1 ® 1999 South-Western College Publishing Chapter 8 The Gain From Portfolio Diversification

Welcome message from author
This document is posted to help you gain knowledge. Please leave a comment to let me know what you think about it! Share it to your friends and learn new things together.
Transcript

1® 1999 South-Western College Publishing
Chapter 8The Gain From Portfolio
Diversification

2® 1999 South-Western College Publishing
Optimal Portfolio
Level of Risk
Expected Return
Determine

3® 1999 South-Western College Publishing
Background Assumptions
• As an investor you want to maximize the As an investor you want to maximize the returns for a given level of risk.returns for a given level of risk.
• The relationship between the returns for The relationship between the returns for assets in the portfolio is important.assets in the portfolio is important.
• A good portfolio is not simply a collection A good portfolio is not simply a collection of individually good investments.of individually good investments.

4® 1999 South-Western College Publishing
Risk Aversion
Given a choice between two assets with Given a choice between two assets with equal rates of return, risk averse equal rates of return, risk averse investors will select the asset with the investors will select the asset with the lower level of risk.lower level of risk.

5® 1999 South-Western College Publishing
Evidence ThatInvestors are Risk Averse
• Many investors purchase insurance for: Many investors purchase insurance for: Life, Automobile, Health, and Disability Life, Automobile, Health, and Disability Income. The purchaser trades known costs Income. The purchaser trades known costs for unknown risk of lossfor unknown risk of loss
• Yield on bonds increases with risk Yield on bonds increases with risk classifications from AAA to AA to A….classifications from AAA to AA to A….

6® 1999 South-Western College Publishing
Are all investors risk averse?
Risk preference may have to do with how Risk preference may have to do with how skewed the possible returns are that are skewed the possible returns are that are involved - risking small amounts, but involved - risking small amounts, but insuring large lossesinsuring large losses
Do the possible outcomes push the investor Do the possible outcomes push the investor into different categories of overall into different categories of overall consumption?consumption?
7® 1999 South-Western College Publishing
Definition of Risk
1. Uncertainty of future outcomes1. Uncertainty of future outcomes
oror
2. Probability of an adverse outcome2. Probability of an adverse outcome
We will consider several measures of risk that We will consider several measures of risk that are used in developing portfolio theoryare used in developing portfolio theory
8® 1999 South-Western College Publishing
Markowitz Portfolio Theory
• Formally extends the MVC from individual stocks to a Formally extends the MVC from individual stocks to a portfolio contextportfolio context
• Quantifies riskQuantifies risk• Derives the expected rate of return for a portfolio of Derives the expected rate of return for a portfolio of
assets and an expected risk measureassets and an expected risk measure• Shows the variance of the rate of return is a meaningful Shows the variance of the rate of return is a meaningful
measure of portfolio riskmeasure of portfolio risk• Derives the formula for computing the variance of a Derives the formula for computing the variance of a
portfolio, showing how to effectively diversify a portfolio, showing how to effectively diversify a portfolioportfolio
9® 1999 South-Western College Publishing
Assumptions of Markowitz Portfolio Theory
1. Investors consider each investment 1. Investors consider each investment alternative as being presented by a alternative as being presented by a probability distribution of expected returns probability distribution of expected returns over some holding period.over some holding period.

10® 1999 South-Western College Publishing
Assumptions of Markowitz Portfolio Theory
2. Investors minimize one-period expected 2. Investors minimize one-period expected utility, and their utility curves demonstrate utility, and their utility curves demonstrate diminishing marginal utility of wealth.diminishing marginal utility of wealth.
11® 1999 South-Western College Publishing
Assumptions of Markowitz Portfolio Theory
3. Investors estimate the risk of the portfolio 3. Investors estimate the risk of the portfolio on the basis of the variability of expected on the basis of the variability of expected returns.returns.

12® 1999 South-Western College Publishing
Assumptions of Markowitz Portfolio Theory
4. Investors base decisions solely on expected 4. Investors base decisions solely on expected return and risk, so their utility curves are a return and risk, so their utility curves are a function of expected return and the function of expected return and the expected variance (or standard deviation) of expected variance (or standard deviation) of returns only.returns only.

13® 1999 South-Western College Publishing
Assumptions of Markowitz Portfolio Theory
5. For a given risk level, investors prefer higher 5. For a given risk level, investors prefer higher returns to lower returns. Similarly, for a returns to lower returns. Similarly, for a given level of expected returns, investors given level of expected returns, investors prefer less risk to more risk. (MVC)prefer less risk to more risk. (MVC)
Are these assumptions realistic? Do investors really Are these assumptions realistic? Do investors really act to “maximize their utility functions w.r.t. act to “maximize their utility functions w.r.t. expected return and variance”? Do pool players pay expected return and variance”? Do pool players pay attention to the rules and laws of physics?attention to the rules and laws of physics?

14® 1999 South-Western College Publishing
Assumptions of Markowitz Portfolio Theory
Using these five assumptions, a single asset or Using these five assumptions, a single asset or portfolio of assets is considered to be portfolio of assets is considered to be efficient if no other asset or portfolio of efficient if no other asset or portfolio of assets offers higher expected return with the assets offers higher expected return with the same (or lower) risk, or lower risk with the same (or lower) risk, or lower risk with the same (or higher) expected return.same (or higher) expected return.

15® 1999 South-Western College Publishing
Alternative Measures of Risk
• Variance or standard deviation of expected returnVariance or standard deviation of expected return– Alternatively, variation away from some Alternatively, variation away from some
benchmark (tracking error)benchmark (tracking error)• Range of returnsRange of returns• Returns below expectationsReturns below expectations
– Semivariance - measure expected returns below Semivariance - measure expected returns below some targetsome target
– Intended to minimize the damageIntended to minimize the damage

16® 1999 South-Western College Publishing
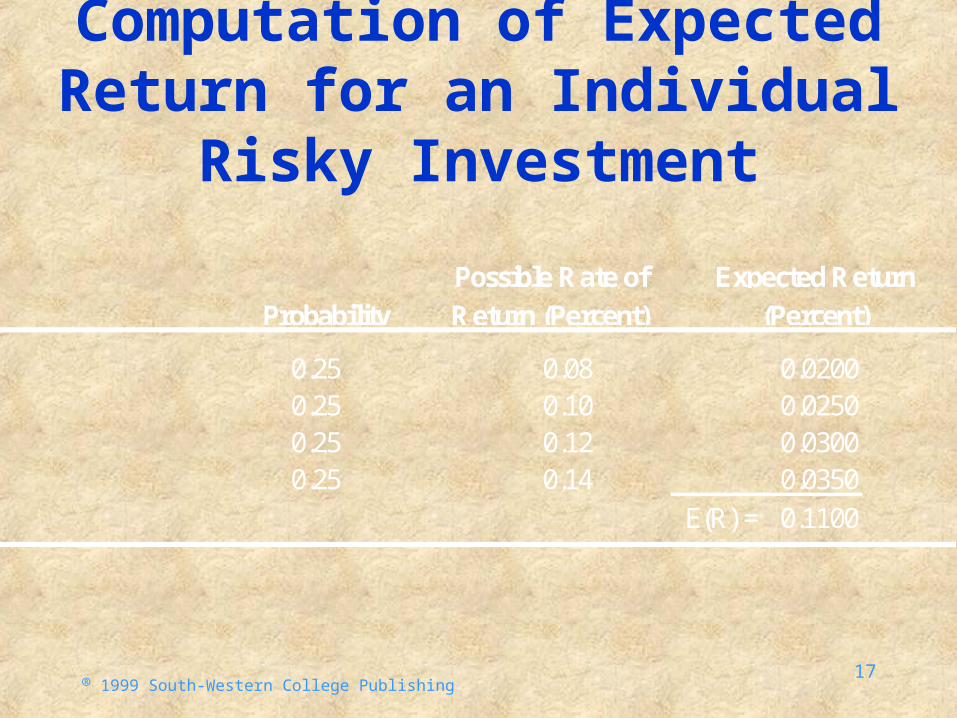
Expected Rates of Return
• Individual risky assetIndividual risky asset
– Sum of probability times possible rate of Sum of probability times possible rate of returnreturn
• PortfolioPortfolio
– Weighted average of expected rates of Weighted average of expected rates of return for the individual investments in return for the individual investments in the portfoliothe portfolio
17® 1999 South-Western College Publishing
Computation of Expected Return for an Individual Risky Investment
0.25 0.08 0.02000.25 0.10 0.02500.25 0.12 0.03000.25 0.14 0.0350
E(R) = 0.1100
Expected Return(Percent)Probability
Possible Rate ofReturn (Percent)

18® 1999 South-Western College Publishing
Computation of the Expected Return for a Portfolio of Risky Assets
0.20 0.10 0.02000.30 0.11 0.03300.30 0.12 0.03600.20 0.13 0.0260
E(Rpor i) = 0.1150
Expected Portfolio
Return (Wi X Ri) (Percent of Portfolio)
Expected Security
Return (Ri)
Weight (Wi)
iasset for return of rate expected the )E(Riasset in portfolio theofpercent theW
:where
RW)E(R
i
i
1ipor
n
iii

19® 1999 South-Western College Publishing
Variance (Standard Deviation) of Returns for an Individual Investment
Standard deviation is the square root of the Standard deviation is the square root of the variancevariance
Variance is a measure of the variation of Variance is a measure of the variation of possible rates of return Rpossible rates of return R ii away from the away from the
expected rate of return [E(Rexpected rate of return [E(R ii)])]

20® 1999 South-Western College Publishing
Variance (Standard Deviation) of Returns for an Individual Investment
n
i 1i
2ii
2 P)]E(R-R[)( Variance
where Pwhere Pii is the probability of the possible rate is the probability of the possible rate
of return, Rof return, Rii

21® 1999 South-Western College Publishing
Variance (Standard Deviation) of Returns for an Individual Investment
n
i 1i
2ii P)]E(R-R[)(
Standard DeviationStandard Deviation

22® 1999 South-Western College Publishing
Variance (Standard Deviation) of Returns for an Individual Investment
Possible Rate Expected
of Return (Ri) Return E(Ri) Ri - E(Ri) [Ri - E(Ri)]2 Pi [Ri - E(Ri)]
2Pi
0.08 0.11 0.03 0.0009 0.25 0.0002250.10 0.11 0.01 0.0001 0.25 0.0000250.12 0.11 0.01 0.0001 0.25 0.0000250.14 0.11 0.03 0.0009 0.25 0.000225
0.000500
Variance ( 2) = .0050
Standard Deviation ( ) = .02236

23® 1999 South-Western College Publishing
Variance (Standard Deviation) of Returns for a Portfolio
Computation of Monthly Rates of ReturnComputation of Monthly Rates of ReturnCoca - Cola Exxon
Closing ClosingDate Price Dividend Return (%) Price Dividend Return (%)
Dec-97 66.688 0.14 61.188 0.41Jan-98 64.750 -2.91% 59.313 -3.06%Feb-98 68.625 5.98% 63.750 0.41 8.17%Mar-98 77.438 0.15 13.06% 67.625 6.08%Apr-98 75.875 -2.02% 73.063 8.04%May-98 78.375 3.29% 70.500 0.41 -2.95%Jun-98 85.500 0.15 9.28% 71.375 1.24%Jul-98 80.500 -5.85% 70.250 -1.58%
Aug-98 65.125 -19.10% 65.438 0.41 -6.27%Sep-98 57.625 0.15 -11.29% 70.625 7.93%Oct-98 67.563 17.25% 71.625 1.42%Nov-98 70.063 0.15 3.92% 75.000 0.41 5.28%Dec-98 67.000 -4.37% 73.125 -2.50%
E(RCoca-Cola)= 0.61% E(RExxon)= 1.82%

24® 1999 South-Western College Publishing
Time Series Returns forCoca-Cola: 1998
-25.00%
-20.00%
-15.00%
-10.00%
-5.00%
0.00%
5.00%
10.00%
15.00%
20.00%
J F M A M J J A S O N D
25® 1999 South-Western College Publishing
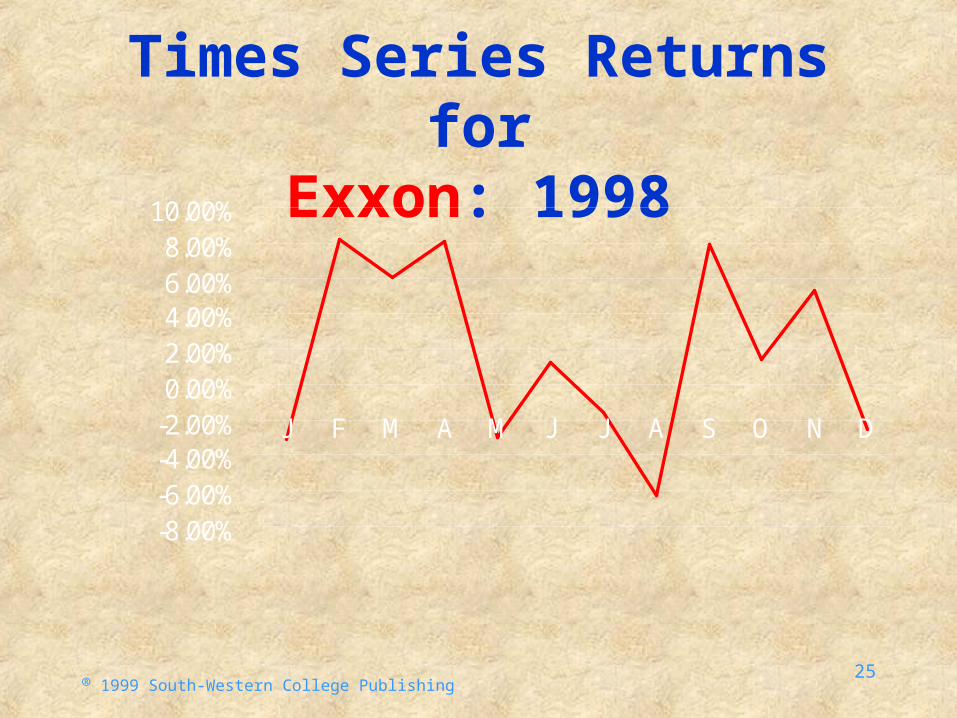
Times Series Returns forExxon: 1998
-8.00%-6.00%-4.00%-2.00%0.00%2.00%4.00%6.00%8.00%
10.00%
J F M A M J J A S O N D

26® 1999 South-Western College Publishing
Times Series Returns forCoca-Cola and Exxon: 1998
-20.00%
-15.00%
-10.00%
-5.00%
0.00%
5.00%
10.00%
15.00%
J F M A M J J A S O N D

27® 1999 South-Western College Publishing
Variance (Standard Deviation) of Returns for a Portfolio
For two assets, i and j, the covariance of rates For two assets, i and j, the covariance of rates of return is defined as:of return is defined as:
CovCovijij = E{[R = E{[Rii - E(R - E(Rii)][R)][Rjj - E(R - E(Rjj)]})]}

28® 1999 South-Western College Publishing
Computation of Covariance of Returns for Coca-Cola and Exxon: 1998
Rate of Rate of Coca-Cola Exxon Coca-Cola ExxonDate Return (%) Return (%) Ri - E(Ri) Rj - E(Rj) [Ri - E(Ri)] X [Rj - E(Rj)]
Jan-98 -2.91% -0.0306 -0.0352 -0.049 17.18Feb-98 5.98% 8.17% 0.0537 0.064 34.10Mar-98 13.06% 6.08% 0.1245 0.043 53.04Apr-98 -2.02% 8.04% -0.0263 0.062 -16.36
May-98 3.29% -2.95% 0.0268 -0.048 -12.78Jun-98 9.28% 1.24% 0.0867 -0.006 -5.03Jul-98 -5.85% -1.58% -0.0646 -0.034 21.96
Aug-98 -19.10% -6.27% -0.1971 -0.081 159.45Sep-98 -11.29% 7.93% -0.1190 0.061 -72.71Oct-98 17.25% 1.42% 0.1664 -0.004 -6.66Nov-98 3.92% 5.28% 0.0331 0.035 11.45Dec-98 -4.37% -2.50% -0.0498 -0.043 21.51
E(RCoca-Cola)= 0.61% E(RExxon)= 1.82% Sum = 205.16Covij = 205.16 / 12 = 17.10

29® 1999 South-Western College Publishing
Scatter Plot of Monthly Returns for Coca-Cola and
Exxon: 1998
-8.00%
-6.00%
-4.00%
-2.00%
0.00%
2.00%
4.00%
6.00%
8.00%
10.00%
-8.00% -6.00% -4.00% -2.00% 0.00% 2.00% 4.00% 6.00% 8.00% 10.00% 12.00% 14.00% 16.00%
Monthly Returns for Coca-Cola
Mo
nth
ly R
etu
rn f
or
Ex
xo
n
30® 1999 South-Western College Publishing
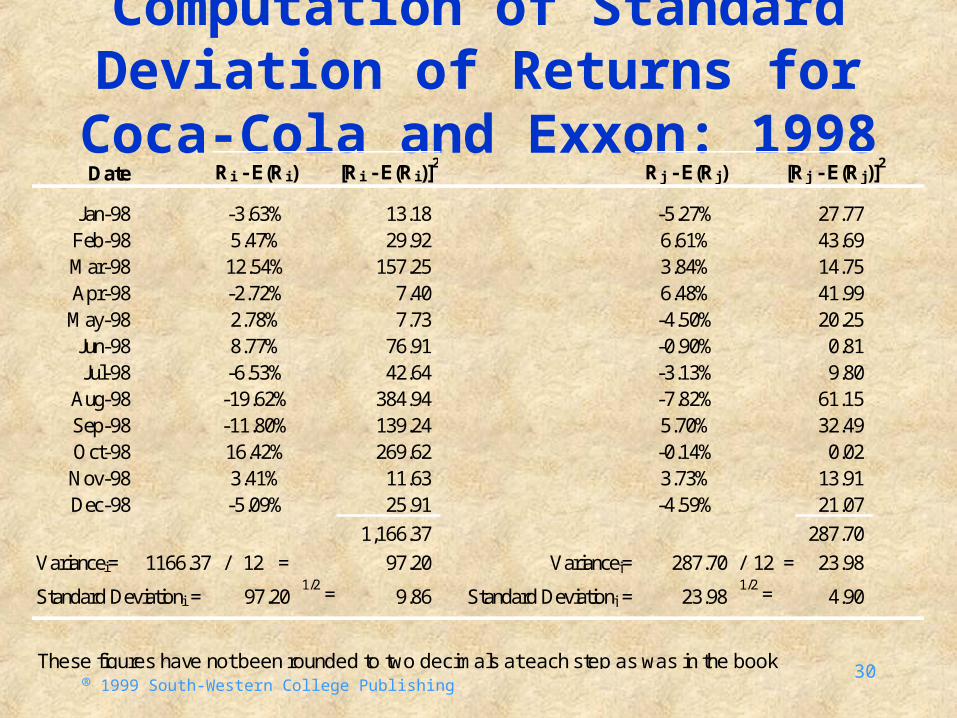
Computation of Standard Deviation of Returns for Coca-Cola and Exxon: 1998
Date Ri - E(Ri) [Ri - E(Ri)]2 Rj - E(Rj) [Rj - E(Rj)]
2
Jan-98 -3.63% 13.18 -5.27% 27.77 Feb-98 5.47% 29.92 6.61% 43.69 Mar-98 12.54% 157.25 3.84% 14.75 Apr-98 -2.72% 7.40 6.48% 41.99 May-98 2.78% 7.73 -4.50% 20.25
Jun-98 8.77% 76.91 -0.90% 0.81 Jul-98 -6.53% 42.64 -3.13% 9.80
Aug-98 -19.62% 384.94 -7.82% 61.15 Sep-98 -11.80% 139.24 5.70% 32.49 Oct-98 16.42% 269.62 -0.14% 0.02 Nov-98 3.41% 11.63 3.73% 13.91 Dec-98 -5.09% 25.91 -4.59% 21.07
1,166.37 287.70
Variancei= 1166.37 / 12 = 97.20 Variancej= 287.70 / 12 = 23.98
Standard Deviationi = 97.20 1/2 = 9.86 Standard Deviationj = 23.98
1/2 = 4.90
These figures have not been rounded to two decimals at each step as was in the book
31® 1999 South-Western College Publishing
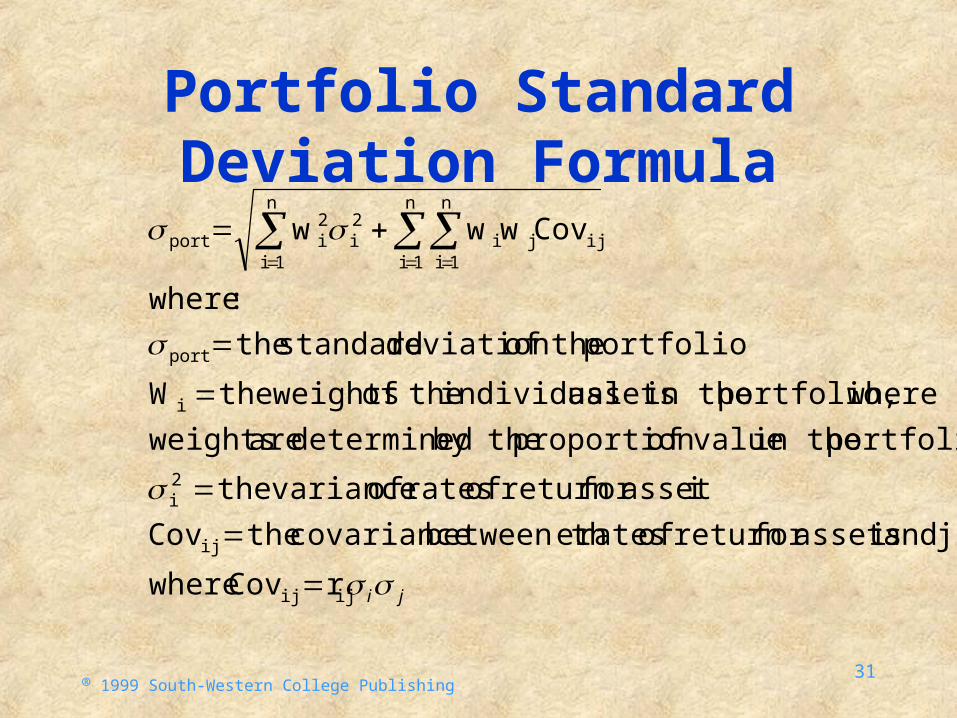
Portfolio Standard Deviation Formula
ji
ijij
ij
2i
i
port
n
1i
n
1iijj
n
1ii
2i
2iport
rCov where
j, and i assetsfor return of rates ebetween th covariance theCov
iasset for return of rates of variancethe
portfolio in the valueof proportion by the determined are weights
whereportfolio, in the assets individual theof weightstheW
portfolio theofdeviation standard the
:where
Covwww

32® 1999 South-Western College Publishing
Portfolio Standard Deviation Calculation
• Any asset of a portfolio may be described by two Any asset of a portfolio may be described by two characteristics:characteristics:– The expected rate of returnThe expected rate of return– The expected standard deviations of returnsThe expected standard deviations of returns
• The correlation, measured by covariance, affects The correlation, measured by covariance, affects the portfolio standard deviationthe portfolio standard deviation
• Low correlation reduces portfolio risk while not Low correlation reduces portfolio risk while not affecting the expected returnaffecting the expected return
33® 1999 South-Western College Publishing
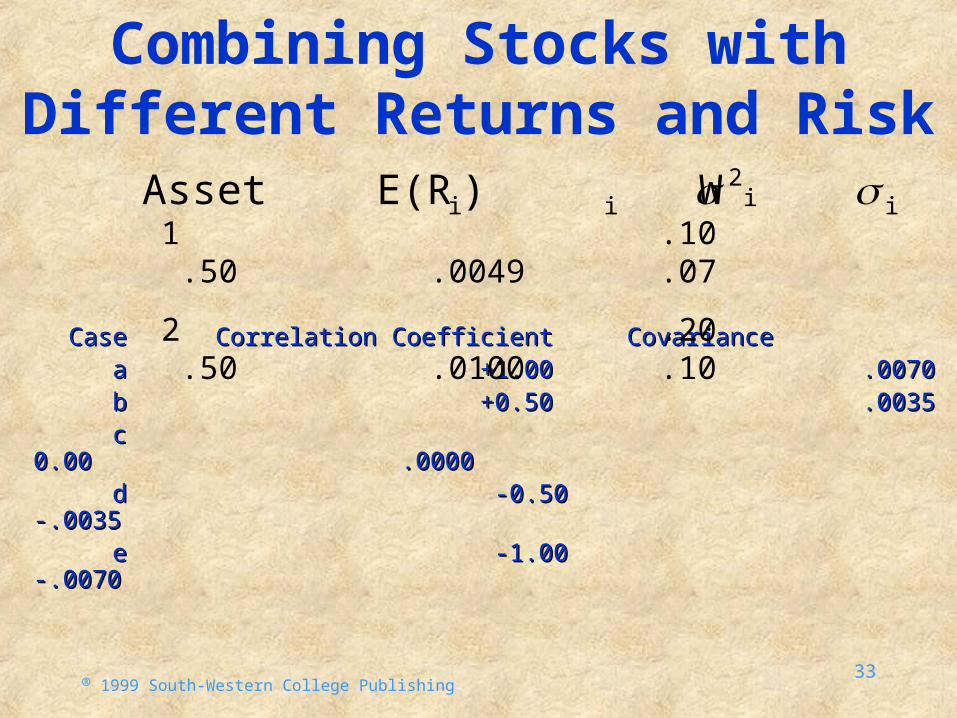
Combining Stocks with Different Returns and Risk
Case Correlation Coefficient CovarianceCase Correlation Coefficient Covariance a +1.00 .0070a +1.00 .0070 b +0.50 .0035b +0.50 .0035 c 0.00 .0000c 0.00 .0000 d -0.50 -.0035d -0.50 -.0035 e -1.00 -.0070e -1.00 -.0070
W)E(R Asset ii2
ii 1 .10 .50 .0049 .07
2 .20 .50 .0100 .10

34® 1999 South-Western College Publishing
Combining Stocks with Different Returns and Risk
• Assets may differ in expected rates of return Assets may differ in expected rates of return and individual standard deviationsand individual standard deviations
• Negative correlation reduces portfolio riskNegative correlation reduces portfolio risk
• Combining two assets with -1.0 correlation Combining two assets with -1.0 correlation reduces the portfolio standard deviation to reduces the portfolio standard deviation to zero only when individual standard zero only when individual standard deviations are equaldeviations are equal

35® 1999 South-Western College Publishing
Constant Correlationwith Changing Weights
Case W1 W2 E(Ri)
f 0.00 1.00 0.20 g 0.20 0.80 0.18 h 0.40 0.60 0.16 i 0.50 0.50 0.15 j 0.60 0.40 0.14 k 0.80 0.20 0.12 l 1.00 0.00 0.10
)E(R Asset i
1 .10 r ij = 0.00
2 .20

36® 1999 South-Western College Publishing
Constant Correlationwith Changing Weights
Case W1 W2 E(Ri) port
f 0.00 1.00 0.20 0.1000g 0.20 0.80 0.18 0.0812h 0.40 0.60 0.16 0.0662i 0.50 0.50 0.15 0.0610j 0.60 0.40 0.14 0.0580k 0.80 0.20 0.12 0.0595l 1.00 0.00 0.10 0.0700
37® 1999 South-Western College Publishing
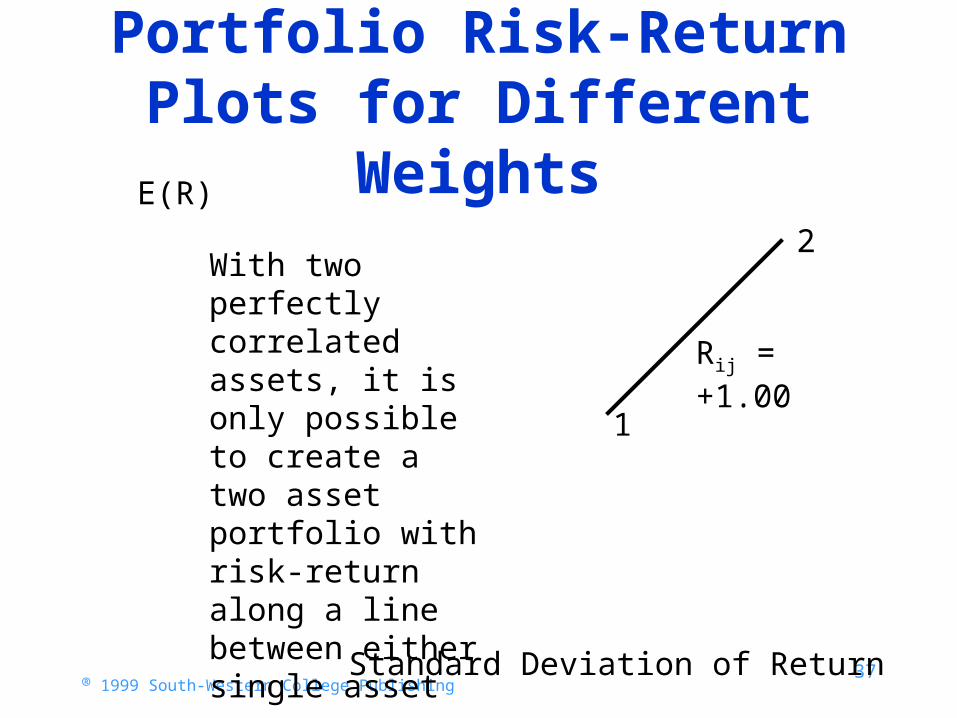
Portfolio Risk-Return Plots for Different Weights
-
0.05
0.10
0.15
0.20
0.00 0.01 0.02 0.03 0.04 0.05 0.06 0.07 0.08 0.09 0.10 0.11 0.12
Standard Deviation of Return
E(R)
Rij = +1.00
1
2With two perfectly correlated assets, it is only possible to create a two asset portfolio with risk-return along a line between either single asset
38® 1999 South-Western College Publishing
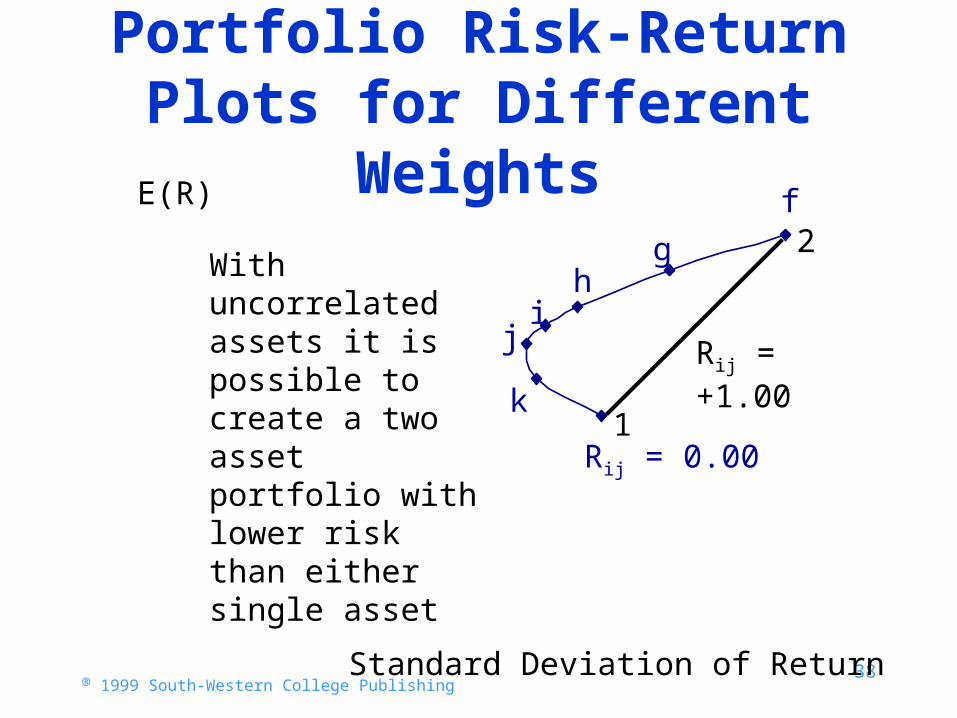
Portfolio Risk-Return Plots for Different Weights
-
0.05
0.10
0.15
0.20
0.00 0.01 0.02 0.03 0.04 0.05 0.06 0.07 0.08 0.09 0.10 0.11 0.12
Standard Deviation of Return
E(R)
Rij = 0.00
Rij = +1.00
f
gh
ij
k1
2With uncorrelated assets it is possible to create a two asset portfolio with lower risk than either single asset

39® 1999 South-Western College Publishing
Portfolio Risk-Return Plots for Different Weights
-
0.05
0.10
0.15
0.20
0.00 0.01 0.02 0.03 0.04 0.05 0.06 0.07 0.08 0.09 0.10 0.11 0.12
Standard Deviation of Return
E(R)
Rij = 0.00
Rij = +1.00
Rij = +0.50
f
gh
ij
k1
2With correlated assets it is possible to create a two asset portfolio between the first two curves

40® 1999 South-Western College Publishing
Portfolio Risk-Return Plots for Different Weights
-
0.05
0.10
0.15
0.20
0.00 0.01 0.02 0.03 0.04 0.05 0.06 0.07 0.08 0.09 0.10 0.11 0.12
Standard Deviation of Return
E(R)
Rij = 0.00
Rij = +1.00
Rij = -0.50
Rij = +0.50
f
gh
ij
k1
2
With negatively correlated assets it is possible to create a two asset portfolio with much lower risk than either single asset
41® 1999 South-Western College Publishing
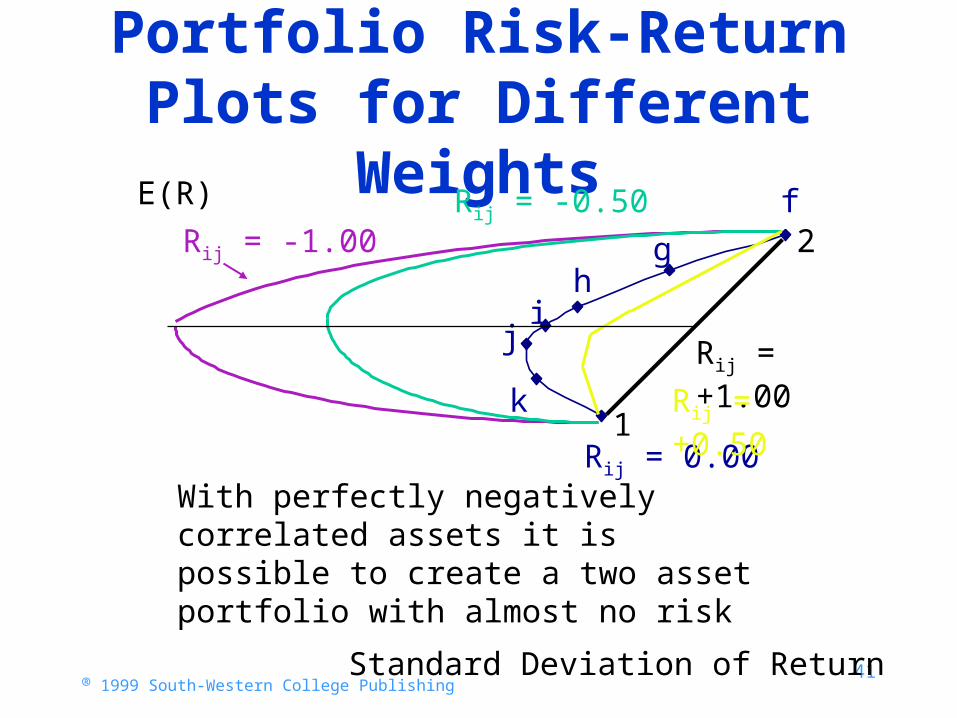
Portfolio Risk-Return Plots for Different Weights
-
0.05
0.10
0.15
0.20
0.00 0.01 0.02 0.03 0.04 0.05 0.06 0.07 0.08 0.09 0.10 0.11 0.12
Standard Deviation of Return
E(R)
Rij = 0.00
Rij = +1.00
Rij = -1.00
Rij = +0.50
f
gh
ij
k1
2
With perfectly negatively correlated assets it is possible to create a two asset portfolio with almost no risk
Rij = -0.50

42® 1999 South-Western College Publishing
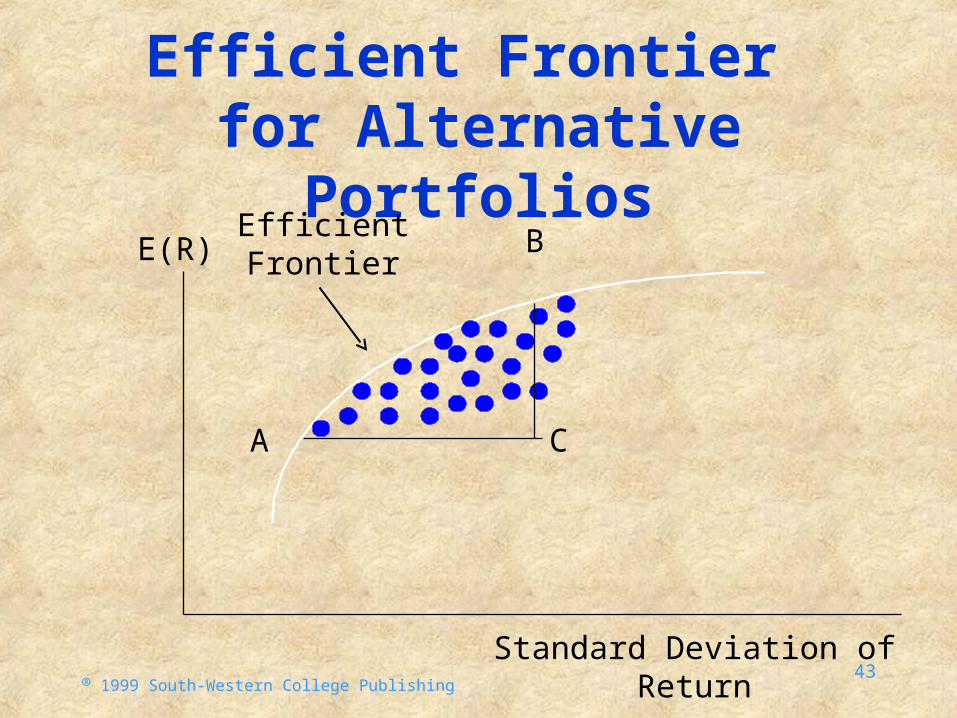
The Efficient Frontier• The efficient frontier represents that set of The efficient frontier represents that set of
portfolios with the maximum rate of return portfolios with the maximum rate of return for every given level of risk, or the for every given level of risk, or the minimum risk for every level of returnminimum risk for every level of return
• Frontier will be portfolios of investments Frontier will be portfolios of investments rather than individual securitiesrather than individual securities
– Exception: the asset with the single Exception: the asset with the single highest returnhighest return
43® 1999 South-Western College Publishing
Efficient Frontier for Alternative Portfolios
Efficient Frontier
A
B
C
E(R)
Standard Deviation of Return

44® 1999 South-Western College Publishing
The Efficient Frontier and Investor Utility
• An individual investor’s utility curve An individual investor’s utility curve specifies the trade-offs he is willing to make specifies the trade-offs he is willing to make between expected return and riskbetween expected return and risk
• The slope of the efficient frontier curve The slope of the efficient frontier curve decreases steadily as you move upwarddecreases steadily as you move upward
• These two interactions will determine the These two interactions will determine the particular portfolio selected by an particular portfolio selected by an individual investorindividual investor

45® 1999 South-Western College Publishing
The Efficient Frontier and Investor Utility
• The optimal portfolio has the highest utility The optimal portfolio has the highest utility for a given investorfor a given investor
• It lies at the point of tangency between the It lies at the point of tangency between the efficient frontier and the utility curve with efficient frontier and the utility curve with the highest possible utilitythe highest possible utility

46® 1999 South-Western College Publishing
Selecting an Optimal Risky Portfolio
)E( port
)E(R port
X
Y
U3
U2
U1
U3’
U2’ U1’
Figure 8.10
47® 1999 South-Western College Publishing
Gains From Diversification
• Lower CorrelationLower Correlation
• Smaller Portfolio VarianceSmaller Portfolio Variance
• Larger Gains From DiversificationLarger Gains From Diversification
• For a Given Set of For a Given Set of WeightsWeights

48® 1999 South-Western College Publishing
How Many Stocks Are Required For Adequate
Diversification?
• Benefits achieved even with “naïve” or evenly Benefits achieved even with “naïve” or evenly weighted diversificationweighted diversification
• The More Stocks, the Better The More Stocks, the Better • Increasing Transaction CostsIncreasing Transaction Costs• 10-15 Stocks Sufficient10-15 Stocks Sufficient• 90% of Maximum Benefit with 12-1890% of Maximum Benefit with 12-18• Most Benefits Achieved with 10Most Benefits Achieved with 10• Diminishing Benefits with Additional StocksDiminishing Benefits with Additional Stocks

49® 1999 South-Western College Publishing
“A Little Diversification Goes A Long Way”
As the Number of Assets As the Number of Assets Increases the Incremental Increases the Incremental Contribution to Variance Contribution to Variance
Reduction Becomes Smaller Reduction Becomes Smaller and Smallerand Smaller

50® 1999 South-Western College Publishing
Mutual Funds
• Diminishing Benefits of More Stocks are Diminishing Benefits of More Stocks are Still PositiveStill Positive– There is some gainThere is some gain
• Low Cost of Data Low Cost of Data • Large Funds Have to Invest in Many StocksLarge Funds Have to Invest in Many Stocks
– Avoid buying and selling affects Avoid buying and selling affects – Regulation MRegulation M
• Own Own 5% of any company’s stock 5% of any company’s stock
51® 1999 South-Western College Publishing
Unrelated Industries
• Significant Risk ReductionSignificant Risk Reduction
– Achieved by diversifying across different Achieved by diversifying across different industriesindustries
• Stocks From Same IndustryStocks From Same Industry
– Highly positively correlatedHighly positively correlated
• Stocks From Different IndustriesStocks From Different Industries
– Negative correlationNegative correlation
52® 1999 South-Western College Publishing
Investment Weights
• Affect the Portfolio’s VarianceAffect the Portfolio’s Variance
• Minimize Portfolio’s RiskMinimize Portfolio’s Risk
• Determine the Investor’s Risk ExposureDetermine the Investor’s Risk Exposure
• If If = -1, 1 Strategy of Weights Can Yield a = -1, 1 Strategy of Weights Can Yield a Portfolio with No RiskPortfolio with No Risk

53® 1999 South-Western College Publishing
Weights For The 2 Asset Portfolio
WWAA + W + WBB = 1 = 1
WWBB = 1 - W = 1 - WAA
WWAA + (1 - W + (1 - WAA) = 1 or 100%) = 1 or 100%
only need to solve for one variableonly need to solve for one variable
also have equivalent restriction for more-than-2-asset casealso have equivalent restriction for more-than-2-asset case
54® 1999 South-Western College Publishing
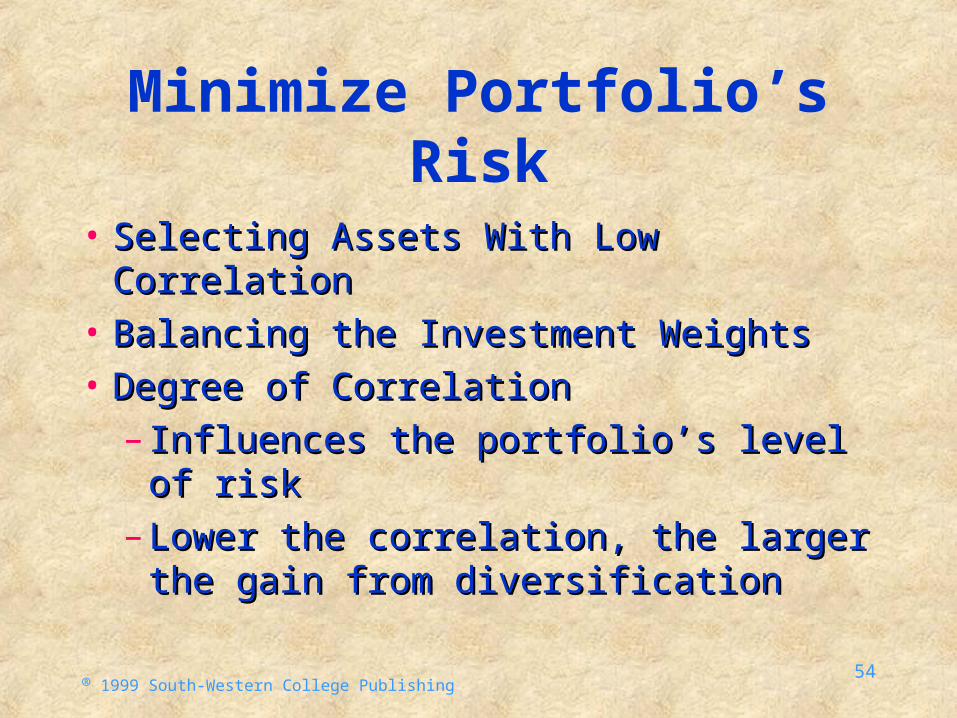
Minimize Portfolio’s Risk
• Selecting Assets With Low CorrelationSelecting Assets With Low Correlation
• Balancing the Investment WeightsBalancing the Investment Weights
• Degree of CorrelationDegree of Correlation
– Influences the portfolio’s level of riskInfluences the portfolio’s level of risk
– Lower the correlation, the larger the gain Lower the correlation, the larger the gain from diversificationfrom diversification
55® 1999 South-Western College Publishing
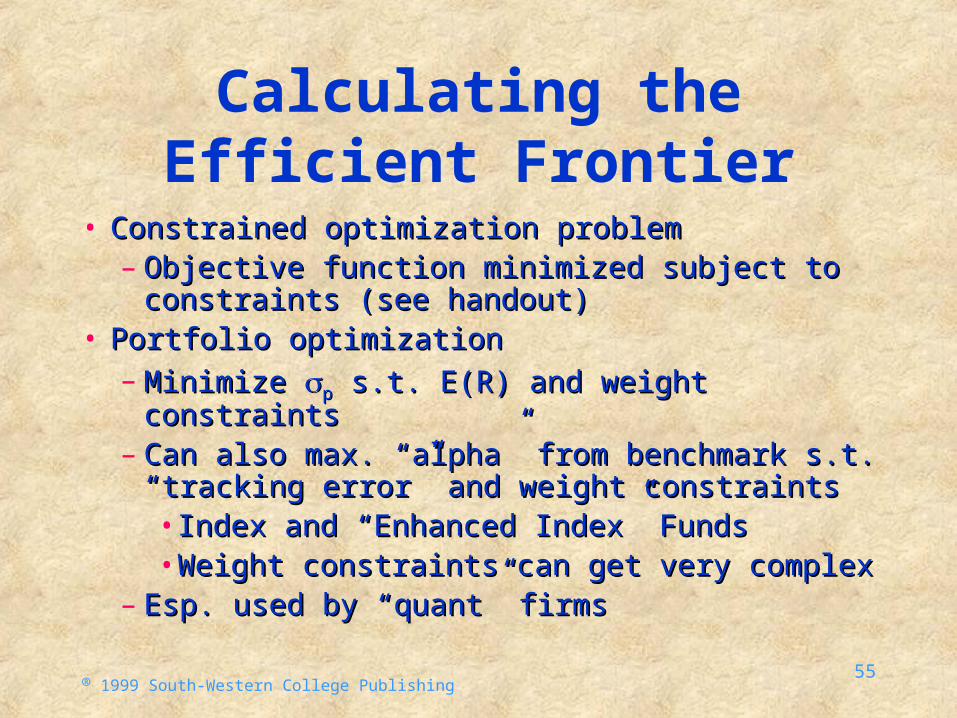
Calculating the Efficient Frontier
• Constrained optimization problemConstrained optimization problem– Objective function minimized subject to constraints Objective function minimized subject to constraints
(see handout)(see handout)• Portfolio optimizationPortfolio optimization
– Minimize Minimize pp s.t. E(R) and weight constraints s.t. E(R) and weight constraints– Can also max. “alpha” from benchmark s.t. Can also max. “alpha” from benchmark s.t.
“tracking error” and weight constraints“tracking error” and weight constraints• Index and “Enhanced Index” FundsIndex and “Enhanced Index” Funds• Weight constraints can get very complexWeight constraints can get very complex
– Esp. used by “quant” firmsEsp. used by “quant” firms

56® 1999 South-Western College Publishing
MVP
• Minimum Variance PortfolioMinimum Variance Portfolio
• Portfolio With the Smallest Variance From Portfolio With the Smallest Variance From the Mean-Variance Frontierthe Mean-Variance Frontier
• Mean-Variance FrontierMean-Variance Frontier
– Efficient frontierEfficient frontier
• Dominate portfolioDominate portfolio
– Inefficient frontierInefficient frontier

57® 1999 South-Western College Publishing
What Is The Implication Of Diversification For Portfolio
Management?
• Not All Diversification Strategies are DesirableNot All Diversification Strategies are Desirable
• Some Strategies are InefficientSome Strategies are Inefficient
• No Investor Would Select Portfolios From the No Investor Would Select Portfolios From the
Segment Below Point Segment Below Point MVPMVP
see next slidesee next slide

58® 1999 South-Western College Publishing
••MVP
Inefficient Frontier
Efficient Frontier
Standard Deviation
E(R)

59® 1999 South-Western College Publishing
Two Assets With Different Correlations
• The Higher the Correlation, the Smaller the The Higher the Correlation, the Smaller the Gain From DiversificationGain From Diversification
• As Correlation Declines, Risk Reduction As Correlation Declines, Risk Reduction IncreasesIncreases
– Implies larger risk reduction because of Implies larger risk reduction because of diversificationdiversification

60® 1999 South-Western College Publishing
Complicated Portfolio Choices
• More Than Two Assets to Choose FromMore Than Two Assets to Choose From
• Assets do not Have the Same Mean or Assets do not Have the Same Mean or VarianceVariance
• Nonzero correlations prevailNonzero correlations prevail
• Must Find the Mean-Variance FrontierMust Find the Mean-Variance Frontier
• Identify the Efficient and Inefficient SetsIdentify the Efficient and Inefficient Sets

61® 1999 South-Western College Publishing
Estimation Issues
• Results of portfolio allocation depend on accurate Results of portfolio allocation depend on accurate statistical inputsstatistical inputs
• Estimates ofEstimates of– Expected returns Expected returns – Standard deviationStandard deviation– Correlation coefficient Correlation coefficient
• Among entire set of assetsAmong entire set of assets• With 100 assets, 4,950 correlation estimatesWith 100 assets, 4,950 correlation estimates
• Estimation risk refers to potential errorsEstimation risk refers to potential errors

62® 1999 South-Western College Publishing
Estimation Issues
• With assumption that stock returns can be With assumption that stock returns can be described by a single market model, the described by a single market model, the number of correlations required reduces to number of correlations required reduces to the number of assetsthe number of assets
• Single index market model:Single index market model:imiii RbaR
bi = the slope coefficient that relates the returns for security i to the returns for the aggregate stock market
Rm = the returns for the aggregate stock market
63® 1999 South-Western College Publishing
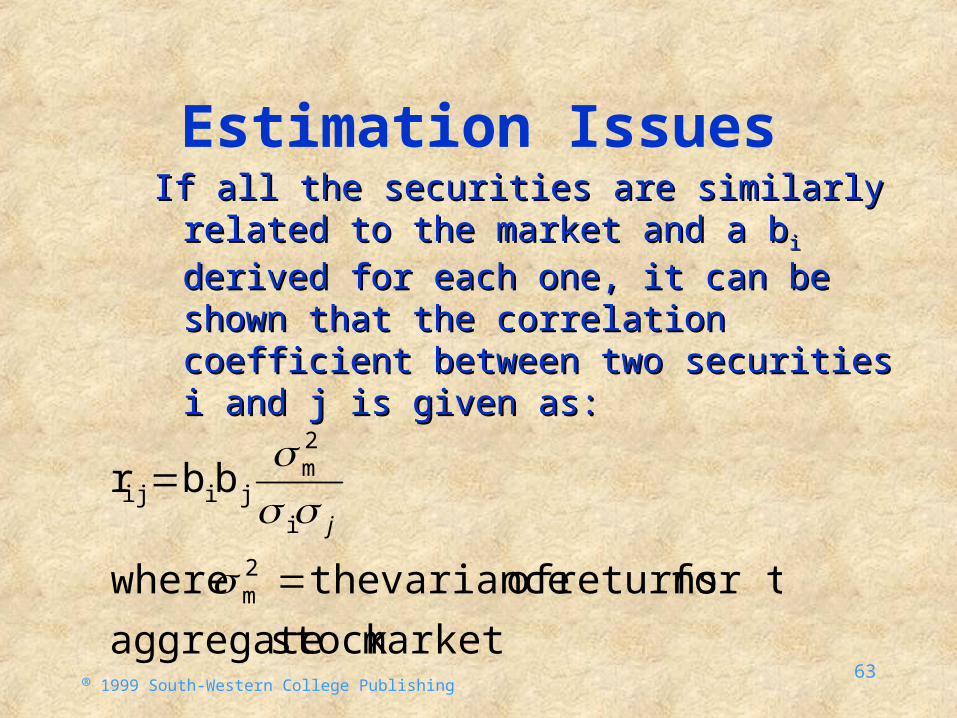
Estimation IssuesIf all the securities are similarly related to If all the securities are similarly related to
the market and a bthe market and a bii derived for each one, derived for each one,
it can be shown that the correlation it can be shown that the correlation coefficient between two securities i and j coefficient between two securities i and j is given as:is given as:
marketstock aggregate
for the returns of variancethe where
bbr
2m
i
2m
jiij
j
Related Documents