ANNUAL REPORT ON VOLATILE ORGANIC COMPOUND EMISSIONS FROM PESTICIDES: EMISSIONS FOR 1990 – 2015 Rosemary Neal, Ph.D. Research Scientist III Pam Wofford Environmental Program Manager I and Randy Segawa Special Advisor, Pesticide Programs Division March, 2017 California Environmental Protection Agency Department of Pesticide Regulation Environmental Monitoring Branch P.O. Box 4015 Sacramento, California 95812-4015 (916) 324-4039 AIR2017-1 1

Welcome message from author
This document is posted to help you gain knowledge. Please leave a comment to let me know what you think about it! Share it to your friends and learn new things together.
Transcript
ANNUAL REPORT ONVOLATILE ORGANIC COMPOUND EMISSIONS
FROM PESTICIDES: EMISSIONS FOR 1990 – 2015
Rosemary Neal, Ph.D. Research Scientist III
Pam WoffordEnvironmental Program Manager I
and
Randy SegawaSpecial Advisor, Pesticide Programs Division
March, 2017
California Environmental Protection AgencyDepartment of Pesticide RegulationEnvironmental Monitoring Branch
P.O. Box 4015 Sacramento, California 95812-4015
(916) 324-4039
AIR2017-1
1

EXECUTIVE SUMMARY Preface
This report fulfills the requirements of Title 3, California Code of Regulations (3 CCR), section 6452.4 which requires the Director of Department of Pesticide Regulation (DPR) to issue an annual emissions inventory report for the Sacramento Metro, San Joaquin Valley, South Coast, Southeast Desert, and Ventura ozone nonattainment areas (NAAs). This report presents data reported to or produced by DPR from May 1, 2015, to October 31, 2015, the peak ozone season in California. In addition, data from the same months in 1990 are included for baseline comparisons, and from 2012, 2013 and 2014 for trend analysis.
Background
Under the federal Clean Air Act, California must meet national standards for airborne pollutants and must specify how it plans to achieve these goals in a federally approved State Implementation Plan (SIP). SIPs require the control of emissions of nitrogen oxides and VOCs because they are precursors to ozone. Under California’s SIP, approved by the U.S. Environmental Protection Agency (U.S. EPA), DPR must track and control VOC emissions from pesticide products used in agriculture and by commercial structural applicators in five regions that do not attain the federal air quality standard for ozone (ozone nonattainment areas, NAAs). The SIP requires DPR to reduce emissions by 20 percent from the 1990 base year in four ozone nonattainment areas (NAAs)—Sacramento Metro, South Coast, Southeast Desert, and Ventura, and by 12 percent in a fifth NAA—San Joaquin Valley.
DPR’s VOC emission inventory database includes only pesticide applications that are made between May 1 and October 31, the peak ozone season in California. The database is updated when annual pesticide use report data from the previous year becomes available, and contains data for every year since 1990. Each year contains about 2.5 million pesticide use records (PUR) and emission potential (EP) values for approximately 5,000 products. The EP is that fraction of a product that is assumed to contribute to atmospheric VOCs.
Beginning in 2008 DPR adopted a series of regulations to reduce VOC emissions from fumigant pesticides. Title 3, California Code of Regulations, section 6452.2, includes specific emission target levels (VOC regulation benchmarks) for each of the five NAAs, equivalent to the SIP obligation of a 12 percent or 20 percent reduction. The regulations reduce VOC emissions by requiring low-emission fumigation methods in certain NAAs. If, in spite of these application method requirements, pesticide VOC emissions exceed 95 percent of the benchmark for a NAA, the regulations specified that DPR will ensure that the benchmark is achieved by establishing a fumigant limit. The fumigant limit is determined by subtracting the estimated nonfumigant emissions from the regulatory benchmark, basing the nonfumigant emissions estimate on VOC emission inventory data from previous years.
Because a significantly higher proportion of emissions in the San Joaquin Valley NAA are from nonfumigants, in May 2013 (and effective November 1, 2013), DPR amended the VOC regulations by replacing the fumigant limit required when the 95 percent trigger level is
2
exceeded in that NAA with prohibitions on the use of certain nonfumigant products designated as high VOC.
Report Summary
In 2015 all five nonattainment areas were in compliance with the SIP goals and were below the VOC regulation benchmarks. • Sacramento Metro NAA: VOC emissions decreased by 14 percent from 1.386 tons per day
in 2014 to 1.190 tons per day in 2015. Emissions in 2015 were 57 percent lower than the 1990 base year and remain in compliance with the SIP goal and the VOC regulation benchmark. In 2015, eight percent (8%) of emissions were derived from fumigants and were consistent with levels observed for six of the previous eight years.
• San Joaquin Valley NAA: VOC emissions decreased between 2014 and 2015, from 16.811 tons per day to 15.301 tons per day, falling below the SIP goal by 2.799 tons per day. Pesticide VOC emissions in 2015 were 25 percent lower than the 1990 base year and comply with the SIP goal and VOC regulation benchmark. A significant portion of the reduction of pesticide emissions from nonfumigants can be attributed to the prohibition on the use of certain high-VOC products that went into effect in 2015. Despite the reductions, the regulations require the high-VOC prohibitions to remain in effect for May-October 2017.
• Southeast Desert NAA: VOC emissions increased by 24 percent from 0.288 tons per day in 2014 to 0.358 tons per day in 2015. Emissions in 2015 were 69 percent lower than the 1990 base year and continue to comply with the SIP goal and VOC regulation benchmark. Emissions from fumigants increased by 13 percent and from nonfumigants by 29 percent.
• Ventura NAA: The implementation of fumigation methods that use totally impermeable film (tarps assigned 60 percent buffer zone credit on labels) in Ventura continued to impact fumigant emissions in 2015. Total VOC emissions increased by 3 percent in 2015 to 1.665 tons per day, 1.335 tpd below the SIP goal. Pesticide VOC emissions in 2015 were 56 percent lower than the 1990 base year. Seventy-three percent (73%) of emissions were derived from fumigants.
• South Coast NAA: VOC emissions increased in 2015 by 16 percent compared to 2014, rising to 1.357 tons per day, and continue to remain well below the emission targets. Pesticide VOC emissions in 2015 were 87 percent lower than the 1990 base year. Over 80 percent of emissions were derived from nonfumigants.
Section 6452.3 requires a 45-day public comment period of the draft report. No comments were received during the comment period (January 10, 2017 – February 24, 2017).
3
Abbreviations and Definitions
AI Active Ingredient AMAF Application Method Adjustment Factor APCD Air Pollution Control District ARB California Air Resources Board EC Emulsifiable Concentrate EP Emission Potential ER Emission Rating FFM Field Fumigation Methods GIS Geographic Information System MUF Method Use Fraction NAA Nonattainment Area PUR Pesticide Use Report SIP State Implementation Plan TGA Thermogravimetric Analysis TIF Totally Impermeable Film tpd tons per day VOC Volatile Organic Chemical
ACKNOWLEDGEMENTS
The authors wish to thank the reviewers whose unique perspectives and experiences helped ensure the accuracy and readability of this report. We gratefully acknowledge the staff of DPR and cooperating federal, state, local, and private agencies for contributing to the database.
DISCLAIMER
The mention of commercial products, their source, or their use in this report is not to be construed as either an actual or implied endorsement of such product.
4
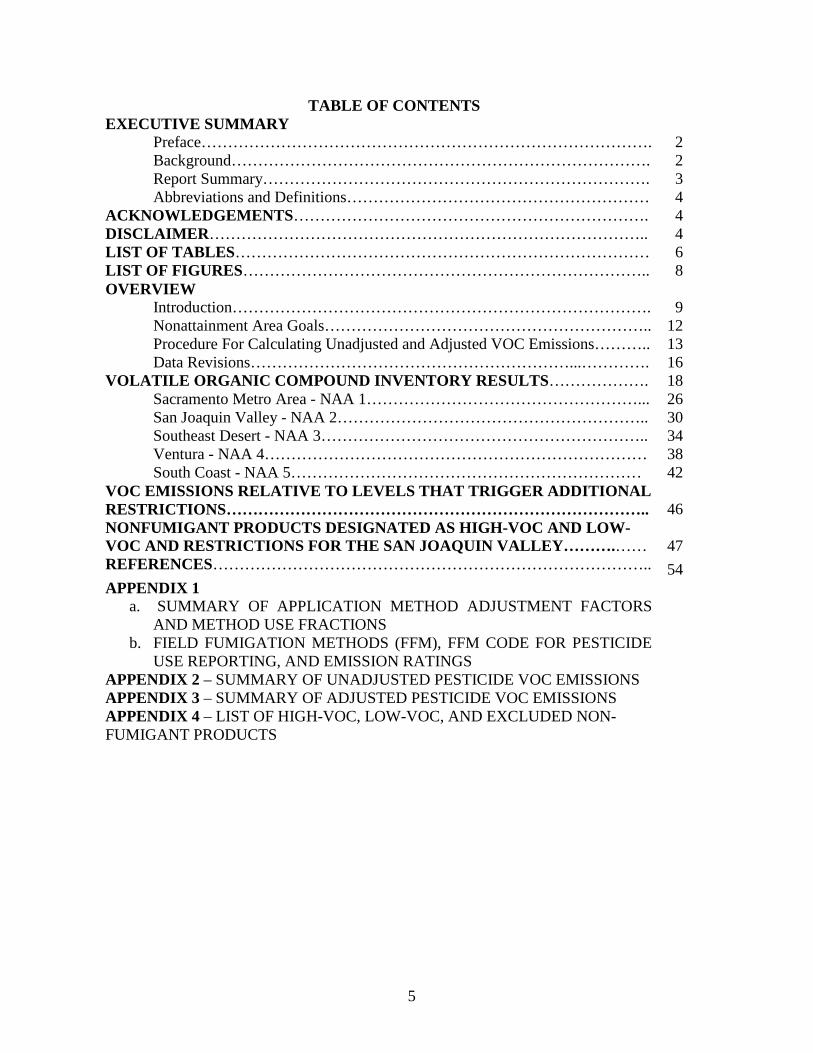
TABLE OF CONTENTS EXECUTIVE SUMMARY
Preface…………………………………………………………………………. 2 2Background…………………………………………………………………….
Report Summary………………………………………………………………. 3 Abbreviations and Definitions………………………………………………… 4
ACKNOWLEDGEMENTS…………………………………………………………. 4 DISCLAIMER……………………………………………………………………….. 4 LIST OF TABLES…………………………………………………………………… 6 LIST OF FIGURES………………………………………………………………….. 8 OVERVIEW
Introduction……………………………………………………………………. 9 Nonattainment Area Goals…………………………………………………….. 12 Procedure For Calculating Unadjusted and Adjusted VOC Emissions……….. 13 Data Revisions……………………………………………………...…………. 16
VOLATILE ORGANIC COMPOUND INVENTORY RESULTS………………. 18 Sacramento Metro Area - NAA 1……………………………………………... 26 San Joaquin Valley - NAA 2………………………………………………….. 30 Southeast Desert - NAA 3…………………………………………………….. 34 Ventura - NAA 4……………………………………………………………… 38 South Coast - NAA 5………………………………………………………… 42
VOC EMISSIONS RELATIVE TO LEVELS THAT TRIGGER ADDITIONAL RESTRICTIONS…………………………………………………………………….. 46 NONFUMIGANT PRODUCTS DESIGNATED AS HIGH-VOC AND LOWVOC AND RESTRICTIONS FOR THE SAN JOAQUIN VALLEY……….…… 47 REFERENCES……………………………………………………………………….. 54 APPENDIX 1
a. SUMMARY OF APPLICATION METHOD ADJUSTMENT FACTORS AND METHOD USE FRACTIONS
b. FIELD FUMIGATION METHODS (FFM), FFM CODE FOR PESTICIDE USE REPORTING, AND EMISSION RATINGS
APPENDIX 2 – SUMMARY OF UNADJUSTED PESTICIDE VOC EMISSIONS APPENDIX 3 – SUMMARY OF ADJUSTED PESTICIDE VOC EMISSIONS APPENDIX 4 – LIST OF HIGH-VOC, LOW-VOC, AND EXCLUDED NONFUMIGANT PRODUCTS
5
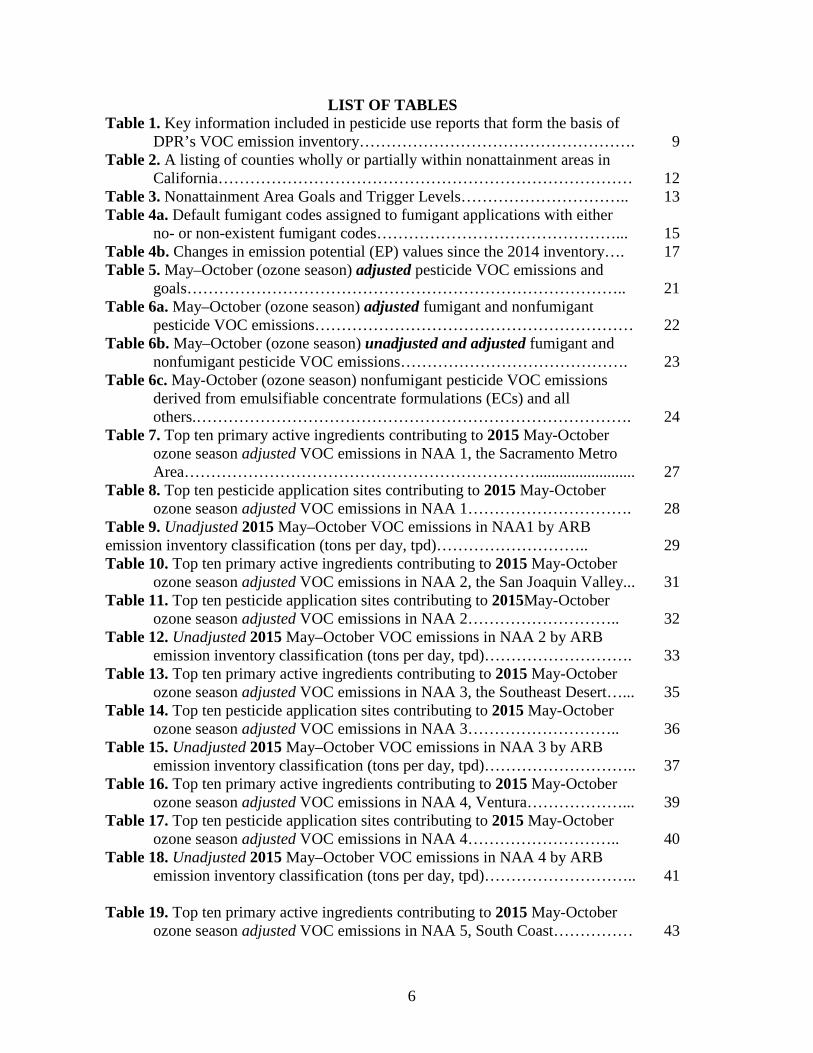
LIST OF TABLES Table 1. Key information included in pesticide use reports that form the basis of
DPR’s VOC emission inventory……………………………………………. 9 Table 2. A listing of counties wholly or partially within nonattainment areas in
California…………………………………………………………………… 12 Table 3. Nonattainment Area Goals and Trigger Levels………………………….. 13 Table 4a. Default fumigant codes assigned to fumigant applications with either
no- or non-existent fumigant codes………………………………………... 15 Table 4b. Changes in emission potential (EP) values since the 2014 inventory…. 17 Table 5. May–October (ozone season) adjusted pesticide VOC emissions and
goals……………………………………………………………………….. 21 Table 6a. May–October (ozone season) adjusted fumigant and nonfumigant
pesticide VOC emissions…………………………………………………… 22 Table 6b. May–October (ozone season) unadjusted and adjusted fumigant and
nonfumigant pesticide VOC emissions……………………………………. 23 Table 6c. May-October (ozone season) nonfumigant pesticide VOC emissions
derived from emulsifiable concentrate formulations (ECs) and all others.………………………………………………………………………. 24
Table 7. Top ten primary active ingredients contributing to 2015 May-October ozone season adjusted VOC emissions in NAA 1, the Sacramento Metro Area…………………………………………………………......................... 27
Table 8. Top ten pesticide application sites contributing to 2015 May-October ozone season adjusted VOC emissions in NAA 1…………………………. 28
Table 9. Unadjusted 2015 May–October VOC emissions in NAA1 by ARB emission inventory classification (tons per day, tpd)……………………….. 29 Table 10. Top ten primary active ingredients contributing to 2015 May-October
ozone season adjusted VOC emissions in NAA 2, the San Joaquin Valley... 31 Table 11. Top ten pesticide application sites contributing to 2015May-October
ozone season adjusted VOC emissions in NAA 2……………………….. 32 Table 12. Unadjusted 2015 May–October VOC emissions in NAA 2 by ARB
emission inventory classification (tons per day, tpd)………………………. 33 Table 13. Top ten primary active ingredients contributing to 2015 May-October
ozone season adjusted VOC emissions in NAA 3, the Southeast Desert…... 35 Table 14. Top ten pesticide application sites contributing to 2015 May-October
ozone season adjusted VOC emissions in NAA 3……………………….. 36 Table 15. Unadjusted 2015 May–October VOC emissions in NAA 3 by ARB
emission inventory classification (tons per day, tpd)……………………….. 37 Table 16. Top ten primary active ingredients contributing to 2015 May-October
ozone season adjusted VOC emissions in NAA 4, Ventura………………... 39 Table 17. Top ten pesticide application sites contributing to 2015 May-October
ozone season adjusted VOC emissions in NAA 4……………………….. 40 Table 18. Unadjusted 2015 May–October VOC emissions in NAA 4 by ARB
emission inventory classification (tons per day, tpd)……………………….. 41
Table 19. Top ten primary active ingredients contributing to 2015 May-October ozone season adjusted VOC emissions in NAA 5, South Coast…………… 43
6

Table 20. Top ten pesticide application sites contributing to 2015 May-October ozone season adjusted VOC emissions in NAA 5……………………….. 44
Table 21. Unadjusted 2015 May–October VOC emissions in NAA 5 by ARB emission inventory classification (tons per day, tpd)………………………. 45
Table 22. Trigger levels and 2015 pesticide VOC emissions.……………………... 46 Table 23. Emission potential thresholds for agricultural products with abamectin,
chlorpyrifos, giberellins or oxyfluorfen as the primary active ingredient…. 47 Table 24. Abamectin, chlorpyrifos, gibberellins and oxyfluorfen contributions to
2015 May-October ozone season adjusted VOC emissions in NAA 2, the San Joaquin Valley ………………………………………………………. 49
Table 25. Emissions from 2014 and 2015 applications of high- and low-VOC products for abamectin, chlorpyrifos, gibberellins and oxyfluorfen on all commodity sites…………………………………………………………… 49
Table 26. Emissions from 2014 and 2015 applications of high- and low-VOC products for abamectin, chlorpyrifos, gibberellins and oxyfluorfen on alfalfa, almonds, citrus, cotton, grapes, pistachios, or walnuts……………. 50
Table 27. Pounds of product and active ingredient used in NAA2 from 2014 to 2015……………………………………………………………………….. 51
Table 28. Calculation of hypothetical emissions as described in section 6884(c)… 53
7

LIST OF FIGURES Figure 1. Federal nonattainment areas affected by California Regulations to
reduce emissions from fumigant pesticides………………………………… 11 Figure 2. Annual unadjusted ozone season pesticide VOC emissions by NAA
from 1990 to 2015, inclusive……………………………………………….. 20 Figure 3. Annual ozone season pesticide VOC emissions by NAA. These figures
show adjusted emissions and SIP goals (reductions from 1990 emissions)... 25 Figure 4. Pesticide VOC emissions for the Sacramento Metro NAA, May–
October.……………………………………………………………………. 27 Figure 5. Changes in adjusted emissions of selected AIs in the Sacramento Metro
NAA from 2012 to 2015……………………………………………………. 28 Figure 6. Changes in emissions from selected commodities/sites in the
Sacramento Metro NAA from 2012 to 2015……………………………….. 29 Figure 7. Pesticide VOC emissions for the San Joaquin Valley NAA, May–
October……………………………………………………………………… 31 Figure 8. Changes in adjusted emissions of selected AIs in the San Joaquin Valley
NAA from 2012 to 2015……………………………………………………. 32 Figure 9. Changes in emissions from selected commodities/sites in the San
Joaquin Valley NAA from 2012 to 2015………………………………….. 33 Figure 10. Pesticide VOC emissions for the Southeast Desert NAA, May–
October……………………………………………………………………. 35 Figure 11. Changes in adjusted emissions of selected AIs in the Southeast Desert
NAA from 2012 to 2015……………………………………………………. 36 Figure 12. Changes in emissions from selected commodities/sites in the Southeast
Desert NAA from 2012 to 2015……………………………... 37 Figure 13. Pesticide VOC emissions for the Ventura NAA, May–October.………. 39 Figure 14. Changes in adjusted emissions of selected AIs in the Ventura NAA
from 2011 to 2014…………………………………………………………... 40 Figure 15. Changes in emissions from selected commodities/sites in the Ventura
NAA from 2011 to 2014………………………………………. 41 Figure 16. Pesticide VOC emissions for the South Coast NAA, May–
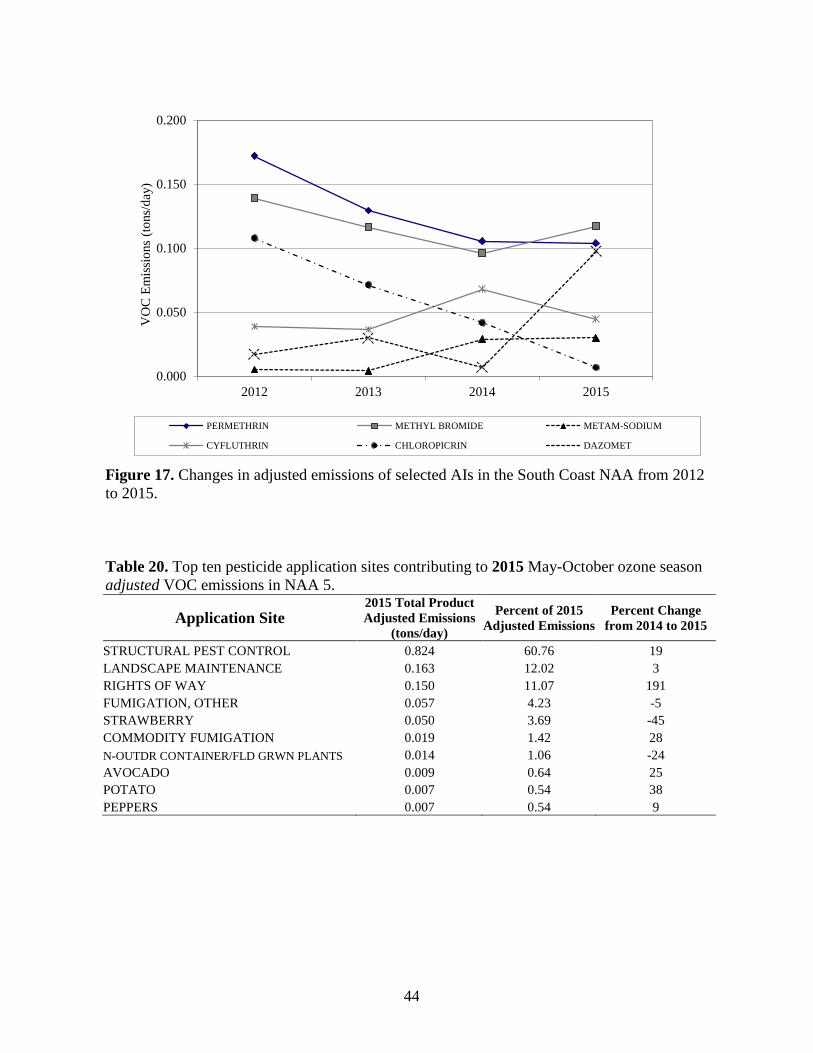
October.…………………………………………………………………….. 43 Figure 17. Changes in adjusted emissions of selected AIs in the South Coast NAA
from 2012 to 2015…………………………………………………………... 44 Figure 18. Changes in emissions from selected commodities/sites in the South
Coast NAA from 2012 to 2015………………………………….................. 45
8
OVERVIEW
Introduction
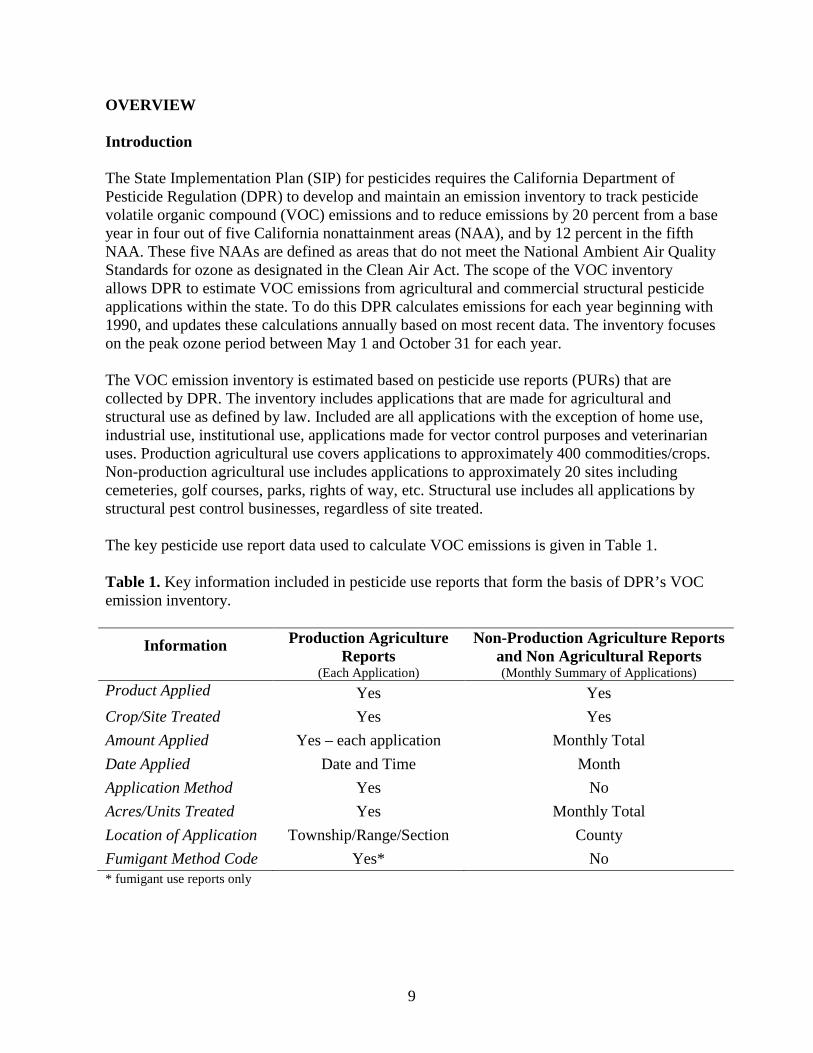
The State Implementation Plan (SIP) for pesticides requires the California Department of Pesticide Regulation (DPR) to develop and maintain an emission inventory to track pesticide volatile organic compound (VOC) emissions and to reduce emissions by 20 percent from a base year in four out of five California nonattainment areas (NAA), and by 12 percent in the fifth NAA. These five NAAs are defined as areas that do not meet the National Ambient Air Quality Standards for ozone as designated in the Clean Air Act. The scope of the VOC inventory allows DPR to estimate VOC emissions from agricultural and commercial structural pesticide applications within the state. To do this DPR calculates emissions for each year beginning with 1990, and updates these calculations annually based on most recent data. The inventory focuses on the peak ozone period between May 1 and October 31 for each year.
The VOC emission inventory is estimated based on pesticide use reports (PURs) that are collected by DPR. The inventory includes applications that are made for agricultural and structural use as defined by law. Included are all applications with the exception of home use, industrial use, institutional use, applications made for vector control purposes and veterinarian uses. Production agricultural use covers applications to approximately 400 commodities/crops. Non-production agricultural use includes applications to approximately 20 sites including cemeteries, golf courses, parks, rights of way, etc. Structural use includes all applications by structural pest control businesses, regardless of site treated.
The key pesticide use report data used to calculate VOC emissions is given in Table 1.
Table 1. Key information included in pesticide use reports that form the basis of DPR’s VOC emission inventory.
Information Production Agriculture Reports
Non-Production Agriculture Reports and Non Agricultural Reports
(Each Application) (Monthly Summary of Applications) Product Applied Yes Yes Crop/Site Treated Yes Yes Amount Applied Yes – each application Monthly Total Date Applied Date and Time Month Application Method Yes No Acres/Units Treated Yes Monthly Total Location of Application Township/Range/Section County Fumigant Method Code Yes* No * fumigant use reports only
9
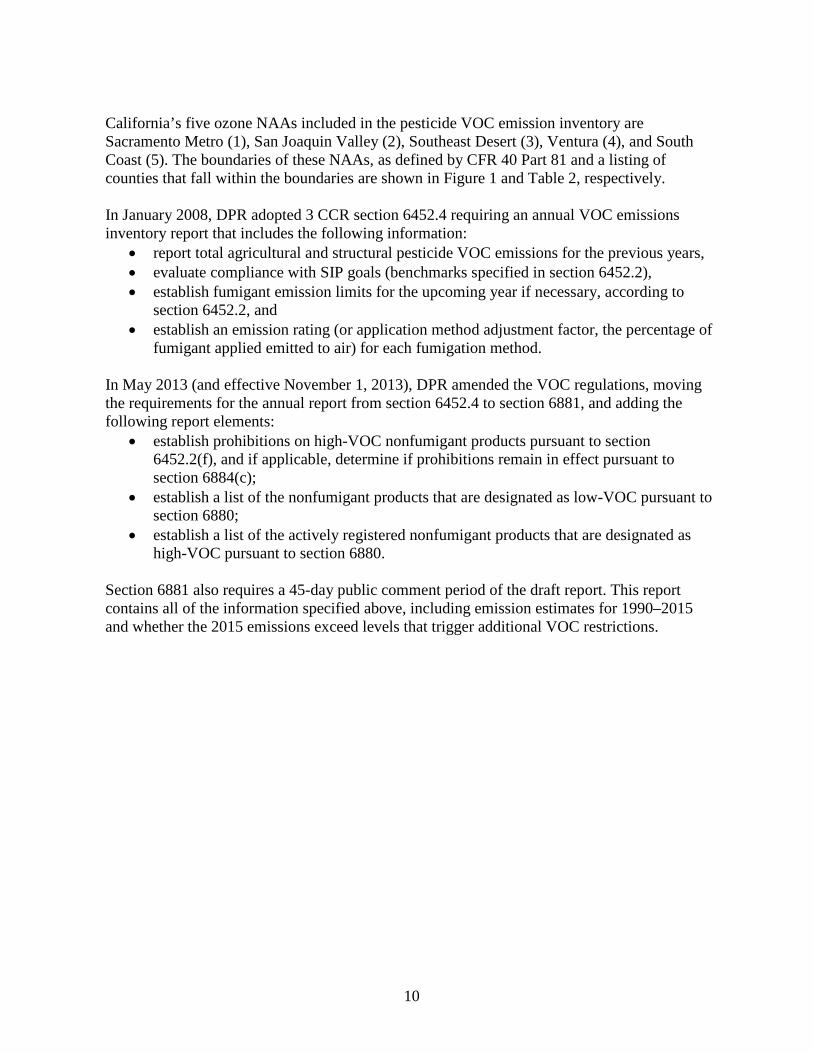
California’s five ozone NAAs included in the pesticide VOC emission inventory are Sacramento Metro (1), San Joaquin Valley (2), Southeast Desert (3), Ventura (4), and South Coast (5). The boundaries of these NAAs, as defined by CFR 40 Part 81 and a listing of counties that fall within the boundaries are shown in Figure 1 and Table 2, respectively.
In January 2008, DPR adopted 3 CCR section 6452.4 requiring an annual VOC emissions inventory report that includes the following information: • report total agricultural and structural pesticide VOC emissions for the previous years, • evaluate compliance with SIP goals (benchmarks specified in section 6452.2), • establish fumigant emission limits for the upcoming year if necessary, according to
section 6452.2, and • establish an emission rating (or application method adjustment factor, the percentage of
fumigant applied emitted to air) for each fumigation method.
In May 2013 (and effective November 1, 2013), DPR amended the VOC regulations, moving the requirements for the annual report from section 6452.4 to section 6881, and adding the following report elements: • establish prohibitions on high-VOC nonfumigant products pursuant to section
6452.2(f), and if applicable, determine if prohibitions remain in effect pursuant to section 6884(c);
• establish a list of the nonfumigant products that are designated as low-VOC pursuant to section 6880;
• establish a list of the actively registered nonfumigant products that are designated as high-VOC pursuant to section 6880.
Section 6881 also requires a 45-day public comment period of the draft report. This report contains all of the information specified above, including emission estimates for 1990–2015 and whether the 2015 emissions exceed levels that trigger additional VOC restrictions.
10

Figure 1. Federal nonattainment areas affected by California Regulations to reduce emissions from fumigant pesticides.
11

Table 2. A listing of counties wholly or partially within nonattainment areas in California.
NAA Counties within the NAA
1 – Sacramento Metro
2 – San Joaquin Valley
All of Sacramento, Yolo Parts of Sutter, Solano, Placer, El Dorado All of Fresno, Kings, Madera, Merced, San Joaquin, Stanislaus, Tulare Western Part of Kern
3 – Southeast Desert Parts of Los Angeles, San Bernardino, Riverside
4 – Ventura All of Ventura
5 – South Coast All of Orange Western Parts of Los Angeles, San Bernardino, Riverside
Nonattainment Area Goals
The emissions in DPR’s VOC inventory are compared to NAA goals listed in Table 3, which are described in California’s original 1994 SIP (62 Fed. Reg. at 1170, 1997) and Appendix H to the 2007 SIP (73 Fed. Reg. 41277, 2008). These “SIP goals” are a 20 percent reduction from 1990 for the Sacramento Metro, Southeast Desert, Ventura and South Coast NAAs, and a 12 percent reduction from 1990 for the San Joaquin Valley NAA. In August 2012, U.S. EPA approved DPR’s SIP amendment for the San Joaquin Valley. This amendment includes a SIP goal of 18.1 tons/day, equivalent to a 12 percent reduction relative to 1990. Prior to the amendment, the SIP described the reduction commitment only as 12 percent less than 1990. Because the 18.1 tons/day represents the 12 percent reduction from the 1990 baseline calculated using a specific methodology, that methodology must continue to be used to calculate future emissions to assure a legitimate comparison to measure SIP compliance. Therefore, emission estimates for application methods that were used in 1990 cannot be modified, absent a SIP revision. Similarly, nonfumigant pesticides emission potentials of formulations that were used in the base year cannot be changed, absent a SIP revision.
The annual report includes DPR’s determination if emissions exceed levels that trigger additional VOC restrictions. As specified in 3 CCR section 6452.2, additional restrictions are triggered if pesticide VOC emissions in a NAA exceed 95 percent of its SIP goal (Table 3). For the Sacramento Metro, Southeast Desert, South Coast, and Ventura NAAs the additional restrictions are a fumigant emissions limit, enforced by DPR and county agricultural commissioners through grower allowances or other methods. The 2013 regulations revised the additional restrictions for the San Joaquin Valley because nonfumigant products contribute more VOCs than fumigant products in this NAA, so additional restrictions on nonfumigant products is a more efficient method to ensure that the SIP goal is achieved. If VOC emissions exceed the trigger level for the San Joaquin Valley, certain uses of high-VOC products are prohibited (3 CCR section 6884). For all five NAAs, the additional restrictions are triggered for the upcoming May-October period based on the emissions inventory for the previous year. For example, the 2015 emissions inventory is used to determine if additional VOC restrictions will go into effect for May-October 2017. Additional information on the 2013 regulations and changes to the additional restrictions is available at <http://www.cdpr.ca.gov/docs/emon/vocs/vocproj/reduce_nonfumigant.htm>.
12
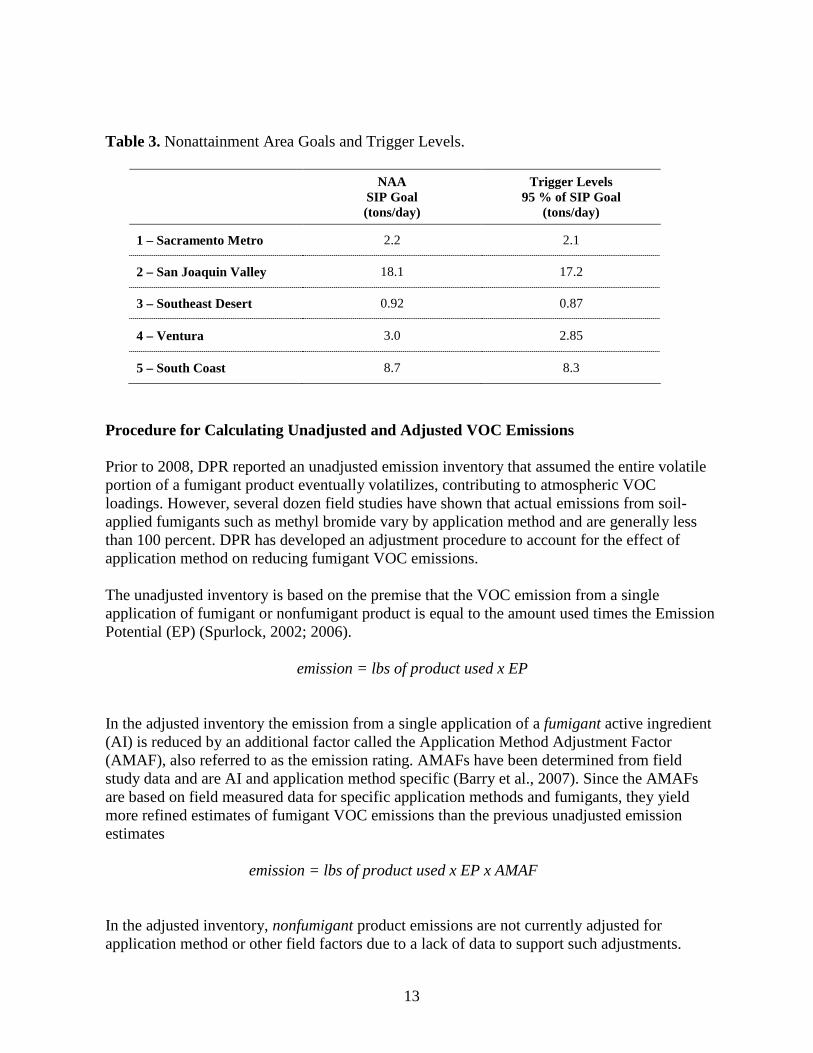
Table 3. Nonattainment Area Goals and Trigger Levels.
1 – Sacramento Metro
NAA SIP Goal (tons/day)
2.2
Trigger Levels 95 % of SIP Goal
(tons/day)
2.1
2 – San Joaquin Valley 18.1 17.2
3 – Southeast Desert 0.92 0.87
4 – Ventura 3.0 2.85
5 – South Coast 8.7 8.3
Procedure for Calculating Unadjusted and Adjusted VOC Emissions
Prior to 2008, DPR reported an unadjusted emission inventory that assumed the entire volatile portion of a fumigant product eventually volatilizes, contributing to atmospheric VOC loadings. However, several dozen field studies have shown that actual emissions from soil-applied fumigants such as methyl bromide vary by application method and are generally less than 100 percent. DPR has developed an adjustment procedure to account for the effect of application method on reducing fumigant VOC emissions.
The unadjusted inventory is based on the premise that the VOC emission from a single application of fumigant or nonfumigant product is equal to the amount used times the Emission Potential (EP) (Spurlock, 2002; 2006).
emission = lbs of product used x EP
In the adjusted inventory the emission from a single application of a fumigant active ingredient (AI) is reduced by an additional factor called the Application Method Adjustment Factor (AMAF), also referred to as the emission rating. AMAFs have been determined from field study data and are AI and application method specific (Barry et al., 2007). Since the AMAFs are based on field measured data for specific application methods and fumigants, they yield more refined estimates of fumigant VOC emissions than the previous unadjusted emission estimates
emission = lbs of product used x EP x AMAF
In the adjusted inventory, nonfumigant product emissions are not currently adjusted for application method or other field factors due to a lack of data to support such adjustments.
13
Consequently their emissions are calculated using the same procedure as the unadjusted inventory.
Usually there are several different types of application methods used for a particular fumigant in any particular NAA. Each method of use (e.g. drip, sprinkler, shank, tarp, etc.) represents a fraction of the total number of methods used and is referred to as the Method Use Fraction (MUF). The sum of all MUFs for any particular (NAA/fumigant AI) combination is one. Use practices change over time so that different MUFs are used for the baseline year (1990) as opposed to more recent inventory years. For 2007 and earlier years, MUFs are determined in a number of different ways. For 1,3-dichloropropene the MUFs are determined from use data collected by the registrant in support of DPR’s township application caps; for metam sodium and metam potassium grower/applicator surveys were conducted to determine types of applications for different crops and areas. Methyl bromide and chloropicrin MUFs are based on expert opinion and regulatory history. Finally, MUFs for dazomet and sodium tetrathiocarbonate equal one because the AMAFs for each of these two fumigants are constant, independent of application method. A detailed discussion of how MUF and AMAFs were determined is given by Barry et al (2007).
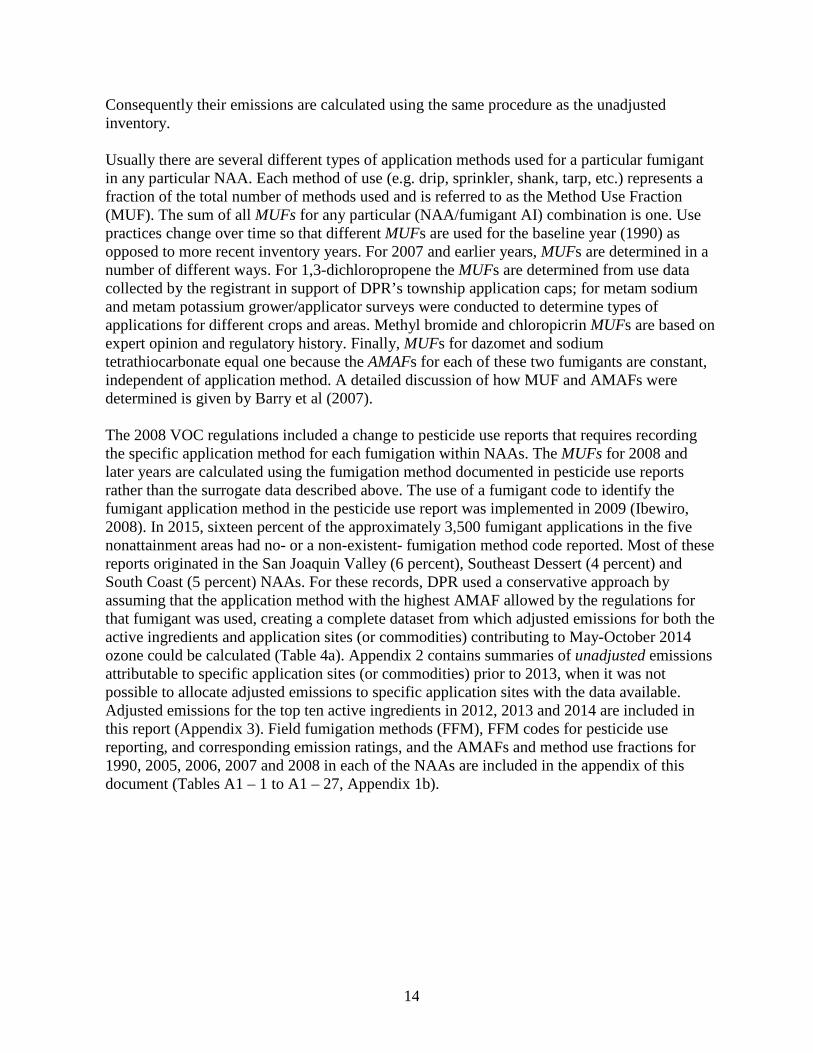
The 2008 VOC regulations included a change to pesticide use reports that requires recording the specific application method for each fumigation within NAAs. The MUFs for 2008 and later years are calculated using the fumigation method documented in pesticide use reports rather than the surrogate data described above. The use of a fumigant code to identify the fumigant application method in the pesticide use report was implemented in 2009 (Ibewiro, 2008). In 2015, sixteen percent of the approximately 3,500 fumigant applications in the five nonattainment areas had no- or a non-existent- fumigation method code reported. Most of these reports originated in the San Joaquin Valley (6 percent), Southeast Dessert (4 percent) and South Coast (5 percent) NAAs. For these records, DPR used a conservative approach by assuming that the application method with the highest AMAF allowed by the regulations for that fumigant was used, creating a complete dataset from which adjusted emissions for both the active ingredients and application sites (or commodities) contributing to May-October 2014 ozone could be calculated (Table 4a). Appendix 2 contains summaries of unadjusted emissions attributable to specific application sites (or commodities) prior to 2013, when it was not possible to allocate adjusted emissions to specific application sites with the data available. Adjusted emissions for the top ten active ingredients in 2012, 2013 and 2014 are included in this report (Appendix 3). Field fumigation methods (FFM), FFM codes for pesticide use reporting, and corresponding emission ratings, and the AMAFs and method use fractions for 1990, 2005, 2006, 2007 and 2008 in each of the NAAs are included in the appendix of this document (Tables A1 – 1 to A1 – 27, Appendix 1b).
14
Table 4a. Default fumigant codes assigned to fumigant applications with either no- or nonexistent fumigant codes.
Active Ingredient Default AMAF Methyl Bromide with or without Chloropicrin 48% 1,3-Dichloropropene with or without Chloropicrin 44% Chloropicrin Only 44% Metam-Sodium or Potassium N-Methyldithiocarbamate 28% Dazomet 17% Sodium Tetrathiocarbonate 10%
In addition to the VOC emissions derived from fumigant active ingredients, inert ingredients for products that contain chloropicrin, methyl bromide, 1,3-dichloropropene and methyl iodide are assumed to be volatile and are included in the inventory calculations. For the highest use products containing those fumigants, DPR analyzes their confidential statements of formula to determine the composition of inerts and decides whether those inerts are nonvolatile. Inert ingredients used in products containing metam sodium, metam potassium, sodium tetrathiocarbonate and dazomet are non-volatile and so do not contribute to the emission potential of these products.
Non-production agriculture and non-agricultural pesticide applications are reported to DPR as “monthly summary data” with no geographic location information beyond the county of application (Table 1). These include commercial structural, landscape maintenance, rights of way, and commodity fumigations. In cases where two or more air basins, one of which may be in a nonattainment area (NAA), are present within a single county, these applications must be proportionally allocated. DPR allocates these monthly summary applications using surrogate data that are assumed to have similar geographic distributions. In 2012, the surrogate data was updated to provide the most accurate estimated geographic distribution of VOC emissions, reflecting changes in California’s population and transportation infrastructure. U.S. Census data for the 2010 decennial census together with TIGER/Line shapefiles for roads, rail roads and linear hydrography were used as surrogates for commercial structural, landscape maintenance and rights of way applications. Commodity fumigation data were provided by California County Agricultural Commissioners (Neal and Spurlock, 2012).
VOC emissions were calculated for each NAA and summed according to primary active ingredient, application site, and emission category as defined by the Air Resources Board (ARB). The primary active ingredient is defined as the pesticide active ingredient present at the highest percentage in a product. If a pesticide product contains 20 percent of active ingredient “A” and 10 percent of active ingredient “B”, all estimated emissions from that product are assigned to the primary active ingredient “A”. This approach prevents “double-counting” of emissions from products containing two active ingredients.
VOC Emissions by ARB Emission Inventory Classification
ARB defines four VOC emission categories: methyl bromide emissions from agricultural applications, non-methyl bromide emissions from agricultural applications, methyl bromide
15
emissions from structural applications, and non-methyl bromide emissions from structural applications. Emissions are calculated for the May–October ozone season according to these categories, and are reported as U.S. tons per day (tpd) in this inventory report.
Data Revisions
DPR continually evaluates pesticide use report data, EP values, MUFs, and AMAFs to ensure the VOC inventory includes the most reliable data. As requested by DPR, registrants provide thermogravimetric analysis (TGA) data, DPR’s preferred data to determine EPs, for new and existing products. Previous inventories have shown that changes in a widely used product’s EP can have a significant impact on the adjusted emissions inventory. Table 4b shows products which had EP values that changed significantly since the previous VOC inventory as a result of recent TGA submissions.
16
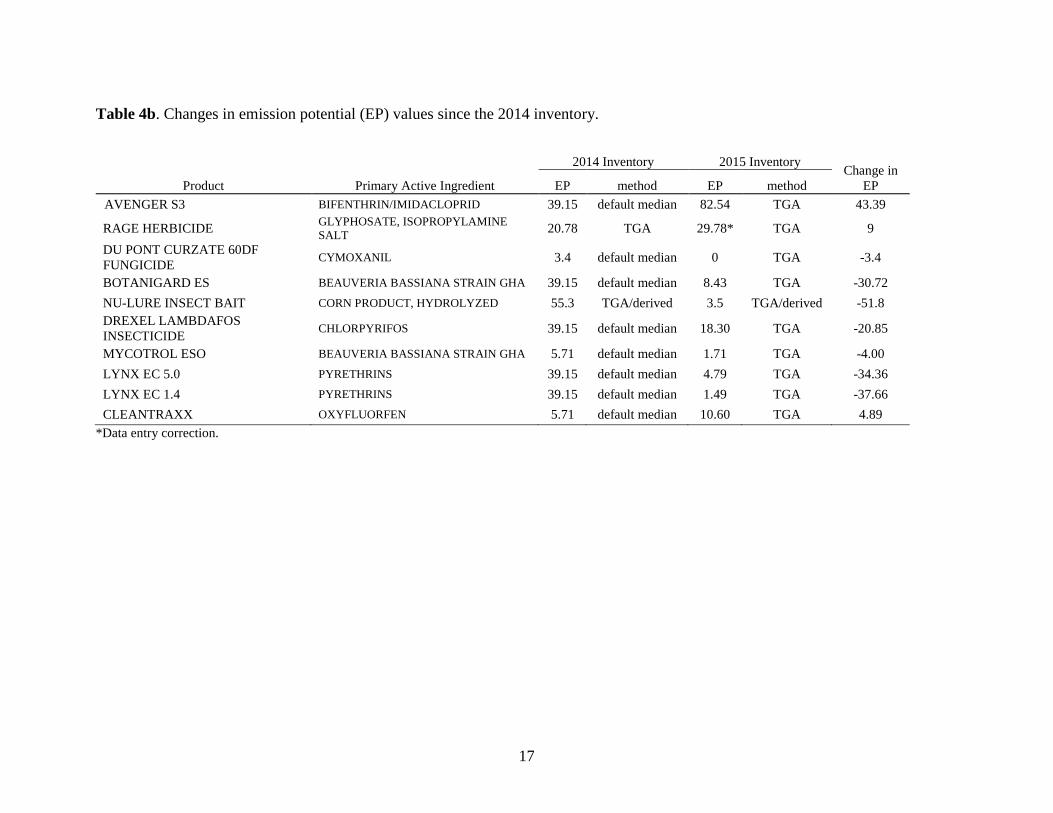
Table 4b. Changes in emission potential (EP) values since the 2014 inventory.
Product AVENGER S3
RAGE HERBICIDE DU PONT CURZATE 60DF FUNGICIDE
Primary Active Ingredient BIFENTHRIN/IMIDACLOPRID GLYPHOSATE, ISOPROPYLAMINE SALT
CYMOXANIL
2014 Inventory
EP method 39.15 default median
20.78 TGA
3.4 default median
2015 Inventory
EP method 82.54 TGA
29.78* TGA
0 TGA
Change in EP
43.39
9
-3.4
BOTANIGARD ES BEAUVERIA BASSIANA STRAIN GHA 39.15 default median 8.43 TGA -30.72 NU-LURE INSECT BAIT DREXEL LAMBDAFOS INSECTICIDE
CORN PRODUCT, HYDROLYZED
CHLORPYRIFOS
55.3
39.15
TGA/derived
default median
3.5
18.30
TGA/derived
TGA
-51.8
-20.85
MYCOTROL ESO BEAUVERIA BASSIANA STRAIN GHA 5.71 default median 1.71 TGA -4.00 LYNX EC 5.0 PYRETHRINS 39.15 default median 4.79 TGA -34.36 LYNX EC 1.4 PYRETHRINS 39.15 default median 1.49 TGA -37.66 CLEANTRAXX OXYFLUORFEN 5.71 default median 10.60 TGA 4.89
*Data entry correction.
17
VOLATILE ORGANIC COMPOUND INVENTORY RESULTS
The main text of this report summarizes the pesticide VOC emission inventory data for 2015 only. Adjusted and unadjusted emission data for 2012, 2013 and 2014 are summarized in Appendices 2 and 3. Inventory data for prior years can be found in previous inventory reports located at http://www.cdpr.ca.gov/docs/emon/vocs/vocproj/voc_data_analysis.htm.
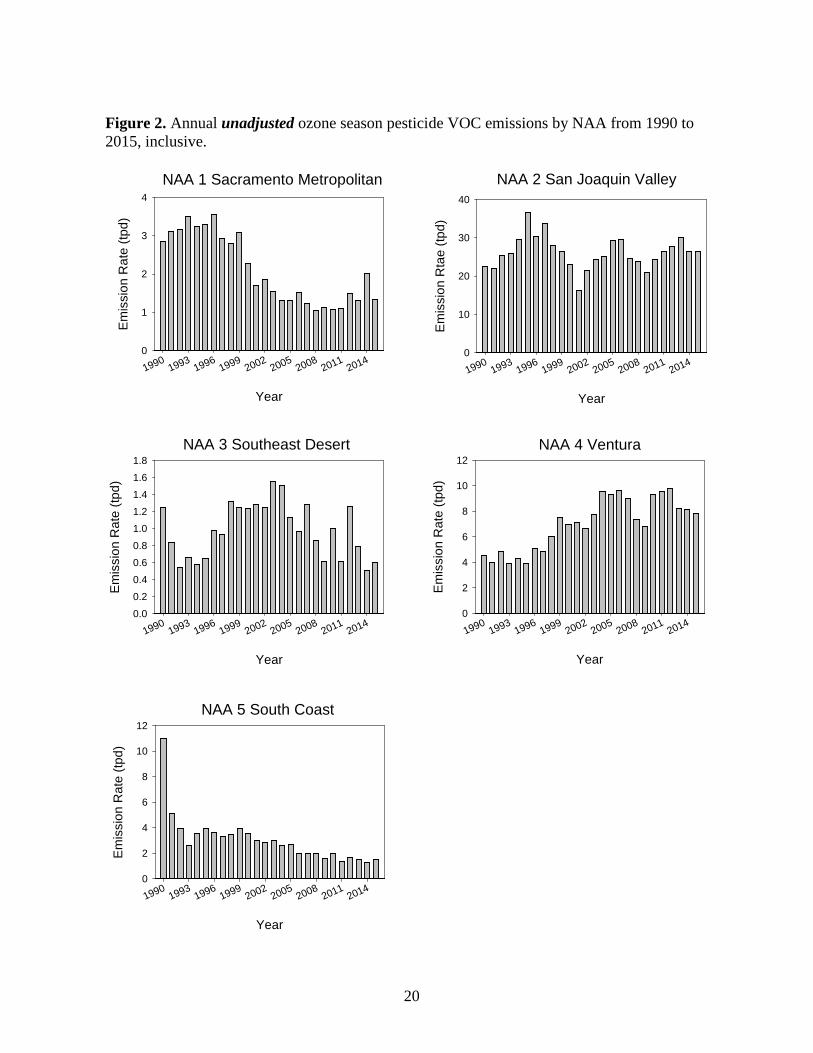
Figure 2 illustrates the changes in unadjusted VOC emissions from 1990 to 2015. These values are unadjusted and so do not take in to consideration MUFs and AMAFs that can only be applied to emissions in 2004 through 2015, and 1990. The figure is useful in that it compares emissions for the entire history of the inventory and shows trends in five NAAs.
Tables 5 and 6a and Figure 3 summarize the adjusted pesticide VOC emissions for 2004 through 2015, and compare them to the SIP goals that are based on a percentage reduction from the 1990. Table 6b compares the unadjusted and adjusted fumigant VOC emissions for 2004 through 2015. Table 6c shows the amount of emissions that resulted from nonfumigant products with emulsifiable concentrate formulations compared to all other nonfumigant formulations. The emissions in the base year are also included to reflect the long term decrease or increase. Generally, what the tables and figure show can be summarized as follows:
• Adjusted emissions in 2015 in the Sacramento Metro (1) decreased from 1.386 tpd in 2014 to 1.190 tpd. This decrease was largely due to a reduction in the use of fumigants. Nonfumigants represented 92 percent of the total, the latter remaining 46 percent below the SIP goal of 2.2 tpd. Forty-seven percent (0.515 tpd) of nonfumigant emissions were derived from products with emulsifiable concentrate formulations.
• In the San Joaquin Valley (2), total adjusted VOC emissions decreased by 9 percent from 2014 to 2015. Total adjusted emissions were below the SIP goal of 18.1 tpd by 2.799 tpd. Nonfumigant emissions accounted for less than seventy percent of the total VOC emissions in the San Joaquin Valley in 2015, with emissions from products with emulsifiable concentrate formulations accounting for 39 percent of the total VOC emissions for this NAA. VOC emissions from emulsifiable concentrates decreased from 7.308 tpd in 2014 to 5.975 tpd in 2015. Fumigant emissions increased from 4.026 tpd in 2014 to 4.777 tpd in 2015.
• In 2015, fumigants accounted for 27 percent of VOC emissions in the Southeast Desert (3) compared to 29 percent in 2014. Total VOC emissions in 2015 increased by almost 25 percent from 2014, to 0.358 tpd, and are still well below (61 percent) the SIP goal (0.92 tpd).
• 2015 VOC emissions in the Ventura NAA (4) continue to be lower than in years prior to 2013. Emissions increased by three percent from 2014 to 1.665 tpd, meeting the regulatory goals for 2015. Seventy-three percent (73%) of emissions came from fumigants.
• Emissions in the South Coast NAA (5) increased by 16 percent over 2014 values to 1.357 tpd in 2015, and continue to be well below the SIP goal of 8.7 tpd. Eighty-one percent (81%) of the total adjusted VOC emissions came from non-fumigants (1.098
18
tpd), of which 31 percent are attributable to products with emulsifiable concentrate formulations.
Pesticide use varies from year to year depending on many factors, including weather, drought, pest problems, economics and types of crops planted. Increases and decreases in pesticide use from one year to the next or in the span of a few years do not necessarily indicate a trend. Such variances are and will continue to be a normal occurrence. For example, extremely heavy rains result in excessive weeds, thus more pesticides may be used; drought conditions may give rise to fewer planted acres and less pesticide use. A more detailed explanation of pesticide use patterns is given in DPR’s annual summary of pesticide use reports at http://www.cdpr.ca.gov/docs/pur/purmain.htm.
The decrease in emissions in the San Joaquin Valley NAA and the continuing trend seen in the Ventura NAA in 2015 can be attributed to the success DPR, growers, registrants, and others have achieved by taking steps to reduce VOC emissions by using lower emission methods and products. DPR continues to register reformulated products with lower EPs, including products containing abamectin, chlorpyrifos, gibberellins and oxyfluorfen that are major VOC contributors. Nonfumigant pesticide products, particularly emulsifiable concentrates, contribute more VOC emissions than fumigants in the San Joaquin Valley. DPR adopted regulations for nonfumigant products in 2013 and most of the requirements went into effect beginning in May 2014. The nonfumigant regulations designate certain products containing abamectin, chlorpyrifos, gibberellins, and oxyfluorfen as high-VOC products. San Joaquin Valley growers must obtain a recommendation from a pest control adviser prior to certain uses of these high-VOC products, and pest control advisers are required to recommend low-VOC products when feasible. The criteria and specific products designated as high-VOC and low-VOC are discussed in a later section.
The 2013 and earlier VOC regulations include additional restrictions that are triggered if pesticide VOC emissions in a NAA exceed 95 percent of its SIP goal. None of the five NAAs exceeded their trigger levels in 2015. However, San Joaquin Valley exceeded its trigger level in 2013, requiring certain uses of the designated high-VOC products to be prohibited during May-October for that NAA beginning in 2015 and remaining in effect for at least two years.
19
19901993
19961999
20022005
20082011
2014 1990
19931996
19992002
20052008
20112014
19901993
19961999
20022005
20082011
2014 1990
19931996
19992002
20052008
20112014
19901993
19961999
20022005
20082011
2014
Figure 2. Annual unadjusted ozone season pesticide VOC emissions by NAA from 1990 to 2015, inclusive.
NAA 1 Sacramento Metropolitan NAA 2 San Joaquin Valley 4 40
0 0
Em
issi
on R
ate
(tpd)
E
mis
sion
Rat
e (tp
d)
Em
issi
on R
ate
(tpd)
Em
issi
on R
ate
(tpd)
E
mis
sion
Rta
e (tp
d)
3 30
2 20
1 10
Year Year
NAA 3 Southeast Desert NAA 4 Ventura 12 1.8
1.6
1.4
1.2
1.0
0.8
0.6
0.4
0.2
10
8
6
4
2
0.0 0
Year Year
NAA 5 South Coast 12
10
8
6
4
2
0
Year
20
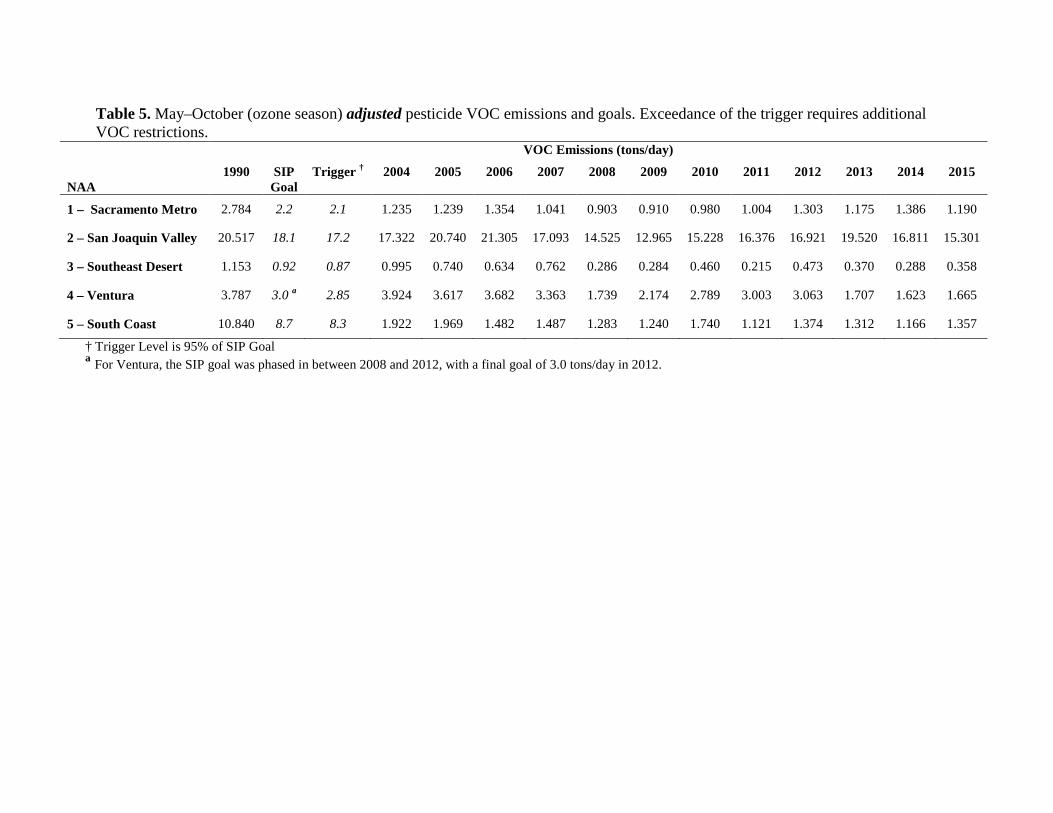
Table 5. May–October (ozone season) adjusted pesticide VOC emissions and goals. Exceedance of the trigger requires additional VOC restrictions.
VOC Emissions (tons/day)
1990 SIP Trigger † 2004 2005 2006 2007 2008 2009 2010 2011 2012 2013 2014 2015 NAA Goal
1 – Sacramento Metro 2.784 2.2 2.1 1.235 1.239 1.354 1.041 0.903 0.910 0.980 1.004 1.303 1.175 1.386 1.190
2 – San Joaquin Valley 20.517 18.1 17.2 17.322 20.740 21.305 17.093 14.525 12.965 15.228 16.376 16.921 19.520 16.811 15.301
3 – Southeast Desert 1.153 0.92 0.87 0.995 0.740 0.634 0.762 0.286 0.284 0.460 0.215 0.473 0.370 0.288 0.358
4 – Ventura 3.787 3.0 a 2.85 3.924 3.617 3.682 3.363 1.739 2.174 2.789 3.003 3.063 1.707 1.623 1.665
5 – South Coast 10.840 8.7 8.3 1.922 1.969 1.482 1.487 1.283 1.240 1.740 1.121 1.374 1.312 1.166 1.357
† Trigger Level is 95% of SIP Goal a For Ventura, the SIP goal was phased in between 2008 and 2012, with a final goal of 3.0 tons/day in 2012.

Table 6a. May–October (ozone season) adjusted fumigant and nonfumigant pesticide VOC emissions. VOC Emissions (tons/day)
NAA 1990 2004 2005 2006 2007 2008 2009 2010 2011 2012 2013 2014 2015 Sacramento Metro
Fumigants 0.384 0.111 0.085 0.162 0.189 0.064 0.134 0.097 0.061 0.083 0.068 0.246 0.098 (14%) (9%) (7%) (12%) (18%) (7%) (15%) (10%) (6%) (6%) (6%) (18%) (8%)
Nonfumigants 2.400 1.124 1.154 1.192 0.851 0.838 0.775 0.883 0.944 1.221 1.106 1.140 1.092 (86%) (91%) (93%) (88%) (82%) (93%) (85%) (90%) (94%) (94%) (94%) (82%) (92%)
San Joaquin Valley Fumigants 5.536 6.362 6.910 6.808 6.123 3.370 3.078 3.700 4.001 4.265 4.353 4.026 4.777
(27%) (37%) (33%) (32%) (36%) (23%) (24%) (24%) (24%) (25%) (22%) (24%) (31%) Nonfumigants 14.981 10.960 13.831 14.498 10.970 11.154 9.887 11.528 12.375 12.656 15.167 12.785 10.524
(73%) (63%) (67%) (68%) (64%) (77%) (76%) (76%) (76%) (75%) (78%) (76%) (69%) Southeast Desert
Fumigants 0.840 0.762 0.474 0.413 0.575 0.119 0.137 0.273 0.078 0.258 0.169 0.085 0.095 (73%) (77%) (64%) (65%) (75%) (42%) (48%) (59%) (36%) (55%) (46%) (29%) (27%)
Nonfumigants 0.313 0.233 0.266 0.221 0.187 0.167 0.146 0.186 0.137 0.215 0.201 0.204 0.263 (27%) (23%) (36%) (35%) (25%) (58%) (52%) (41%) (64%) (45%) (54%) (71%) (73%)
Ventura Fumigants 3.140 3.302 3.119 3.175 2.935 1.252 1.720 2.312 2.577 2.681 1.311 1.188 1.211
(83%) (84%) (86%) (86%) (87%) (72%) (79%) (83%) (86%) (88%) (77%) (73%) (73%) Nonfumigants 0.647 0.622 0.497 0.508 0.428 0.486 0.454 0.477 0.425 0.382 0.397 0.435 0.454
(17%) (16%) (14%) (14%) (13%) (28%) (21%) (17%) (12%) (12%) (23%) (27%) (27%) South Coast
Fumigants 9.372 0.702 0.594 0.422 0.411 0.377 0.312 0.375 0.196 0.381 0.285 0.208 0.257 (86%) (37%) (30%) (28%) (28%) (29%) (25%) (22%) (17%) (28%) (22%) (18%) (19%)
Nonfumigants 1.468 1.220 1.375 1.060 1.075 0.906 0.927 1.365 0.926 0.993 1.027 0.958 1.100 (14%) (63%) (70%) (72%) (72%) (71%) (75%) (78%) (83%) (72%) (78%) (82%) (81%)
22

Table 6b. May–October (ozone season) unadjusted and adjusted fumigant pesticide VOC emissions. VOC/applied (tons or pounds of VOCs emitted for each ton or pound of fumigant applied) was calculated by dividing the adjusted fumigant emissions by the unadjusted fumigant emissions. The trends over time and between NAAs indicate if the fumigants and/or fumigation methods used are lower-emitting or higher-emitting.
Emissions NAA 1990 2004 2005 2006 2007 2008 2009 2010 2011 2012 2013 2014 2015
1 – Sacramento Metro Unadjusted (tons/day) 0.461 0.186 0.151 0.315 0.383 0.241 0.363 0.181 0.162 0.263 0.197 0.876 0.247
Adjusted (tons/day) 0.384 0.111 0.085 0.162 0.189 0.064 0.134 0.097 0.061 0.083 0.068 0.246 0.098 VOC/applied (tons/ton) 0.833 0.597 0.563 0.514 0.493 0.266 0.369 0.536 0.375 0.314 0.346 0.281 0.395
2 - San Joaquin Valley Unadjusted (tons/day) 7.491 14.213 15.400 15.034 13.750 12.620 11.119 12.944 14.116 14.969 15.002 13.666 15.937
Adjusted (tons/day) 5.536 6.362 6.910 6.808 6.123 3.370 3.078 3.700 4.001 4.265 4.353 4.026 4.777 VOC/applied (tons/ton) 0.739 0.448 0.449 0.453 0.445 0.267 0.277 0.286 0.283 0.285 0.290 0.295 0.300
3 - Southeast Desert Unadjusted (tons/day) 0.933 1.275 0.863 0.750 1.086 0.684 0.469 0.814 0.482 1.041 0.591 0.308 0.341
Adjusted (tons/day) 0.840 0.762 0.474 0.413 0.575 0.119 0.137 0.273 0.078 0.258 0.169 0.085 0.095 VOC/applied (tons/ton) 0.900 0.598 0.549 0.551 0.529 0.174 0.293 0.336 0.162 0.248 0.286 0.275 0.280
4 - Ventura Unadjusted (tons/day) 3.909 8.916 8.841 9.113 8.658 6.543 6.345 8.844 9.126 9.442 7.846 7.705 7.335
Adjusted (tons/day) 3.140 3.302 3.119 3.175 2.935 1.252 1.720 2.312 2.577 2.681 1.311 1.188 1.211 VOC/applied (tons/ton) 0.803 0.370 0.353 0.348 0.339 0.191 0.271 0.261 0.282 0.284 0.167 0.154 0.165
5 – South Coast Unadjusted (tons/day) 9.514 1.418 1.301 0.898 0.883 1.043 0.694 0.647 0.449 0.672 0.492 0.308 0.394
Adjusted (tons/day) 9.372 0.702 0.594 0.422 0.411 0.377 0.312 0.375 0.196 0.381 0.285 0.208 0.257 VOC/applied (tons/ton) 0.985 0.495 0.457 0.470 0.465 0.361 0.450 0.580 0.435 0.566 0.580 0.674 0.651
23
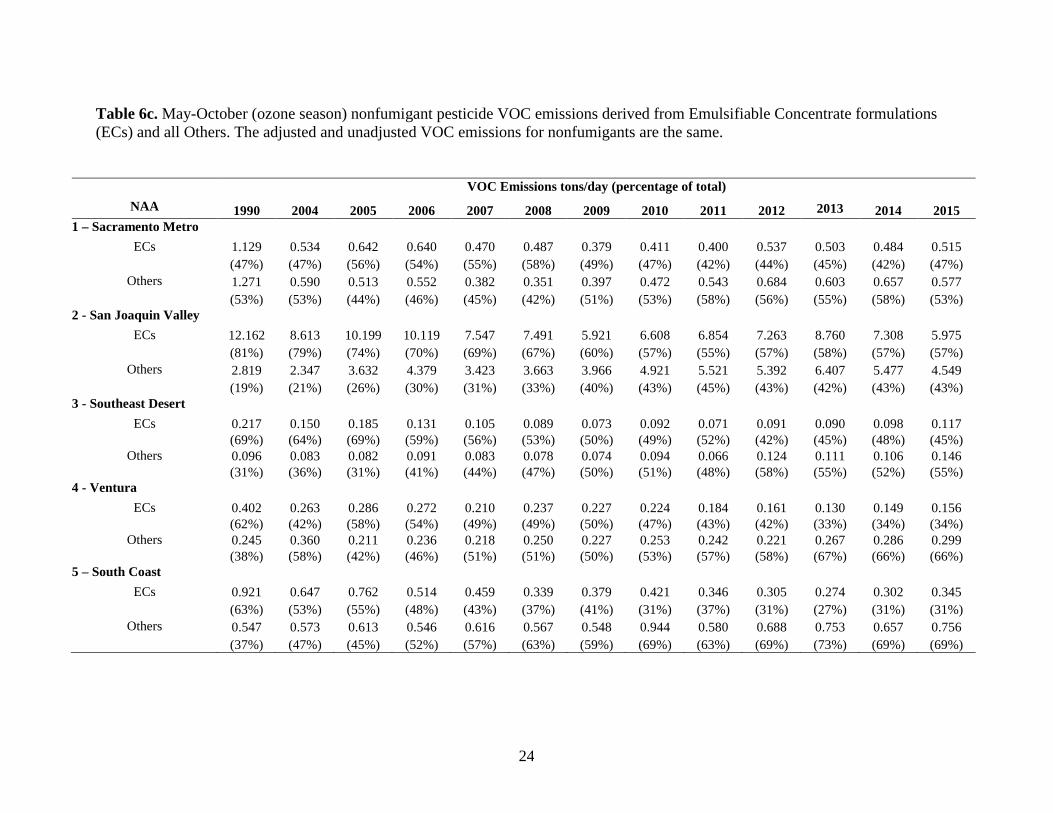
Table 6c. May-October (ozone season) nonfumigant pesticide VOC emissions derived from Emulsifiable Concentrate formulations (ECs) and all Others. The adjusted and unadjusted VOC emissions for nonfumigants are the same.
VOC Emissions tons/day (percentage of total) NAA 1990 2004 2005 2006 2007 2008 2009 2010 2011 2012 2013 2014 2015
1 – Sacramento Metro ECs 1.129 0.534 0.642 0.640 0.470 0.487 0.379 0.411 0.400 0.537 0.503 0.484 0.515
(47%) (47%) (56%) (54%) (55%) (58%) (49%) (47%) (42%) (44%) (45%) (42%) (47%) Others 1.271 0.590 0.513 0.552 0.382 0.351 0.397 0.472 0.543 0.684 0.603 0.657 0.577
(53%) (53%) (44%) (46%) (45%) (42%) (51%) (53%) (58%) (56%) (55%) (58%) (53%) 2 - San Joaquin Valley
ECs 12.162 8.613 10.199 10.119 7.547 7.491 5.921 6.608 6.854 7.263 8.760 7.308 5.975 (81%) (79%) (74%) (70%) (69%) (67%) (60%) (57%) (55%) (57%) (58%) (57%) (57%)
Others 2.819 2.347 3.632 4.379 3.423 3.663 3.966 4.921 5.521 5.392 6.407 5.477 4.549 (19%) (21%) (26%) (30%) (31%) (33%) (40%) (43%) (45%) (43%) (42%) (43%) (43%)
3 - Southeast Desert ECs 0.217 0.150 0.185 0.131 0.105 0.089 0.073 0.092 0.071 0.091 0.090 0.098 0.117
(69%) (64%) (69%) (59%) (56%) (53%) (50%) (49%) (52%) (42%) (45%) (48%) (45%) Others 0.096 0.083 0.082 0.091 0.083 0.078 0.074 0.094 0.066 0.124 0.111 0.106 0.146
(31%) (36%) (31%) (41%) (44%) (47%) (50%) (51%) (48%) (58%) (55%) (52%) (55%) 4 - Ventura
ECs 0.402 0.263 0.286 0.272 0.210 0.237 0.227 0.224 0.184 0.161 0.130 0.149 0.156 (62%) (42%) (58%) (54%) (49%) (49%) (50%) (47%) (43%) (42%) (33%) (34%) (34%)
Others 0.245 0.360 0.211 0.236 0.218 0.250 0.227 0.253 0.242 0.221 0.267 0.286 0.299 (38%) (58%) (42%) (46%) (51%) (51%) (50%) (53%) (57%) (58%) (67%) (66%) (66%)
5 – South Coast ECs 0.921 0.647 0.762 0.514 0.459 0.339 0.379 0.421 0.346 0.305 0.274 0.302 0.345
(63%) (53%) (55%) (48%) (43%) (37%) (41%) (31%) (37%) (31%) (27%) (31%) (31%) Others 0.547 0.573 0.613 0.546 0.616 0.567 0.548 0.944 0.580 0.688 0.753 0.657 0.756
(37%) (47%) (45%) (52%) (57%) (63%) (59%) (69%) (63%) (69%) (73%) (69%) (69%)
24
19901993
19961999
20022005
20082011
2014 1990
19931996
19992002
20052008
20112014
19901993
19961999
20022005
20082011
2014 1990
19931996
19992002
20052008
20112014
19901993
19961999
20022005
20082011
2014
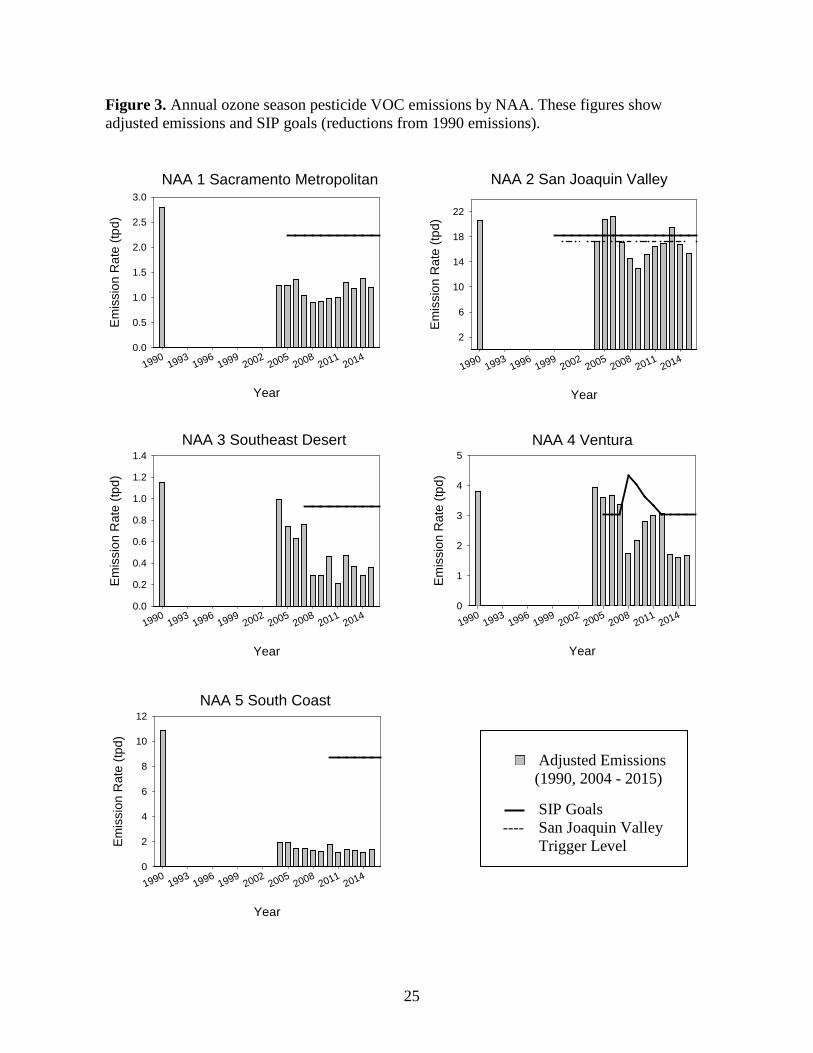
Figure 3. Annual ozone season pesticide VOC emissions by NAA. These figures show adjusted emissions and SIP goals (reductions from 1990 emissions).
NAA 1 Sacramento Metropolitan NAA 2 San Joaquin Valley 3.0
22
0.0
Em
issi
on R
ate
(tpd)
E
mis
sion
Rat
e (tp
d)
Em
issi
on R
ate
(tpd)
2.5
Em
issi
on R
ate
(tpd)
E
mis
sion
Rat
e (tp
d)
18 2.0
14 1.5
10 1.0
6 0.5
2
Year Year
NAA 3 Southeast Desert NAA 4 Ventura 51.4
00.0
1.2 4
1.0
30.8
0.6 2
0.4 1
0.2
Year
NAA 5 South Coast 12
10
8
6
4
2
0
Year
Adjusted Emissions (1990, 2004 - 2015)
SIP Goals ---- San Joaquin Valley
Trigger Level
Year
25
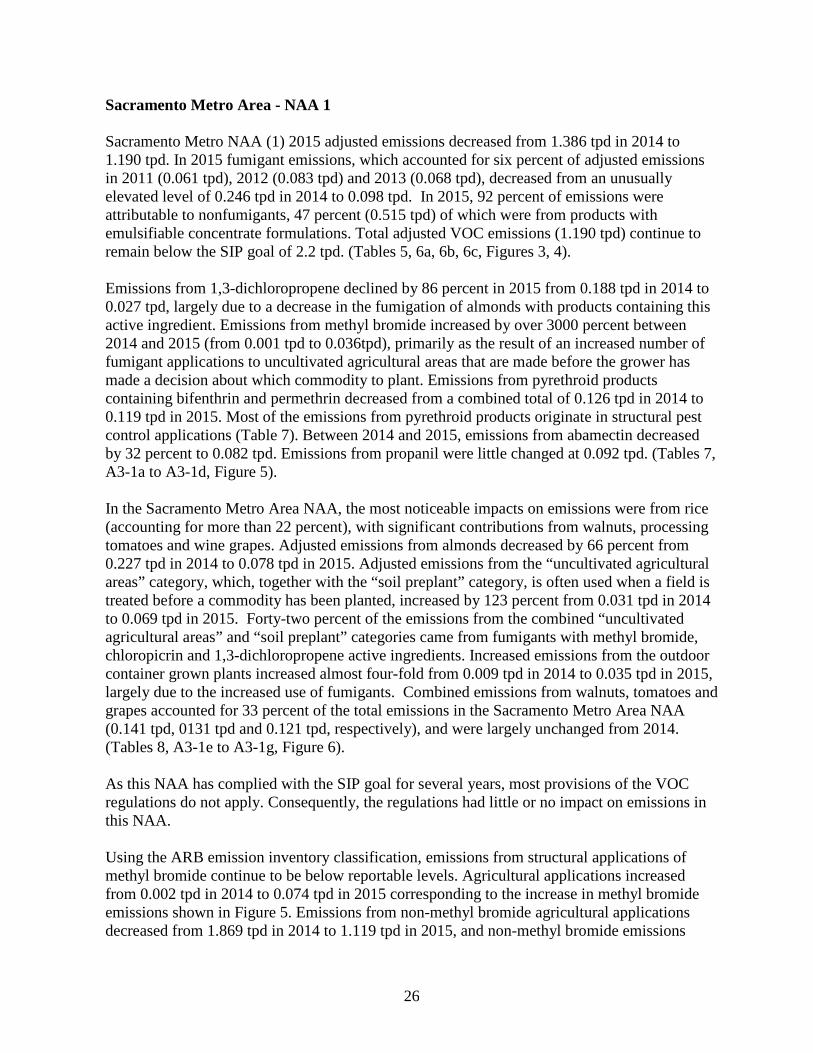
Sacramento Metro Area - NAA 1
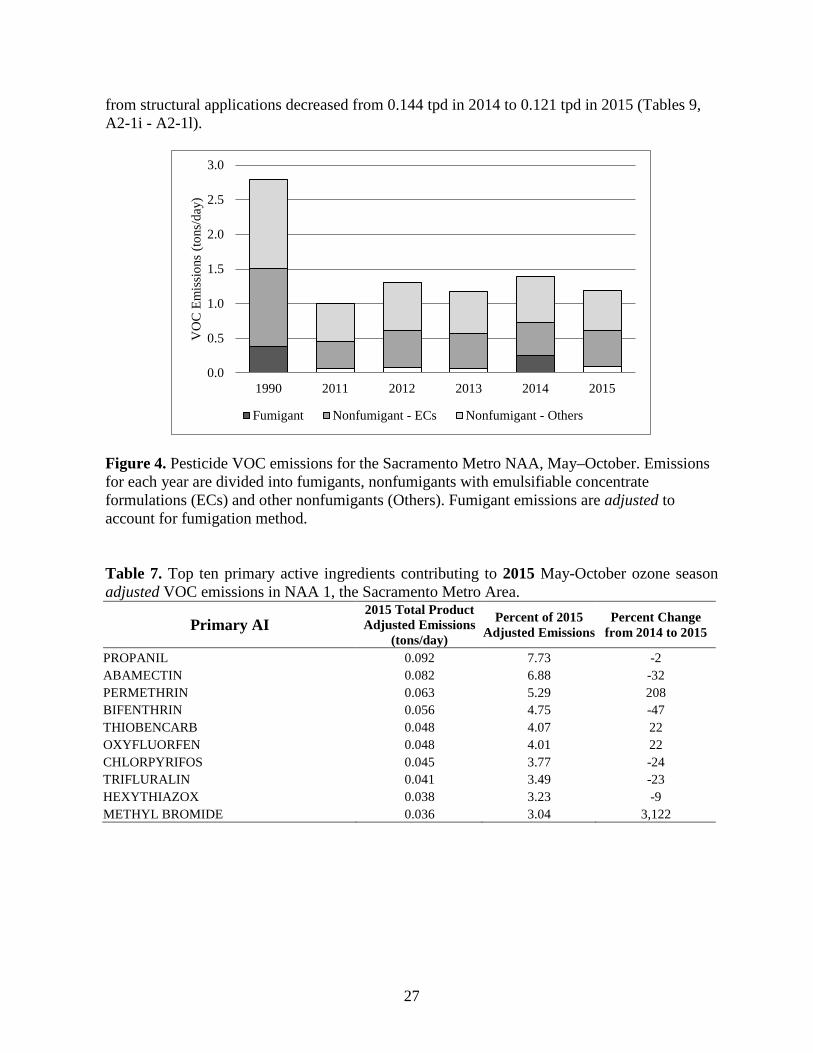
Sacramento Metro NAA (1) 2015 adjusted emissions decreased from 1.386 tpd in 2014 to 1.190 tpd. In 2015 fumigant emissions, which accounted for six percent of adjusted emissions in 2011 (0.061 tpd), 2012 (0.083 tpd) and 2013 (0.068 tpd), decreased from an unusually elevated level of 0.246 tpd in 2014 to 0.098 tpd. In 2015, 92 percent of emissions were attributable to nonfumigants, 47 percent (0.515 tpd) of which were from products with emulsifiable concentrate formulations. Total adjusted VOC emissions (1.190 tpd) continue to remain below the SIP goal of 2.2 tpd. (Tables 5, 6a, 6b, 6c, Figures 3, 4).
Emissions from 1,3-dichloropropene declined by 86 percent in 2015 from 0.188 tpd in 2014 to 0.027 tpd, largely due to a decrease in the fumigation of almonds with products containing this active ingredient. Emissions from methyl bromide increased by over 3000 percent between 2014 and 2015 (from 0.001 tpd to 0.036tpd), primarily as the result of an increased number of fumigant applications to uncultivated agricultural areas that are made before the grower has made a decision about which commodity to plant. Emissions from pyrethroid products containing bifenthrin and permethrin decreased from a combined total of 0.126 tpd in 2014 to 0.119 tpd in 2015. Most of the emissions from pyrethroid products originate in structural pest control applications (Table 7). Between 2014 and 2015, emissions from abamectin decreased by 32 percent to 0.082 tpd. Emissions from propanil were little changed at 0.092 tpd. (Tables 7, A3-1a to A3-1d, Figure 5).
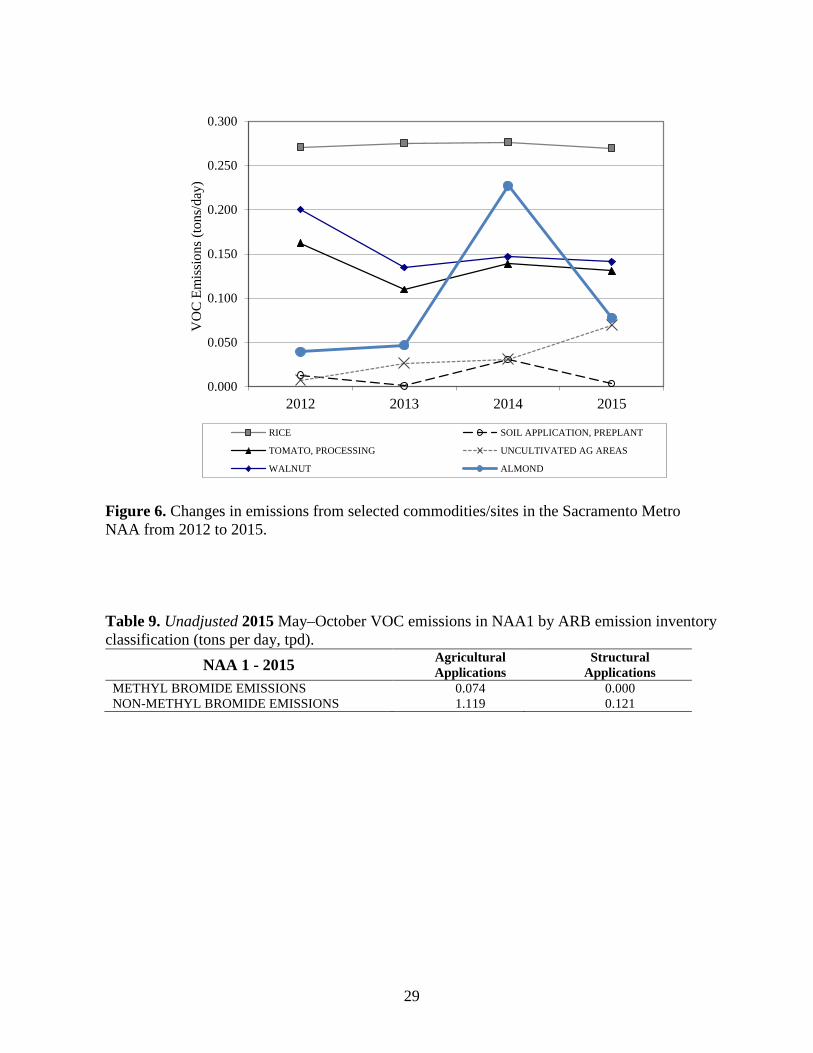
In the Sacramento Metro Area NAA, the most noticeable impacts on emissions were from rice (accounting for more than 22 percent), with significant contributions from walnuts, processing tomatoes and wine grapes. Adjusted emissions from almonds decreased by 66 percent from 0.227 tpd in 2014 to 0.078 tpd in 2015. Adjusted emissions from the “uncultivated agricultural areas” category, which, together with the “soil preplant” category, is often used when a field is treated before a commodity has been planted, increased by 123 percent from 0.031 tpd in 2014 to 0.069 tpd in 2015. Forty-two percent of the emissions from the combined “uncultivated agricultural areas” and “soil preplant” categories came from fumigants with methyl bromide, chloropicrin and 1,3-dichloropropene active ingredients. Increased emissions from the outdoor container grown plants increased almost four-fold from 0.009 tpd in 2014 to 0.035 tpd in 2015, largely due to the increased use of fumigants. Combined emissions from walnuts, tomatoes and grapes accounted for 33 percent of the total emissions in the Sacramento Metro Area NAA (0.141 tpd, 0131 tpd and 0.121 tpd, respectively), and were largely unchanged from 2014. (Tables 8, A3-1e to A3-1g, Figure 6).
As this NAA has complied with the SIP goal for several years, most provisions of the VOC regulations do not apply. Consequently, the regulations had little or no impact on emissions in this NAA.
Using the ARB emission inventory classification, emissions from structural applications of methyl bromide continue to be below reportable levels. Agricultural applications increased from 0.002 tpd in 2014 to 0.074 tpd in 2015 corresponding to the increase in methyl bromide emissions shown in Figure 5. Emissions from non-methyl bromide agricultural applications decreased from 1.869 tpd in 2014 to 1.119 tpd in 2015, and non-methyl bromide emissions
26
from structural applications decreased from 0.144 tpd in 2014 to 0.121 tpd in 2015 (Tables 9, A2-1i - A2-1l).
VO
C E
mis
sion
s (to
ns/d
ay) 2.5
3.0
2013 2014 2015
Nonfumigant - Others
1990 2011 2012
2.0
1.5
1.0
0.5
0.0
Fumigant Nonfumigant - ECs
Figure 4. Pesticide VOC emissions for the Sacramento Metro NAA, May–October. Emissions for each year are divided into fumigants, nonfumigants with emulsifiable concentrate formulations (ECs) and other nonfumigants (Others). Fumigant emissions are adjusted to account for fumigation method.
Table 7. Top ten primary active ingredients contributing to 2015 May-October ozone season adjusted VOC emissions in NAA 1, the Sacramento Metro Area.
Primary AI 2015 Total Product Adjusted Emissions
(tons/day)
Percent of 2015 Adjusted Emissions
Percent Change from 2014 to 2015
PROPANIL 0.092 7.73 -2 ABAMECTIN 0.082 6.88 -32 PERMETHRIN 0.063 5.29 208 BIFENTHRIN 0.056 4.75 -47 THIOBENCARB 0.048 4.07 22 OXYFLUORFEN 0.048 4.01 22 CHLORPYRIFOS 0.045 3.77 -24 TRIFLURALIN 0.041 3.49 -23 HEXYTHIAZOX 0.038 3.23 -9 METHYL BROMIDE 0.036 3.04 3,122
27

0.200
0.150 V
OC
Em
issi
ons
(tons
/day
)
0.100
0.050
0.000 2014 20152012 2013
PERMETHRIN 1,3-DICHLOROPROPENE METHYL BROMIDE BIFENTHRIN ABAMECTIN PROPANIL
Figure 5. Changes in adjusted emissions of selected AIs in the Sacramento Metro NAA from 2012 to 2015.
Table 8. Top ten pesticide application sites contributing to 2015 May-October ozone season adjusted VOC emissions in NAA 1.
Application Site 2015 Total Product Adjusted Emissions
(tons/day)
Percent of 2015 Adjusted Emissions
Percent Change from 2014 to 2015
RICE 0.270 22.67 -2 WALNUT 0.141 11.87 -4 TOMATOES, FOR PROCESSING 0.131 10.99 -6 GRAPES, WINE 0.121 10.21 -7 STRUCTURAL PEST CONTROL 0.121 10.15 -16 ALMOND 0.078 6.54 -66 UNCULTIVATED AGRICULTURAL AREAS* 0.069 5.81 123 RIGHTS OF WAY 0.038 3.23 -1 N-OUTDR CONTAINER/FLD GRWN PLANTS 0.035 2.92 273 LANDSCAPE MAINTENANCE 0.033 2.77 -27
* Treatment of an area prior to determining which crop will be planted.
28
VO
C E
mis
sion
s (to
ns/d
ay)
0.300
0.250
0.200
0.150
0.100
0.050
0.000 2012 2013 2014 2015
RICE SOIL APPLICATION, PREPLANT
TOMATO, PROCESSING UNCULTIVATED AG AREAS
WALNUT ALMOND
Figure 6. Changes in emissions from selected commodities/sites in the Sacramento Metro NAA from 2012 to 2015.
Table 9. Unadjusted 2015 May–October VOC emissions in NAA1 by ARB emission inventory classification (tons per day, tpd).
NAA 1 - 2015 Agricultural Applications
Structural Applications
METHYL BROMIDE EMISSIONS 0.074 0.000 NON-METHYL BROMIDE EMISSIONS 1.119 0.121
29
San Joaquin Valley - NAA 2
In the San Joaquin Valley NAA, total VOC emissions decreased from 16.811 tpd in 2014 to 15.301 tpd in 2015, and remain below the 18.1 tpd SIP goal and the trigger of 17.2 tpd (95% of SIP goal). Nonfumigant emissions (10.524 tpd) accounted for sixty-nine percent of the total VOC emissions in the San Joaquin Valley in 2015, the lowest percentage since 2007. Emissions from products with emulsifiable concentrate formulations accounted for 57 percent of the nonfumigant VOC emissions and 39 percent of the total VOC emissions for this NAA (Table 6c). VOC emissions from emulsifiable concentrates decreased by 19 percent from 7.308 tpd in 2014 to 5.975 tpd in 2015. Conversely, fumigant emissions increased by 18 percent from 4.026 tpd in 2014 to 4.777 tpd in 2015. (Tables 6a, 6b, Figure 3, 7).
Table 10 shows that VOC emissions from products containing 8 of the top 10 active ingredients decreased between 2014 and 2015. Adjusted emissions from 1,3-dichloropropene increased from 1.783 tpd in 2014 to 2.270 tpd in 2015, the highest level since 2005. Over the same period, adjusted emissions from chloropicrin more than doubled from 0.216 tpd in 2014 to 0.517 tpd in 2015. The emissions-to-use ratio for fumigants increased from 0.295 tons/ton to 0.300 tons/ton in 2015, continuing a steady increase over the previous seven years from 0.267 tons/ton in 2008 (Table 6b). This ratio compares favorably to the years between 2004 and 2007, indicating that the use of low-emission fumigation methods required by the 2008 regulations is now well established in this NAA.
In 2015, emissions from nonfumigant products with active ingredients hexythiazox and fenpyroximate decreased from levels observed in 2014 (0.911 tpd to 0.859 tpd, and 0.879 tpd to 0.798 tpd, respectively) but continue to be major contributors to the total adjusted VOC emissions for this NAA (Tables 10, Figure 8). Emissions from products containing chlorpyrifos, abamectin, gibberellins and oxyfluorfen all decreased by between 47 and 74 percent, corresponding to the prohibition of certain uses of high-VOC products containing these active ingredients that went in to effect in 2015 (Tables 10 and 24, Figure 8). The impact of the prohibitions is discussed in a later section on page 47.
VOC emissions from pesticide products applied to the top ten crops/sites are shown in Table 11. The increase in VOC emissions from pesticides applied to preplant soil application sites, and walnut and pistachio orchards were primarily from fumigant applications. Emissions for all other top ten crops/sites decreased in 2015, corresponding to reductions in nonfumigant applications and the use of low-VOC non-fumigant products. Emissions from almonds dropped from 4.812 tpd in 2014 to 4.295 tpd in 2015, but continue to account for more than one quarter of total emissions from this NAA (Table 11, Figure 9).
Using the ARB emission inventory classification, emissions from structural applications of methyl bromide were below a calculable level in 2015. Agricultural applications of methyl bromide decreased from 1.278 tpd in 2014 to 1.130 tpd in 2015. Non-methyl bromide emissions from agricultural applications increased from 24.744 tpd in 2014 to 24.946 tpd in 2015, and structural applications increased from 0.216 tpd in 2014 to 0.227 tpd in 2015. (Tables 12, A2-2i to A2-2l).
30

25.0
20.0
15.0
10.0
5.0
0.0
Fumigant Nonfumigant - ECs Nonfumigant - Others
Figure 7. Pesticide VOC emissions for the San Joaquin Valley NAA, May–October. Emissions for each year are divided into fumigants, nonfumigants with emulsifiable concentrate formulations (ECs) and other nonfumigants (Others). Fumigant emissions are adjusted to account for fumigation method.
Table 10. Top ten primary active ingredients contributing to 2015 May-October ozone season adjusted VOC emissions in NAA 2, the San Joaquin Valley.
VO
C E
mis
sion
s (to
ns/d
ay)
1990 2011 2012 2013 2014 2015
Primary AI 2015 Total Product Adjusted Emissions
(tons/day)
Percent of 2015 Adjusted Emissions
Percent Change from 2014 to 2015
1,3-DICHLOROPROPENE 2.270 15.09 27 HEXYTHIAZOX 0.859 5.71 -6 FENPYROXIMATE 0.798 5.31 -9 POTASSIUM N-METHYLDITHIOCARBAMATE 0.790 5.25 -5 ABAMECTIN 0.739 4.91 -51 CHLORPYRIFOS 0.715 4.75 -49 METHYL BROMIDE 0.608 4.04 -17 BIFENTHRIN 0.602 4.00 -4 GLYPHOSATE, ISOPROPYLAMINE SALT 0.527 3.50 -35 CHLOROPICRIN 0.517 3.44 140
31

VO
C E
mis
sion
s (to
ns/d
ay)
2.500
2.000
1.500
1.000
0.500
0.000 2012 2013 2014 2015
1,3-DICHLOROPROPENE FENPYROXIMATE
CHLORPYRIFOS ABAMECTIN
CHLOROPICRIN GLYPHOSATE, ISOPROPYLAMINE SALT
Figure 8. Changes in adjusted emissions of selected AIs in the San Joaquin Valley NAA from 2012 to 2015.
Table 11. Top ten pesticide application sites contributing to 2015 May-October ozone season adjusted VOC emissions in NAA 2.
Application Site 2015 Total Product Adjusted Emissions
(tons/day)
Percent of 2015 Adjusted Emissions
Percent Change from 2014 to 2015
ALMOND 4.295 28.07 -11 SOIL APPLICATION, PREPLANT* 1.479 9.66 22 COTTON 1.027 6.71 -19 CARROTS 0.729 4.77 -9 WALNUT 0.672 4.39 4 PISTACHIO 0.652 4.26 7 GRAPES 0.616 4.02 -21 ORANGE 0.602 3.93 -34 TOMATOES, FOR PROCESSING/CANNING 0.578 3.78 -12 GRAPES, WINE 0.496 3.24 -15 * Treatment of an area prior to determining which crop will be planted.
32

VO
C E
mis
sion
s (to
ns/d
ay)
6.000
5.000
4.000
3.000
2.000
1.000
0.000 2012 2013 2014 2015
ALMOND SOIL APPLICATION GRAPES WALNUT PISTACHIO
Figure 9. Changes in emissions from selected commodities/sites in the San Joaquin Valley NAA from 2012 to 2015.
Table 12. Unadjusted 2015 May–October VOC emissions in NAA 2 by ARB emission inventory classification (tons per day, tpd).
NAA 2 - 2015 Agricultural Applications
Structural Applications
METHYL BROMIDE EMISSIONS 1.130 0.000 NON-METHYL BROMIDE EMISSIONS 24.946 0.227
33
Southeast Desert - NAA 3
Total adjusted emissions for the Southeast Desert increased from 0.288 tpd in 2014 to 0.358 tpd in 2015. The 2015 emission rate is well below the SIP goal of 0.92 tpd (Tables 6a, 6b, Figures 3, 10).
Fumigants accounted for 27 percent of the emissions in this NAA in 2015, increasing by almost 13 percent to 0.095 tpd. Emissions from 1,3-dichloropropene, metam-sodium and dazomet, all increased in 2015, while emissions from methyl bromide and chloropicrin declined. There was no reported use of potassium n-methyldithiocarbamate for the third straight year (Tables 13, A3-3a to A3-3d, Figure 11). The increase in emissions from 1,3-dichloropropene corresponded to an increase in use on grapes. There was also a significant rise in the reported use of dazomet on rights of way. Less than half of the emissions from nonfumigants came from products with emulsifiable concentrate formulations (0.117 tpd) (Table 6c). Emissions from acetic acid (0.020 tpd) and caprylic acid (0.007tpd), both observed for the first time in 2015, made significant contributions to the adjusted emissions total of NAA 3. The use of Vinagreen, an acetic acid (vinegar) based weed control product, on outdoor container/field gown plants accounted for almost 100 percent of the emissions from this active ingredient. Emissions from caprylic acid came from an emulsifiable product used to control weeds around dates, mangoes, peaches and peppers.
Adjusted emissions from eight of the top ten crops increased from between 4 and over 1,000 percent in 2015. Emissions from grapes increased from 0.003 tpd in 2014 to 0.043 tpd in 2015 largely due to the use of 1,3-dicholoropropene. Emissions from lemons increased from 0.005 tpd in 2014 to 0.021 tpd in 2015 primarily due to the increased use of glyphosate, isopropylamine salt and chlorpyrifos. More than 93 percent of emissions derived from outdoor container/field grown plants came from the use of the acetic acid product Vinagreen, and 77 percent of emissions on rights of way originated from fumigant applications. In 2015, unadjusted emissions from grapes, peppers and strawberries totaled 0.300 tpd, however adjusted emissions in 2015 were 0.081 tpd because of the continued use of low emission fumigation methods1408 (metam-sodium ER 9%) and 1259 (chloropicrin ER 7 %, 1,3dichloropropene ER 29%) (Tables 14, A3- 3e to A3-3g, Figure 12).
Using the ARB emission inventory classification, emissions from structural applications of methyl bromide continue to be below a calculable level, as they have since 2005. Agricultural applications of methyl bromide decreased from 0.076 tpd in 2014 to 0.001 tpd in 2015. Non-methyl bromide emissions from agricultural applications increased by almost 40 percent from 0.366 tpd in 2014 to 0.514 tpd in 2015. Structural non-methyl bromide emissions increased by 0.022 tpd from 0.068 tpd in 2014 to 0.090 tpd in 2014. (Tables 15, A2-3i to A2-3l).
34

1.4
1.2
1.0
0.8
0.6
0.4
0.2
0.0
Fumigant Nonfumigant - ECs Nonfumigant - Others
Figure 10. Pesticide VOC emissions for the Southeast Desert NAA, May–October. Emissions for each year are divided into fumigants, nonfumigants with emulsifiable concentrate formulations (ECs) and other nonfumigants (Others). Fumigant emissions are adjusted to account for fumigation method.
Table 13. Top ten primary active ingredients contributing to 2015 May-October ozone season adjusted VOC emissions in NAA3, the Southeast Desert
VO
C E
mis
sion
s (to
ns/d
ay)
1990 2011 2012 2013 2014 2015
Primary AI 2015 Total Product Adjusted Emissions
(tons/day)
Percent of 2015 Adjusted Emissions
Percent Change from 2014 to 2015
1,3-DICHLOROPROPENE 0.043 12.12 261 CYPERMETHRIN 0.025 7.17 75 METAM-SODIUM 0.023 6.62 37 BENSULIDE 0.023 6.50 31 GLYPHOSATE, ISOPROPYLAMINE SALT 0.021 6.13 39 ACETIC ACID 0.020 5.83 -* BIFENTHRIN 0.020 5.76 43 DAZOMET 0.019 5.37 312 MEFENOXAM 0.010 2.91 19 CAPRYLIC ACID 0.007 2.04 -* *No reported use in previous year
35

0.160
0.120
0.080
0.040
0.000 2012 2013 2014 2015
1,3-DICHLOROPROPENE METAM-SODIUM METHYL BROMIDE
DAZOMET MEFENOXAM CHLOROPICRIN
VO
C E
mis
sion
s (to
ns/d
ay)
Figure 11. Changes in adjusted emissions of selected AIs in the Southeast Desert NAA from 2012 to 2015.
Table 14. Top ten pesticide application sites contributing to 2015 May-October ozone season adjusted VOC emissions in NAA 3.
Application Site 2015 Total Product Adjusted Emissions
(tons/day)
Percent of 2015 Adjusted Emissions
Percent Change from 2014 to 2015
STRUCTURAL PEST CONTROL 0.090 25.04 33 GRAPES 0.043 11.93 1,239 RIGHTS OF WAY 0.032 8.86 114 PEPPERS 0.023 6.48 4 LANDSCAPE MAINTENANCE 0.023 6.35 7 N-OUTDR CONTAINER/FLD GRWN PLANTS 0.022 6.09 592 LEMON 0.021 5.89 335 STRAWBERRY 0.015 4.06 -42 CARROTS 0.014 4.00 -27 LETTUCE 0.014 3.80 13
36

VO
C E
mis
sion
s (to
ns/d
ay)
0.200
0.150
0.100
0.050
0.000 2012 2013 2014 2015
STRUCTURAL PEST CONTROL GRAPES N-OUTDR CONTAINER STRAWBERRY UNCULTIVATED AG LEMON
Figure 12. Changes in emissions from selected commodities/sites in the Southeast Desert NAA from 2012 to 2015.
Table 15. Unadjusted 2015 May–October VOC emissions in NAA 3 by ARB emission inventory classification (tons per day, tpd). NAA 3 - 2015 Agricultural
Applications Structural
Applications METHYL BROMIDE EMISSIONS 0.001 0.000 NON-METHYL BROMIDE EMISSIONS 0.514 0.090
37

Ventura - NAA 4
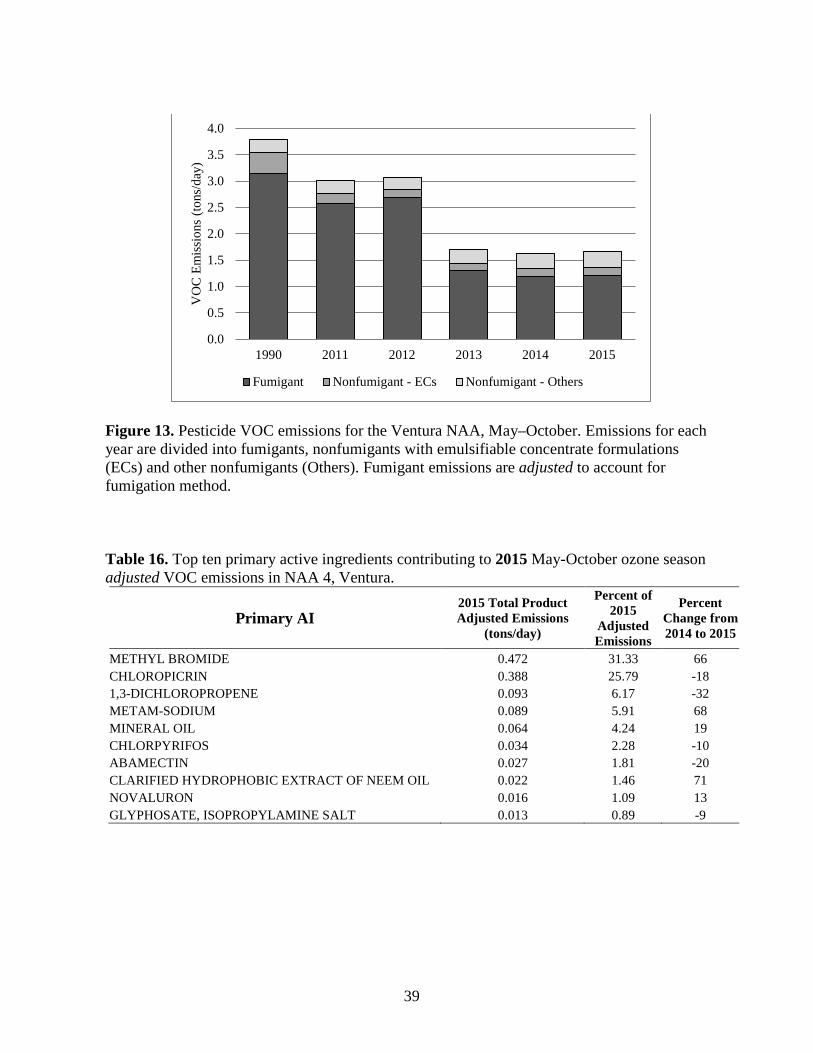
Ozone season adjusted emissions in the Ventura NAA (NAA 4) increased by 0.042 tpd (3 percent) from 1.623 tpd in 2014 to 1.665 tpd in 2015. VOC emissions were 1.335 tpd below the SIP goal for 2015 (3.0 tpd) (Tables 6a, 6b, Figures 3, 13). The amount of adjusted emissions can be directly attributed to the continued use of totally impermeable film (TIF) tarp methods, which became effective on May 1, 2013 (California Code of regulations, Title 3, section 6452) together with an overall reduction in pesticide use. DPR’s interim approval of TIF methods followed up U.S. EPA’s revisions of most fumigant product labels in December 2012 requiring buffer zones for most applications. These label changes required buffer zones for chloropicrin (as a sole active ingredient and when used in combination with methyl bromide or 1,3dichloropropene) statewide for the first time. The labels specify a 60% reduction in buffer distance when U.S. EPA-approved TIF tarps are used.
As in previous years, fumigants dominate the pesticide inventory for this NAA. In 2015 fumigants accounted for 73 percent of the emissions, down significantly from 88 percent in 2012 and, with the exception of 2008 (72%), the lowest percentage seen since adjusted emission calculations began in 2004. The most heavily used fumigants in NAA 4 in 2015 were methyl bromide and chloropicrin, which together accounted for 57 percent of emissions (Tables 16, A3-4a to A3-4d, Figure 14). A further 12 percent of emissions were attributable to the use of 1,3-dichloropropene and metam-sodium (0.93 tpd and 0.089 tpd, respectively). Of the 395 reported fumigations in 2015, 65 percent were made using TIF tarps, which have significantly lower emission ratings. Almost one hundred percent of all methyl bromide fumigations on strawberries used the fumigation method with the lowest emission rating of 48 percent (fumigation codes 1103 and 1143). Over ninety-three percent of all chloropicrin applications used TIF tarp fumigation methods with the lowest emission rating of 7 percent (fumigation codes 1143, 1242 and 1259).
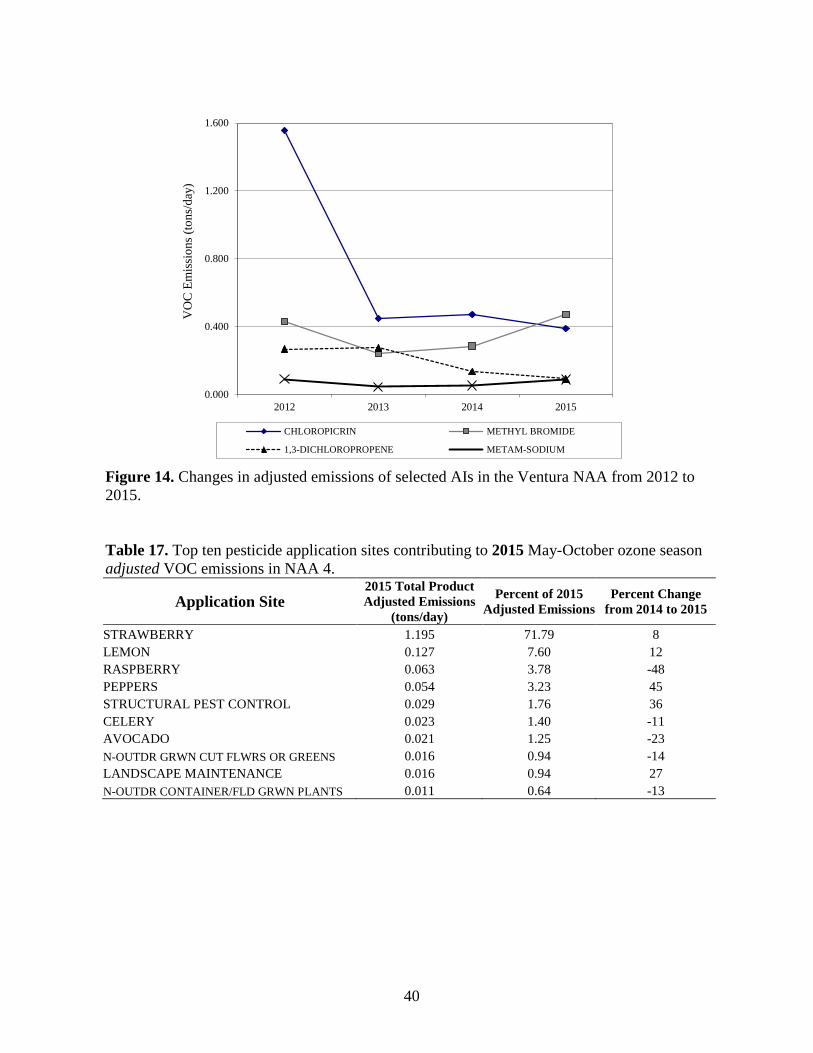
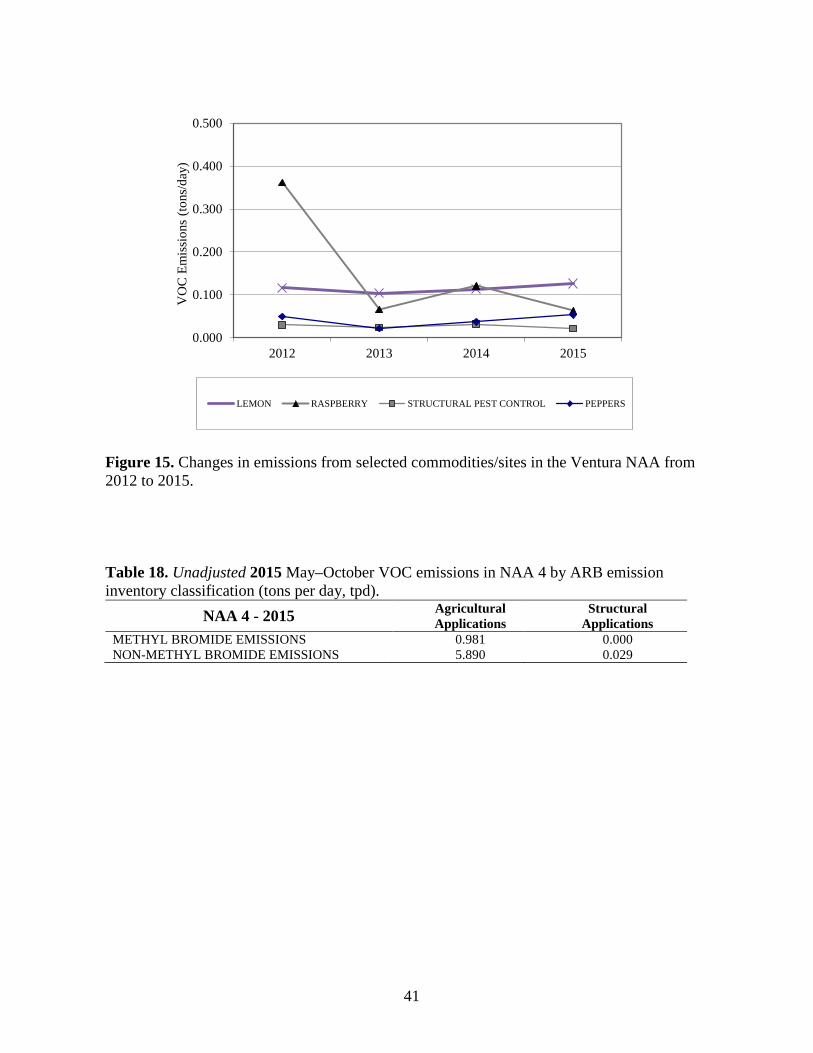
In 2015 adjusted emissions from methyl bromide increased from 0.284 tpd in 2014 to 0.472 tpd. Emissions from metam-sodium also increased from 0.053 tpd in 2014 to 0.089 tpd in 2015, while emissions from chloropicrin and 1,3-dichloropropene decreased by 18 and 32 percent respectively. In 2015 more than ninety percent emissions from fumigants came from applications to strawberries, and three percent from applications to raspberries. Other notable commodities/sites for emissions in 2015 include lemons, peppers, avocados and celery (Tables 17, A3-4e to A3-4g, Figure 15). In 2015 thirty-four percent (34%) of nonfumigant emissions, which account for 9 percent of this NAA’s total adjusted emissions, were from products with emulsifiable concentrate formulations (0.156 tpd), and was comparable to the ratios observed in 2014 and 2013 (Table 6c).
Using the ARB emission inventory classification, emissions from structural methyl bromide applications were below a calculable level in 2015. Emissions from agricultural applications of methyl bromide increased from 0.590 tpd in 2014 to 0.981 tpd in 2015. These findings are consistent with the trend found for the increased use of methyl bromide on strawberries and cut flowers. Non-methyl bromide emissions from agricultural applications decreased from 6.964 tpd in 2014 to 5.890 tpd in 2015. Structural non-methyl bromide emissions increased from 0.022 tpd in 2014 to 0.029 tpd in 2015 (Tables 18, A2-4i to A2-4l).
38
VO
C E
mis
sion
s (to
ns/d
ay)
2.0
1.5
1.0
0.5
0.0 2012 2013 2014 2015
Fumigant
4.0
3.5
3.0
2.5
1990 2011
Nonfumigant - ECs Nonfumigant - Others
Figure 13. Pesticide VOC emissions for the Ventura NAA, May–October. Emissions for each year are divided into fumigants, nonfumigants with emulsifiable concentrate formulations (ECs) and other nonfumigants (Others). Fumigant emissions are adjusted to account for fumigation method.
Table 16. Top ten primary active ingredients contributing to 2015 May-October ozone season adjusted VOC emissions in NAA 4, Ventura.
Primary AI 2015 Total Product Adjusted Emissions
(tons/day)
Percent of 2015
Adjusted Emissions
Percent Change from 2014 to 2015
METHYL BROMIDE 0.472 31.33 66 CHLOROPICRIN 0.388 25.79 -18 1,3-DICHLOROPROPENE 0.093 6.17 -32 METAM-SODIUM 0.089 5.91 68 MINERAL OIL 0.064 4.24 19 CHLORPYRIFOS 0.034 2.28 -10 ABAMECTIN 0.027 1.81 -20 CLARIFIED HYDROPHOBIC EXTRACT OF NEEM OIL 0.022 1.46 71 NOVALURON 0.016 1.09 13 GLYPHOSATE, ISOPROPYLAMINE SALT 0.013 0.89 -9
39
VO
C E
mis
sion
s (to
ns/d
ay)
1.600
1.200
0.800
0.400
0.000 2012 2013 2014 2015
CHLOROPICRIN METHYL BROMIDE
1,3-DICHLOROPROPENE METAM-SODIUM
Figure 14. Changes in adjusted emissions of selected AIs in the Ventura NAA from 2012 to 2015.
Table 17. Top ten pesticide application sites contributing to 2015 May-October ozone season adjusted VOC emissions in NAA 4.
Application Site 2015 Total Product Adjusted Emissions
(tons/day)
Percent of 2015 Adjusted Emissions
Percent Change from 2014 to 2015
STRAWBERRY 1.195 71.79 8 LEMON 0.127 7.60 12 RASPBERRY 0.063 3.78 -48 PEPPERS 0.054 3.23 45 STRUCTURAL PEST CONTROL 0.029 1.76 36 CELERY 0.023 1.40 -11 AVOCADO 0.021 1.25 -23 N-OUTDR GRWN CUT FLWRS OR GREENS 0.016 0.94 -14 LANDSCAPE MAINTENANCE 0.016 0.94 27 N-OUTDR CONTAINER/FLD GRWN PLANTS 0.011 0.64 -13
40
VO
C E
mis
sion
s (to
ns/d
ay)
0.500
0.400
0.300
0.200
0.100
0.000 2012 2013 2014 2015
LEMON RASPBERRY STRUCTURAL PEST CONTROL PEPPERS
Figure 15. Changes in emissions from selected commodities/sites in the Ventura NAA from 2012 to 2015.
Table 18. Unadjusted 2015 May–October VOC emissions in NAA 4 by ARB emission inventory classification (tons per day, tpd).
NAA 4 - 2015 Agricultural Applications
Structural Applications
METHYL BROMIDE EMISSIONS 0.981 0.000 NON-METHYL BROMIDE EMISSIONS 5.890 0.029
41

South Coast - NAA 5
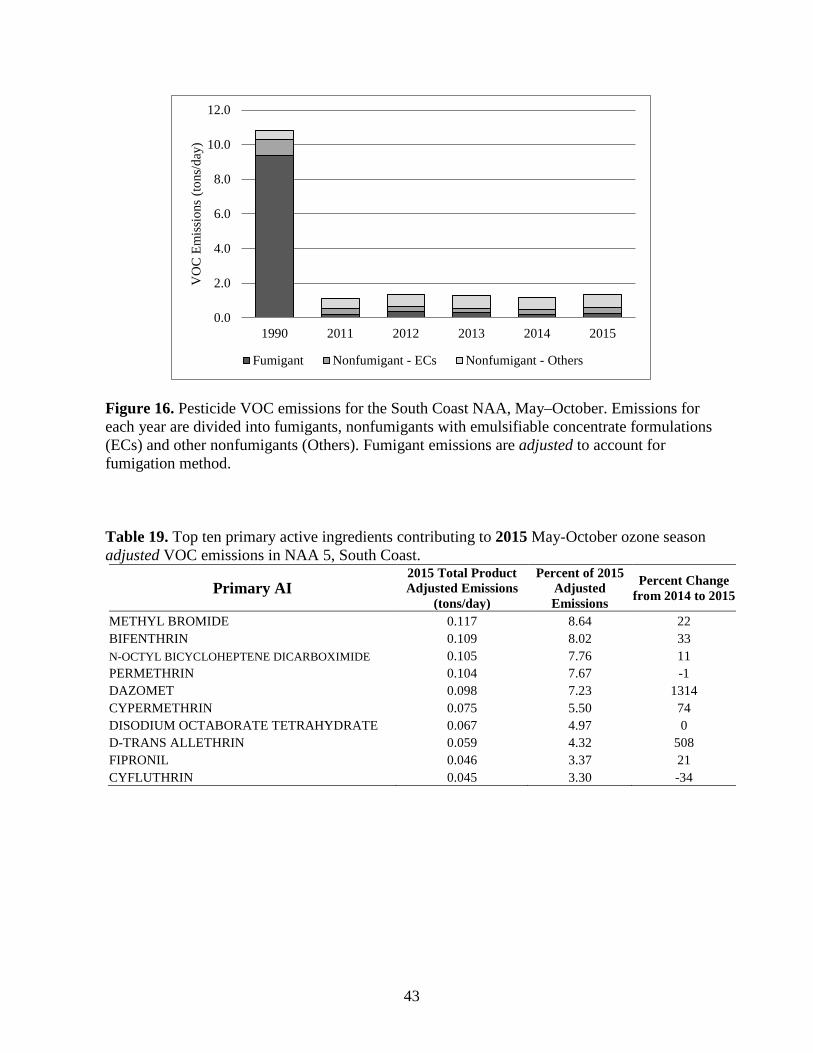
In the South Coast NAA, adjusted emissions increased from 1.166 tpd in 2014 to 1.357 tpd in 2015 which is eight-four percent below the SIP goal of 8.7 tpd. In 2015, emissions from nonfumigants accounted for 81 percent of the total for the South Coast NAA, increasing from 0.958 tpd in 2014 to 1.100 tpd. Emissions from nonfumigants with emulsifiable concentrate formulations accounted for 0.345 tpd, 25 percent of the nonattainment area’s total adjusted emissions (Tables 6a, 6b, 6c, Figure 3, 16).
The fumigants methyl bromide, dazomet and metam-sodium contributed more than 18 percent of 2015 total adjusted emissions, up from 2014. Emissions from dazomet increased from 0.007 tpd in 2014 to 0.098 tpd in 2015 due to increased usage on rights of way. Bifenthrin, N-octyl bicycloheptene dicarboximide and permethrin, all active ingredients used to control pests in structural and landscape environments, continue to be the largest nonfumigant contributors to the adjusted VOC inventory accounting for more than 23 percent of emissions, at 0.109 tpd, 0.105 tpd and 0.104 tpd, respectively. Emissions from d-trans allethrin, a synthetic insecticide structurally similar to pyrethrin, increased from 0.010 tpd in 2014 to 0.059 tpd in 2015 corresponding to an increased use in structural pest control (Tables 19, A3-5a to A3-5d, Figure 17).
Sixty percent of emissions in NAA 5 in 2014 came from fumigant and nonfumigant use in structural pest control (0.824 tpd), a 19 percent increase from 2014. A further 23 percent of total emissions came from landscape maintenance and rights-of-way treatments, 0.163 tpd and 0.150 tpd, respectively, a reflection of the predominantly urban environment in this NAA. Adjusted emissions from strawberries (0.050 tpd) were down significantly from 0.090 tpd in 2014, largely due to the reduction in use of chloropicrin and 1,3-dichloroporopene. Increased emissions from methyl bromide resulted from increased use on strawberries (Tables 20, A3-5e to A3-5g, Figure 18).
Since this NAA has complied with the SIP goal for several years, most provisions of the VOC regulations do not apply and have little or no impact on emissions in this NAA.
Using the ARB emission inventory classification, emissions of methyl bromide from structural applications continue to be below a calculable level in 2015. Agricultural applications increased from 0.103 tpd in 2014 to 0.159 tpd in 2015. Non-methyl bromide emissions from agricultural applications decreased from 0.448 tpd in 2014 to 0.430 tpd in 2015. Structural non-methyl bromide emissions increased from 0.693 tpd in 2014 to 0.825 tpd in 2015 (Tables 21, A2-5i to A2-5l).
42
12.0
10.0
8.0
6.0
4.0
2.0
0.0
Fumigant Nonfumigant - ECs Nonfumigant - Others
Figure 16. Pesticide VOC emissions for the South Coast NAA, May–October. Emissions for each year are divided into fumigants, nonfumigants with emulsifiable concentrate formulations (ECs) and other nonfumigants (Others). Fumigant emissions are adjusted to account for fumigation method.
Table 19. Top ten primary active ingredients contributing to 2015 May-October ozone season adjusted VOC emissions in NAA 5, South Coast.
VO
C E
mis
sion
s (to
ns/d
ay)
1990 2011 2012 2013 2014 2015
Primary AI 2015 Total Product Adjusted Emissions
(tons/day)
Percent of 2015 Adjusted Emissions
Percent Change from 2014 to 2015
METHYL BROMIDE 0.117 8.64 22 BIFENTHRIN 0.109 8.02 33 N-OCTYL BICYCLOHEPTENE DICARBOXIMIDE 0.105 7.76 11 PERMETHRIN 0.104 7.67 -1 DAZOMET 0.098 7.23 1314 CYPERMETHRIN 0.075 5.50 74 DISODIUM OCTABORATE TETRAHYDRATE 0.067 4.97 0 D-TRANS ALLETHRIN 0.059 4.32 508 FIPRONIL 0.046 3.37 21 CYFLUTHRIN 0.045 3.30 -34
43
0.200
VO
C E
mis
sion
s (to
ns/d
ay) 0.150
0.100
0.050
0.000 2012 2013 2014 2015
PERMETHRIN METHYL BROMIDE METAM-SODIUM
CYFLUTHRIN CHLOROPICRIN DAZOMET
Figure 17. Changes in adjusted emissions of selected AIs in the South Coast NAA from 2012 to 2015.
Table 20. Top ten pesticide application sites contributing to 2015 May-October ozone season adjusted VOC emissions in NAA 5.
Application Site 2015 Total Product Adjusted Emissions
(tons/day)
Percent of 2015 Adjusted Emissions
Percent Change from 2014 to 2015
STRUCTURAL PEST CONTROL 0.824 60.76 19 LANDSCAPE MAINTENANCE 0.163 12.02 3 RIGHTS OF WAY 0.150 11.07 191 FUMIGATION, OTHER 0.057 4.23 -5 STRAWBERRY 0.050 3.69 -45 COMMODITY FUMIGATION 0.019 1.42 28 N-OUTDR CONTAINER/FLD GRWN PLANTS 0.014 1.06 -24 AVOCADO 0.009 0.64 25 POTATO 0.007 0.54 38 PEPPERS 0.007 0.54 9
44

VO
C E
mis
sion
s (to
ns/d
ay)
1.000
0.800
0.600
0.400
0.200
0.000 2012 2013 2014 2015
STRUCTURAL PEST CONTROL STRAWBERRY
LANDSCAPE MAINTENANCE RIGHTS OF WAY
Figure 18. Changes in emissions from selected commodities/sites in the South Coast NAA from 2012 to 2015.
Table 21. Unadjusted 2015 May–October VOC emissions in NAA 5 by ARB emission inventory classification (tons per day, tpd).
NAA 5 - 2015 Agricultural Applications
Structural Applications
METHYL BROMIDE EMISSIONS 0.159 0.000 NON-METHYL BROMIDE EMISSIONS 0.430 0.825
45
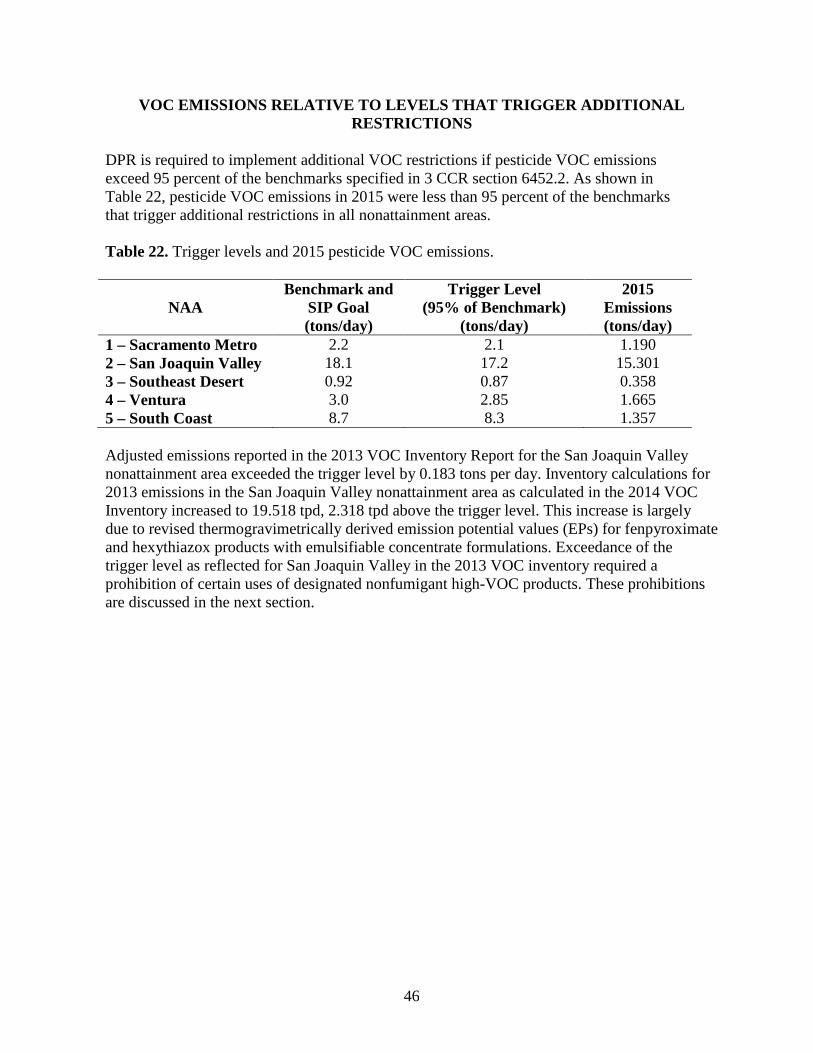
VOC EMISSIONS RELATIVE TO LEVELS THAT TRIGGER ADDITIONAL RESTRICTIONS
DPR is required to implement additional VOC restrictions if pesticide VOC emissions exceed 95 percent of the benchmarks specified in 3 CCR section 6452.2. As shown in Table 22, pesticide VOC emissions in 2015 were less than 95 percent of the benchmarks that trigger additional restrictions in all nonattainment areas.
Table 22. Trigger levels and 2015 pesticide VOC emissions.
Benchmark and Trigger Level 2015 NAA SIP Goal (95% of Benchmark) Emissions
(tons/day) (tons/day) (tons/day) 1 – Sacramento Metro 2.2 2.1 1.190 2 – San Joaquin Valley 18.1 17.2 15.301 3 – Southeast Desert 0.92 0.87 0.358 4 – Ventura 3.0 2.85 1.665 5 – South Coast 8.7 8.3 1.357
Adjusted emissions reported in the 2013 VOC Inventory Report for the San Joaquin Valley nonattainment area exceeded the trigger level by 0.183 tons per day. Inventory calculations for 2013 emissions in the San Joaquin Valley nonattainment area as calculated in the 2014 VOC Inventory increased to 19.518 tpd, 2.318 tpd above the trigger level. This increase is largely due to revised thermogravimetrically derived emission potential values (EPs) for fenpyroximate and hexythiazox products with emulsifiable concentrate formulations. Exceedance of the trigger level as reflected for San Joaquin Valley in the 2013 VOC inventory required a prohibition of certain uses of designated nonfumigant high-VOC products. These prohibitions are discussed in the next section.
46

NONFUMIGANT PRODUCTS DESIGNATED AS HIGH-VOC AND LOW-VOC AND RESTRICTIONS FOR THE SAN JOAQUIN VALLEY
Regulations to reduce VOC emissions from certain nonfumigant pesticide products establish criteria to designate certain agricultural products as high-VOC, and these products have restrictions on sales and prohibitions on use when emission limits are triggered. 3 CCR section 6880 establishes the following emission potential thresholds to designate agricultural products as high-VOC or low-VOC:
Table 23. Emission potential thresholds for agricultural products with abamectin, chlorpyrifos, giberellins or oxyfluorfen as the primary active ingredient.
Primary Active Ingredient Abamectin
Emission Potential (EP) Threshold (%) 35
Chlorpyrifos
Gibberellins
25
25
Oxyfluorfen 15
If a product contains more than one active ingredient, the primary active ingredient is the one present at the highest percentage in a product. These criteria do not apply to products that contain an active ingredient listed above, but not as the primary active ingredient, including products with one or more active ingredients present at the same percentage.
Products labeled only for non-agricultural uses are excluded from the proposed regulations. Non-agricultural uses include: a) home use; b) use in structural pest control; c) industrial or institutional use; d) control of an animal pest under the written prescription of a veterinarian; or e) vector control. All other uses are considered agricultural. DPR classifies products containing any of the four pesticides listed above into three groups:
High-VOC product: a) contains any of the four pesticides as a primary active ingredient; and b) labeled for agricultural use; and c) the EP is greater than the threshold.
Low-VOC product: a) contains any of the four pesticides as a primary active ingredient; and b) labeled for agricultural use; and c) the EP is equal to or less than the threshold.
Excluded product: a) contains any of the four pesticides, but not as a primary active ingredient; or b) labeled for only for non-agricultural use.
Appendix 4 lists the currently registered products designated as high-VOC, low-VOC, or excluded.
47
A key restriction (3 CCR section 6883) requires growers to obtain a recommendation from a pest control adviser for:
• High-VOC products containing abamectin, chlorpyrifos, gibberellins, or oxyfluorfen; and
• Applied in San Joaquin Valley; and • Applied between May 1 and October 31; and • Application to alfalfa, almonds, citrus, cotton, grapes, pistachios, or walnuts.
DPR’s 2013 pesticide VOC emissions inventory for the San Joaquin Valley NAA exceeded both the SIP goal and the VOC regulation benchmark. Therefore, in 2014, DPR enacted prohibitions of certain uses of designated high-VOC products during the periods May 1 through October 31 of 2015 and 2016, as required by 3CCR section 6452.2(f), with the following exceptions included in the regulations:
• Use of chlorpyrifos products to control aphids on cotton. • Use of gibberellins products when applied at an application rate of 16 grams of active
ingredient per acre or less. • Use of oxyfluorfen products when applied at an application rate of 0.125 (⅛) pounds of
active ingredient per acre or less. • Uses for which the U.S. Environmental Protection Agency has issued an emergency
exemption from registration under Section 18 of the Federal Insecticide, Fungicide, and Rodenticide Act.
• Uses registered as a Special Local Need under Section 24(c) of the Federal Insecticide, Fungicide, and Rodenticide Act.
• Applications made by or under the direction of the U.S. Department of Agriculture, the California Department of Food and Agriculture, or county agricultural commissioner to control, suppress or eradicate pests.
• Applications using precision spray technology meeting the criteria of the California Office of the Natural Resources Conservation Service’s Environmental Quality Incentives Program.
Prohibitions on the use of high-VOC products with abamectin, chlorpyrifos, gibberellins and oxyfluorfen active ingredients on alfalfa, almonds, citrus, cotton, grapes, pistachios and walnuts were in effect between May 1 and October 31, 2015. Table 24 shows the contributions of each of the four active ingredients to 2015 May-October ozone season adjusted VOC emissions, and tables 25 and 26 compare the emissions from high- and low-VOC products containing these four active ingredients in both 2014 and 2015.
48

Table 24. Abamectin, chlorpyrifos, gibberellins and oxyfluorfen contributions to 2015 May-October ozone season adjusted VOC emissions in NAA 2, the San Joaquin Valley.
Primary AI 2015 Total Product Adjusted Emissions
(tons/day)
Percent of 2015 Adjusted Emissions
Percent Change from 2014 to 2015
ABAMECTIN 0.739 4.91 -51 CHLORPYRIFOS 0.715 4.75 -49 OXYFLUORFEN 0.407 2.70 -47 GIBBERELLINS 0.137 0.91 -74
Table 25. Emissions from 2014 and 2015 applications of high- and low-VOC products for abamectin, chlorpyrifos, gibberellins and oxyfluorfen on all commodity sites.
Primary AI Total Emissions (tons/day)
Percent of Emissions from All Products with this Active Ingredient
Percent of Total Nonfumigant Emissions
2014 2015 2014 2015 2014 2015 ABAMECTIN
High VOC 1.252 0.186 83.8% 25.1% 9.8% 1.8% Low VOC 0.242 0.544 16.2% 74.9% 1.9% 5.3%
CHLORPYRIFOS High VOC 0.887 0.117 63.1% 16.4% 6.9% 1.1% Low VOC 0.517 0.598 36.9% 83.6% 4.0% 5.7%
GIBBERELLINS High VOC 0.516 0.069 96.0% 50.0% 4.0% 0.7% Low VOC 0.021 0.069 4.0% 50.0% 0.2% 0.7%
OXYFLUORFEN High VOC 0.739 0.359 96.7% 88.3% 5.8% 3.4% Low VOC 0.025 0.048 3.3% 11.7% 0.2% 0.5%
COMBINED High VOC 3.394 0.730 80.8% 36.6% 26.5% 6.9% Low VOC 0.806 1.268 19.2% 63.4% 6.3% 12.0%
49
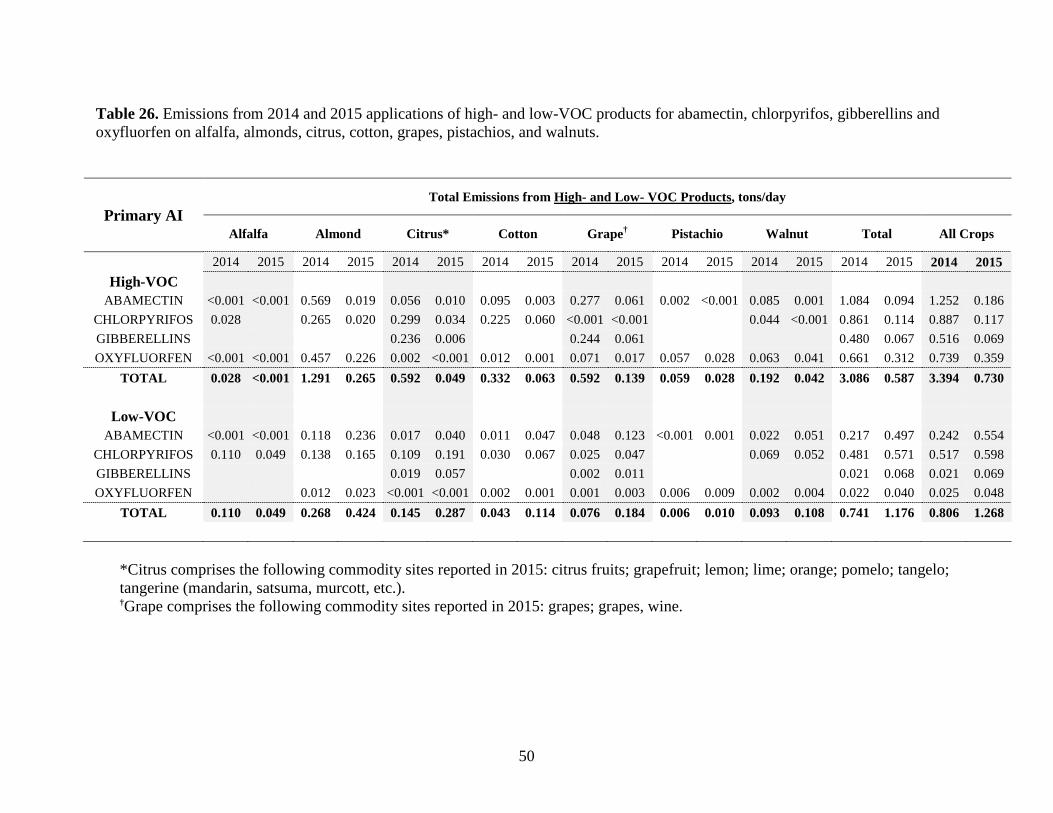
Table 26. Emissions from 2014 and 2015 applications of high- and low-VOC products for abamectin, chlorpyrifos, gibberellins and oxyfluorfen on alfalfa, almonds, citrus, cotton, grapes, pistachios, and walnuts.
Primary AI Alfalfa Almond
Total Emissions from High- and Low- VOC Products, tons/day
Citrus* Cotton Grape† Pistachio Walnut Total All Crops
High-VOC ABAMECTIN
CHLORPYRIFOS GIBBERELLINS OXYFLUORFEN
2014 2015
<0.001 <0.001 0.028
<0.001 <0.001
2014
0.569 0.265
0.457
2015
0.019 0.020
0.226
2014
0.056 0.299 0.236 0.002
2015
0.010 0.034 0.006
<0.001
2014
0.095 0.225
0.012
2015
0.003 0.060
0.001
2014 2015
0.277 0.061 <0.001 <0.001 0.244 0.061 0.071 0.017
2014
0.002
0.057
2015
<0.001
0.028
2014
0.085 0.044
0.063
2015
0.001 <0.001
0.041
2014
1.084 0.861 0.480 0.661
2015
0.094 0.114 0.067 0.312
2014
1.252 0.887 0.516 0.739
2015
0.186 0.117 0.069 0.359
TOTAL 0.028 <0.001 1.291 0.265 0.592 0.049 0.332 0.063 0.592 0.139 0.059 0.028 0.192 0.042 3.086 0.587 3.394 0.730
Low-VOC ABAMECTIN
CHLORPYRIFOS GIBBERELLINS OXYFLUORFEN
<0.001 <0.001 0.110 0.049
0.118 0.138
0.012
0.236 0.165
0.023
0.017 0.040 0.109 0.191 0.019 0.057
<0.001 <0.001
0.011 0.030
0.002
0.047 0.067
0.001
0.048 0.025 0.002 0.001
0.123 0.047 0.011 0.003
<0.001
0.006
0.001
0.009
0.022 0.069
0.002
0.051 0.052
0.004
0.217 0.481 0.021 0.022
0.497 0.571 0.068 0.040
0.242 0.517 0.021 0.025
0.554 0.598 0.069 0.048
TOTAL 0.110 0.049 0.268 0.424 0.145 0.287 0.043 0.114 0.076 0.184 0.006 0.010 0.093 0.108 0.741 1.176 0.806 1.268
*Citrus comprises the following commodity sites reported in 2015: citrus fruits; grapefruit; lemon; lime; orange; pomelo; tangelo; tangerine (mandarin, satsuma, murcott, etc.). †Grape comprises the following commodity sites reported in 2015: grapes; grapes, wine.
50
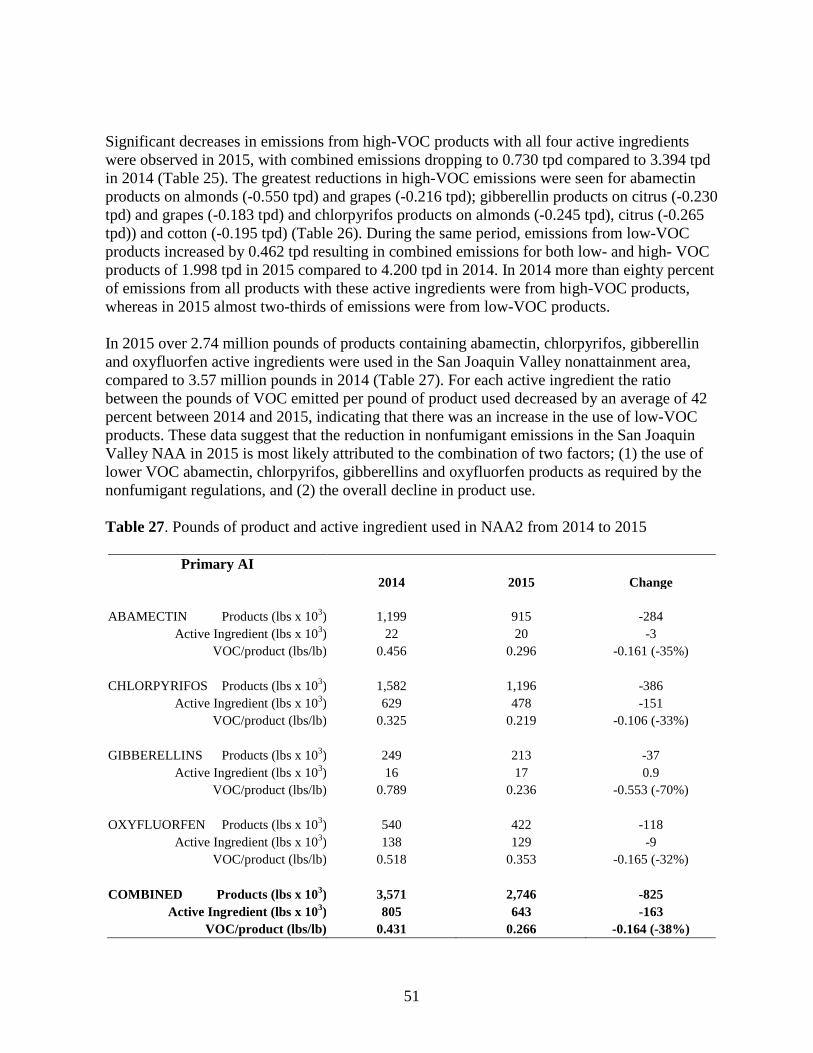
Significant decreases in emissions from high-VOC products with all four active ingredients were observed in 2015, with combined emissions dropping to 0.730 tpd compared to 3.394 tpd in 2014 (Table 25). The greatest reductions in high-VOC emissions were seen for abamectin products on almonds (-0.550 tpd) and grapes (-0.216 tpd); gibberellin products on citrus (-0.230 tpd) and grapes (-0.183 tpd) and chlorpyrifos products on almonds (-0.245 tpd), citrus (-0.265 tpd)) and cotton (-0.195 tpd) (Table 26). During the same period, emissions from low-VOC products increased by 0.462 tpd resulting in combined emissions for both low- and high- VOC products of 1.998 tpd in 2015 compared to 4.200 tpd in 2014. In 2014 more than eighty percent of emissions from all products with these active ingredients were from high-VOC products, whereas in 2015 almost two-thirds of emissions were from low-VOC products.
In 2015 over 2.74 million pounds of products containing abamectin, chlorpyrifos, gibberellin and oxyfluorfen active ingredients were used in the San Joaquin Valley nonattainment area, compared to 3.57 million pounds in 2014 (Table 27). For each active ingredient the ratio between the pounds of VOC emitted per pound of product used decreased by an average of 42 percent between 2014 and 2015, indicating that there was an increase in the use of low-VOC products. These data suggest that the reduction in nonfumigant emissions in the San Joaquin Valley NAA in 2015 is most likely attributed to the combination of two factors; (1) the use of lower VOC abamectin, chlorpyrifos, gibberellins and oxyfluorfen products as required by the nonfumigant regulations, and (2) the overall decline in product use.
Table 27. Pounds of product and active ingredient used in NAA2 from 2014 to 2015
Primary AI 2014 2015 Change
ABAMECTIN Products (lbs x 103) 1,199 915 -284 Active Ingredient (lbs x 103) 22 20 -3
VOC/product (lbs/lb) 0.456 0.296 -0.161 (-35%)
CHLORPYRIFOS Products (lbs x 103) 1,582 1,196 -386 Active Ingredient (lbs x 103) 629 478 -151
VOC/product (lbs/lb) 0.325 0.219 -0.106 (-33%)
GIBBERELLINS Products (lbs x 103) 249 213 -37 Active Ingredient (lbs x 103) 16 17 0.9
VOC/product (lbs/lb) 0.789 0.236 -0.553 (-70%)
OXYFLUORFEN Products (lbs x 103) 540 422 -118 Active Ingredient (lbs x 103) 138 129 -9
VOC/product (lbs/lb) 0.518 0.353 -0.165 (-32%)
COMBINED Products (lbs x 103) 3,571 2,746 -825 Active Ingredient (lbs x 103) 805 643 -163
VOC/product (lbs/lb) 0.431 0.266 -0.164 (-38%)
51

Despite the prohibitions there was significant reported use of high-VOC emission products between May 1 and October 31, 2015 (Tables 25 and 26). Estimates of emissions attributable to the use of high-VOC products for the exceptions listed above were determined to be below 0.006 tpd for chlorpyrifos and less than 0.001 tpd for both gibberellins and oxyflourofen. These exceptions cannot, therefore, account for the combined emissions of 0.587 tpd from high-VOC chlorpyrifos, gibberellin and oxyflourofen products reported in Table 26.
If prohibitions for high-VOC nonfumigant products are in effect those prohibitions must remain in effect until the hypothetical VOC emissions shown in the Annual VOC Emissions Inventory Report comply with the limit specified in 3CCR section 6452.2(f) for at least two consecutive years. The hypothetical VOC emissions during a year of prohibitions shall be calculated for each active ingredient used on each crop specified in 3CCR section 6884. The hypothetical emissions shall be calculated by assuming the relative mixture of high and low-VOC products used in the current year of prohibitions would have been the same as in the most recent year without prohibitions. The VOC emissions are then calculated using that product mixture for the amount of active ingredient used in the current year.
The following formula is used to calculate the hypothetical VOC emissions described above for each pesticide-crop combination:
Emissions for the pesticide-crop Pounds active ingredient for Hypothetical emissions combination during May-Oct for the the crop during May-Oct for
for a pesticide-crop most current year without prohibitions the year of prohibitions combination listed in (Table 28 column A) X (Table 28 column B)section 6884 during =
May-Oct for the year of Pounds active ingredient for the crop during May-Oct for the most current prohibitions year without prohibitions (Table 28 column D) (Table 28 column C)
Table 28 details the hypothetical emissions for 2015 calculated using the formula above. The total hypothetical emissions for the pesticides and crops listed in section 6880 for 2015 are 3.331 tpd, 1.568 tpd more than the actual inventory emissions. Total hypothetical VOC emissions equal the sum of the hypothetical emissions for each pesticide-crop combination, plus the actual VOC emissions for the remaining pesticides and crops not listed in section 6880:
Total hypothetical VOC emissions = 3.331 + 13.538 = 16.869 tpd
and therefore less than the VOC regulation benchmark of 17.2 tpd.
The high-VOC prohibitions were not in effect during 2014, so the actual and hypothetical pesticide VOC emissions are the same for that year, 16.811 tpd. As specified in 3CCR section 6452.2(f), the hypothetical emissions must be less than the trigger level for at least two consecutive years before DPR can lift the high-VOC prohibitions. The hypothetical emissions for 2016 must also be less than the trigger level. DPR will make a preliminary estimate of 2016 VOC emissions in Fall 2017, and may lift the VOC prohibitions for 2018. The high-VOC prohibitions will remain in effect for May-October 2017.
52
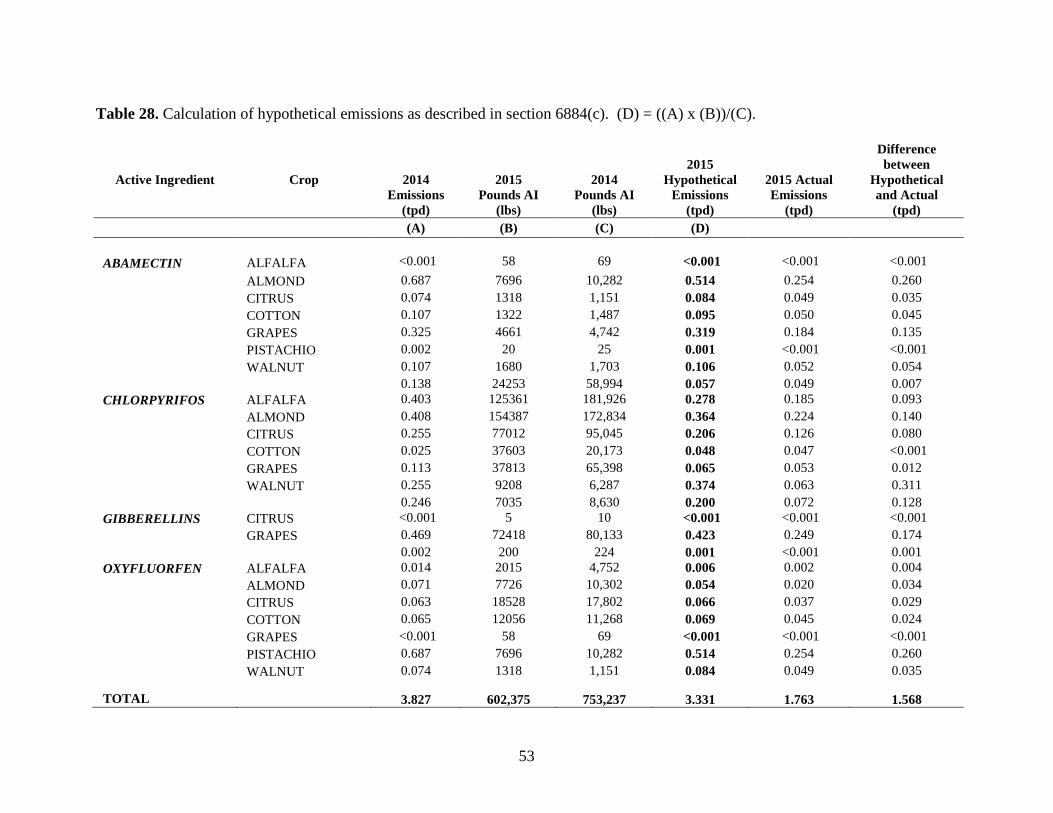
Table 28. Calculation of hypothetical emissions as described in section 6884(c). (D) = ((A) x (B))/(C).
Difference 2015 between
Active Ingredient Crop 2014 2015 2014 Hypothetical 2015 Actual Hypothetical Emissions Pounds AI Pounds AI Emissions Emissions and Actual
(tpd) (lbs) (lbs) (tpd) (tpd) (tpd) (A) (B) (C) (D)
ABAMECTIN ALFALFA <0.001 58 69 <0.001 <0.001 <0.001 ALMOND 0.687 7696 10,282 0.514 0.254 0.260 CITRUS 0.074 1318 1,151 0.084 0.049 0.035 COTTON 0.107 1322 1,487 0.095 0.050 0.045 GRAPES 0.325 4661 4,742 0.319 0.184 0.135 PISTACHIO 0.002 20 25 0.001 <0.001 <0.001 WALNUT 0.107 1680 1,703 0.106 0.052 0.054
0.138 24253 58,994 0.057 0.049 0.007 CHLORPYRIFOS ALFALFA 0.403 125361 181,926 0.278 0.185 0.093
ALMOND 0.408 154387 172,834 0.364 0.224 0.140 CITRUS 0.255 77012 95,045 0.206 0.126 0.080 COTTON 0.025 37603 20,173 0.048 0.047 <0.001 GRAPES 0.113 37813 65,398 0.065 0.053 0.012 WALNUT 0.255 9208 6,287 0.374 0.063 0.311
0.246 7035 8,630 0.200 0.072 0.128 GIBBERELLINS CITRUS <0.001 5 10 <0.001 <0.001 <0.001
GRAPES 0.469 72418 80,133 0.423 0.249 0.174 0.002 200 224 0.001 <0.001 0.001
OXYFLUORFEN ALFALFA 0.014 2015 4,752 0.006 0.002 0.004 ALMOND 0.071 7726 10,302 0.054 0.020 0.034 CITRUS 0.063 18528 17,802 0.066 0.037 0.029 COTTON 0.065 12056 11,268 0.069 0.045 0.024 GRAPES <0.001 58 69 <0.001 <0.001 <0.001 PISTACHIO 0.687 7696 10,282 0.514 0.254 0.260 WALNUT 0.074 1318 1,151 0.084 0.049 0.035
TOTAL 3.827 602,375 753,237 3.331 1.763 1.568
53

REFERENCES
Barry, T., F. Spurlock and R. Segawa. September 29, 2007, memorandum to J. Sanders: Pesticide Volatile Organic Compound Emission Adjustments For Field Conditions And Estimated Volatile Organic Compound Reductions–Revised Estimates. On-line: http://www.cdpr.ca.gov/docs/emon/pubs/ehapreps/analysis_memos/1955_sanders.pdf
Barry, T. 2008. September 28, 2008, memorandum to Randy Segawa: Development of Sub-Chronic Air Concentration Estimates Associated with Single Fumigant Application.
California Code of Regulations, Title 3, section 6452. April, 29, 2013. Request for Approval of Reduced Volatile Organic Compound Emissions Field Fumigation Method. http://www.cdpr.ca.gov/docs/emon/vocs/vocproj/decision_voc_tif_042913.pdf
California Code of Regulations ,Title 3, section 6880. Criteria to Designate Low-Volatile Organic Compound (VOC) or High-VOC Nonfumigant Pesticide Products. http://www.cdpr.ca.gov/docs/legbills/calcode/040202.htm
Federal Register. 1997. January 8, 1997, page 1170, Emission Reductions.
Federal Register. 2008. July 18, 2008, page 41277, Revisions to the California State Implementation Plan; Pesticide Element; Ventura County.
Ibewiro, B. 2008. How to File Pesticide Use Reports for Field Fumigant Applications. On-line: http://www.cdpr.ca.gov/docs/emon/vocs/vocproj/factshts/voc_pur.pdf
Johnson, B. 2011. October 11, 2011. Memorandum to R Segawa. Evaluation of 1,3Dichloropropene and Chloropicrin Field Studies With Regard to Volatile Organic Compound Program.
Neal, R. H, P.Wofford, and R. Segawa. March 2016. Annual report on volatile organic compound emissions from pesticides: Emissions for 1990 – 2014. On-line: http://www.cdpr.ca.gov/docs/emon/vocs/vocproj/2014_annual_rpt_main.pdf
Neal, R.H and F. Spurlock, 2012. Memorandum to R. Segawa. Reassessment of Nonspatial Fractions in the VOC Inventory. On-line: http://www.cdpr.ca.gov/docs/emon/pubs/ehapreps/analysis_memos/2390_segawa.pdf
Oros, D. and Spurlock, F. 2011. Estimating Pesticide Product Volatile Organic Compound Ozone Reactivity. Part 1: Speciating TGA-Based Volatile Organic Compound Emissions Using Confidential Statements of Formula. http://www.cdpr.ca.gov/docs/emon/pubs/ehapreps/analysis_memos/2286_segawa.pdf
Segawa, R. and T. Barry. April 29, 2010. Memorandum to John Sanders. Methyl iodide (iodomethane) mitigation evaluation and options. On line: http://www.cdpr.ca.gov/docs/registration/mei_pdfs/mitigation_options_4-29-10.pdf
54
Spurlock, F. 2009. July 16, 2009. Memorandum to R. Segawa. Time Series Analysis and Forecasting of Ventura County Nonfumigant Pesticide Volatile Organic Compound Emissions. On-line: http://www.cdpr.ca.gov/docs/emon/pubs/ehapreps/analysis_memos/2151_segawa.pdf
Spurlock, F., 2006. July 18, 2006, memorandum to J. Sanders: 2006 Revisions to Procedures for Estimating Volatile Organic Compound Emissions from Pesticides. On-line: http://www.cdpr.ca.gov/docs/emon/vocs/vocproj/voc_calc_revision071805.pdf
Spurlock, F. January 7, 2002 memorandum to J. Sanders. Methodology for determining VOC emission potential of pesticide products. On-line: http://www.cdpr.ca.gov/docs/emon/vocs/vocproj/intro.pdf
Yates, S.R., J. Knuteson, F.F. Ernst, W. Zheng, and Q. Wang. 2008. Effect of Sequential Surface Irrigations on Field-Scale Emissions of 1,3-Dichloropropene. Environ. Sci. Technol. 42 (23): 8753-8758.
55
Related Documents