1959 Survivor Benefit Program Actuarial Valuation As of June 30, 2016 Item 3f, Attachment 2 Page 1 of 36

Welcome message from author
This document is posted to help you gain knowledge. Please leave a comment to let me know what you think about it! Share it to your friends and learn new things together.
Transcript
1959 Survivor Benefit ProgramActuarial Valuation
As of June 30, 2016
Item 3f, Attachment 2Page 1 of 36
Actuarial Certification 1
Highlights and Executive Summary 2Introduction 3Purpose of Report 3Funded Status of the Plan 3Required Employer and Employee Monthly Premiums 3Changes Since the Prior Year's Valuation 4
Assets 5State 5th Level Pool 6Schools 5th Level Pool 6Public Agency 1st Level Pool 6Public Agency 2nd Level Pool 6Public Agency 3rd Level Pool 7Public Agency 4th Level Pool 7Public Agency Indexed Level Pool 7
Liabilities and Funding Requirements 8Comparison of Current and Prior Results 9Development of Funding Requirements 11Schedule of Amortization Bases 14(Gain)/Loss Analysis 14
Risk Analysis 17Analysis of Future Investment Return Scenarios 18Analysis of Discount Rate Sensitivity 19
Appendix A - Statement of Actuarial Methods and Assumptions 20Appendix B - Summary of Principal Plan Provisions 28Appendix C - Demographic and Experience Information 30Appendix D - 1959 Survivor Deaths Per Year 31Appendix E - Glossary of Actuarial Terms 32
Table of ContentsItem 3f, Attachment 2
Page 2 of 36

April 2017
To the best of our knowledge, this report is complete and accurate and contains sufficient information to fully and fairly disclose thefunded condition of the 1959 Survivor Program for Public Agency 1st, 2nd, 3rd, 4th, and Indexed Level, and the State and Schools 5th Level Pools. This valuation is based on the beneficiary and membership data provided to the Actuarial Office, the statement ofassets provided by the CalPERS Financial Office, and the benefits provided under this program. It is our opinion that this valuationhas been performed by qualified actuaries in accordance with generally accepted actuarial principles, in accordance with standardsof practice prescribed by the Actuarial Standards Board, and that the assumptions and methods are internally consistent andreasonable for this program.
The undersigned are actuaries for CalPERS, who are members of the American Academy of Actuaries and the Society of Actuariesand meet the Qualification Standards of the American Academy of Actuaries to render the actuarial opinion contained herein.
Kerry J. Worgan, FSA, FCIA, MAAASenior Pension Actuary, CalPERS
Scott Terando, ASA, EA, MAAA, FCA, CFAChief Actuary, CalPERS
Actuarial Certification
1 | Actuarial Certification | CalPERS 1959 Survivor Benefit Program Actuarial Valuation - June 30, 2016
Item 3f, Attachment 2 Page 3 of 36

Highlights and Executive Summary
3 INTRODUCTION
3 PURPOSE OF REPORT
3 FUNDED STATUS OF THE PLAN
3 REQUIRED EMPLOYER AND EMPLOYEE MONTHLY PREMIUMS
4 CHANGES SINCE THE PRIOR YEAR'S VALUATION
Item 3f, Attachment 2 Page 4 of 36
INTRODUCTIONThe 1959 Survivor program was designed to provide pre-retirement death benefits comparable to those provided by SocialSecurity, formally the Federal Old Age and Survivor Insurance (OASI) program, to CalPERS’ members not covered by SocialSecurity.
Highlights and Executive Summary
3 | Highlights and Executive Summary | CalPERS 1959 Survivor Benefit Program Actuarial Valuation - June 30, 2016
PURPOSE OF REPORTThis actuarial valuation of the 1959 Survivor Program for Public Agency 1st, 2nd, 3rd, 4th and Indexed level and the State andSchools 5th level pools within the California Public Employees’ Retirement System (CalPERS) was performed by CalPERS staffactuaries as of June 30, 2016 in order to:
• Set forth the funded status of the program, reflecting the assets and funding liabilities of this program as of June 30, 2016.• Establish the actuarially required premiums for all levels and employee premiums in the Indexed, and State and Schools
5th Level for the Fiscal Year July 1, 2017 through June 30, 2018; and• Provide actuarial information as of June 30, 2016 to the CalPERS Board of Administration and other interested parties.
The use of this report for any other purposes may be inappropriate.
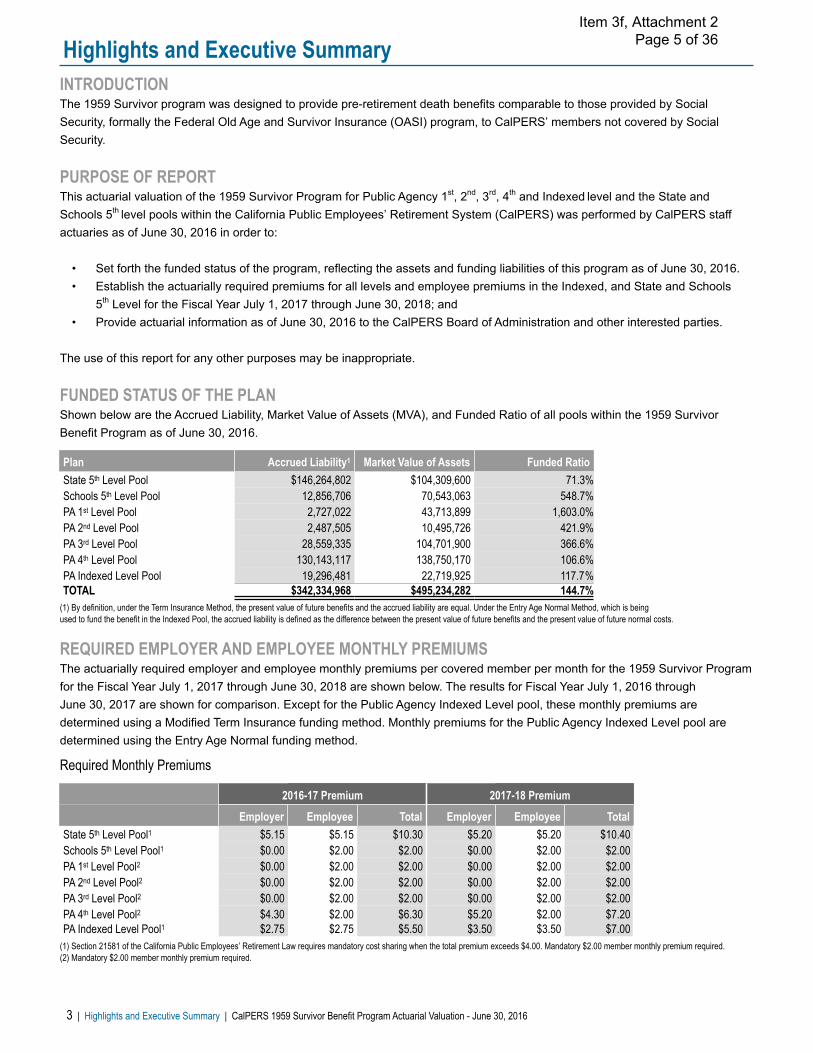
FUNDED STATUS OF THE PLANShown below are the Accrued Liability, Market Value of Assets (MVA), and Funded Ratio of all pools within the 1959 SurvivorBenefit Program as of June 30, 2016.
(1) By definition, under the Term Insurance Method, the present value of future benefits and the accrued liability are equal. Under the Entry Age Normal Method, which is being used to fund the benefit in the Indexed Pool, the accrued liability is defined as the difference between the present value of future benefits and the present value of future normal costs.
Plan Accrued Liability1 Market Value of Assets Funded RatioState 5th Level Pool $146,264,802 $104,309,600 71.3%Schools 5th Level Pool 12,856,706 70,543,063 548.7%PA 1st Level Pool 2,727,022 43,713,899 1,603.0%PA 2nd Level Pool 2,487,505 10,495,726 421.9%PA 3rd Level Pool 28,559,335 104,701,900 366.6%PA 4th Level Pool 130,143,117 138,750,170 106.6%PA Indexed Level Pool 19,296,481 22,719,925 117.7%TOTAL $342,334,968 $495,234,282 144.7%
REQUIRED EMPLOYER AND EMPLOYEE MONTHLY PREMIUMSThe actuarially required employer and employee monthly premiums per covered member per month for the 1959 Survivor Programfor the Fiscal Year July 1, 2017 through June 30, 2018 are shown below. The results for Fiscal Year July 1, 2016 through June 30, 2017 are shown for comparison. Except for the Public Agency Indexed Level pool, these monthly premiums aredetermined using a Modified Term Insurance funding method. Monthly premiums for the Public Agency Indexed Level pool aredetermined using the Entry Age Normal funding method.
Required Monthly Premiums
(1) Section 21581 of the California Public Employees’ Retirement Law requires mandatory cost sharing when the total premium exceeds $4.00. Mandatory $2.00 member monthly premium required.(2) Mandatory $2.00 member monthly premium required.
2016-17 Premium 2017-18 Premium
Employer Employee Total Employer Employee TotalState 5th Level Pool1 $5.15 $5.15 $10.30 $5.20 $5.20 $10.40Schools 5th Level Pool1 $0.00 $2.00 $2.00 $0.00 $2.00 $2.00PA 1st Level Pool2 $0.00 $2.00 $2.00 $0.00 $2.00 $2.00PA 2nd Level Pool2 $0.00 $2.00 $2.00 $0.00 $2.00 $2.00PA 3rd Level Pool2 $0.00 $2.00 $2.00 $0.00 $2.00 $2.00PA 4th Level Pool2 $4.30 $2.00 $6.30 $5.20 $2.00 $7.20PA Indexed Level Pool1 $2.75 $2.75 $5.50 $3.50 $3.50 $7.00
Item 3f, Attachment 2 Page 5 of 36

REQUIRED EMPLOYER AND EMPLOYEE MONTHLY PREMIUMS (CONTINUED)The required employee premium for the State 5th level pool will change from $5.15 to $5.20 per member, per month (or from $2.38to $2.40 for biweekly paid members) for Fiscal Year 2017-18. This is in accordance with Statute 21581(c), which specifies thatwhen the total required premium (after amortization of surplus/unfunded liability) exceeds $4.00, the employer and the membershall evenly share the required monthly premium.
The required employee premium for the Indexed level pool will change from $2.75 to $3.50 per member, per month (or from $1.27to $1.62 for biweekly paid members) for Fiscal Year 2017-18. This is in accordance with Statute 21581(b), which specifies thatwhen the total required premium (after amortization of surplus/unfunded liability) exceeds $4.00, the employer and the membershall evenly share the required monthly premium.
Employee required premiums for all of the other pools shall remain the same, $2.00 per member, per month, as in the prior year.
Highlights and Executive Summary (continued)
CalPERS 1959 Survivor Benefit Program Actuarial Valuation - June 30, 2016 | Highlights and Executive Summary | 4
CHANGES SINCE THE PRIOR YEAR'S VALUATION Actuarial Methods and AssumptionsOn December 21, 2016, the CalPERS Board of Administration lowered the discount rate from 7.50 percent to 7.00 percent using athree year phase-in beginning with the June 30, 2016 actuarial valuations. The discount rate for this valuation is 7.375 percent. Thedecision to reduce the discount rate was primarily based on reduced capital market assumptions provided by external investmentconsultants and CalPERS investment staff. A complete description of the actuarial methods and assumptions used in the June 30, 2016 valuation may be found in Appendix A of this report.
Plan ProvisionsNo changes were made since the prior valuation. A complete description of the principal plan provisions used in the June 30, 2016valuation may be found in Appendix B of this report.
Other ChangesCalPERS recently adopted a Funding Risk Mitigation Policy that will reduce the funding risk over time. Under this policy, goodinvestment performance that significantly outperforms the discount rate triggers adjustments to the discount rate, expectedinvestment return and strategic asset allocation targets. In conjunction with the discount rate change described above, the Boardalso temporarily suspended the Funding Risk Mitigation Policy for a three year period. This has no impact on the current valuationresults.
Item 3f, Attachment 2 Page 6 of 36

Assets
RECONCILIATION OF THE MARKET VALUE OF ASSETS FOR:
6 STATE 5th LEVEL POOL
6 SCHOOLS 5th LEVEL POOL
6 PUBLIC AGENCY 1st LEVEL POOL
6 PUBLIC AGENCY 2nd LEVEL POOL
7 PUBLIC AGENCY 3rd LEVEL POOL
7 PUBLIC AGENCY 4th LEVEL POOL
7 PUBLIC AGENCY INDEXED LEVEL POOL
RECONCILIATION OF THE MARKET VALUE OF ASSETS FOR:
6 STATE 5th LEVEL POOL
6 SCHOOLS 5th LEVEL POOL
6 PUBLIC AGENCY 1st LEVEL POOL
6 PUBLIC AGENCY 2nd LEVEL POOL
7 PUBLIC AGENCY 3rd LEVEL POOL
7 PUBLIC AGENCY 4th LEVEL POOL
7 PUBLIC AGENCY INDEXED LEVEL POOL
Item 3f, Attachment 2 Page 7 of 36

RECONCILIATION OF THE MARKET VALUE OF ASSETSShown below are the changes in the market value of assets for the various pools.
State 5th Level June 30, 2015 June 30, 2016Beginning Balance $113,878,478 $109,619,378Contributions (Employer and Employee) Received During Fiscal Year 9,328,084 9,400,741Benefit Payments During Fiscal Year (15,755,900) (15,034,139)Net Transfer of Assets Into and Out of this Pool — —Investment Earnings Credited 2,168,716 323,620Ending Balance $109,619,378 $104,309,600Fund Return for Year 2.00% 0.30%
Assets
CalPERS 1959 Survivor Benefit Program Actuarial Valuation - June 30, 2016 | Assets | 6
Schools 5th Level June 30, 2015 June 30, 2016Beginning Balance $71,331,499 $71,525,517Contributions (Employer and Employee) Received During Fiscal Year 210,282 212,941Benefit Payments During Fiscal Year (1,458,812) (1,430,067)Net Transfer of Assets Into and Out of this Pool — —Investment Earnings Credited 1,442,549 234,672Ending Balance $71,525,517 $70,543,063Fund Return for Year 2.00% 0.33%
Public Agency 1st Level June 30, 2015 June 30, 2016Beginning Balance $43,028,607 $43,637,106Contributions (Employer and Employee) Received During Fiscal Year 177,824 176,722Benefit Payments During Fiscal Year (231,026) (243,756)Net Transfer of Assets Into and Out of this Pool (212,216) —Investment Earnings Credited 873,917 143,826Ending Balance $43,637,106 $43,713,899Fund Return for Year 2.00% 0.33%
Public Agency 2nd Level June 30, 2015 June 30, 2016Beginning Balance $10,527,005 $10,589,764Contributions (Employer and Employee) Received During Fiscal Year 92,682 92,757Benefit Payments During Fiscal Year (236,761) (221,127)Net Transfer of Assets Into and Out of this Pool (4,443) —Investment Earnings Credited 211,281 34,332Ending Balance $10,589,764 $10,495,726Fund Return for Year 2.00% 0.33%
Item 3f, Attachment 2 Page 8 of 36

RECONCILIATION OF THE MARKET VALUE OF ASSETS OVER THE PRIOR FISCAL YEAR (CONTINUED)
Public Agency 3rd Level June 30, 2015 June 30, 2016Beginning Balance $106,304,466 $106,293,464Contributions (Employer and Employee) Received During Fiscal Year 984,836 1,024,049Benefit Payments During Fiscal Year (2,623,553) (2,728,291)Net Transfer of Assets Into and Out of this Pool (497,448) (230,616)Investment Earnings Credited 2,125,163 343,294Ending Balance $106,293,464 $104,701,900Fund Return for Year 2.00% 0.33%
Assets (continued)
7 | Assets | CalPERS 1959 Survivor Benefit Program Actuarial Valuation - June 30, 2016
Public Agency 4th Level June 30, 2015 June 30, 2016Beginning Balance $149,327,096 $145,999,937Contributions (Employer and Employee) Received During Fiscal Year 5,701,601 4,571,409Benefit Payments During Fiscal Year (12,677,733) (12,511,293)Net Transfer of Assets Into and Out of this Pool 704,436 230,616Investment Earnings Credited 2,944,537 459,501Ending Balance $145,999,937 $138,750,170Fund Return for Year 2.00% 0.32%
Public Agency Indexed Level June 30, 2015 June 30, 2016Beginning Balance $23,230,521 $23,270,090Contributions (Employer and Employee) Received During Fiscal Year 792,091 602,118Benefit Payments During Fiscal Year (1,223,796) (1,226,026)Net Transfer of Assets Into and Out of this Pool 9,671 —Investment Earnings Credited 461,602 73,742Ending Balance $23,270,090 $22,719,925Fund Return for Year 2.00% 0.32%
Item 3f, Attachment 2 Page 9 of 36

Liabilities and Funding Requirements
9 COMPARISON OF CURRENT AND PRIOR YEAR RESULTS
11 DEVELOPMENT OF FUNDING REQUIREMENTS
14 SCHEDULE OF AMORTIZATION BASES
14 (GAIN)/LOSS ANALYSIS
Item 3f, Attachment 2 Page 10 of 36

COMPARISON OF CURRENT AND PRIOR YEAR RESULTSShown below are the comparisons of key valuation results for the current valuation date compared to corresponding values fromthe prior valuation date.
Public Agency 1st Level June 30, 2015 June 30, 2016Covered Active Members 7,413 7,555
Beneficiaries Included in the ValuationDeferred (eligible, but not yet receiving benefits) 33 32Receiving Benefits 94 100Total 127 132
Present Value of Benefits $2,585,287 $2,727,022Market Value of Assets (MVA) 43,637,106 43,713,899Unfunded Liability/(Excess Assets) (41,051,819) (40,986,876)
Required Employer Monthly Premium Per MemberTotal Premium Required $1.40 $1.50Premium Required After Employee Contributions $0.00 $0.00Employer Premium After Amortization of Unfunded Liability/(Excess Assets) $0.00 $0.00
Funded Ratio Based on MVA 1,687.9% 1,603.0%
Schools 5th Level June 30, 2015 June 30, 2016Covered Active Members 10,490 10,259
Beneficiaries Included in the ValuationDeferred (eligible, but not yet receiving benefits) 18 21Receiving Benefits 154 143Total 172 164
Present Value of Benefits $13,498,624 $12,856,706Market Value of Assets (MVA) 71,525,517 70,543,063Unfunded Liability/(Excess Assets) (58,026,893) (57,686,357)
Required Employer Monthly Premium Per MemberBefore Amortization of Unfunded Liability/(Excess Assets) $4.70 $4.60After Amortization of Unfunded Liability/(Excess Assets) $0.00 $0.00After Employer/Employee Premium Sharing $0.00 $0.00
Funded Ratio Based on MVA 529.9% 548.7%
State 5th Level June 30, 2015 June 30, 2016Covered Active Members 74,372 75,782
Beneficiaries Included in the ValuationDeferred (eligible, but not yet receiving benefits) 290 300Receiving Benefits 1,437 1,439Total 1,727 1,739
Present Value of Benefits $142,864,757 $146,264,802Market Value of Assets (MVA) 109,619,378 104,309,600Unfunded Liability/(Excess Assets) 33,245,379 41,955,202
Required Employer Monthly Premium Per MemberBefore Amortization of Unfunded Liability/(Excess Assets) $7.00 $7.10After Amortization of Unfunded Liability/(Excess Assets) $10.30 $10.40After Employer/Employee Premium Sharing $5.15 $5.20
Funded Ratio Based on MVA 76.7% 71.3%
Liabilities and Funding Requirements
9 | Liabilities and Funding Requirements | CalPERS 1959 Survivor Benefit Program Actuarial Valuation - June 30, 2016
Item 3f, Attachment 2 Page 11 of 36
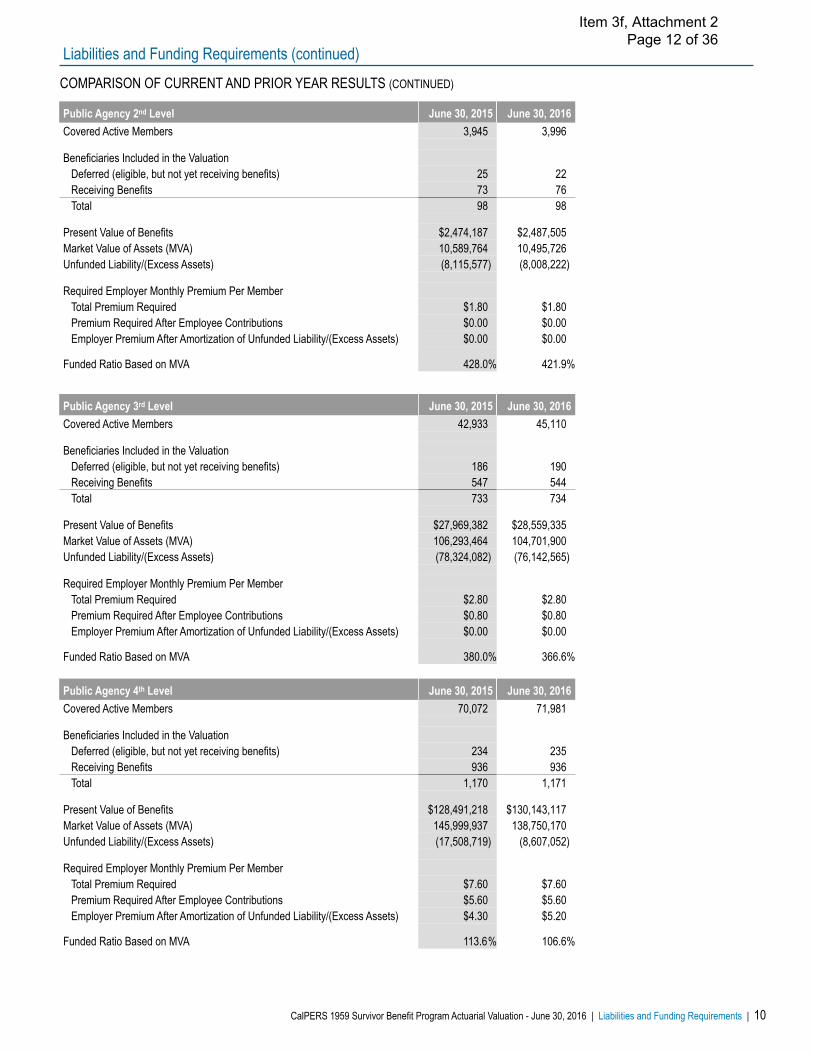
COMPARISON OF CURRENT AND PRIOR YEAR RESULTS (CONTINUED)
Public Agency 4th Level June 30, 2015 June 30, 2016Covered Active Members 70,072 71,981
Beneficiaries Included in the ValuationDeferred (eligible, but not yet receiving benefits) 234 235Receiving Benefits 936 936Total 1,170 1,171
Present Value of Benefits $128,491,218 $130,143,117Market Value of Assets (MVA) 145,999,937 138,750,170Unfunded Liability/(Excess Assets) (17,508,719) (8,607,052)
Required Employer Monthly Premium Per MemberTotal Premium Required $7.60 $7.60Premium Required After Employee Contributions $5.60 $5.60Employer Premium After Amortization of Unfunded Liability/(Excess Assets) $4.30 $5.20
Funded Ratio Based on MVA 113.6% 106.6%
Public Agency 2nd Level June 30, 2015 June 30, 2016Covered Active Members 3,945 3,996
Beneficiaries Included in the ValuationDeferred (eligible, but not yet receiving benefits) 25 22Receiving Benefits 73 76Total 98 98
Present Value of Benefits $2,474,187 $2,487,505Market Value of Assets (MVA) 10,589,764 10,495,726Unfunded Liability/(Excess Assets) (8,115,577) (8,008,222)
Required Employer Monthly Premium Per MemberTotal Premium Required $1.80 $1.80Premium Required After Employee Contributions $0.00 $0.00Employer Premium After Amortization of Unfunded Liability/(Excess Assets) $0.00 $0.00
Funded Ratio Based on MVA 428.0% 421.9%
Public Agency 3rd Level June 30, 2015 June 30, 2016Covered Active Members 42,933 45,110
Beneficiaries Included in the ValuationDeferred (eligible, but not yet receiving benefits) 186 190Receiving Benefits 547 544Total 733 734
Present Value of Benefits $27,969,382 $28,559,335Market Value of Assets (MVA) 106,293,464 104,701,900Unfunded Liability/(Excess Assets) (78,324,082) (76,142,565)
Required Employer Monthly Premium Per MemberTotal Premium Required $2.80 $2.80Premium Required After Employee Contributions $0.80 $0.80Employer Premium After Amortization of Unfunded Liability/(Excess Assets) $0.00 $0.00
Funded Ratio Based on MVA 380.0% 366.6%
Liabilities and Funding Requirements (continued)
CalPERS 1959 Survivor Benefit Program Actuarial Valuation - June 30, 2016 | Liabilities and Funding Requirements | 10
Item 3f, Attachment 2 Page 12 of 36

COMPARISON OF CURRENT AND PRIOR YEAR RESULTS (CONTINUED)
Public Agency Indexed Level June 30, 2015 June 30, 2016Covered Active Members 10,516 10,939
Beneficiaries Included in the ValuationDeferred (eligible, but not yet receiving benefits) 21 18Receiving Benefits 110 116Total 131 134
Entry Age Normal Accrued Liability $18,279,091 $19,296,481Market Value of Assets (MVA) 23,270,090 22,719,925Unfunded Liability/(Excess Assets) (4,990,999) (3,423,444)
Required Employer Monthly Premium Per MemberBefore Amortization of Unfunded Liability/(Excess Assets) $8.20 $8.60After Amortization of Unfunded Liability/(Excess Assets) $5.50 $7.00After Employer/Employee Premium Sharing $2.75 $3.50
Funded Ratio Based on MVA 127.3% 117.7%
Liabilities and Funding Requirements (continued)
11 | Liabilities and Funding Requirements | CalPERS 1959 Survivor Benefit Program Actuarial Valuation - June 30, 2016
DEVELOPMENT OF FUNDING REQUIREMENTSThe following table develops the annual premiums required for 2017-18 for the State 5th and Schools 5th Level Pools.
(1) See amortization schedule on Page 14
June 30, 2016 State 5th Level Schools 5th Level1) Development of Unfunded Liability
a) Present Value of Future Survivor Benefits $146,264,802 $12,856,706b) Market Value of Assets 104,309,600 70,543,063c) Unfunded Accrued Liability/(Excess Assets) [(1a) - (1b)] $41,955,202 ($57,686,357)
2) Development of Normal Costa) Present Value of Benefits for 2012 - 2015 Deaths $25,991,852 $2,077,496b) Number of 2012 - 2015 Member Months 3,481,908 490,128c) Total Per Member, Per Month 2016/2017 Term Insurance Normal Cost $7.00 $4.70d) Total Per Member, Per Month 2017/2018 Term Insurance Normal Cost $7.10 $4.60 [.25 * (2a) / (2b) + .75 * (2c)], rounded to nearest $0.10
3) 2017 Projected Unfunded Liabilitya) 2016 Unfunded Accrued Liability/(Excess Assets) as of June 30, 2017 [(1c) * 1.07375] $45,049,399 ($61,940,726)b) Projected Normal Cost Accrual 2016-2017 with Interest 7,030,712 603,514c) Projected Employer Contributions 2016-2017 with Interest 4,923,972 —d) Projected Employee Contributions 2016-2017 with Interest 4,923,972 253,157e) Total Projected UAL/(Excess Assets) as of June 30, 2017 [(3a) + (3b) - (3c) - (3d)] $42,232,166 ($61,590,369)
4) 2017/2018 Required Contributiona) Required Normal Cost Per Member, Per Month [(2d)] $7.10 $4.60b) Projected Active Members as of 6/30/2017 78,000 10,100c) Required Normal Cost Contribution [12 * (4a) * (4b) * (1.07375)1/2] $6,886,298 $577,713d) Amortization of the UAL/(Excess Assets)1 2,851,331 (577,713)e) Total Required Contribution Per Member, Per Month [((4c) + (4d)) / ((4b)*12)], Rounded to Nearest $0.10 $10.40 $0.00f) Amortization Period see table on pg 14 30-year
5) 2017/2018 Required Employer and Employee Premiums With Cost Sharing Provisiona) Required Employee Premium Per Member, Per Month [maximum ($2, (4e) / 2)] $5.20 $2.00b) Required Employer Premium Per Member, Per Month [maximum ($0, (4e) - (5a))] $5.20 $0.00
Item 3f, Attachment 2 Page 13 of 36
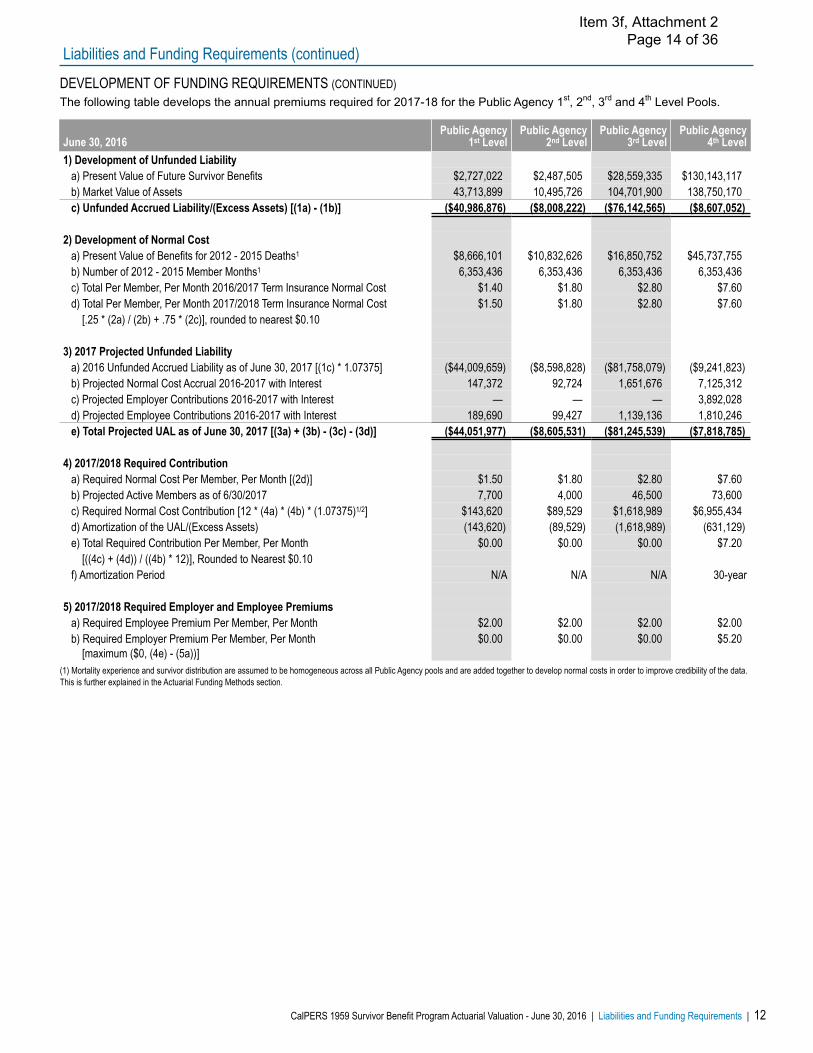
DEVELOPMENT OF FUNDING REQUIREMENTS (CONTINUED)The following table develops the annual premiums required for 2017-18 for the Public Agency 1st, 2nd, 3rd and 4th Level Pools.
(1) Mortality experience and survivor distribution are assumed to be homogeneous across all Public Agency pools and are added together to develop normal costs in order to improve credibility of the data.This is further explained in the Actuarial Funding Methods section.
June 30, 2016Public Agency
1st LevelPublic Agency
2nd LevelPublic Agency
3rd LevelPublic Agency
4th Level1) Development of Unfunded Liability
a) Present Value of Future Survivor Benefits $2,727,022 $2,487,505 $28,559,335 $130,143,117b) Market Value of Assets 43,713,899 10,495,726 104,701,900 138,750,170c) Unfunded Accrued Liability/(Excess Assets) [(1a) - (1b)] ($40,986,876) ($8,008,222) ($76,142,565) ($8,607,052)
2) Development of Normal Costa) Present Value of Benefits for 2012 - 2015 Deaths1 $8,666,101 $10,832,626 $16,850,752 $45,737,755b) Number of 2012 - 2015 Member Months1 6,353,436 6,353,436 6,353,436 6,353,436c) Total Per Member, Per Month 2016/2017 Term Insurance Normal Cost $1.40 $1.80 $2.80 $7.60d) Total Per Member, Per Month 2017/2018 Term Insurance Normal Cost $1.50 $1.80 $2.80 $7.60 [.25 * (2a) / (2b) + .75 * (2c)], rounded to nearest $0.10
3) 2017 Projected Unfunded Liabilitya) 2016 Unfunded Accrued Liability as of June 30, 2017 [(1c) * 1.07375] ($44,009,659) ($8,598,828) ($81,758,079) ($9,241,823)b) Projected Normal Cost Accrual 2016-2017 with Interest 147,372 92,724 1,651,676 7,125,312c) Projected Employer Contributions 2016-2017 with Interest — — — 3,892,028d) Projected Employee Contributions 2016-2017 with Interest 189,690 99,427 1,139,136 1,810,246e) Total Projected UAL as of June 30, 2017 [(3a) + (3b) - (3c) - (3d)] ($44,051,977) ($8,605,531) ($81,245,539) ($7,818,785)
4) 2017/2018 Required Contributiona) Required Normal Cost Per Member, Per Month [(2d)] $1.50 $1.80 $2.80 $7.60b) Projected Active Members as of 6/30/2017 7,700 4,000 46,500 73,600c) Required Normal Cost Contribution [12 * (4a) * (4b) * (1.07375)1/2] $143,620 $89,529 $1,618,989 $6,955,434d) Amortization of the UAL/(Excess Assets) (143,620) (89,529) (1,618,989) (631,129)e) Total Required Contribution Per Member, Per Month $0.00 $0.00 $0.00 $7.20 [((4c) + (4d)) / ((4b) * 12)], Rounded to Nearest $0.10f) Amortization Period N/A N/A N/A 30-year
5) 2017/2018 Required Employer and Employee Premiumsa) Required Employee Premium Per Member, Per Month $2.00 $2.00 $2.00 $2.00b) Required Employer Premium Per Member, Per Month $0.00 $0.00 $0.00 $5.20 [maximum ($0, (4e) - (5a))]
Liabilities and Funding Requirements (continued)
CalPERS 1959 Survivor Benefit Program Actuarial Valuation - June 30, 2016 | Liabilities and Funding Requirements | 12
Item 3f, Attachment 2 Page 14 of 36

DEVELOPMENT OF FUNDING REQUIREMENTS (CONTINUED)The following table develops the annual premiums required for 2017-18 for the Public Agency Indexed Level Pools.
June 30, 2016Public AgencyIndexed Level
1) Development of Unfunded Liabilitya) Present Value of Future Benefits for Active Members $12,535,100b) Present Value of Future Benefits for Current Survivors 14,588,831c) Total Present Value of Future Benefits [(1a) + (1b)] $27,123,931d) Present Value of Future Normal Costs $7,827,450e) Entry Age Normal Total Accrued Liability [(1c)-(1d)] $19,296,481f) Market Value of Assets $22,719,925g) Unfunded Accrued Liability/(Excess Assets) [(1e) - (1f)] ($3,423,444)
2) Development of Normal Costa) Required Entry Age Normal Cost $1,124,881b) Active Members as of June 30, 2016 10,939c) Total Per Member, Per Month Entry Age Normal Cost [(2a) / (2b) * 12], Rounded to Nearest $0.10 $8.60
3) 2017 Projected Unfunded Liabilitya) 2016 Unfunded Accrued Liability/(Excess Assets) as of June 30, 2017 [(1g) * 1.07375] ($3,675,923)b) Projected Normal Cost Accrual 2016-2017 with Interest 1,226,117c) Projected Employer Contributions 2016-2017 with Interest 378,524d) Projected Employee Contributions 2016-2017 with Interest 378,524e) Total Projected UAL as of June 30, 2017 [(3a) + (3b) - (3c) - (3d)] ($3,206,854)
4) 2017/2018 Required Contributiona) Required Normal Cost Per Member, Per Month [(2c)] $8.60b) Projected Active Members as of 6/30/2017 11,200c) Required Normal Cost Contribution [12 * (4a) * (4b) * (1.07375)1/2] $1,197,703d) Amortization of the UAL/(Excess Assets) (258,856)e) Total Required Contribution Per Member, Per Month [((4c) + (4d)) / ((4b) * 12)], Rounded to Nearest $0.10 $7.00f) Amortization Period 30-year
5) 2017/2018 Required Employer and Employee Premiums With Cost Sharing Provisiona) Required Employee Premium Per Member, Per Month [maximum ($2, (4e) / 2] $3.50b) Required Employer Premium Per Member, Per Month [maximum($0, (4e) - (5a))] $3.50
Liabilities and Funding Requirements (continued)
13 | Liabilities and Funding Requirements | CalPERS 1959 Survivor Benefit Program Actuarial Valuation - June 30, 2016
Item 3f, Attachment 2 Page 15 of 36

SCHEDULE OF AMORTIZATION BASESThe schedule below shows the development of the required payments on the Amortization Bases in accordance with theAmortization Policy. In accordance with Board policy, a plan with a funding excess will have their funding excess amortized over aminimum of 30 years.
State 5th Level Pool
DateEstablished
RemainingPeriod
ProjectedBalance
6/30/2016Payment2016-17
ProjectedBalance
6/30/2017Payment2017-18
ProjectedBalance
6/30/2018
ProjectedPayment2018-19
Unfunded Liability 6/30/2013 27 $37,116,838 $3,093,190 $36,648,982 $3,055,839 $36,185,325 $3,055,839Experience (Gain)/Loss 6/30/2014 28 (14,342,641) (533,783) (14,847,294) (790,843) (15,122,795) (1,054,458)Experience (Gain)/Loss 6/30/2015 29 10,022,549 196,695 10,557,892 388,275 10,934,199 582,412Assumption Change 6/30/2016 20 1,458,901 35,047 1,530,178 70,095Experience (Gain)/Loss 6/30/2016 30 8,413,685 163,014 8,865,277 326,027TOTAL $32,796,746 $2,756,102 $42,232,166 $2,851,331 $42,392,185 $2,979,915
Liabilities and Funding Requirements (continued)
CalPERS 1959 Survivor Benefit Program Actuarial Valuation - June 30, 2016 | Liabilities and Funding Requirements | 14
(GAIN)/LOSS ANALYSIS 6/30/2015 - 6/30/2016The following table develops the asset and demographic gain and losses between June 30, 2015 and June 30, 2016 for the State and Schools 5th Level Pools.
State 5th Level Schools 5th LevelAmounts as of 6/30/2015
1) Present Value of Benefits $142,864,757 $13,498,6242) Market Value of Assets 109,619,378 71,525,5173) Unfunded Liability/(Excess Assets) [(1) - (2)] $33,245,379 ($58,026,893)
Amounts During the Period 6/30/15 - 6/30/20164) Expected Claims for the Fiscal Year $6,280,995 $588,4925) Employer and Employee Premiums Collected 9,400,741 212,9416) Benefit Payments (15,034,139) (1,430,067)7) Net Liabilities Transferred into the Level Pool — —8) Net Assets Transferred into the Level Pool — —
Expected Amounts as of 6/30/20169) Change in Accrued Liability due to Discount Rate Change $1,458,901 $121,35910) Expected Present Value of Benefits [(1) * 1.075 + ((4) + (6) + (7)) * (1.075)1/2 + (9)] 145,963,062 13,759,81611) Expected Market Value of Assets [(2) * 1.075 + ((5) + (6) + (8)) * (1.075)1/2] 112,000,000 75,627,98812) Expected Unfunded Liability/(Excess Assets) [(10) - (11)] $33,963,062 ($61,868,172)
Amounts as of 6/30/201613) Present Value of Benefits $146,264,802 $12,856,70614) Market Value of Assets 104,309,600 70,543,06315) Unfunded Liability/(Excess Assets) [(13) - (14)] $41,955,202 ($57,686,357)
(Gain)/Loss for the Period 6/30/2015 - 6/30/201616) Liability (Gain)/Loss [(13) - (10)] $301,740 ($903,110)17) Asset (Gain)/Loss [(11) - (14)] 7,690,400 5,084,92518) Total (Gain)/Loss [(16) + (17)] $7,992,141 $4,181,814
Item 3f, Attachment 2 Page 16 of 36

(GAIN)/LOSS ANALYSIS 6/30/2015 - 6/30/2016 (CONTINUED)The following table develops the asset and demographic gain and losses between June 30, 2015 and June 30, 2016 for the Public Agency 1st, 2nd, 3rd, and 4th Level Pools.
Public Agency1st Level
Public Agency2nd Level
Public Agency3rd Level
Public Agency4th Level
Amounts as of 6/30/20151) Present Value of Benefits $2,585,287 $2,474,187 $27,969,382 $128,491,2182) Market Value of Assets 43,637,106 10,589,764 106,293,464 145,999,9373) Unfunded Liability/(Excess Assets) [(1) - (2)] ($41,051,819) ($8,115,577) ($78,324,082) ($17,508,719)
Amounts During the Period 6/30/15 - 6/30/20164) Expected Claims for the Fiscal Year $130,586 $86,239 $1,489,688 $6,537,2795) Employer and Employee Premiums Collected 176,722 92,757 1,024,049 4,571,4096) Benefit Payments (243,756) (221,127) (2,728,291) (12,511,293)7) Net Liabilities Transferred into the Level Pool — — (49,633) 134,7198) Net Assets Transferred into the Level Pool — — (230,616) 230,616
Expected Amounts as of 6/30/20169) Change in Accrued Liability due to Discount Rate Change $28,143 $25,391 $299,361 $1,344,10510) Expected Present Value of Benefits [(1)*1.075+((4)+(6)+(7))*(1.075)1/2 +(9)] 2,689,990 2,545,288 29,030,774 133,417,85611) Expected Market Value of Assets [(2) * 1.075 + ((5) + (6) + (8)) * (1.075)1/2] 46,840,387 11,250,900 112,259,370 148,956,79212) Expected Unfunded Liability/(Excess Assets) [(10) - (11)] ($44,150,397) ($8,705,612) ($83,228,596) ($15,538,937)
Amounts as of 6/30/201613) Present Value of Benefits $2,727,022 $2,487,505 $28,559,335 $130,143,11714) Market Value of Assets 43,713,899 10,495,726 104,701,900 138,750,17015) Unfunded Liability/(Excess Assets) [(13) - (14)] ($40,986,876) ($8,008,222) ($76,142,565) ($8,607,052)
(Gain)/Loss for the Period 6/30/2015 - 6/30/201616) Liability (Gain)/Loss [(13) - (10)] $37,032 ($57,783) ($471,439) ($3,274,739)17) Asset (Gain)/Loss [(11)- (14)] 3,126,488 755,174 7,557,470 10,206,62318) Total (Gain)/Loss [(16) + (17)] $3,163,521 $697,391 $7,086,031 $6,931,884
Liabilities and Funding Requirements (continued)
15 | Liabilities and Funding Requirements | CalPERS 1959 Survivor Benefit Program Actuarial Valuation - June 30, 2016
Item 3f, Attachment 2 Page 17 of 36

(GAIN)/LOSS ANALYSIS 6/30/2015 - 6/30/2016 (CONTINUED)The following table develops the asset and demographic gain and losses between June 30, 2015 and June 30, 2016 for the Public Agency Indexed Level Pool.
Public AgencyIndexed Level
Amounts as of 6/30/20151) Accrued Liability $18,279,0912) Market Value of Assets 23,270,0903) Unfunded Liability/(Excess Assets) [(1) - (2)] ($4,990,999)
Amounts During the Period 6/30/15 - 6/30/20164) Expected Claims for the Fiscal Year $1,069,7465) Employer and Employee Premiums Collected 602,1186) Benefit Payments (1,226,026)7) Net Liabilities Transferred into the Level Pool —8) Net Assets Transferred into the Level Pool —
Expected Amounts as of 6/30/20169) Change in Accrued Liability due to Discount Rate Change $321,47510) Expected Present Value of Benefits [(1) * 1.075 + ((4) + (6) + (7)) * (1.075)1/2 + (9)] 19,809,46411) Expected Market Value of Assets [(2) * 1.075 + ((5) + (6) + (8)) * (1.075)1/2] 24,368,46512) Expected Unfunded Liability/(Excess Assets) [(10) - (11)] ($4,559,002)
Amounts as of 6/30/201613) Accrued Liability $19,296,48114) Market Value of Assets 22,719,92515) Unfunded Liability/(Excess Assets) [(13) - (14)] ($3,423,444)
(Gain)/Loss for the Period 6/30/2015 - 6/30/201616) Liability (Gain)/Loss [(13) - (10)] ($512,983)17) Asset (Gain)/Loss [(11) - (14)] 1,648,54118) Total (Gain)/Loss [(16) + (17)] $1,135,558
Liabilities and Funding Requirements (continued)
CalPERS 1959 Survivor Benefit Program Actuarial Valuation - June 30, 2016 | Liabilities and Funding Requirements | 16
Item 3f, Attachment 2 Page 18 of 36

Risk Analysis
18 ANALYSIS OF FUTURE INVESTMENT RETURN SCENARIOS
19 ANALYSIS OF DISCOUNT RATE SENSITIVITY
Item 3f, Attachment 2 Page 19 of 36
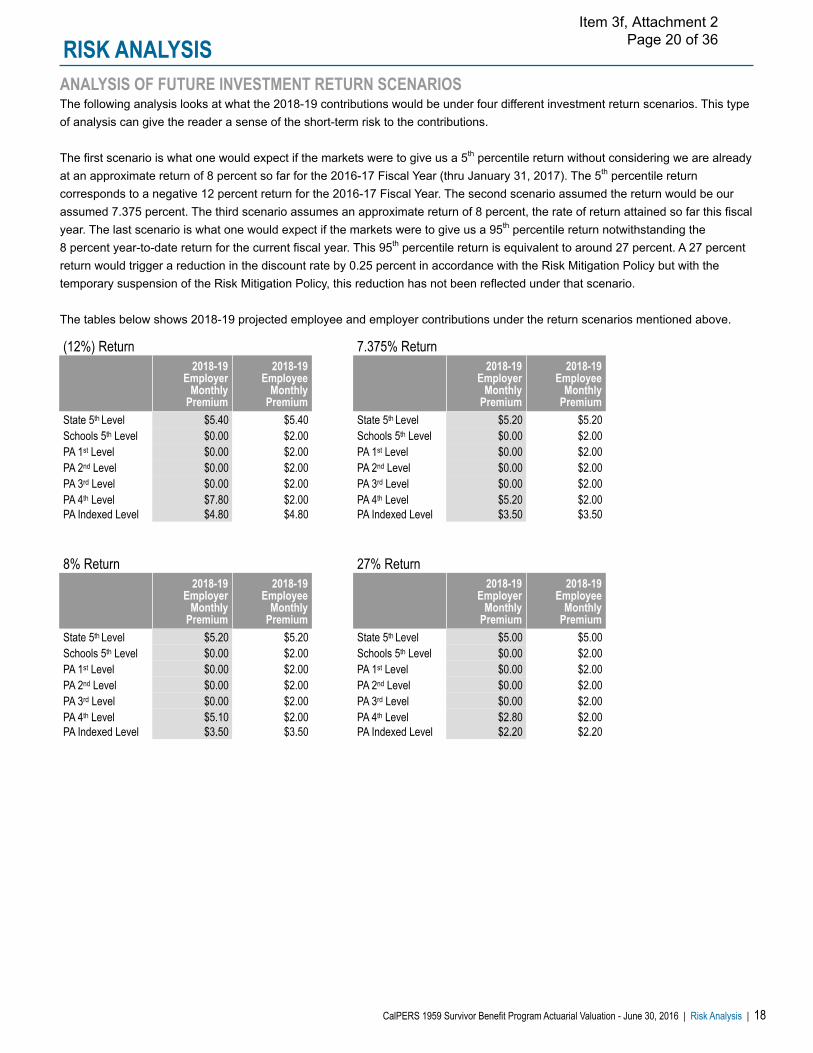
ANALYSIS OF FUTURE INVESTMENT RETURN SCENARIOSThe following analysis looks at what the 2018-19 contributions would be under four different investment return scenarios. This typeof analysis can give the reader a sense of the short-term risk to the contributions.
The first scenario is what one would expect if the markets were to give us a 5th percentile return without considering we are alreadyat an approximate return of 8 percent so far for the 2016-17 Fiscal Year (thru January 31, 2017). The 5th percentile returncorresponds to a negative 12 percent return for the 2016-17 Fiscal Year. The second scenario assumed the return would be ourassumed 7.375 percent. The third scenario assumes an approximate return of 8 percent, the rate of return attained so far this fiscalyear. The last scenario is what one would expect if the markets were to give us a 95th percentile return notwithstanding the 8 percent year-to-date return for the current fiscal year. This 95th percentile return is equivalent to around 27 percent. A 27 percentreturn would trigger a reduction in the discount rate by 0.25 percent in accordance with the Risk Mitigation Policy but with thetemporary suspension of the Risk Mitigation Policy, this reduction has not been reflected under that scenario.
The tables below shows 2018-19 projected employee and employer contributions under the return scenarios mentioned above.
8% Return 27% Return2018-19
EmployerMonthly
Premium
2018-19Employee
MonthlyPremium
2018-19Employer
MonthlyPremium
2018-19Employee
MonthlyPremium
State 5th Level $5.20 $5.20 State 5th Level $5.00 $5.00Schools 5th Level $0.00 $2.00 Schools 5th Level $0.00 $2.00PA 1st Level $0.00 $2.00 PA 1st Level $0.00 $2.00PA 2nd Level $0.00 $2.00 PA 2nd Level $0.00 $2.00PA 3rd Level $0.00 $2.00 PA 3rd Level $0.00 $2.00PA 4th Level $5.10 $2.00 PA 4th Level $2.80 $2.00PA Indexed Level $3.50 $3.50 PA Indexed Level $2.20 $2.20
(12%) Return 7.375% Return2018-19
EmployerMonthly
Premium
2018-19Employee
MonthlyPremium
2018-19Employer
MonthlyPremium
2018-19Employee
MonthlyPremium
State 5th Level $5.40 $5.40 State 5th Level $5.20 $5.20Schools 5th Level $0.00 $2.00 Schools 5th Level $0.00 $2.00PA 1st Level $0.00 $2.00 PA 1st Level $0.00 $2.00PA 2nd Level $0.00 $2.00 PA 2nd Level $0.00 $2.00PA 3rd Level $0.00 $2.00 PA 3rd Level $0.00 $2.00PA 4th Level $7.80 $2.00 PA 4th Level $5.20 $2.00PA Indexed Level $4.80 $4.80 PA Indexed Level $3.50 $3.50
RISK ANALYSIS
CalPERS 1959 Survivor Benefit Program Actuarial Valuation - June 30, 2016 | Risk Analysis | 18
Item 3f, Attachment 2 Page 20 of 36

ANALYSIS OF DISCOUNT RATE SENSITIVITYThe following analysis looks at what the 2017-18 contributions would be under two different discount rate scenarios. Wedetermined the required contributions using discount rates that are 1 percent lower and 1 percent higher than the valuationdiscount rate of 7.375 percent. This analysis will give an indication of the potential required contributions if the PERF hadinvestment returns of 6.375 percent or 8.375 percent over the long-term.
This type of analysis can give employers a sense of the long-term risk to the contributions.
6.375% Discount Rate (-1%) Increase in Contribution2017-18
EmployerMonthly
Premium
2017-18Employee
MonthlyPremium
2017-18Employer
MonthlyPremium
2017-18Employee
MonthlyPremium
State 5th Level $5.65 $5.65 State 5th Level $0.45 $0.45Schools 5th Level $0.00 $2.00 Schools 5th Level $0.00 $0.00PA 1st Level $0.00 $2.00 PA 1st Level $0.00 $0.00PA 2nd Level $0.00 $2.00 PA 2nd Level $0.00 $0.00PA 3rd Level $0.00 $2.00 PA 3rd Level $0.00 $0.00PA 4th Level $6.70 $2.00 PA 4th Level $1.50 $0.00PA Indexed Level $4.85 $4.85 PA Indexed Level $1.35 $1.35
8.375% Discount Rate (+1%) Decrease in Contribution2017-18
EmployerMonthly
Premium
2017-18Employee
MonthlyPremium
2017-18Employer
MonthlyPremium
2017-18Employee
MonthlyPremium
State 5th Level $4.85 $4.85 State 5th Level ($0.35) ($0.35)Schools 5th Level $0.00 $2.00 Schools 5th Level $0.00 $0.00PA 1st Level $0.00 $2.00 PA 1st Level $0.00 $0.00PA 2nd Level $0.00 $2.00 PA 2nd Level $0.00 $0.00PA 3rd Level $0.00 $2.00 PA 3rd Level $0.00 $0.00PA 4th Level $3.60 $2.00 PA 4th Level ($1.60) $0.00PA Indexed Level $2.25 $2.25 PA Indexed Level ($1.25) ($1.25)
Risk Analysis (continued)
19 | Risk Analysis | CalPERS 1959 Survivor Benefit Program Actuarial Valuation - June 30, 2016
Item 3f, Attachment 2 Page 21 of 36
Appendix AStatement of Actuarial Methods and Assumptions
CalPERS 1959 Survivor Benefit Program Actuarial Valuation - June 30, 2016 | Appendix A | 20
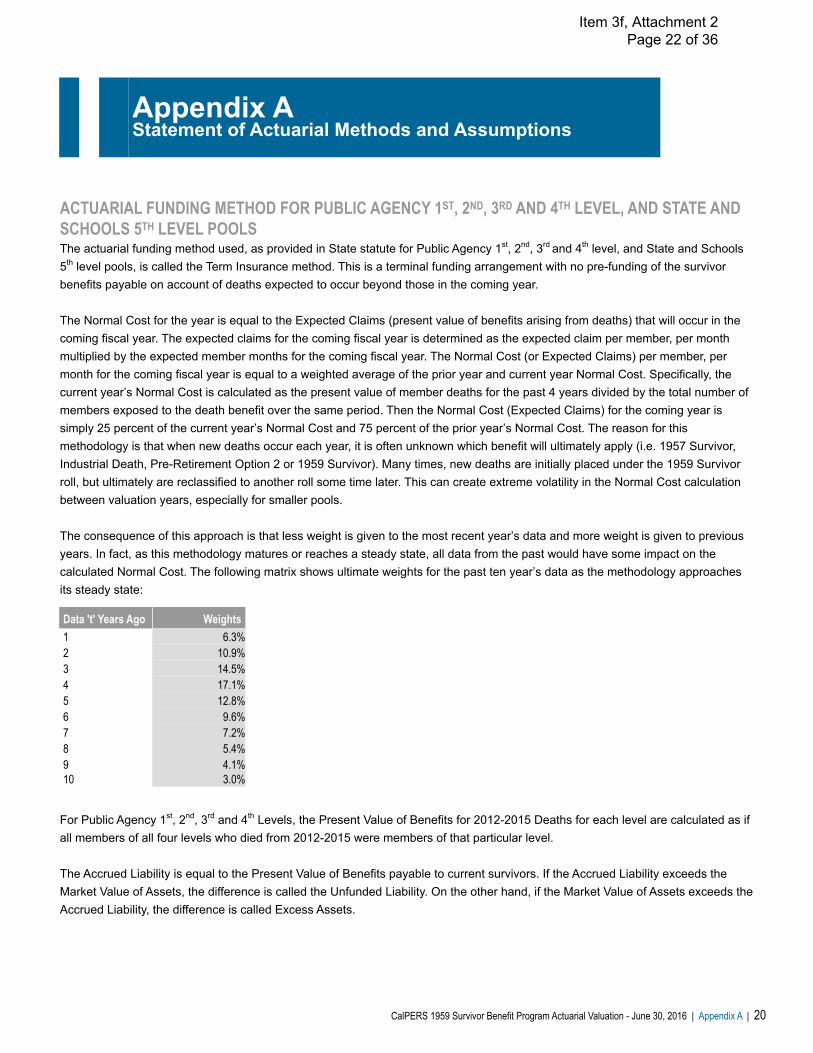
ACTUARIAL FUNDING METHOD FOR PUBLIC AGENCY 1ST, 2ND, 3RD AND 4TH LEVEL, AND STATE ANDSCHOOLS 5TH LEVEL POOLSThe actuarial funding method used, as provided in State statute for Public Agency 1st, 2nd, 3rd and 4th level, and State and Schools5th level pools, is called the Term Insurance method. This is a terminal funding arrangement with no pre-funding of the survivorbenefits payable on account of deaths expected to occur beyond those in the coming year.
The Normal Cost for the year is equal to the Expected Claims (present value of benefits arising from deaths) that will occur in thecoming fiscal year. The expected claims for the coming fiscal year is determined as the expected claim per member, per monthmultiplied by the expected member months for the coming fiscal year. The Normal Cost (or Expected Claims) per member, permonth for the coming fiscal year is equal to a weighted average of the prior year and current year Normal Cost. Specifically, thecurrent year’s Normal Cost is calculated as the present value of member deaths for the past 4 years divided by the total number ofmembers exposed to the death benefit over the same period. Then the Normal Cost (Expected Claims) for the coming year issimply 25 percent of the current year’s Normal Cost and 75 percent of the prior year’s Normal Cost. The reason for thismethodology is that when new deaths occur each year, it is often unknown which benefit will ultimately apply (i.e. 1957 Survivor,Industrial Death, Pre-Retirement Option 2 or 1959 Survivor). Many times, new deaths are initially placed under the 1959 Survivorroll, but ultimately are reclassified to another roll some time later. This can create extreme volatility in the Normal Cost calculationbetween valuation years, especially for smaller pools.
The consequence of this approach is that less weight is given to the most recent year’s data and more weight is given to previousyears. In fact, as this methodology matures or reaches a steady state, all data from the past would have some impact on thecalculated Normal Cost. The following matrix shows ultimate weights for the past ten year’s data as the methodology approachesits steady state:
For Public Agency 1st, 2nd, 3rd and 4th Levels, the Present Value of Benefits for 2012-2015 Deaths for each level are calculated as ifall members of all four levels who died from 2012-2015 were members of that particular level.
The Accrued Liability is equal to the Present Value of Benefits payable to current survivors. If the Accrued Liability exceeds theMarket Value of Assets, the difference is called the Unfunded Liability. On the other hand, if the Market Value of Assets exceeds theAccrued Liability, the difference is called Excess Assets.
Data 't' Years Ago Weights1 6.3%2 10.9%3 14.5%4 17.1%5 12.8%6 9.6%7 7.2%8 5.4%9 4.1%10 3.0%
Item 3f, Attachment 2 Page 22 of 36

ACTUARIAL FUNDING METHOD FOR PUBLIC AGENCY 1ST, 2ND, 3RD AND 4TH LEVEL, AND STATE AND SCHOOLS 5TH LEVELPOOLS (CONTINUED)The required employer monthly premium is the total required monthly premium less the $2.00 per month member contributions asrequired by State Statute Section 21581. For all levels, existing excess assets in the pool will be amortized and directly used tooffset required employer contributions. However, for the State and Schools 5th Level pool, if the total required monthly premiumafter amortization of excess assets exceeds $4.00, the member and the employer shall evenly share the required monthlypremium. For the current valuation date, the unfunded liability for the State 5th Level pool was amortized using CalPERSamortization policy. Excess assets for the Schools 5th Level pool, and Public Agency 1st, 2nd, and 3rd Level pools were sufficient tooffset required employer contributions indefinitely, based on June 30, 2016 data and assumptions. Excess assets for the PublicAgency 4th Level were amortized over a 30-year period, and are not sufficient to fully offset the required employer contribution. Theresulting employer contribution for the 4th Level is $5.20 per covered member per month.
Appendix A - Statement of Actuarial Methods and Assumptions (continued)
21 | Appendix A | CalPERS 1959 Survivor Benefit Program Actuarial Valuation - June 30, 2016
ACTUARIAL FUNDING METHOD FOR PUBLIC AGENCY INDEXED LEVEL POOLThe funding method used for the Public Agency Indexed Level pool is the Entry Age Normal method. Under this method, projectedbenefits are determined for all members and the associated liabilities are spread in a manner that produces an annual cost thatincreases by approximately 2 percent in each year.
The Normal Cost for the Public Agency Indexed Level pool is the portion of the total Entry Age Normal Cost, as described in thepreceding paragraph that is allocated to the current fiscal year. Since there is no cost allocated to the current fiscal year for thosealready receiving benefits or are in a deferred status, only active members have a Normal Cost. The population demographics,excluding population growth, are assumed to remain stable for purposes of projecting the Normal Cost to the year for which thecontribution requirement is being determined.
The Accrued Liability is equal to the Present Value of Future Benefits for both current survivors and active members, less thePresent Value of Future Normal Costs.
The total required monthly premium is the sum of the individual Normal Costs divided by the number of member months. Therequired employer monthly premium is the total required monthly premium less the $2.00 per month member contributions asrequired by State Statute Section 21581. Existing excess assets in the pool will be amortized and directly used to offset requiredemployer contributions. However, if the total required monthly premium after amortization of excess assets exceeds $4.00, themember and the employer shall evenly share the required monthly premium. Excess assets for the Public Agency Indexed Levelare amortized over a 30-year period. The resulting employer contribution for the Indexed Level is $3.50 per covered member permonth.
ASSET VALUATION METHOD Commencing with the June 30, 2013 valuation, assets were and continue to be valued on a Market Value basis.
METHOD FOR PROJECTING ACTIVE COUNTSIn the past, actuarial staff has found that two particular methods have worked well in predicting future active member counts for thepools. Projected counts are necessary to determine employer premiums. The two methods that are normally used are linear trendor autoregressive models. For this valuation year, we will continue to use these models for the Public Agency Pools. They continueto model slow growth in the 1st, 2nd, 3rd, 4th and Indexed Level pools.
These methods when applied to the State and Schools Pools are also predicting modest growth for State and small decline forSchools. This is consistent with the current state of the economy, current hiring practices of the State and the fact that newmigration into and out of these pools do not take place.
Item 3f, Attachment 2 Page 23 of 36

ACTUARIAL ASSUMPTIONSThe actuarial assumptions used in this valuation include the investment return rate and the mortality rates for current beneficiaries.These assumptions are shown below. Actual mortality rates for active members of all pools combined are shown in Appendix D andare used in the calculation of the annual normal costs, except for the Public Agency Indexed Level.
Economic AssumptionsInvestment Return 7.375% compounded annually (net of administrative expenses)
Demographic Assumptions:The mortality assumptions are based on mortality rates resulting from the most recent CalPERS Experience Study adopted by theCalPERS Board. For purposes of the mortality rates, the revised rates include 20 years of projected on-going mortalityimprovement using Scale BB published by the Society of Actuaries. For more details, please refer to the experience study reportthat can be found at the following link:
https://www.calpers.ca.gov/docs/forms-publications/calpers-experience-study-2014.pdf
AttainedAge
Male MortalityRate
Female MortalityRate
AttainedAge
Male MortalityRate
Female MortalityRate
25 0.0003 0.0002 65 0.0083 0.005930 0.0004 0.0003 70 0.0131 0.009935 0.0006 0.0005 75 0.0221 0.017240 0.0011 0.0009 80 0.0390 0.029045 0.0023 0.0020 85 0.0697 0.052450 0.0050 0.0047 90 0.1297 0.098955 0.0060 0.0042 95 0.2244 0.184960 0.0071 0.0044 100 0.3254 0.3002
Appendix A - Statement of Actuarial Methods and Assumptions (continued)
CalPERS 1959 Survivor Benefit Program Actuarial Valuation - June 30, 2016 | Appendix A | 22
ADDITIONAL ACTUARIAL ASSUMPTIONS APPLICABLE TO THE PUBLIC AGENCY INDEXED LEVELThe Public Agency Indexed Level’s Accrued Liability and Entry Age Normal cost for active members are calculated based on theactuarial assumptions for our Public Agency miscellaneous 2% @ 55 and police 2% @ 50 pension plans. The final valuation resultsequals the sum of the results valued on the basis of a miscellaneous 2% @ 55 plan plus the results valued on the basis of a police2% @ 50 plan, where all miscellaneous employees of plans contracting for the Public Agency Indexed Level of 1959 Survivorbenefits are valued using miscellaneous 2% @ 55 assumptions, and all safety employees of plans contracting for the PublicAgency Indexed Level of 1959 Survivor benefits are valued using police 2% @ 50 assumptions.
The actuarial assumptions for each of these plans are as follows:
Eligible Survivor StatusFor active members of both the Miscellaneous and Safety Police plans, the probability of having eligible survivor(s) at the date ofdeath is assumed according to the following table:
Age at DeathPercent Having
Eligible Survivor(s)Age 20 and Under 30%Between Ages 21 and 24 50%Between Ages 25 and 29 70%Between Ages 30 and 29 90%Between Ages 40 and 49 95%Between Ages 50 and 54 90%Age 55 and Above 85%
Item 3f, Attachment 2 Page 24 of 36
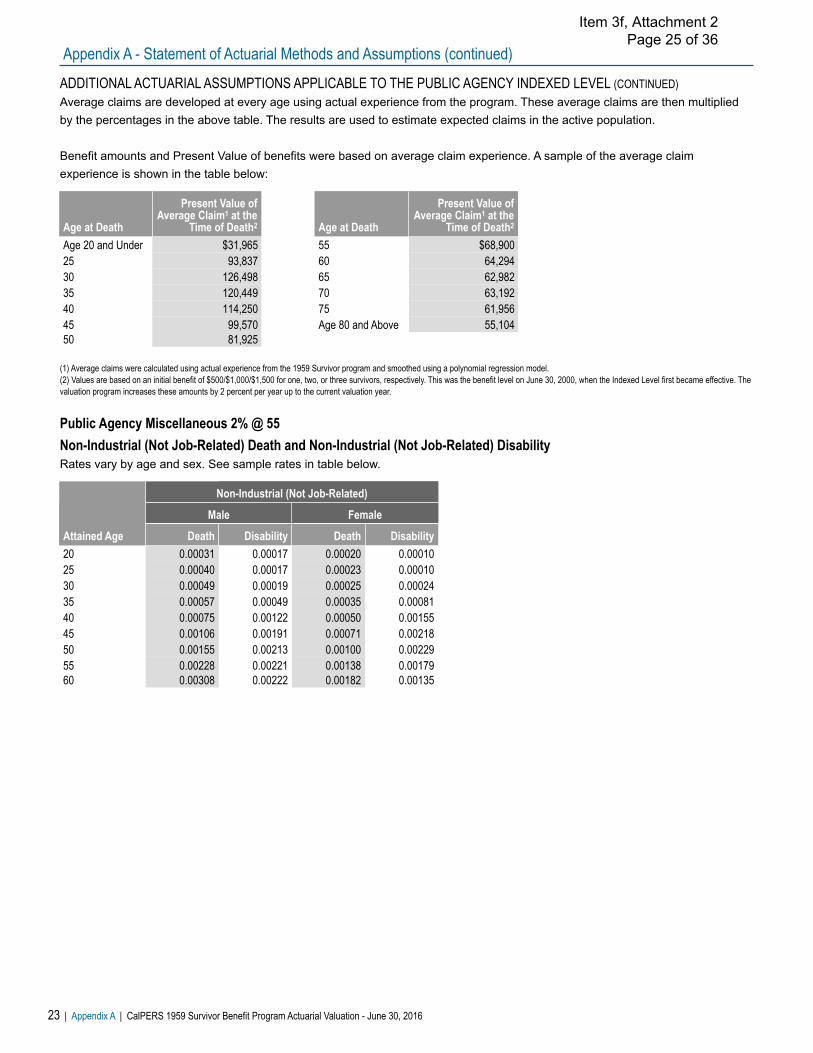
ADDITIONAL ACTUARIAL ASSUMPTIONS APPLICABLE TO THE PUBLIC AGENCY INDEXED LEVEL (CONTINUED)Average claims are developed at every age using actual experience from the program. These average claims are then multipliedby the percentages in the above table. The results are used to estimate expected claims in the active population.
Benefit amounts and Present Value of benefits were based on average claim experience. A sample of the average claimexperience is shown in the table below:
(1) Average claims were calculated using actual experience from the 1959 Survivor program and smoothed using a polynomial regression model.(2) Values are based on an initial benefit of $500/$1,000/$1,500 for one, two, or three survivors, respectively. This was the benefit level on June 30, 2000, when the Indexed Level first became effective. Thevaluation program increases these amounts by 2 percent per year up to the current valuation year.
Public Agency Miscellaneous 2% @ 55Non-Industrial (Not Job-Related) Death and Non-Industrial (Not Job-Related) DisabilityRates vary by age and sex. See sample rates in table below.
Attained Age
Non-Industrial (Not Job-Related)
Male Female
Death Disability Death Disability20 0.00031 0.00017 0.00020 0.0001025 0.00040 0.00017 0.00023 0.0001030 0.00049 0.00019 0.00025 0.0002435 0.00057 0.00049 0.00035 0.0008140 0.00075 0.00122 0.00050 0.0015545 0.00106 0.00191 0.00071 0.0021850 0.00155 0.00213 0.00100 0.0022955 0.00228 0.00221 0.00138 0.0017960 0.00308 0.00222 0.00182 0.00135
Age at Death
Present Value ofAverage Claim1 at the
Time of Death2 Age at Death
Present Value ofAverage Claim1 at the
Time of Death2
Age 20 and Under $31,965 55 $68,90025 93,837 60 64,29430 126,498 65 62,98235 120,449 70 63,19240 114,250 75 61,95645 99,570 Age 80 and Above 55,10450 81,925
Appendix A - Statement of Actuarial Methods and Assumptions (continued)
23 | Appendix A | CalPERS 1959 Survivor Benefit Program Actuarial Valuation - June 30, 2016
Item 3f, Attachment 2 Page 25 of 36
ADDITIONAL ACTUARIAL ASSUMPTIONS APPLICABLE TO THE PUBLIC AGENCY INDEXED LEVEL (CONTINUED)
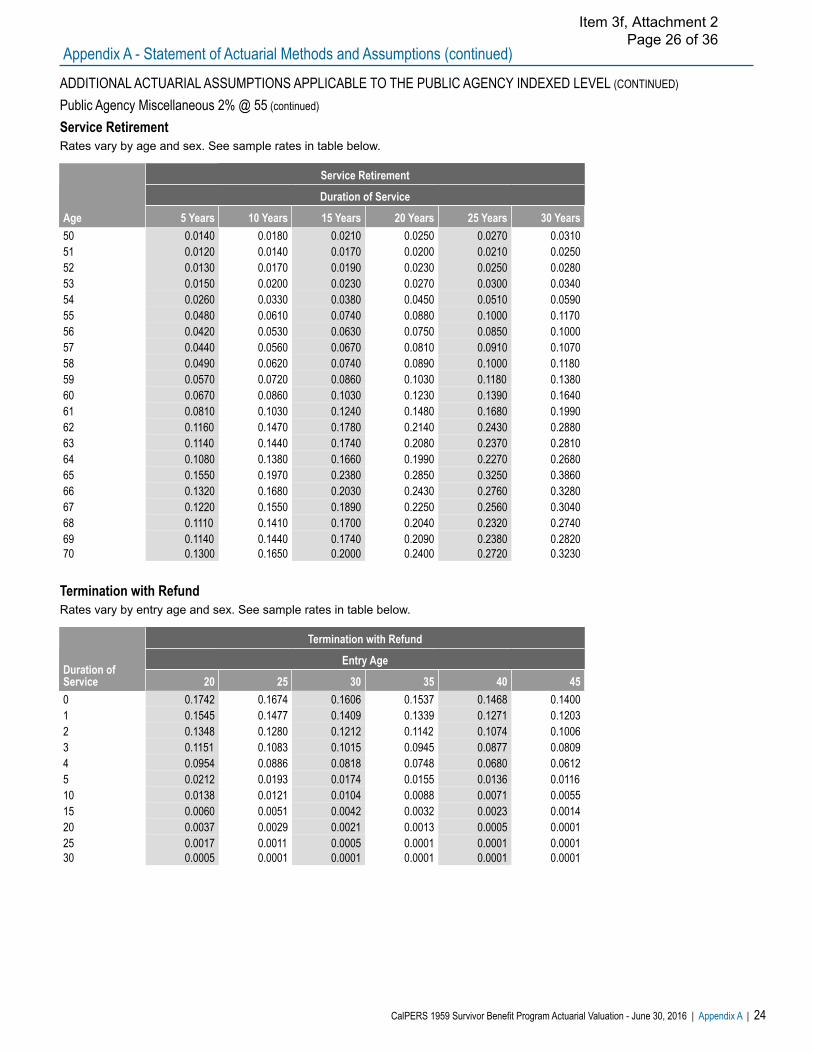
Public Agency Miscellaneous 2% @ 55 (continued)
Service RetirementRates vary by age and sex. See sample rates in table below.
Termination with RefundRates vary by entry age and sex. See sample rates in table below.
Age
Service Retirement
Duration of Service
5 Years 10 Years 15 Years 20 Years 25 Years 30 Years50 0.0140 0.0180 0.0210 0.0250 0.0270 0.031051 0.0120 0.0140 0.0170 0.0200 0.0210 0.025052 0.0130 0.0170 0.0190 0.0230 0.0250 0.028053 0.0150 0.0200 0.0230 0.0270 0.0300 0.034054 0.0260 0.0330 0.0380 0.0450 0.0510 0.059055 0.0480 0.0610 0.0740 0.0880 0.1000 0.117056 0.0420 0.0530 0.0630 0.0750 0.0850 0.100057 0.0440 0.0560 0.0670 0.0810 0.0910 0.107058 0.0490 0.0620 0.0740 0.0890 0.1000 0.118059 0.0570 0.0720 0.0860 0.1030 0.1180 0.138060 0.0670 0.0860 0.1030 0.1230 0.1390 0.164061 0.0810 0.1030 0.1240 0.1480 0.1680 0.199062 0.1160 0.1470 0.1780 0.2140 0.2430 0.288063 0.1140 0.1440 0.1740 0.2080 0.2370 0.281064 0.1080 0.1380 0.1660 0.1990 0.2270 0.268065 0.1550 0.1970 0.2380 0.2850 0.3250 0.386066 0.1320 0.1680 0.2030 0.2430 0.2760 0.328067 0.1220 0.1550 0.1890 0.2250 0.2560 0.304068 0.1110 0.1410 0.1700 0.2040 0.2320 0.274069 0.1140 0.1440 0.1740 0.2090 0.2380 0.282070 0.1300 0.1650 0.2000 0.2400 0.2720 0.3230
Duration ofService
Termination with Refund
Entry Age
20 25 30 35 40 450 0.1742 0.1674 0.1606 0.1537 0.1468 0.14001 0.1545 0.1477 0.1409 0.1339 0.1271 0.12032 0.1348 0.1280 0.1212 0.1142 0.1074 0.10063 0.1151 0.1083 0.1015 0.0945 0.0877 0.08094 0.0954 0.0886 0.0818 0.0748 0.0680 0.06125 0.0212 0.0193 0.0174 0.0155 0.0136 0.011610 0.0138 0.0121 0.0104 0.0088 0.0071 0.005515 0.0060 0.0051 0.0042 0.0032 0.0023 0.001420 0.0037 0.0029 0.0021 0.0013 0.0005 0.000125 0.0017 0.0011 0.0005 0.0001 0.0001 0.000130 0.0005 0.0001 0.0001 0.0001 0.0001 0.0001
Appendix A - Statement of Actuarial Methods and Assumptions (continued)
CalPERS 1959 Survivor Benefit Program Actuarial Valuation - June 30, 2016 | Appendix A | 24
Item 3f, Attachment 2 Page 26 of 36

ADDITIONAL ACTUARIAL ASSUMPTIONS APPLICABLE TO THE PUBLIC AGENCY INDEXED LEVEL (CONTINUED)
Public Agency Miscellaneous 2% @ 55 (continued)
Termination with Vested Deferred BenefitsRates vary by entry age and sex. See sample rates in table below.
Public Agency Police 2% @ 50Non-Industrial (Not Job-Related) Death and Non-Industrial (Not Job-Related) DisabilityRates vary by age and sex. See sample rates in table below.
Industrial (Job-Related) Death and Industrial (Job-Related) DisabilityRates vary by age and sex. See sample rates in table below.
Duration ofService
Termination with Vested Deferred Benefits
Entry Age
20 25 30 35 405 0.0656 0.0597 0.0537 0.0477 0.041810 0.0530 0.0466 0.0403 0.0339 0.000015 0.0443 0.0373 0.0305 0.0000 0.000020 0.0333 0.0261 0.0000 0.0000 0.000025 0.0212 0.0000 0.0000 0.0000 0.000030 0.0000 0.0000 0.0000 0.0000 0.0000
Attained Age
Industrial (Job-Related)
Male Female
Death Disability Death Disability20 0.00003 0.00000 0.00003 0.0000025 0.00007 0.00165 0.00007 0.0016530 0.00010 0.00476 0.00010 0.0047635 0.00012 0.00788 0.00012 0.0078840 0.00013 0.01100 0.00013 0.0110045 0.00014 0.01412 0.00014 0.0141250 0.00015 0.01846 0.00015 0.0184655 0.00016 0.04785 0.00016 0.0478560 0.00017 0.06024 0.00017 0.06024
Attained Age
Non-Industrial (Not Job-Related)
Male Female
Death Disability Death Disability20 0.00031 0.00010 0.00020 0.0001025 0.00040 0.00010 0.00023 0.0001030 0.00049 0.00020 0.00025 0.0002035 0.00057 0.00030 0.00035 0.0003040 0.00075 0.00040 0.00050 0.0004045 0.00106 0.00050 0.00071 0.0005050 0.00155 0.00080 0.00100 0.0008055 0.00228 0.00130 0.00138 0.0013060 0.00308 0.00200 0.00182 0.00200
Appendix A - Statement of Actuarial Methods and Assumptions (continued)
25 | Appendix A | CalPERS 1959 Survivor Benefit Program Actuarial Valuation - June 30, 2016
Item 3f, Attachment 2 Page 27 of 36

ADDITIONAL ACTUARIAL ASSUMPTIONS APPLICABLE TO THE PUBLIC AGENCY INDEXED LEVEL (CONTINUED)
Public Agency Police 2% @ 50 (continued)
Service RetirementRates vary by age and sex. See sample rates in table below.
Termination with RefundRates vary by entry age and sex. See sample rates in table below.
Age
Service Retirement
Duration of Service
5 Years 10 Years 15 Years 20 Years 25 Years 30 Years50 0.0050 0.0050 0.0050 0.0050 0.0170 0.089051 0.0050 0.0050 0.0050 0.0050 0.0170 0.087052 0.0180 0.0180 0.0180 0.0180 0.0420 0.132053 0.0440 0.0440 0.0440 0.0440 0.0900 0.217054 0.0650 0.0650 0.0650 0.0650 0.1260 0.283055 0.0860 0.0860 0.0860 0.0860 0.1660 0.354056 0.0670 0.0670 0.0670 0.0670 0.1300 0.289057 0.0660 0.0660 0.0660 0.0660 0.1290 0.288058 0.0660 0.0660 0.0660 0.0660 0.1290 0.288059 0.1390 0.1390 0.1390 0.1390 0.1760 0.312060 0.1230 0.1230 0.1230 0.1230 0.1530 0.278061 0.1100 0.1100 0.1100 0.1100 0.1380 0.256062 0.1300 0.1300 0.1300 0.1300 0.1620 0.291063 0.1300 0.1300 0.1300 0.1300 0.1620 0.291064 0.1300 0.1300 0.1300 0.1300 0.1620 0.291065 1.0000 1.0000 1.0000 1.0000 1.0000 1.0000
Duration ofService
Termination with Refund
Entry Age
20 25 30 35 40 450 0.1013 0.1013 0.1013 0.1013 0.1013 0.10131 0.0636 0.0636 0.0636 0.0636 0.0636 0.06362 0.0271 0.0271 0.0271 0.0271 0.0271 0.02713 0.0258 0.0258 0.0258 0.0258 0.0258 0.02584 0.0245 0.0245 0.0245 0.0245 0.0245 0.02455 0.0086 0.0086 0.0086 0.0086 0.0086 0.008610 0.0053 0.0053 0.0053 0.0053 0.0053 0.005315 0.0027 0.0027 0.0027 0.0027 0.0027 0.002720 0.0017 0.0017 0.0017 0.0017 0.0017 0.001725 0.0012 0.0012 0.0012 0.0012 0.0012 0.001230 0.0009 0.0009 0.0009 0.0009 0.0009 0.0009
Appendix A - Statement of Actuarial Methods and Assumptions (continued)
CalPERS 1959 Survivor Benefit Program Actuarial Valuation - June 30, 2016 | Appendix A | 26
Item 3f, Attachment 2 Page 28 of 36

ADDITIONAL ACTUARIAL ASSUMPTIONS APPLICABLE TO THE PUBLIC AGENCY INDEXED LEVEL (CONTINUED)
Public Agency Police 2% @ 50 (continued)
Termination with Vested Deferred BenefitsRates vary by entry age and sex. See sample rates in table below.
Duration ofService
Termination with Vested Deferred Benefits
Entry Age
20 25 30 35 405 0.0163 0.0163 0.0163 0.0163 0.016310 0.0126 0.0126 0.0126 0.0126 0.000015 0.0082 0.0082 0.0082 0.0000 0.000020 0.0065 0.0065 0.0000 0.0000 0.000025 0.0058 0.0000 0.0000 0.0000 0.000030 0.0000 0.0000 0.0000 0.0000 0.0000
Appendix A - Statement of Actuarial Methods and Assumptions (continued)
27 | Appendix A | CalPERS 1959 Survivor Benefit Program Actuarial Valuation - June 30, 2016
Item 3f, Attachment 2 Page 29 of 36

Appendix BSummary of Principal Plan Provisions
CalPERS 1959 Survivor Benefit Program Actuarial Valuation - June 30, 2016 | Appendix B | 28
The 1959 Survivor program was designed to provide pre-retirement death benefits comparable to those provided by SocialSecurity, formally the Federal Old Age and Survivor Insurance (OASI) program, to CalPERS’ members not covered by SocialSecurity.
ELIGIBILITYThe benefit is available only to those members not covered by Social Security OASI benefits. For public agencies, this benefit isprovided by contract with CalPERS. Only those public agencies that contract for the 1st, 2nd, 3rd, 4th, or Indexed level of the programare eligible for the benefits valued in this report. Public Agency 1st and 2nd levels have been closed since January 1, 1994 and 3rd level has been closed since July 1, 2001. For State and Schools members, the 5th level benefit is provided by State statute tocertain groups of employees. Members who are eligible for the benefit are given a one-time option to join at the time of contract.Members hired subsequent to the time of contract are automatically enrolled in the program.
SPOUSAL OR DOMESTIC PARTNER BENEFITThe benefit is a monthly payment to eligible surviving spouses or domestic partners age 62 or older for Public Agency 1st, 2nd and3rd Levels and age 60 or older for all other levels. The benefit is also payable under these deferred ages for spouses or partnersthat have care of children under the age of 22. As an example, assume an agency contracts for the 3rd Level benefit and an activemember dies and leaves behind a 35 year old spouse and 2 children, ages 5 and 15. The following table describes how the benefitwould be paid over the course of time.
(1) At this time, the spouse would be 52 years old and would not receive any benefit until age 62.(2) Spouse would continue to receive this benefit until his/her death.
Event Monthly Benefit PaidMember Death $8401st Child Turns 22 $7002nd Child Turns 221 $0Spouse Turns 622 $350
CHILD BENEFITChildren are eligible if they are not married or in a registered domestic partnership and are under the age of 22 whether or not aspouse or domestic partner exists. For 3 or more children, the 3 survivor benefit is paid; for 2 children, the 2 survivor benefit is paidand so forth (see tables below). In all cases, unless a child is disabled, the benefit stops at age 22. If a child is disabled, the benefitis paid until the disability ceases.
PARENTAL BENEFITSIf there is no eligible spouse or domestic partner or children, parent(s) dependent for at least half of their support from thedeceased member may be eligible for benefits. The parent(s) must be over age 62 for Public Agency 1st, 2nd and 3rd Levels andover age 60 for all other levels.
Item 3f, Attachment 2 Page 30 of 36

MONTHLY BENEFIT AMOUNTSThe monthly benefit amount depends upon the coverage level within the program.
1st, 2nd and 3rd Level (For Members of Public Agencies who Contract)
4th Level and Indexed Level (For Members of Public Agencies who Contract) and 5th Level (State and School Members)
(1) These figures indicate calendar year benefit amounts for the Indexed Level in effect for calendar year 2017. Benefit amounts will increase by 2 percent each January 1.
1st Level 2nd Level 3rd LevelSpouse or Domestic Partner With Two or More Eligible Children; or Three or More Eligible Children $430 $538 $840Spouse with One Eligible Child; or Two Eligible Children Only $360 $450 $700One Eligible Child Only; or Spouse Age 62 or Older; or Eligible Dependent parents $180 $225 $350
4th LevelIndexed
Level
State andSchools5th Level
Spouse or Domestic Partner with Two or More Eligible Children; or Three or More Eligible Children $2,280 $2,100 1 $1,800Spouse with One Eligible Child; or Two Eligible Children Only $1,900 $1,400 1 $1,500One Eligible Child Only; or Spouse Age 60 or Older; or Eligible Dependent parents $950 $700 1 $750
Appendix B - Summary of Principal Plan Provisions (continued)
29 | Appendix B | CalPERS 1959 Survivor Benefit Program Actuarial Valuation - June 30, 2016
COMPARISON OF SOCIAL SECURITY AND CALPERS 1959 SURVIVOR BENEFITSThe following tables compare current Social Security survivor benefits with current benefit levels paid under the 1959 SurvivorProgram.
Social Security
Unlike the 1959 Survivor Benefit (with the exception of the Indexed level), federal Social Security benefits normally receive anautomatic cost-of-living adjustment every year. Also, unlike the 1959 Survivor Benefit, Social Security benefits are based on aworker’s actual earnings up to the maximum covered. The values shown assume death at age 45 (benefits slightly higher at lowerages, lower at higher ages), and steady earnings. “Low” is 2016 salary of $25,000, “Average” is $50,000, and “High” is $90,000.
CalPERS 1959 Survivor Benefit
(1) Amounts effective January 1, 2017
Survivor Group Low Average HighThree Survivors $1,544 $2,823 $4,009Two Survivors 1,542 2,316 3,436One Survivor 771 1,158 1,718
Survivor Group 1st Level 2nd Level 3rd Level 4th Level Indexed Level1State and Schools
5th LevelThree Survivors $430 $538 $840 $2,280 $2,100 $1,800Two Survivors 360 450 700 1,900 1,400 1,500One Survivors 180 225 350 950 700 750
SUMMARY OF PLAN CHANGESExisting public agency employers joining the Public Agency 4th or Indexed Level Pool during the 2017-18 Fiscal Year are requiredto pay only the Unfunded Liability based on their own membership (amortized over a period of five years) which exists at the timethey join plus the agency’s normal cost for all members at the new benefit level for the first five years. If they have excess assets,the excess assets will be amortized over five years and used to offset the agency’s normal cost for each year.
Item 3f, Attachment 2 Page 31 of 36

Appendix CDemographic and Experience Information
CalPERS 1959 Survivor Benefit Program Actuarial Valuation - June 30, 2016 | Appendix C | 30
CURRENT AND DEFERRED BENFICIARIES - ALL LEVELS OF THE 1959 SURVIVOR PROGRAM FORPUBLIC AGENCIES, STATE AND SCHOOLSCurrently, there are 4,172 cases where liability exists. These cases include widows or widowers in deferred status even thoughpresently there are no benefits being paid. There are 9 possible beneficiary combinations that can be associated with each case.The combinations presented below are given as of the date of the valuation, for all levels of the 1959 Survivor program.
(1) Percentages may not sum to 100% due to rounding.
Status Number PercentWidow Deferred 818 19.6%Widow Only Receiving 2,522 60.5%Widow With One Child 315 7.6%Widow With Two or More Children 273 6.5%One Child 158 3.8%Two Children 50 1.2%Three or More Children 20 0.5%One Parent 13 0.3%Two Parents 3 0.1%Totals 4,172 100.0%1
BENEFICIARY COMBINATIONS AT DATE OF DEATH - ALL LEVELS OF THE 1959 SURVIVOR PROGRAMFOR PUBLIC AGENCIES, STATE AND SCHOOLSThere exist 7,603 cases of death associated with the 1959 Survivor program since its inception where 1959 Survivor benefitsbecame payable. With this data, a historical account of each combination can be made. Further, probabilities can be approximatedwith respect to these combinations when a member dies. Below is a list of all combinations on record, numbers and associatedpercentages as of the time of death, for all levels of the 1959 Survivor program.
(1) Percentages may not sum to 100% due to rounding.
Status Number PercentWidow Deferred 2,180 28.7%Widow Only Receiving 1,072 14.1%Widow With One Child 1,261 16.6%Widow With Two or More Children 2,060 27.1%One Child 448 5.9%Two Children 334 4.4%Three or More Children 215 2.8%One Parent 27 0.4%Two Parents 6 0.1%Totals 7,603 100.0%1
Item 3f, Attachment 2 Page 32 of 36
Appendix D1959 Survivor Deaths Per Year
31 | Appendix D | CalPERS 1959 Survivor Benefit Program Actuarial Valuation- June 30, 2016
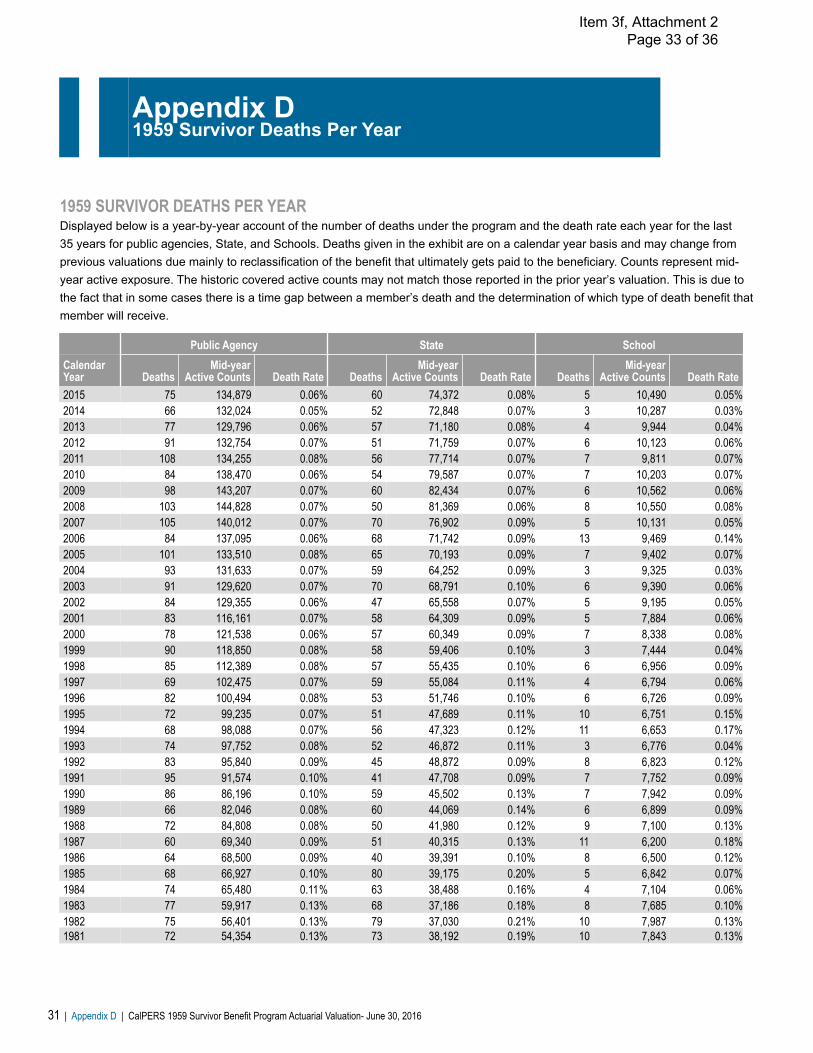
1959 SURVIVOR DEATHS PER YEARDisplayed below is a year-by-year account of the number of deaths under the program and the death rate each year for the last 35 years for public agencies, State, and Schools. Deaths given in the exhibit are on a calendar year basis and may change fromprevious valuations due mainly to reclassification of the benefit that ultimately gets paid to the beneficiary. Counts represent mid-year active exposure. The historic covered active counts may not match those reported in the prior year’s valuation. This is due tothe fact that in some cases there is a time gap between a member’s death and the determination of which type of death benefit thatmember will receive.
Public Agency State SchoolCalendarYear Deaths
Mid-yearActive Counts Death Rate Deaths
Mid-yearActive Counts Death Rate Deaths
Mid-yearActive Counts Death Rate
2015 75 134,879 0.06% 60 74,372 0.08% 5 10,490 0.05%2014 66 132,024 0.05% 52 72,848 0.07% 3 10,287 0.03%2013 77 129,796 0.06% 57 71,180 0.08% 4 9,944 0.04%2012 91 132,754 0.07% 51 71,759 0.07% 6 10,123 0.06%2011 108 134,255 0.08% 56 77,714 0.07% 7 9,811 0.07%2010 84 138,470 0.06% 54 79,587 0.07% 7 10,203 0.07%2009 98 143,207 0.07% 60 82,434 0.07% 6 10,562 0.06%2008 103 144,828 0.07% 50 81,369 0.06% 8 10,550 0.08%2007 105 140,012 0.07% 70 76,902 0.09% 5 10,131 0.05%2006 84 137,095 0.06% 68 71,742 0.09% 13 9,469 0.14%2005 101 133,510 0.08% 65 70,193 0.09% 7 9,402 0.07%2004 93 131,633 0.07% 59 64,252 0.09% 3 9,325 0.03%2003 91 129,620 0.07% 70 68,791 0.10% 6 9,390 0.06%2002 84 129,355 0.06% 47 65,558 0.07% 5 9,195 0.05%2001 83 116,161 0.07% 58 64,309 0.09% 5 7,884 0.06%2000 78 121,538 0.06% 57 60,349 0.09% 7 8,338 0.08%1999 90 118,850 0.08% 58 59,406 0.10% 3 7,444 0.04%1998 85 112,389 0.08% 57 55,435 0.10% 6 6,956 0.09%1997 69 102,475 0.07% 59 55,084 0.11% 4 6,794 0.06%1996 82 100,494 0.08% 53 51,746 0.10% 6 6,726 0.09%1995 72 99,235 0.07% 51 47,689 0.11% 10 6,751 0.15%1994 68 98,088 0.07% 56 47,323 0.12% 11 6,653 0.17%1993 74 97,752 0.08% 52 46,872 0.11% 3 6,776 0.04%1992 83 95,840 0.09% 45 48,872 0.09% 8 6,823 0.12%1991 95 91,574 0.10% 41 47,708 0.09% 7 7,752 0.09%1990 86 86,196 0.10% 59 45,502 0.13% 7 7,942 0.09%1989 66 82,046 0.08% 60 44,069 0.14% 6 6,899 0.09%1988 72 84,808 0.08% 50 41,980 0.12% 9 7,100 0.13%1987 60 69,340 0.09% 51 40,315 0.13% 11 6,200 0.18%1986 64 68,500 0.09% 40 39,391 0.10% 8 6,500 0.12%1985 68 66,927 0.10% 80 39,175 0.20% 5 6,842 0.07%1984 74 65,480 0.11% 63 38,488 0.16% 4 7,104 0.06%1983 77 59,917 0.13% 68 37,186 0.18% 8 7,685 0.10%1982 75 56,401 0.13% 79 37,030 0.21% 10 7,987 0.13%1981 72 54,354 0.13% 73 38,192 0.19% 10 7,843 0.13%
Item 3f, Attachment 2 Page 33 of 36

Appendix EGlossary of Actuarial Terms
Accrued Liability: (also called Actuarial Accrued Liability or Entry Age Normal Accrued Liability) The total dollars needed as of thevaluation date to fund all benefits earned in the past for current members.
Actuarial Assumptions: Assumptions made about certain events that will affect pension costs. Assumptions generally can bebroken down into two categories: demographic and economic. Demographic assumptions include such things as mortality,disability and retirement rates. Economic assumptions include discount rate, salary growth and inflation.
Actuarial Methods: Procedures employed by actuaries to achieve certain funding goals of a pension plan. Actuarial methodsinclude funding method, setting the length of time to fund the Accrued Liability and determining the Value of Assets.
Actuarial Valuation: The determination, as of a valuation date of the Normal Cost, Accrued Liability, and related actuarial presentvalues for a pension plan. These valuations are performed annually or when an employer is contemplating a change to their planprovisions.
Amortization Base: Separate payment schedules for different portions of the Unfunded Liability. The total Unfunded Liability ofa plan can be segregated by "cause,” creating “bases” and each such base will be separately amortized and paid for over aspecific period of time. However, all bases are amortized using investment assumptions from the current valuation. This can belikened to a home having a first mortgage of 24 years remaining payments and a second mortgage that has 10 years remainingpayments. Each base or each mortgage note has its own terms (payment period, principal, etc.)
Generally, in an actuarial valuation, the separate bases consist of changes in unfunded liability due to actuarial assumptionchanges, actuarial methodology changes, and/or experience gains and losses. Amortization methodology is determined by Boardpolicy.
Amortization Period: The number of years required to pay off an Amortization Base.
Entry Age Normal Cost Method: An actuarial cost method designed to fund a member's total plan benefit over the course of hisor her career. This method is designed to yield a rate expressed as a level percentage of payroll.
(The assumed retirement age less the entry age is the amount of time required to fund a member’s total benefit. Generally, theolder a member on the date of hire, the greater the entry age normal cost. This is mainly because there is less time to earninvestment income to fund the future benefits.)
Normal Cost: The portion of the actuarial present value of projected benefits that is allocated to a period, typically twelve months,under the actuarial cost method. The normal cost may include a provision for expenses.
Pension Actuary: A business professional that is authorized by the Society of Actuaries, and the American Academy of Actuariesto perform the calculations necessary to properly fund a pension plan.
Present Value of Benefits (PVB): The total dollars needed as of the valuation date to fund all benefits earned in the past orexpected to be earned in the future for current members.
Term Insurance Method: An actuarial cost method designed such that contributions are made to the plan to meet benefitpayments expected to fall due within the year for which the contribution is made.
CalPERS 1959 Survivor Benefit Program Actuarial Valuation - June 30, 2016 | Appendix E | 32
Item 3f, Attachment 2 Page 34 of 36

Unfunded Liability (UAL): When a plan or pool’s Value of Assets is less than its Accrued Liability, the difference is the plan orpool’s Unfunded Liability. If the Unfunded Liability is positive, the plan or pool will have to pay contributions exceeding theNormal Cost.
Appendix E - Glossary of Actuarial Terms (Continued)
33 | Appendix E | CalPERS 1959 Survivor Benefit Program Actuarial Valuation - June 30, 2016
Item 3f, Attachment 2 Page 35 of 36

Actuarial OfficeP.O. Box 942709
Sacramento, CA 94229-2709TTY - (877) 249-7442
(888) 225-7377FAX (916) 795-2744
Available online at www.calpers.ca.gov
California Public Employees' Retirement SystemA Component Unit of the State of California
Item 3f, Attachment 2 Page 36 of 36
Related Documents