1/9/2018 Thinking Mathematically, Sixth Edition https://media.pearsoncmg.com/cmg/pmmg_mml_shared/mathstats_html_ebooks/BlitzerThinkM6/page_433.html 1/2 7 Algebra: Graphs, Functions and Linear Systems > 7.3 Systems of Linear Equations in Two Variables 7.3 Systems of Linear Equations in Two Variables What am I Supposed to Learn? After you have read this section, you should be able to: 1 Decide whether an ordered pair is a solution of a linear system. 2 Solve linear systems by graphing. 3 Solve linear systems by substitution. 4 Solve linear systems by addition. 5 Identify systems that do not have exactly one ordered-pair solution. 6 Solve problems using systems of linear equations. RESEARCHERS IDENTIFIED COLLEGE STUDENTS WHO generally were procrastinators or nonprocrastinators. The students were asked to report throughout the semester how many symptoms of physical illness they had experienced. Figure 7.27 shows that by late in the semester, all students experienced increases in symptoms. Early in the semester, procrastinators reported fewer symptoms, but late in the semester, as work came due, they reported more symptoms than their nonprocrastinating peers. The data in Figure 7.27 can be analyzed using a pair of linear models in two variables. The figure shows that by week 6, both groups reported the same number of symptoms of illness, an average of approximately 3.5 symptoms per group. In this section, you will learn two algebraic methods, called substitution and addition, that will reinforce this graphic observation, verifying (6, 3.5) as the point of intersection. d FIGURE 7.27 Source: Richard Gerrig, Psychology and Life, 20th Edition. Pearson, 2013. Systems of Linear Equations and Their Solutions 1 Decide whether an ordered pair is a solution of a linear system. We have seen that all equations in the form A and B not both zero, are straight lines when graphed. Two such equations are called a system of linear equations or a linear system. A solution to a system of linear equations in two variables is an ordered pair that satisfies both equations in the system. For example, satisfies the system Skip Directly to Table of Contents | Skip Directly to Main Content Change text size Show/Hide TOC Page

Welcome message from author
This document is posted to help you gain knowledge. Please leave a comment to let me know what you think about it! Share it to your friends and learn new things together.
Transcript
1/9/2018 Thinking Mathematically, Sixth Edition
https://media.pearsoncmg.com/cmg/pmmg_mml_shared/mathstats_html_ebooks/BlitzerThinkM6/page_433.html 1/2
7 Algebra: Graphs, Functions and Linear Systems > 7.3 Systems of Linear Equations in Two Variables
7.3 Systems of Linear Equations in Two Variables
What am I Supposed to Learn?After you have read this section, you should be able to:
1 Decide whether an ordered pair is a solution of a linear system.
2 Solve linear systems by graphing.
3 Solve linear systems by substitution.
4 Solve linear systems by addition.
5 Identify systems that do not have exactly one ordered-pair solution.
6 Solve problems using systems of linear equations.
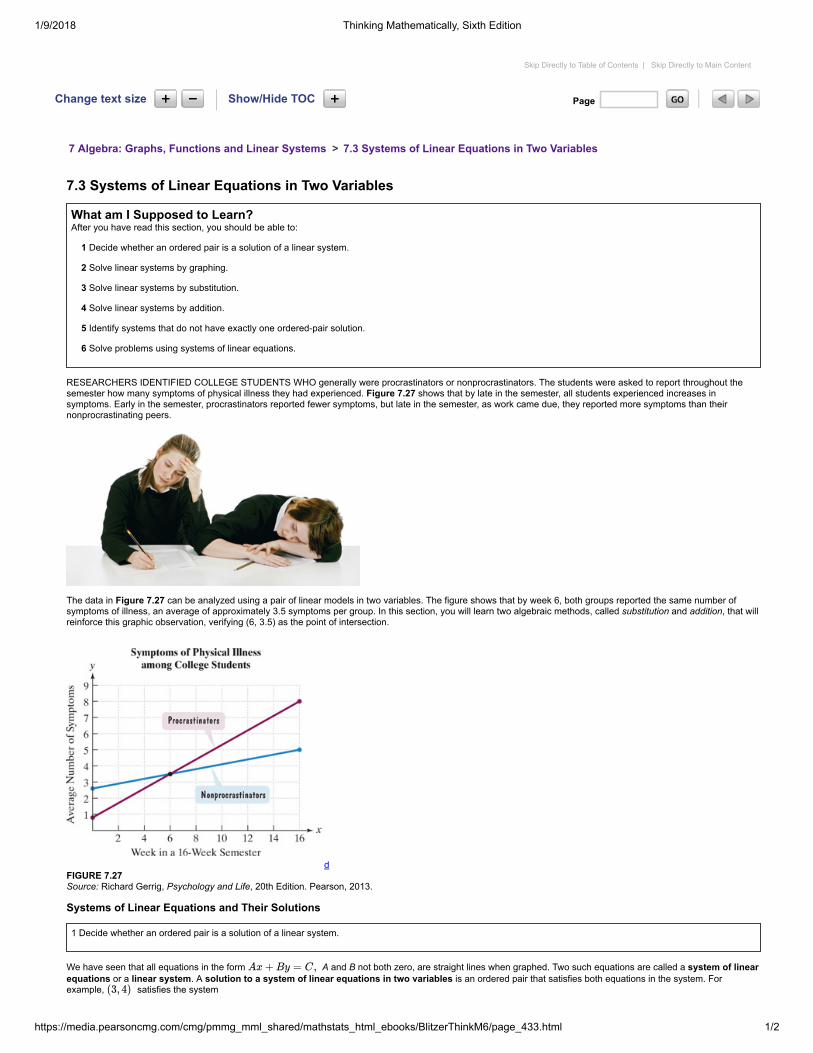
RESEARCHERS IDENTIFIED COLLEGE STUDENTS WHO generally were procrastinators or nonprocrastinators. The students were asked to report throughout thesemester how many symptoms of physical illness they had experienced. Figure 7.27 shows that by late in the semester, all students experienced increases insymptoms. Early in the semester, procrastinators reported fewer symptoms, but late in the semester, as work came due, they reported more symptoms than theirnonprocrastinating peers.
The data in Figure 7.27 can be analyzed using a pair of linear models in two variables. The figure shows that by week 6, both groups reported the same number ofsymptoms of illness, an average of approximately 3.5 symptoms per group. In this section, you will learn two algebraic methods, called substitution and addition, that willreinforce this graphic observation, verifying (6, 3.5) as the point of intersection.
dFIGURE 7.27 Source: Richard Gerrig, Psychology and Life, 20th Edition. Pearson, 2013.
Systems of Linear Equations and Their Solutions
1 Decide whether an ordered pair is a solution of a linear system.
We have seen that all equations in the form A and B not both zero, are straight lines when graphed. Two such equations are called a system of linearequations or a linear system. A solution to a system of linear equations in two variables is an ordered pair that satisfies both equations in the system. Forexample, satisfies the system
Skip Directly to Table of Contents | Skip Directly to Main Content
Change text size Show/Hide TOC Page
Ax + By = C,
(3, 4)

1/9/2018 Thinking Mathematically, Sixth Edition
https://media.pearsoncmg.com/cmg/pmmg_mml_shared/mathstats_html_ebooks/BlitzerThinkM6/page_433.html 2/2
Page 433
Thus, satisfies both equations and is a solution of the system. The solution can be described by saying that and The solution can also bedescribed using set notation. The solution set of the system is —that is, the set consisting of the ordered pair
A system of linear equations can have exactly one solution, no solution, or infinitely many solutions. We begin with systems having exactly one solution.
Example 1 Determining Whether an Ordered Pair Is a Solution of a SystemDetermine whether is a solution of the system:
Copyright 2018 © Pearson Education, Inc. or its affiliate(s). All rights reserved. Privacy Policy | Terms of Use | Rights and Permissions
{x + y =
x − y =
7
−1.
(3 + 4 is, indeed, 7.)
(3 − 4 is, indeed, − 1. )
(3, 4) x = 3 y = 4.{(3, 4)} (3, 4).
(1, 2)
{2x − 3y =
2x + y =
−4
4.

1/9/2018 Thinking Mathematically, Sixth Edition
https://media.pearsoncmg.com/cmg/pmmg_mml_shared/mathstats_html_ebooks/BlitzerThinkM6/page_434.html 1/2
7 Algebra: Graphs, Functions and Linear Systems > 7.3 Systems of Linear Equations in Two Variables > Solving Linear Systemsby Graphing
SOLUTION
Because 1 is the x-coordinate and 2 is the y-coordinate of we replace x with 1 and y with 2.
The pair satisfies both equations: It makes each equation true. Thus, the pair is a solution of the system.
Check Point 1Determine whether is a solution of the system:
Solving Linear Systems by Graphing
2 Solve linear systems by graphing.
The solution to a system of linear equations can be found by graphing both of the equations in the same rectangular coordinate system. For a system with one solution,the coordinates of the point of intersection of the lines is the system's solution.
Example 2 Solving a Linear System by GraphingSolve by graphing:
SOLUTION
We find the solution by graphing both and in the same rectangular coordinate system. We will use intercepts to graph each equation.
The line passes through The line passes through We graph as a blue line in Figure 7.28.
dFIGURE 7.28 Visualizing a system's solution
Skip Directly to Table of Contents | Skip Directly to Main Content
Change text size Show/Hide TOC Page
(1, 2),
2x − 3y =
2(1) − 3(2) =?
2 − 6 =?
−4 =
−4
−4
−4
−4,
true
2x + y =
2(1) + 2 =?
2 + 2 =?
4 =
4
4
4
4,
true
(1, 2)
(−4, 3)
{x + 2y = 2
x − 2y = 6.
{x + 2y = 2
x − 2y = 6.
x + 2y = 2 x − 2y = 6
x + 2y = 2
x-intercept: Set y = 0.
x + 2 ⋅ 0 = 2
x = 2
y-intercept: Set x = 0.
0 + 2y = 2
2y = 2
y = 1(2, 0). (0, 1).
x + 2y = 2

1/9/2018 Thinking Mathematically, Sixth Edition
https://media.pearsoncmg.com/cmg/pmmg_mml_shared/mathstats_html_ebooks/BlitzerThinkM6/page_434.html 2/2
Page 434
The line passes through The line passes through We graph as a red line in Figure 7.28.
The system is graphed in Figure 7.28. To ensure that the graph is accurate, check the coordinates of the intersection point, in both equations.
Copyright 2018 © Pearson Education, Inc. or its affiliate(s). All rights reserved. Privacy Policy | Terms of Use | Rights and Permissions
x − 2y = 6
x-intercept: Set y = 0.
x − 2 ⋅ 0 = 6
x = 6
y-intercept: Set x = 0.
0 − 2y = 6
−2y = 6
y = −3
(6, 0). (0,−3).
x − 2y = 6
(4,−1),
1/9/2018 Thinking Mathematically, Sixth Edition
https://media.pearsoncmg.com/cmg/pmmg_mml_shared/mathstats_html_ebooks/BlitzerThinkM6/page_435.html 1/2
7 Algebra: Graphs, Functions and Linear Systems > 7.3 Systems of Linear Equations in Two Variables > Solving Linear Systemsby the Substitution Method
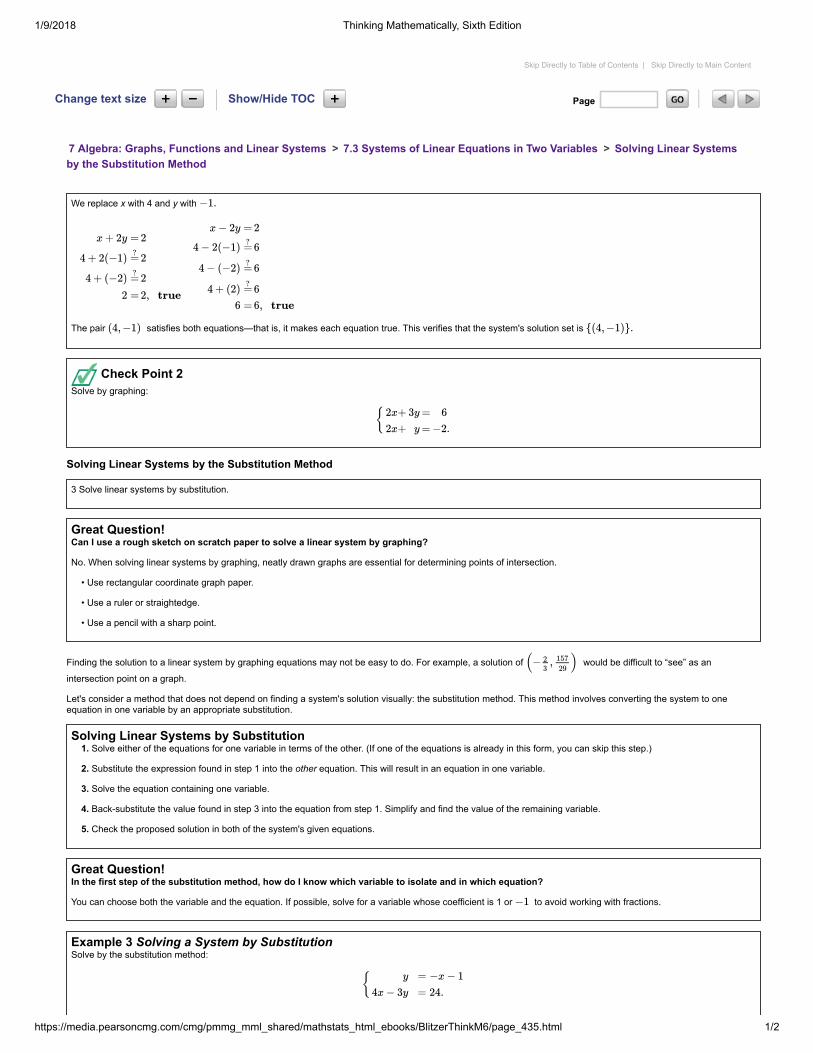
We replace x with 4 and y with
The pair satisfies both equations—that is, it makes each equation true. This verifies that the system's solution set is
Check Point 2Solve by graphing:
Solving Linear Systems by the Substitution Method
3 Solve linear systems by substitution.
Great Question!Can I use a rough sketch on scratch paper to solve a linear system by graphing?
No. When solving linear systems by graphing, neatly drawn graphs are essential for determining points of intersection.
• Use rectangular coordinate graph paper.
• Use a ruler or straightedge.
• Use a pencil with a sharp point.
Finding the solution to a linear system by graphing equations may not be easy to do. For example, a solution of would be difficult to “see” as an
intersection point on a graph.
Let's consider a method that does not depend on finding a system's solution visually: the substitution method. This method involves converting the system to oneequation in one variable by an appropriate substitution.
Solving Linear Systems by Substitution1. Solve either of the equations for one variable in terms of the other. (If one of the equations is already in this form, you can skip this step.)
2. Substitute the expression found in step 1 into the other equation. This will result in an equation in one variable.
3. Solve the equation containing one variable.
4. Back-substitute the value found in step 3 into the equation from step 1. Simplify and find the value of the remaining variable.
5. Check the proposed solution in both of the system's given equations.
Great Question!In the first step of the substitution method, how do I know which variable to isolate and in which equation?
You can choose both the variable and the equation. If possible, solve for a variable whose coefficient is 1 or to avoid working with fractions.
Example 3 Solving a System by SubstitutionSolve by the substitution method:
Skip Directly to Table of Contents | Skip Directly to Main Content
Change text size Show/Hide TOC Page
−1.
x + 2y =
4+ 2(−1) =?
4 + (−2) =?
2 =
2
2
2
2,
true
x − 2y =
4− 2(−1) =?
4 − (−2) =?
4 + (2) =?
6 =
2
6
6
6
6,
true
(4,−1) {(4,−1)}.
{ 2x+
2x+
3y
y
=
=
6
−2.
(− , )23
157
29
−1
{ y
4x − 3y
= −x − 1
= 24.

1/9/2018 Thinking Mathematically, Sixth Edition
https://media.pearsoncmg.com/cmg/pmmg_mml_shared/mathstats_html_ebooks/BlitzerThinkM6/page_435.html 2/2
Page 435
SOLUTION
Step 1 Solve either of the equations for one variable in terms of the other. This step has already been done for us. The first equation, is solvedfor y in terms of x.
Step 2 Substitute the expression from step 1 into the other equation. We substitute the expression for y into the other equation:
This gives us an equation in one variable, namely
The variable y has been eliminated.
Copyright 2018 © Pearson Education, Inc. or its affiliate(s). All rights reserved. Privacy Policy | Terms of Use | Rights and Permissions
y = −x − 1,
−x − 1
┌ ┐−−−−−−−−−−−
y = 4x − 3 = 24−x − 1 y Substitute − x − 1 for y.
4x − 3(−x − 1) = 24.

1/9/2018 Thinking Mathematically, Sixth Edition
https://media.pearsoncmg.com/cmg/pmmg_mml_shared/mathstats_html_ebooks/BlitzerThinkM6/page_436.html 1/2
7 Algebra: Graphs, Functions and Linear Systems > 7.3 Systems of Linear Equations in Two Variables > Solving Linear Systemsby the Substitution Method
Step 3 Solve the resulting equation containing one variable.
Step 4 Back-substitute the obtained value into the equation from step 1. We now know that the x-coordinate of the solution is 3. To find the y-coordinate, weback-substitute the x-value into the equation from step 1.
With and the proposed solution is
Step 5 Check. Check the proposed solution, in both of the system's given equations. Replace x with 3 and y with
The pair satisfies both equations. The system's solution set is
TechnologyA graphing calculator can be used to solve the system in Example 3. Graph each equation and use the intersection feature. The calculator displays the solution
as
Check Point 3Solve by the substitution method:
Example 4 Solving a System by SubstitutionSolve by the substitution method:
SOLUTION
Skip Directly to Table of Contents | Skip Directly to Main Content
Change text size Show/Hide TOC Page
4x − 3(−x − 1) = 24
4x + 3x + 3 = 24
7x + 3 = 24
7x = 21
x = 3
This is the equation containing one variable.
Apply the distributive property.
Combine like terms.
Subtract 3 from both sides.
Divide both sides by 7.
y = −x − 1
▲
Substitute 3 for x.
▼
y = −3− 1
y = −4
This is the equation from step 1.
Simplify.
x = 3 y = −4, (3,−4).
(3,−4) −4.
y =
−4 =?
−4 =
−x − 1
−3 − 1
−4,
true
4x − 3y =
4(3) − 3(−4) =?
12 + 12 =?
24 =
24
24
24
24,
true
(3,−4) {(3,−4)}.
(3,−4)
x = 3,y = −4.
{ y =
5x − 2y =
3x − 7
8.
{5x − 4y =
x − 2y =
9
−3.

1/9/2018 Thinking Mathematically, Sixth Edition
https://media.pearsoncmg.com/cmg/pmmg_mml_shared/mathstats_html_ebooks/BlitzerThinkM6/page_436.html 2/2
Page 436
Step 1 Solve either of the equations for one variable in terms of the other. We begin by isolating one of the variables in either of the equations. By solving for xin the second equation, which has a coefficient of 1, we can avoid fractions.
Step 2 Substitute the expression from step 1 into the other equation. We substitute for x in the first equation.
Copyright 2018 © Pearson Education, Inc. or its affiliate(s). All rights reserved. Privacy Policy | Terms of Use | Rights and Permissions
x − 2y =
x =
−3
2y − 3
This is the second equation in the given system.
Solve for x by adding 2y to both sides.
2y − 3
┌ ┐−−−−−−
x = 5 − 4y = 92y − 3 x
1/9/2018 Thinking Mathematically, Sixth Edition
https://media.pearsoncmg.com/cmg/pmmg_mml_shared/mathstats_html_ebooks/BlitzerThinkM6/page_437.html 1/2
7 Algebra: Graphs, Functions and Linear Systems > 7.3 Systems of Linear Equations in Two Variables > Solving Linear Systemsby the Addition Method
Substituting for x in gives us an equation in one variable, namely
The variable x has been eliminated.
Step 3 Solve the resulting equation containing one variable.
Step 4 Back-substitute the obtained value into the equation from step 1. Now that we have the y-coordinate of the solution, we back-substitute 4 for y in theequation
With and the proposed solution is
Step 5 Check. Take a moment to show that satisfies both given equations, and The solution set is
Great Question!If my solution satisfies one of the equations in the system, do I have to check the solution in the other equation?
Get into the habit of checking ordered-pair solutions in both equations of the system.
Check Point 4Solve by the substitution method:
Solving Linear Systems by the Addition Method
4 Solve linear systems by addition.
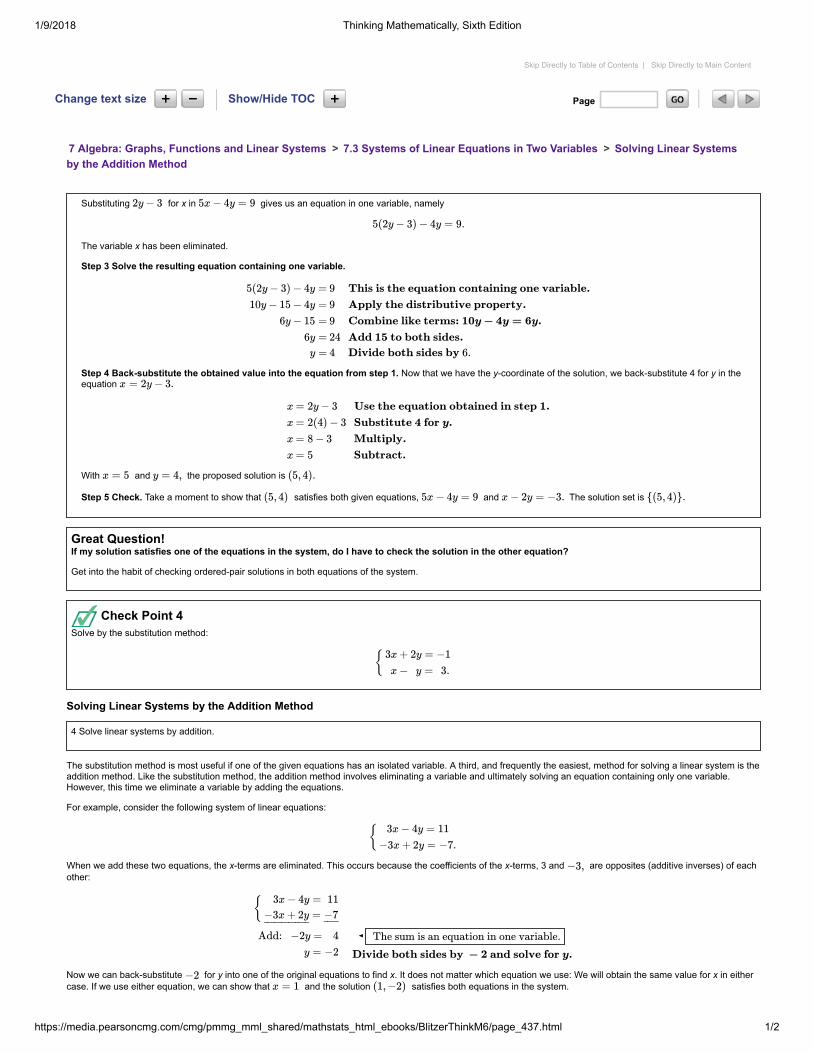
The substitution method is most useful if one of the given equations has an isolated variable. A third, and frequently the easiest, method for solving a linear system is theaddition method. Like the substitution method, the addition method involves eliminating a variable and ultimately solving an equation containing only one variable.However, this time we eliminate a variable by adding the equations.
For example, consider the following system of linear equations:
When we add these two equations, the x-terms are eliminated. This occurs because the coefficients of the x-terms, 3 and are opposites (additive inverses) of eachother:
Now we can back-substitute for y into one of the original equations to find x. It does not matter which equation we use: We will obtain the same value for x in eithercase. If we use either equation, we can show that and the solution satisfies both equations in the system.
Skip Directly to Table of Contents | Skip Directly to Main Content
Change text size Show/Hide TOC Page
2y − 3 5x − 4y = 9
5(2y − 3) − 4y = 9.
5(2y − 3) − 4y =
10y − 15 − 4y =
6y − 15 =
6y =
y =
9
9
9
24
4
This is the equation containing one variable.
Apply the distributive property.
Combine like terms: 10y − 4y = 6y.
Add 15 to both sides.
Divide both sides by 6.
x = 2y − 3.
x
x
x
x
= 2y − 3
= 2(4) − 3
= 8 − 3
= 5
Use the equation obtained in step 1.
Substitute 4 for y.
Multiply.
Subtract.
x = 5 y = 4, (5, 4).
(5, 4) 5x − 4y = 9 x − 2y = −3. {(5, 4)}.
{ 3x + 2y = −1
x − y = 3.
{ 3x − 4y = 11
−3x + 2y = −7.
−3,
{ 3x − 4y = 11
=−3x + 2y
¯ ¯¯̄ ¯̄ ¯̄ ¯̄ ¯̄ ¯−7¯ ¯¯̄
Add:
−2y = 4
y = −2
◄ The sum is an equation in one variable.
Divide both sides by − 2 and solve for y.
−2x = 1 (1, −2)

1/9/2018 Thinking Mathematically, Sixth Edition
https://media.pearsoncmg.com/cmg/pmmg_mml_shared/mathstats_html_ebooks/BlitzerThinkM6/page_437.html 2/2
Page 437
Copyright 2018 © Pearson Education, Inc. or its affiliate(s). All rights reserved. Privacy Policy | Terms of Use | Rights and Permissions
1/9/2018 Thinking Mathematically, Sixth Edition
https://media.pearsoncmg.com/cmg/pmmg_mml_shared/mathstats_html_ebooks/BlitzerThinkM6/page_438.html 1/2
Page 438
7 Algebra: Graphs, Functions and Linear Systems > 7.3 Systems of Linear Equations in Two Variables > Solving Linear Systemsby the Addition Method
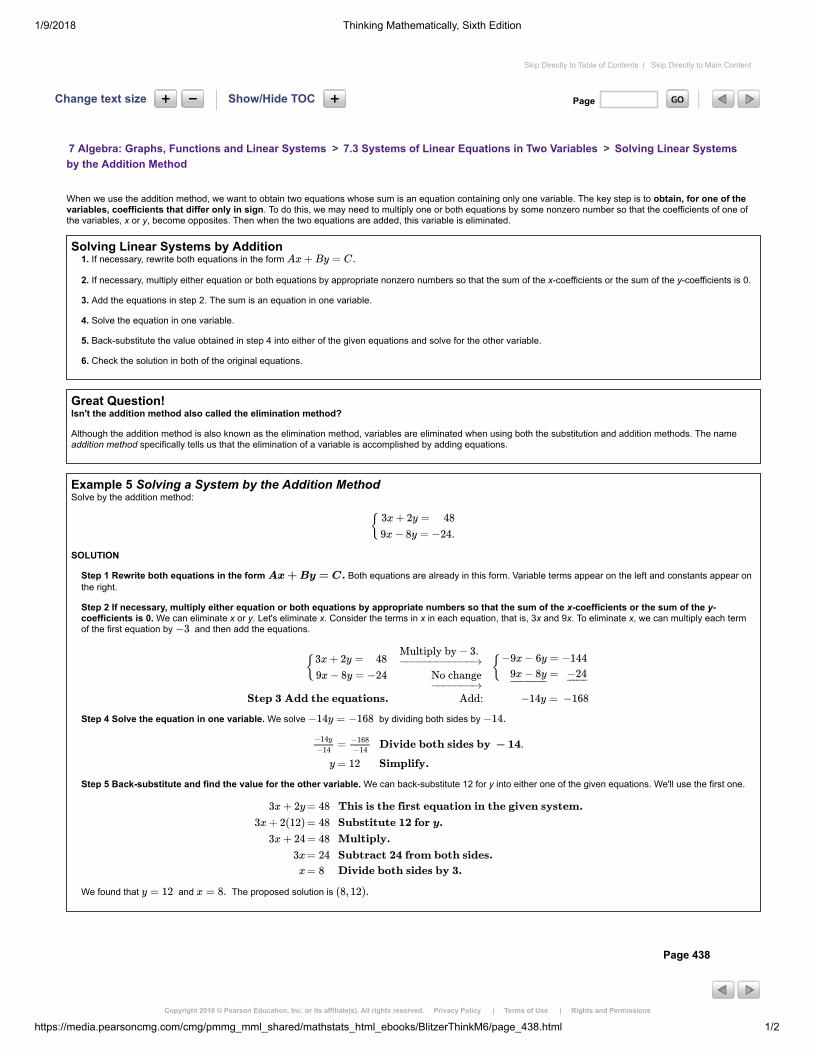
When we use the addition method, we want to obtain two equations whose sum is an equation containing only one variable. The key step is to obtain, for one of thevariables, coefficients that differ only in sign. To do this, we may need to multiply one or both equations by some nonzero number so that the coefficients of one ofthe variables, x or y, become opposites. Then when the two equations are added, this variable is eliminated.
Solving Linear Systems by Addition1. If necessary, rewrite both equations in the form
2. If necessary, multiply either equation or both equations by appropriate nonzero numbers so that the sum of the x-coefficients or the sum of the y-coefficients is 0.
3. Add the equations in step 2. The sum is an equation in one variable.
4. Solve the equation in one variable.
5. Back-substitute the value obtained in step 4 into either of the given equations and solve for the other variable.
6. Check the solution in both of the original equations.
Great Question!Isn't the addition method also called the elimination method?
Although the addition method is also known as the elimination method, variables are eliminated when using both the substitution and addition methods. The nameaddition method specifically tells us that the elimination of a variable is accomplished by adding equations.
Example 5 Solving a System by the Addition MethodSolve by the addition method:
SOLUTION
Step 1 Rewrite both equations in the form Both equations are already in this form. Variable terms appear on the left and constants appear onthe right.
Step 2 If necessary, multiply either equation or both equations by appropriate numbers so that the sum of the x-coefficients or the sum of the y-coefficients is 0. We can eliminate x or y. Let's eliminate x. Consider the terms in x in each equation, that is, 3x and 9x. To eliminate x, we can multiply each termof the first equation by and then add the equations.
Step 4 Solve the equation in one variable. We solve by dividing both sides by
Step 5 Back-substitute and find the value for the other variable. We can back-substitute 12 for y into either one of the given equations. We'll use the first one.
We found that and The proposed solution is
Copyright 2018 © Pearson Education, Inc. or its affiliate(s). All rights reserved. Privacy Policy | Terms of Use | Rights and Permissions
Skip Directly to Table of Contents | Skip Directly to Main Content
Change text size Show/Hide TOC Page
Ax + By = C.
{ 3x + 2y = 48
9x − 8y = −24.
Ax + By = C.
−3
{3x + 2y = 48
9x − 8y = −24
Step 3 Add the equations.
Multiply by − 3. − →−−−−−−−−−−−
No change− →−−−−−−
Add:
{−9x − 6y = −144
=9x − 8y¯ ¯¯̄¯̄ ¯̄¯̄ ¯
−24¯ ¯¯̄¯̄
−14y = −168
−14y = −168 −14.
−14y
−14
y
= −168
−14
= 12
Divide both sides by − 14.
Simplify.
3x + 2y
3x + 2(12)
3x + 24
3x
x
= 48
= 48
= 48
= 24
= 8
This is the first equation in the given system.
Substitute 12 for y.
Multiply.
Subtract 24 from both sides.
Divide both sides by 3.
y = 12 x = 8. (8, 12).

1/9/2018 Thinking Mathematically, Sixth Edition
https://media.pearsoncmg.com/cmg/pmmg_mml_shared/mathstats_html_ebooks/BlitzerThinkM6/page_438.html 2/2

1/9/2018 Thinking Mathematically, Sixth Edition
https://media.pearsoncmg.com/cmg/pmmg_mml_shared/mathstats_html_ebooks/BlitzerThinkM6/page_439.html 1/2
Page 439
7 Algebra: Graphs, Functions and Linear Systems > 7.3 Systems of Linear Equations in Two Variables > Solving Linear Systemsby the Addition Method
Step 6 Check. Take a few minutes to show that satisfies both of the original equations in the system. The solution set is
Check Point 5Solve by the addition method:
Example 6 Solving a System by the Addition MethodSolve by the addition method:
SOLUTION
Step 1 Rewrite both equations in the form We first arrange the system so that variable terms appear on the left and constants appear on theright. We obtain
Step 2 If necessary, multiply either equation or both equations by appropriate numbers so that the sum of the x-coefficients or the sum of the y-coefficients is 0. We can eliminate x or y. Let's eliminate y by multiplying the first equation by 3 and the second equation by
Step 4 Solve the equation in one variable. We solve by dividing both side by 17.
Step 5 Back-substitute and find the value for the other variable. We can back-substitute for x into either one of the given equations. We'll use the secondone.
With and the proposed solution is
Step 6 Check. Take a moment to show that satisfies both given equations. The solution is and the solution set is
Check Point 6Solve by the addition method:
Skip Directly to Table of Contents | Skip Directly to Main Content
Change text size Show/Hide TOC Page
(8, 12) {(8, 12)}.
{4x + 5y = 3
2x − 3y = 7.
{7x = 5 − 2y
3y = 16 − 2x.
Ax + By = C.
{7x + 2y =
2x − 3y =
5
16
Add 2y to both sides of the first equation.
Add 2x to both sides of the second equation.
−2.
{7x + 2y =
2x + 3y =
5
16
Step 3 Add the equations.
Multiply by 3. − →−−−−−−−−−−
Multiply by − 2.− →−−−−−−−−−−−
Add:
{ 21x + 6y =
=−4x − 6y
¯ ¯¯̄ ¯̄ ¯̄ ¯̄ ¯̄ ¯
15
−32¯ ¯¯̄¯̄
17x + 0y =
17x =
−17
−17
17x = −17
=17x
17
x =
−17
17
−1
Divide both sides by 17.
Simplify.
−1
3y
3y
3y
3y
y
= 16 − 2x
= 16 − 2(−1)
= 16 + 2
= 18
= 6
This is the second equation in the given system.
Substitute − 1 for x.
Multiply.
Add.
Divide both sides by 3.
x = −1 y = 6, (−1, 6).
(−1, 6) (−1, 6) {(−1, 6)}.
{3x = 2 − 4y
5y = −1 − 2x.

1/9/2018 Thinking Mathematically, Sixth Edition
https://media.pearsoncmg.com/cmg/pmmg_mml_shared/mathstats_html_ebooks/BlitzerThinkM6/page_439.html 2/2
Copyright 2018 © Pearson Education, Inc. or its affiliate(s). All rights reserved. Privacy Policy | Terms of Use | Rights and Permissions
1/9/2018 Thinking Mathematically, Sixth Edition
https://media.pearsoncmg.com/cmg/pmmg_mml_shared/mathstats_html_ebooks/BlitzerThinkM6/page_440.html 1/2
7 Algebra: Graphs, Functions and Linear Systems > 7.3 Systems of Linear Equations in Two Variables > Linear Systems HavingNo Solution or Infinitely Many Solutions
Linear Systems Having No Solution or Infinitely Many Solutions
5 Identify systems that do not have exactly one ordered-pair solution.
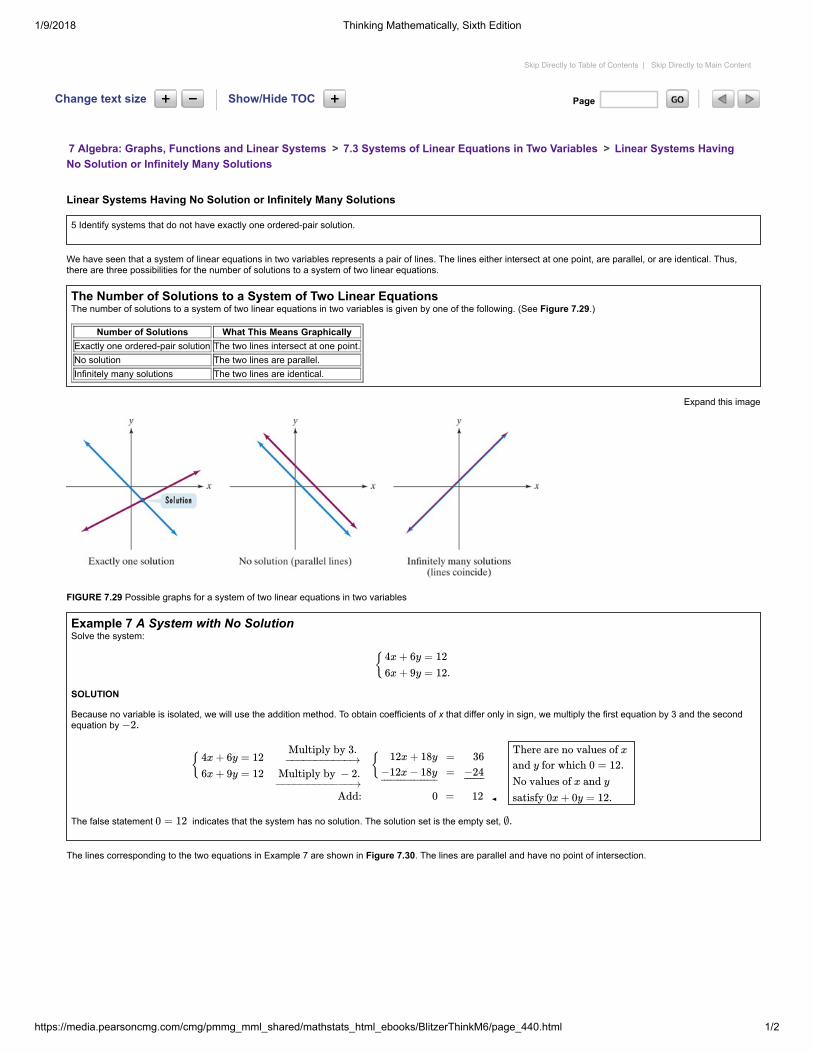
We have seen that a system of linear equations in two variables represents a pair of lines. The lines either intersect at one point, are parallel, or are identical. Thus,there are three possibilities for the number of solutions to a system of two linear equations.
The Number of Solutions to a System of Two Linear EquationsThe number of solutions to a system of two linear equations in two variables is given by one of the following. (See Figure 7.29.)
Number of Solutions What This Means GraphicallyExactly one ordered-pair solution The two lines intersect at one point.No solution The two lines are parallel.Infinitely many solutions The two lines are identical.
Expand this image
FIGURE 7.29 Possible graphs for a system of two linear equations in two variables
Example 7 A System with No SolutionSolve the system:
SOLUTION
Because no variable is isolated, we will use the addition method. To obtain coefficients of x that differ only in sign, we multiply the first equation by 3 and the secondequation by
The false statement indicates that the system has no solution. The solution set is the empty set,
The lines corresponding to the two equations in Example 7 are shown in Figure 7.30. The lines are parallel and have no point of intersection.
Skip Directly to Table of Contents | Skip Directly to Main Content
Change text size Show/Hide TOC Page
{4x + 6y = 12
6x + 9y = 12.
−2.
{ 4x + 6y = 12
6x + 9y = 12
Multiply by 3. − →−−−−−−−−−−
Multiply by − 2.− →−−−−−−−−−−−
Add:
{ 12x + 18y
−12x − 18y
¯ ¯¯̄¯̄ ¯̄¯̄ ¯̄ ¯̄¯̄ ¯
=
=
36
−24¯ ¯¯̄¯̄
0 = 12 ◄
There are no values of x
and y for which 0 = 12.
No values of x and y
satisfy 0x + 0y = 12.
0 = 12 ∅.

1/9/2018 Thinking Mathematically, Sixth Edition
https://media.pearsoncmg.com/cmg/pmmg_mml_shared/mathstats_html_ebooks/BlitzerThinkM6/page_440.html 2/2
Page 440
FIGURE 7.30 The graph of a system with no solution
Check Point 7Solve the system:
Copyright 2018 © Pearson Education, Inc. or its affiliate(s). All rights reserved. Privacy Policy | Terms of Use | Rights and Permissions
{ x + 2y = 4
3x + 6y = 13.

1/9/2018 Thinking Mathematically, Sixth Edition
https://media.pearsoncmg.com/cmg/pmmg_mml_shared/mathstats_html_ebooks/BlitzerThinkM6/page_441.html 1/2
7 Algebra: Graphs, Functions and Linear Systems > 7.3 Systems of Linear Equations in Two Variables > Linear Systems HavingNo Solution or Infinitely Many Solutions
Example 8 A System with Infinitely Many SolutionsSolve the system:
SOLUTION
Because the variable y is isolated in the first equation, we can use the substitution method. We substitute the expression for y into the second equation.
In our final step, both variables have been eliminated and the resulting statement, is true. This true statement indicates that the system has infinitely manysolutions. The solution set consists of all points (x, y) lying on either of the coinciding lines, or as shown in Figure 7.31.
FIGURE 7.31 The graph of a system with infinitely many solutions
We express the solution set for the system in one of two equivalent ways:
Great Question!The system in Example 8 has infinitely many solutions. Does that mean that any ordered pair of numbers is a solution?
Although the system in Example 8 has infinitely many solutions, this does not mean that any ordered pair of numbers you can form will be a solution. The ordered pair(x, y) must satisfy one of the system's equations, and there are infinitely many such ordered pairs. Because the graphs arecoinciding lines, the ordered pairs that are solutions of one of the equations are also solutions of the other equation.
Check Point 8Solve the system:
Linear Systems Having No Solution Or Infinitely Many Solutions
Skip Directly to Table of Contents | Skip Directly to Main Content
Change text size Show/Hide TOC Page
{ y =
15x − 5y =
3x − 2
10.
y = 3x − 2,
┌ ┐−−−−−−−−−−
y = 15x − 5 =3x − 2 y
15x − 5(3x − 2) =
15x − 15x + 10 =
▶ 10 =This statement is true
for all values of x and y.
10
10
10
10
Substitute 3x − 2 for y.
The substitution results in an
equation in one variable.
Apply the distributive property.
Simplify.
10 = 10,y = 3x − 2 15x − 5y = 10,
{(x, y)}|y = 3x − 2}
▲
The set of all ordered pairs
(x, y) such that y = 3x − 2
or
{(x, y)|15x − 5y = 10}.
▲
The set of all ordered pairs
(x, y) such that 15x − 5y = 10
y = 3x − 2 or 15x − 5y = 10,
{ y = 4x − 4
8x − 2y = 8.

1/9/2018 Thinking Mathematically, Sixth Edition
https://media.pearsoncmg.com/cmg/pmmg_mml_shared/mathstats_html_ebooks/BlitzerThinkM6/page_441.html 2/2
Page 441
If both variables are eliminated when solving a system of linear equations by substitution or addition, one of the following is true:
1. There is no solution if the resulting statement is false.
2. There are infinitely many solutions if the resulting statement is true.
Copyright 2018 © Pearson Education, Inc. or its affiliate(s). All rights reserved. Privacy Policy | Terms of Use | Rights and Permissions

1/9/2018 Thinking Mathematically, Sixth Edition
https://media.pearsoncmg.com/cmg/pmmg_mml_shared/mathstats_html_ebooks/BlitzerThinkM6/page_442.html 1/2
7 Algebra: Graphs, Functions and Linear Systems > 7.3 Systems of Linear Equations in Two Variables > Modeling with Systems ofEquations: Making Money (and Losing It)
Modeling with Systems of Equations: Making Money (and Losing It)
6 Solve problems using systems of linear equations.
What does every entrepreneur, from a kid selling lemonade to Mark Zuckerberg, want to do? Generate profit, of course. The profit made is the money taken in, or therevenue, minus the money spent, or the cost.
Revenue and Cost FunctionsA company produces and sells x units of a product. Its revenue is the money generated by selling x units of the product. Its cost is the cost of producing x units of theproduct.
Revenue Function
Cost Function
The point of intersection of the graphs of the revenue and cost functions is called the break-even point. The x-coordinate of the point reveals the number of units that acompany must produce and sell so that money coming in, the revenue, is equal to money going out, the cost. The y-coordinate of the break-even point gives the amountof money coming in and going out. Example 9 illustrates the use of the substitution method in determining a company's break-even point.
Example 9 Finding a Break-Even PointTechnology is now promising to bring light, fast, and beautiful wheelchairs to millions of disabled people. A company is planning to manufacture these radicallydifferent wheelchairs. Fixed cost will be $500,000 and it will cost $400 to produce each wheelchair. Each wheelchair will be sold for $600.
a. Write the cost function, C, of producing x wheelchairs.
b. Write the revenue function, R, from the sale of x wheelchairs.
c. Determine the break-even point. Describe what this means.
SOLUTION
a. The cost function is the sum of the fixed cost and variable cost.
b. The revenue function is the money generated from the sale of x wheelchairs. We are given that each wheelchair will be sold for $600.
Skip Directly to Table of Contents | Skip Directly to Main Content
Change text size Show/Hide TOC Page
R(x) = (price per unit sold)x
C(x) = fixed cost + (cost per unit produced)x
Fixed cost of $500,000
▼
C(x) = 500,000 + 400x
▲
plus
◄Variable cost: $400 for
each chair produced
1/9/2018 Thinking Mathematically, Sixth Edition
https://media.pearsoncmg.com/cmg/pmmg_mml_shared/mathstats_html_ebooks/BlitzerThinkM6/page_442.html 2/2
Page 442
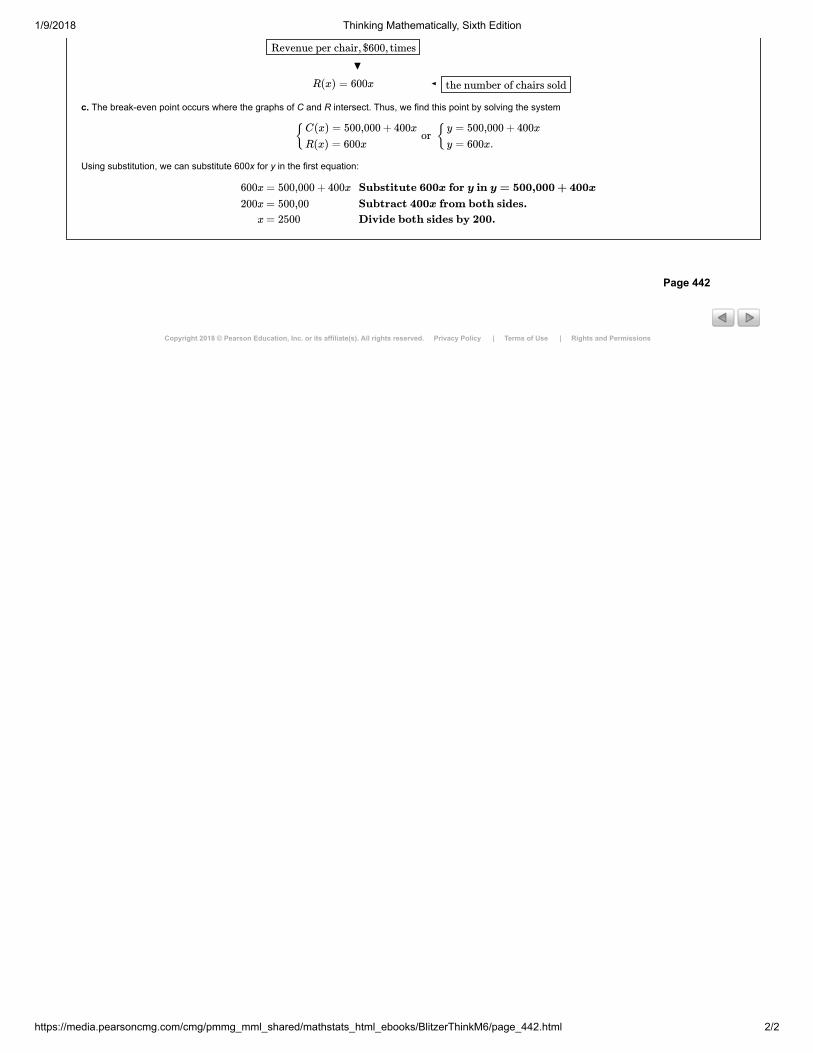
c. The break-even point occurs where the graphs of C and R intersect. Thus, we find this point by solving the system
Using substitution, we can substitute 600x for y in the first equation:
Copyright 2018 © Pearson Education, Inc. or its affiliate(s). All rights reserved. Privacy Policy | Terms of Use | Rights and Permissions
Revenue per chair, $600, times
▼
R(x) = 600x ◄ the number of chairs sold
{ or {C(x) = 500,000 + 400x
R(x) = 600x
y = 500,000 + 400x
y = 600x.
600x
200x
x
= 500,000 + 400x
= 500,00
= 2500
Substitute 600x for y in y = 500,000 + 400x
Subtract 400x from both sides.
Divide both sides by 200.

1/9/2018 Thinking Mathematically, Sixth Edition
https://media.pearsoncmg.com/cmg/pmmg_mml_shared/mathstats_html_ebooks/BlitzerThinkM6/page_443.html 1/2
7 Algebra: Graphs, Functions and Linear Systems > 7.3 Systems of Linear Equations in Two Variables > Modeling with Systems ofEquations: Making Money (and Losing It)
Back-substituting 2500 for x in either of the system's equations (or functions), or we obtain
The break-even point is (2500, 1,500,000). This means that the company will break even if it produces and sells 2500 wheelchairs. At this level, the money coming inis equal to the money going out: $1,500,000.
Figure 7.32 shows the graphs of the revenue and cost functions for the wheelchair business. Similar graphs and models apply no matter how small or large a businessventure may be.
dFIGURE 7.32
The intersection point confirms that the company breaks even by producing and selling 2500 wheelchairs. Can you see what happens for The red costgraph lies above the blue revenue graph. The cost is greater than the revenue and the business is losing money. Thus, if they sell fewer than 2500 wheelchairs, theresult is a loss. By contrast, look at what happens for The blue revenue graph lies above the red cost graph. The revenue is greater than the cost and thebusiness is making money. Thus, if they sell more than 2500 wheelchairs, the result is a gain.
Check Point 9A company that manufactures running shoes has a fixed cost of $300,000. Additionally, it costs $30 to produce each pair of shoes. They are sold at $80 per pair.
a. Write the cost function, C, of producing x pairs of running shoes.
b. Write the revenue function, R, from the sale of x pairs of running shoes.
c. Determine the break-even point. Describe what this means.
The profit generated by a business is the money taken in (its revenue) minus the money spent (its cost). Thus, once a business has modeled its revenue and cost with asystem of equations, it can determine its profit function,
The Profit FunctionThe profit generated after producing and selling x units of a product is given by the profit function
where R and C are the revenue and cost functions, respectively.
The profit function for the wheelchair business in Example 9 is
The graph of this profit function is shown in Figure 7.33. The red portion lies below the x-axis and shows a loss when fewer than 2500 wheelchairs are sold. Thebusiness is “in the red.” The black portion lies above the x-axis and shows a gain when more than 2500 wheelchairs are sold. The wheelchair business is “in the black.”
Skip Directly to Table of Contents | Skip Directly to Main Content
Change text size Show/Hide TOC Page
C(x) = 500,000 + 400x R(x) = 600x,
R(2500) = 600(2500) = 1,500,000.
▲
We used R(x) = 600x.
x < 2500?
x > 2500.
P (x).
P (x),
P (x) = R(x) − C(x),
P (x)
= R(x) − C(x)
= 600x − (500,000 + 400x)
= 200x − 500,000.

1/9/2018 Thinking Mathematically, Sixth Edition
https://media.pearsoncmg.com/cmg/pmmg_mml_shared/mathstats_html_ebooks/BlitzerThinkM6/page_443.html 2/2
Page 443
dFIGURE 7.33
Copyright 2018 © Pearson Education, Inc. or its affiliate(s). All rights reserved. Privacy Policy | Terms of Use | Rights and Permissions

1/9/2018 Thinking Mathematically, Sixth Edition
https://media.pearsoncmg.com/cmg/pmmg_mml_shared/mathstats_html_ebooks/BlitzerThinkM6/page_444.html 1/3
7 Algebra: Graphs, Functions and Linear Systems > 7.3 Systems of Linear Equations in Two Variables > Concept and VocabularyCheck
Concept and Vocabulary CheckFill in each blank so that the resulting statement is true.
1. A solution to a system of linear equations in two variables is an ordered pair that ________.
2. When solving a system of linear equations by graphing, the system's solution is determined by locating ________.
3. When solving
by the substitution method, we obtain so the solution set is ________.
4. When solving
by the addition method, we can eliminate y by multiplying the second equation by ________ and then adding the equations.
5. When solving
by the addition method, we can eliminate y by multiplying the first equation by 2 and the second equation by ________ and then adding the equations.
6. When solving
by the addition method, we obtain so the solution set is _________. If you attempt to solve such a system by graphing, you will obtain two lines that are________.
7. When solving
by the substitution method, we obtain so the solution set is ____________________. If you attempt to solve such a system by graphing, you will obtain twolines that ________.
8. A company's _________ function is the money generated by selling x units of its product. The difference between this function and the company's cost function iscalled its _________ function.
9. A company has a graph that shows the money it generates by selling x units of its product. It also has a graph that shows its cost of producing x units of its product.The point of intersection of these graphs is called the company's ________.
Exercise Set 7.3Practice ExercisesIn Exercises 1–4, determine whether the given ordered pair is a solution of the system.
1.
2.
3.
4.
Skip Directly to Table of Contents | Skip Directly to Main Content
Change text size Show/Hide TOC Page
{ 3x − 2y = 5
y = 3x − 3
x = ,13
{ 2x + 10y = 9
8x + 5y = 7
{ 4x − 3y = 15
3x − 2y = 10
{12x − 21y
4x − 7y
= 24
= 7
0 = 3,
{x = 3y + 2
5x − 15y = 10
10 = 10,
(2, 3)
{x + 3y
x − 5y
= 11
= −13
(−3, 5)
{9x + 7y
8x − 9y
= 8
= −69
(2, 5)
{2x + 3y
x + 4y
= 17
= 16
(8, 5)

1/9/2018 Thinking Mathematically, Sixth Edition
https://media.pearsoncmg.com/cmg/pmmg_mml_shared/mathstats_html_ebooks/BlitzerThinkM6/page_444.html 2/3
In Exercises 5–12, solve each system by graphing. Check the coordinates of the intersection point in both equations.
5.
6.
7.
8.
9.
10.
11.
12.
In Exercises 13–24, solve each system by the substitution method. Be sure to check all proposed solutions.
13.
14.
15.
16.
17.
18.
19.
20.
21.
22.
23.
24.
In Exercises 25–36, solve each system by the addition method. Be sure to check all proposed solutions.
25.
26.
27.
{5x − 4y = 20
3y = 2x + 1
{x + y
x − y
= 6
= 2
{x + y
x − y
= 2
= 4
{2x − 3y
4x + 3y
= 6
= 12
{4x + y
3x − y
= 4
= 3
{y
y
= x + 5
= −x + 3
{y
y
= x + 1
= 3x − 1
{y = −x − 1
4x − 3y = 24
{y = 3x − 4
2x + y = 1
{x + y = 4
y = 3x
{x + y = 6
y = 2x
{x + 3y = 8
y = 2x − 9
{2x − 3y = −13
y = 2x + 7
{x + 3y = 5
4x + 5y = 13
{y = 2x + 7
2x − y = −5
{2x − y
x + 5y
= −5
= 14
{2x + 3y
x − 4y
= 11
= 0
{2x − y
5x − 2y
= 3
= 10
{−x + 3y
2x + 8y
= 10
= −6
{ x + 8y
2x + 4y
= 6
= −3
{−4x + y
2x − 3y
= −11
= 5
{x + y
x − y
= 1
= 3
{x + y
x − y
= 6
= −2
{2x + 3y
2x − 3y
= 6
= 6

1/9/2018 Thinking Mathematically, Sixth Edition
https://media.pearsoncmg.com/cmg/pmmg_mml_shared/mathstats_html_ebooks/BlitzerThinkM6/page_444.html 3/3
Page 444
28.
29.
30.
31.
32.
33.
34.
35.
36.
Copyright 2018 © Pearson Education, Inc. or its affiliate(s). All rights reserved. Privacy Policy | Terms of Use | Rights and Permissions
{3x + 2y
3x − 2y
= 14
= 10
{ x + 2y
−4x + 3y
= 2
= 25
{2x − 7y
3x + y
= 2
= −20
{4x + 3y
2x − 5y
= 15
= 1
{3x − 7y
6x + 5y
= 13
= 7
{3x − 4y
2x + 3y
= 11
= −4
{2x + 3y
5x − 10y
= −16
= 30
{2x = 3y − 4
−6x + 12y = 6
{5x = 4y − 8
3x + 7y = 14

1/9/2018 Thinking Mathematically, Sixth Edition
https://media.pearsoncmg.com/cmg/pmmg_mml_shared/mathstats_html_ebooks/BlitzerThinkM6/page_445.html 1/3
7 Algebra: Graphs, Functions and Linear Systems > 7.3 Systems of Linear Equations in Two Variables > Concept and VocabularyCheck
In Exercises 37–44, solve by the method of your choice. Identify systems with no solution and systems with infinitely many solutions, using set notation to express theirsolution sets.
37.
38.
39.
40.
41.
42.
43.
44.
Practice PlusUse the graphs of the linear functions to solve Exercises 45–46.
d
45. Write the linear system whose solution set is Express each equation in the system in slope-intercept form.
46. Write the linear system whose solution set is Express each equation in the system in slope-intercept form.
In Exercises 47–48, solve each system for x and y, expressing either value in terms of a or b, if necessary. Assume that and
47.
48.
49. For the linear function and Find m and b.
50. For the linear function and Find m and b.
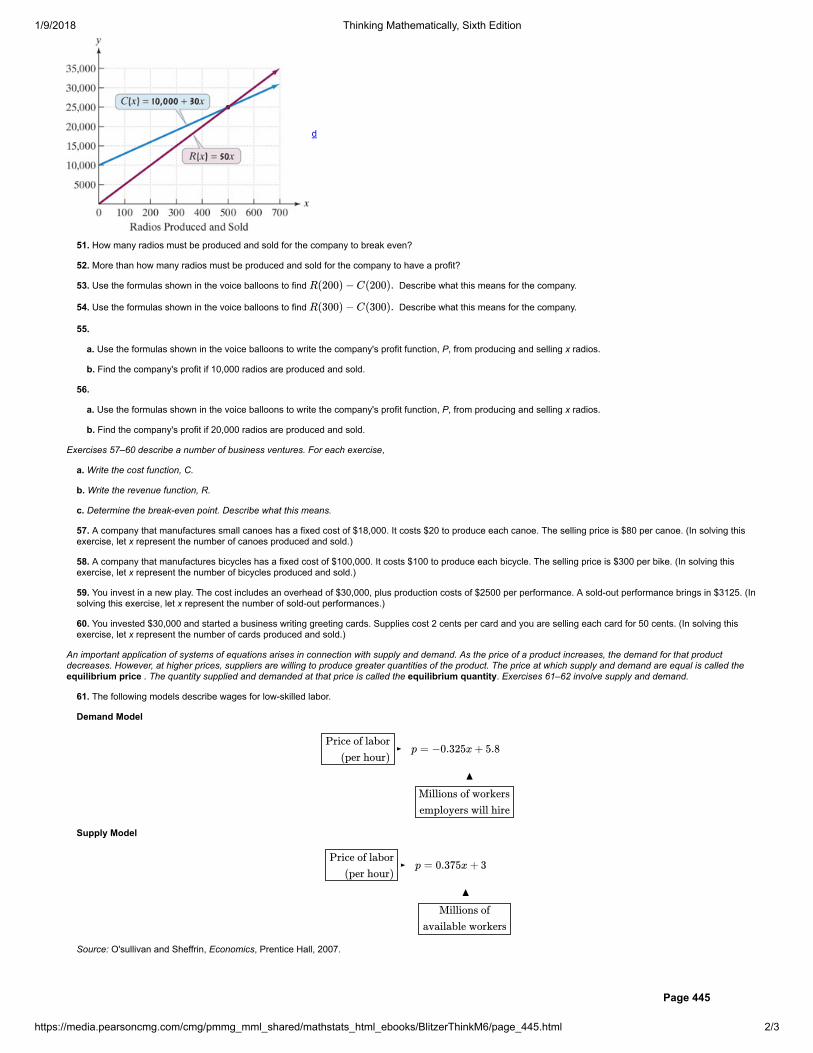
Application ExercisesThe figure shows the graphs of the cost and revenue functions for a company that manufactures and sells small radios. Use the information in the figure to solveExercises 51–56.
Skip Directly to Table of Contents | Skip Directly to Main Content
Change text size Show/Hide TOC Page
{x = 9 − 2y
x + 2y = 13
{6x + 2y = 7
y = 2 − 3x
{y = 3x − 5
21x − 35 = 7y
{9x − 3y = 12
y = 3x − 4
{3x − 2y
4x + y
= −5
= 8
{2x + 5y
3x − y
= −4
= 11
{ x + 3y
3x + 9y
= 2
= 6
{4x − 2y
2x − y
= 2
= 1
{(6, 2)}.
∅.
a 0= b 0.=
{5ax + 4y = 17
ax + 7y = 22
{4ax + by = 3
6ax + 5by = 8
f(x) = mx + b, f(−2) = 11 f(3) = −9.
f(x) = mx + b, f(−3) = 23 f(2) = −7.
1/9/2018 Thinking Mathematically, Sixth Edition
https://media.pearsoncmg.com/cmg/pmmg_mml_shared/mathstats_html_ebooks/BlitzerThinkM6/page_445.html 2/3
Page 445
d
51. How many radios must be produced and sold for the company to break even?
52. More than how many radios must be produced and sold for the company to have a profit?
53. Use the formulas shown in the voice balloons to find Describe what this means for the company.
54. Use the formulas shown in the voice balloons to find Describe what this means for the company.
55.
a. Use the formulas shown in the voice balloons to write the company's profit function, P, from producing and selling x radios.
b. Find the company's profit if 10,000 radios are produced and sold.
56.
a. Use the formulas shown in the voice balloons to write the company's profit function, P, from producing and selling x radios.
b. Find the company's profit if 20,000 radios are produced and sold.
Exercises 57–60 describe a number of business ventures. For each exercise,
a. Write the cost function, C.
b. Write the revenue function, R.
c. Determine the break-even point. Describe what this means.
57. A company that manufactures small canoes has a fixed cost of $18,000. It costs $20 to produce each canoe. The selling price is $80 per canoe. (In solving thisexercise, let x represent the number of canoes produced and sold.)
58. A company that manufactures bicycles has a fixed cost of $100,000. It costs $100 to produce each bicycle. The selling price is $300 per bike. (In solving thisexercise, let x represent the number of bicycles produced and sold.)
59. You invest in a new play. The cost includes an overhead of $30,000, plus production costs of $2500 per performance. A sold-out performance brings in $3125. (Insolving this exercise, let x represent the number of sold-out performances.)
60. You invested $30,000 and started a business writing greeting cards. Supplies cost 2 cents per card and you are selling each card for 50 cents. (In solving thisexercise, let x represent the number of cards produced and sold.)
An important application of systems of equations arises in connection with supply and demand. As the price of a product increases, the demand for that productdecreases. However, at higher prices, suppliers are willing to produce greater quantities of the product. The price at which supply and demand are equal is called theequilibrium price . The quantity supplied and demanded at that price is called the equilibrium quantity. Exercises 61–62 involve supply and demand.
61. The following models describe wages for low-skilled labor.
Demand Model
Supply Model
Source: O'sullivan and Sheffrin, Economics, Prentice Hall, 2007.
R(200) − C(200).
R(300) − C(300).
►Price of labor
(per hour)p = −0.325x + 5.8
▲
Millions of workers
employers will hire
►Price of labor
(per hour)p = 0.375x + 3
▲
Millions of
available workers

1/9/2018 Thinking Mathematically, Sixth Edition
https://media.pearsoncmg.com/cmg/pmmg_mml_shared/mathstats_html_ebooks/BlitzerThinkM6/page_445.html 3/3
Copyright 2018 © Pearson Education, Inc. or its affiliate(s). All rights reserved. Privacy Policy | Terms of Use | Rights and Permissions

1/9/2018 Thinking Mathematically, Sixth Edition
https://media.pearsoncmg.com/cmg/pmmg_mml_shared/mathstats_html_ebooks/BlitzerThinkM6/page_446.html 1/2
7 Algebra: Graphs, Functions and Linear Systems > 7.3 Systems of Linear Equations in Two Variables > Concept and VocabularyCheck
a. Solve the system and find the equilibrium number of workers, in millions, and the equilibrium hourly wage.
b. Use your answer from part (a) to complete this statement: If workers are paid _____ per hour, there will be _____ million available workers and _____ millionworkers will be hired.
c. In 2007, the federal minimum wage was set at $5.15 per hour. Substitute 5.15 for p in the demand model, and determine the millions ofworkers employers will hire at this price.
d. At a minimum wage of $5.15 per hour, use the supply model, to determine the millions of available workers. Round to one decimal place.
e. At a minimum wage of $5.15 per hour, use your answers from parts (c) and (d) to determine how many more people are looking for work than employers arewilling to hire.
62. The following models describe demand and supply for three-bedroom rental apartments.
Demand Model
Supply Model
a. Solve the system and find the equilibrium quantity and the equilibrium price.
b. Use your answer from part (a) to complete this statement:
When rents are _____ per month, consumers will demand _____ apartments and suppliers will offer _____ apartments for rent.
63. We opened this section with a study showing that late in the semester, procrastinating students reported more symptoms of physical illness than theirnonprocrastinating peers.
a. At the beginning of the semester, procrastinators reported an average of 0.8 symptoms, increasing at a rate of 0.45 symptoms per week. Write a function thatmodels the average number of symptoms, y, after x weeks.
b. At the beginning of the semester, nonprocrastinators reported an average of 2.6 symptoms, increasing at a rate of 0.15 symptoms per week. Write a function thatmodels the average number of symptoms, y, after x weeks.
c. By which week in the semester did both groups report the same number of symptoms of physical illness? For that week, how many symptoms were reported byeach group? How is this shown in Figure 7.27 on page 433?
64.
a. In 1960, 5% of U.S. adults lived alone, increasing at a rate of 0.2% per year. Write a function that models the percentage of U.S. adults living alone, y, x yearsafter 1960.
b. In 1960, 47% of U.S. adults were married, living with kids, decreasing at a rate of 0.4% per year. Write a function that models the percentage of married U.S.adults living with kids, y, x years after 1960.
c. Use the models from parts (a) and (b) to project the year in which the percentage of adults living alone will be the same as the percentage of married adults livingwith kids. What percentage of U.S. adults will belong to each group during that year?
Writing in Mathematics65. What is a system of linear equations? Provide an example with your description.
66. What is the solution to a system of linear equations?
67. Explain how to solve a system of equations using graphing.
68. Explain how to solve a system of equations using the substitution method. Use and to illustrate your explanation.
69. Explain how to solve a system of equations using the addition method. Use and to illustrate your explanation.
70. What is the disadvantage to solving a system of equations using the graphing method?
71. When is it easier to use the addition method rather than the substitution method to solve a system of equations?
Skip Directly to Table of Contents | Skip Directly to Main Content
Change text size Show/Hide TOC Page
p = −0.325x + 5.8,
p = 0.375x + 3,
►Monthly rental price p = −50x + 2000
▲
Number of apartments
demanded, in thousands
►Monthly rental price p = 50x
▲
Number of apartments
supplied, in thousands
y = 3 − 3x 3x + 4y = 6
3x + 5y = −2 2x + 3y = 0

1/9/2018 Thinking Mathematically, Sixth Edition
https://media.pearsoncmg.com/cmg/pmmg_mml_shared/mathstats_html_ebooks/BlitzerThinkM6/page_446.html 2/2
Page 446
72. When using the addition or substitution method, how can you tell whether a system of linear equations has infinitely many solutions? What is the relationshipbetween the graphs of the two equations?
73. When using the addition or substitution method, how can you tell whether a system of linear equations has no solution? What is the relationship between thegraphs of the two equations?
74. Describe the break-even point for a business.
Critical Thinking ExercisesMake Sense? In Exercises 75–78, determine whether each statement make sense or does not make sense, and explain your reasoning.
75. Even if a linear system has a solution set involving fractions, such as I can use graphs to determine if the solution set is reasonable.
76. Each equation in a system of linear equations has infinitely many ordered-pair solutions.
77. Every system of linear equations has infinitely many ordered-pair solutions.
78. I find it easiest to use the addition method when one of the equations has a variable on one side by itself.
79. Write a system of equations having as a solution set. (More than one system is possible.)
80. One apartment is directly above a second apartment. The resident living downstairs calls his neighbor living above him and states, “If one of you is willing to comedownstairs, we'll have the same number of people in both apartments.” The upstairs resident responds, “We're all too tired to move. Why don't one of you come uphere? Then we will have twice as many people up here as you've got down there.” How many people are in each apartment?
81. A set of identical twins can only be distinguished by the characteristic that one always tells the truth and the other always lies. One twin tells you of a lucky numberpair: “When I multiply my first lucky number by 3 and my second lucky number by 6, the addition of the resulting numbers produces a sum of 12. When I add my firstlucky number and twice my second lucky number, the sum is 5.” Which twin is talking?
Copyright 2018 © Pearson Education, Inc. or its affiliate(s). All rights reserved. Privacy Policy | Terms of Use | Rights and Permissions
{( , )} ,8
11
43
11
{(−2, 7)}
Related Documents