Top Banner
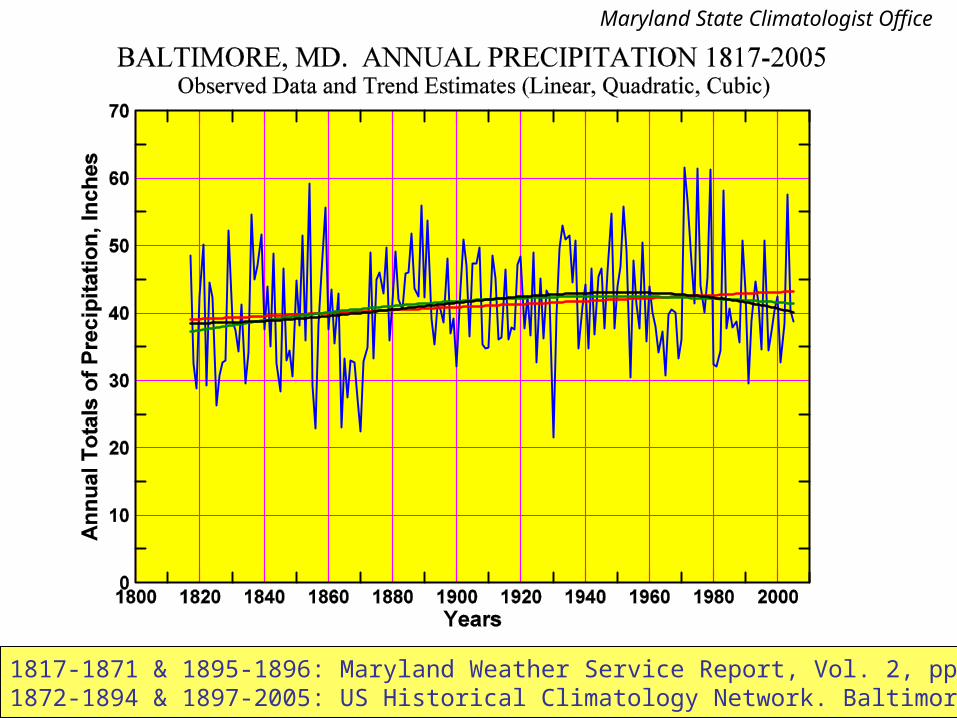
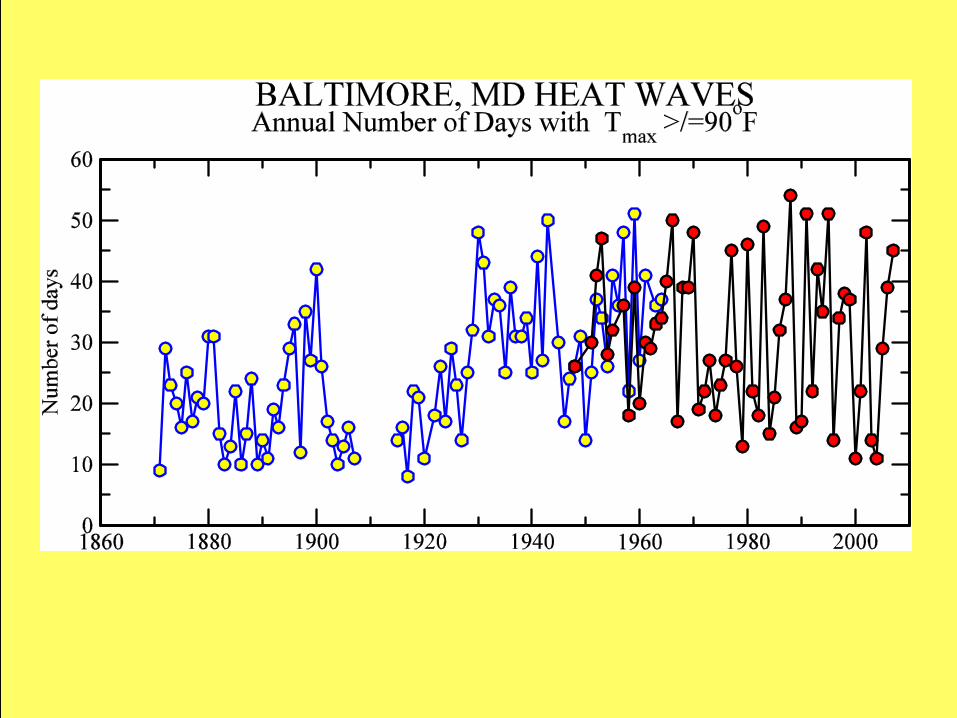
1817-1871 & 1895-1896: Maryland Weather Service Report, Vol. 2, pp. 1872-1894 & 1897-2005: US Historical Climatology Network. Baltimore Maryland State Climatologist Office
12

1817-1871 & 1895-1896: Maryland Weather Service Report, Vol. 2, pp.186-187. 1907. 1872-1894 & 1897-2005: US Historical Climatology Network. Baltimore WSO.

Dec 21, 2015

Download

Documents

Welcome message from author
This document is posted to help you gain knowledge. Please leave a comment to let me know what you think about it! Share it to your friends and learn new things together.
Transcript
Page 1: 1817-1871 & 1895-1896: Maryland Weather Service Report, Vol. 2, pp.186-187. 1907. 1872-1894 & 1897-2005: US Historical Climatology Network. Baltimore WSO.

1817-1871 & 1895-1896: Maryland Weather Service Report, Vol. 2, pp.186-187. 1907.1872-1894 & 1897-2005: US Historical Climatology Network. Baltimore WSO City.

Maryland State Climatologist Office

Page 2: 1817-1871 & 1895-1896: Maryland Weather Service Report, Vol. 2, pp.186-187. 1907. 1872-1894 & 1897-2005: US Historical Climatology Network. Baltimore WSO.

Annual Precipitation at Maryland is increasing ~ 2 Inch/100 yr

Page 3: 1817-1871 & 1895-1896: Maryland Weather Service Report, Vol. 2, pp.186-187. 1907. 1872-1894 & 1897-2005: US Historical Climatology Network. Baltimore WSO.
Page 4: 1817-1871 & 1895-1896: Maryland Weather Service Report, Vol. 2, pp.186-187. 1907. 1872-1894 & 1897-2005: US Historical Climatology Network. Baltimore WSO.

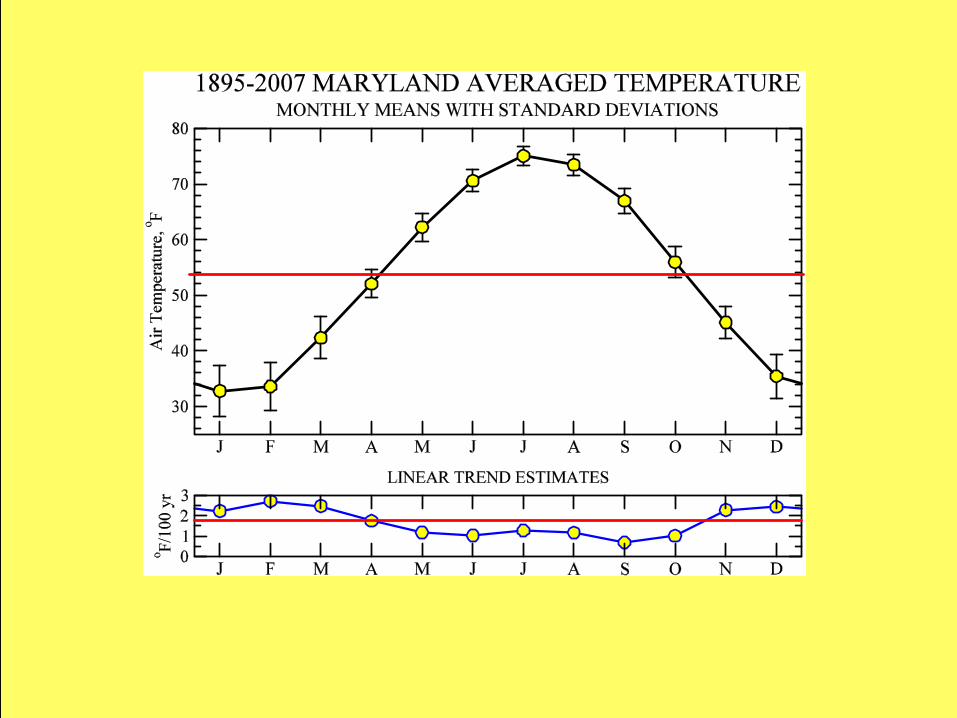
1817-1895: Maryland Weather Service Report, Vol. 2, 1907, pp.93-94.1896-2007: US Historical Climatology Network, Version 2, Baltimore Downtown. Overlapping period of two records is 1896-1903.

Maryland State Climatologist Office

Page 5: 1817-1871 & 1895-1896: Maryland Weather Service Report, Vol. 2, pp.186-187. 1907. 1872-1894 & 1897-2005: US Historical Climatology Network. Baltimore WSO.

Observed air temperature trend at Maryland, 1.7 F/100 yr, is close to observed global warming trend

for the same time interval

Page 6: 1817-1871 & 1895-1896: Maryland Weather Service Report, Vol. 2, pp.186-187. 1907. 1872-1894 & 1897-2005: US Historical Climatology Network. Baltimore WSO.
Page 7: 1817-1871 & 1895-1896: Maryland Weather Service Report, Vol. 2, pp.186-187. 1907. 1872-1894 & 1897-2005: US Historical Climatology Network. Baltimore WSO.
Page 8: 1817-1871 & 1895-1896: Maryland Weather Service Report, Vol. 2, pp.186-187. 1907. 1872-1894 & 1897-2005: US Historical Climatology Network. Baltimore WSO.

These Stations Can Be Used to Study 1895-Present MARYLAND Climate Change

Page 9: 1817-1871 & 1895-1896: Maryland Weather Service Report, Vol. 2, pp.186-187. 1907. 1872-1894 & 1897-2005: US Historical Climatology Network. Baltimore WSO.

Seasonal and Diurnal Variations of 10 yr average O3 Concentration, ppb

Shenandoah National Park – Big Meadows. 1983-2002

Page 10: 1817-1871 & 1895-1896: Maryland Weather Service Report, Vol. 2, pp.186-187. 1907. 1872-1894 & 1897-2005: US Historical Climatology Network. Baltimore WSO.

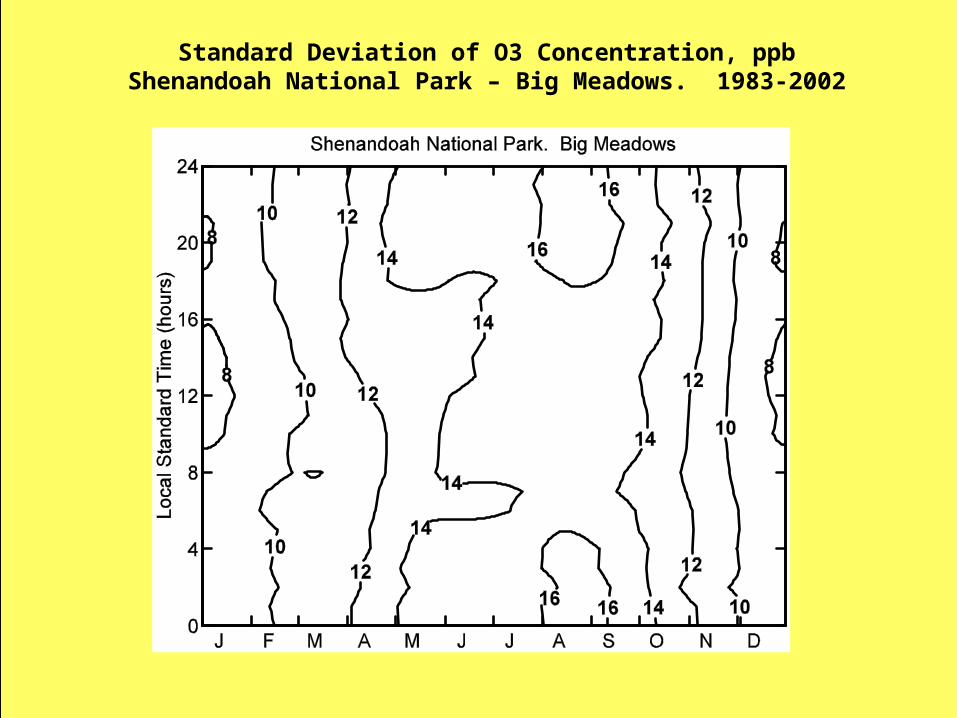
Standard Deviation of O3 Concentration, ppbShenandoah National Park – Big Meadows. 1983-2002

Page 11: 1817-1871 & 1895-1896: Maryland Weather Service Report, Vol. 2, pp.186-187. 1907. 1872-1894 & 1897-2005: US Historical Climatology Network. Baltimore WSO.

Linear trend in observed variation of Ozone Concentration, ppb/10 yrShenandoah National Park – Big Meadows. 1983-2002

Page 12: 1817-1871 & 1895-1896: Maryland Weather Service Report, Vol. 2, pp.186-187. 1907. 1872-1894 & 1897-2005: US Historical Climatology Network. Baltimore WSO.