April 18, 2018 MEETING NOTICE WATER CONSERVATION AND DEMAND MANAGEMENT COMMITTEE Members of the Water Conservation and Demand Management Committee: Director Nai Hsueh Director Linda J. LeZotte, Vice Chair Director Richard P. Santos, Chair Staff Support of the Water Conservation and Demand Management Committee: Norma J. Camacho, Chief Executive Officer Nina Hawk, Chief Operating Officer, Water Utility Rick Callender, Chief of External Affairs Stanly Yamamoto, District Counsel Erick Soderlund, Assistant District Counsel Garth Hall, Deputy Operating Officer, Water Supply Division Rachael Gibson, Deputy Administrative Officer, Office of Government Relations Bart Broome, Assistant Officer, Office of Government Relations Antonio Alfaro, Government Relations Advocate, Office of Government Relations Jerry De La Piedra, Water Supply Planning and Conservation Manager, Water Supply Planning and Conservation Unit Vanessa De La Piedra, Groundwater Management Manager, Groundwater Monitoring and Analysis Unit Tracy Hemmeter, Senior Project Manager Bassam Kassab, Senior Water Resources Specialist George Cook, Senior Water Resources Specialist The regular meeting of the Water Conservation and Demand Management Committee is scheduled to be held on Monday, April 30, 2018, at 10:00 a.m. in the Headquarters Building Boardroom, located at the Santa Clara Valley Water District, 5700 Almaden Expressway, San Jose, California. Enclosed are the meeting agenda and corresponding materials. Please bring this packet with you to the meeting. Enclosures

Welcome message from author
This document is posted to help you gain knowledge. Please leave a comment to let me know what you think about it! Share it to your friends and learn new things together.
Transcript
April 18, 2018
MEETING NOTICE
WATER CONSERVATION AND DEMAND MANAGEMENT COMMITTEE Members of the Water Conservation and Demand Management Committee:
Director Nai Hsueh Director Linda J. LeZotte, Vice Chair Director Richard P. Santos, Chair
Staff Support of the Water Conservation and Demand Management Committee: Norma J. Camacho, Chief Executive Officer Nina Hawk, Chief Operating Officer, Water Utility Rick Callender, Chief of External Affairs Stanly Yamamoto, District Counsel Erick Soderlund, Assistant District Counsel Garth Hall, Deputy Operating Officer, Water Supply Division Rachael Gibson, Deputy Administrative Officer, Office of Government Relations Bart Broome, Assistant Officer, Office of Government Relations Antonio Alfaro, Government Relations Advocate, Office of Government Relations Jerry De La Piedra, Water Supply Planning and Conservation Manager, Water Supply Planning and Conservation Unit Vanessa De La Piedra, Groundwater Management Manager, Groundwater Monitoring and Analysis Unit Tracy Hemmeter, Senior Project Manager Bassam Kassab, Senior Water Resources Specialist George Cook, Senior Water Resources Specialist
The regular meeting of the Water Conservation and Demand Management Committee is scheduled to be held on Monday, April 30, 2018, at 10:00 a.m. in the Headquarters Building Boardroom, located at the Santa Clara Valley Water District, 5700 Almaden Expressway, San Jose, California. Enclosed are the meeting agenda and corresponding materials. Please bring this packet with you to the meeting. Enclosures
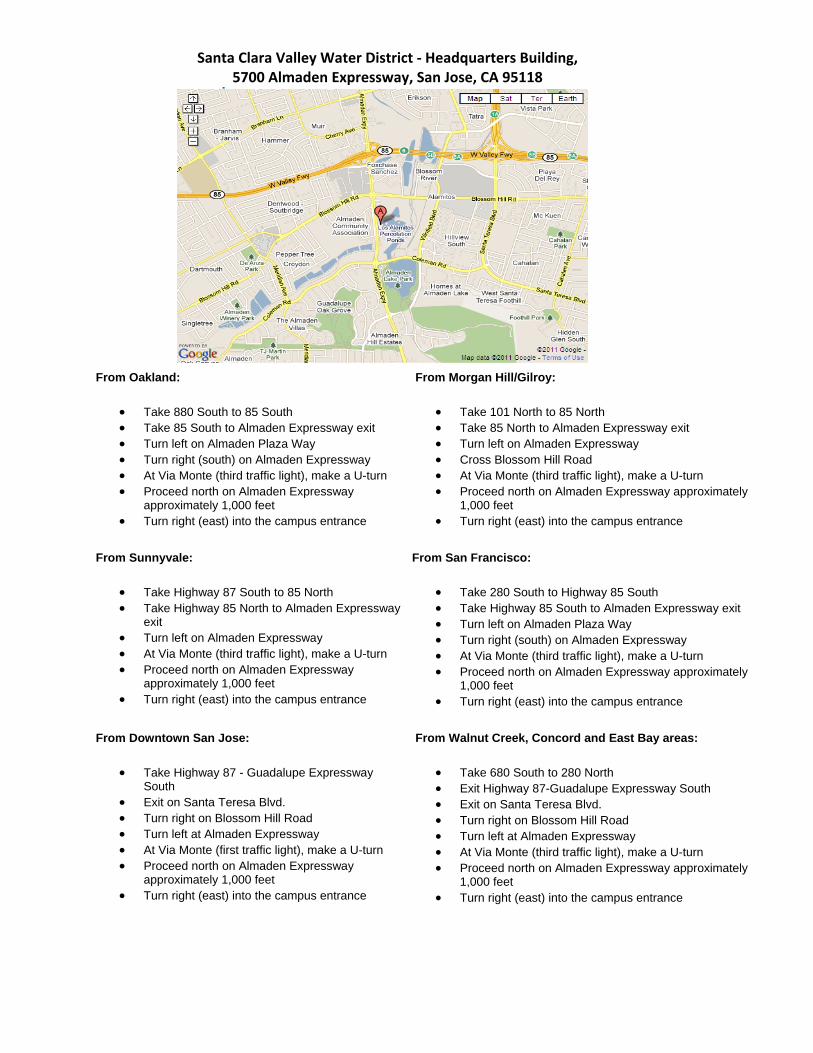
Santa Clara Valley Water District - Headquarters Building, 5700 Almaden Expressway, San Jose, CA 95118
From Oakland:
• Take 880 South to 85 South
• Take 85 South to Almaden Expressway exit
• Turn left on Almaden Plaza Way
• Turn right (south) on Almaden Expressway
• At Via Monte (third traffic light), make a U-turn
• Proceed north on Almaden Expresswayapproximately 1,000 feet
• Turn right (east) into the campus entrance
From Morgan Hill/Gilroy:
• Take 101 North to 85 North
• Take 85 North to Almaden Expressway exit
• Turn left on Almaden Expressway
• Cross Blossom Hill Road
• At Via Monte (third traffic light), make a U-turn
• Proceed north on Almaden Expressway approximately1,000 feet
• Turn right (east) into the campus entrance
From Sunnyvale:
• Take Highway 87 South to 85 North
• Take Highway 85 North to Almaden Expresswayexit
• Turn left on Almaden Expressway
• At Via Monte (third traffic light), make a U-turn
• Proceed north on Almaden Expresswayapproximately 1,000 feet
• Turn right (east) into the campus entrance
From San Francisco:
• Take 280 South to Highway 85 South
• Take Highway 85 South to Almaden Expressway exit
• Turn left on Almaden Plaza Way
• Turn right (south) on Almaden Expressway
• At Via Monte (third traffic light), make a U-turn
• Proceed north on Almaden Expressway approximately1,000 feet
• Turn right (east) into the campus entrance
From Downtown San Jose:
• Take Highway 87 - Guadalupe ExpresswaySouth
• Exit on Santa Teresa Blvd.
• Turn right on Blossom Hill Road
• Turn left at Almaden Expressway
• At Via Monte (first traffic light), make a U-turn
• Proceed north on Almaden Expresswayapproximately 1,000 feet
• Turn right (east) into the campus entrance
From Walnut Creek, Concord and East Bay areas:
• Take 680 South to 280 North
• Exit Highway 87-Guadalupe Expressway South
• Exit on Santa Teresa Blvd.
• Turn right on Blossom Hill Road
• Turn left at Almaden Expressway
• At Via Monte (third traffic light), make a U-turn
• Proceed north on Almaden Expressway approximately1,000 feet
• Turn right (east) into the campus entrance

WATER CONSERVATION AND DEMAND MANAGEMENT COMMITTEE Director Nai Hsueh Director Linda J. LeZotte, Vice Chair Director Richard P. Santos, Chair
Page 1 of 2
AGENDA
WATER CONSERVATION AND DEMAND MANAGEMENT COMMITTEE
MONDAY, APRIL 30, 2018
10:00 a.m. - 12:00 p.m.
Santa Clara Valley Water District Headquarters Building Boardroom
5700 Almaden Expressway San Jose, CA 95118
Time Certain
10:00 a.m. 1. Call to Order/Roll Call
2. Time Open for Public Comment on Any Item Not on the Agenda Comments should be limited to two minutes. If the Committee wishes to discuss a subject raised by the speaker, it can request placement on a future agenda.
3. Approval of Minutes 3.1 Approval of Minutes – February 28, 2018, meeting
4. Discussion/Action Items 4.1 Water Conservation Options for Agriculture (Jerry De La Piedra)
Recommendation: This is a discussion item and the Committee may provide comments, however, no action is required.
4.2 Water Supply Reliability Level of Service Goal (Michael Martin) Recommendation: This is a discussion item and the Committee may provide comments, however, no action is required. 4.3 Water Supply Master Plan “No Regrets” Programs (Neeta Bijoor) Recommendation: 1. Receive information on the status of planning for implementation of the Water Supply Master Plan’s “No Regrets” package and 2. Provide comment to the Board on the implementation of the Advanced Metering Infrastructure program. 4.4 Current Water Conservation Programs and Resources (Karen Koppett) Recommendation: Provide comment to the Board in the implementation of the District’s mission as it applies to the Current Water Conservation Programs and Resources. 4.5 Review of Water Conservation and Demand Management Committee Work Plan, the Outcomes of Board Action of Committee Requests and the Committee’s Next Meeting Agenda (Committee Chair) Recommendation: Review of Water Conservation and Demand Management Committee Work Plan, any Outcomes of Board Action or Committee Requests and the Committee’s Next Meeting Agenda.
Page 2 of 2
5. Clerk Review and Clarification of Committee’s Requests This is an opportunity for the Clerk to review and obtain clarification on any formally moved, seconded, and approved requests and recommendations made by the Committee during discussion of Item 4.
6. Adjourn: Adjourn
REASONABLE EFFORTS TO ACCOMMODATE PERSONS WITH DISABILITIES WISHING TO ATTEND COMMITTEE MEETINGS WILL BE MADE. PLEASE ADVISE THE CLERK OF THE BOARD OFFICE OF ANY SPECIAL NEEDS BY CALLING (408) 630-2277.
Meetings of this committee will be conducted in compliance with all Brown Act requirements. All public records relating to an open session item on this agenda, which are not exempt from disclosure pursuant to the California Public Records Act, that are distributed to a majority of the legislative body will be available for public inspection at the same time that the public records are distributed or made available to the legislative body, at the following location: Santa Clara Valley Water District, Office of the Clerk of the Board 5700 Almaden Expressway, San Jose, CA 95118 Water Conservation and Demand Management Committee: Purpose: To support the Board of Directors in achieving its policy to provide a reliable water supply to meet current and future water usage by making policy recommendations related to demand management.

WATER CONSERVATION AND DEMAND MANAGEMENT COMMITTEE MEETING
DRAFT MINUTES
Page 1 of 3
WEDNESDAY, FEBRUARY 28, 2018 11:30 AM
(Paragraph numbers coincide with agenda item numbers)
A regularly scheduled meeting of the Water Conservation and Demand Management Committee was held on February 28, 2018, in the Headquarters Building Conference Room A143 at the Santa Clara Valley Water District, 5700 Almaden Expressway, San Jose, California.
1. CALL TO ORDER/ROLL CALL Chair, Director Richard P. Santos called the meeting to order at 11:34 a.m.
Board Members in attendance were: Director Nai Hsueh (District 5), Director Linda J. LeZotte (District 4), and Director Richard P. Santos (District 3).
Staff members in attendance were: Kurt Arends, Glenna Brambill, Jerry De La Piedra, Vanessa De La Piedra, Marty Grimes, Darin Taylor, and Stan Yamamoto. Guest in attendance were: Michael Bolzowski (California Water Service), Brian Boyer (Cinnabar Hills Golf Club), Anthony Eulo (City of Morgan Hill), Tim Guster (Great Oaks Water Company), Michael Hurley (California Water Service), Curt Rayer, John Tang and Bill Tuttle (San Jose Water Company).
2. TIME OPEN FOR PUBLIC COMMENT ON ANY ITEM NOT ON AGENDA There was no one present who wished to speak.
3. APPROVAL OF MINUTES 3.1 APPROVAL OF MINUTES
It was moved by Director Nai Hsueh, seconded by Director Linda J. LeZotte and unanimously carried, to approve the minutes of the December 14, 2017, Water Conservation and Demand Management Committee meeting, with one correction on page 2, sentence 9, under Agenda Item 4.3,
Page 1
Page 2 of 3
Director Nai Hsueh... (Director Nai Hsueh had questions on the next steps and the
Board’s look at the level of service to assist with the discussion with the stakeholder
group.)
4. ELECT CHAIR AND VICE CHAIR
It was moved by Director Nai Hsueh, seconded by Director Linda J. LeZotte and unanimously carried, to retain Director Richard P. Santos as Chair and Director Linda J. LeZotte as Vice Chair.
5. ACTION ITEMS
5.1 WATER CONSERVATION AND DEMAND MANAGEMENT COMMITTEE 2017 ACCOMPLISHMENTS REPORT
Mr. Jerry De La Piedra and Ms. Glenna Brambill reviewed the materials as outlined in the agenda items and no action was taken.
5.2 DEVELOP WATER CONSERVATION AND DEMAND MANAGEMENT COMMITTEE’S 2018 WORK PLAN, IN CONSIDERATION OF THE FOLLOWING POTENTIAL TOPICS:
CURRENT WATER CONSERVATION PROGRAMS AND RESOURCES
WATER SUPPLY MASTER PLAN “NO REGRETS” PROGRAMS
SHALLOW GROUNDWATER
FIXED/VARIABLE CHARGES
OPEN SPACE CREDIT
STATE’S EFFORT TO MAKE WATER CONSERVATION A CALIFORNIA WAY OF LIFE
Mr. Jerry De La Piedra, Mr. Marty Grimes and Ms. Vanessa De La Piedra reviewed the materials as outlined in the agenda items and a Fact Sheet on drought and Water Supply Impacts was distributed.
Mr. Darin Taylor was available to answer questions.
Director LeZotte requested that the Climate Plan be added to the work plan and have the City of San Jose’s Environmental Services Division (ESD) come and make a presentation. Director Nai Hsueh, Mr. Tim Guster, Director Linda J. LeZotte, Mr. Michael Hurley, Director Richard P. Santos, Mr. Anthony Eulo, Mr. Brian Boyer and Mr. John Tang had questions of the subject topics. No action was taken.
5.3 SCHEDULE THE COMMITTEE’S NEXT MEETING The Committee discussed the next meeting to be held on Monday, April 30, 2018, at 10:00 a.m.
Page 2
Page 3 of 3
6. CLERK REVIEW AND CLARIFICATION OF COMMITTEE’S REQUESTS Board Committee Liaison Ms. Glenna Brambill stated there were no action items for Board consideration.
7. ADJOURNMENT Chair Santos adjourned at 12:30 p.m. to the next regularly scheduled to the next scheduled meeting on Monday, April 30, 2018, at 10:00 a.m., in the Santa Clara Valley Water District Headquarters Building Boardroom.
Glenna Brambill
Board Committee Liaison Office of the Clerk of the Board
Approved:
Page 3

This Page Intentionally Left Blank Page 4
Page 1 of 2
Committee: Water Conservation and
Demand Management
Meeting Date: 04/30/18
Agenda Item No.: 4.1
Unclassified Manager: Garth Hall
Email: [email protected]
Est. Staff Time: 10 minutes
COMMITTEE AGENDA MEMO
SUBJECT: Water Conservation Options for Agriculture
RECOMMENDED ACTION: This is a discussion item and the Committee may provide comments, however, no action is required. SUMMARY: Over the last few years the Board has been discussing the Open Space Credit as it’s applied to groundwater charges for agriculture. To assist the growers in lieu of continuing the current level of the Open Space Credit, several options were recently presented to the Board’s Agriculture Advisory Committee (AAC), including:
Discount to growers that demonstrate improved efficiency (likely an expansion of the District’s current Mobile Irrigation Lab (MIL) program)
Discount for fallowing land during water shortage
Incentives for installing efficient irrigation equipment
The AAC discussed the three options, sharing their concerns as to why they didn’t think they were feasible. One reason was many thought the growers were already efficient, both in their practices as well as they type of irrigation system being utilized (i.e. drip irrigation). To confirm this, the District may wish to undertake a study to document both the types of irrigation methods currently being used as well as the level of efficiency. This would likely start with a review of the LPRCD MIL program data, going back to 2011. There is also data available from the Central Coast Regional Water Quality Control Board and Santa Clara County. Several agencies, including NASA, U.S. Department of Agriculture-Natural Resources Conservation Service, and the Farm Bureau have data and may be willing to partner with the district on such a study. The Mobile Irrigation Lab Program Currently, the water district, in cooperation with the Loma Prieta Resource Conservation District (LPRCD), provides growers in Santa Clara County free irrigation system evaluations and irrigation efficiency services through the MIL program. The goal of the MIL program is to provide growers with information on how to improve their overall irrigation efficiency. In addition, the program includes a nutrient management component to help protect groundwater quality. All growers in the water district’s service area are eligible to receive a thorough irrigation system evaluation that includes a distribution uniformity (DU) assessment, a system audit that checks pressure readings throughout the system and identifies major leaks or breaks, and a summary report with recommendations that can be used to help improve overall irrigation system performance. Selected growers are also able to utilize intensive season long irrigation efficiency services that include the system evaluation along with irrigation water flow monitoring with flow meters, soil moisture monitoring and weekly
Page 5

Page 2 of 2
irrigation scheduling recommendations based on crop type and size, soil type, and local evapotranspiration data. BACKGROUND: The District is required to implement an agriculture irrigation efficiency program as part of its Central Valley Project imported water contract. Starting in the late 1990s and running through 2008, the MIL program was implemented by an outside consultant hired by the District. The program experienced moderate results in terms of participation rates, especially when coupled with a nutrient management component; however, there were difficulties in measuring program effectiveness as the growers were not willing to share the data required to perform the analysis (there seemed to be an overall lack of trust by the growers towards government agencies). In 2009, the District tried a different approach by partnering with the Farm Bureau (FB) on a three-year program. Although the program only focused on 10 growers, the idea was these growers would act as ambassadors and share what they learned with others. The FB was responsible for all aspects of the program, including hiring and overseeing the work of the technical consultant. Because of their relationship with the growers, the FB was given access to the data needed to perform a more detailed analysis for each grower. The FB’s final report (Attachment 1) documented an overall improvement for most of the sites and the participating growers have been sharing their results with others. Since the conclusion of the FB program, the District has partnered with the Loma Prieta Resource Conservation District (LPRCD) to offer a joint irrigation efficiency and nutrient management program. The CY 2016 Annual Report is attached for reference (Attachment 2). The CY 2017 Annual Report is still in draft form, however highlights from CY 2017 include:
The mobile lab team worked with 15 growers representing 637 total acres to perform irrigation system evaluations in a variety of row crops, tree crops and greenhouse crops on over 130 acres from June to October 2017
Grower feedback has been very positive, and the program continues to gain momentum through word-of-mouth promotion amongst growers and program promotion at workshops and meetings in the community
The current Cooperative Agreement with LPRCD will continue the partnership through December 31, 2018. ATTACHMENT(S): Attachment 1: 2011 Santa Clara Farm Bureau Irrigation Efficiency Program – Final Report Attachment 2: Mobile Irrigation Laboratory Irrigation System Evaluation Annual Report – 2016
Page 6

2011 Santa Clara Farm Bureau Irrigation Efficiency Program
Final Report
Attachment 1 Page 1 of 42
Page 7

2011 Santa Clara Farm Bureau Irrigation Efficiency Program - Final Report
Page 2 of 42
Introduction
The Santa Clara Valley Water District, in collaboration with the Santa Clara County Farm Bureau,
funded an Irrigation Efficiency Program (IEP) for Santa Clara growers. The IEP began in 2009 and
continued through 2011. The program focused on working intensively with 10 cooperating
growers per year with the goal of improving their irrigation to at least 80% efficiency over three
years. The main tools of the project were to evaluate the efficiency of the irrigation systems,
recommend ways to improve the uniformity and scheduling of the irrigations, and monitor
progress made in achieving higher irrigation efficiencies. The growers are working with the Santa
Clara County Farm Bureau, University of California Cooperative Extension, and the Resource
Conservation District of Monterey County to achieve these goals.
Participants in the 2011 IEP represent a cross-section of crops grown in the Santa Clara Valley
(wine grapes, cherries, fresh market tomatoes, Asian vegetables, peppers, celery, turf grass, and
potted flowers), and a cross section of irrigation methods (overhead sprinklers, micro-sprinklers,
surface placed drip tape, buried drip tape, and emitterized drip hose). For this year only, we
added a Chinese Nursery grower and exchanged one vegetable grower for another adjacent
grower. Both large and small commercial operations participated in the program. The 10 growers
participating in 2011 farmed a combined total of 2,146 acres in Santa Clara County. Over the 3
years, we worked with 12 growers. Those 12 farm a combined total of 4,591 acres in the county.
The tasks and procedures performed included outreach to growers, installing test equipment
(flow meters, dataloggers, soil moisture sensors, pressure gauges, etc.), field evaluations
conducted by trained staff using standardized procedures, conducting the distribution uniformity
and irrigation system evaluations, estimating water use efficiency of the crops; data analysis,
report writing, and overall tracking and administration.
Three Years in Review
Over the past three irrigation seasons, the Santa Clara County Farm Bureau has partnered with the
Santa Clara Valley Water District, University of California Cooperative Extension, the Central Coast
Agricultural Water Quality Coalition and the Resource Conservation District of Monterey County
to conduct an Irrigation Efficiency Program with 10 growers representing a wide diversity of
crops, irrigation systems, and operation size. The purpose of the program was to assist each
grower in addressing irrigation system and management inefficiencies in their respective
operational contexts through progressive evaluations of Distribution Uniformity, season-long
water use relative to estimated crop need, and the irrigation system infrastructure for the given
field.
The program focused on intensive evaluation of one field per grower. The idea being that the
things learned on that field could be used on all of the other fields to leverage the improvements.
Attachment 1 Page 2 of 42
Page 8

2011 Santa Clara Farm Bureau Irrigation Efficiency Program - Final Report
Page 3 of 42
The growers had the choice of using their most representative field or their most challenging field
each year – whichever was most likely to improve their overall efficiency. The first year of the
program, many of the growers started on a representative field. All 10 were very interested in the
results and most moved fields to focus on their greatest challenges the second and third years.
The value of focusing on challenging areas is the opportunity to improve fields that are
underperforming the rest of the farm and thus improve the farms’ overall efficiency. However,
because the efficiency numbers are much lower on underperforming fields and some of the
problems found and fixed in the prior years’ fields show up in the new fields, the results can be
embarrassing to the farmer if published – and make the program look as if it too is
underperforming because the efficiency numbers dropped. The growers were very excited about
what they learned and reported that they had transferred what they learned to their other fields.
Unfortunately, two growers were excited but also very embarrassed with their results and
dropped the program so as not to have to have the results reported. Both of those growers
wanted to solve the problems, however, and both have hired a well-respected irrigation/nutrient
management consultant to help them improve their efficiency privately. At the request of the
farmers, the Farm Bureau and UCCE have assisted that transfer with the information from the first
2 years’ evaluations to help the consultant be most effective as quickly as possible.
In all, twelve producers participated, as two of the original ten (as reported above) were replaced
with new growers in 2011. Eleven of the twelve growers who participated in the program over
the three years reported that they considered the information gained from our evaluations and
recommendations valuable and extendable to other aspects of their operations. They made
adjustments to their operations’ water use efficiency and many ended with plans for testing other
changes beyond the timespan of this program.
Including all of the growers that participated over the three year span of the program, Distribution
Uniformities averaged just over 80%, with a slight decrease (82% to 80%) between 2009 and
2011. For the eight growers that stayed with the program the entire three years, DU increased on
average from 83 to 86%. For those same eight growers, average Irrigation Efficiency of the fields
studied actually decreased over time from 86% to 79%, but this included the two vegetable
growers who purposefully chose more challenging fields to study in the last year of the program.
Excluding those two growers, average IE for the remaining six growers remained at just over 90%
throughout the program, with the only decrease being associated with the turf grower. Like the
vegetable growers, however, he was very committed to the program and made numerous changes
in response to our recommendations to address the water use efficiency challenges with his crop.
Comments that we got from 9 growers participating in their final 2011 interviews with Dr. Cahn to
review results included:
Attachment 1 Page 3 of 42
Page 9
2011 Santa Clara Farm Bureau Irrigation Efficiency Program - Final Report
Page 4 of 42
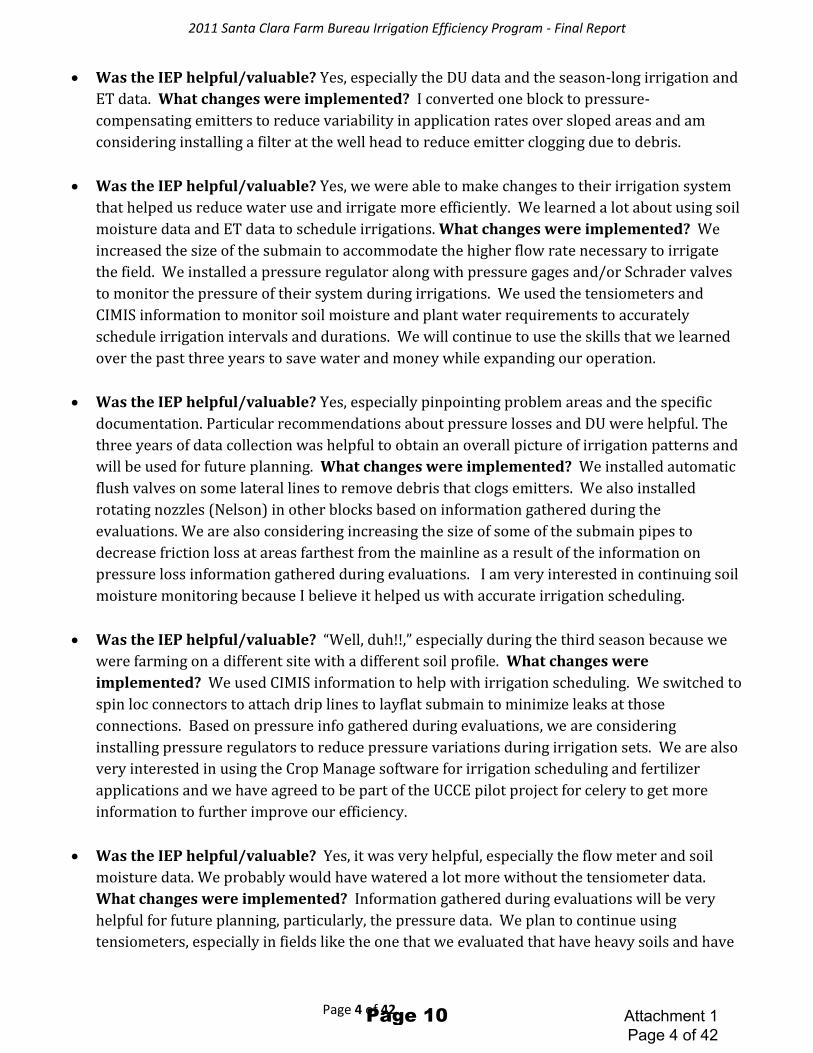
Was the IEP helpful/valuable? Yes, especially the DU data and the season-long irrigation and
ET data. What changes were implemented? I converted one block to pressure-
compensating emitters to reduce variability in application rates over sloped areas and am
considering installing a filter at the well head to reduce emitter clogging due to debris.
Was the IEP helpful/valuable? Yes, we were able to make changes to their irrigation system
that helped us reduce water use and irrigate more efficiently. We learned a lot about using soil
moisture data and ET data to schedule irrigations. What changes were implemented? We
increased the size of the submain to accommodate the higher flow rate necessary to irrigate
the field. We installed a pressure regulator along with pressure gages and/or Schrader valves
to monitor the pressure of their system during irrigations. We used the tensiometers and
CIMIS information to monitor soil moisture and plant water requirements to accurately
schedule irrigation intervals and durations. We will continue to use the skills that we learned
over the past three years to save water and money while expanding our operation.
Was the IEP helpful/valuable? Yes, especially pinpointing problem areas and the specific
documentation. Particular recommendations about pressure losses and DU were helpful. The
three years of data collection was helpful to obtain an overall picture of irrigation patterns and
will be used for future planning. What changes were implemented? We installed automatic
flush valves on some lateral lines to remove debris that clogs emitters. We also installed
rotating nozzles (Nelson) in other blocks based on information gathered during the
evaluations. We are also considering increasing the size of some of the submain pipes to
decrease friction loss at areas farthest from the mainline as a result of the information on
pressure loss information gathered during evaluations. I am very interested in continuing soil
moisture monitoring because I believe it helped us with accurate irrigation scheduling.
Was the IEP helpful/valuable? “Well, duh!!,” especially during the third season because we
were farming on a different site with a different soil profile. What changes were
implemented? We used CIMIS information to help with irrigation scheduling. We switched to
spin loc connectors to attach drip lines to layflat submain to minimize leaks at those
connections. Based on pressure info gathered during evaluations, we are considering
installing pressure regulators to reduce pressure variations during irrigation sets. We are also
very interested in using the Crop Manage software for irrigation scheduling and fertilizer
applications and we have agreed to be part of the UCCE pilot project for celery to get more
information to further improve our efficiency.
Was the IEP helpful/valuable? Yes, it was very helpful, especially the flow meter and soil
moisture data. We probably would have watered a lot more without the tensiometer data.
What changes were implemented? Information gathered during evaluations will be very
helpful for future planning, particularly, the pressure data. We plan to continue using
tensiometers, especially in fields like the one that we evaluated that have heavy soils and have
Attachment 1 Page 4 of 42
Page 10

2011 Santa Clara Farm Bureau Irrigation Efficiency Program - Final Report
Page 5 of 42
different soil profiles across the field. We have started using a different type of filter (Amiad)
this year to prevent emitter clogging.
Was the IEP helpful/valuable? Yes, especially for irrigation scheduling and for utilizing flow
meter and data logger info to implement more precise scheduling practices in 2012. What
changes were implemented? We are doing more supervision and irrigation scheduling
training with irrigators. We are also considering using pressure regulating valves at each
block and intend to flush the lateral lines on a regular basis to prevent drip emitter clogging on
our subsurface drip tape.
Was the IEP helpful/valuable? Yes, it was a great training tool for the ground crew and
irrigator. We now have a much better understanding of our water use due to the information
gathered during this program and the collaboration with the UCCE. What changes were
implemented? We are considering using pressure compensators at each head to increase DU
and reduce pressure variability at the heads. We are also using CIMIS data to help with
irrigation scheduling.
Was the IEP helpful/valuable? Yes, it really helped us understand how to adjust pressure at
individual blocks to maximize the system efficiency. What changes were implemented? We
changed the irrigation block configuration to optimize pressure performance. We are planning
to install automatic flush valves on the ends of each lateral to help prevent emitter clogging.
We also plan to use Decagon Echo 10HS sensors to measure volumetric water content from
now on after seeing and interpreting the data provided from the IEP season-long evaluations.
Was the IEP helpful/valuable? Yes, especially runoff data and the 2011 experiments with
pressure compensating emitters to increase efficiency at areas with pinched spaghetti lines.
What changes were implemented? Our new greenhouses will reuse the runoff water in our
trial fields and utilize automatic timers for precisely timed irrigation run times. We plan to
continue monitoring runoff, preferably with the continued support of UCCE. We also plan to
install pressure regulators at the submain/lateral junction in the new greenhouses.
The stated numeric goal for the program was 80% water use efficiency for each grower. While
this was a foregone conclusion for the four growers deficit-irrigating their crops for fruit quality
(efficiency was over 100% regardless of DU), the same drive for fruit quality had the opposite
impact for the four green vegetable producers involved in the program. Although one vegetable
grower rigorously changed his practices to maximize water use efficiency, in general, the need for
marketable (blemish-free) vegetables, which are highly sensitive to drought stress, overruled cost-
savings and steadfast commitment to reducing water applications to Et estimations. Each of the
vegetable growers received our evaluation results with keen interest and made corresponding
changes to their systems to improve irrigation and fertilizer efficiencies and/or distribution
uniformity on given fields. They reported gaining valuable information for how to improve their
Attachment 1 Page 5 of 42
Page 11

2011 Santa Clara Farm Bureau Irrigation Efficiency Program - Final Report
Page 6 of 42
efficiency while maintaining product quality. However, including efforts to tie irrigation amounts
to CIMIS Et estimates, attaining a season-long irrigation efficiency of 80% remains a substantial
challenge.
In funding this program, the SCVWD supported the kind of on-ground, collaborative assessment
and information exchange that will be critical for supporting the District’s and growers’ needs to
balance the pressures from within their operations, the market, regulation, economy, and resource
(water) conservation. Every participant in the program made strides to varying degrees in
addressing those challenges and will need to continue to do so to remain viable in the future.
Water use efficiency in the context of productive agriculture cannot be created by fiat. Such
intensive field work as was conducted over the past three years will remain a critical part of
developing lasting water use efficiency solutions for agriculture in the Santa Clara Valley.
Summary of 2011 Irrigation System Changes All but one grower reported changing or plans to change elements of their irrigation systems.
Some growers have applied to the NRCS for Environmental Quality Incentives Program (EQIP)
funds to make more costly changes in their systems. Tables 3-12 below summarize the types of
irrigation challenges found during our 2011 evaluations, the numbers of practices we
recommended after estimating each system’s irrigation efficiency, and the practices the growers
had already reported that they planned to adopt. As in 2009 and 2010, the top recommended
practices address challenges with irrigation scheduling, leaks, potential plugging, and pressure
regulation.
Attachment 1 Page 6 of 42
Page 12
2011 Santa Clara Farm Bureau Irrigation Efficiency Program - Final Report
Page 7 of 42
Growers exceeded CIMIS-based crop evapotranspiration (ETc) estimates for two reasons: use of
irrigation to establish the crop and to achieve high product quality (for example, to minimize
sunburn of peppers and reduce pith in celery).
Overall, the greatest inefficiencies were tied to the amount of irrigation used during the
establishment phase in the row crops (celery, peppers and Asian vegetables) to ensure product
quality, which is an ongoing challenge for row crop growers. That being said, when we limit our
focus to the water use efficiency of the growers not achieving high efficiency overall to efficiency
during the post-establishment phase of these crops only, the numbers for most increased
significantly, e.g.; from 53 to 63.3%, from 81 to 93%, and from 43 to 61%. One grower had
significant problems with his driplines through much of the season which meant that he had to
overwater in some areas to compensate for low uniformity and his efficiency only rose to 29.2%
post-establishment. That grower was very focused on improving. He selected his most
challenging field each year and actively worked with our field crews throughout the growing
season. He has already hired an independent consultant to help him for 2012.
Description of IEP services offered There was an initial consultation with each grower to update background information on their
crop production and irrigation practices, changes resulting from 2010 recommendations, and this
year’s goals for participating in the irrigation efficiency program. At that time, we also agreed
upon which field to evaluate and discussed the logistics of installing, maintaining or relocating
flow meters, photo voltaic panels, soil moisture sensors, and their accompanying data loggers.
Distribution uniformity (DU) was measured on the one field each grower asked us to evaluate. DU
is a measurement of how evenly an irrigation system applies water across a given area.
We determined the lowest quarter distribution uniformity (DUlq), meaning that the average of the
lowest 25% of measurements of applied water divided by the average of all measurements. We
further measured the lowest 10%, emitter discharge rates, and system flow rates. Additionally,
pressure uniformity was evaluated and the average application rate (inches/hour) of the system
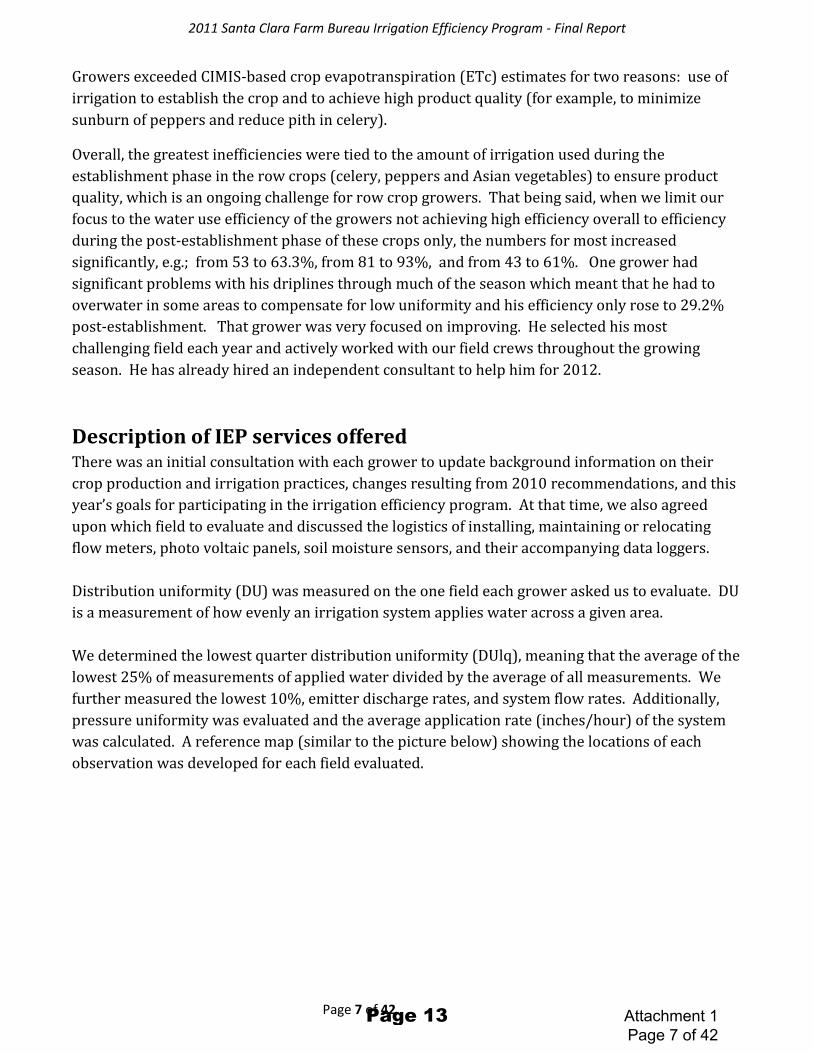
was calculated. A reference map (similar to the picture below) showing the locations of each
observation was developed for each field evaluated.
Attachment 1 Page 7 of 42
Page 13
2011 Santa Clara Farm Bureau Irrigation Efficiency Program - Final Report
Page 8 of 42
Map of field and location of pressure and DU measurements. Numbers show location of pressure
readings.
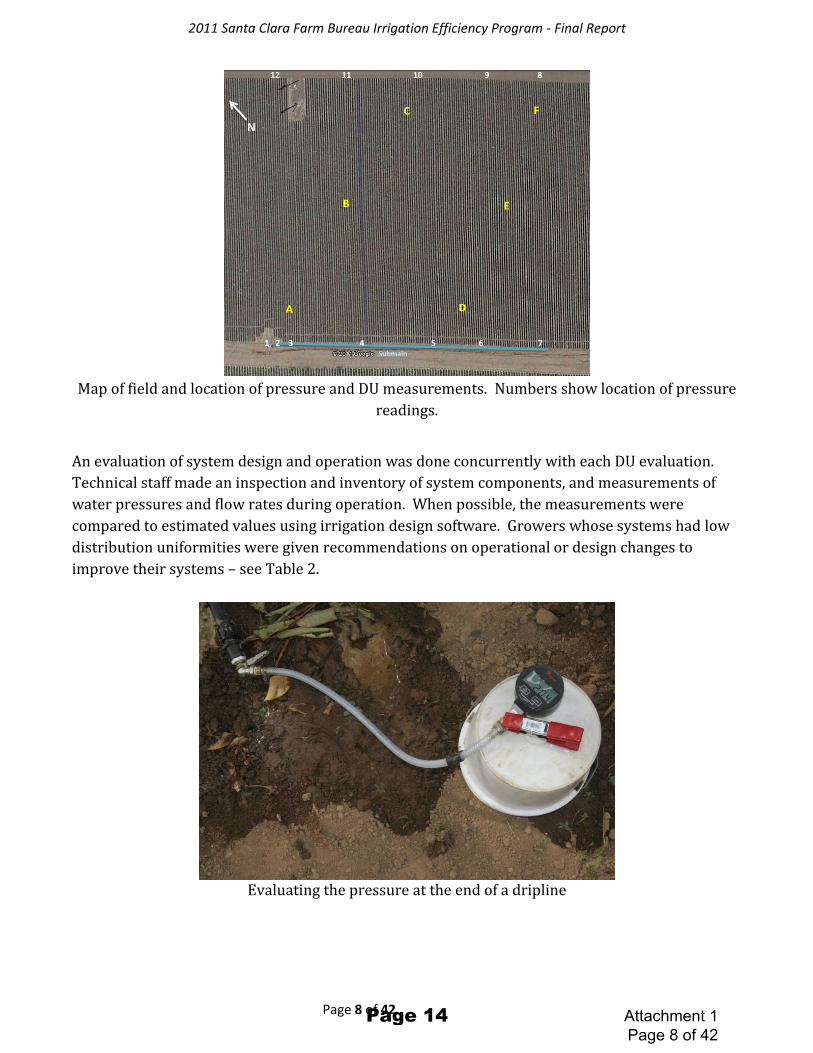
An evaluation of system design and operation was done concurrently with each DU evaluation.
Technical staff made an inspection and inventory of system components, and measurements of
water pressures and flow rates during operation. When possible, the measurements were
compared to estimated values using irrigation design software. Growers whose systems had low
distribution uniformities were given recommendations on operational or design changes to
improve their systems – see Table 2.
Evaluating the pressure at the end of a dripline
1 2 3 4 5 6 7
12 11 10 9 8
A
F
E
D
C
B
N
Attachment 1 Page 8 of 42
Page 14

2011 Santa Clara Farm Bureau Irrigation Efficiency Program - Final Report
Page 9 of 42
flow monitoring data logging array
Attachment 1 Page 9 of 42
Page 15
2011 Santa Clara Farm Bureau Irrigation Efficiency Program - Final Report
Page 10 of 42
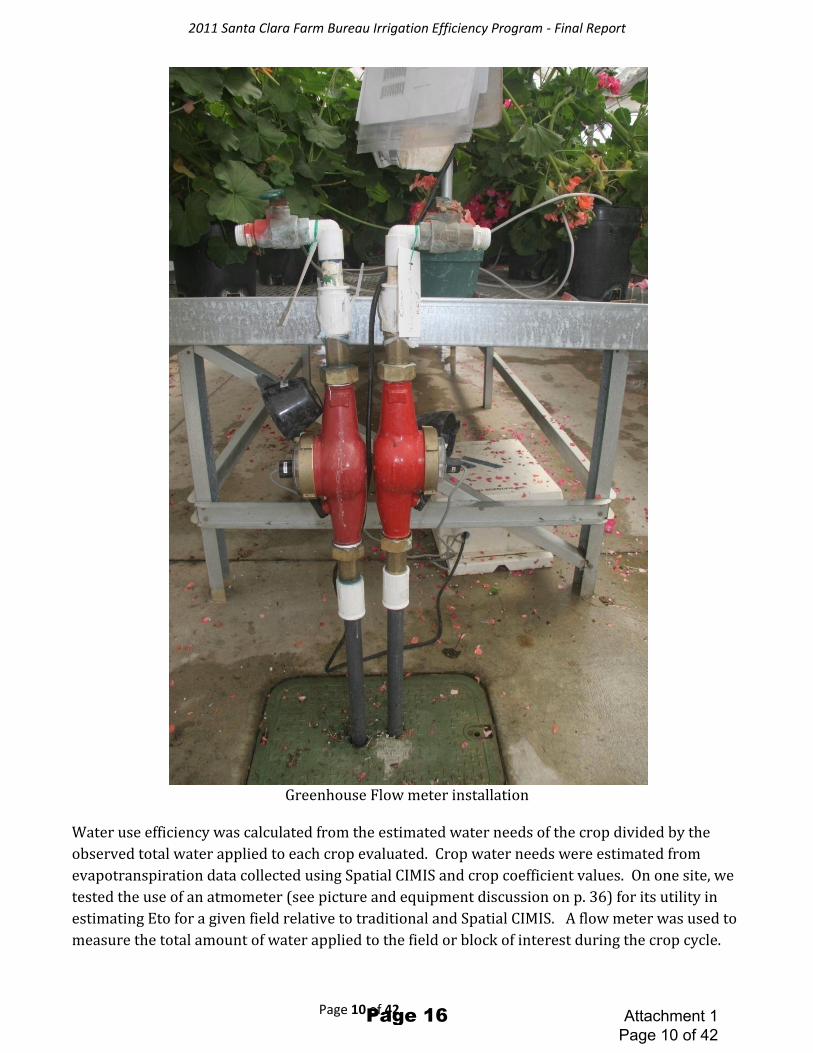
Greenhouse Flow meter installation
Water use efficiency was calculated from the estimated water needs of the crop divided by the
observed total water applied to each crop evaluated. Crop water needs were estimated from
evapotranspiration data collected using Spatial CIMIS and crop coefficient values. On one site, we
tested the use of an atmometer (see picture and equipment discussion on p. 36) for its utility in
estimating Eto for a given field relative to traditional and Spatial CIMIS. A flow meter was used to
measure the total amount of water applied to the field or block of interest during the crop cycle.
Attachment 1 Page 10 of 42
Page 16

2011 Santa Clara Farm Bureau Irrigation Efficiency Program - Final Report
Page 11 of 42
The flow meter was connected to a datalogger to record all irrigation events. Crop coefficient
values were adjusted by direct measurements of the crop’s canopy cover. A water use efficiency
ratio was calculated by dividing the estimated water needs of the crop by the amount of water
applied during the crop cycle. A summary of the irrigation schedule was compared to the daily
estimates of the water needs of the crop.
Early season infrared pictures of crop canopy
Late season infrared pictures of the same crop’s canopy
Attachment 1 Page 11 of 42
Page 17

2011 Santa Clara Farm Bureau Irrigation Efficiency Program - Final Report
Page 12 of 42
Seven fields had soil moisture monitors installed. Soil moisture was monitored during the crop
cycle using watermark blocks, tensiometers and/or dielectric moisture sensors. The soil moisture
sensors were located at 3 locations in each of the seven fields. They were placed at 2 to 3 ft
depths, and a datalogger recorded changes in soil moisture.
After the end of the crop cycle, we analyzed the data and prepared the results. We held a meeting
with all ten growers to review the results and discuss their various issues, reactions, and learnings
so that all could learn from each other and the overall results. Comments included …
We found that it needed more labor and equipment to obtain that higher distribution uniformity so doing it was a trade off and the value was affected by the crop market price.
Identifying the problems on this field helped us plan as we start new fields. We are paying more now at the initial system installations but are very happy with the results.
We are putting the tensiometers in much deeper now. It has made a huge difference.
We are now training all staff at the beginning of the year to find and fix leaks.
We have changed the volume and scheduling for our irrigation.
We were very dubious the first year but now, after three years, we have found this program to be immensely valuable.
We have learned what are the real issues instead of accepting what we had as par for course. It has really helped our water use.
I need more help knowing what technology is available – and what works.
I would like CIMIS closer to my location.
I loved having the instant feedback from the tensiometers. We are putting them in all of our fields.
This was a real eye-opener. We will be recycling all of our runoff so that we are wasting less water.
The most valuable part was the specificity of the recommendations.
The most valuable part was for us was the technology evaluations.
The most valuable part was information on flow rates, drip tape, and distribution uniformity.
The most valuable part was system design advice.
In addition, we met with each grower individually to discuss their particular results and address
specific questions and recommendations. Comments from the one on one discussions are
provided on pages 4-5 above.
Attachment 1 Page 12 of 42
Page 18
2011 Santa Clara Farm Bureau Irrigation Efficiency Program - Final Report
Page 13 of 42
Summary of accomplishments in 2011
Distribution Uniformity
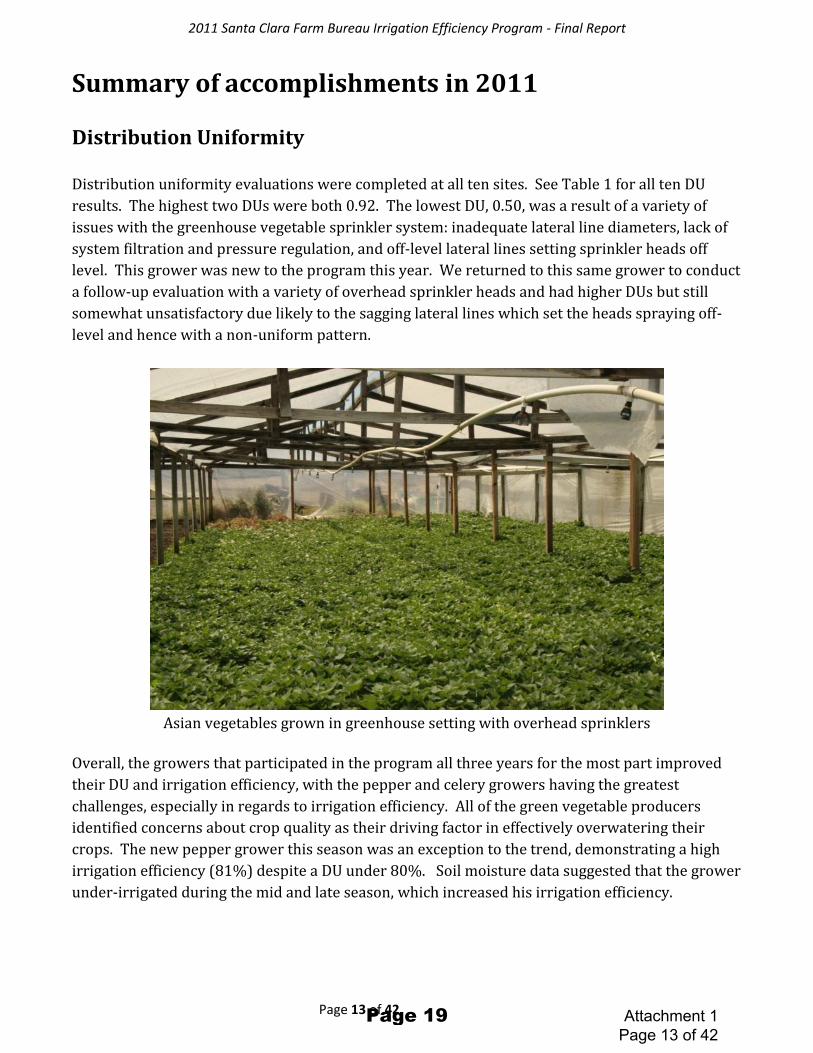
Distribution uniformity evaluations were completed at all ten sites. See Table 1 for all ten DU
results. The highest two DUs were both 0.92. The lowest DU, 0.50, was a result of a variety of
issues with the greenhouse vegetable sprinkler system: inadequate lateral line diameters, lack of
system filtration and pressure regulation, and off-level lateral lines setting sprinkler heads off
level. This grower was new to the program this year. We returned to this same grower to conduct
a follow-up evaluation with a variety of overhead sprinkler heads and had higher DUs but still
somewhat unsatisfactory due likely to the sagging lateral lines which set the heads spraying off-
level and hence with a non-uniform pattern.
Asian vegetables grown in greenhouse setting with overhead sprinklers
Overall, the growers that participated in the program all three years for the most part improved
their DU and irrigation efficiency, with the pepper and celery growers having the greatest
challenges, especially in regards to irrigation efficiency. All of the green vegetable producers
identified concerns about crop quality as their driving factor in effectively overwatering their
crops. The new pepper grower this season was an exception to the trend, demonstrating a high
irrigation efficiency (81%) despite a DU under 80%. Soil moisture data suggested that the grower
under-irrigated during the mid and late season, which increased his irrigation efficiency.
Attachment 1 Page 13 of 42
Page 19

2011 Santa Clara Farm Bureau Irrigation Efficiency Program - Final Report
Page 14 of 42
Existing sprinklers (above) and rotators (below)
Attachment 1 Page 14 of 42
Page 20

2011 Santa Clara Farm Bureau Irrigation Efficiency Program - Final Report
Page 15 of 42
Table 1. 2011 Summary of crop and irrigation systems evaluated and corresponding
seasonal irrigation efficiency and distribution uniformity.
Crop Irrigation
method Irrigation Efficiency
Distribution Uniformity lowest
quarter
----------------- % ------------
cherry microsprinkler 100 81
greenhouse mums drip 75 92
winegrape drip 100 92
winegrape drip 100 90
turf grass sprinkler 72 74
Asian vegetable* sprinkler 43 50
tomato drip 100 92
pepper* drip 81 79
pepper drip 28 83
celery drip 53 88
Average 75 82
Table2 is a summary of recommended solutions based on the irrigation system evaluations.
Irrigation system evaluations were done concurrently with the distribution uniformity
evaluations.
Table 2: Recommended solutions as determined by initial irrigation system evaluations
Recommendations # of
growers
APPLICATION VOLUME MANAGEMENT
Consider applying less water with each irrigation event:
To avoid leaching nutrients.
If the field was recently irrigated to reduce drainage below the root zone.
To minimize drainage beyond the root zone of the crop.
With sprinklers during transplant establishment.
1. 4
Install pressure regulators to ensure consistent application rates for each irrigation event.
4
Evaluate if the amount (inches) of water applied during transplant 1
Attachment 1 Page 15 of 42
Page 21

2011 Santa Clara Farm Bureau Irrigation Efficiency Program - Final Report
Page 16 of 42
establishment can be reduced.
Consider using a flow meter to monitor the volume of water applied with each
irrigation.
1
Evaluate if additional water during July and August increases yield and
maintains fruit quality.
1
LEAKS & DRAINAGE
Fix leaks along the submain. 5
Fix leaks in lateral lines 2
Level lateral lines (1.5 inch PVC pipe) so that they can completely drain after
an irrigation and assure that sprinkler heads are pointed directly down so that
they spray evenly.
1
2.
HEADS, EMITTERS, AND CLOGGING 3.
Flush lines regularly (consider using flush valves) 9
Consider using different sprinkler or microsprinkler heads that discharge at a lower rate than the current sprinkler heads, or with a distribution uniformity greater than the present heads or replacing worn heads.
4. 5
Consider using micro-sprinklers or drip emitters that are pressure compensating
3
Assure that all (sprinkler) nozzle orifice diameters are the same and are not worn
1
Periodically inject bleach or similar material to discourage algal growth or root intrusion into the emitters
2
Consider installing check valves at each sprinkler head to prevent algal growth and drainage from the heads after the system is shut down.
1
Assure that filter at pump is operational and regularly cleaned. If not operational, consider installing a filter with 120 mesh screen. If the irrigation water contains substantial debris then consider using higher capacity filters such as disk, sand media, or auto-flushing screen filters.
1
PRESSURE MANAGEMENT
5.
Consider using 7/8” diameter instead of 5/8” drip tape for beds longer than 500’ or use low flow tape (< .25 gpm/100 ft)
1
When using pressure compensating emitters, maintain pressure at 20 psi at the submain.
1
Attachment 1 Page 16 of 42
Page 22

2011 Santa Clara Farm Bureau Irrigation Efficiency Program - Final Report
Page 17 of 42
Install pressure gauges or Schrader valves for monitoring irrigation system pressure.
1
Increase pressure in submain to at least 10 psi to improve uniformity and to
reduce variation in flow rate.
1
Irrigate field in 2 sets or use low flow drip tape so that the irrigation system and water supply flow rates match.
1
WIND
Operate (sprinkler) system under low wind conditions. 1
Irrigation Efficiency
Irrigation Efficiency, for the purposes of this contract, was defined as:
where water beneficially used is calculated from California Irrigation Management Information
System (CIMIS) data and crop coefficients for the crops of interest.
Irrigation efficiency estimates were generated for all ten 2011 sites were evaluated based on
metered water use on each field, the crop coefficients, and CIMIS data. At the end of the season,
individual reports on irrigation efficiency (IE) and distribution uniformity (DU) data were
prepared for each grower. Estimated IEs ranged between 43% and 100%. As in 2010, five
growers had higher IE than expected (based on observed practices) because three were deficit
irrigating to improve fruit quality, while two were unintentionally under irrigating. The following
table shows key information reported to each grower regarding their irrigation. The growers
receive their individual reports during in-person one on one meetings with each grower and
his/her irrigation manager, if any. Summary information on each location can be found in
Appendix 1 below.
Attachment 1 Page 17 of 42
Page 23
2011 Santa Clara Farm Bureau Irrigation Efficiency Program - Final Report
Page 18 of 42
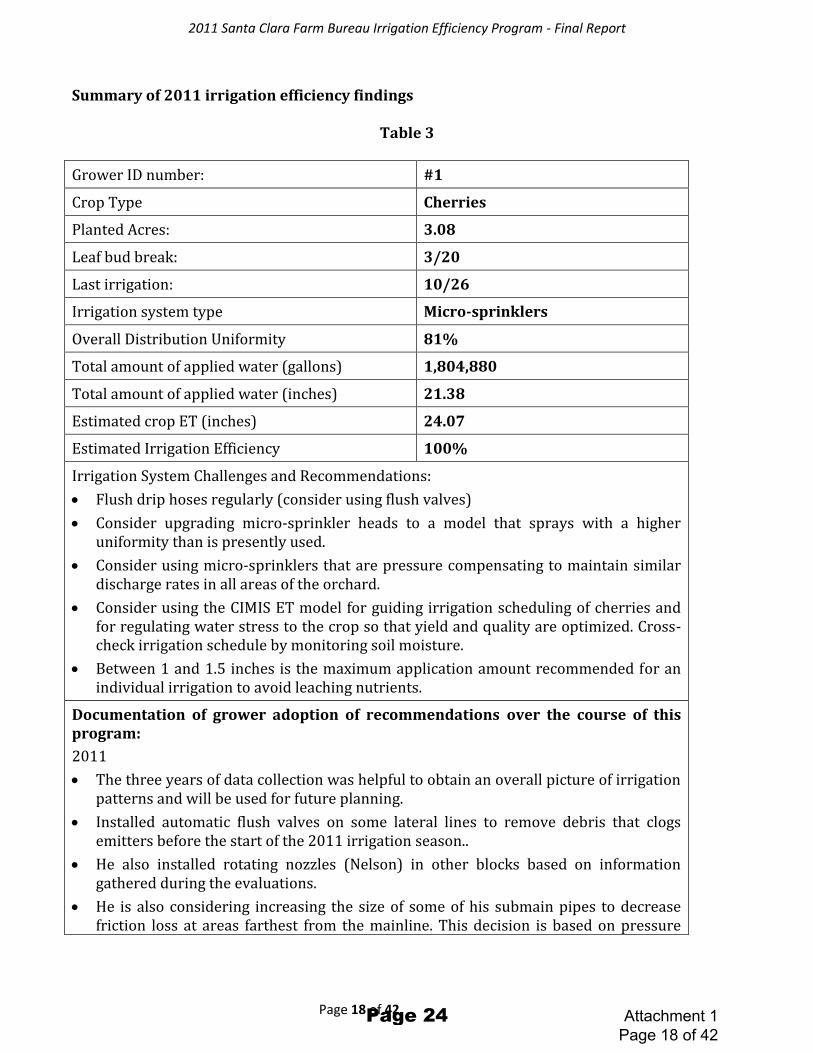
Summary of 2011 irrigation efficiency findings
Table 3
Grower ID number: #1
Crop Type Cherries
Planted Acres: 3.08
Leaf bud break: 3/20
Last irrigation: 10/26
Irrigation system type Micro-sprinklers
Overall Distribution Uniformity 81%
Total amount of applied water (gallons) 1,804,880
Total amount of applied water (inches) 21.38
Estimated crop ET (inches) 24.07
Estimated Irrigation Efficiency 100%
Irrigation System Challenges and Recommendations:
Flush drip hoses regularly (consider using flush valves)
Consider upgrading micro-sprinkler heads to a model that sprays with a higher uniformity than is presently used.
Consider using micro-sprinklers that are pressure compensating to maintain similar discharge rates in all areas of the orchard.
Consider using the CIMIS ET model for guiding irrigation scheduling of cherries and for regulating water stress to the crop so that yield and quality are optimized. Cross-check irrigation schedule by monitoring soil moisture.
Between 1 and 1.5 inches is the maximum application amount recommended for an individual irrigation to avoid leaching nutrients.
Documentation of grower adoption of recommendations over the course of this program:
2011
The three years of data collection was helpful to obtain an overall picture of irrigation patterns and will be used for future planning.
Installed automatic flush valves on some lateral lines to remove debris that clogs emitters before the start of the 2011 irrigation season..
He also installed rotating nozzles (Nelson) in other blocks based on information gathered during the evaluations.
He is also considering increasing the size of some of his submain pipes to decrease friction loss at areas farthest from the mainline. This decision is based on pressure
Attachment 1 Page 18 of 42
Page 24
2011 Santa Clara Farm Bureau Irrigation Efficiency Program - Final Report
Page 19 of 42
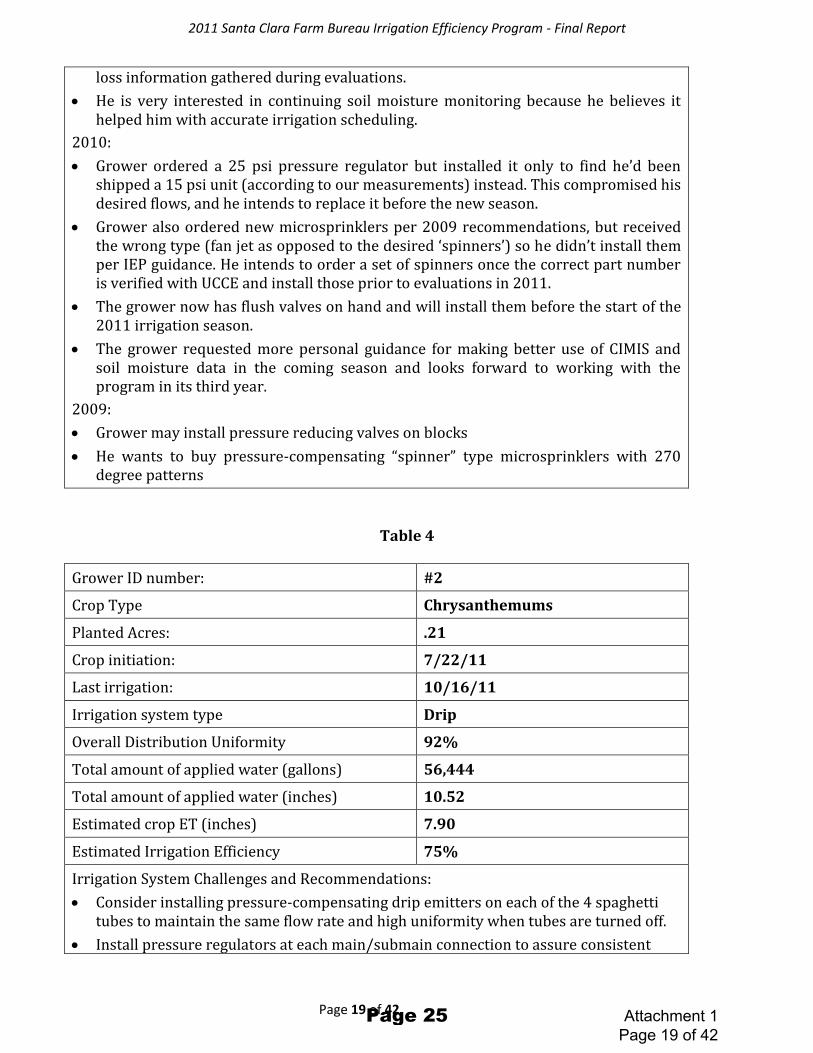
loss information gathered during evaluations.
He is very interested in continuing soil moisture monitoring because he believes it helped him with accurate irrigation scheduling.
2010:
Grower ordered a 25 psi pressure regulator but installed it only to find he’d been shipped a 15 psi unit (according to our measurements) instead. This compromised his desired flows, and he intends to replace it before the new season.
Grower also ordered new microsprinklers per 2009 recommendations, but received the wrong type (fan jet as opposed to the desired ‘spinners’) so he didn’t install them per IEP guidance. He intends to order a set of spinners once the correct part number is verified with UCCE and install those prior to evaluations in 2011.
The grower now has flush valves on hand and will install them before the start of the 2011 irrigation season.
The grower requested more personal guidance for making better use of CIMIS and soil moisture data in the coming season and looks forward to working with the program in its third year.
2009:
Grower may install pressure reducing valves on blocks
He wants to buy pressure-compensating “spinner” type microsprinklers with 270 degree patterns
Table 4
Grower ID number: #2
Crop Type Chrysanthemums
Planted Acres: .21
Crop initiation: 7/22/11
Last irrigation: 10/16/11
Irrigation system type Drip
Overall Distribution Uniformity 92%
Total amount of applied water (gallons) 56,444
Total amount of applied water (inches) 10.52
Estimated crop ET (inches) 7.90
Estimated Irrigation Efficiency 75%
Irrigation System Challenges and Recommendations:
Consider installing pressure-compensating drip emitters on each of the 4 spaghetti tubes to maintain the same flow rate and high uniformity when tubes are turned off.
Install pressure regulators at each main/submain connection to assure consistent
Attachment 1 Page 19 of 42
Page 25

2011 Santa Clara Farm Bureau Irrigation Efficiency Program - Final Report
Page 20 of 42
application rates among irrigation events.
Fix leaks along laterals and spaghetti tubes.
Flush drip hoses regularly (consider using flush valves).
Consider using the CIMIS ET model for guiding irrigation scheduling.
Documentation of grower adoption of recommendations over the course of this program:
2011
Their new greenhouses will reuse the runoff water in their trial fields and utilize automatic timers for precisely timed irrigation run times.
They plan to continue monitoring runoff, preferably with the continued support of UCCE.
They also plan to install pressure regulators at the submain/lateral junction in the new greenhouses.
2010:
Identified leaks on submain were repaired shortly after evaluation was performed in July 2010.
Greenhouse manager will install a pressure regulator in 2011 to reduce variations in flow resulting from varying draws on the shared well for the facility that create variability in pressure delivered to the greenhouse for different irrigations
Manager is considering changing emitter types to both reduce flow rate (2 gph to 1 gph) and provide better pressure compensation. The former will give the irrigator more ‘breathing room’ for managing irrigations (changing run times from 8-10 min to ~15 min.), and the latter will better regulate flows delivered to each pot for improved DU.
Manager is considering setting irrigation valves within the greenhouse on timers to enable irrigator to run even shorter irrigation times if appropriate (per CIMIS recommendations).
2009:
Grower’s parent company is pushing for greater energy efficiency, decreasing of carbon footprints, water conservation, and other management practices.
Grower is very interested in tailwater reuse.
Table 5
Grower ID number: #3
Crop Type Cabernet Sauvignon Wine Grapes
Planted Acres: 9.46
Leaf bud break: 4/20/11
Last irrigation: 10/25/11
Attachment 1 Page 20 of 42
Page 26
2011 Santa Clara Farm Bureau Irrigation Efficiency Program - Final Report
Page 21 of 42
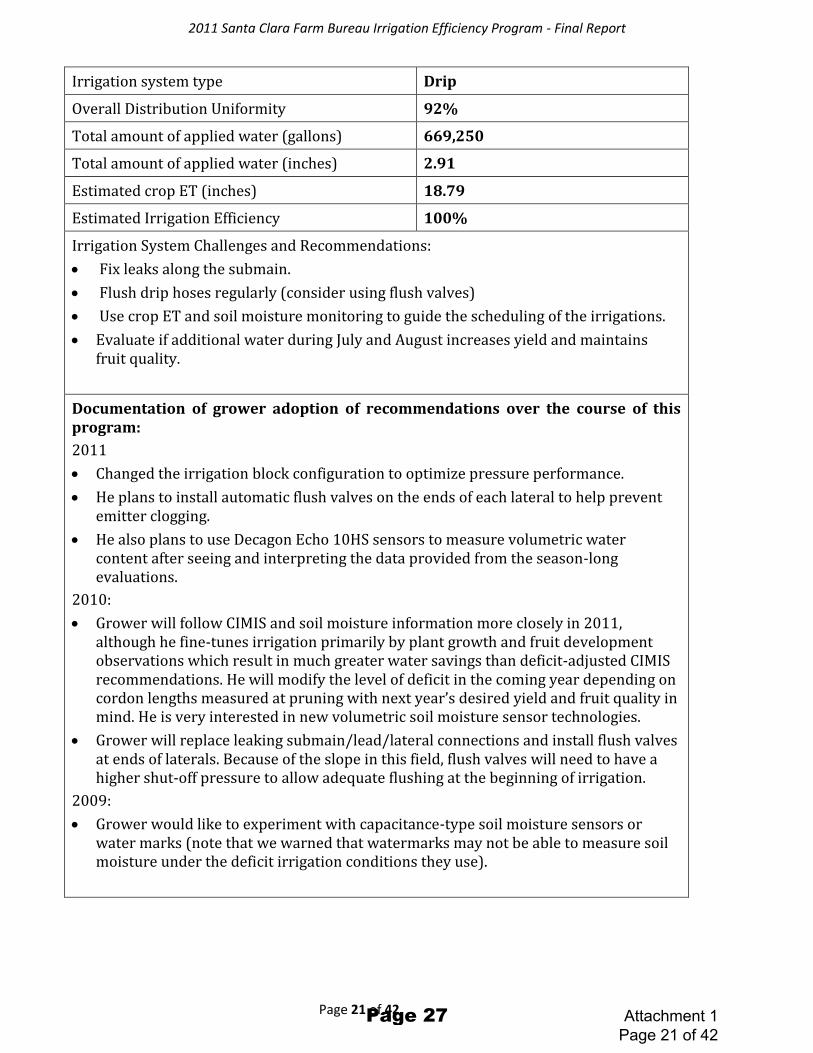
Irrigation system type Drip
Overall Distribution Uniformity 92%
Total amount of applied water (gallons) 669,250
Total amount of applied water (inches) 2.91
Estimated crop ET (inches) 18.79
Estimated Irrigation Efficiency 100%
Irrigation System Challenges and Recommendations:
Fix leaks along the submain.
Flush drip hoses regularly (consider using flush valves)
Use crop ET and soil moisture monitoring to guide the scheduling of the irrigations.
Evaluate if additional water during July and August increases yield and maintains fruit quality.
Documentation of grower adoption of recommendations over the course of this program:
2011
Changed the irrigation block configuration to optimize pressure performance.
He plans to install automatic flush valves on the ends of each lateral to help prevent emitter clogging.
He also plans to use Decagon Echo 10HS sensors to measure volumetric water content after seeing and interpreting the data provided from the season-long evaluations.
2010:
Grower will follow CIMIS and soil moisture information more closely in 2011, although he fine-tunes irrigation primarily by plant growth and fruit development observations which result in much greater water savings than deficit-adjusted CIMIS recommendations. He will modify the level of deficit in the coming year depending on cordon lengths measured at pruning with next year’s desired yield and fruit quality in mind. He is very interested in new volumetric soil moisture sensor technologies.
Grower will replace leaking submain/lead/lateral connections and install flush valves at ends of laterals. Because of the slope in this field, flush valves will need to have a higher shut-off pressure to allow adequate flushing at the beginning of irrigation.
2009:
Grower would like to experiment with capacitance-type soil moisture sensors or water marks (note that we warned that watermarks may not be able to measure soil moisture under the deficit irrigation conditions they use).
Attachment 1 Page 21 of 42
Page 27
2011 Santa Clara Farm Bureau Irrigation Efficiency Program - Final Report
Page 22 of 42
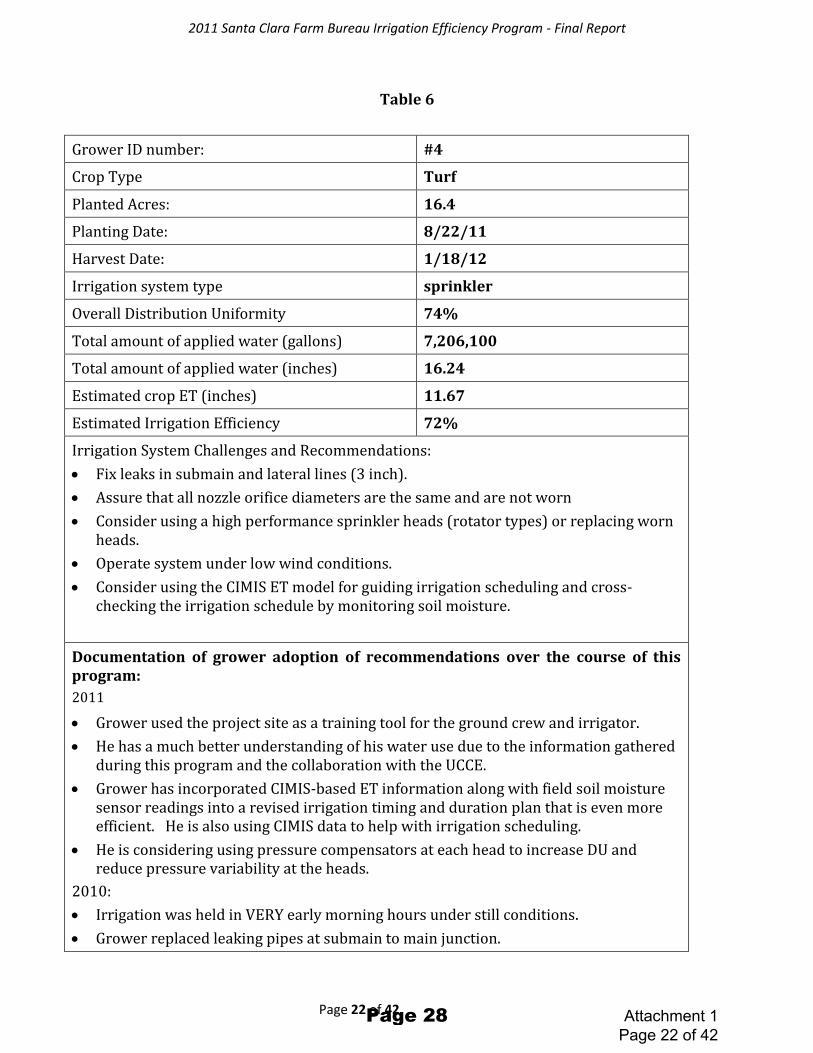
Table 6
Grower ID number: #4
Crop Type Turf
Planted Acres: 16.4
Planting Date: 8/22/11
Harvest Date: 1/18/12
Irrigation system type sprinkler
Overall Distribution Uniformity 74%
Total amount of applied water (gallons) 7,206,100
Total amount of applied water (inches) 16.24
Estimated crop ET (inches) 11.67
Estimated Irrigation Efficiency 72%
Irrigation System Challenges and Recommendations:
Fix leaks in submain and lateral lines (3 inch).
Assure that all nozzle orifice diameters are the same and are not worn
Consider using a high performance sprinkler heads (rotator types) or replacing worn heads.
Operate system under low wind conditions.
Consider using the CIMIS ET model for guiding irrigation scheduling and cross-checking the irrigation schedule by monitoring soil moisture.
Documentation of grower adoption of recommendations over the course of this program:
2011
Grower used the project site as a training tool for the ground crew and irrigator.
He has a much better understanding of his water use due to the information gathered during this program and the collaboration with the UCCE.
Grower has incorporated CIMIS-based ET information along with field soil moisture sensor readings into a revised irrigation timing and duration plan that is even more efficient. He is also using CIMIS data to help with irrigation scheduling.
He is considering using pressure compensators at each head to increase DU and reduce pressure variability at the heads.
2010:
Irrigation was held in VERY early morning hours under still conditions.
Grower replaced leaking pipes at submain to main junction.
Attachment 1 Page 22 of 42
Page 28
2011 Santa Clara Farm Bureau Irrigation Efficiency Program - Final Report
Page 23 of 42
Grower intends to replace all of his nozzles with those of uniform size and make to improve DU.
Grower intends to work with irrigator to make sure more consistent pressure between 45-50 psi is available during irrigations to match the pressure for which his sprinklers are designed.
Grower wants to incorporate CIMIS-based ET information along with field soil moisture sensor readings into a revised irrigation timing and duration plan that is even more efficient.
2009:
Nozzle replacements are planned to ensure consistent nozzle sizes.
After looking at irrigation set time records, irrigation timers will be tried out.
Re-building wheel move systems (replacing gaskets, clamps, spigots).
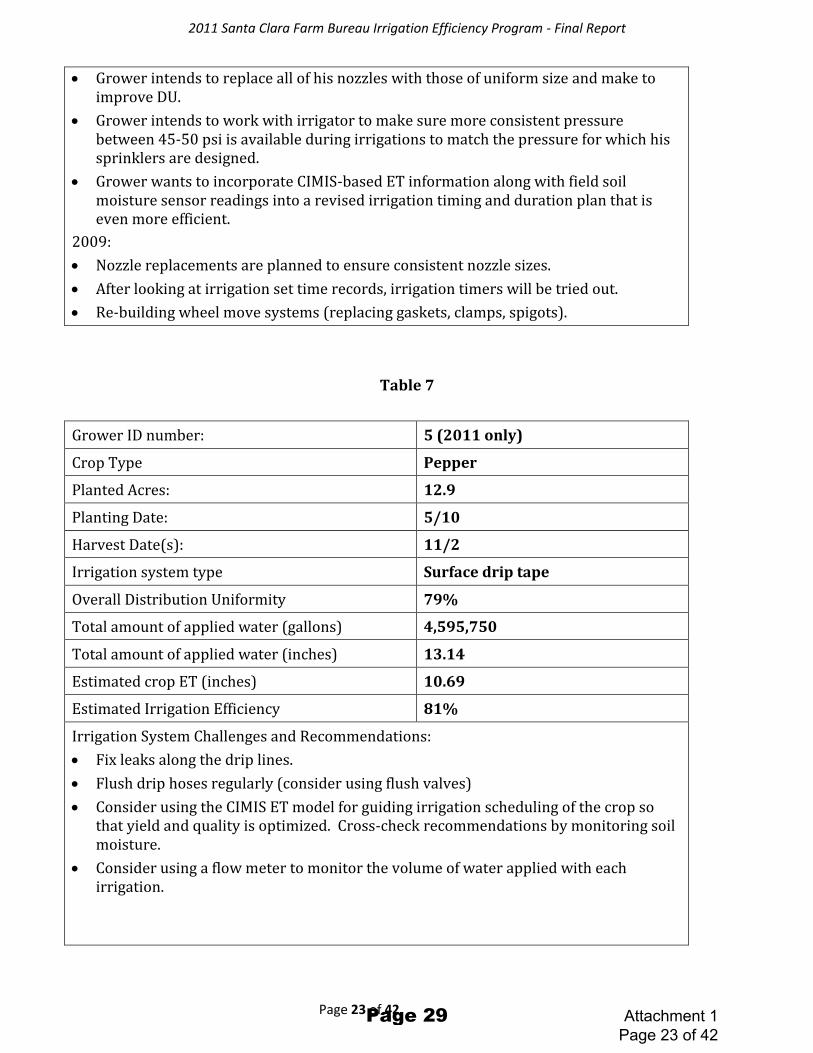
Table 7
Grower ID number: 5 (2011 only)
Crop Type Pepper
Planted Acres: 12.9
Planting Date: 5/10
Harvest Date(s): 11/2
Irrigation system type Surface drip tape
Overall Distribution Uniformity 79%
Total amount of applied water (gallons) 4,595,750
Total amount of applied water (inches) 13.14
Estimated crop ET (inches) 10.69
Estimated Irrigation Efficiency 81%
Irrigation System Challenges and Recommendations:
Fix leaks along the drip lines.
Flush drip hoses regularly (consider using flush valves)
Consider using the CIMIS ET model for guiding irrigation scheduling of the crop so that yield and quality is optimized. Cross-check recommendations by monitoring soil moisture.
Consider using a flow meter to monitor the volume of water applied with each irrigation.
Attachment 1 Page 23 of 42
Page 29
2011 Santa Clara Farm Bureau Irrigation Efficiency Program - Final Report
Page 24 of 42
Documentation of grower adoption of recommendations over the course of this program:
Grower watered a lot less than he would have without the tensiometer data.
Grower reported that the info gathered during evaluations will be very helpful for future planning, particularly, the pressure data.
Grower plans to continue using tensiometers, especially in fields like the one that we evaluated which have heavy soils and have different soil profiles across the field.
Grower has started using a different type of filter (Amiad) this year to prevent emitter clogging.
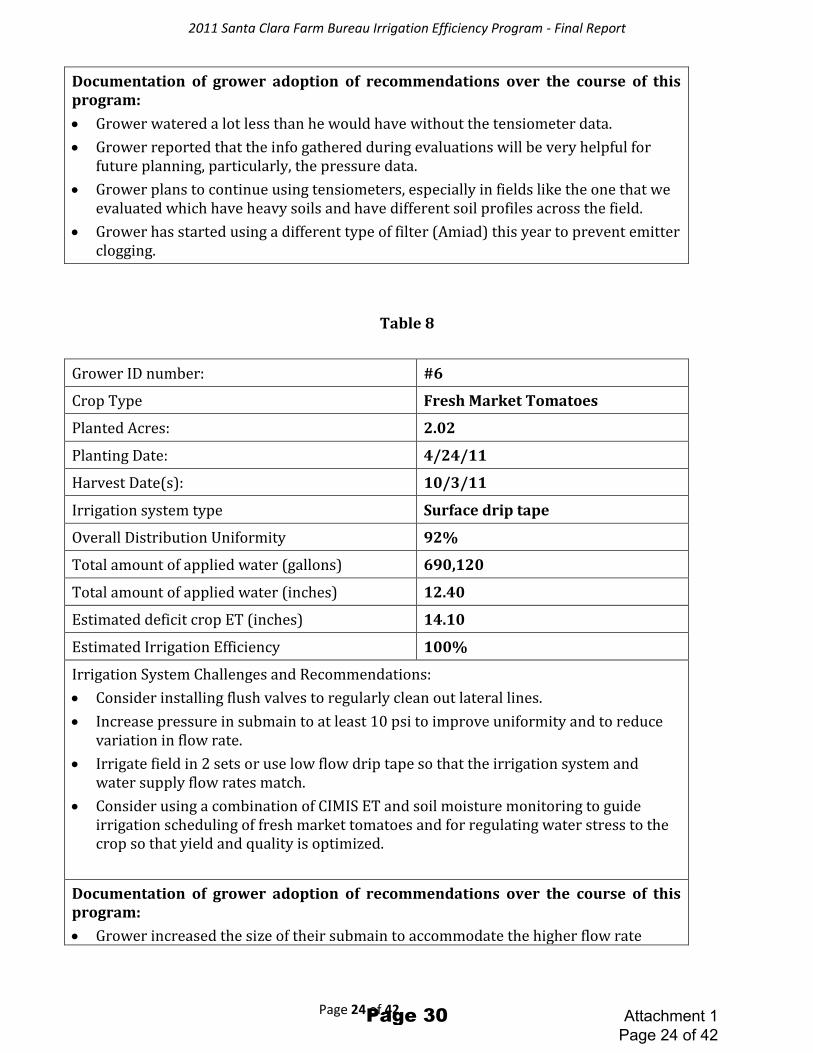
Table 8
Grower ID number: #6
Crop Type Fresh Market Tomatoes
Planted Acres: 2.02
Planting Date: 4/24/11
Harvest Date(s): 10/3/11
Irrigation system type Surface drip tape
Overall Distribution Uniformity 92%
Total amount of applied water (gallons) 690,120
Total amount of applied water (inches) 12.40
Estimated deficit crop ET (inches) 14.10
Estimated Irrigation Efficiency 100%
Irrigation System Challenges and Recommendations:
Consider installing flush valves to regularly clean out lateral lines.
Increase pressure in submain to at least 10 psi to improve uniformity and to reduce variation in flow rate.
Irrigate field in 2 sets or use low flow drip tape so that the irrigation system and water supply flow rates match.
Consider using a combination of CIMIS ET and soil moisture monitoring to guide irrigation scheduling of fresh market tomatoes and for regulating water stress to the crop so that yield and quality is optimized.
6.
Documentation of grower adoption of recommendations over the course of this program:
Grower increased the size of their submain to accommodate the higher flow rate
Attachment 1 Page 24 of 42
Page 30
2011 Santa Clara Farm Bureau Irrigation Efficiency Program - Final Report
Page 25 of 42
necessary to irrigate their field.
Grower installed a pressure regulator along with pressure gages and/or Schrader valves to monitor the pressure of their system during irrigations.
Grower used the tensiometers and CIMIS information to monitor soil moisture and plant water requirements to accurately schedule irrigation intervals and durations.
Grower reported that they will continue to use the skills that they learned over the past three years to save water and money while expanding their operation.
Grower replaced existing 6 mil drip tape with thicker tape that will be less tear prone. 10 mil tape also allows use for multiple seasons, potentially resulting in savings in replacement costs.
2010:
Grower increased submain diameter from 2” to 3” per 2009 recommendation and reduced friction-loss across field to within desired range.
Grower used on CIMIS information and self-measured canopy cover data to time irrigations and set durations resulting in more frequent, but shorter irrigations. The end result was reduced water lost to deep percolation and much better fruit quality. While applied water was significantly less than that recommended by deficit-adjusted CIMIS calculations, grower applications roughly tracked or paralleled the CIMIS recommendations.
Grower checked filter from periodically and found it not very dirty. He will look into the issue of desired flow rates versus filter designed flow capacity before the 2011 irrigation season.
Grower intends to replace existing 6 mil drip tape with thicker tape that will be less tear prone. 10 mil tape would also allow use for multiple seasons, potentially resulting in savings in replacement costs. We recommended he find tape with a manufacturer’s coefficient of variation less than 3%.
2009:
At our recommendation, the grower removed any 3/4 inch internal diameter pipes and replaced all pipes with 2 inch internal diameter PVC pipe. This immediately improved water pressure throughout the drip system according to the grower. This was done by the grower prior to our evaluation on his own
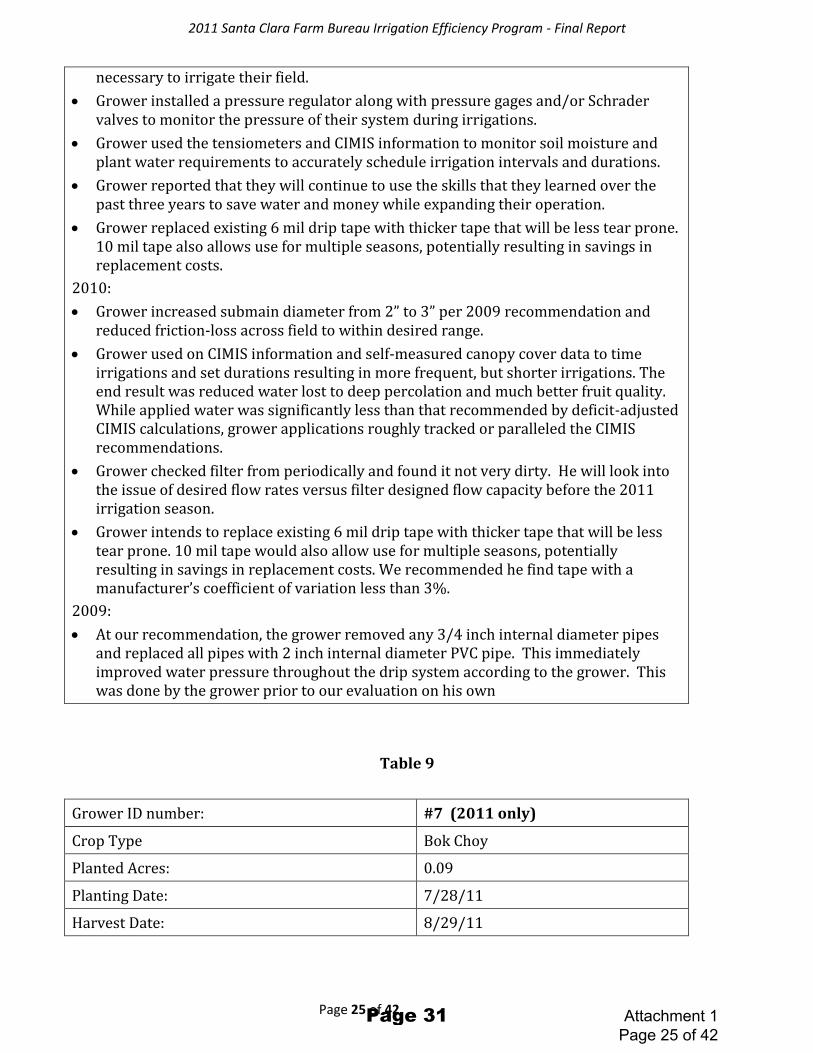
Table 9
Grower ID number: #7 (2011 only)
Crop Type Bok Choy
Planted Acres: 0.09
Planting Date: 7/28/11
Harvest Date: 8/29/11
Attachment 1 Page 25 of 42
Page 31

2011 Santa Clara Farm Bureau Irrigation Efficiency Program - Final Report
Page 26 of 42
Irrigation system type Overhead sprinkler
Overall Distribution Uniformity 50%
Total amount of applied water (gallons) 22,500
Total amount of applied water (inches) 9.21
Estimated crop ET (inches) 3.95
Estimated Irrigation Efficiency 43%
Irrigation System Challenges and Recommendations:
Level lateral lines (1.5 inch PVC pipe) so that they can completely drain after an irrigation and assure that sprinkler heads are pointed directly down so that they spray evenly.
Consider using flush valves at the end of each lateral line to automatically flush lines on startup and drain lines after the system shuts down.
Regularly inject bleach (once per week) to prevent algal growth in submain and lateral lines.
Consider using lower discharge rate sprinkler heads with a distribution uniformity greater than the present heads.
Consider installing check valves at each sprinkler head to prevent algal growth and drainage from the heads after the system is shut down.
Install pressure gauges or Schrader valves for monitoring irrigation system pressure.
Consider using the CIMIS ET model for guiding irrigation scheduling and cross-checking the irrigation schedule by monitoring soil moisture.
Apply less water during individual irrigation sets if the field was recently irrigated to reduce drainage below the root zone.
Irrigation scheduling could be improved by using sprinkler heads that discharge at a lower rate than the current sprinkler heads. The lower application rate would also permit a larger portion of the greenhouse to be irrigated at the same time.
Documentation of grower adoption of recommendations:
This grower only participated in this year of the program. He was enthusiastic at the beginning of the season and participated throughout the process and came to all meetings. He received substantial advice and guidance very specific to his system but, despite his active participation, he did not indicate what changes he would make based on our recommendations and was unavailable for communication after the season end despite repeated efforts on our part.
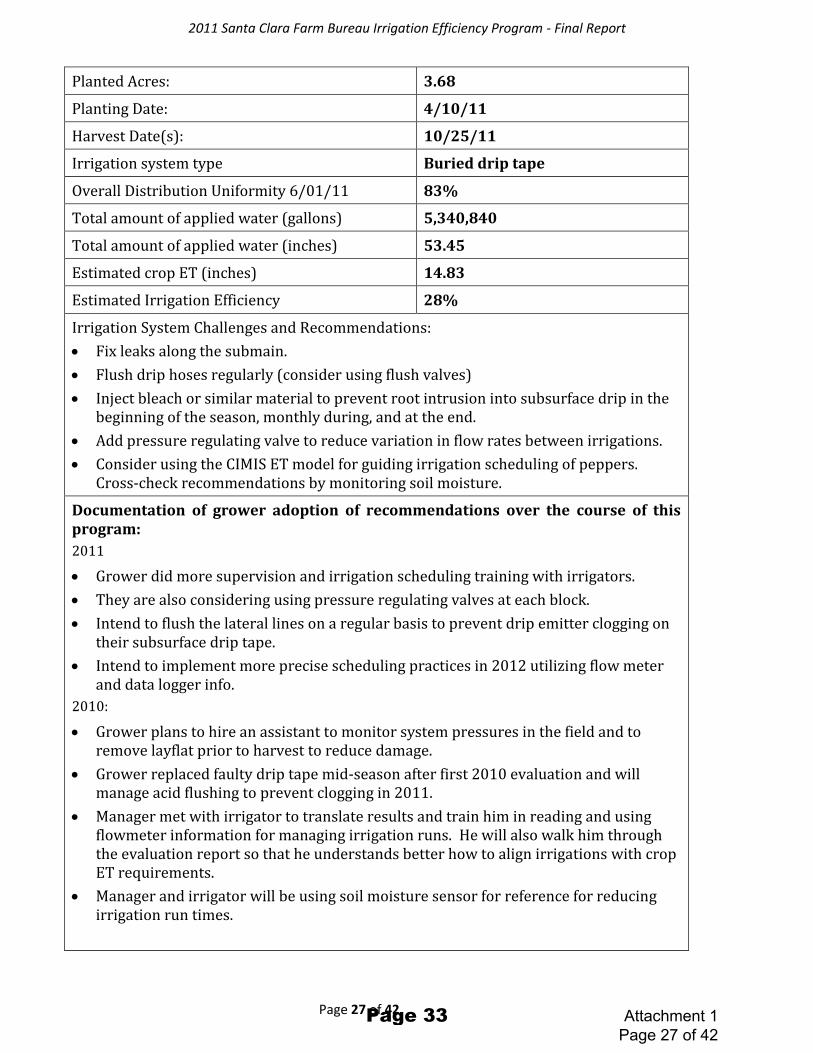
Table 10
Grower ID number: #8
Crop Type Peppers
Attachment 1 Page 26 of 42
Page 32
2011 Santa Clara Farm Bureau Irrigation Efficiency Program - Final Report
Page 27 of 42
Planted Acres: 3.68
Planting Date: 4/10/11
Harvest Date(s): 10/25/11
Irrigation system type Buried drip tape
Overall Distribution Uniformity 6/01/11 83%
Total amount of applied water (gallons) 5,340,840
Total amount of applied water (inches) 53.45
Estimated crop ET (inches) 14.83
Estimated Irrigation Efficiency 28%
Irrigation System Challenges and Recommendations:
Fix leaks along the submain.
Flush drip hoses regularly (consider using flush valves)
Inject bleach or similar material to prevent root intrusion into subsurface drip in the beginning of the season, monthly during, and at the end.
Add pressure regulating valve to reduce variation in flow rates between irrigations.
Consider using the CIMIS ET model for guiding irrigation scheduling of peppers. Cross-check recommendations by monitoring soil moisture.
Documentation of grower adoption of recommendations over the course of this program:
2011
Grower did more supervision and irrigation scheduling training with irrigators.
They are also considering using pressure regulating valves at each block.
Intend to flush the lateral lines on a regular basis to prevent drip emitter clogging on their subsurface drip tape.
Intend to implement more precise scheduling practices in 2012 utilizing flow meter and data logger info.
2010:
Grower plans to hire an assistant to monitor system pressures in the field and to remove layflat prior to harvest to reduce damage.
Grower replaced faulty drip tape mid-season after first 2010 evaluation and will manage acid flushing to prevent clogging in 2011.
Manager met with irrigator to translate results and train him in reading and using flowmeter information for managing irrigation runs. He will also walk him through the evaluation report so that he understands better how to align irrigations with crop ET requirements.
Manager and irrigator will be using soil moisture sensor for reference for reducing irrigation run times.
Attachment 1 Page 27 of 42
Page 33

2011 Santa Clara Farm Bureau Irrigation Efficiency Program - Final Report
Page 28 of 42
2009:
Grower plans to hire an assistant. This will give him someone to measure water pressures in irrigation systems.
Grower will remove layflat before harvesting to reduce damage and leaks.
Grower is very interested in applying for NRCS AWEP or EQIP funding for irrigation efficiency upgrades.
Grower was enthusiastic to show our irrigation efficiency report to his supervisor and Signature Irrigation, the irrigation designer.
Table 11
Grower ID number: #9
Crop Type Wine Grapes
Planted Acres: 0.7
Leaf bud break: 4/01
Last irrigation: 10/20/2011
Irrigation system type drip
Overall Distribution Uniformity 90%
Total amount of applied water (gallons) 88,700
Total amount of applied water (inches) 4.67
Estimated crop ET (inches) 12.7
Estimated Irrigation Efficiency 100%
Irrigation System Challenges and Recommendations:
Fix leaks along the submain.
Flush drip hoses regularly (consider using flush valves)
Continue converting to pressure compensating drip emitters. When using pressure compensating emitters, maintain pressure at 20 psi at the submain
Assure that filter at pump is operational and regularly cleaned. If not operational, consider installing a filter with 120 mesh screen. If the irrigation water contains substantial debris then consider using higher capacity filters such as disk, sand media, or auto-flushing screen filters.
Consider using the CIMIS ET and soil moisture monitoring for guiding irrigation scheduling and for regulating water stress of the crop so that yield and quality are optimized.
Install a pressure regulating valve at main/submain connection to assure similar application rates among irrigation events.
Attachment 1 Page 28 of 42
Page 34
2011 Santa Clara Farm Bureau Irrigation Efficiency Program - Final Report
Page 29 of 42
Documentation of grower adoption of recommendations over the course of this program:
Converted one block to pressure-compensating emitters to reduce variability in application rates over sloped areas.
He is also considering installing a filter at the well head to reduce emitter clogging due to debris. He is saving money for the appropriate filter for his system—we recommended a sand separator. When he flushes his mainline later this winter to investigate what’s causing the loss of pressure, he will know better what size particles are his primary filtering concern and that information will guide him in the most appropriate filter to purchase.
The grower repaired the observed leaks along the submain.
2010:
The grower is primarily concerned with investigating and resolving the considerable drop in pressure along his mainline between the pump and the submain junction. Until he resolves that he will not have adequate pressure going to the submain for a pressure regulator to function properly.
The grower will repair the observed leaks along the submain.
The grower is concerned that he stressed his vines too much (resulting in premature drying of fruit) and intends to use CIMIS ET-based information to guide an appropriate (slight) increase in applied water later in latter part of the season.
2009:
Grower acknowledges that he needs a sand filter with automatic backflush. NRCS cost
share could help make this a reality for him. He will be applying for EQIP funding.
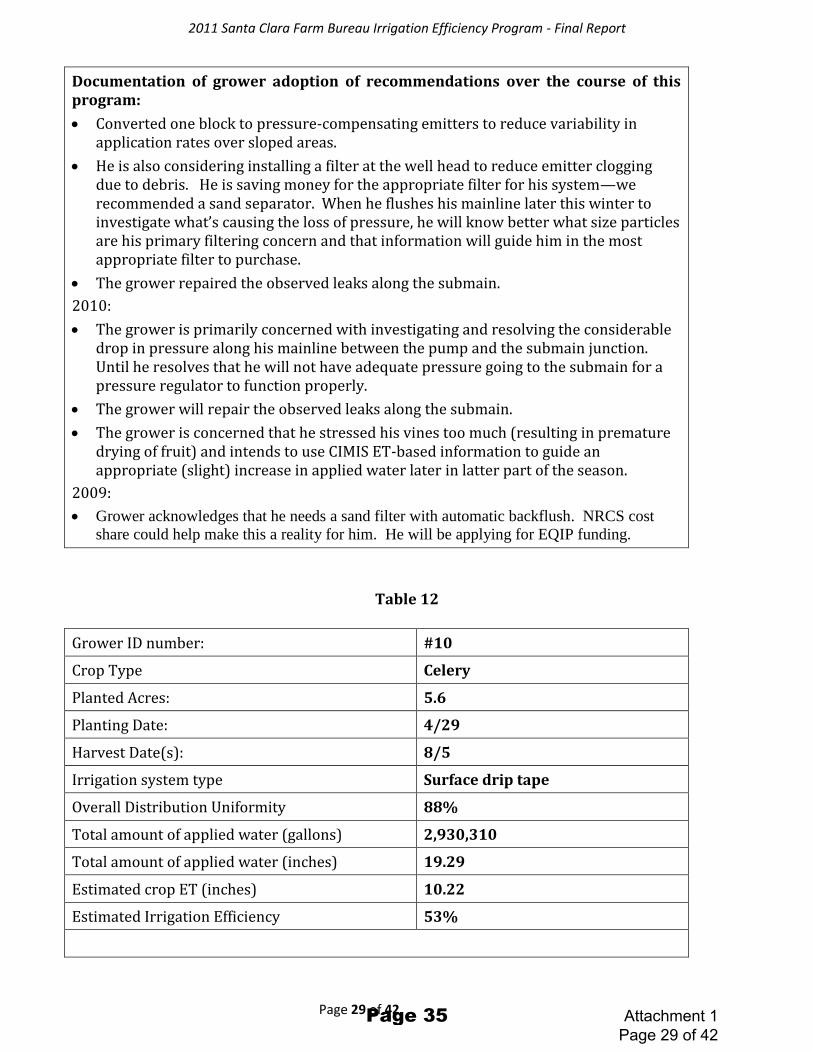
Table 12
Grower ID number: #10
Crop Type Celery
Planted Acres: 5.6
Planting Date: 4/29
Harvest Date(s): 8/5
Irrigation system type Surface drip tape
Overall Distribution Uniformity 88%
Total amount of applied water (gallons) 2,930,310
Total amount of applied water (inches) 19.29
Estimated crop ET (inches) 10.22
Estimated Irrigation Efficiency 53%
Attachment 1 Page 29 of 42
Page 35
2011 Santa Clara Farm Bureau Irrigation Efficiency Program - Final Report
Page 30 of 42
Irrigation System Challenges and Recommendations:
Fix leaks along the submain.
Flush drip hoses regularly (consider using flush valves)
Consider using 7/8” diameter instead of 5/8” drip tape for beds longer than 500’ or use low flow tape (< .25 gpm/100 ft)
Add a pressure regulator after the filter to minimize fluctuations in system flow rate during the drip phase of the crop.
Evaluate if the amount (inches) of water applied during transplant establishment can be reduced.
Consider using the CIMIS ET model for guiding irrigation scheduling of the crop so that yield and quality is optimized. Cross-check recommendations by monitoring soil moisture.
Documentation of grower adoption of recommendations over the course of this program:
Used CIMIS information to help with irrigation scheduling and plans a systematic use of CIMIS-based scheduling.
He switched to spin loc connectors to attach drip lines to layflat submain to minimize leaks at those connections.
Based on pressure info gathered during evaluations, he is considering installing pressure regulators to reduce pressure variations during irrigation sets.
He is very interested in using the Crop Manage software for irrigation scheduling and fertilizer applications and plans to be part of the pilot project for celery.
Grower started his transplants on drip irrigation in 2011 to reduce over-application during establishment phase.
2010:
Grower tested a biological amendment to irrigation water to reduce algae growth (and associated emitter-plugging) in laterals.
Grower will start his transplants on drip irrigation in 2011 to reduce over-application during establishment phase.
Grower would like to install a pressure regulator on the field in 2011 as long as he can train his irrigators on how to use it.
Grower may switch submain-to-lead connections to twist-lok connectors to reduce leaks.
Grower very enthusiastic about program and has used a consultant to guide him in keeping drip application timing and durations roughly consistent with CIMIS-based ET requirements.
2009:
Grower is very interested in NRCS EQIP or AWEP funding for cost sharing the replacement of twisted wire drip tape connections, buy new layflat submains, and new pressure regulators.
Attachment 1 Page 30 of 42
Page 36
2011 Santa Clara Farm Bureau Irrigation Efficiency Program - Final Report
Page 31 of 42
Grower Education
A meeting of participating growers was held on January 18, 2011. At that meeting, we reviewed
the evaluation process and individual concerns with those present. The format of the meeting
included a summary of season results by Dr. Michael Cahn, UC Cooperative Extension, a discussion
of individual growers’ issues affecting efficiency and regarding our methods, and an introduction
to new work Dr. Cahn is conducting on tools to enhance water and nutrient use efficiency. This
same information will be used in a series of trainings through 2012 for the general grower
community. The first of those trainings was held on April 30th at the San Martin Lions Club.
Addressing irrigation system challenges
Greenhouse drip
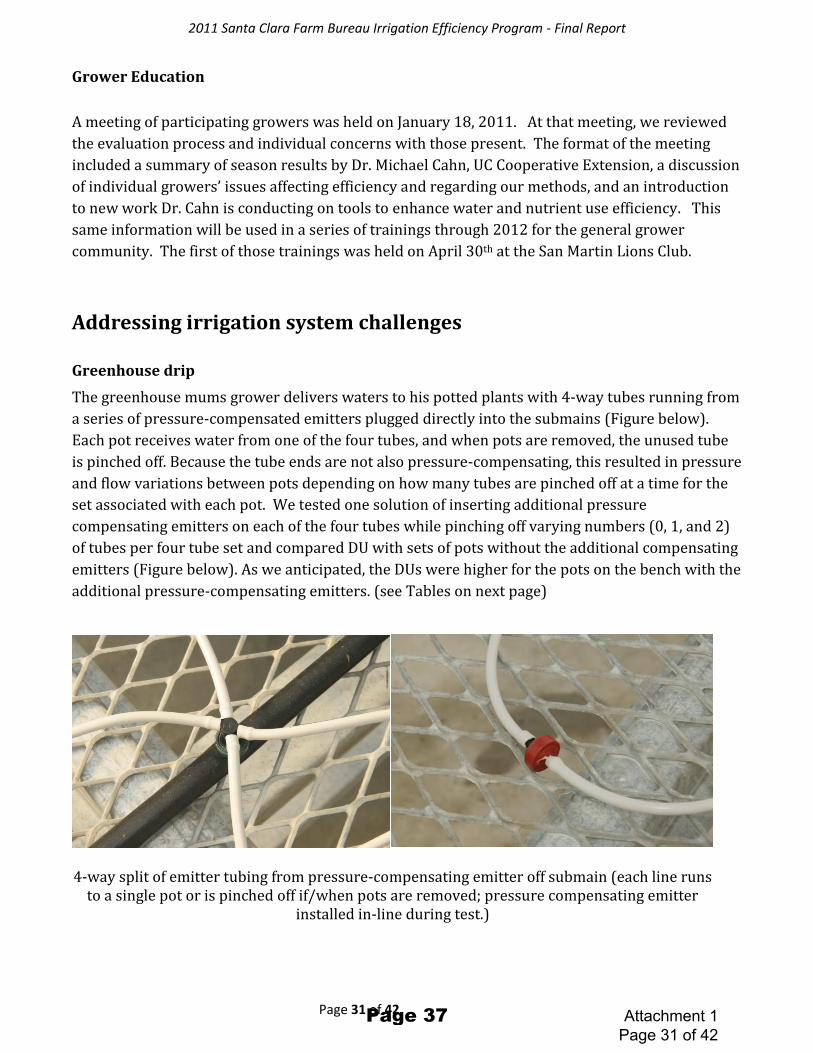
The greenhouse mums grower delivers waters to his potted plants with 4-way tubes running from
a series of pressure-compensated emitters plugged directly into the submains (Figure below).
Each pot receives water from one of the four tubes, and when pots are removed, the unused tube
is pinched off. Because the tube ends are not also pressure-compensating, this resulted in pressure
and flow variations between pots depending on how many tubes are pinched off at a time for the
set associated with each pot. We tested one solution of inserting additional pressure
compensating emitters on each of the four tubes while pinching off varying numbers (0, 1, and 2)
of tubes per four tube set and compared DU with sets of pots without the additional compensating
emitters (Figure below). As we anticipated, the DUs were higher for the pots on the bench with the
additional pressure-compensating emitters. (see Tables on next page)
4-way split of emitter tubing from pressure-compensating emitter off submain (each line runs
to a single pot or is pinched off if/when pots are removed; pressure compensating emitter installed in-line during test.)
Attachment 1 Page 31 of 42
Page 37
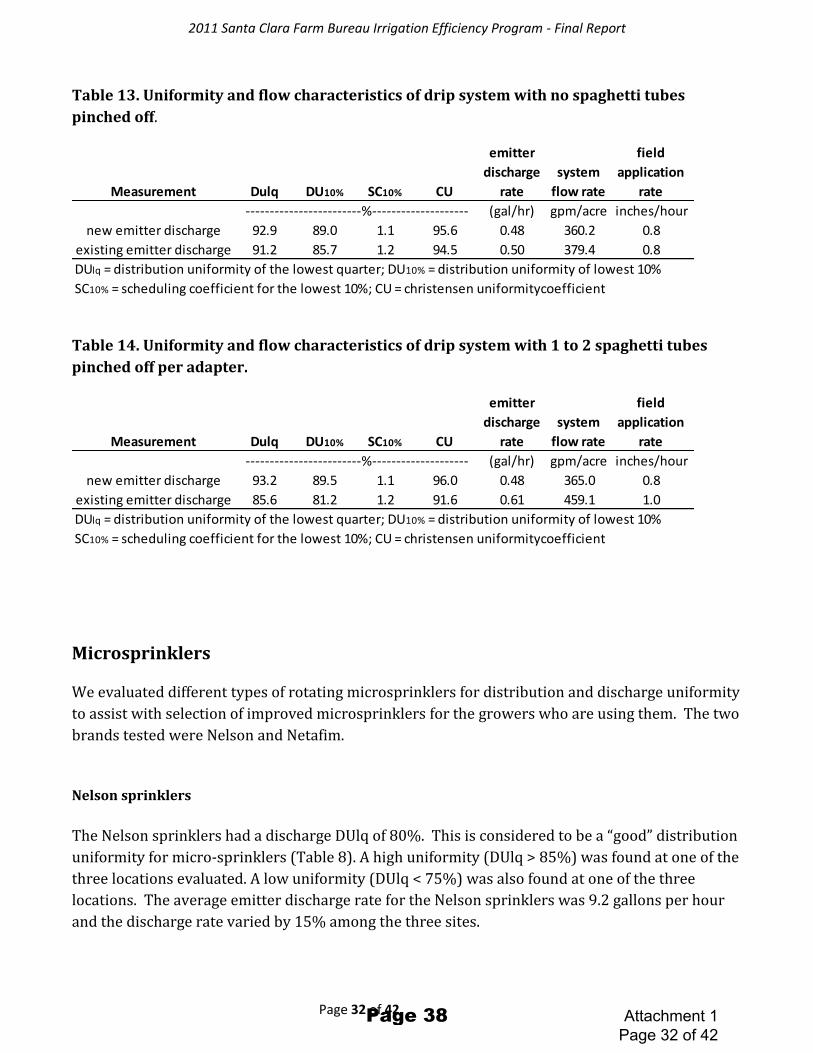
2011 Santa Clara Farm Bureau Irrigation Efficiency Program - Final Report
Page 32 of 42
Table 13. Uniformity and flow characteristics of drip system with no spaghetti tubes
pinched off.
Table 14. Uniformity and flow characteristics of drip system with 1 to 2 spaghetti tubes
pinched off per adapter.
Microsprinklers We evaluated different types of rotating microsprinklers for distribution and discharge uniformity
to assist with selection of improved microsprinklers for the growers who are using them. The two
brands tested were Nelson and Netafim.
Nelson sprinklers
The Nelson sprinklers had a discharge DUlq of 80%. This is considered to be a “good” distribution
uniformity for micro-sprinklers (Table 8). A high uniformity (DUlq > 85%) was found at one of the
three locations evaluated. A low uniformity (DUlq < 75%) was also found at one of the three
locations. The average emitter discharge rate for the Nelson sprinklers was 9.2 gallons per hour
and the discharge rate varied by 15% among the three sites.
Measurement Dulq DU10% SC10% CU
emitter
discharge
rate
system
flow rate
field
application
rate
(gal/hr) gpm/acre inches/hour
new emitter discharge 92.9 89.0 1.1 95.6 0.48 360.2 0.8
existing emitter discharge 91.2 85.7 1.2 94.5 0.50 379.4 0.8
DUlq = distribution uniformity of the lowest quarter; DU10% = distribution uniformity of lowest 10%
SC10% = scheduling coefficient for the lowest 10%; CU = christensen uniformitycoefficient
------------------------%--------------------
Measurement Dulq DU10% SC10% CU
emitter
discharge
rate
system
flow rate
field
application
rate
(gal/hr) gpm/acre inches/hour
new emitter discharge 93.2 89.5 1.1 96.0 0.48 365.0 0.8
existing emitter discharge 85.6 81.2 1.2 91.6 0.61 459.1 1.0
DUlq = distribution uniformity of the lowest quarter; DU10% = distribution uniformity of lowest 10%
SC10% = scheduling coefficient for the lowest 10%; CU = christensen uniformitycoefficient
------------------------%--------------------
Attachment 1 Page 32 of 42
Page 38
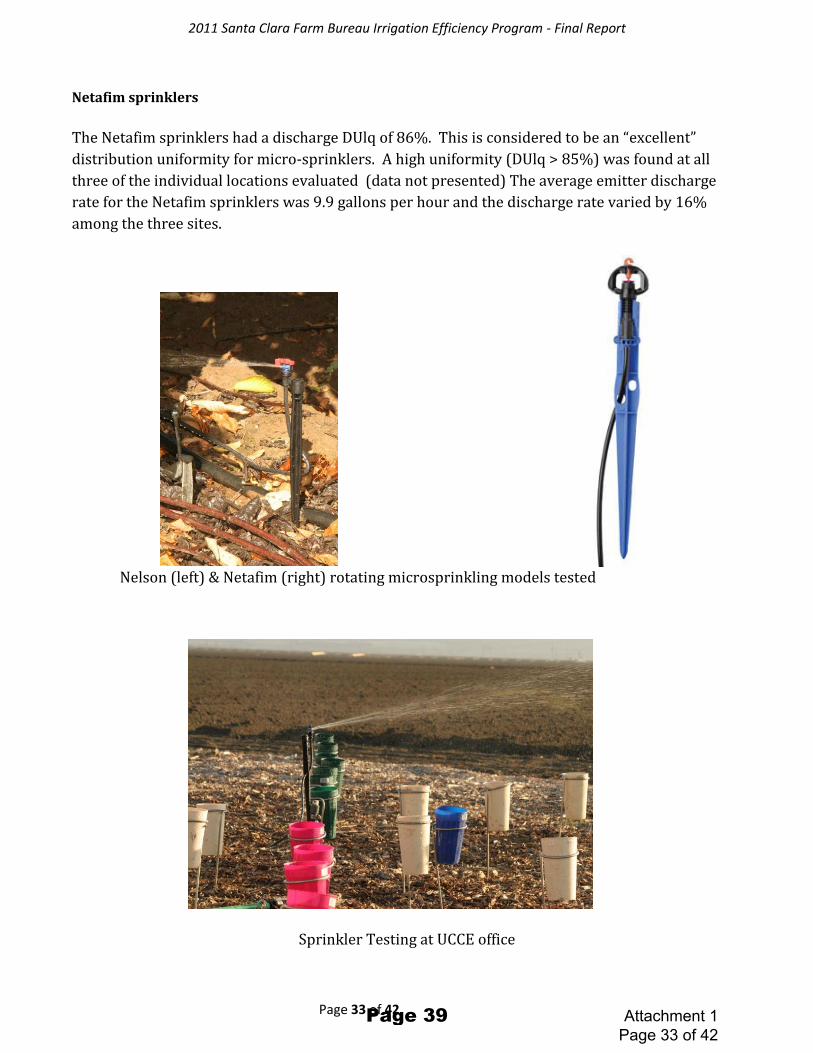
2011 Santa Clara Farm Bureau Irrigation Efficiency Program - Final Report
Page 33 of 42
Netafim sprinklers
The Netafim sprinklers had a discharge DUlq of 86%. This is considered to be an “excellent”
distribution uniformity for micro-sprinklers. A high uniformity (DUlq > 85%) was found at all
three of the individual locations evaluated (data not presented) The average emitter discharge
rate for the Netafim sprinklers was 9.9 gallons per hour and the discharge rate varied by 16%
among the three sites.
Nelson (left) & Netafim (right) rotating microsprinkling models tested
Sprinkler Testing at UCCE office
Attachment 1 Page 33 of 42
Page 39

2011 Santa Clara Farm Bureau Irrigation Efficiency Program - Final Report
Page 34 of 42
Stand test of micro-sprinklers
The following graphs present the relationship between distance and distribution uniformity and
application rate for various models of microsprinklers (the grower’s existing Bowsmith fanjets
and the aforementioned Nelson and Netafim swivel models). The swivel micro-sprinklers
provided the most uniform spray patterns. DU was calculated from the volume of water collected
in cups positioned at varying distances from the microsprinklers. Each point on the graphs below
represents data collected between 0 feet and the corresponding distance on the X-axis. Wind
speeds were monitored during each irrigation test. The average wind speed is noted below each
graph. None of the wind speeds recorded was greater than the recommended maximum for these
microsprinklers.
Distribution uniformity and application rate profile of Bowsmith fanjet E micro sprinkler at 18 psi
pressure and average wind speed of 5.1 mph.
Distance from sprinkler head (feet)0 2 4 6 8 10 12 14
Appl
ied
wat
er (i
nche
s pe
r hou
r)
0.00
0.02
0.04
0.06
0.08
0.10
0.12
Low
est Q
uarte
r Dis
tribu
tion
Uni
form
ity (%
)0
10
20
30
40
50
60
70
80
90
Application RateDUlq
Attachment 1 Page 34 of 42
Page 40

2011 Santa Clara Farm Bureau Irrigation Efficiency Program - Final Report
Page 35 of 42
Distribution uniformity and application rate profile of Bowsmith fanjet E micro sprinkler at 25 psi
pressure and average wind speed of 5.4 mph.
Distribution uniformity and application rate profile of Nelson micro sprinkler at 18 psi pressure and
average wind speed of 7.6 mph.
Distance from sprinkler head (feet)0 2 4 6 8 10 12 14
Appl
ied
wat
er (i
nche
s pe
r hou
r)
0.00
0.02
0.04
0.06
0.08
0.10
Low
est Q
uarte
r Dis
tribu
tion
Uni
form
ity (%
)
0
10
20
30
40
50
60
70
80
90
Application RateDUlq
Distance from sprinkler head (feet)0 2 4 6 8 10 12 14
App
lied
wat
er (i
nche
s pe
r hou
r)
0.00
0.01
0.02
0.03
0.04
0.05
0.06
0.07
Low
est Q
uarte
r Dis
tribu
tion
Uni
form
ity (%
)
0
10
20
30
40
50
60
70
80
90
Application RateDUlq
Attachment 1 Page 35 of 42
Page 41
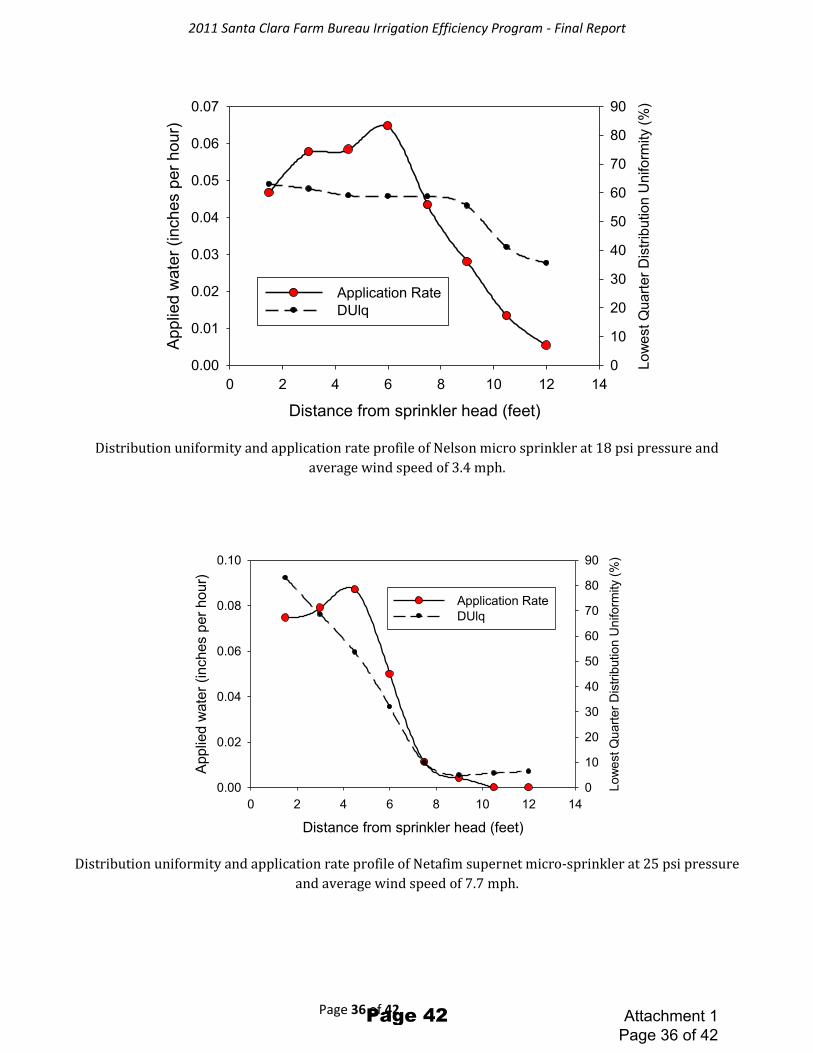
2011 Santa Clara Farm Bureau Irrigation Efficiency Program - Final Report
Page 36 of 42
Distribution uniformity and application rate profile of Nelson micro sprinkler at 18 psi pressure and
average wind speed of 3.4 mph.
Distribution uniformity and application rate profile of Netafim supernet micro-sprinkler at 25 psi pressure
and average wind speed of 7.7 mph.
Distance from sprinkler head (feet)0 2 4 6 8 10 12 14
Appl
ied
wat
er (i
nche
s pe
r hou
r)
0.00
0.01
0.02
0.03
0.04
0.05
0.06
0.07
Low
est Q
uarte
r Dis
tribu
tion
Uni
form
ity (%
)
0
10
20
30
40
50
60
70
80
90
Application RateDUlq
Distance from sprinkler head (feet)0 2 4 6 8 10 12 14
App
lied
wat
er (i
nche
s pe
r hou
r)
0.00
0.02
0.04
0.06
0.08
0.10
Low
est Q
uarte
r Dis
tribu
tion
Uni
form
ity (%
)
0
10
20
30
40
50
60
70
80
90
Application RateDUlq
Attachment 1 Page 36 of 42
Page 42
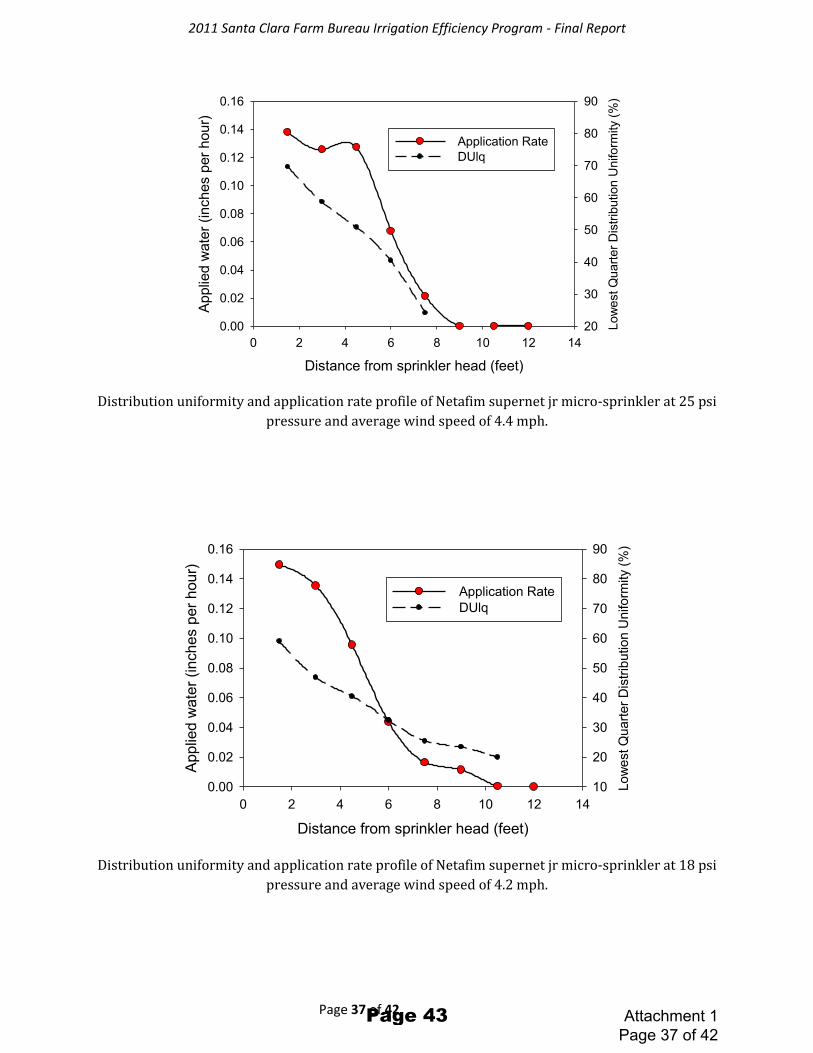
2011 Santa Clara Farm Bureau Irrigation Efficiency Program - Final Report
Page 37 of 42
Distribution uniformity and application rate profile of Netafim supernet jr micro-sprinkler at 25 psi
pressure and average wind speed of 4.4 mph.
Distribution uniformity and application rate profile of Netafim supernet jr micro-sprinkler at 18 psi
pressure and average wind speed of 4.2 mph.
Distance from sprinkler head (feet)0 2 4 6 8 10 12 14
Appl
ied
wat
er (i
nche
s pe
r hou
r)
0.00
0.02
0.04
0.06
0.08
0.10
0.12
0.14
0.16
Low
est Q
uarte
r Dis
tribu
tion
Uni
form
ity (%
)
20
30
40
50
60
70
80
90
Application RateDUlq
Distance from sprinkler head (feet)0 2 4 6 8 10 12 14
Appl
ied
wat
er (i
nche
s pe
r hou
r)
0.00
0.02
0.04
0.06
0.08
0.10
0.12
0.14
0.16
Low
est Q
uarte
r Dis
tribu
tion
Uni
form
ity (%
)
10
20
30
40
50
60
70
80
90
Application RateDUlq
Attachment 1 Page 37 of 42
Page 43

2011 Santa Clara Farm Bureau Irrigation Efficiency Program - Final Report
Page 38 of 42
Tools for estimating evapotranspiration
Figure: atmometer (left) and CIMIS weather station (right) At each site, we estimated evapotranspiration using a combination of techniques as described
earlier. Growers located in areas distant from an existing CIMIS station and desiring a more
precisely local Eto estimate have a growing variety of options available to them besides Spatial
CIMIS or payment to establish a new CIMIS station. During the project season, we evaluated the
use of an atmometer as a “do it yourself” method on one site in comparison with the estimates
from the nearest CIMIS station and Spatial CIMIS. As illustrated in the charts below, all three
methods tracked Eto very closely relative to each other.
Attachment 1 Page 38 of 42
Page 44
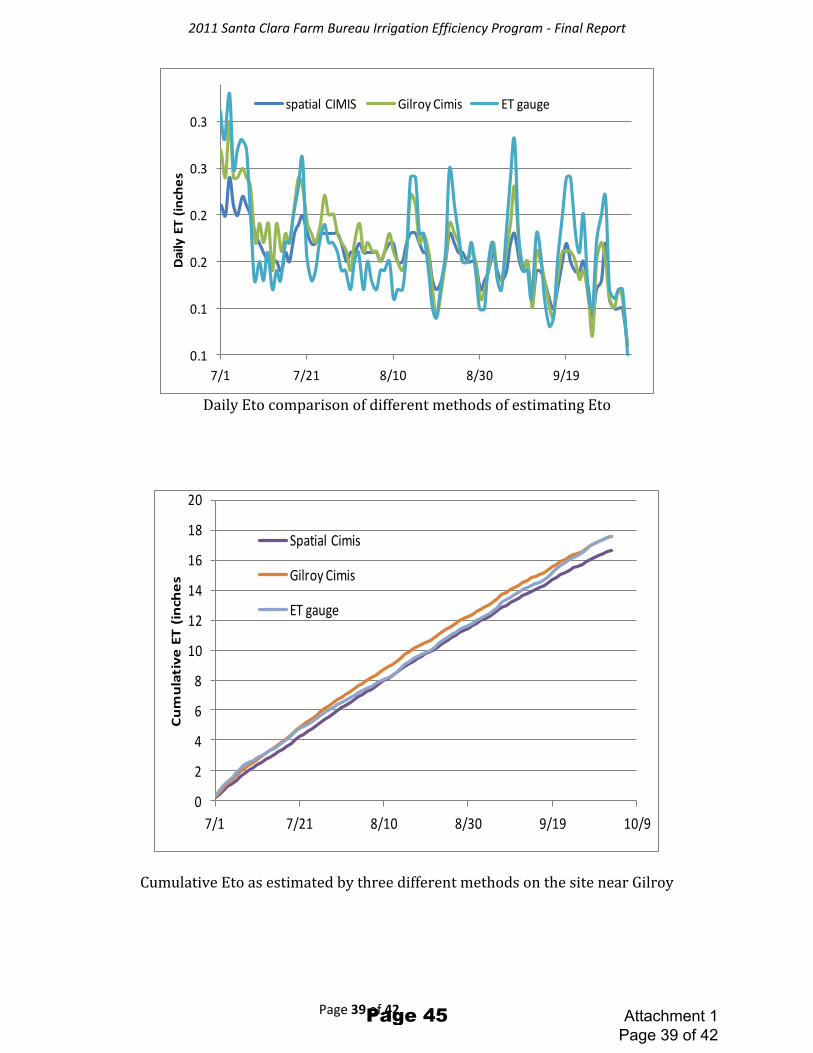
2011 Santa Clara Farm Bureau Irrigation Efficiency Program - Final Report
Page 39 of 42
Daily Eto comparison of different methods of estimating Eto
Cumulative Eto as estimated by three different methods on the site near Gilroy
0.1
0.1
0.2
0.2
0.3
0.3
7/1 7/21 8/10 8/30 9/19
Da
ily
ET
(in
che
s
spatial CIMIS Gilroy Cimis ET gauge
0
2
4
6
8
10
12
14
16
18
20
7/1 7/21 8/10 8/30 9/19 10/9
Cu
mu
lati
ve
ET
(in
che
s
Spatial Cimis
Gilroy Cimis
ET gauge
Attachment 1 Page 39 of 42
Page 45
2011 Santa Clara Farm Bureau Irrigation Efficiency Program - Final Report
Page 40 of 42
Program Summary The Santa Clara Valley Irrigation Efficiency Program (IEP) began in 2009 and continued through
2011. The program worked closely with 10 local growers per year with the goal of improving
their irrigation efficiency (the amount of water used relative to the amount that the crop needed)
to at least 80% over three years.
Participants in the program represented a cross-section of large and small operations growing a
variety of the main crops grown in the Santa Clara Valley (wine grapes, cherries, fresh market
tomatoes, Asian vegetables, peppers, celery, turf grass, and potted flowers), and a cross section of
irrigation methods (overhead sprinklers, micro-sprinklers, surface placed drip tape, buried drip
tape, and emitterized drip hose). Eight of the growers participated all three years. Two
participated for two years, and two participated only in the final year. The 12 participants farm a
combined total of 4,591 acres in the county.
The program focused on intensive evaluation of one field per grower. The idea being that the
things learned on that field could be used on all of the other fields to leverage the improvements.
The growers had the choice of using their most representative field or their most challenging field
each year – whichever was most likely to improve their overall efficiency. The first year of the
program, many of the growers started on a representative field because that field was likely to
provide information applicable to their whole operation. All 10 were very interested in the results
and most moved fields to focus on their greatest challenges the second and third years. Some
fields are more challenging to make efficient because of factors such as slope, soil type, sprinkler
layout, wind, shape, distance from the well, etc. In addition, some crops are more challenging.
Vegetables and turf, which are sold based on how plump and healthy they look, can lose market
value if they are underwatered. Crops such as grapes and tomatoes, which are sold based on
flavor intensity, are regularly underwatered to increase the flavor. Many of those growers had
very high efficiency ratings because they were purposely underwatering.
The participating growers received an evaluation of the efficiency and distribution uniformity of
the irrigation systems each year, every drop of water for the field was metered and recorded and
compared to the water use efficiency and expected evapotranspiration (ET) of the crop to
calculate season-long water use relative to estimated crop need, and each grower got individual
consultation and recommendations of ways to improve the uniformity and scheduling of the
irrigations, and how to monitor progress made in achieving higher irrigation efficiencies.
The growers were very excited about what they learned and reported that they had implemented
many recommendations. Eleven of the twelve growers who participated in the program over the
three years reported that they considered the information gained from our evaluations and
recommendations valuable and extendable to other aspects of their operations. They made
adjustments to their operations’ water use efficiency on multiple fields, not just the field being
Attachment 1 Page 40 of 42
Page 46
2011 Santa Clara Farm Bureau Irrigation Efficiency Program - Final Report
Page 41 of 42
managed in this program, and many ended with plans for testing other changes beyond the
timespan of this program. See grower comments on pages 4, 5, and 12.
Over the three year span of the program, distribution uniformity (DU) readings averaged just over
80%, with a slight decrease (82% to 80%) between 2009 and 2011. For the eight growers that
stayed with the program the entire three years, DU increased on average from 83 to 86%.
Although the average irrigation efficiency appeared to have decreased over time from 86% to
79%, such a conclusion could not be made because some growers purposefully chose more
challenging fields to study in the last year of the program so the results aren’t truly comparable
from year to year. Excluding those growers, average IE for the remaining six growers was just
over 90%.
In addition to the efficiency and uniformity work done for all growers, the program included field
testing of some new water efficiency technology at several grower sites. Technologies tested
included two types of soil moisture monitoring, use of cell phones to do remote readings of pump
meters and soil moisture, various in-field evapotranspiration (ET) gages compared to regional and
spatial CIMIS stations, three different types of micro-sprinklers, and greenhouse drip systems.
The growers reported that these results were particularly valuable to them as they upgrade their
systems and install irrigation in new fields. This information was also the most requested section
at two general grower workshops in April 2012.
Overall, this was a very valuable program for the growers in the valley. The participating growers
learned and applied new techniques to improve their irrigation efficiency on the field that was
studied and on their other operations. Other growers learned from the participating growers in
workshops and, even more effectively, by word of mouth. As one grower stated so eloquently “We
will continue to use the skills that we learned over the past three years to save water and money
while expanding our operation.”
Attachment 1 Page 41 of 42
Page 47

2011 Santa Clara Farm Bureau Irrigation Efficiency Program - Final Report
Page 42 of 42
Appendix 1 Project Participant Summary Data
Field Well Numbers Type of crop Planted Acres
Irrigation System Types
11S03E02G001 Flowers/ Greenhouse 0.27
Drip and Hand Watering
Blue Line turnout on Half Road, Morgan Hill, CA Cherry 3.1 Micro Sprinklers
First well is 10S03E14C005, meter number 893155. Second well number is 10S03E14D001, meter number 893170 Wine Grapes 9.46 Drip Emitters
Water mixed from three sources: Well 09S02E01C001, Well 09S02E01F003, Well 09S02E01M003 Turf Grass 16.4 Solid set sprinklers
KEJI001564 Bok Choy .09 Overhead sprinklers
11S04E04F003 Heirloom Tomato 1.93 Surface Drip Tape
Meter #961861 Peppers 12.9 Sub surface Drip Tape
11S04E15A003 Peppers 8.0 Sub surface Drip Tape
10504E84B003 Wine Grapes 0.7 Drip Emitters
11S04E22Q002 Celery 4.41 Sprinklers/surface drip tape
Attachment 1 Page 42 of 42
Page 48
Mobile Irrigation Laboratory
Irrigation System Evaluation
Annual Report
2016
Prepared by:
Resource Conservation District of Monterey County (831) 424-1036 ext 126
For:
Loma Prieta Resource Conservation District (408) 847-4171
May 2017
Attachment 2 Page 1 of 17
Page 49

1
1. Summary of monthly reports
The Loma Prieta RCD Mobile Irrigation Lab (MIL) provides growers with evaluations of irrigation system performance and irrigation scheduling, and recommendations for increasing irrigation distribution uniformity. The Loma Prieta MIL is funded by the Santa Clara Valley Water District. The summary reports are presented in Appendix 1.
Eight growers participated in 2016. The irrigation systems evaluated were drip, micro sprinklers and solid set sprinklers (Figure # 1). Drip or sprinklers were used for the irrigation of vegetable row crops and micro sprinklers were used for the irrigation of orchards. The systems were used to irrigate crops grown in the county, including: green beans, baby leafy greens, celery, cherries flowers, and vineyards (Figure # 2).
Figure # 1. Irrigation systems evaluated based on total farm acreage
49%
2%
49%Drip
Micro Sprinklers
Solid Set Sprinkler
Attachment 2 Page 2 of 17
Page 50
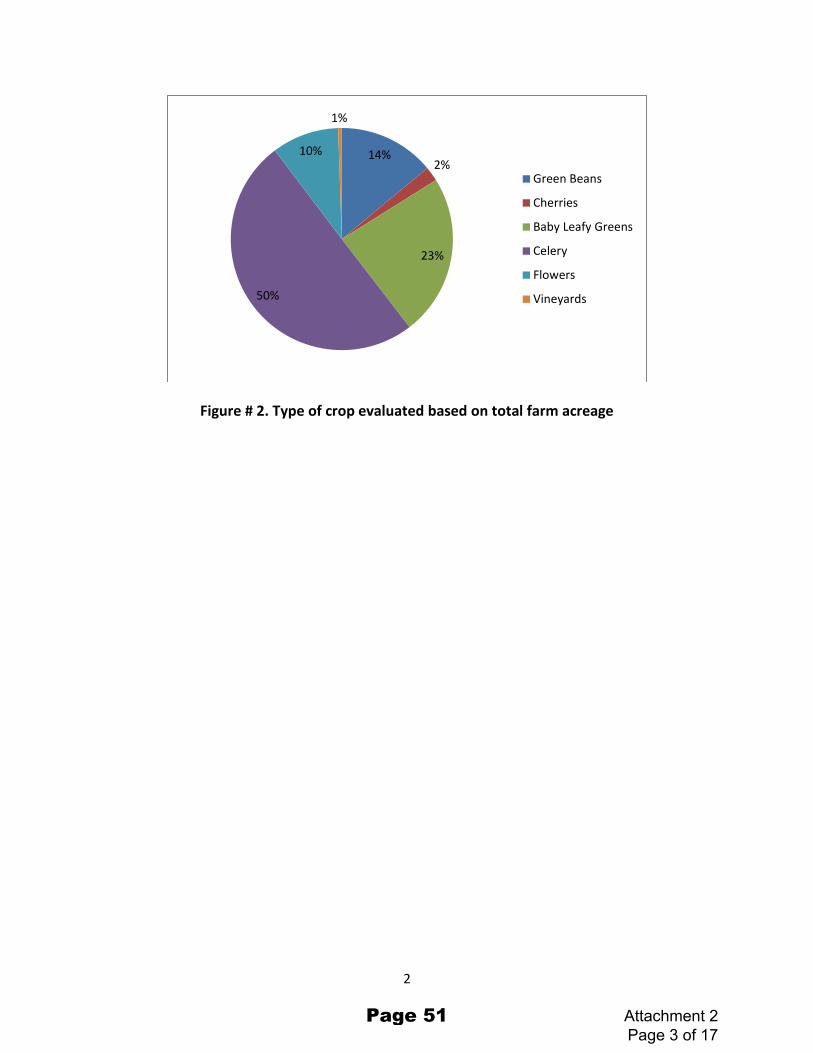
2
Figure # 2. Type of crop evaluated based on total farm acreage
14%2%
23%
50%
10%
1%
Green Beans
Cherries
Baby Leafy Greens
Celery
Flowers
Vineyards
Attachment 2 Page 3 of 17
Page 51
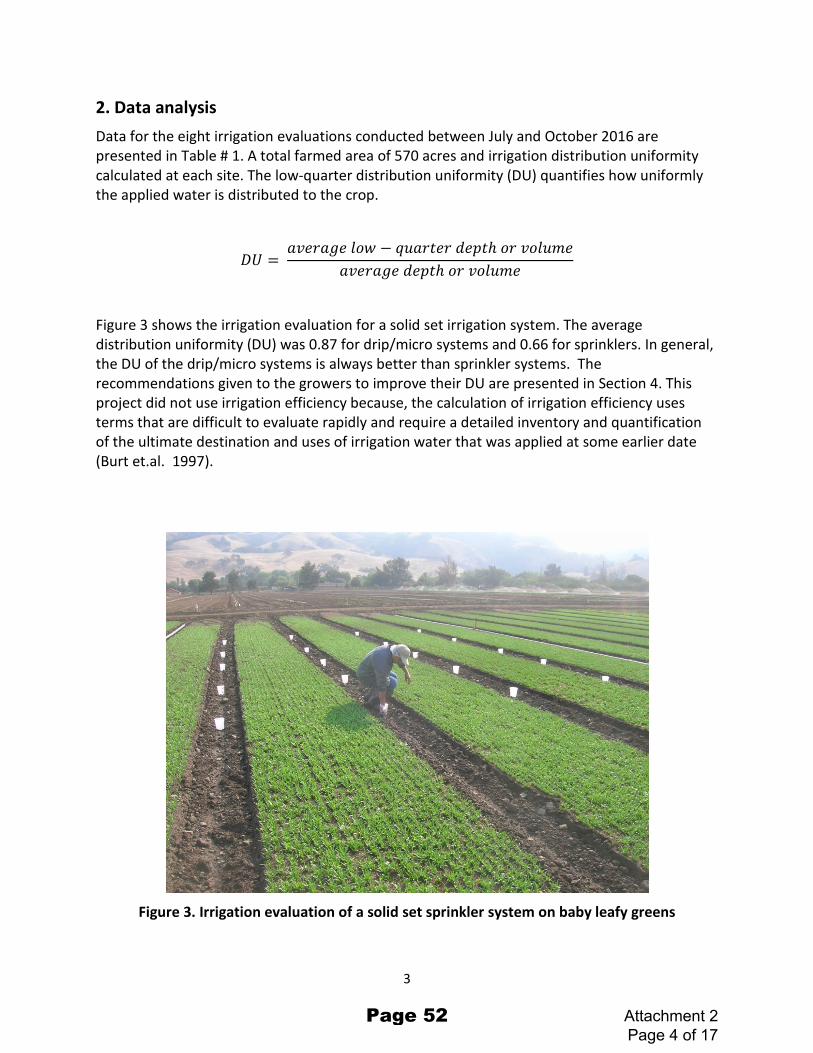
3
2. Data analysis Data for the eight irrigation evaluations conducted between July and October 2016 are presented in Table # 1. A total farmed area of 570 acres and irrigation distribution uniformity calculated at each site. The low-quarter distribution uniformity (DU) quantifies how uniformly the applied water is distributed to the crop.
𝐷𝐷𝐷𝐷 = 𝑎𝑎𝑎𝑎𝑎𝑎𝑎𝑎𝑎𝑎𝑎𝑎𝑎𝑎 𝑙𝑙𝑙𝑙𝑙𝑙 − 𝑞𝑞𝑞𝑞𝑎𝑎𝑎𝑎𝑞𝑞𝑎𝑎𝑎𝑎 𝑑𝑑𝑎𝑎𝑑𝑑𝑞𝑞ℎ 𝑙𝑙𝑎𝑎 𝑎𝑎𝑙𝑙𝑙𝑙𝑞𝑞𝑣𝑣𝑎𝑎
𝑎𝑎𝑎𝑎𝑎𝑎𝑎𝑎𝑎𝑎𝑎𝑎𝑎𝑎 𝑑𝑑𝑎𝑎𝑑𝑑𝑞𝑞ℎ 𝑙𝑙𝑎𝑎 𝑎𝑎𝑙𝑙𝑙𝑙𝑞𝑞𝑣𝑣𝑎𝑎
Figure 3 shows the irrigation evaluation for a solid set irrigation system. The average distribution uniformity (DU) was 0.87 for drip/micro systems and 0.66 for sprinklers. In general, the DU of the drip/micro systems is always better than sprinkler systems. The recommendations given to the growers to improve their DU are presented in Section 4. This project did not use irrigation efficiency because, the calculation of irrigation efficiency uses terms that are difficult to evaluate rapidly and require a detailed inventory and quantification of the ultimate destination and uses of irrigation water that was applied at some earlier date (Burt et.al. 1997).
Figure 3. Irrigation evaluation of a solid set sprinkler system on baby leafy greens
Attachment 2 Page 4 of 17
Page 52

4
Table # 1. Summary data of irrigation evaluations conducted during 2016
Evaluation #
Crop
Total Ranch Area
(Acres)
Irrigation System
Distribution Uniformity
1 16-03 Green Beans 16 Drip 0.88
2 16-05 Green Beans 37 Drip 0.80
3 16-09 Cherries 8 Micro Sprinklers 0.85
4 16-10 Baby Leafy Greens 90 Solid Set
Sprinkler 0.81
5 16-12 Celery 190 Drip 0.90
6 16-13 Celery 190 Solid Set Sprinklers 0.50
7 16-14 Flowers 37 Drip 0.93
8 16-15 Vineyards 2 Drip 0.84
Total Ranch Acres = 570
Micro/Drip
Sprinklers
0.87
0.66
Attachment 2 Page 5 of 17
Page 53
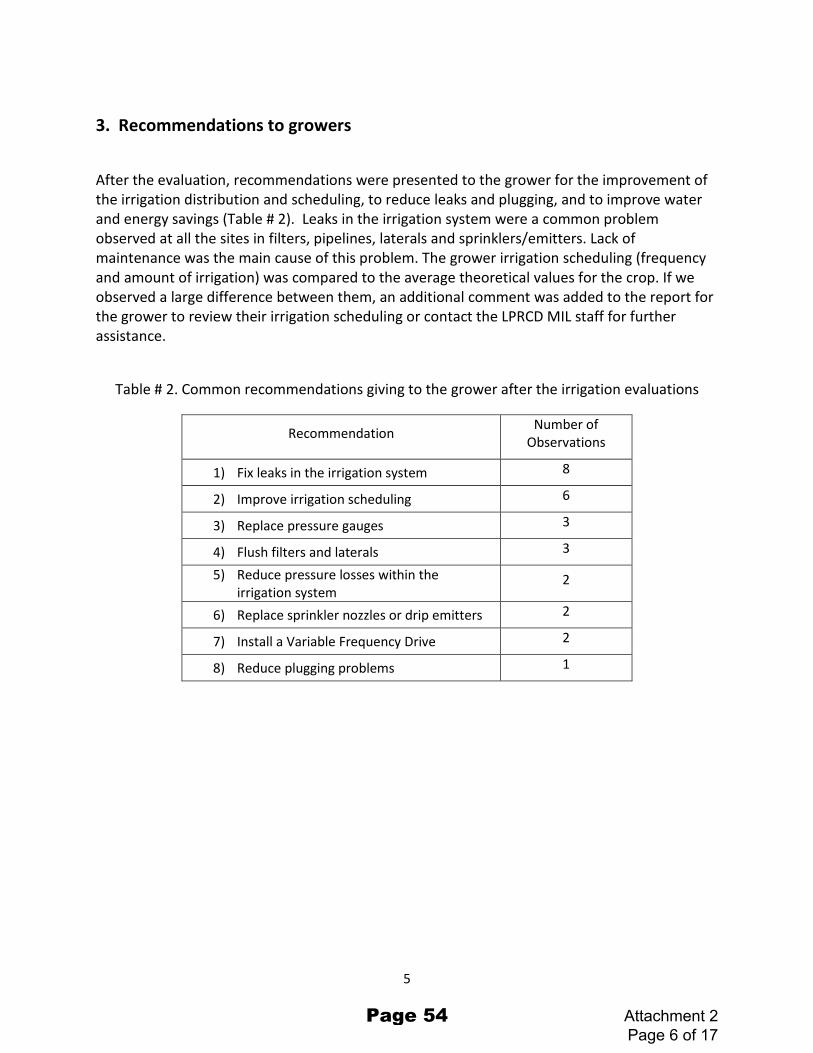
5
3. Recommendations to growers
After the evaluation, recommendations were presented to the grower for the improvement of the irrigation distribution and scheduling, to reduce leaks and plugging, and to improve water and energy savings (Table # 2). Leaks in the irrigation system were a common problem observed at all the sites in filters, pipelines, laterals and sprinklers/emitters. Lack of maintenance was the main cause of this problem. The grower irrigation scheduling (frequency and amount of irrigation) was compared to the average theoretical values for the crop. If we observed a large difference between them, an additional comment was added to the report for the grower to review their irrigation scheduling or contact the LPRCD MIL staff for further assistance.
Table # 2. Common recommendations giving to the grower after the irrigation evaluations
Recommendation Number of Observations
1) Fix leaks in the irrigation system 8
2) Improve irrigation scheduling 6
3) Replace pressure gauges 3
4) Flush filters and laterals 3
5) Reduce pressure losses within the irrigation system
2
6) Replace sprinkler nozzles or drip emitters 2
7) Install a Variable Frequency Drive 2
8) Reduce plugging problems 1
Attachment 2 Page 6 of 17
Page 54
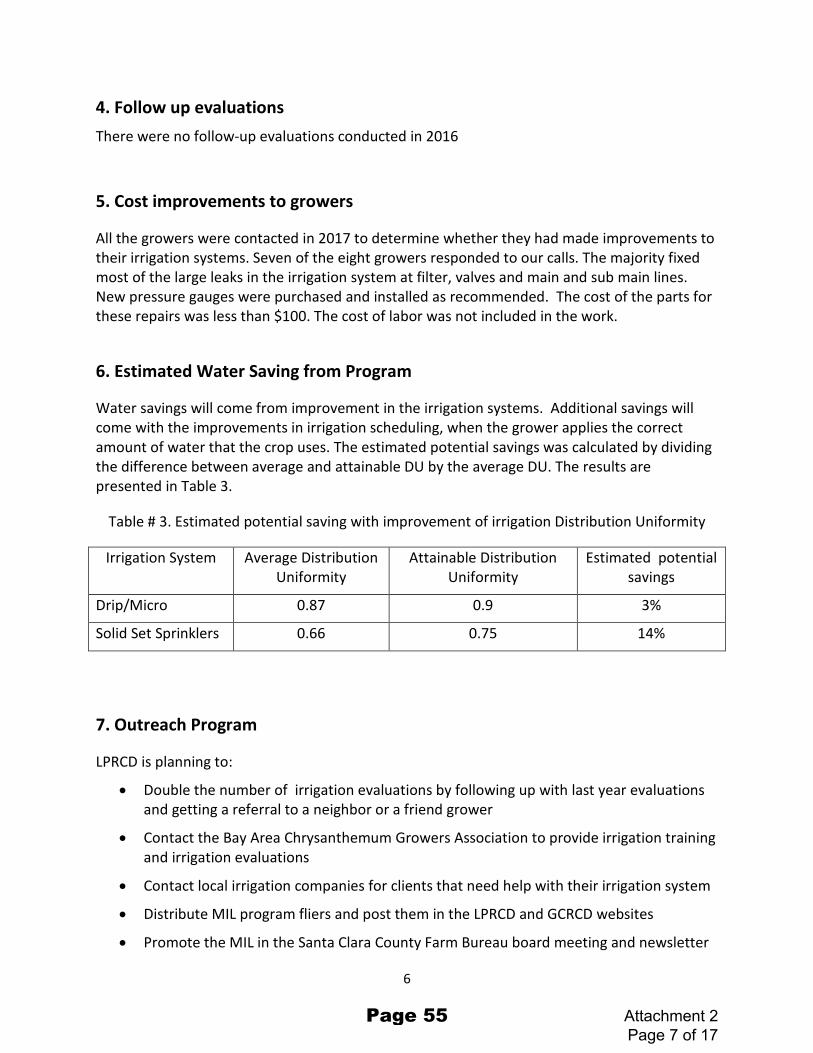
6
4. Follow up evaluations There were no follow-up evaluations conducted in 2016
5. Cost improvements to growers
All the growers were contacted in 2017 to determine whether they had made improvements to their irrigation systems. Seven of the eight growers responded to our calls. The majority fixed most of the large leaks in the irrigation system at filter, valves and main and sub main lines. New pressure gauges were purchased and installed as recommended. The cost of the parts for these repairs was less than $100. The cost of labor was not included in the work.
6. Estimated Water Saving from Program
Water savings will come from improvement in the irrigation systems. Additional savings will come with the improvements in irrigation scheduling, when the grower applies the correct amount of water that the crop uses. The estimated potential savings was calculated by dividing the difference between average and attainable DU by the average DU. The results are presented in Table 3.
Table # 3. Estimated potential saving with improvement of irrigation Distribution Uniformity
Irrigation System Average Distribution Uniformity
Attainable Distribution Uniformity
Estimated potential savings
Drip/Micro 0.87 0.9 3%
Solid Set Sprinklers 0.66 0.75 14%
7. Outreach Program
LPRCD is planning to:
• Double the number of irrigation evaluations by following up with last year evaluations and getting a referral to a neighbor or a friend grower
• Contact the Bay Area Chrysanthemum Growers Association to provide irrigation training and irrigation evaluations
• Contact local irrigation companies for clients that need help with their irrigation system
• Distribute MIL program fliers and post them in the LPRCD and GCRCD websites
• Promote the MIL in the Santa Clara County Farm Bureau board meeting and newsletter
Attachment 2 Page 7 of 17
Page 55
7
• Partner with Central Coast Vineyard Team to promote the MIL as part of the Sustainability In Practice Certification
• Place an add on farmsreach.com
• Place an MIL announcement in the Agriculture Water Quality Alliance Monthly newsletter
• Link MIL services with the new yearly LPRCD irrigator training in Santa Clara County
• Partner with Santa Clara County Weed Management Area to promote the MIL program
8. Recommendations for the Mobile Lab Program
The following work is planned for 2017:
1) Improve our outreach to increase the number of irrigation evaluations conducted during the year
2) Follow up the with 2016 growers to re-evaluate their farms and to document implementation of recommendations and improvements in the DU
3) Install portable flow meters in the fields to provide the growers with information on the amounts of water applied that can be compared to crop water needs. This will help growers assess their irrigation efficiency.
Attachment 2 Page 8 of 17
Page 56

8
APPENDIX 1. IRRIGATION EVALUATION SUMMARY
Attachment 2 Page 9 of 17
Page 57
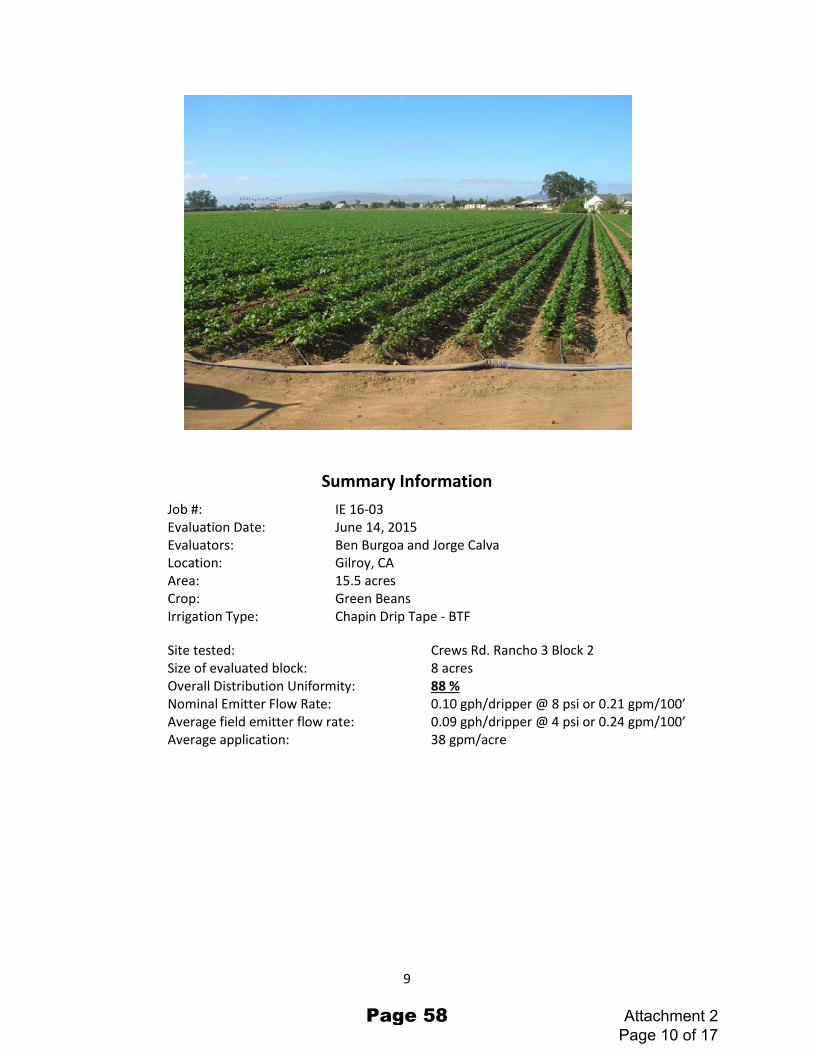
9
Summary Information Job #: IE 16-03 Evaluation Date: June 14, 2015 Evaluators: Ben Burgoa and Jorge Calva Location: Gilroy, CA Area: 15.5 acres Crop: Green Beans Irrigation Type: Chapin Drip Tape - BTF
Site tested: Crews Rd. Rancho 3 Block 2 Size of evaluated block: 8 acres Overall Distribution Uniformity: 88 % Nominal Emitter Flow Rate: 0.10 gph/dripper @ 8 psi or 0.21 gpm/100’ Average field emitter flow rate: 0.09 gph/dripper @ 4 psi or 0.24 gpm/100’ Average application: 38 gpm/acre
Attachment 2 Page 10 of 17
Page 58

10
Summary Information Job #: IE 16-05 Evaluation Date: June 22, 2016 Evaluators: Ben Burgoa and Jorge Calva Location: Gilroy, CA Area: 37 acres Crop: Green Beans Irrigation Type: Chapin Drip Tape - BTF
Site tested: Crews Rd. Rancho 2 Size of evaluated block: 11 acres Overall Distribution Uniformity: 80 % Nominal Emitter Flow Rate: 0.12 gph/dripper @ 10 psi or 0.3 gpm/100’ Average field emitter flow rate: 0.13 gph/dripper @ 10 psi or 0.31 gpm/100’ Average application: 41 gpm/acre
Attachment 2 Page 11 of 17
Page 59

11
Summary Information Job #: IE 16-09 Evaluation Date: July 21, 2016 Evaluators: Ben Burgoa and Jorge Calva Location: Gilroy, CA Area: 7.6 acres Crop: Cherries Irrigation Type: 2002 Aqua Smart PC Micro-sprinkler, Jain Irrigation Inc.
Site tested: West Block Size of evaluated block: ≈4.3 acres Overall Distribution Uniformity: 85 % Nominal Emitter Flow Rate: 7.4 gph @ 20 to 60 psi Average field emitter flow rate: 5.9 gph @ 10 psi Average application: 16 gpm/acre
Attachment 2 Page 12 of 17
Page 60
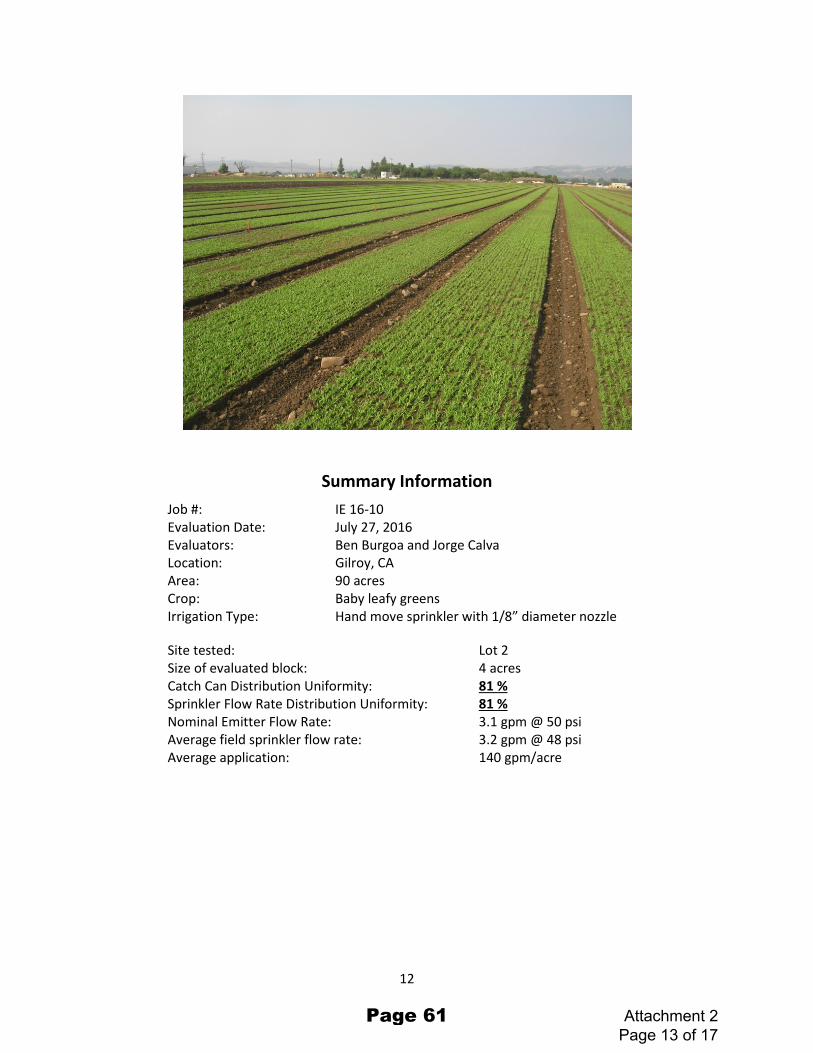
12
Summary Information Job #: IE 16-10 Evaluation Date: July 27, 2016 Evaluators: Ben Burgoa and Jorge Calva Location: Gilroy, CA Area: 90 acres Crop: Baby leafy greens Irrigation Type: Hand move sprinkler with 1/8” diameter nozzle
Site tested: Lot 2 Size of evaluated block: 4 acres Catch Can Distribution Uniformity: 81 % Sprinkler Flow Rate Distribution Uniformity: 81 % Nominal Emitter Flow Rate: 3.1 gpm @ 50 psi Average field sprinkler flow rate: 3.2 gpm @ 48 psi Average application: 140 gpm/acre
Attachment 2 Page 13 of 17
Page 61
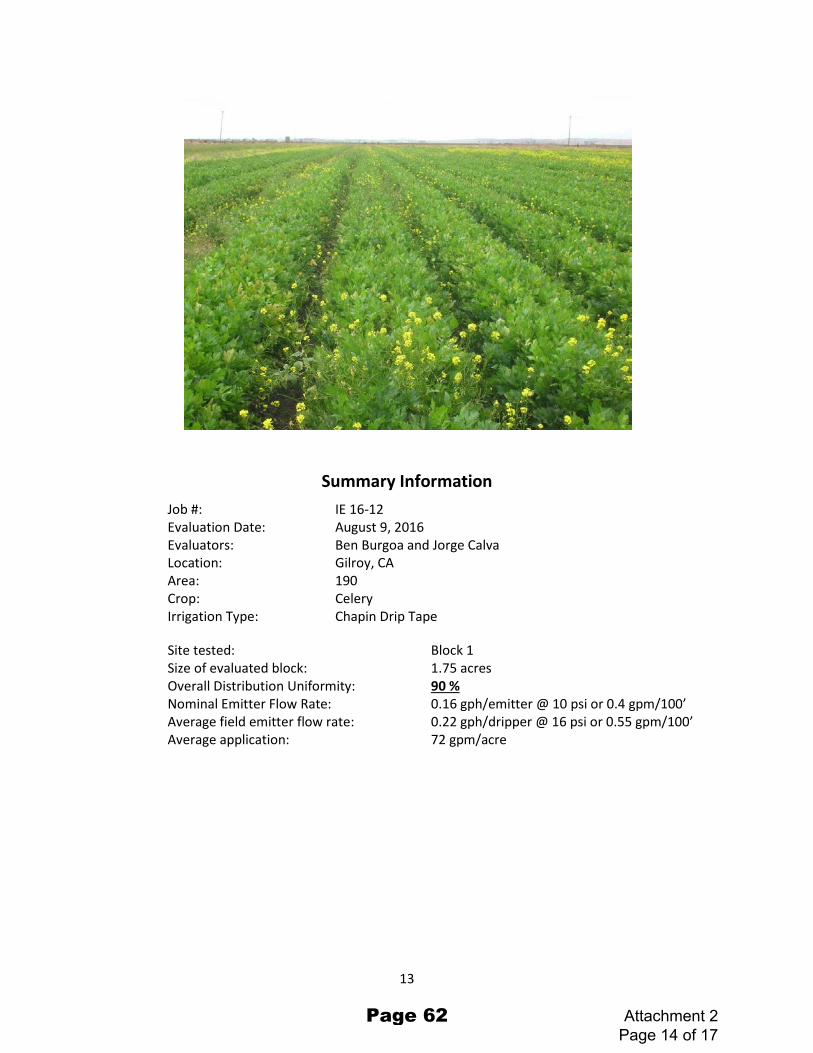
13
Summary Information Job #: IE 16-12 Evaluation Date: August 9, 2016 Evaluators: Ben Burgoa and Jorge Calva Location: Gilroy, CA Area: 190 Crop: Celery Irrigation Type: Chapin Drip Tape
Site tested: Block 1 Size of evaluated block: 1.75 acres Overall Distribution Uniformity: 90 % Nominal Emitter Flow Rate: 0.16 gph/emitter @ 10 psi or 0.4 gpm/100’ Average field emitter flow rate: 0.22 gph/dripper @ 16 psi or 0.55 gpm/100’ Average application: 72 gpm/acre
Attachment 2 Page 14 of 17
Page 62
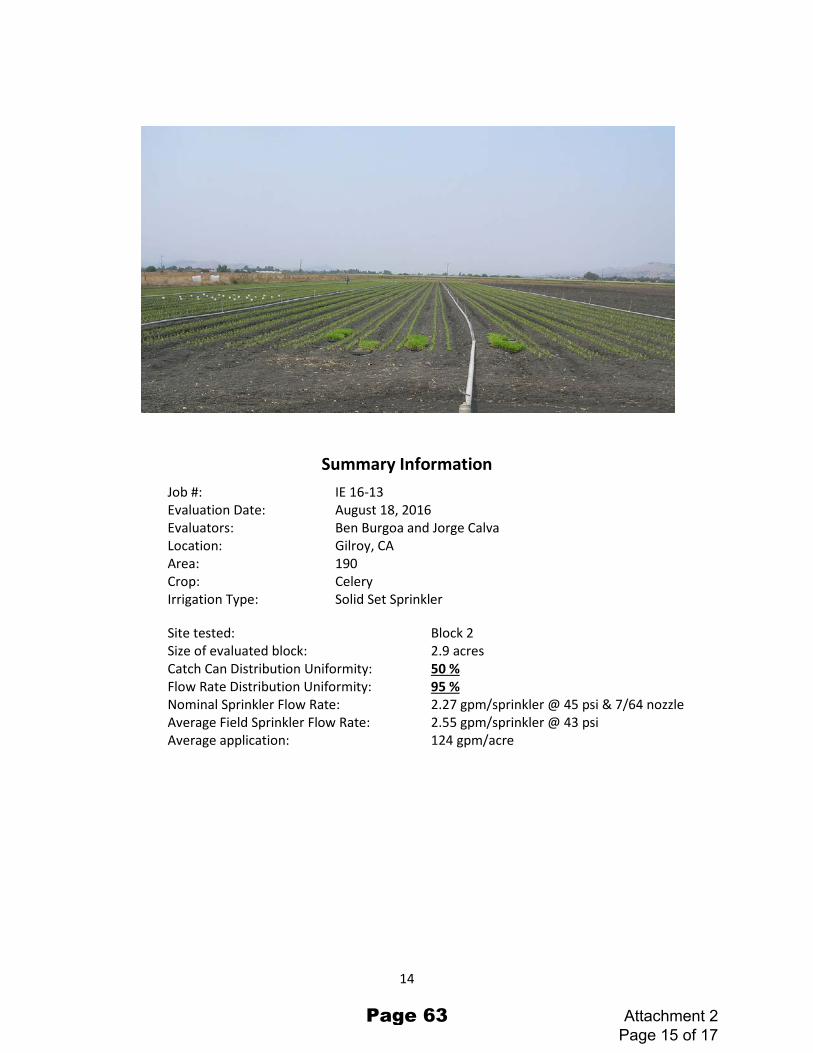
14
Summary Information Job #: IE 16-13 Evaluation Date: August 18, 2016 Evaluators: Ben Burgoa and Jorge Calva Location: Gilroy, CA Area: 190 Crop: Celery Irrigation Type: Solid Set Sprinkler
Site tested: Block 2 Size of evaluated block: 2.9 acres Catch Can Distribution Uniformity: 50 % Flow Rate Distribution Uniformity: 95 % Nominal Sprinkler Flow Rate: 2.27 gpm/sprinkler @ 45 psi & 7/64 nozzle Average Field Sprinkler Flow Rate: 2.55 gpm/sprinkler @ 43 psi Average application: 124 gpm/acre
Attachment 2 Page 15 of 17
Page 63

15
Summary Information Job #: IE 16-14 Evaluation Date: August 23, 2016 Evaluators: Ben Burgoa and Jorge Calva Location: Gilroy, CA Area: 37 Crop: Flowers Irrigation Type: Chapin Drip Tape - BTF
Site tested: Block 2 Size of evaluated block: 2.85 acres Overall Distribution Uniformity: 93 % Nominal Emitter Flow Rate: 0.13 gph/emitter @ 8 psi or 0.32 gpm/100’ Average field emitter flow rate: 0.14 gph/dripper @ 9 psi or 0.36 gpm/100’ Average application: 47 gpm/acre
Attachment 2 Page 16 of 17
Page 64

16
Summary Information Job #: IE 16-15 Evaluation Date: September 1, 2016 Evaluators: Ben Burgoa and Jorge Calva Location: Gilroy, CA Area: 2.4 acres Crop: Vineyard Irrigation Type: Netafim Pressure Compensating Drippers
Site tested: Block 1 Size of evaluated block: 2.4 acres Overall Distribution Uniformity: 84 % Nominal Emitter Flow Rate: 0.50 gph/emitter @ 7 – 45 psi Average field emitter flow rate: 0.61 gph/dripper @ 22 psi Average application: 11 gpm/acre
Attachment 2 Page 17 of 17
Page 65

This Page Intentionally Left Blank Page 66
Page 1 of 3
Committee: Water Conservation and
Demand Management
Meeting Date: 04/30/18
Agenda Item No.: 4.2
Unclassified Manager: Garth Hall
Email: [email protected]
Est. Staff Time: 10 minutes
COMMITTEE AGENDA MEMO
SUBJECT: Water Supply Reliability Level of Service Goal RECOMMENDED ACTION: This is a discussion item and the Committee may provide comments, however, no action is required. SUMMARY: On September 19, 2017, the Board approved considering a level of service goal lower than currently used for water supply planning. The Board also directed staff to return with additional information on the costs associated with different levels of service and report on stakeholder input. If the District establishes a level of service goal that is too high, it would be planning to make investments whose costs exceed their benefits. The Board requested that staff present information to the Committee on the water supply reliability level of service goal and related topics for the Water Supply Master Plan Update (WSMP) prior to bringing the information to the full Board. The level of service goal establishes the Board’s policy on balancing how reliable future water supplies are expected to be against the cost of providing that reliability. Staff uses the level of service goal to set the target that is used for developing and evaluating water supply alternatives in the WSMP. This item presents information on the benefits and costs of different levels of service and identifies other potential considerations for establishing the level of service goal. BACKGROUND: The WSMP is the District’s strategy for providing a reliable and sustainable water supply in a cost-effective manner. It describes the new water supply investments the District is planning to make, the anticipated schedule of those investments, and the associated costs and benefits of the investments. The level of service goal is important because it guides the level of new investment the District will need. Avoided Cost of Shortage In preparation for these discussions, staff estimated the benefits and costs of different levels of service, which is defined as the estimated maximum shortage level associated with a water supply strategy scenario. Benefits are the estimated value to the community of having fewer and lower level shortages, often referred to as the Avoided Cost of Shortage. The Avoided Cost of Shortage is not an actual cost borne by District ratepayers, rather it is the estimated amount water users would be willing to be pay to reduce the magnitude and frequency of water supply shortages. Costs are the estimated lifecycle costs of the projects in the water supply strategy scenario.
Page 67

Page 2 of 3
Staff worked with the economist on the Expert Panel convened for the WSMP to develop a methodology to estimate the Avoided Cost of Shortages (i.e., the benefits to the community). This is a widely used methodology for valuing increments (or decrements) of water supply. For example, it provides the basis for the calculation of water supply benefits for the California Water Fix (by Sunding in 2015), the economic cost of the state conservation mandate (by M.Cubed in 2015), and numerous other statewide and regional water resources benefit-cost assessments. Figure 1 shows the range of benefits and costs for the District at different levels of service compared to a base case. The base case includes existing water supply facilities, additional regulatory restrictions that reduce Delta-conveyed supplies, and increases in demands. Water shortages of 50 percent in multiple years are associated with the base case, meaning that the District would only be able to meet half of future demand in multiple dry years. In Figure 1, to go from a 50 percent maximum shortage to a 30 percent maximum shortage, the range of costs for new investments (between about $800 million and $1.5 billion) is well below the range of benefits (between about $2.2 billion and $2.5 billion). This indicates that investments to reduce shortages from 50 percent in the base case to 30 percent in these scenarios are cost effective and have a good return on investment. As the maximum shortage level decreases to 15 percent and 10 percent, the value of avoiding shortages increases, but at a diminishing rate; meanwhile the cost of providing increased reliability goes up. In most cases, the benefits of water supply strategy scenarios exceed the costs of the scenarios, indicating that most scenarios are cost-effective. Figure 1. Benefits and Costs of Different Levels of Service
Additional Level of Service Goal Considerations Different levels of service can be achieved cost-effectively. Therefore, the Board will need to use other considerations in deciding on the level of service goal. These other considerations could include incremental benefits of increasing levels of service, the planning objectives, stakeholder input, consistency with State and regional policy, frequency of shortage, preferred water supply strategies, and feasibility. Two of these considerations are discussed below.
Page 68
Page 3 of 3
Incremental Benefits A key finding of staff’s analysis to date is that the projects the Board recently approved for planning (Water Supply Master Plan No Regrets Package, California Water Fix, and up to 24,000 acre-feet per year of potable reuse at Los Gatos Ponds) appear to be sufficient to meet an 85 percent water supply reliability level of service goal (maximum 15% shortage). The value of avoided shortage for this scenario is approximately $2.8 billion (present value) while the cost is estimated at $2.0 billion (present value). Stakeholder Input Staff held two stakeholder workshops in January 2018 – one with general stakeholders on January 12th and one with retailers on January 30th – to solicit input on water supply projects and strategies, including the level of service goal. Some participants were open to reducing the level of service goal down to 70 percent as a method of encouraging conservation and reducing the level investment needed. Others expressed concerns about having too low a goal and the impact that could have on reliability. Input from the workshops is provided in Attachment 1. Staff will solicit feedback on these and other considerations at the Committee meeting. Next Steps
Staff plans to respond to Committee input and direction received at this meeting and return with additional analysis in June 2018. Once the Committee agrees on a recommended level of service goal, staff will bring the recommendation to the full Board. ATTACHMENT(S): Attachment 1: Stakeholder Workshops Summary
Page 69

This Page Intentionally Left Blank Page 70
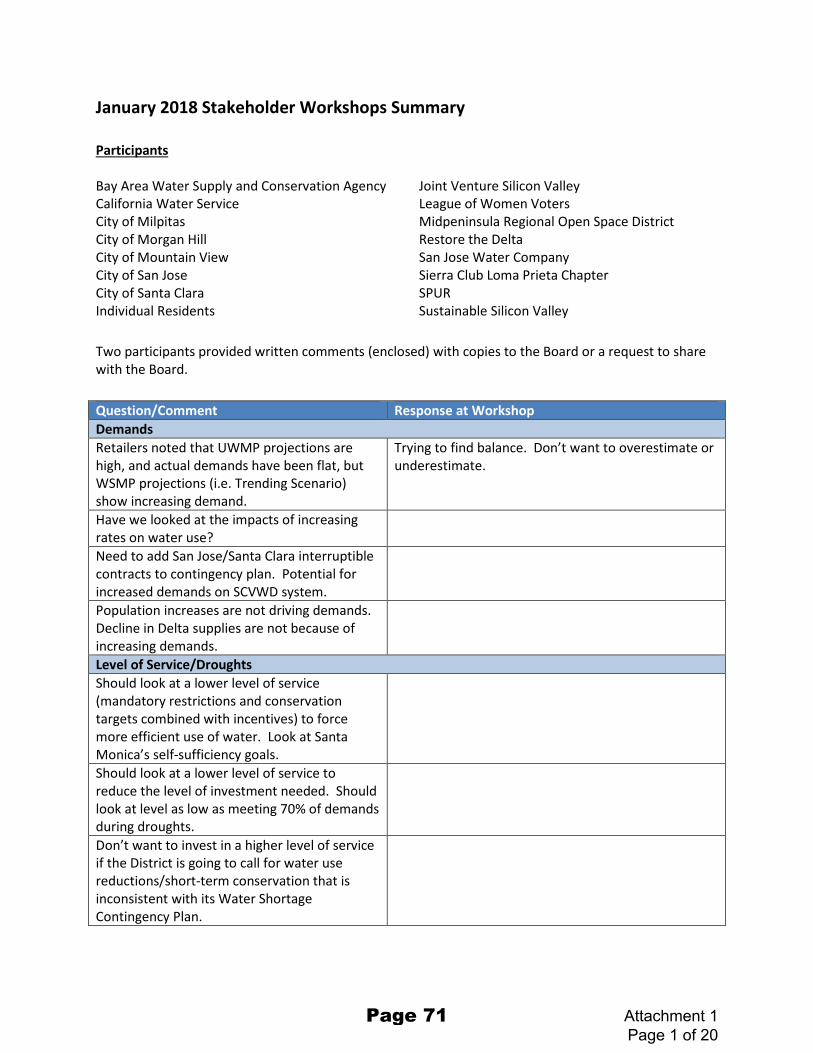
January 2018 Stakeholder Workshops Summary Participants Bay Area Water Supply and Conservation Agency California Water Service City of Milpitas City of Morgan Hill City of Mountain View City of San Jose City of Santa Clara Individual Residents
Joint Venture Silicon Valley League of Women Voters Midpeninsula Regional Open Space District Restore the Delta San Jose Water Company Sierra Club Loma Prieta Chapter SPUR Sustainable Silicon Valley
Two participants provided written comments (enclosed) with copies to the Board or a request to share with the Board. Question/Comment Response at Workshop Demands Retailers noted that UWMP projections are high, and actual demands have been flat, but WSMP projections (i.e. Trending Scenario) show increasing demand.
Trying to find balance. Don’t want to overestimate or underestimate.
Have we looked at the impacts of increasing rates on water use?
Need to add San Jose/Santa Clara interruptible contracts to contingency plan. Potential for increased demands on SCVWD system.
Population increases are not driving demands. Decline in Delta supplies are not because of increasing demands.
Level of Service/Droughts Should look at a lower level of service (mandatory restrictions and conservation targets combined with incentives) to force more efficient use of water. Look at Santa Monica’s self-sufficiency goals.
Should look at a lower level of service to reduce the level of investment needed. Should look at level as low as meeting 70% of demands during droughts.
Don’t want to invest in a higher level of service if the District is going to call for water use reductions/short-term conservation that is inconsistent with its Water Shortage Contingency Plan.
Attachment 1 Page 1 of 20
Page 71
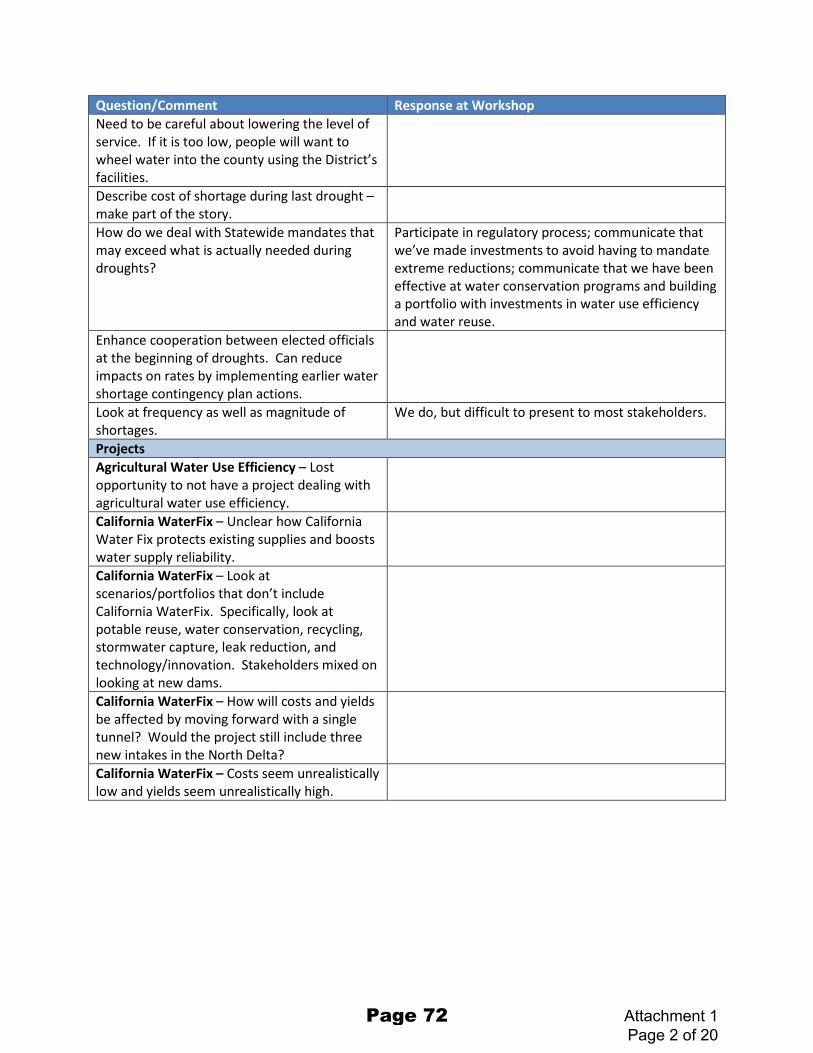
Question/Comment Response at Workshop Need to be careful about lowering the level of service. If it is too low, people will want to wheel water into the county using the District’s facilities. Describe cost of shortage during last drought – make part of the story. How do we deal with Statewide mandates that may exceed what is actually needed during droughts?
Participate in regulatory process; communicate that we’ve made investments to avoid having to mandate extreme reductions; communicate that we have been effective at water conservation programs and building a portfolio with investments in water use efficiency and water reuse.
Enhance cooperation between elected officials at the beginning of droughts. Can reduce impacts on rates by implementing earlier water shortage contingency plan actions. Look at frequency as well as magnitude of shortages.
We do, but difficult to present to most stakeholders.
Projects Agricultural Water Use Efficiency – Lost opportunity to not have a project dealing with agricultural water use efficiency. California WaterFix – Unclear how California Water Fix protects existing supplies and boosts water supply reliability. California WaterFix – Look at scenarios/portfolios that don’t include California WaterFix. Specifically, look at potable reuse, water conservation, recycling, stormwater capture, leak reduction, and technology/innovation. Stakeholders mixed on looking at new dams. California WaterFix – How will costs and yields be affected by moving forward with a single tunnel? Would the project still include three new intakes in the North Delta? California WaterFix – Costs seem unrealistically low and yields seem unrealistically high.
Attachment 1 Page 2 of 20
Page 72
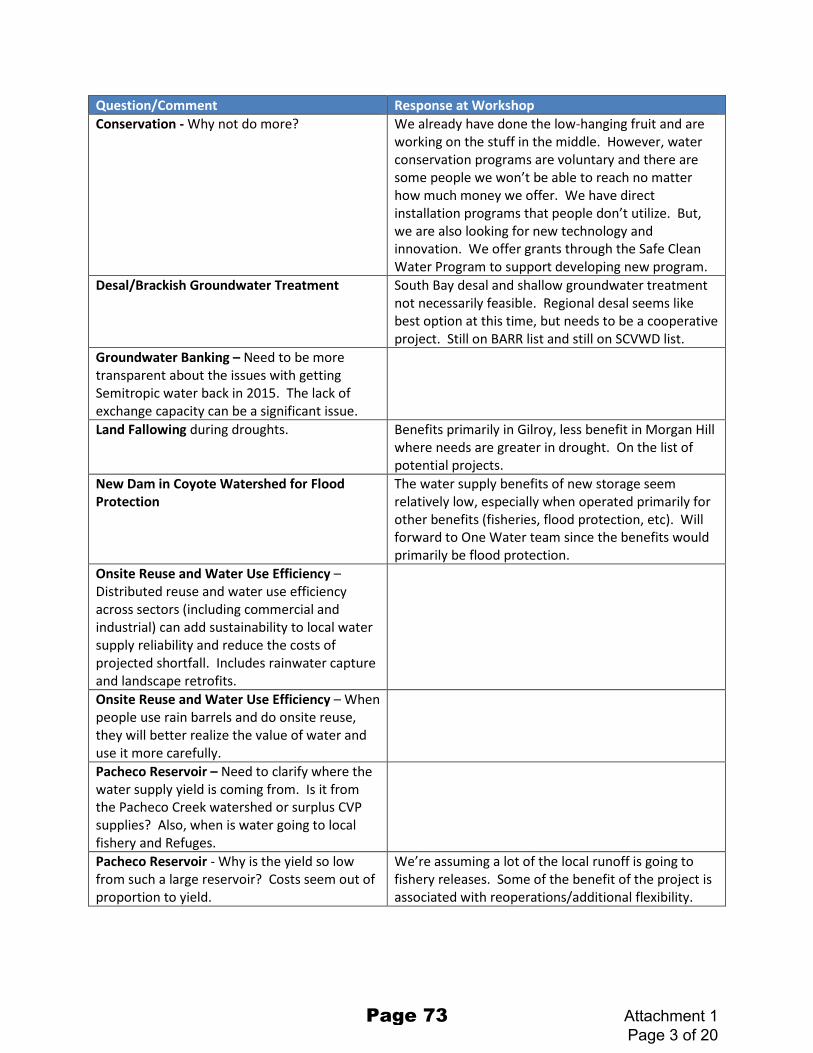
Question/Comment Response at Workshop Conservation - Why not do more? We already have done the low-hanging fruit and are
working on the stuff in the middle. However, water conservation programs are voluntary and there are some people we won’t be able to reach no matter how much money we offer. We have direct installation programs that people don’t utilize. But, we are also looking for new technology and innovation. We offer grants through the Safe Clean Water Program to support developing new program.
Desal/Brackish Groundwater Treatment South Bay desal and shallow groundwater treatment not necessarily feasible. Regional desal seems like best option at this time, but needs to be a cooperative project. Still on BARR list and still on SCVWD list.
Groundwater Banking – Need to be more transparent about the issues with getting Semitropic water back in 2015. The lack of exchange capacity can be a significant issue.
Land Fallowing during droughts. Benefits primarily in Gilroy, less benefit in Morgan Hill where needs are greater in drought. On the list of potential projects.
New Dam in Coyote Watershed for Flood Protection
The water supply benefits of new storage seem relatively low, especially when operated primarily for other benefits (fisheries, flood protection, etc). Will forward to One Water team since the benefits would primarily be flood protection.
Onsite Reuse and Water Use Efficiency – Distributed reuse and water use efficiency across sectors (including commercial and industrial) can add sustainability to local water supply reliability and reduce the costs of projected shortfall. Includes rainwater capture and landscape retrofits.
Onsite Reuse and Water Use Efficiency – When people use rain barrels and do onsite reuse, they will better realize the value of water and use it more carefully.
Pacheco Reservoir – Need to clarify where the water supply yield is coming from. Is it from the Pacheco Creek watershed or surplus CVP supplies? Also, when is water going to local fishery and Refuges.
Pacheco Reservoir - Why is the yield so low from such a large reservoir? Costs seem out of proportion to yield.
We’re assuming a lot of the local runoff is going to fishery releases. Some of the benefit of the project is associated with reoperations/additional flexibility.
Attachment 1 Page 3 of 20
Page 73
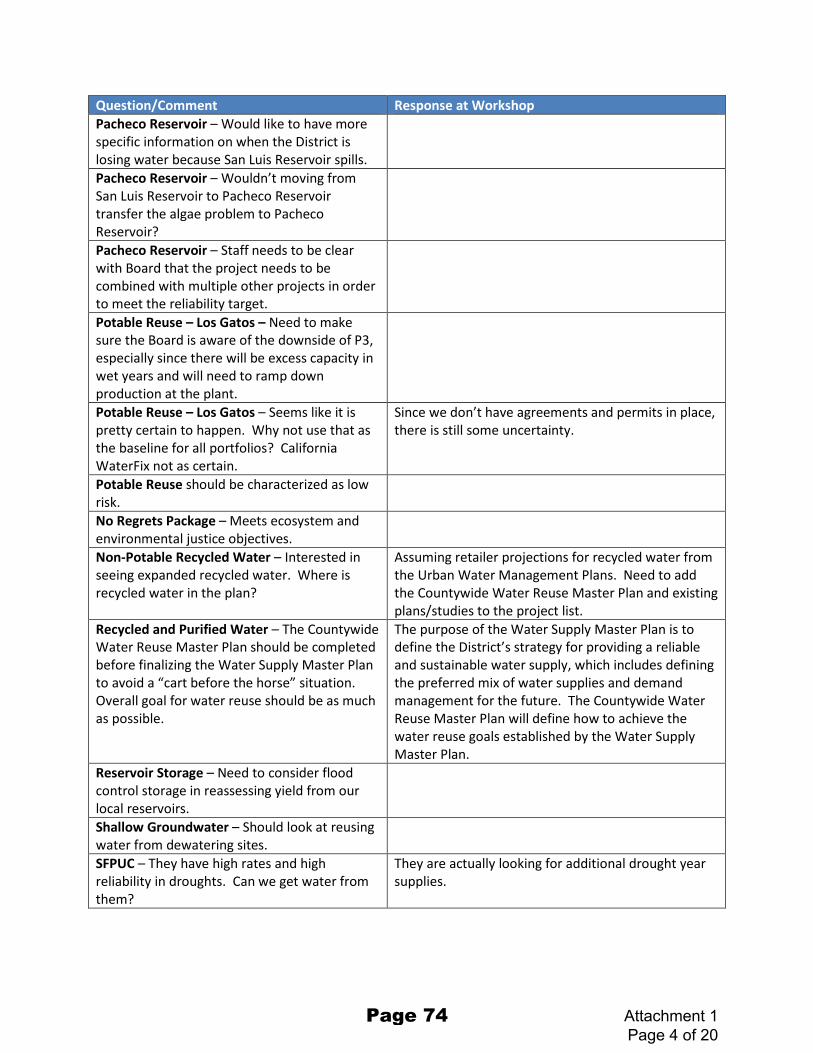
Question/Comment Response at Workshop Pacheco Reservoir – Would like to have more specific information on when the District is losing water because San Luis Reservoir spills.
Pacheco Reservoir – Wouldn’t moving from San Luis Reservoir to Pacheco Reservoir transfer the algae problem to Pacheco Reservoir?
Pacheco Reservoir – Staff needs to be clear with Board that the project needs to be combined with multiple other projects in order to meet the reliability target.
Potable Reuse – Los Gatos – Need to make sure the Board is aware of the downside of P3, especially since there will be excess capacity in wet years and will need to ramp down production at the plant.
Potable Reuse – Los Gatos – Seems like it is pretty certain to happen. Why not use that as the baseline for all portfolios? California WaterFix not as certain.
Since we don’t have agreements and permits in place, there is still some uncertainty.
Potable Reuse should be characterized as low risk.
No Regrets Package – Meets ecosystem and environmental justice objectives.
Non-Potable Recycled Water – Interested in seeing expanded recycled water. Where is recycled water in the plan?
Assuming retailer projections for recycled water from the Urban Water Management Plans. Need to add the Countywide Water Reuse Master Plan and existing plans/studies to the project list.
Recycled and Purified Water – The Countywide Water Reuse Master Plan should be completed before finalizing the Water Supply Master Plan to avoid a “cart before the horse” situation. Overall goal for water reuse should be as much as possible.
The purpose of the Water Supply Master Plan is to define the District’s strategy for providing a reliable and sustainable water supply, which includes defining the preferred mix of water supplies and demand management for the future. The Countywide Water Reuse Master Plan will define how to achieve the water reuse goals established by the Water Supply Master Plan.
Reservoir Storage – Need to consider flood control storage in reassessing yield from our local reservoirs.
Shallow Groundwater – Should look at reusing water from dewatering sites.
SFPUC – They have high rates and high reliability in droughts. Can we get water from them?
They are actually looking for additional drought year supplies.
Attachment 1 Page 4 of 20
Page 74

Question/Comment Response at Workshop Surface Water Storage Projects – It seems like a stretch to say dams have ecosystem benefits. Maybe label the objective as “Prop 1 Ecosystem Benefits.”
Costs and Water Rates Should not make decisions about projects based on unit costs (cost/AF). Unit costs don’t tell the whole story and can be used to force decisions to implement unsustainable projects.
The District’s strategy should be scalable and flexibility, so it can be implemented as needed with climate change and supply and demand changes.
Most expensive supply is the water you don’t have.
What is/is not included in the water rates forecast?
The baseline scenario includes California WaterFix, Potable Reuse (up to 45,000 AFY), No Regrets, and Transfer-Bethany Pipeline.
Not clear to public that all the projects the District has on its list are needed now and for future droughts. We shouldn’t overinvest. Are we planning on a gold-plated Cadillac when we really just need a Volkswagen?
Need to have simple and clear explanation of what is needed and why.
Staff seems to have a good handle on appropriate investment levels. Concerned that some may want unnecessary expensive projects.
Staff should make it clear that adding expensive projects isn’t needed to meet future needs at this time. In other words, show that the costs of adding projects does not result in commensurate increasing is reliability.
Need to show the rate impacts of the different projects and portfolios.
Need to make sure that investments are made at the appropriate time. Don’t build a project now that isn’t needed for 40 years.
The District should consider how it wants the public to perceive its actions. When the District sets rates, is it demonstrating that it is conscientious with regard to minimizing rate increases or will it appear that the District is spending unnecessarily.
Attachment 1 Page 5 of 20
Page 75

Question/Comment Response at Workshop Proposed rate increases are substantial and don’t leave room for retailer needs in their systems.
Don’t propose a $2 billion CIP if there is only a $1 million budget.
Need to have sustainable rates as well as a reliable water supply. The rates don’t seem sustainable.
Timing is important. Some of these projects can wait.
Very difficult to justify 10% rate increases, essentially doubling rates over next 10 years, after they already doubled last 10 years. And some of these projects will have costs past Darin’s forecast, are rates going to double again in the next 10 year window. This is not sustainable.
Haven’t adequately considered the effect of increased rates on demands. Rates are going up and demands are going down.
Affordability needs to be a consideration. Discrepancy between the effect of rate increases on the east side vs. west side.
Break out rate impacts without Prop 1 Water Storage Investment Program funding.
Lower income people are hit harder by rate increases, but not drought surcharges.
Do newcomers pay for new water requirements? Are there development fees?
Something at least one Board member is really interested in. Challenging because 1) new development doesn’t appear to be increasing water use and 2) SCVWD is not a land use agency.
Are impact fees included in the costs of projects?
No, but will consider potential sources of revenue in developing the financing plan.
Other Staff should explain why “previously considered” projects were cut from the project list.
None of the projects are off the list forever. Some do not make sense at this time because 1) there are lower cost and/or more effective projects that achieve the same purpose or 2) there are issues with feasibility at this time. Staff will try to improve the descriptions on the project list.
Add a risk column to project summary table. Provide incentives to local urban growers who provide fresh produce to low income families via community gardening projects.
Attachment 1 Page 6 of 20
Page 76
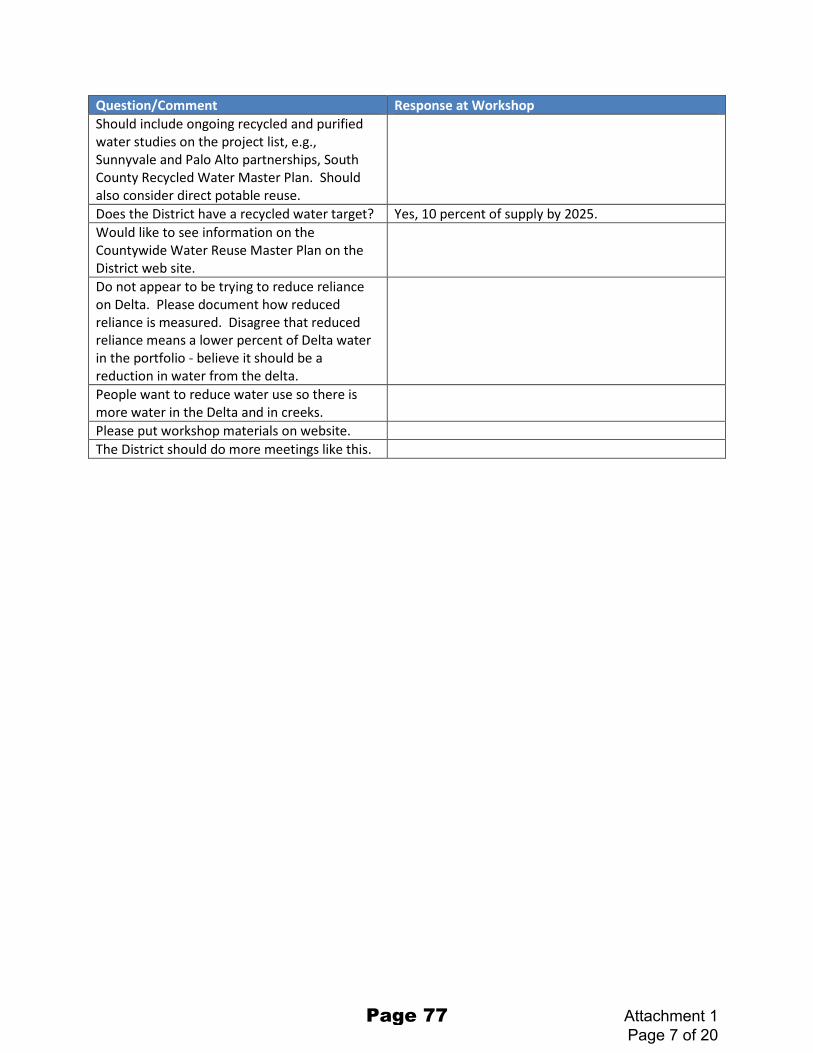
Question/Comment Response at Workshop Should include ongoing recycled and purified water studies on the project list, e.g., Sunnyvale and Palo Alto partnerships, South County Recycled Water Master Plan. Should also consider direct potable reuse.
Does the District have a recycled water target? Yes, 10 percent of supply by 2025. Would like to see information on the Countywide Water Reuse Master Plan on the District web site.
Do not appear to be trying to reduce reliance on Delta. Please document how reduced reliance is measured. Disagree that reduced reliance means a lower percent of Delta water in the portfolio - believe it should be a reduction in water from the delta.
People want to reduce water use so there is more water in the Delta and in creeks.
Please put workshop materials on website. The District should do more meetings like this.
Attachment 1 Page 7 of 20
Page 77

From: Patrick FerraroTo: Tracy HemmeterCc: Jerry De La Piedra; Board of Directors; Barbara Keegan; KatjaSubject: Re: SCVWD Water Supply Master Plan Workshop PresentationDate: Monday, January 22, 2018 12:46:21 PMAttachments: image001.png
WSMP Update 2018 01 12.pptx
Thanks Tracy and Jerry.
The workshop was well worth attending and I complement you both for fielding many toughquestions and concerns about the track that the DRAFT Master Plan implies.
I want to re-state my concern that conducting a Water Reuse Master Plan should becompleted before the finalization of the Water Supply Master Plan.Otherwise, the product willbe a classic " cart-before-the-horse"
I was greatly encouraged last month by the "No Drop Left Behind" seminar sponsored bySustainable Silicon Valley at the Mt. View Microsoft campus. Industry engagement indistributed reuse and water use efficiency can add substantially to local water supplyreliability and reduce the projected costs of shortfalls. The same applies to domestic reuse,rainwater capture and landscape retrofits.
Affordability has become a greater concern for county residents and business, as evidenced bythe well-organized resistance to San Jose Water Company's recent rate increase requests to theCPUC and the damage done during their administrative approach to implementing themandated use reduction during the last drought. But again, I object to decision making basedon unit costs developed to force decisions to implement unsustainable projects.
The "One Water" approach requires that the issue of flood control storage be a majorconsideration for re-assessing the yield from our local water resources. Also, the discussionhas skipped the costs and benefits of direct potable reuse, which of course has the added riskof lack of public acceptance. The benefits to improving Delta water quality by blending withproduct water from the purification plants and reducing the need for Delta water make thisproject worth considering now.
Thanks again for your hard work and public service to our local communities.
Never Thirst!
Pat Ferraro, Former Director, SCVWD
On Mon, Jan 22, 2018 at 9:12 AM, Tracy Hemmeter <[email protected]> wrote:
Hi all,
Thanks to those of you that could attend the Water Supply Master Plan workshop on1/12/18. I’m still working on updating our web page to have more current information, butthought I should at least get you the presentation from the workshop. There are someproject specific slides at the end that I didn’t use during the presentation, but I thought they
Attachment 1 Page 8 of 20
Page 78
Attachment 1 Page 9 of 20
Page 79
From: AlMegTo: Tracy HemmeterCc: AlMegSubject: material for consideration: Re: Santa Clara Valley Water District staff are holding a workshop on Friday, January 12 10AM-12NoonDate: Wednesday, January 10, 2018 11:24:43 AMAttachments: image001.png
AG.MG commnt memo re 2017 Wat Supp Mast Plan .docxWaterFix memo for Oct 17 2017 SCVWD mtg.docx
Hello, Tracy,
I just received your notice as a "forward", and would appreciate your seeing that my e-mail is added to your list of recipients, so that in the future, advancenotice will be provided to my husband and me We look forward to participating in Friday's meeting
My husband and I re-submit the two attached documents (our memos, concerning water supply and the related WaterFix, previously submitted to theSCVWD Board) for inclusion in tomorrow's meeting and consideration by SCVWD staff, the Board and the public
Thank you
Best regards,
Meg Gibersonamgibr-lwv@yahoo com
From: Tracy Hemmeter [mailto themmeter@valleywater org] Sent: Thursday, December 28, 2017 8:28 AMCc: Nina Hawk <NHawk@valleywater org>; Garth Hall <ghall@valleywater org>; Jerry De La Piedra <GDeLaPiedra@valleywater org>; Rick Callender <rcallender@valleywater org>;Rachael Gibson <rgibson@valleywater org>; Paul Randhawa <PRandhawa@valleywater org>Subject: SCVWD Water Supply Master Plan Workshop - 1/12/18 Santa Clara Valley Water District (District) staff are holding a workshop on Friday, January 12, 2018, to get input on different water supply strategies that are being consideredfor the District s Water Supply Master Plan The Water Supply Master Plan is the District s strategy for providing a reliable and sustainable water supply into the future in a cost-effective manner At this workshop, staff will go over projected future water supplies and demands, describe the new projects being considered for the Water Supply MasterPlan, and present potential water supply strategies for stakeholder discussion and input The input will be presented to the District Board as part of the next Water SupplyMaster Plan update, probably in February 2018 The most recent update provided to the Board is available by clicking here I have also attached a summary of the projects thatwe are currently including in the potential water supply strategies Workshop time and location:
Date: Friday, January 12, 2018
Time: 10:00 am to Noon
Location: District Headquarters Boardroom, 5700 Almaden Expressway, San Jose, 95118
Please RSVP so we can make sure we have appropriate number handouts and seats Happy New Year! Tracy
TRACY HEMMETERSENIOR PROJECT MANAGERWater Supply Planning and ConservationSanta Clara Valley Water District5750 Almaden Expressway San Jose CA 95118(408) [email protected]
___________________________________________________
Attachment 1 Page 10 of 20
Page 80

1
TO: Honorable Members of the Santa Clara Valley Water District Board FROM: Alan and Meg Giberson, ratepayers RE: 2017 Water Supply Master Plan DATE: September 19, 2017 The Delta Reform Act of 2009 mandated reducing reliance on the Delta eight years ago. Water Code § 85021. The Water Supply Master Plan and update of 2012 and 2015 could have included these “no regret” projects, and more. However, SCVWD’s 2017 Water Supply Master Plan (current draft) still looks to increase imports through WaterFix, seeking a projected 41,000 afy from WaterFix (more even than the 39,000 afy projected shortfall that was identified last week in the SCVWD 9/12/2017 staff packet “modeled long-term average” graphic). Too much time and money have been spent on WaterFix tunnels, a project that is fraught and tainted by too many unknowns and behind-the-scenes negotiations, dodgy ownership and payment options. It is time to look to local and regional projects for the “shortfall” water and put a hold—preferably permanent—on WaterFix. Strategies to reduce reliance on imported water such as conservation, recycling and stormwater capture can more than compensate for projected future delivery shortfalls (even without WaterFix). Singapore, for example, with a population three times that of Santa Clara County, currently meets 40% of its water demand (~192,640 afy) with recycled water. By 2060 Singapore expects to meet up to 55% of its demand. Recycled water has allowed industries there to reduce their costs because of the high level of purity in the recycled water. Creative local solutions acknowledging our situation should be pursued. Some of Santa Clara County is at or below sea level, where buildings’ lower levels are impacted by infiltrating water: basements of both residences and businesses need to be fitted out with pumps to remove the continuing inflow of water. At a recent SCVWD hearing, Roger Castillo, a local RCD director, pointed to the obvious: the water that pump stations remove from downtown buildings could be pumped to the upper watersheds to replenish the system. Palo Alto residents complained several years ago about large new construction that required ongoing pumping of basements—which then lowered the groundwater level for their areas. The same basement pumping situations are occurring elsewhere in this county. Demand and supply can be managed through thoughtful, proactive, investments in projects that will benefit the health of our economy, our Bay and our community, as well as those of the Delta. What has been proposed in the “No Regrets Package” is a good start, but needs to be
Attachment 1 Page 11 of 20
Page 81

2
pursued more intensively. Growing population doesn’t have to mean increases in water use. Strategies that involve less imported water can meet reasonable demands. The time factor also should be accounted for. The “no regrets” package can be started immediately, with costs and construction overseen by our local authorities, with foreseeable benefits to our economy. The WaterFix will not be operational for well over a decade, with as-yet-undetermined costs and uncertain product, but whose costs will require more ratepayer/taxpayer dollars immediately. A State Water Resources Control Board policy established a mandate (in 2009) to increase the use of recycled water in California:
We strongly encourage local and regional water agencies to move toward clean, abundant, local water for California by emphasizing appropriate water recycling, water conservation, and maintenance of supply infrastructure and the use of stormwater (including dry-weather urban runoff) in these plans; these sources of supply are drought-proof, reliable, and minimize our carbon footprint and can be sustained over the long-term.
The SCVWD should consider the following examples of conservation and recycling projects that have been successfully planned or successfully implemented by others, as projects to emulate. Water conservation—we are doing well, but could do better: Santa Clara Valley and Santa Clara Valley Water District can meet future demand even without WaterFix. • There would be a shortfall of about 23% of our modeled long-term average Delta imports in a future with no WaterFix (assuming the 39,000 afy shortfall mentioned in last week’s memo) and increased restrictions on water from the Delta; according to SCVWD predictions —future shortfalls could equal 37,000 afy (average year, 2040) to 137,000 afy (drought, 2040)
• Conservation in the recent drought has already saved 28% according to SCVWD (approximately 84,000 afy); • conservation predicted in the 2012 Water Master Plan shows that conservation and water recycling strategies will reduce Delta water reliance by 25%. Water recycling—we could do more: • SCVWD looks to only 32,000 acre-feet per year (afy) of non-potable recycled water by 2040. Current recycle figure for the county is up to ≈15,000 afy. (population of Santa Clara County ~ 1.9 million) • Singapore (population ~ 5.7 million) recycles wastewater effectively
- recycled currently meets 40% water demand (~192,640 afy) - has allowed industries to reduce their costs because of the high level of purity in
the recycled water. • Orange County Water District already recycles 103,000 afy that it uses to recharge its underground aquifer for drinking water purposes (unit cost $525 with subsidies and $850 without subsidies)
Attachment 1 Page 12 of 20
Page 82
3
• LA County Sanitation Districts, in partnership with Metropolitan Water District, are planning a Regional Recycled Water Program with an eventual production target of up to 168,000 afy • The LADWP reported in May 2010 that its water recycling/replenishment will use "about 50% less energy than it takes to import water from Northern California and the Colorado River and it will lessen the strain on California's Bay Delta."
• An April 2017 SCVWD/EMC survey showed many more voter/customers willing to pay for recycled water than were willing to invest in maintaining the level of imported water from the Sacramento-San Joaquin [Delta]
• A survey by the Bay Area Council in 2015 found 88 percent in favor of expanding recycled water programs (See: http://www.bayareacouncil.org/news/2015-bay-area-council-poll/ .)
• DWR’s 2005 Water Plan found that “[t]here is a potential of about 0.9 million to 1.4 million acre-feet annually of additional water supply from recycled water by the year 2030.” • Consequences of not cleaning up wastewater could be fines of $5 billion to $10 billion, which could be imposed on sewage treatment plants around the Bay for discharging substances that are fouling the Bay (http://www.mercurynews.com/bay-area-news/ci_24630366/san-francisco-bay-waters-are-becoming-clearer-but) Local stormwater capture could potentially replace a large part of Santa Clara Valley’s imported water.
• SCVWD used imported water to fill its groundwater basins, even when local water from this past rainy winter could have been used to recharge our local aquifers. (See: http://www.mercurynews.com/2017/03/02/water-district-perc-ponds-pass-on-turbid-water-full-of-sediment/ ). As SCVWD says, local aquifers hold nearly half the water used in the county and constitute a vast storage capacity (> 2 times local reservoirs).
• “Groundwater basins are the only thing that even approximate in size of storage [what] we’re going to lose when we lose our snowpack in the decades to come.” (Felicia Marcus, SWRCB Chair, speaking at a GGU water law conference, Jan. 2015)
• Los Angeles has proposed long-term stormwater capture of 179,000 acre-feet/year (conservative estimate) to 258,000 acre-feet/year (afy) (aggressive estimate) by 2099. Santa Clara Valley receives about the same amount of precipitation as LA and should prepare the same aggressive program.
• LA might even capture up to 300,000 afy stormwater says Dr. Richard Luthy, a Stanford professor of civil and environmental engineering and the director of the National Science Foundation’s Engineering Research Center. https://mavensnotebook.com/2016/08/18/stormwater-capture-treatment-and-recharge-for-urban-water-supply/
• The October 2014 stormwater capture bill signed by Gov. Brown points to the opportunity to capture more than 600,000 afy within the Bay Area and Southern California. Population growth, other areas’ experience has shown, does not mean greater water demand (although population growth appears to be SCVWD stated reason for greater projected demand).
Attachment 1 Page 13 of 20
Page 83
4
• In fact, LA population grew by one million while water demand stayed at about the same level for the past 45 years or so. https://www.newsdeeply.com/water/articles/2016/11/08/how-water-use-has-declined-with-population-growth (Also see: Urban Water Demand in California to 2100: Incorporating Climate Change (Aug. 2012) http://pacinst.org/wp-content/uploads/2014/04/2100-urban-water-efficiency.pdf)
• San Francisco Public Utilities Commission saw water use drop 17 percent for its retail customers between 2005 and 2015 while population increased by 10 percent. • SCVWD in its 2012 Water Master Plan looked to a population growth of only 600,000 people by 2035 (ABAG projection) yet claimed that growth will result in an increase in water demands of 94,000 afy by 2035 Leaks account for a lot of lost water:
• “Studies suggest that leak detection surveys could reduce annual water losses by 260,000 gallons per mile surveyed, at a cost of $300 per mile.” Oct. 2016, The Cost of Alternative Water Supply and Efficiency Options in California (Pacific Institute) • DWR estimates that leaks in water district distribution systems siphon away more than 700,000 acre-feet of water a year in California—enough to supply 1.4 million homes for a year. Audits of water utilities have found an average loss through leaks of 10 percent of their total supply. [From Governor’s 5/9/2016 drought message] • Finding leaks in pipes may get easier -- saving money and water according to an MIT study. https://www.wateronline.com/doc/finding-leaks-while-they-re-easy-to-fix-0001?vm_tId=2015739&user=92da4b24-340f-483f-abe0-59407f92cf31&utm_source=et_10759433&utm_medium=email&utm_campaign=WOL_08-10-2017&utm_term=92da4b24-340f-483f-abe0-59407f92cf31&utm_content=Finding+Leaks+While+They%2527re+Easy+To+Fix
Local jobs are created by local/regional projects (that can’t be outsourced):
• SEIU Local 721—the largest public sector union in Southern California—opposes California WaterFix/tunnels and questions the financial plan and higher costs of WaterFix. Their July 13, 2017 letter enumerates the jobs that environmentally sustainable water capture at the local level can create. SEIU Local 721 supports recycling and stormwater capture (Letter already submitted to SCVWD Board).
• The Sacramento Regional Sanitary upgrade will create up to 600 construction jobs (at peak construction) (see: http://www.kcra.com/article/600-workers-will-build-2b-mega-project-in-sacramento/6419879). Similar projects locally could create local jobs. Tech: Silicon Valley technology can address many of these water supply issues, by using its ability to innovate, not by promoting an improvident WaterFix project.
Attachment 1 Page 14 of 20
Page 84
5
Dams are a questionable proposition: • dams and their reservoirs leak or lose billions of gallons of water to evaporation: https://projects.propublica.org/killing-the-colorado/story/arizona-cotton-drought-crisis
• a 2016 algae bloom in San Luis Reservoir became severe, resulting in an advisory level upgraded to “warning” from “caution” http://www.fresnobee.com/news/local/article110480652.html
Conclusion: The proposed WaterFix has too many unknowns and uncertainties; it is not the water solution for Santa County residents and ratepayers. Other, better solutions should be aggressively pursued. WaterFix unknowns and problem issues, for example, include:
• the accusation that taxpayer money was “wrongly used” to plan California water tunnel project according to an Inspector General report (federal), issue covered by the LA Times http://www.latimes.com/local/california/la-me-water-tunnel-funds-20170908-story.html (some $50-80 million, depending on media reporting). Transparency and accountability have been lacking in this process
• whether WaterFix will be legally considered part of the SWP—an issue to be decided in “validation action” in Sacramento Court; • if WF is not found to be part of SWP, then there is questionable ability under Water Code to authorize bonds to construct, etc. • who will control project if “validation action” fails and DWR is not “owner”
-proposal that Joint Finance JPA, or “designee”, could assume ownership, with question of who would control then (“ongoing negotiations, discussions” are being held, in private) -“In the scenario that DWR does not have the authority, SWP contractors that are members of the Finance JPA would have to ‘step up’ to pay the debt service for the outstanding Finance JPA Bonds.” (from previous SCVWD Bd. Agenda Memo, Item 2.1, § F.1)
• whether State Water Board will allow the change in point of diversion to the proposed northern intakes (if not, the project will not go forward); the continued hearings on that are scheduled to begin in Jan. 2018 • WaterFix project projected capital costs $16.7 billion, that may ultimately cost up to $60 billion or more, including debt financing • an ultimate high cost to SCVWD ratepayers (risk volatility is inherent in project) • ultimate water allocation amount
-can depend on % from SWP, CVP, etc., regulatory actions, SLR, climate change -SCVWD looks to approximately 28,000 to 44,300 afy gain from WaterFix
• opt-in/opt-out “choices”: opt-in for CVP participation in WF; opt-out of SWP participation in WF • will ratepayers of Santa Clara County still have to pay for WaterFix even if SCVWD opts out of participation in SWP part of WaterFix; will SCVWD opt in to participation under CVP?
Attachment 1 Page 15 of 20
Page 85

1
October 13, 2017 TO: Honorable Members of the Santa Clara Valley Water District Board FROM: Alan and Meg Giberson
RE: October 17, 2017, SCVWD WaterFix meeting California WaterFix (CWF or WF) is a fantasy project. The years-long process of “study” has left a “project” that seems no more real than it did 10 years ago because so much about it is unknown. Only 5% to 10% of the project has been designed so far; 90% to 95% of its design has yet to be determined. With its legal status as part of the SWP uncertain, with construction costs unknowable because of WaterFix’s incomplete design stage, with as-yet-undeterminable borrowing costs (being dependent in part on whether a JPA or government/state actor will be the borrower), and with uncertain amounts of yield and cost per acre-foot of any WaterFix water, nothing about WaterFix can be relied on. Currently available information demonstrates that WaterFix is a quagmire not a solution. California residents are being asked to trust, but there is insufficient data with which to verify. Need for this project cannot be demonstrated because local projects and local water sources will yield more reliable water at an equal or lesser cost. COST will soar; COST OVERRUNS to be expected
CWF costs will rise above what has been promoted; accurate costs of construction and/or resulting cost per acre foot of water have not been—and cannot be— assured. CWF water costs presented to SCVWD board have been low-balled at $600 per acre-foot (per SCVWD projects’ cost analysis, 9/19/17, Item 2.1-E, Handout, Attachment 4, revised page 13 of 42). However:
• staff has also labeled WaterFix cost as the riskiest, in a Weighted Cost Risk analysis of thirteen projects (Fig. 3, Attachment 3, SCVWD Item # 2.1, 9/19/17); • costs will reach $888 to $1427 per acre-foot (in 2033 dollars) according to Kern documents (“Kern document” at https://wrmwsd.com/wp-content/uploads/2017/08/KCWA-CWF-Overview-Public-Version-Complete-9.15.17.pdf, page 72 ).
Cost overruns have plagued projects in this state and elsewhere. The Bay Bridge and high-speed rail are but two California examples.
The Legislative Analyst’s Office also reported in 2009 an “upward expenditure cycle [of the SWP] … due in part to the lack of effective budgetary oversight of the (State Water Project).” The LAO has recommended making the State Water Project’s entire budget part of the state budgeting process. Such a process might help CWF’s soaring bottom line, but such oversight seems extremely unlikely in view of DWR /CWF activities to date.
Attachment 1 Page 16 of 20
Page 86
2
Kern Water Agency’s consultant 5RMK, while noting that CWF design was only “5 to 10 percent complete”, was told to base its estimate on a “design definition” requiring a 10 to 30 percent complete” project. (Kern County Water Agency’s Analysis of California WaterFix Impacts—“Kern analysis”—page 27.) With just this minimal information, 5RMK signaled possible WF capital cost increases that could be more than one and one-half times 5RMK’s lowest estimate. (Kern Analysis, page 76.) FAULTY PROJECT DESIGN, reliability jeopardized:
Given the preliminary status of WaterFix design, all cost estimates are guesswork, based on missing and/or inadequate data. Comparisons and estimates cannot be considered reliable, and border on speculation because of so many unknowns.
The ≈35% construction contingency figure reported for WaterFix by both SCVWD1 and Kern County Water Agency would be drastically low for a large tunneling project such as this, given the “iron law of megaprojects”: “over time, over budget, over and over again.” Considering the 5% to 10% design stage2 of WaterFix and the identified weakness of the construction method using concrete segments that are subject to leakage at segment joints, costs will soar with likely tunnel failure; water reliability will be jeopardized.
Initial DWR design documents indicate large segmented concrete tunnels are planned, but without the inner lining that had been considered earlier. (See: Informational comments submitted by Des Jardins for the 10/10/2017 SCVWD meeting, quoting DWR 2010a, p.9.) This cheaper design nearly guarantees leakage from sources such as: 1) seismic activity, 2) subsidence of the soft soils surrounding proposed tunnel placement, 3) long-term degradation of segmental concrete lining, resulting in 4) increased forces pulling the tunnels apart. Consequences will be increased cost to 1) redesign and construct tunnels, or 2) repair, if built as preliminarily designed.
The Des Jardins 10/10/2017 submission cited EMBUD’s 2015 comments on the tunnel
design: Long-term degradation of segmental concrete lining may result in failure of the lining. In the event that the tunnel lining fails and results in a tunnel collapse or blowout, a collapse during operations would result in major ground movement extending to the ground surface and potentially sinkholes or blowout.
1 SCVWD Sep 12, 2017 Board memo, Section D (“Total WaterFix costs”), Table 1 (Calif. WaterFix Cost Summary) cited “Contingency (36%)” under capital costs (and directly following “construction” costs 2 Design is at only 5% to 10% stage (“the design definition for California WaterFix currently is between 5 to 10 percent complete”, according to https://wrmwsd.com/wp-content/uploads/2017/08/KCWA-CWF-Overview-Public-Version-Complete-9.15.17.pdf
Attachment 1 Page 17 of 20
Page 87

3
STATE AUDITOR’S REPORT critical of WATERFIX:
The State Auditor’s Report is critical of WaterFix; it should be heeded as a warning not to proceed with the project. DWR’s lack of transparency is not new, and bodes ill for any WaterFix future. The State Auditor’s report re WaterFix (October 2017, Report 2016-132) indicates ongoing lax management on the part of DWR, which was responsible for: • no demonstration of financial viability, incomplete financial analysis, yet “[t]he financial analysis is critical in determining whether water contractors are willing and able to pay for the construction of WaterFix” (State Auditor’s Report, pages 34- 35);
• unqualified consulting firm hired, with multi-million dollar CWF contract, but no competitive bid process; • amended contracts for BDCP consultant costs resulting in cost increases of nearly five times the original amount, with funding or spending “not fully track[ed]” (State Auditor’s Report, page 17); • no finished economic analysis; • $50 million allegedly misused to pay planning costs; • planning alone 200%-500% over budget. With DWR making the critical and final decisions re WaterFix management, WaterFix is a bad choice for Santa Clara Valley ratepayers.
DESIGN AND COST CONSIDERATIONS: Design and cost considerations coalesce in ballooning costs if WaterFix is allowed to proceed. California already faces a staggering cost of infrastructure maintenance, leak detection and repair. Dams in California, for instance, need expensive upgrades/repairs.
• The same people (DWR) who brought us Oroville—with repair costs rising potentially to $1 billion— have suggested a CWF design that proposes tunnel construction involving demonstrably problematic construction techniques. SWP contractors, such as SCVWD (and ratepayers), may be on the hook for expenses such as the Oroville repair, according to a statement by Gov. Brown’s Department of Finance in February this year. • Of the dams owned by SCVWD, the California Division of Safety of Dams September 2017 report listed four as only “fair”, with significant downstream hazards due to extremely high potential for loss of life/infrastructure in the event of dam failure. SCVWD ratepayers will be on the hook for such catastrophic events. • https://www.eenews.net/stories/1060053463: “The 240-foot Anderson Dam near Morgan Hill … impounds a 90,000-acre-foot reservoir that is threatened by an earthquake on the same fault. If it fails, a deluge would reach the pricey real estate in Morgan Hill in less than 15 minutes. Downtown San Jose would be under 8 feet of water in three hours. The dam's owner, the Santa Clara Valley Water District, has sought to avoid surprises…. But that hasn't kept its price tag from ballooning. The project cost jumped from $200 million to $400 million when new geologic studies concluded the upstream slope of the dam could collapse in an earthquake.”
Attachment 1 Page 18 of 20
Page 88
4
BETTER CHOICE: RELIABLE, DROUGHT-PROOF, CLIMATE-RESILIENT, LOCAL WATER SOURCES The Pacific Institute notes that urban water conservation and efficiency measures are less expensive than most new water supply options and are thus the most cost-effective ways to meet current and future water needs. Indeed, many residential and non-residential measures have a “negative cost,” which means that they save the customer more money over their lifetime than they cost to implement. Stormwater capture projects can cost less, and use local water.
• A median cost of $590 per af for large stormwater capture projects is projected by a Pacific Institute study/report. (The Cost of Alternative Water Supply and Efficiency Options in California, Pacific Institute, October 2016) • UCSC’s Dr. Andy Fisher is currently working on distributed stormwater recharge projects in Pajaro Valley (“Pajaro”), which has a similar precipitation pattern to Silicon Valley’s. Pajaro receives no imported water; it is dependent on groundwater, which—at over 1 mafy—represents 83-85% of Pajaro’s demand. See: https://mavensnotebook.com/2017/09/20/dr-andy-fisher-enhancing-groundwater-recharge-with-stormwater/. The recharge initiative has four components: mapping, modeling, field project, monetizing incentives for stakeholders. Similar projects could help recharge Santa Clara Valley’s aquifers. • Work by Dr. Richard Luthy, Stanford, also demonstrates enormous potential for stormwater capture. See: https://mavensnotebook.com/2016/08/18/stormwater-capture-treatment-and-recharge-for-urban-water-supply/ Dr. Luthy projects the possibility that LA could boost its aggressive plan for stormwater capture (of 258,000 afy by 2099) up to 300,000 afy stormwater. • Considerable tech expertise is available in Silicon Valley to address these, and similar, water source issues.
Alternate sources: The averaged cost of $400 per acre-foot of the nine projects listed in SCVWD 9/19/017 Water Supply Master Plan Update demonstrates potential for sourcing water from other than megaprojects such as WaterFix. (“Project and Programs Currently Being Considered for Inclusion in the 2017 Water Supply Master Plan”, Attachment 1, page 1 of 9).
• Landscape conversion can save up to 2,000,000 acre-feet per year in California, and is one of the lowest cost water supplies (The Cost of Alternative Water Supply and Efficiency Options in California, Pacific Institute, October 2016, page 17, Table 5, “Residential Water Efficiency Measures”) • Recycled water - Recycled water has received approvals from numerous groups: Cal. Med. Assoc. (2012 Resolution 119-12); Santa Clara County voters (SCVWD/EMC April 2017 Survey); Bay Area Council 2015 (88 percent of those surveyed favored expanding recycled water programs); NRC/National Academies: Reuse of Municipal Wastewater has Significant Potential to Augment Future U.S. Drinking Water Supplies (“Moreover, new analyses suggest that the possible health risks of exposure to chemical contaminants and disease-causing microbes from wastewater reuse do not exceed, and in some cases may
Attachment 1 Page 19 of 20
Page 89
https://mavensnotebook.com/2017/09/20/dr-andy-fisher-enhancing-groundwater-recharge-with-stormwater/
5
be significantly lower than, the risks of existing water supplies.”) (press release) Also see: http://www8.nationalacademies.org/onpinews/newsitem.aspx?recordid=13303. - Various areas and agencies safely process and use large amounts of recycled water: • OCWD 103,000 afy (project uses half the energy it would take to pump imported water; cost $525/af with subsidies, $850/af without subsidies); • Singapore 192,640 afy;
• LA County Sanitation Districts plan up to 168,000 afy. LADWP reported in May 2010 that its water recycling/replenishment will use "about 50% less energy than it takes to import water from Northern California and the Colorado River and it will lessen the strain on California's Bay Delta.”
• Del Puerto district (Stanislaus County) will receive 30,600 acre-feet of highly-treated wastewater (recycled water) from Modesto (from a $100 million project) that will supply one-third of the needs for Del Puerto farmers and give them a stable water source; ultimately 59,000 afy is anticipated. http://www.modbee.com/news/state/california/water-and-drought/article30198939.html#storylink=cpy
HIGH RISK: WaterFix was listed as the riskiest project in SCVWD staff’s rating of 13 potential water supply projects. Members of the SCVWD board have also repeatedly mentioned being risk-averse; that risk aversion was again cited at the 10/10/2017 SCVWD board meeting. SCVWD and DWR documents have repeatedly reported that the WaterFix design is subject to change. (SCVWD staff reports, along with the Kern consultant 5RMK have identified the same 35% construction contingency.) WaterFix doesn’t merit taking that risk. BORROWING COSTS: If WaterFix is not legally considered part of the SWP (pursuant to a Validation Action in a Sacramento court) issuance of bonds may not be possible as a state action. Financing would then need to be provided through a JPA, which might have to pay higher interest rates than state-backed bonds receive. (And DWR has already had to increase its short-term—and thus more costly— borrowing capacity to pay for Oroville spillway repair work.) CONCLUSION: A long, 15-year, delay in WaterFix water availability is projected (assuming all goes perfectly for the project, unlikely in view of the problematic design and multiple lawsuits challenging it). Local projects can be built faster and may be less costly, with local control and more reliable water as a result. History does not favor large infrastructure such as WaterFix; water transfer projects haven’t been the solutions they were supposed to be. WaterFix is not the fix Santa Clara Valley needs.
Our five-page memo submitted for the September 19, 2017, SCVWD 2017 Water Supply Master Plan board hearing is hereby referenced and included in this memo, as if fully set forth herein.
Attachment 1 Page 20 of 20
Page 90
Page 1 of 1
Committee: Water Conservation and Demand Management
Meeting Date: 04/30/18
Agenda Item No.: 4.3
Unclassified Manager: Garth Hall
Email: [email protected]
Est. Staff Time: 10 minutes
COMMITTEE AGENDA MEMO
SUBJECT: Water Supply Master Plan “No Regrets” Programs RECOMMENDED ACTION: 1. Receive information on the status of planning for implementation of the Water Supply Master Plan’s “No Regrets” package 2. Provide comment to the Board on the implementation of the Advanced Metering Infrastructure program SUMMARY: This Implementation Plan for the No Regrets package describes the work to be accomplished and clarifies roles and responsibilities for implementing, measuring, monitoring, and directing the projects and programs (Attachment 1). BACKGROUND: The “No Regrets” package of projects and programs is broadly supported by stakeholders, relatively low cost, and can be implemented independently of other projects and programs that might be included in the Water Supply Master Plan. These projects and programs include:
1) Advanced Metering Infrastructure 2) Leak Repair Incentives 3) Graywater Rebate Program Expansion 4) Model Water Efficiency New Development Ordinance 5) Stormwater Capture.
The total present value lifecycle cost of the projects is estimated to be up to $100 million and staff estimates the projects will provide approximately 11,000 acre-feet per year (AFY) of water supply benefits (Attachment 2). Most of the water supply benefit (10,000 AFY) is associated with water conservation savings and approximately 1,000 AFY of benefit is associated with the stormwater projects. The Board approved beginning planning for implementing the No Regrets package at their September 19, 2017 meeting. ATTACHMENT(S): Attachment 1: Water Supply Master Plan’s No Regrets Package Implementation Plan Attachment 2: Project Water Savings and Costs
Page 91

This Page Intentionally Left Blank Page 92
Attachment 1 Page 1 of 7
Implementation Plan for the Water Supply Master Plan’s No Regrets Package 1) ADVANCED METERING INFRASTRUCTURE (AMI) Background Advanced Metering Infrastructure (AMI) is an integrated system of smart meters, communication networks, and data management systems that enables two-way communication between utilities and customers. In the water sector, AMI can help detect leaks, increase customer awareness of water use, and improve communication between retailers and their customers. The District has awarded Safe, Clean Water and Natural Flood Protection (Safe, Clean Water) grant funding to three retailers to conduct AMI pilot tests – City of Mountain View, San Jose Water Company, and Purissima Hills Water District – to gain a better understanding of the potential water savings and implementation complexities. Several of these AMI pilot projects are scheduled for completion by June 2018. The results of these pilot projects will inform the development of the future program. Additionally, the District held a one-day workshop focusing on AMI in July 2017 that was attended by water suppliers from across the Bay Area. Next Steps After the District receives the results from the AMI pilot projects it funded, a more detailed plan will be put together for accelerating conversion of the approximately 115,000 accounts remaining in the county to AMI. Please note that nearly 28,000 accounts have already been converted and the investor-owned utilities (i.e. Great Oaks Water, California Water and San Jose Water Company) will not look for cost-sharing funds for this equipment (approximately 275,000 accounts). It is anticipated that any AMI cost sharing project will be required to have real-time leak notification. Anticipated Costs and Yield The initial assumption is to provide approximately 50 percent of the hardware cost for AMI, or $75 per meter converted. A total of about $8.6 million is projected. Staff anticipates requesting $1 million in the FY19 water conservation budget to begin cost-sharing with retailers on implementation of AMI. Actual expenditures will depend on the actual budget approved by the Board and the results of the Safe, Clean Water pilot studies. The estimated water savings from this project are about 4,000 acre-feet per year (AFY). Policy question to be answered: What date does the District use to determine cost-sharing eligibility? For instance, would conversations that occurred in FY 17 be eligible for District funding? Or would the funding only be eligible for conversions that occur once the program funding is officially available? Staff recommendation: To be consistent with implementation of other District programs, staff recommends the cost-sharing funding be available to retailers for conversions that occur once the funding availability is announced (FY 19).
Page 93
Attachment 1 Page 2 of 7
2) LEAK REPAIR INCENTIVES Background Staff anticipate implementing a leak repair incentive program after implementing AMI, in coordination with the water retailers. AMI will provide information on the frequency and magnitude of leaks, as well as customer responses to different levels of leaks. This information will inform how best to design a program by better understanding the severity of the issue and potentially the types of leaks that are occurring. Furthermore, AMI will provide data to help evaluate the effectiveness of leak repair incentives. It could be that a leak repair incentive program would be most effective in disadvantaged communities and/or for very slow leaks that consumers may not be sufficiently motivated to repair on their own. Next Steps and Anticipated Costs and Yield Budget and schedule dependent on AMI program results. The estimated water savings from this project are less than 500 AFY. 3) GRAYWATER REBATE PROGRAM EXPANSION Background Staff is in the process of improving the existing Graywater Laundry to Landscape Rebate Program by simplifying the application process, expanding public outreach, and improving educational resources to help guide community members through designing and installing graywater systems. Additional modifications under consideration include:
providing tools and specific equipment to assist the homeowner with the installation;
expanding the program to include graywater systems other than laundry to landscape;
a direct installation program, which could potentially require planting trees and other appropriate landscape to promote sustainable landscaping that’s resilient to a hotter climate and future drought; as well as
an installer-certification program to provide formal training installing and maintaining these relatively novel irrigation systems.
Expansions to the program will be considered based on evaluation of the effectiveness of current efforts, including feedback from previous and potential participants. This could also include working with non-profits to do installations, as well as coordinating with irrigation-equipment suppliers and local plant nurseries to provide harder-to-find graywater equipment. Other types of graywater systems could include gravity-fed systems commonly referred to as “branched drain” systems; systems with pumps, filters, and/or surge tanks; and manufactured systems or whole-house systems that are NSF 350-certified. Whole-house systems may include microfiltration and treatment to facilitate their use in conjunction with conventional subsurface irrigation systems or for certain approved indoor uses (e.g. toilet flushing). Since permits are required for all graywater systems except laundry to landscape systems, a future expansion of this program could emphasize general guidelines and uses for the various graywater systems, while requiring the community member go through the permitting process
Page 94

Attachment 1 Page 3 of 7
with their local enforcement agency in order to be eligible for a rebate—this would help community members choose a system that’s most appropriate for their property and desired uses while following local building code standards. Another program expansion option includes providing a rebate based on the number of fixtures connected to a graywater system, irrespective of the type of graywater system installed, and leaving the onus on the community member to adhere to their local building code standards. Certain types of commercial properties could also benefit from an expanded graywater rebate program. For example, hotels and buildings with gym facilities produce sufficient quantities of graywater from bathroom sinks and showers for cost-effective graywater use on their properties. Air-conditioning unit effluent that meets certain water quality standards has potential to be a source of graywater accepted in a future program expansion as well. Ecology Action has District grant funding to pilot whole house reuse, which includes using rainwater for indoor nonpotable uses (such as toilet flushing and clothes washing). It is possible for a future expansion of the graywater program to include an incentive to use rainwater for clothes washing using a clothes washer that is part of a graywater laundry to landscape system. In other words, rainwater is the nonpotable source of water for the clothes washer, and then is used to irrigate the landscape through the graywater laundry to landscape system. Next Steps Staff is expanding public outreach, including promoting existing how-to videos on social media and the District web page and coordinating with local businesses on meeting the unmet market demand by carrying hard-to-find graywater equipment that is required for the current and future graywater rebate program. Staff is also researching a direct installation pilot program. Meeting and coordinating with appropriate stakeholders will be essential to a future expanded graywater program that’s successful and accessible to the community.
It will be essential to work with local enforcement bodies (e.g. County Department of Environmental Health, the district’s Groundwater Unit, local building and planning departments, and cross-connection specialists from the various water providers) to ensure a future program has cost-effective participation numbers and does not become a burden on community members who would need to follow permitting and cross-connection protection procedures before and after installing such systems.
Leverage the options prescribed within the Model Water Efficient Landscape Ordinance to promote graywater.
Effective stakeholder outreach will help the district develop relevant and accurate educational materials to guide community members through the process of scoping and installing a graywater system. Additional benefits and common ground may be found as well. The County of Santa Barbara allows branched drain graywater systems (shower and bathroom sinks in a gravity-fed system) to be installed without a permit. A similar move in Santa Clara County would help promote the wider adoption of simple graywater systems that tend to be much more cost-effective than whole-house graywater systems, for instance.
Graywater systems, other than laundry to landscape, require permits and potentially require cross-connection protections that may necessitate annual inspections by the water provider.
Page 95

Attachment 1 Page 4 of 7
Anticipated Costs and Yield Costs born by the customer for acquiring permits as well as ongoing cross-connection protections may need to be addressed and clarified to help ensure a future expanded rebate program is successful. Approximately 6 to 12 months of planning would be needed to hold important stakeholder focus groups and to begin developing the educational resources needed to help constituents correctly install graywater systems. Stakeholder focus groups should involve permit and planning officials, cross-connection specialists, and the County’s Department of Environmental Health at a minimum. Outreach to landscape and plumbing professionals should be launched prior to program launch, which could take the form of installer-certification courses. A one- to two-week installer-certification course may cost between $13,000 and $17,000, or less if customers are charged to attend. Educational materials to develop prior to program launch include information on appropriate pumps, filters, proper design for systems without pumps or filters, and when backflow-prevention devices would be required. From scoping, stakeholder engagement, and material development, this may also take approximately 6 to 9 months to complete. To accelerate the program timeline, a direct-installation program of laundry to landscape and simple, gravity-fed graywater systems could be considered as it combines installer training with implementing the program. In a 2016 estimate, this would cost approximately $50,000 to install 25 systems ($1,900 per system to design and install along with 1-year of maintenance plus administration costs). After completing outreach and developing educational materials, approximately 3 to 6 months would be needed to finalize the program design and implementation strategy. Depending on the type of system and the fixtures it diverts from, graywater systems may cost as low as a few hundred dollars to more than $15,000, excluding permitting and backflow protection costs. To help customers understand permitting requirements, a future rebate could mirror the system types outlined in the California Plumbing Code: a rebate 50% of equipment cost for any system up to $1,000 for simple systems (<250 gallons per day) or up to $2,000 for complex systems (>250 gallons per day). With an initial rebate budget of $40,000, 30 simple systems and 5 complex systems could be incentivized in the program’s first year. The existing laundry to landscape graywater system would continue as is, with cost-sharing agreement opportunities with our water retailer and municipal partners. An additional element of the planning process and costs should consider how to incentivize simple graywater systems that do not have pumps, filters, or storage tanks as graywater systems without those elements have lower ongoing maintenance costs and have greater likelihood of their long-term viability in the community. The estimated water savings from this project are less than 500 AFY.
Page 96

Attachment 1 Page 5 of 7
4) MODEL WATER EFFICIENCY NEW DEVELOPMENT ORDINANCE Background The Model Water Efficiency New Development Ordinance is being developed by the Santa Clara County Model Water Efficiency New Development Ordinance Task Force. The ordinance has the following requirements on new development:
Require hot water recirculation for single-family development,
Pre-plumb all new single-family development for graywater collection, treatment, and redistribution,
Pre-plumb all new multi-family and non-residential development for alternative water sources,
Mandate recycled water connections for common areas in HOA developments, and
Outlaw the sale of non-compliant fixtures. The Model Ordinance has been drafted and is being shared with key groups. The District is currently in the process of hiring a consultant to finalize the Model Ordinance, develop an analysis as to “why” it’s needed (including benefit/costs), and to prepare the Model Ordinance for filing with the Building Standards Commission review. Next Steps Staff will incorporate stakeholder input and then work with all the Santa Clara County jurisdictions on adoption. The District’s role will be to encourage ordinance adoption and implementation, and provide technical assistance. Anticipated Costs and Yield The cost of finalizing and encouraging implementation of the ordinance will be approximately $40,000 (includes $25,000 for consultant). Ongoing costs to support implementation and provide technical support are estimated at $100,000 per year (District staff time). The estimated water savings from this project are about 5,000 AFY, assuming implementation at ten major developments. 5) STORMWATER CAPTURE Background Stormwater capture can provide multiple benefits, including water quality, water supply, flood management, environmental, and community (e.g., aesthetics, recreation, and education). The “No Regrets” package includes two different scales of stormwater capture projects – “centralized” and “decentralized.” “Centralized” projects are those that capture water from multiple parcels and/or municipal projects, including “green streets” projects. The “No Regrets Package includes three centralized stormwater projects – Stormwater-San Jose, Stormwater-Saratoga, and Ag Land Recharge. “Decentralized” projects focus primarily of keeping stormwater onsite and/or private projects. The “No Regrets” package includes two decentralized programs –rain barrel/cistern rebates and rain garden rebates.
Page 97
Attachment 1 Page 6 of 7
Staff in the Water Utility Enterprise and Watersheds are participating in development of the Santa Clara Basin Storm Water Resources Plan (SWRP), which will evaluate and prioritize centralized stormwater projects in northern Santa Clara County and support green infrastructure requirements in the municipalities’ stormwater permits. Through this plan, the Upper Penitencia area has been identified as an area for possible conceptual design for stormwater detention basins. The SWRP is scheduled for completion in December 2018. Staff from both organizational areas are also participating in development of the City of San Jose’s Storm Sewer Master Plan, which is also prioritizing centralized stormwater projects and scheduled for completion in 2018. Likewise, staff are talking with the City of Morgan Hill and other agencies about potential centralized stormwater projects. Another approach to centralized stormwater capture in Santa Clara County is to use agricultural lands as temporary recharge sites during the winter months. An example of this process is in the Central Valley where some almond growers allow their fields to flood during the winter to recharge the aquifer. The planned flooding for groundwater recharge is referred to as managed aquifer recharge (MAR). Another option for MAR on agricultural lands could be to capture hillslope surface runoff on agricultural fields adjacent to the hillslopes by grading the fields or building berms. Capturing hillslope runoff may reduce flood flows to creeks and runoff reaching roads while increasing aquifer recharge. Decentralized stormwater projects, especially at the residential parcel level, are typically not cost-effective when comparing to other water supply alternatives in terms of direct water savings. However, there are additional benefits associated with stormwater projects (water quality, flood management, etc.) as described above. The benefit most cited by Board members is the educational component of rain barrels. People have a lot of interest in rain barrels. Providing a rebate for them will expose people to other rebate programs, including the landscape rebate program. Furthermore, using rain barrels for irrigation requires more effort than simply turning on a tap or irrigation controller. Therefore, people should gain a better understanding of the value of water and the importance of managing every drop. Next Steps Staff will continue participation in development of the SWRP and City of San Jose Storm Sewer Master Plan. Once those plans are complete, staff will review the schedule and budget for the higher priority projects and, as appropriate, work with municipalities on implementing projects that will provide similar water supply benefits to the Stormwater-San Jose and Stormwater-Saratoga projects in the No Regrets package. At that time, more detailed cost and schedule estimates will be developed. The Open Space Authority has a state grant to develop a program that prioritizes agricultural lands for preservation and they are considering integrating MAR potential into their program. Agricultural land preservation is consistent with their mission. The City of Morgan Hill is also considering agricultural land preservation projects. The District will continue conversations with these agencies in order to identify potential agricultural lands that would be suitable for MAR as an additional monetary incentive to farmers to preserve their agricultural fields. In addition to working to identify centralized stormwater projects for implementation, staff are proposing to begin incorporating “decentralized” stormwater programs into the Water Conservation Program beginning in FY 19. “Decentralized” stormwater programs are those keep water on an individual parcel and include rain barrels, cisterns, and rain gardens. These programs are expected to be appended to the existing Landscape Rebate Program.
Page 98
Attachment 1 Page 7 of 7
Costs The estimated capital costs for centralized stormwater projects in the “No Regrets” package range from about $2 million (Stormwater Saratoga and Stormwater San Jose) to $15 million (Ag Land Recharge), with the higher cost associated with assumed land easement costs. No land acquisition costs are assumed for the San Jose and Saratoga stormwater projects, as staff is assuming they would occur on public lands in partnership with other agencies. The capital costs are associated with constructing basins for recharging stormwater. Operations, maintenance, and rehabilitation costs range from about $30,000 per year for ag land recharge to about $70,000 per year for the San Jose and Saratoga stormwater projects. There is a placeholder in the rate forecast for a capital centralized stormwater project of about $20 million, beginning in FY 2020. The combined yield of the projects is about 1,500 AFY. The estimated costs for the decentralized stormwater projects presented to the Board in September 2017 were $2.8 million per year. This number will be refined as the programs are developed. The original costs were based on the following assumptions.
Rain barrels: ramp up program to 3,000 participants per year. The rebates for rain barrels would be $25, as a typical rain barrel costs $60-$100. With the assumption of 3,000 participants per year the cost equals $75,000 ($25*3000). The estimated average annual water savings from this program are about 7 AFY. Cisterns: ramp up program to 500 participants per year. These could be any type of cistern, including rooftop or underground. A commercial cistern program could be promoted more than the rain barrel program as the volume of water captured may be substantially higher. The rebate for cisterns would be $0.50 per gallon of storage for large cisterns, including underground or rooftop cisterns, for a total cost of $2.5 million. The estimated average annual water savings from this program are about 120 AFY. Rain Garden: Rebate cost could be an additional $1 per square foot. For average of 600 sq. ft. per home, and 2,000 participants per year, this would be $1,200,000/year. Water savings per year estimated at about 4,600 gallons/year per household, based on amount of water diverted from rooftop that could be pooled and captured in a rain garden (Los Angeles example, p. 133, NAS, 2015). Assuming ramping up to 2,000 households participate per year, this would be 28 AF/year.
Administrative costs would be low since the program would be administered by the existing Landscape Rebate Program (LRP). The total average annual water savings from the decentralized stormwater projects are about 155 AFY.
Page 99

This Page Intentionally Left Blank Page 100
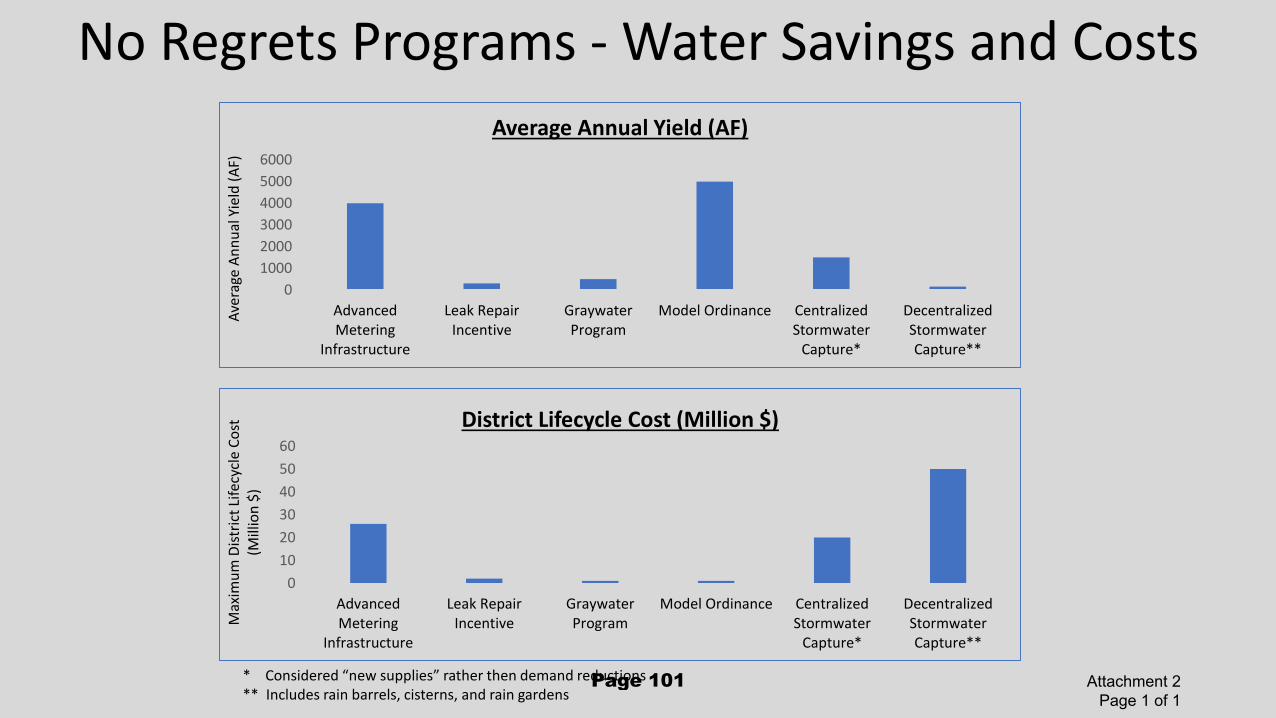
0
1000
2000
3000
4000
5000
6000
AdvancedMetering
Infrastructure
Leak RepairIncentive
GraywaterProgram
Model Ordinance CentralizedStormwater
Capture*
DecentralizedStormwaterCapture**
Ave
rage
An
nu
al Y
ield
(A
F)
Average Annual Yield (AF)
0
10
20
30
40
50
60
AdvancedMetering
Infrastructure
Leak RepairIncentive
GraywaterProgram
Model Ordinance CentralizedStormwater
Capture*
DecentralizedStormwaterCapture**
Max
imu
m D
istr
ict
Life
cycl
e C
ost
(M
illio
n $
)
District Lifecycle Cost (Million $)
No Regrets Programs - Water Savings and Costs
* Considered “new supplies” rather then demand reductions** Includes rain barrels, cisterns, and rain gardens
Attachment 2 Page 1 of 1
Page 101

This Page Intentionally Left BlankPage 102
Page 1 of 5
Committee: Water Conservation and Demand Management
Meeting Date: 04/30/18
Agenda Item No.: 4.4
Unclassified Manager: Garth Hall
Email: [email protected]
Est. Staff Time: 10 minutes
COMMITTEE AGENDA MEMO
SUBJECT: Current Water Conservation Programs and Resources RECOMMENDED ACTION: Provide comment to the Board in the implementation of the District’s mission as it applies to the Current Water Conservation Programs and Resources. SUMMARY: The following is an in-depth look at the programs discussed at the February 2018 Committee meeting: 1) Our City Forest’s Lawn Busters Program Our City Forest (OCF), with funding from the District, is currently administering a turf replacement program. The program provides a low-cost, easy and fast option for low-income, elderly, disabled or veteran homeowners and institutions within Disadvantaged Communities in Santa Clara County. Homeowners/clients are required to pay $100-$500/1,000 square feet (sq. ft.) of turf converted, depending on the package of services selected. This program uses AmeriCorps service members as the bulk of its employees. FUNDS: District committed $340,000 to this program. So far, the District has transferred over $250,000 to OCF. TERM: Program started in September 2015. Current end date is June 30, 2018, or until funds run out, whichever occurs first. GOAL: 170,000 sq. ft. As of December 2017, OCF has converted 146,800 sq. ft, about 86% of goal. We expect them to meet their goal by June 30, 2018. OCF PROPOSAL: Our City Forest has proposed continuing the Lawn Busters Program for another year (July 1, 2018 to June 30, 2019) with a goal of converting an additional 55,000 sq. ft. of lawn. At $2 per square foot, the total for the District for this extension would be $110,000. This program would continue to serve the same targeted community as the current program. 2) Ecology Action’s WaterLink Program Ecology Action, a non-profit organization based in Santa Cruz, currently administers a direct installation program utilizing free and low-cost water- and energy-savings measures. This program serves the disadvantaged communities in Santa Clara County (San Jose, Santa Clara, Morgan Hill, Gilroy).
Page 103
Page 2 of 5
FUNDS: The District is one of the funding partners of the WaterLink Program ($176,875), along with California Department of Water Resources ($2.5M grant), PG&E, and Monrovia (plants). So far, Ecology Action has invoiced the District for about $100,000 of the $176,875 total. We expect to use most of the remaining funding by the end of the program (June 30, 2018). TERM: Mid-March 2016 to June 30, 2018. GOAL: Program includes the following four projects: Project 1 – Residential direct install of showerheads, faucet aerators, clothes washers, water heaters, recirculation pumps. Over 3,000 installations have completed to date. District provides showerheads and aerators, as well as washer rebates. Project 2 – Commercial direct install of pre-rinse sprayers and aerators; commercial clothes washer rebate for apartments and Laundromats, and commercial dishwashers. The District provides aerators and pre-rinse sprayers for this project. Project 3 – Public facilities turf replacement. The target is 50,000 square feet (sq. ft.) of turf replaced. To date, over 27,000 sq. ft of turf has been replaced. The District provides funding at $2/sq. ft. Project 4 – Hotels and skilled nursing – ozone laundry installation. The target is 30 ozone systems at 15 facilities. No installations have occurred yet, however expecting some this spring. The District provides rebates at $4 per hundred cubic feet of water saved. ECOLOGY ACTION PROPOSAL: There is a proposal by Ecology Action to continue to partner on several programs that would target low-income and other underserved communities. One of the benefits of continuing to work with Ecology Action is in leveraging the contacts they’ve built through WaterLink to help ensure the success of the program. The programs currently under consideration include: Project 1 – Direct Installation of graywater systems for low-income participants. This project would also include training graywater system installers. Project 2 – Direct Installation of Rain Barrels for low-income participants. This project may also work in tandem with the graywater system project. Project 3 – Direct Installation of Weather-Based Irrigation Controllers. Again, this project will target low-income participants who currently have an older non-efficient irrigation controller and replace it with an efficient weather-based irrigation controller, programmed for the optimal watering schedule for their landscape. 3) Landscape Rebate Program The Landscape Rebate Program (LRP) spiked in terms of participation as well as staffing support and budget in FY 15 and FY 16, during the peak of the drought. However, since the heavy rains we received in 2017, the program has seen a dramatic decline in participation, most noticeably in turf conversion participation.
Page 104
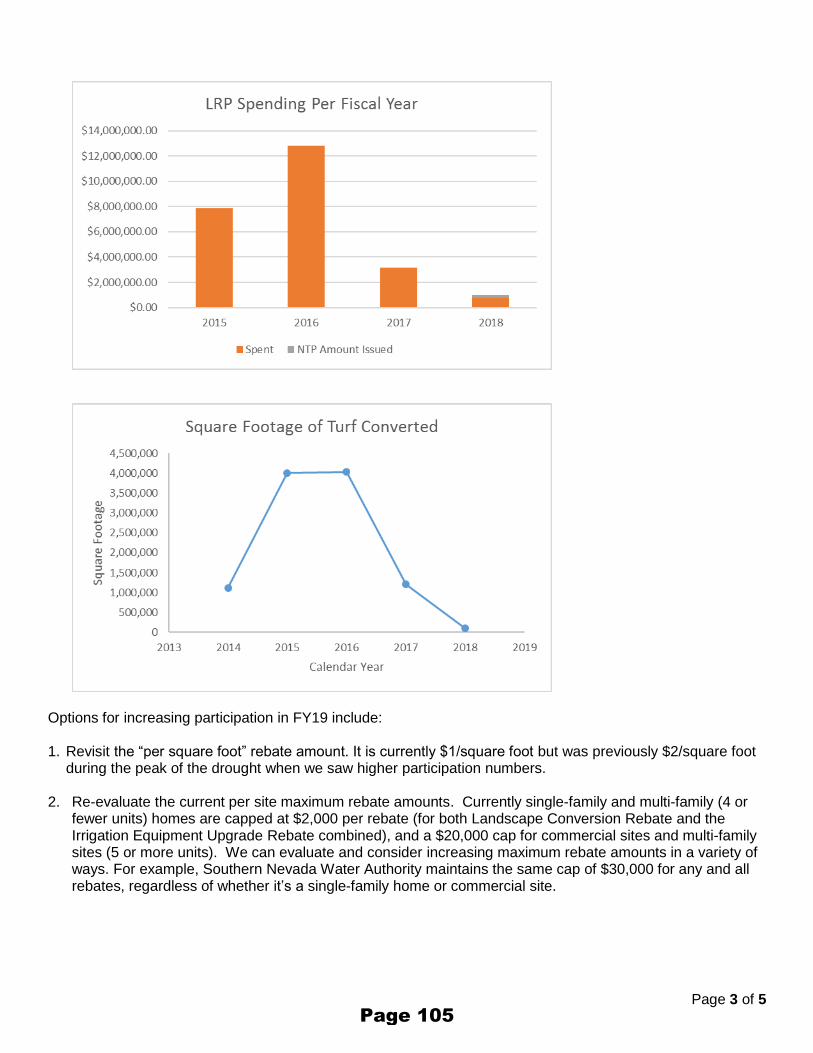
Page 3 of 5
Options for increasing participation in FY19 include: 1. Revisit the “per square foot” rebate amount. It is currently $1/square foot but was previously $2/square foot
during the peak of the drought when we saw higher participation numbers.
2. Re-evaluate the current per site maximum rebate amounts. Currently single-family and multi-family (4 or fewer units) homes are capped at $2,000 per rebate (for both Landscape Conversion Rebate and the Irrigation Equipment Upgrade Rebate combined), and a $20,000 cap for commercial sites and multi-family sites (5 or more units). We can evaluate and consider increasing maximum rebate amounts in a variety of ways. For example, Southern Nevada Water Authority maintains the same cap of $30,000 for any and all rebates, regardless of whether it’s a single-family home or commercial site.
Page 105
Page 4 of 5
3. Investigate a tiered rebate amount based on establishing a conservation easement in perpetuity. Southern Nevada Water Authority is an example of an agency that has a similar system in place. This option is likely to be more staff intensive, and more complex overall as it would involve multiple departments (Legal, Community Projects, Water Utility, County records, etc.). It could be structured so that the District offers a higher rebate (e.g. $2 sq/ft) for homeowners willing to sign an easement or agreement of sorts to keep the converted land as low-water use in perpetuity. One potential drawback is it may turn people away from applying for the rebate program that normally would if they perceive it as another hurdle or that it may potentially impact their resale value. In speaking with our community projects staff, it would require legal overview, as well as county records, and may be cost prohibitive. It would also require complicated changes to the District’s internal rebate processing system.
4) Media Campaign The Office of Communications and the Water Supply Planning and Conservation Unit are working together to strategize for the District’s annual water conservation campaign. Staff is currently identifying campaign objectives and goals for this campaign. A local media company, PRx Digital, is working with the District to identify campaign strategy and messaging.
Initial outreach strategy includes print, digital and radio advertising (in English, Spanish, Vietnamese and Chinese), as well as working with local water retailers to create water bill inserts. The goals of this campaign will be to encourage continued water conservation, encourage residents to keep up the good work, and highlight and promote the District’s water conservation programs.
In addition to the media marketing campaign, Communication and Conservation staff are analyzing the possibility of a community-based social marketing campaign to complement our traditional, paid, mass media advertising campaign. Community-based social marketing is a methodology that focuses on individual behaviors and develops techniques to target sustainable behavior change.
Staff is also reaching out to Chambers of Commerce to identify opportunities to increase participation in the district’s commercial and business conservation rebates such as the Water Efficient Technologies Rebate Program. Staff has recommended submissions to chambers’ newsletters and if possible a brief presentation at monthly meetings.
Additionally, staff has been working with the Landscape Committee to review educational material the District distributes relating to landscaping and outdoor water conservation. The objective is to identify gaps and any areas for improvement, and the Committee plans on making recommendations this spring.
Staff has also worked with the Landscape Committee on education material relating to the District’s onsite demonstration garden. Phase One of this project included replacing existing plant signs; creating a flyer for visitors to use; and creating a webpage with information about the District’s landscape, including the downloadable flyer. For Phase Two, which includes improving signage and possibly creating a formal demonstration garden, a subcommittee of the Landscape Committee was formed, which includes staff from the City of San Jose and Morgan Hill, as well as other representatives.
Page 106
Page 5 of 5
BACKGROUND: To meet the District’s goal of saving nearly 100,000 acre-feet per year by 2030, the District and its retailers partner to implement nearly 20 different ongoing water conservation programs that use a mix of incentives and rebates, free device installation, one-on-one home visits, site surveys, and educational outreach to reduce water consumption in homes, businesses and agriculture. Programs include replacing high-water using landscaping with low-water using landscape, installing efficient irrigation equipment, and offering incentives for graywater laundry-to-landscape systems. The District also implements an annual water conservation campaign that typically includes an online component, social media, and traditional media ads. Each year the District revues its current mix of programs/efforts to see if any efficiencies could be implemented, new programs/technologies added, and/or changes to rebate amounts are needed to increase participation to meet our water savings goals. ATTACHMENT(S): None.
Page 107

This Page Intentionally Left Blank Page 108

Page 1 of 1
Committee: Water Conservation and Demand Management
Meeting Date: 04/30/18
Agenda Item No.: 4.5
Unclassified Manager: Michele King
Email: [email protected]
Est. Staff Time: 5 minutes
COMMITTEE AGENDA MEMO
SUBJECT: Review of Water Conservation and Demand Management Committee Work Plan, any Outcomes of Board Action or Committee Requests and the Committee’s Next Meeting Agenda RECOMMENDED ACTION: Review the Committee work plan and Planning Calendar to guide the Committee’s discussions regarding policy alternatives and implications for Board deliberation. SUMMARY:
The attached Work Plan and Planning Calendar outlines the topics for discussion to be able to prepare policy alternatives and implications for Board deliberation. The work plan and planning calendar are agendized at each meeting as accomplishments are updated and to review additional work plan assignments by the Board. BACKGROUND: Governance Process Policy-8: The District Act provides for the creation of advisory boards, committees, or commissions by resolution to serve at the pleasure of the Board. The Board Ad Hoc Committee is comprised of less than a quorum of the Board and/or external members having a limited term, to accomplish a specific task, is established in accordance with the Board Ad Hoc Committee procedure (Procedure No. W723S01), and will be used sparingly. Annually, the purpose of an established Ad Hoc Committee will be reviewed to determine its relevance.
In keeping with the Board’s broader focus, Board Committees will not direct the implementation of District programs and projects, other than to receive information and provide advice and comment.
ATTACHMENT(S): Attachment 1: Water Conservation and Demand Management Committee 2018 Work Plan Attachment 2: Water Conservation and Demand Management Committee June 2018 Draft Agenda
Page 109

This Page Intentionally Left Blank Page 110

2018 Work Plan: Water Conservation and Demand Update: March 2018 Management Committee
Yellow = Update Since Last Meeting Attachment 1
Blue = Action taken by the Board of Directors Page 1 of 3
The annual work plan establishes a framework for committee discussion and action during the annual meeting schedule. The committee work plan is a dynamic document, subject to change as external and internal issues impacting the District occur and are recommended for committee discussion. Subsequently, an annual committee accomplishments report is developed based on the work plan and presented to the District Board of Directors.
ITEM
WORK PLAN ITEM
MEETING
ACTION/DISCUSSION OR INFORMATION ONLY
ACCOMPLISHMENT DATE AND OUTCOME
1
Election of Chair and Vice Chair for 2018
2-28-18
Discussion/Action Item
Accomplished 02/28/18: The Committee voted to retain Director Richard P. Santos as Chair and Director Linda J. LeZotte as Vice Chair’ for 2018.
2
Water Conservation and Demand Management Committee 2017 Accomplishments Report
2-28-18
Discussion
Accomplished 02/28/18: The Committee reviewed the 2017 work plan accomplishments and took no action.
3
Develop Water Conservation and Demand Management Committee’s 2018 Work Plan, in consideration of the following potential topics:
Current water conservation programs and resources
Water Supply Master Plan “No Regrets” programs
Shallow groundwater
Fixed/variable charges
Open Space credit
State’s effort to Make Water Conservation a California Way of Life
Water Supply Reliability Level of Service Goal
See workplan items #5-#11 for suggested meeting dates
2-28-18
Discussion/Action Item
Accomplished 02/28/18: The Committee received an overview of the 2018 work plan and added one additional item to the Climate Plan and invited the City of San Jose’s Environmental Services Division (ESD) to make a presentation.
Page 111
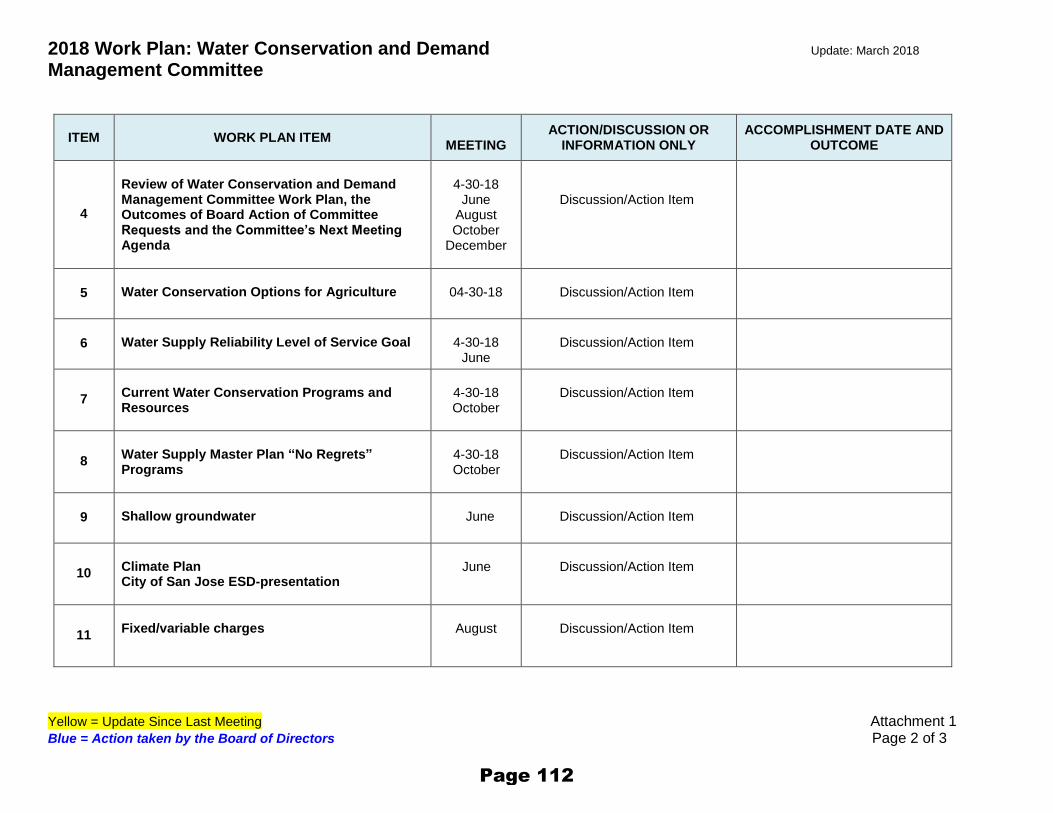
2018 Work Plan: Water Conservation and Demand Update: March 2018 Management Committee
Yellow = Update Since Last Meeting Attachment 1
Blue = Action taken by the Board of Directors Page 2 of 3
ITEM
WORK PLAN ITEM
MEETING
ACTION/DISCUSSION OR INFORMATION ONLY
ACCOMPLISHMENT DATE AND OUTCOME
4
Review of Water Conservation and Demand Management Committee Work Plan, the Outcomes of Board Action of Committee Requests and the Committee’s Next Meeting Agenda
4-30-18
June August October
December
Discussion/Action Item
5
Water Conservation Options for Agriculture
04-30-18
Discussion/Action Item
6
Water Supply Reliability Level of Service Goal
4-30-18
June
Discussion/Action Item
7
Current Water Conservation Programs and Resources
4-30-18 October
Discussion/Action Item
8
Water Supply Master Plan “No Regrets” Programs
4-30-18
October
Discussion/Action Item
9
Shallow groundwater
June
Discussion/Action Item
10
Climate Plan City of San Jose ESD-presentation
June
Discussion/Action Item
11
Fixed/variable charges
August
Discussion/Action Item
Page 112

2018 Work Plan: Water Conservation and Demand Update: March 2018 Management Committee
Yellow = Update Since Last Meeting Attachment 1
Blue = Action taken by the Board of Directors Page 3 of 3
ITEM
WORK PLAN ITEM
MEETING
ACTION/DISCUSSION OR INFORMATION ONLY
ACCOMPLISHMENT DATE AND OUTCOME
12
State’s effort to Make Water Conservation a California Way of Life
June
August
Discussion/Action Item
Page 113
This Page Intentionally Left Blank Page 114
WATER CONSERVATION AND DEMAND MANAGEMENT COMMITTEE Director Nai Hsueh Director Linda J. LeZotte, Vice Chair Director Richard P. Santos, Chair
Attachment 2 Page 1 of 2
AGENDA
WATER CONSERVATION AND DEMAND MANAGEMENT COMMITTEE
JUNE 2018 (TBD)
10:00 a.m. - 12:00 p.m.
Santa Clara Valley Water District Headquarters Building Boardroom
5700 Almaden Expressway San Jose, CA 95118
Time Certain
10:00 a.m. 1. Call to Order/Roll Call
2. Time Open for Public Comment on Any Item Not on the Agenda Comments should be limited to two minutes. If the Committee wishes to discuss a subject raised by the speaker, it can request placement on a future agenda.
3. Approval of Minutes 3.1 Approval of Minutes – April 30, 2018, meeting
4. Discussion/Action Items 4.1 Water Supply Reliability Level of Service Goal (Tracy Hemmeter) Recommendation: This is a discussion item and the Committee may provide comments, however, no action is required. 4.2 Shallow Groundwater (Vanessa De La Piedra) Recommendation: This is a discussion item and the Committee may provide comments, however, no action is required. 4.3 Climate Plan (City of San Jose-ESD Presentation) (Kerrie Romanow) Recommendation: This is a discussion item and the Committee may provide comments, however, no action is required. 4.4 Review of Water Conservation and Demand Management Committee Work Plan, the Outcomes of Board Action of Committee Requests and the Committee’s Next Meeting Agenda (Committee Chair) Recommendation: Review of Water Conservation and Demand Management Committee Work Plan, any Outcomes of Board Action or Committee Requests and the Committee’s Next Meeting Agenda.
5. Clerk Review and Clarification of Committee’s Requests This is an opportunity for the Clerk to review and obtain clarification on any formally moved, seconded, and approved requests and recommendations made by the Committee during discussion of Item 4.
6. Adjourn: Adjourn
Page 115
Page 2 of 2
REASONABLE EFFORTS TO ACCOMMODATE PERSONS WITH DISABILITIES WISHING TO ATTEND COMMITTEE MEETINGS WILL BE MADE. PLEASE ADVISE THE CLERK OF THE BOARD OFFICE OF ANY SPECIAL NEEDS BY CALLING (408) 630-2277.
Meetings of this committee will be conducted in compliance with all Brown Act requirements. All public records relating to an open session item on this agenda, which are not exempt from disclosure pursuant to the California Public Records Act, that are distributed to a majority of the legislative body will be available for public inspection at the same time that the public records are distributed or made available to the legislative body, at the following location: Santa Clara Valley Water District, Office of the Clerk of the Board 5700 Almaden Expressway, San Jose, CA 95118 Water Conservation and Demand Management Committee: Purpose: To support the Board of Directors in achieving its policy to provide a reliable water supply to meet current and future water usage by making policy recommendations related to demand management.
Page 116
Related Documents