Raamdeo Agrawal ([email protected]) / Shrinath Mithanthaya ([email protected]) We thank Mr Dhruv Mehta ([email protected]), Investment Consultant, for his invaluable contribution to this report. THE BIGGEST THE FASTEST THE MOST CONSISTENT Wealth 5-Year Appeared 10-Year Rank Company Created Company Price Company in WC Price (INR b) CAGR (%) Study (x) CAGR (%) 1 ITC 1,187 TTK Prestige 89 Kotak Mahindra Bank 10 48 2 TCS 1,082 LIC Housing Finance 57 Siemens 10 44 3 HDFC Bank 744 Coromandel Inter 54 Sun Pharma 10 40 4 MMTC 671 Eicher Motors 52 Asian Paints 10 35 5 H D F C 558 IndusInd Bank 50 HDFC Bank 10 31 6 State Bank of India 556 MMTC 48 Hero Motocorp 10 30 7 Infosys 516 Jindal Steel 47 H D F C 10 29 8 Tata Motors 499 Bata India 41 ACC 10 29 9 Hind Unilever 457 Titan Inds 40 Ambuja Cements 10 26 10 Jindal Steel 436 GSK Consumer 39 Infosys 10 21 TOP 10 WEALTH CREATORS (2007-2012) Thematic Study | 12 December 2012 17th ANNUAL WEALTH CREATION STUDY (2007-2012) HIGHLIGHTS Economic Moat protects the profit of companies from competitive attack. Extended CAP (competitive advantage period) of Economic Moat Companies (EMCs) leads to superior levels of profits and stock returns. Over 2002-2012, EMCs in India have meaningfully outperformed benchmark indices. Breach of Economic Moat causes massive wealth destruction. Markets seem poised to touch new highs in the next 12 months. Economic Moat Fountainhead of Wealth Creation "(Great companies to invest are like) Wonderful castles, surrounded by deep, dangerous moats where the leader inside is an honest and decent person. Preferably, the castle gets its strength from the genius inside; the moat is permanent and acts as a powerful deterrent to those considering an attack; and inside, the leader makes gold but doesn't keep it all for himself. Roughly translated, we like great companies with dominant positions, whose franchise is hard to duplicate and has tremendous staying power or some permanence to it." — Warren Buffett

Welcome message from author
This document is posted to help you gain knowledge. Please leave a comment to let me know what you think about it! Share it to your friends and learn new things together.
Transcript
Raamdeo Agrawal ([email protected]) / Shrinath Mithanthaya ([email protected])
We thank Mr Dhruv Mehta ([email protected]), Investment Consultant, for his invaluable contribution to this report.
THE BIGGEST THE FASTEST THE MOST CONSISTENT
Wealth 5-Year Appeared 10-Year
Rank Company Created Company Price Company in WC Price
(INR b) CAGR (%) Study (x) CAGR (%)
1 ITC 1,187 TTK Prestige 89 Kotak Mahindra Bank 10 48
2 TCS 1,082 LIC Housing Finance 57 Siemens 10 44
3 HDFC Bank 744 Coromandel Inter 54 Sun Pharma 10 40
4 MMTC 671 Eicher Motors 52 Asian Paints 10 35
5 H D F C 558 IndusInd Bank 50 HDFC Bank 10 31
6 State Bank of India 556 MMTC 48 Hero Motocorp 10 30
7 Infosys 516 Jindal Steel 47 H D F C 10 29
8 Tata Motors 499 Bata India 41 ACC 10 29
9 Hind Unilever 457 Titan Inds 40 Ambuja Cements 10 26
10 Jindal Steel 436 GSK Consumer 39 Infosys 10 21
TOP 10 WEALTH CREATORS (2007-2012)
Thematic Study | 12 December 2012
17th ANNUAL WEALTH CREATION STUDY (2007-2012)
HIGHLIGHTS
Economic Moat protects the profit of companies from competitive attack.
Extended CAP (competitive advantage period) of Economic MoatCompanies (EMCs) leads to superior levels of profits and stock returns.
Over 2002-2012, EMCs in India have meaningfully outperformed benchmarkindices.
Breach of Economic Moat causes massive wealth destruction.
Markets seem poised to touch new highs in the next 12 months.
Economic MoatFountainhead of Wealth Creation
"(Great companies to invest are like) Wonderful castles, surrounded by deep, dangerous
moats where the leader inside is an honest and decent person. Preferably, the castle gets its
strength from the genius inside; the moat is permanent and acts as a powerful deterrent to
those considering an attack; and inside, the leader makes gold but doesn't keep it all for
himself. Roughly translated, we like great companies with dominant positions, whose franchise
is hard to duplicate and has tremendous staying power or some permanence to it."
— Warren Buffett

Contents
Objective, Concept and Methodology ................................................................. 1
Wealth Creation Study 2007-2012: Findings .................................................. 2-15
Theme 2013:Economic Moat ........................................................................ 16-36
Market Outlook ............................................................................................ 37-39
Appendix I: MOSL 100 – Biggest Wealth Creators ....................................... 40-41
Appendix II: MOSL 100 – Fastest Wealth Creators ...................................... 42-43
Appendix III: MOSL 100 – Wealth Creators (alphabetical) ................................ 44
Abbreviations and Terms used in this report
ABBREVIATION / TERM DESCRIPTION
2007, 2012, etc Reference to years for India are financial year ending March, unless otherwise stated
Avg Average
CAGR Compound Annual Growth Rate; All CAGR calculations are for 2005 to 2010
unless otherwise stated
L to P / P to L Loss to Profit / Profit to Loss. In such cases, calculation of PAT CAGR is not possible
Price CAGR In the case of aggregates, Price CAGR refers to Market Cap CAGR
INR b Indian Rupees in billion
WC Wealth Creation / Wealth Created
Wealth Created Increase in Market Capitalization over the last 5 years, duly adjusted for corporate
events such as fresh equity issuance, mergers, demergers, share buybacks, etc.
Capitaline database has been used for this study
Wealth Creation Study 2007-2012

112 December 2012
Wealth Creation Study 2007-2012 Findings
Wealth Creation Study 2007-2012Objective, Concept and Methodology
Report structure
Part 1 | Wealth Creation Study findings: Here, we identify and analyze the top 100 Wealth
Creators in the Indian stock market for the period 2007-2012.
Part 2 | Theme - Economic Moat: Here, we explain the concept of Economic Moat and its
effective application for Wealth Creation.
Objective: The foundation of Wealth Creation is in buying businesses at a price substantially
lower than their "intrinsic value" or "expected value". The lower the market value compared
to the intrinsic value, the higher is the margin of safety. Every year for the past 15 years, we
endeavor to cull out the characteristics of businesses, which create value for their
shareholders.
As Phil Fisher says, "It seems logical that even before thinking of buying any common stock,
the first step is to see how money has been most successfully made in the past." Our Wealth
Creation studies are attempts to study the past as a guide to the future and gain insights into
the various dynamics of stock market investing.
Concept: Wealth Creation is the process by which a company enhances the market value of
the capital entrusted to it by its shareholders. It is a basic measure of success for any
commercial venture. Wealth Creation is achieved by the rational actions of a company in a
sustained manner.
Methodology & change in methodology from this year: We define Wealth Created as the
difference in market capitalization over this period of five years, after adjusting for equity
dilution. Hitherto, we ranked the top 100 Wealth Creators based on a simple listing of
companies in descending order of absolute Wealth Created. This year, we introduce a
condition that during the study period, the company's stock price should have at least
outperformed the benchmark index (the BSE Sensex in our case). Speed of Wealth Creation
(speed is price CAGR during the period under study).
Due to the "Market Outperformance Filter", 9 companies dropped off from the Top 100
despite high absolute wealth created, some of them by a hair's breadth. We list below the
drop-outs and also the companies which made it at their expense.
Market Outperformance Filter (Sensex CAGR over 2007-12 was 6%)Who missed the Wealth Creators list … … and who made it
Company Adjusted Price Normal Company Adjusted Price Rank
NWC CAGR (%) Rank* NWC CAGR (%)
O N G C 40,863 4.0 11 Tata Chemicals 3,236 11 92
Wipro 26,602 5.6 19 Tata Global 3,201 13 93
I O C L 15,839 5.6 31 TTK Prestige 3,191 89 94
NTPC 10,678 1.7 44 Kansai Nerolac 3,103 22 95
Hindalco Inds. 8,838 1.8 55 Godrej Inds 2,958 10 96
B H E L 7,557 2.6 61 Ashok Leyland 2,953 10 97
Cipla 5,463 5.3 79 BOC India 2,826 30 98
Oracle Fin.Serv. 4,594 4.7 85 MRF 2,796 24 99
Ranbaxy Labs. 3,712 5.9 95 Ipca Labs 2,698 23 100
* If the stock would have outperformed the Sensex

212 December 2012
Wealth Creation Study 2007-2012 Findings
Wealth Creation
2007-2012The 17TH Annual Study
Findings
312 December 2012
Wealth Creation Study 2007-2012 Findings
9173
262341
1,247377383
2451,0301,065
1,6781,856
3,0771,514
2,5561,742
1,187
19961997199819992000200120022003200420052006200720082009201020112012
RIL
RIL
RIL
ONGCONGCONGC
WiproWipro
Hind. LeverWipro
Hind. Lever
Hind. LeverHind. LeverHind. Lever
RIL
RILITC
Share of wealth creation by top 10 declining,suggesting higher dispersion
The Biggest Wealth Creators
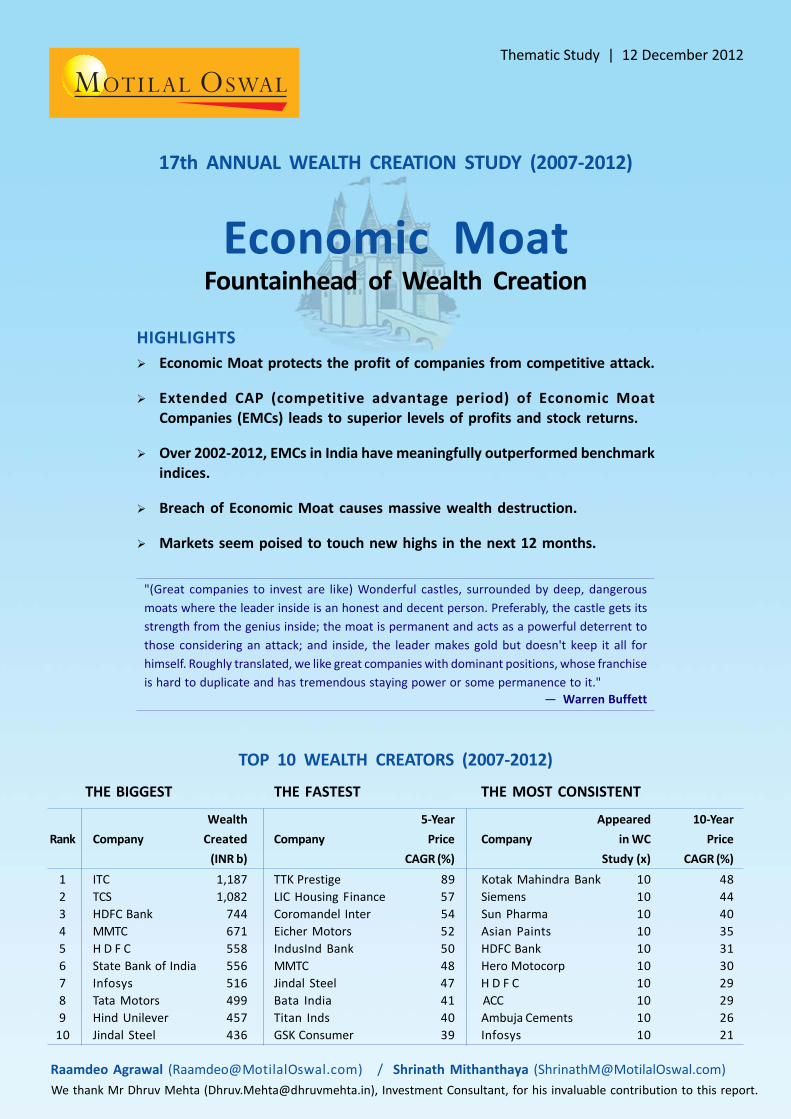
ITC is the Biggest Wealth Creator ITC has emerged as the biggest wealth creator for the first time ever, significantly
improving its 7th rank in last year's study. This breaks the 8-year stranglehold of Oil &
Gas companies with Reliance Industries topping the list in the last 5 years, and ONGC in
the 3 years prior to that.
Interestingly, both Reliance and ONGC did not make it to the top 100 wealth creators
due to market underperformance (2007-12 stock price CAGR was 4% for ONGC and 2%
for Reliance v/s 6% for the Sensex).
TCS has held on to its position as close runner-up. HDFC Bank is in the third place,
jumping 3 spots from its last year's rank of 6th. Going by the findings of our thematic
study on Economic Moat (page 16 onwards), Indian Banking is the sector to watch out
for, and HDFC Bank is a serious contender for the top spot sooner rather than later.
Top 10 Biggest Wealth Creators
Rank Company Wealth Created CAGR (%) P/E (x) RoE (%)
(INR b) % Share Price PAT FY12 FY07 FY12 FY07
1 ITC 1,187 7 26 17 29 21 35 28
2 TCS 1,082 7 14 20 22 29 38 56
3 HDFC Bank 744 5 32 36 23 27 19 19
4 MMTC 671 4 48 -8 761 70 5 14
5 H D F C 558 3 21 26 18 22 19 19
6 State Bank of India 556 3 21 19 9 8 16 16
7 Infosys 516 3 8 17 20 29 29 42
8 Tata Motors 499 3 26 46 6 13 52 32
9 Hind Unilever 457 3 15 11 35 29 87 64
10 Jindal Steel 436 3 47 41 13 10 24 32
Total/Avg of above 6,707 41 20 24 17 20 24 23
Total of Top 100 16,380 100 20 21 16 16 19 21
Biggest wealth creators and wealth created (INR b):ITC breaks the long-standing dominance of Oil & Gas
#1
Key Finding #1Even as ITC tops the list, Hindustan Unilever has made a silent but strong comeback in the
Top 10 list after long gap of 12 years. Most leading consumer companies in India have an
Economic Moat and are likely to remain fountainheads of Wealth Creation
76
5350
4551 49
59
41 42 41
2003
2004
2005
2006
2007
2008
2009
2010
2011
2012
(%)
412 December 2012
Wealth Creation Study 2007-2012 Findings
The Fastest Wealth Creators
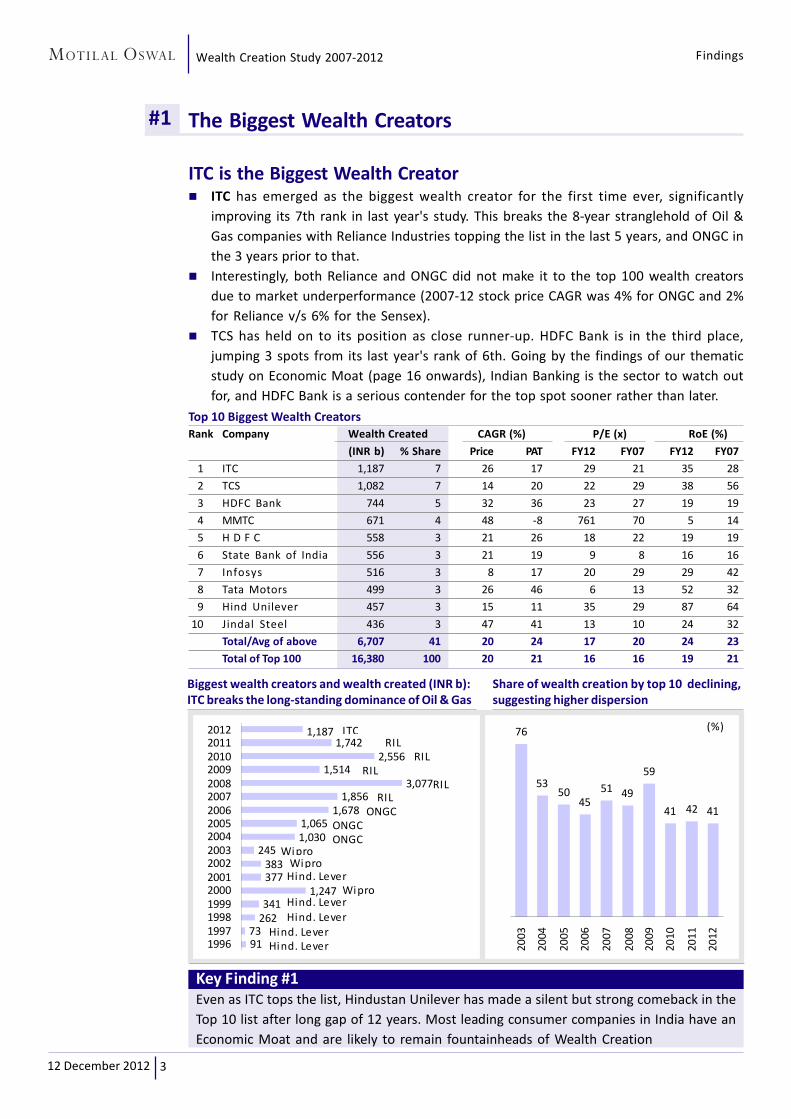
TTK Prestige is the Fastest Wealth Creator TTK Prestige has emerged as the fastest Wealth Creator between 2007 and 2012, during
which period, its stock price multiplied 24x, translating into annualized return of 89%.
Yet, this stunning performance is one of the slowest among all the Fastest Wealth Creators
since 1998.
Akin to Hindustan Unilever's re-entry into the Top 10 Wealth Creators list, 4 consumer
goods companies including TTK have made it to the Top 10 Fastest Wealth Creators list.
Top 10 Fastest Wealth Creators
Rank Price CAGR (%) Wealth Created Mkt Cap (INR b) P/E (x)
Multiple (x) Price PAT (INR b) 2012 2007 2012 2007
1 TTK Prestige 24 89 58 32 33 1 29 12
2 LIC Housing Finance 10 57 27 106 133 12 14 4
3 Coromandel Inter 9 54 43 69 81 8 12 7
4 Eicher Motors 8 52 41 47 54 7 19 13
5 IndusInd Bank 8 50 56 118 150 13 19 16
6 MMTC 7 48 -8 671 783 112 761 70
7 Jindal Steel 7 47 41 436 509 73 13 10
8 Bata India 6 41 42 41 49 9 32 33
9 Titan Inds 5 40 41 166 203 37 34 35
10 GSK Consumer 5 39 23 94 116 22 33 17
Of all the fastest wealth creators since 1999, this year is the slowest! (Price Appreciation - X)
Key Finding #2Consumer goods companies are generally considered to be steady growth businesses,
and deemed unlikely to generate high returns. However, increasing number of consumer
companies seem to be enjoying the tailwind of India's NTD era (Next Trillion Dollar of
GDP), and breaking into the league of Fastest Wealth Creators as well.
#2
30
7
23
75
223
66
69
5075
136
182
665
837
54
28
50
24
1996
1997
1998
1999
2000
2001
2002
2003
2004
2005
20062007
2008
2009
2010
2011
2012
Unitech
Unitech
Unitech
B F Utilities
Matrix Labs
Matrix Labs
Matrix Labs
e- Serve
Wipro
Infosys
SSISatyam Computers
Satyam Computers
Cipla
Dr Reddy's Lab
Sanwaria Agro
TTK Prestige

512 December 2012
Wealth Creation Study 2007-2012 Findings
Most Consistent Wealth Creating Companies
Kotak Mahindra is the Most Consistent Wealth Creator Kotak Mahindra Bank has retained its place as the Most Consistent Wealth Creator.
Given low cyclicality, consumer facing companies (both goods and services) are better
placed to appear in the list of Most Consistent Wealth Creators. Notable exceptions are
Holcim Group companies, ACC and Ambuja Cements, which appear in the top 10 list
both this year and last. Clearly, Holcim's presence has made the behavior of these
companies more predictable to investors, leading to better and stable valuations.
#3
Key Finding #3Quality of management is a key factor behind consistent wealth creation. This is further
amplified by the role of management strategy in creating and/or defending a company's
Economic Moat which protects its profitability from being eroded by competitive forces
(see theme study on Economic Moat from Page 16).
Top 10 Consistent Wealth Creators
Rank Company Appeared in 10-yr Price 5-Year PAT P/E (x) RoE (%)
WC Study (x) CAGR (%) CAGR (%) 2012 2007 2012 2007
1 Kotak Mahindra Bank 10 48 28 30 22 18 15
2 Siemens 10 44 17 48 30 36 23
3 Sun Pharma 10 40 27 29 25 38 25
4 Asian Paints 10 35 28 26 32 37 39
5 HDFC Bank 10 31 36 27 23 19 19
6 Hero Motocorp 10 30 23 18 19 38 66
7 H D F C 10 29 26 22 18 19 19
8 ACC 10 29 3 12 20 41 19
9 Ambuja Cements 10 26 2 15 22 35 16
10 Infosys 10 21 17 29 20 42 29
Consumer facing companies score high on Consistent Wealth Creation
Others
Hero MotoCorp (4)
HDFC (5)
HDFC Bank (4)
Kotak Mah. Bk (3)
Healthcare
Cipla (1)
Piramal Health. (1)
Ranbaxy Lab (1)
Sun Pharma (5)
Consumer
Asian Paints (4)
ITC (2)
Nestle India (1)
Technology
Infosys (5)
Satyam (1)
Others
ACC (2)
Ambuja Cement (3)
Hind. Zinc (1)
O N G C (2)
Siemens (1)
Reliance Inds (4)
Consistent Wealth Creators (Last 5 years, 2007 to 2012)
Non-Consumer FacingConsumer Facing
Number in brackets indicates times appeared within top 10 in last five Wealth Creation Studies
612 December 2012
Wealth Creation Study 2007-2012 Findings
Wealth Creators (Wealthex) v/s BSE Sensex
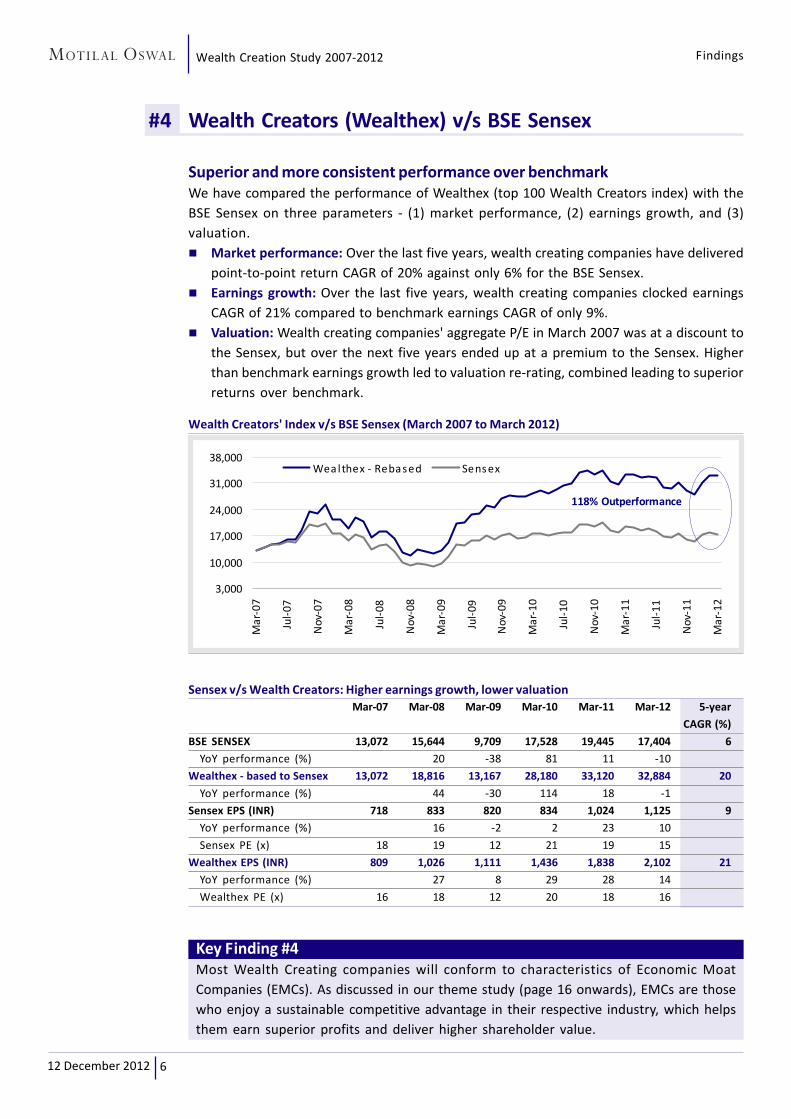
Superior and more consistent performance over benchmarkWe have compared the performance of Wealthex (top 100 Wealth Creators index) with the
BSE Sensex on three parameters - (1) market performance, (2) earnings growth, and (3)
valuation.
Market performance: Over the last five years, wealth creating companies have delivered
point-to-point return CAGR of 20% against only 6% for the BSE Sensex.
Earnings growth: Over the last five years, wealth creating companies clocked earnings
CAGR of 21% compared to benchmark earnings CAGR of only 9%.
Valuation: Wealth creating companies' aggregate P/E in March 2007 was at a discount to
the Sensex, but over the next five years ended up at a premium to the Sensex. Higher
than benchmark earnings growth led to valuation re-rating, combined leading to superior
returns over benchmark.
#4
Key Finding #4Most Wealth Creating companies will conform to characteristics of Economic Moat
Companies (EMCs). As discussed in our theme study (page 16 onwards), EMCs are those
who enjoy a sustainable competitive advantage in their respective industry, which helps
them earn superior profits and deliver higher shareholder value.
Wealth Creators' Index v/s BSE Sensex (March 2007 to March 2012)
Sensex v/s Wealth Creators: Higher earnings growth, lower valuation
Mar-07 Mar-08 Mar-09 Mar-10 Mar-11 Mar-12 5-year
CAGR (%)
BSE SENSEX 13,072 15,644 9,709 17,528 19,445 17,404 6
YoY performance (%) 20 -38 81 11 -10
Wealthex - based to Sensex 13,072 18,816 13,167 28,180 33,120 32,884 20
YoY performance (%) 44 -30 114 18 -1
Sensex EPS (INR) 718 833 820 834 1,024 1,125 9
YoY performance (%) 16 -2 2 23 10
Sensex PE (x) 18 19 12 21 19 15
Wealthex EPS (INR) 809 1,026 1,111 1,436 1,838 2,102 21
YoY performance (%) 27 8 29 28 14
Wealthex PE (x) 16 18 12 20 18 16
3,000
10,000
17,000
24,000
31,000
38,000
Ma
r-0
7
Jul-
07
Nov
-07
Ma
r-0
8
Jul-
08
Nov
-08
Ma
r-0
9
Jul-
09
Nov
-09
Ma
r-1
0
Jul-
10
Nov
-10
Ma
r-1
1
Jul-
11
Nov
-11
Ma
r-1
2
Wea l thex - Rebased Sens ex
118% Outperformance

712 December 2012
Wealth Creation Study 2007-2012 Findings
Wealth Creation Classification by Industry
Financials maintain top spot as the largest Wealth Creating sector Financials sector has retained its top spot of the largest Wealth Creator. In the 2011
study, Financials emerged as the largest Wealth Creating sector for the first time ever,
hitherto a stronghold of commodity sectors, mainly Oil & Gas and Metals/Mining.
Size apart, Financials has also outperformed in terms of price with 24% CAGR, second
only to Metals/Mining (27%). This is on the back of robust 25% CAGR in PAT, second only
to Auto (27%).
Even after a huge run-up in stock prices, Financials sector valuations remain lower than
average, arguably on concerns regarding asset quality and the impact of fresh competition
by way of new banking licenses.
#5
Key Finding #5Clearly, the Financials sector has gained hugely from restrictions on new banking licenses,
a major sector-level entry barrier (or Economic Moat as we call it in our theme study, see
page 16). Protected by this moat, even relatively inefficient banks have significantly
grown in terms of profits and market cap. When new set of private banks first entered in
the 1980s, significant portion of value migrated from public sector banks to private sector
counterparts. Fresh banking licenses are expected to be issued sooner rather later. This
change in competitive landscape should further separate the men (i.e. those with strong
strategy) from the boys (those without strategy).
Wealth Creators: Classification by industry (INR b)
Wealth Share of Wealth
Industry Created Created (%) CAGR (%) P/E (x) RoE (%)
(No of Companies) (INR b) 2012 2007 Price PAT 2012 2007 2012 2007
Financials (21) 3,672 22 13 24 25 11 11 16 16
Consumer & Retail (21) 3,358 21 5 24 18 33 25 32 31
Metals / Mining (8) 2,095 13 9 27 19 15 10 22 42
Technology (3) 1,734 11 10 11 18 20 27 30 38
Auto (11) 1,630 10 6 21 27 12 15 28 26
Healthcare (11) 1,215 7 4 23 18 26 21 17 25
Oil & Gas (7) 996 6 24 20 23 11 12 16 10
Cement (5) 668 4 3 16 8 17 12 16 32
Capital Goods (6) 609 4 10 13 21 20 27 18 26
Ultility (3) 235 1 2 18 5 26 15 6 8
Others (4) 166 1 15 30 22 14 10 17 19
Grand Total 16,380 100 100 20 21 16 16 19 21
During FY07-12, the financials sector is beginning to assert its dominance (INR b)
1,8392,723
3,891
5,826
2,126
4,949 5,194
3,672
2005
Oi l & Gas
2006
Oi l & Gas
2007
Oi l & Gas
2008
Oi l & Gas
2009
Oi l & Gas
2010
Meta ls/Min.
2011
Financia ls
2012
Financia ls

812 December 2012
Wealth Creation Study 2007-2012 Findings
Wealth Creation by Ownership – PSU v/s Private
Wealth migration follows value migration PSUs' (public sector undertakings) share of wealth creation continues to be on a secular
decline with their share of wealth created more than halving from 50% in 2004/2005 to
about 20% in the current study.
This is one of the classic cases of value migration from the public sector to private sector
in almost every single erstwhile stronghold of PSUs – banking, oil & gas metals/mining,
capital goods, etc.
As of end-FY12, markets valued Wealth Creating PSUs at about 10x trailing earnings,
almost 50% discount to 18x for the private sector Wealth Creating companies. If these
multiples are any indication, the markets expect PSUs' share of Value Creation to remain
low, implying lower Wealth Creation as well.
#6
Key Finding #6In the context of our theme study on Economic Moat, lower valuation multiples of PSU
companies imply that the market expects their competitive advantage period (CAP) to
be significantly shorter than their private sector counterparts. See page 30 for insights
into the concept of CAP.
Wealth Creators: PSU v/s Privately-owned Financials dominate PSU Wealth Creation too
2007-2012
PSU Private
No. of Wealth Creators 20 80
Share of Wealth Created (%) 20 80
Sales CAGR (2007-12, %) 21 24
PAT CAGR (2007-12, %) 19 22
Market Cap CAGR (2007-12, %) 22 20
P/E - 2007 (x) 9 20
P/E - 2012 (x) 10 18
RoE - 2007 (%) 17 24
RoE - 2012 (%) 16 21
Deregulation diminishes role of state-owned companies in Wealth Created
Metals/
Mining
37%
Financials
43%Utility
2%
Capital
Goods
2%
Oil &
G a s
16%
28 30 2618
2516
22 24 20
49 51
36
25
35
2730
27
20
199
9-04
200
0-05
200
1-06
200
2-07
200
3-08
200
4-09
200
5-10
200
6-11
200
7-12
No of PSUs % Wealth Created

912 December 2012
Wealth Creation Study 2007-2012 Findings
2328
21 1925
28
19
121
1-5 6-10 11-15 16-20
Price CAGR (%) PAT CAGR (%)
Wealth Creation by Age and Market Cap
"In youth we learn, in age we understand." - Marie von Ebner-Eschenbach Pace of Wealth Creation is fairly agnostic to age of companies. Younger companies start
off on a low base and manage to deliver high rates of growth. However, markets are
reasonably efficient in pricing these growth rates upfront. As a result, although PAT
growth rates vary across age groups, the Price CAGR is , much more homogenous, and
hovering around average overall return of 20%.
Unlike younger companies, smaller companies (i.e. small- and mid-caps based on market
cap of 2007) seem to have an edge in faster wealth creation. But as is the case with age-
based classification, the divergence in market performance of small and large cap
companies is much lower than that in earnings growthlarger ones create wealth a bit
slowly, but with low level of risk.
#7
Key Finding #7One of the key findings of our theme study this year (see page 16) is that a company's
competitive advantage in its industry (what we call Economic Moat) is a key factor
influencing sustained profitability and in turn, Wealth Creation. So long as companies
generate health profits, markets are agnostic to factors like age of company and market
cap at the time of purchase.
Wealth Creators: Classification by age-group
Wealth % Share
Age No. of Created of CAGR (%) P/E (x) RoE (%)
range cos (INR b) WC Price PAT 2012 2007 2012 2007
1-20 24 4,327 26 22 32 17 25 20 16
21-40 28 4,121 25 18 19 18 19 21 23
41-60 24 3,676 22 21 15 14 11 16 22
>61 24 4,256 26 20 22 14 14 21 22
Total 100 16,380 100 20 21 16 16 19 21
Price CAGR and PAT CAGR by base market cap range
Base Market Cap Range (INR b)

1012 December 2012
Wealth Creation Study 2007-2012 Findings
Wealth Creation by Sales and Earnings growth
Markets remain slaves of earnings power Pace of wealth creation is almost singularly decided by quantum of earnings growth, at
least in the short- and medium term. Earnings growth, in turn, has a very high correlation
with Sales growth, as margin expansion is not sustainable over long periods.
In this year's study, the performance of groups based on Sales growth and PAT growth
has been significantly influenced by commencement of Sales and PAT at Cairn India, and
a significant turnaround in Tata Motors' consolidated performance. As a result, despite
PAT growth in excess of 30%, P/Es have shrunk as the markets deem such PAT performance
to be cyclical and most likely unsustainable.
#8
Key Finding #8In his 2007 letter to Berkshire Hathaway shareholders, Warren Buffett writes, "Long-term
competitive advantage in a stable industry is what we seek in a business. If that comes
with rapid organic growth, great. But even without organic growth, such a business is
rewarding." In the final analysis, markets love steady earnings growth sustained over
long periods in time. This is possible only in the case of companies which enjoy an
Economic Moat, as explained in our theme study from page 16.
Wealth Creators: Classification by Sales Growth
Sales Wealth % Share
Growth No. of Created of CAGR (%) P/E (x) RoE (%)
Range cos (INR b) WC Price PAT 2012 2007 2012 2007
<15 18 2,091 13 15 6 21 14 18 35
15-20 19 3,154 19 16 12 23 19 20 23
20-25 25 4,653 28 21 20 15 15 20 22
25-30 14 1,680 10 19 23 11 13 17 19
30-35 14 2,340 14 28 26 20 19 15 21
>35 10 2,462 15 26 46 10 21 24 10
Total 100 16,380 100 20 21 16 16 19 21
Strong correlation between PAT growth & Price CAGR
PAT Growth Range (%)
18 1720
32 30
<10 10-20 20-30 30-40 >40
Average Price CAGR: 20%
1112 December 2012
Wealth Creation Study 2007-2012 Findings
Wealth Creation by RoE
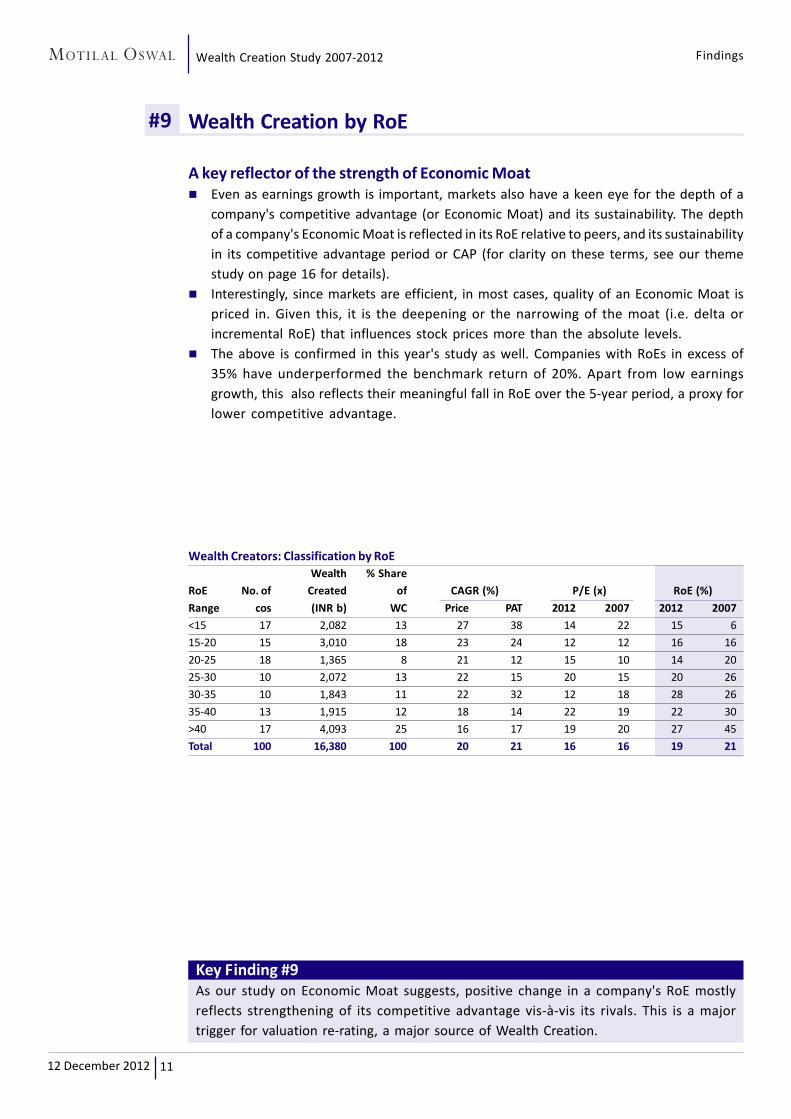
A key reflector of the strength of Economic Moat Even as earnings growth is important, markets also have a keen eye for the depth of a
company's competitive advantage (or Economic Moat) and its sustainability. The depth
of a company's Economic Moat is reflected in its RoE relative to peers, and its sustainability
in its competitive advantage period or CAP (for clarity on these terms, see our theme
study on page 16 for details).
Interestingly, since markets are efficient, in most cases, quality of an Economic Moat is
priced in. Given this, it is the deepening or the narrowing of the moat (i.e. delta or
incremental RoE) that influences stock prices more than the absolute levels.
The above is confirmed in this year's study as well. Companies with RoEs in excess of
35% have underperformed the benchmark return of 20%. Apart from low earnings
growth, this also reflects their meaningful fall in RoE over the 5-year period, a proxy for
lower competitive advantage.
#9
Key Finding #9As our study on Economic Moat suggests, positive change in a company's RoE mostly
reflects strengthening of its competitive advantage vis-à-vis its rivals. This is a major
trigger for valuation re-rating, a major source of Wealth Creation.
Wealth Creators: Classification by RoE
Wealth % Share
RoE No. of Created of CAGR (%) P/E (x) RoE (%)
Range cos (INR b) WC Price PAT 2012 2007 2012 2007
<15 17 2,082 13 27 38 14 22 15 6
15-20 15 3,010 18 23 24 12 12 16 16
20-25 18 1,365 8 21 12 15 10 14 20
25-30 10 2,072 13 22 15 20 15 20 26
30-35 10 1,843 11 22 32 12 18 28 26
35-40 13 1,915 12 18 14 22 19 22 30
>40 17 4,093 25 16 17 19 20 27 45
Total 100 16,380 100 20 21 16 16 19 21

1212 December 2012
Wealth Creation Study 2007-2012 Findings
Wealth Creators by Valuation Parameters
Payback ratio of less than 1x continues to guarantee highest returns In almost every single of our past Wealth Creation Studies, the key valuation indicators
for multi-baggers are -
1. P/E of less than 10x
2. Price/Book of less than 1x
3. Price/Sales of 1x or less
4. Payback Ratio of less than 1x
(Payback is a proprietary ratio of Motilal Oswal, defined as current market cap divided
by estimated profits over the next five years. We back-test this in 2007, based on the
actual profits reported over the next five years).
#10
Wealth Creators: Classification by Valuation Parameters (March 2007)
Wealth % Share
No. of Created of CAGR (%) P/E (x) RoE (%)
Range cos (INR b) WC Price PAT 2012 2007 2012 2007
P/E - 2007
<10 18 2,811 17 20 18 9 8 16 16
10-15 21 2,869 18 22 24 11 12 22 25
15-20 19 1,557 10 21 20 17 17 19 18
20-25 13 2,899 18 25 24 22 22 21 22
25-30 13 4,579 28 16 21 23 28 25 33
>30 16 1,666 10 25 24 49 47 19 21
Total 100 16,380 100 20 21 16 16 19 21
P/B - 2007
<1 6 972 6 25 28 8 9 16 9
1-2 20 1,944 12 20 19 10 9 14 15
2-3 10 1,088 7 24 21 12 11 19 25
3-4 11 2,110 13 20 20 12 12 24 28
4-5 13 2,348 14 22 24 15 17 19 27
5-6 11 2,326 14 26 21 24 20 27 27
>6 29 5,592 34 17 19 27 30 27 37
Total 100 16,380 100 20 21 16 16 19 21
P/S - 2007
<1 23 3,180 19 26 23 10 9 18 17
1-2 27 2,892 18 21 15 17 13 17 22
2-3 19 2,323 14 21 17 16 13 18 34
3-4 9 1,662 10 18 20 20 21 22 26
4-5 7 2,270 14 26 23 25 23 21 18
>5 15 4,053 25 15 26 17 27 23 19
Total 100 16,380 100 20 21 16 16 19 21
Payback Ratio
<1 19 2,371 14 26 25 8 8 17 16
1-2 37 5,486 33 23 24 12 13 20 19
2-3 26 4,770 29 20 15 25 20 19 23
>3 18 3,753 23 15 16 28 30 27 36
Total 100 16,380 100 20 21 16 16 19 21

1312 December 2012
Wealth Creation Study 2007-2012 Findings
Wealth Creators & dividends
Our last year's study on Blue Chip Investing had revealed to us the power of dividends in
wealth creation, especially over long periods of time across economic and business
cycles.
Wealth creating companies continue to demonstrate that companies with high RoE's
tend to have high payout ratios, as they require very little external capital to grow.
Companies with high dividend payout ratios tend to enjoy high share of share of wealth
created.
#11
Wealth Creators: Classification by Payout
2007 Wealth % Share
Payout No. of Created of CAGR (%) P/E (x) RoE (%)
Range cos (INR b) WC Price PAT 2012 2007 2012 2007
<10 13 2,227 14 22 22 14 14 17 17
10-20 16 3,135 19 18 18 16 16 17 20
20-30 22 3,380 21 21 25 12 14 18 20
30-40 27 3,924 24 19 21 16 17 22 22
>40 22 3,714 23 23 18 27 22 30 26
Total 100 16,380 100 20 21 16 16 19 21
Top 10 total dividend paying companies (2007-12): TCS takes sweet revenge over ITC!
2007-12 Dividend Avg Payout CAGR (%) P/E (x) RoE (%)
(INR b) (%) Adj EPS Price 2012 2007 2012 2007
TCS 167 45 19 14 22 29 38 56
ITC 157 72 16 25 29 21 35 28
Infosys 126 39 16 7 20 29 29 42
State Bank of India 110 19 15 17 9 8 16 16
Hind Unilever 94 81 9 15 35 29 87 64
Hero Motocorp 70 79 23 25 19 18 66 38
H D F C 66 36 -12 17 18 22 19 19
NMDC 62 25 25 20 9 11 33 47
GAIL (India) 56 32 12 16 11 9 18 23
Tata Motors 50 20 32 14 6 13 52 32
Top 10 dividend hike companies (2007-12): Top 4 ranks same as total dividend; HUL, Hero Motocorp,GAIL out, NMDC, Hind Zinc, L&T in
2007-12 Div. Payout CAGR (%) P/E (x) RoE (%)
(INR b) (%) Adj EPS Price 2012 2007 2012 2007
TCS 44 24 19 14 22 29 38 56
ITC 27 16 16 25 29 21 35 28
Infosys 24 18 16 7 20 29 29 42
State Bank of India 18 4 15 17 9 8 16 16
NMDC 15 6 25 20 9 11 33 47
H D F C 13 -3 -12 17 18 22 19 19
Hindustan Zinc 9 16 4 19 11 5 22 80
HDFC Bank 9 -1 26 22 23 27 19 19
Tata Motors 8 -21 32 14 6 13 52 32
Larsen & Toubro 7 5 15 10 18 25 16 30
1412 December 2012
Wealth Creation Study 2007-2012 Findings
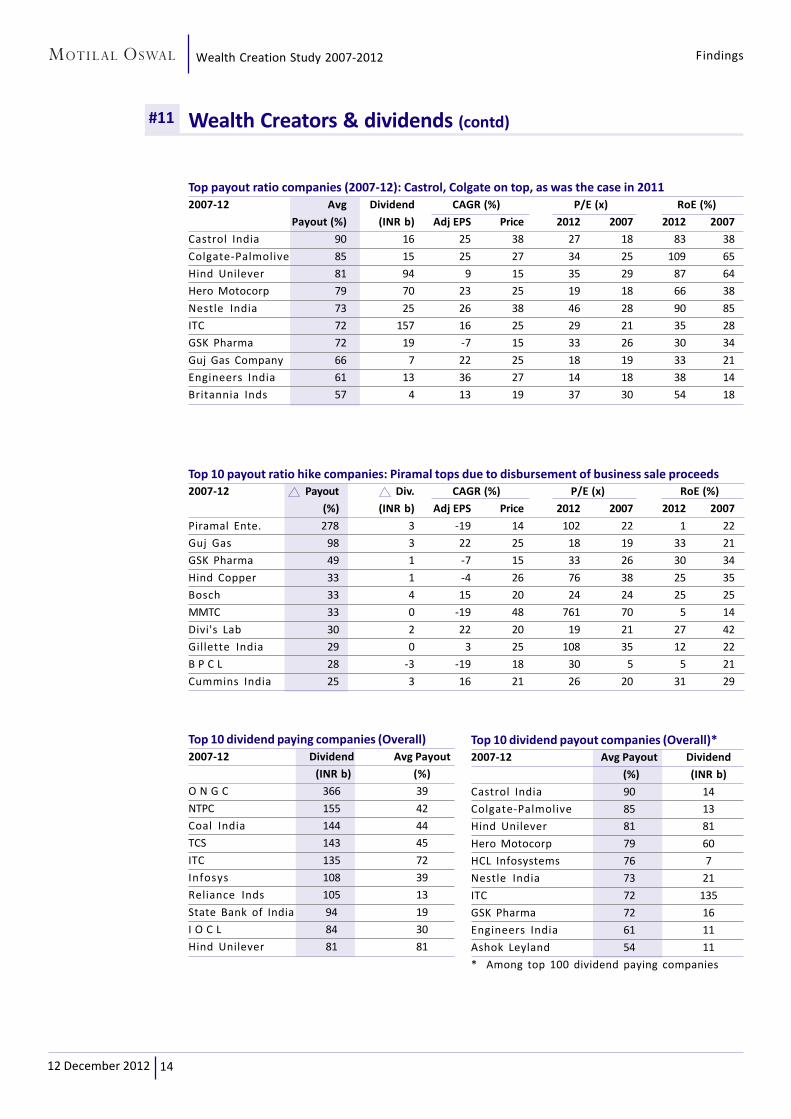
#11 Wealth Creators & dividends (contd)
Top 10 payout ratio hike companies: Piramal tops due to disbursement of business sale proceeds
2007-12 Payout Div. CAGR (%) P/E (x) RoE (%)
(%) (INR b) Adj EPS Price 2012 2007 2012 2007
Piramal Ente. 278 3 -19 14 102 22 1 22
Guj Gas 98 3 22 25 18 19 33 21
GSK Pharma 49 1 -7 15 33 26 30 34
Hind Copper 33 1 -4 26 76 38 25 35
Bosch 33 4 15 20 24 24 25 25
MMTC 33 0 -19 48 761 70 5 14
Divi's Lab 30 2 22 20 19 21 27 42
Gillette India 29 0 3 25 108 35 12 22
B P C L 28 -3 -19 18 30 5 5 21
Cummins India 25 3 16 21 26 20 31 29
Top payout ratio companies (2007-12): Castrol, Colgate on top, as was the case in 2011
2007-12 Avg Dividend CAGR (%) P/E (x) RoE (%)
Payout (%) (INR b) Adj EPS Price 2012 2007 2012 2007
Castrol India 90 16 25 38 27 18 83 38
Colgate-Palmolive 85 15 25 27 34 25 109 65
Hind Unilever 81 94 9 15 35 29 87 64
Hero Motocorp 79 70 23 25 19 18 66 38
Nestle India 73 25 26 38 46 28 90 85
ITC 72 157 16 25 29 21 35 28
GSK Pharma 72 19 -7 15 33 26 30 34
Guj Gas Company 66 7 22 25 18 19 33 21
Engineers India 61 13 36 27 14 18 38 14
Britannia Inds 57 4 13 19 37 30 54 18
Top 10 dividend paying companies (Overall)
2007-12 Dividend Avg Payout
(INR b) (%)
O N G C 366 39
NTPC 155 42
Coal India 144 44
TCS 143 45
ITC 135 72
Infosys 108 39
Reliance Inds 105 13
State Bank of India 94 19
I O C L 84 30
Hind Unilever 81 81
Top 10 dividend payout companies (Overall)*
2007-12 Avg Payout Dividend
(%) (INR b)
Castrol India 90 14
Colgate-Palmolive 85 13
Hind Unilever 81 81
Hero Motocorp 79 60
HCL Infosystems 76 7
Nestle India 73 21
ITC 72 135
GSK Pharma 72 16
Engineers India 61 11
Ashok Leyland 54 11
* Among top 100 dividend paying companies

1512 December 2012
Wealth Creation Study 2007-2012 Findings
Wealth Destroyers
Wealth Destroyed is about 35% of Wealth Created The 2007-12 period saw about INR5.7 trillion of Wealth Destruction, a high 35% of the
Wealth Created by top 100 companies (the figure in last year's study was 15%, whereas
during the peak of the market boom in 2007-08, the figure was as low as 2%).
This year's data is a classic case study on how change in the competitive landscape of an
industry (a key element of a company's Economic Moat) drastically affects value and
wealth creation. Barely 4 years ago, the Indian Telecom sector was the 5th largest Wealth
Creator and sector leader Bharti Airtel was the third largest Wealth Creator. Four years
later, the Telecom sector leads the Wealth Destruction list, and top 4 of 10 Wealth
Destroyer companies emerging from the sector (including RCom, Bharti and MTNL).
This is a grim reminder to both companies and investors of the far-reaching impact of
Economic Moats getting breached. We discuss the concept in detail from page 16.
#12
Top-10 Wealth Destroyers (2007-2012)
Company Wealth Destroyed Price
(INR b) % Share CAGR (%)
Rel. Comm. 677 12 -28
Unitech 294 5 -32
Suzlon Energy 276 5 -34
Satyam Computer 249 4 -30
Bharti Airtel 169 3 -2
Bajaj Holdings 159 3 -20
S A I L 83 1 -4
Tech Mahindra 82 1 -13
M T N L 75 1 -29
Himachal Futuristic 74 1 -12
Total of Above 2,064 36
Total Wealth Destroyed 5,702 100
Wealth Destruction by Industry (%)Sector No of Wealth Destroyed
Cos (INR b) % Share
Telecom 20 1,111 19
Construction / Real Estate 78 835 15
Technology 149 749 13
Capital Goods 115 575 10
Metals 74 267 5
Banking & Finance 120 240 4
Texti les 160 206 4
Media 48 167 3
Uti l it ies 4 135 2
Auto 71 132 2
Oil & Gas 7 101 2
Chemicals & Fertilizers 65 99 2
Healthcare 51 89 2
Sugar 32 60 1
Consumer 32 59 1
Air l ines 4 42 1
Cement 12 32 1
Tea 4 6 0
Paper 21 5 0
Others 261 791 14
Total 1,328 5,702 100

1612 December 2012
Wealth Creation Study 2007-2012 Theme 2013: Economic Moat
Wealth Creation
2007-2012The 17TH Annual Study
Theme 2013:Economic Moat

1712 December 2012
Wealth Creation Study 2007-2012 Theme 2013: Economic Moat
Economic MoatFountainhead of wealth creation
"(Great companies to invest are like) Wonderful castles, surrounded by deep, dangerous
moats where the leader inside is an honest and decent person. Preferably, the castle gets
its strength from the genius inside; the moat is permanent and acts as a powerful deterrent
to those considering an attack; and inside, the leader makes gold but doesn't keep it all
for himself. Roughly translated, we like great companies with dominant positions, whose
franchise is hard to duplicate and has tremendous staying power or some permanence to
it."
- Warren Buffett
Report scope and structure
MOST of us would have read or heard frequent references to "moats" or "Economic
Moats" in the context of equity investing. We believe with a clear understanding of
the concept and its effective application, moats can prove to be fountainheads of Wealth
Creation.
We attempt this in the following pages as follows -
Section 1 introduces the concept of Economic Moat and covers 4 examples of how
investing in EMCs (Economic Moat Companies) pays off handsomely in the stock markets
vis-à-vis non-EMCs.
Section 2 discusses the factors determining Economic Moats, including the importance
of a strong corporate strategy to defend and deepen the same.
Section 3 is where we apply our understanding of Economic Moats for Wealth Creation.
Our backtesting of Economic Moats throws up several interesting findings. We finally
apply the same methodology to identify EMCs among Nifty constituents.
The Appendix (for the academically inclined) is where we share the methodology of
how we went about quantifying what is essentially a qualitative idea.

1812 December 2012
Wealth Creation Study 2007-2012 Theme 2013: Economic Moat
1. Introduction: Economic Moat – the what and the whyIn the long run, investors can earn only as much as the company itself earns
1.1 What is an Economic Moat?
"The idea of an economic moat refers to how likely a company is able to keep competitors
at bay for an extended period. One of the keys to finding superior long-term investments
is buying companies that will be able to stay one step ahead of their competitors."
- MorningStar, a US-based investment firm, which manages a Wide Moat Focus Index
The concept of 'Economic Moat' has its roots in the idea of a traditional moat. A moat is a
deep, wide trench, usually filled with water, that surrounds the rampart of a castle or fortified
place. In many cases, the waters are also infested with sharks and crocodiles to further keep
enemies at bay, and the inhabitants safe.
Akin to a moat, an Economic Moat protects a company's profits from being attacked by a
combination of multiple business forces. Traditional management theory terms such as
"Sustainable Competitive Advantage" or "Entry Barriers" essentially connote the idea of an
Economic Moat.
1.2 Why Economic Moat?
The dynamics of capitalism guarantee that competitors will repeatedly assault any
business "castle" that is earning high returns … Business history is filled with "Roman
Candles," companies whose moats proved illusory and were soon crossed."
- Warren Buffett in his 2007 letter to Berkshire Hathaway shareholders
The sole financial objective of companies is to maximize return on capital invested in their
business, and sustain the same for long periods of time. Capital always chases returns, and
hence will find its way to businesses with high profits and profitability. If a company running
a highly profitable enterprise does not have a deep and wide-enough Economic Moat,
competition from rivals will ensure that its high returns are reduced to the level of the
economic cost of capital (which includes a nominal level of profit).
From a broader perspective, companies do not compete only with rivals for profit. As Joan
Magretta says in her book Understanding Michael Porter –
"Companies are also engaged in a struggle for profits with their customers, who would
always be happier to pay less and get more.
They compete with their suppliers, who would always be happier to be paid more and
deliver less.
They compete with producers who make products that could, in a pinch, be substituted
for their own.
And they compete with potential rivals as well as existing ones, because even the
threat of new entrants places limits on how much they can charge their customers."

1912 December 2012
Wealth Creation Study 2007-2012 Theme 2013: Economic Moat
In this context, an Economic Moat or Sustainable Competitive Advantage is that which
helps a business sustain superior long-term profitability amidst various pulls and
pressures (commonly known as Michael Porter's Five Forces in management theory
parlance).
Porter's Five Forces of Industry Structure:Economic Moat helps a company sustain
superior profitability amidst these pulls and
pressures
1.3 Economic Moat and equity investing
"The number one idea is to view a stock as an ownership of the business and to judge the
staying quality of the business in terms of its competitive advantage."
- Charlie Munger, co-owner Berkshire Hathaway, in Poor Charlie's Almanack
In essence, equity investing is about forgoing purchasing power today for much higher
purchasing power in future, adjusted for inflation and net of taxes. Given this, much like
companies, equity investors too chase high returns on their investments. In the long run,
equity investors can only make as much money and return as the company itself makes.
Hence, it pays to invest in companies with formidable Economic Moats, as this is the only
way to ensure sustained superior profitability and wealth creation.
Markets world over are replete with examples of how companies with "deep, dangerous
moats" (read, sustainable competitive advantage) comprehensively outperform those
without such moats, both in terms of financial performance and stock returns. In the following
section, we present examples chosen from a va riety of sectors in India.
Threat ofsubstitute
products orservices
Threat of newentrants
Bargaining powerof buyers
Bargaining powerof suppliers
Rivalryamongexisting
competitors

2012 December 2012
Wealth Creation Study 2007-2012 Theme 2013: Economic Moat
The facts
Both Hero MotoCorp (then, Hero Honda)
and TVS Motor (then TVS Suzuki) started
business around the same time in the
1980s, when the Indian government
permitted foreign investment.
Both started off as Indo-Japanese joint
ventures - Hero Group with Honda and
TVS Group with Suzuki.
The Indian promoters in both ventures
had some background in India's
transportation business - Hero was
India's leading bicycle manufacturer, and
TVS group owned several auto ancillary
businesses.
Still, Hero MotoCorp has gone on to
become the world's largest two-wheeler
company, whereas TVS Suzuki is
struggling to retain its hitherto No. 3 spot
in India's motorcycle market.
The figures
FY12 Hero MotoCorp TVS Motor
Volume (m) 6.2 2.2
Mkt share (%) 40 14
Sales (INR b) 236 74
PAT (INR b) 22 1
RoE (%) 66 15
FY02-12:
Sales CAGR (%) 18 14
PAT CAGR (%) 17 11
Avg RoE (%) 56 14
The picture: 363% outperformance (10-yr)
1.3.1 Example #1: Hero MotoCorp v/s TVS Motor
0100
200300400500
600
700
Mar
-02
Mar
-03
Mar
-04
Mar
-05
Mar
-06
Mar
-07
Mar
-08
Mar
-09
Mar
-10
Mar
-11
Mar
-12
Hero MotoCorp - Rebas edTVS - Re bas ed
1.3.2 Example #2: Bharti Airtel v/s Tata Teleservices
The facts
Both Bharti and Tat a Tele were
incorporated in 1995 on the eve of India's
telecom boom. In fact, unlike Bharti, Tata
Tele had the rich legacy of India's
foremost business group.
Both companies have journeyed India's
wireless explosion, including a near total
value migration from wired telephony.
Today, Bharti is India's largest telecom
service provider, and was among India's
leading market cap companies before
the stock lost sheen on the back of
heightened domestic competition and
Bharti's own major foray into Africa.
In contrast, Tata Teleservices is yet to
report a single quarter of positive profit.
The figures
FY12 Bharti Airtel Tata Tele
Sales (INR b) 715 25
PAT (INR b) 43 -5
RoE (%) 8 -ve
FY02-12:
Sales CAGR (%) 47 25
PAT CAGR (%) Loss to Profit Loss to Loss
Avg RoE (%) 23 -9
The picture: 1240% outperformance (10-yr)
0
700
1,400
2,100
2,800
Ma
r-02
Ma
r-03
Ma
r-04
Ma
r-05
Ma
r-06
Ma
r-07
Ma
r-08
Ma
r-09
Ma
r-10
Ma
r-11
Ma
r-12
Tata Tele - Re bas edBharti - Reba sed

2112 December 2012
Wealth Creation Study 2007-2012 Theme 2013: Economic Moat
1.3.4 Example #4: HDFC Bank v/s Central Bank
The facts
Central Bank has recently completed
100 years of existence. HDFC Bank, in
contrast, is less than 20 years old.
Further, Central Bank's branches at
over 4,000 are 60% than HDFC Bank's
2,500. In contrast, HDFC Bank's ATMs at
almost 9,000 are 5x that of Central Bank.
Despite its huge early mover
advantage and seemingly wider reach,
Central Bank today significantly lags
HDFC Bank on all key performance
metrics - deposit base, loan book,
NPAs, ROTA, RoE, etc.
HDFC Bank's FY12 PAT is almost 10x that
of Central Bank, but even more
significantly, its current market cap is a
whopping 27x!
The figures
FY12 HDFC Bank Central Bank
Deposits (INR b) 2,465 1,962
Advances (INR b) 1,988 1,477
PAT (INR b) 52 6
RoE (%) 19 5
RoTA (%) 1.7 0.3
FY02-12:
PAT CAGR (%) 33 14
Avg RoE (%) 18 17
The picture: 230% outperformance (5-yr)
0
50
100
150
200
250
300
Aug
-07
Ma
y-08
Feb
-09
No
v-09
Aug
-10
Ma
y-11
Feb
-12
No
v-12
HDFC B ank - Reb ased Central Bank - Re base d
1.3.3 Example #3: L&T v/s HCC
The facts
Both L&T and HCC are long standing
companies in India's construction
industry. In fact, HCC was incorporated
as early as 1926, much earlier L&T in 1946.
Both companies are primarily engaged
in construction and related project
activities, and have been beneficiaries
of India's exponential growth in
infrastructure, real estate and
construction activity.
Today, L&T is not only India's largest
construction company, but also has
developed global competitive edge. A
la General Electric, it has also diversified
into businesses such as IT, finance and
power generation, and is poised to
progressively unlock value in them.
In contrast, HCC is struggling to remain
profitable, with additional troubles on
hand (BOT projects, environmental
issues in its Lavasa City project, etc).
The figures
FY12 L&T HCC
Sales (INR b) 643 82
PAT (INR b) 45 -4
RoE (%) 16 - ve
FY02-12:
Sales CAGR (%) 22 32
PAT CAGR (%) 32 Profit to Loss
Avg RoE (%) 22 11
The picture: 2800% outperformance (10-yr)
0
1,800
3,600
5,400
7,200
Ma
r-02
Ma
r-03
Ma
r-04
Ma
r-05
Ma
r-06
Ma
r-07
Ma
r-08
Ma
r-09
Ma
r-10
Ma
r-11
Ma
r-12
HCC - R ebas ed L&T - Reba sed
2212 December 2012
Wealth Creation Study 2007-2012 Theme 2013: Economic Moat
2. Factors determining Economic MoatWeave of industry structure and corporate strategy
"Why are some companies more profitable than others? … The answer has two parts.
First, companies benefit from (or are hurt by) the structure of their industry. Second, a
company's relative position within its industry can account for even more of the
difference."
- Joan Magretta in her book Understanding Michael Porter
Interestingly, a company's profitability and the strength of its Economic Moat are both
determined by the same set of factors: (1) Industry structure, and (2) Company's own strategy.
2.1 Role of industry structureThe industry structure that a company faces is the first-level macro determinant of a
company's profitability. As depicted by Porter's Five Forces Framework, the industry structure
may be highly favorable or highly unfavorable or, in most cases, somewhere in between.
A favorable industry structure implies that competitors are likely to sink whenever they
take the first step to breach it. On the other hand, an unfavorable industry structure makes
it easy for competitors to step in.
Whether an industry structure is favorable or not depends on several factors, some of
which are listed below:
Bargaining power with customers: This affects an industry's terms of trade on the revenue
side such as product prices, volume discounts, credit period to customers, ability to pass
on cost hikes, finished goods inventory levels, etc. Industries which supply to large,
consolidated or well-informed buyers are adversely placed and vice versa. Likewise, if
an industry's products can be easily substituted by buyers, it is adversely placed and
vica-versa.
Bargaining power with suppliers: This affects an industry's terms of trade on the cost
side such as cost of raw materials, credit period from suppliers, ability to defer cost
hikes, raw material inventory levels, wage negotiations with labor, etc. Industries with
large and consolidated suppliers (including strong worker unions) are unfavorably placed
and vice versa.
Entry barriers: Ease of entry decides how quickly supernormal profits can be leveled off
in an industry due to fresh entry of players. Some of the entry barriers to an industry
include high capital cost, access to distribution network, government regulations (e.g.
on imports, on safety and environment norms, etc).
Rapid changes in business environment: Industries which are vulnerable to rapid and
far-reaching changes in business environment are unfavorably placed vis-à-vis more
stable industries. For instance, companies in dynamic businesses face overnight
obsolescence if a better substitute product or emerges e.g. audio/video cassettes, film-
based photography, pagers, etc. This phenomenon is particularly true in businesses
involving high R&D spend such as healthcare and technology.
Government policy: Government policies on various aspects of doing business determine
whether or not an industry is favorably placed.

2312 December 2012
Wealth Creation Study 2007-2012 Theme 2013: Economic Moat
Examples of how industry factors which affect moat
Industry factor
1. Bargaining
power with
customers
2. Bargaining
power with
suppliers
3. Entry barriers
4. Government
policy
Examples of favorably placed
Computer chip industry
(duopoly)
OPEC (global bargaining
power)
Auto OEMs (buy from small
parts suppliers)
Large consumer and retail
companies e.g. Walmart
Indian banking (due to
licensing restrictions on new
entrants)
Industries with large capital
outlays and gestation period
such as Oil & Gas, Power,
Petrochemicals, Hotels, etc
Indian cigarettes industry (no
new entrant, whether local or
global)
Government ruling on
mandatory digitization is
highly favorable for Indian TV
industry
Examples of unfavorably placed
Auto ancillaries (supplies to
large OEMs)
Unorganized sector
Auto ancillaries
Plastic processors (purchase
from petchem giants)
Glass bottles industry (threat
of plastic bottles)
Internet-based businesses
Business without specialized
skill-sets e.g. general
manufacturing, travel agency,
etc
Many Indian power
generation companies operate
on regulated return on capital.
The Indian government's new
Drug Pricing Control Order is
likely to regulate selling prices
of several drugs, affecting the
Healthcare sector
52 49
28 27 26 24 23 22 20 19 19 19 18 18 18
17 15 14 13 12 10 8
Per
s. P
rod.
Proc
. Fo
od
Eng
ine
s
Ciga
rett
es
Oil
& G
as
Pai
nts
Ba
tte
rie
s
Bea
ring
s
Stee
l
Au
to -
CV
s
He
alth
care
Cem
ent
Ba
nks
Oil
Ref
inin
g
IT -
So
ftw
are
Aut
o -
2W
Tyre
s
NB
FCs
Re
tail
Con
stn/
Infr
a
Fert
ilize
rs
Tex
tile
s
Economic Moat Universe
Avg RoE: 18%
2.2 Role of company strategyWhile the moat created by the industry structure is broadly the same for all companies in
the sector, it is the company's strategy that further enhances the quality of this moat. A
weak company in any case remains vulnerable to incumbent rivals. Therefore, it is the
company's strategy which finally influences the quality of its moat, by making it dangerous
for others to try and breach it.
Interplay of various forces create wide variations in industry profitability

2412 December 2012
Wealth Creation Study 2007-2012 Theme 2013: Economic Moat
Very often, the term 'strategy' is confused with things like vision, goal, action plan, decision-
making, etc. However, strategy is all about ensuring that a company creates and/or maintains
its competitive edge over rivals i.e. at least defends its Economic Moat and ideally deepens
it. There are several frameworks for a company strategy. Here, we find that Porter's own
Value Chain framework integrates well with the concept of Economic Moat (see box below
for 5 key elements of Porter's strategy framework.).
Porter's Value Chain cum Strategy framework
A good strategy is one that will sustain superior economic performance for a company,
and must pass the following 5 tests -
1. Distinctive value proposition (to customers): This emerges from Porter's belief that
companies should not compete to be the best, but to be unique. Thus, the first step
to achieve this is to meet customer needs differently from rivals by (1) choosing the
target customer, (2) identifying the needs, and (3) creating a product or service which
addresses both (1) and (2).
2. Tailored Value Chain: A Value Chain is the sequence of activities that a company
performs to design, produce, sell, deliver, and support its products. In turn, it is part
of a company's larger Value System i.e. all activities and players involved to deliver its
value proposition, including suppliers, distribution channel, etc. A tailored value chain
makes a company's value proposition hard to replicate.
3. Trade-offs different from rivals: This essentially involves deciding on what a company
will or will not do, differently from its rivals e.g. budget airlines do not offer free food
and beverages on board, as they are targeting only those customers whose focus is
not food, bur rather to reach their destination faster (than rail, road, etc).
4. Fit across value chain: Fit determines how well the value chain activities connect
with each other to amplify the company's value proposition, thereby making it even
harder to replicate e.g. Globally, Domino's is focused on home delivery of pizzas.
Therefore, its outlets are smaller than those of Pizza Hut, which are designed for dine
in. In fact, even the Domino's pizza is tailored for home delivery so that it does not get
soft and soggy during delivery.
5. Continuity over time: Continuity gives an organization the time it needs to deepen its
understanding of the strategy. Sticking with a strategy allows a company to more
fully understand the value it creates and to become really good at it. Paradoxically,
continuity of strategy actually improves an organizations's ability to adapt to changes
and to innovate.
Positive impact
Strong brand and/or lowest cost
High focus on core competence
Scale and continuity through
innovation, steady capacity expansion
High level of ethics and compliance
with the law of the land
Balanced approach towards all
stakeholders – customers, employees,
shareholders, and society at large
Negative impact
No unique competitive advantage
Diversification into unrelated businesses
and/or new geographies
Attempt to achieve scale through large
acquisitions, whether domestic or global
Lapses in corporate governance by way of
unethical or illegal business practices
Excessive focus on shareholders, and that
too the majority owner-shareholders
Company's strategic issues which affect moat

2512 December 2012
Wealth Creation Study 2007-2012 Theme 2013: Economic Moat
2.2.1 Company strategy: Two case studiesWe present two case studies of Indian companies which illustrate the Value Chain framework.
Case Study #1: Jubilant Foodworks
The Strategy Framework: The "Domino" effect hits pizza demand
A. Brief description & backdrop
Jubilant Foodworks has entered into a Master Franchise Agreement with Domino's
International, which provides them with the exclusive right to develop and operate Domino's
pizza delivery stores in India, Nepal, Bangladesh and Sri Lanka. It is growing rapidly in terms
of sales, profits and market cap. Recently, it has also entered into a similar arrangement
with Dunkin' Donuts to offer a range of donuts and coffee. The menu has been customized
for India to include select Indian snack foods as well.
B. Nature of competition
Jubilant competes with QSRs (quick service restaurants) across categories - pizza (e.g. Pizza
Hut), burgers (e.g. McDonalds), other breads (e.g. Subway), Indian QSRs (e.g. Dosa Diner).
C. Strategy elements
1. Distinct value proposition
Hot, ready-to-eat food (pizza) delivered at your doorstep
2. Tailored value chain
Several, small outlets: Domino's has a large number of outlets across the country.
However, they are mostly small-sized outlets, designed to discourage dine-in, as
their core proposition is home delivery.
All owned outlets: All of Jubilant Foodworks outlets are company owned and
operated to ensure no compromise on quality.
Pizza more suited for home delivery vis-à-vis rivals: The pizza dough, other materials
used and the baking process of Domino's allows for pizzas to remain fresher and
crisper after budgeting delivery time. (Pizza of rivals are more designed for dine-in,
and tend to get softer and soggier during the process of home delivery.)
3. Trade-offs
Yes to home delivery, no to dine-in: This is the very first trade-off in the sense that
Domino's outlets actually discourage dine-in.
Yes to pizza and related products, no to others: Domino's is focused only on pizzas
and related side-dishes like garlic bread and cake.
Yes to company owned outlets, no to franchising (as explained earlier).
4. Fit across value chain
Product fit: The pizza is more suited for home delivery vis-à-vis rivals.
Place fit: Smaller outlets save on rentals, and make up for the occasional dine-in
customers that may be lost.
Promotion fit: Every pizza delivered is accompanied by a discount coupon on the
next purchase with time validity. This induces repeat purchase.
Ordering channel fit: To ensure that it does not lose orders on account of busy phone
lines, and to save on high manpower costs, Domino's is encouraging orders to be
placed online by marginally lower pricing.

2612 December 2012
Wealth Creation Study 2007-2012 Theme 2013: Economic Moat
5. Continuity over time
Nascent market: The pizza market in India is nascent and has tremendous room for
growth. Jubilant is well placed to leverage its competitive advantage to gain massive
scale.
Expansion: Jubilant is continuously adding outlets and entering new cities – within a
short span of time, it has established its presence in over 105 cities with over 465
outlets.
Replication of Domino's story: Cash flows from Domino's are being ploughed to
replicate the Domino success story with Dunkin' Donuts. The donuts category is
currently at the same stage as pizza was when Jubilant entered the business.
Domino's and Dunkin' may well prove to be a highly successful combination, making
Jubilant's Economic Moat a "Deep & Dangerous" one.
D. The Success Payoff
Sales and PAT Chart Stock Price Chart
Case Study #2: Bajaj Auto
The Strategy Framework: Re-Discover lost Economic Moat
A. Brief description & backdrop
Bajaj Auto is one of India's earliest manufacturers of two-wheelers. The scooter was the
company's staple product for several years. With scooters as the core, the positioning was
extended to mopeds and 3-wheelers. In the 1990s, Bajaj Auto's Economic Moat was severely
dented by -
(1) The entry of motorcycles; and
(2) The introduction of the gearless scooter by Honda under Kinetic Honda.
The current Managing Director Mr Rajiv Bajaj took over the reins from his father and
predecessor Mr Rahul Bajaj in early 2000s.
B. Nature of competitionCompetition was intense with the onset of Indo-Japanese motorcycles on the one hand
(Hero Honda, TVS Suzuki and Escorts Yamaha), and gearless scooters by Honda on the other.
Bajaj's then existing products soon lost their value proposition. Subsequently, Rajiv Bajaj
revived the company's competitive advantage. The elements of the strategy he pursued
are as given in the following section.
0
100
200
300
400
500
600
700
Aug
-07
No
v-0
7
Feb
-08
Ma
y-0
8
Aug
-08
No
v-0
8
Feb
-09
Ma
y-0
9
Aug
-09
No
v-0
9
Feb
-10
Ma
y-1
0
Ju bi lant - Reb ase d Sens ex - R ebas ed
2,360 2,806
4,755
10,189
6,783
1,077
721
333
7984
FY08 FY09 FY10 FY11 FY12
Sales (INR m) PAT (INR m)

2712 December 2012
Wealth Creation Study 2007-2012 Theme 2013: Economic Moat
115164
196
87 84
3128
17
68
FY08 FY09 FY10 FY11 FY12
Sa les (INR b) PAT (INR b)
0
100
200
300
400
500
600
700
Aug
-07
Feb-
08
Aug
-08
Feb-
09
Aug
-09
Feb-
10
Aug
-10
Feb-
11
Aug
-11
Feb-
12Ba ja j Auto - Rebased Sensex - Rebased
C. Strategy elements
1. Distinct value proposition
Sportier, powerful bike: Bajaj positioned itself firmly in the upwards of 125cc market
with Discover and Pulsar brands. The products were positioned as sporty and powerful,
vis-à-vis the typical Indo-Japanese bikes positioning of light and fuel-efficient
vehicles.
2. Tailored value chain
Focus on urban youth: The product positioning was in line with the marketing focus
on urban youth.
Lower emphasis on mother brand 'Bajaj' in favor of product brands: All of Bajaj's
advertising is focused on promoting the product sub-brands such as Discover and
Pulsar, as the Bajaj brand is associated with a wide range of products - from fans to
hair oil.
Leveraging domestic scale efficiencies to export competitively priced motorcycles:
Bajaj exports its bikes to other developing countries e.g. in Africa.
3. Trade-offs
Yes to motorcycles, no to scooters: Bajaj does not sell even a single scooter today.
Yes to premium powerful, sporty bikes, no to entry-level bikes: Bajaj sells a very
small quantity of mass market bikes.
Yes to two-wheelers, no to cars or other vehicles
4. Fit across value chain
There is a strong fit within Bajaj Auto's product positioning, promotion and pricing,
all combining to make Bajaj Auto one of the most profitable two wheeler companies
in the world.
5. Continuity over time
The company has acquired a 50% stake in KTM, an Austrian manufacturer of sports
bikes, to further fortify its global competitive advantage.
D. The Success Payoff
Sales and PAT Chart Stock Price Chart
2812 December 2012
Wealth Creation Study 2007-2012 Theme 2013: Economic Moat
3. Applying Economic Moat concept to investingBuy profit castles with deep and dangerous moats
"Competitive strategy analysis lies at the heart of security analysis."
- Alfred Rappaport & Michael Mauboussin, in their book Expectations Investing
A truly great business must have an enduring "moat" that protects excellent returns on
invested capital.
- Warren Buffett in his 2007 letter to Berkshire Hathaway shareholders
The concept of Economic Moat has implications for both companies and investors -
For companies: Truly successful companies are those which intricately weave industry
structure and their own strategy to create and defend an unbreachable Economic Moat,
ensuring superior profits and high profitability over peers for generations.
For investors: Investors can use the above frameworks to actively seek out companies
with "Deep & Dangerous Moats", run by "honest and decent leaders" (to use Buffett's
words). This way, investors can ensure that they continue to enjoy their share of the
"gold" which the leaders make within the safety of their moat.
In the subsequent sections, we -
1. Present our findings of backtesting the concept of Economic Moat investing, and
demonstrate how the strategy works extremely well for equity investing; and
2. Apply the same methodology to Nifty constituent companies both then and now.
3.1 Backtesting the Economic Moat investing hypothesisAs stated through this report, companies with "deep and/or dangerous" moat tend to enjoy
superior profits and profitability for sustained periods of time. Thus, such companies are
widely acknowledged by the markets as great companies, giving rise to the often heard
quote – "great companies are rarely great stocks". The seeming rationale behind this is that
while there is no denying the high quality of EMCs (Economic Moat Companies), their
premium valuations ensure that they do not generate adequate returns on the bourses.
Accordingly, we backtested the Economic Moat hypothesis over the 17 years between 1995
and 2012. In this section, we present our key steps and findings of the backtest.
Step 1: The Economic Moat hypothesisInvesting in a portfolio of companies of EMCs should lead to sustained outperformance
over benchmark indices across years, irrespective of market conditions.
(Note: The keyword here is portfolio of companies. Else, critics are prone to point out the
one-off cases of a Hindustan Unilever underperforming for almost 11 years since 1994 or an
Infosys underperforming for 10 years since its peak of 2000.)
Step 2: Establishing criteria for Economic MoatThis was the key challenge for our backtesting as Economic Moat is a highly qualitative
concept, not easily reducible to numbers. So, in deciding our final methodology, we applied
two key principles of Economic Moat -
1. A company's Economic Moat needs to ultimately reflect in its financials with return on
investment significantly superior to peers.

2912 December 2012
Wealth Creation Study 2007-2012 Theme 2013: Economic Moat
2. Economic Moat or competitive advantage holds true only within a particular sector and
not across sectors. Thus, a consumer facing company enjoying RoE in excess of 50%
cannot be deemed to enjoy a superior over a bank which earns 20% RoE.
For the academically inclined, we present our full methodology on page 35. In essence, we
compared RoE of companies in the same sector vis-à-vis the sector average for 8 years 1995
to 2002. Companies whose RoE was higher than sector average for 6 years or more were
deemed to enjoy an Economic Moat. Having flagged off companies with or without Economic
Moat, we observed their stock performance over next 10 years to 2012.
Step 3: The findingsWe believe our backtesting has thrown up several interesting findings, many of them
counterintuitive.
Finding #1 - EMCs handsomely outperformA portfolio of companies with Economic Moat bought and held for 10 years comfortably
outperforms benchmark indices every year over the next 10 years. Further even in terms of
annual return, performance of EMCs matches that of non-EMCs for the initial 3 years, before
meaningful outperformance sets in from Year 4 every year. Besides, average stock returns
on EMCs are 2x that of non-EMCs.
Chart showing performance of Sensex, EMCs and non-EMCs rebased
Finding #2 - EMCs' outperformance is earnings and valuations agnosticThis is arguably one of the most liberating conclusions from the investor's perspective.
Most investors are faced with two ordeals - (1) forecasting earnings of stocks, and (2)
assessing market's likely valuation of the stock based on the same. However, in our testing,
we applied no criteria (past, present or future) other than that of Economic Moat, which is
a far easier call to make than a stock's future earnings growth and valuation.
The most plausible explanation for this is as follows -
Earnings agnosticism arises from EMCs' strong competitive advantage which ensures
that they enjoy a more-than-fair share of the growth inherent in most sectors in India.
Valuation agnosticism may well be explained by the phenomenon of continuous rollover
of EMCs' competitive advantage period (CAP), as explained in the box on page 30.
-15
0
15
30
45
60
FY03 FY04 FY05 FY06 FY07 FY08 FY09 FY10 FY11 FY12
Non-EMCs EMCs Sens ex

3012 December 2012
Wealth Creation Study 2007-2012 Theme 2013: Economic Moat
Why EMCs delivery healthy returns over time despite premium valuationsWorld over, even seasoned investors struggle to explain a profound mystery: Why do
companies with strong franchises (i.e. deep Economic Moat) continue to outperform the
market despite their perennial rich valuations? The answer may well lie in the continuous
roll-over of these companies' competitive advantage period or CAP.
What is CAP?
Competitive advantage period (CAP) is the
time during which a company is expected to
generate returns on incremental investment
that exceed its cost of capital. As discussed in
the context of Economic Moat, if a company
earns supernormal return on its invested
capital, its business will attract competitors
that will accept lower returns, eventually
driving down overall industry returns to
economic cost of capital, and sometimes even
below it. (The Indian telecom industry is
currently a classic case of this phenomenon.)
The idea of CAP is graphically presented alongside. Obviously, longer the CAP, the better
it is for both the company and its investors.
CAP rollover: Excess returns of EMCs explained
Markets are generally efficient and do indeed
assign premium valuations to EMCs (Economic
Moat Companies), given their reasonably
accurate assessment that such companies
enjoy a very long CAP.
Where the markets fail is in recognizing that
barring a low mortality rate of less than 15%,
these EMCs continue to draw upon the
strength of their moat and sustain their high
return with passage of time. Thus, as brilliantly
put by Michael Mauboussin in a paper written
way back in 1997 that with each passing year,
the CAP period of EMCs simply rolls over,
creating incremental excess return for investors in these stocks, as represented alongside.
This rollover phenomenon continues so long as EMCs successfully at least defend (if not
deepen) their moat, leading to their stock achieving both sustained outperformance in
the markets, despite their premium valuations.
Rateof
Return
WACC
Time (in year)
CAP
Competitive forces work tobring down excess return
Return=WACC
Markets intuitively value companies based onCAP …
Rate
ofReturn
WACC
0 Year 1 Time (in year)
CAP rolls over by 1 year
Incremental excess return
Return=WACC
… but markets are unable to appropriatelyvalue EMCs whose CAP rolls over with everypassing period
ExcessReturn

3112 December 2012
Wealth Creation Study 2007-2012 Theme 2013: Economic Moat
43 4336 35 34 32 30 28 28 27 27 25
11171820212121222223
Ste
el
Ba
tter
ies
Ret
ail
Cons
tn/I
nfr
a
Bea
ring
s
Pain
ts
Fer
tili
zers
Fin
anc
e
Ban
ks
Aut
o (C
Vs)
Tyr
es
Cig
aret
tes
Eng
ine
s
Pers
. Pr
od.
Pro
c. F
ood
Oil
& G
as
Cem
ent
IT -
So
ftw
are
Au
to (
2W)
Hea
lthc
are
Tex
tile
s
Oil
Ref
inin
g
Sensex CAGR (03‐1 2): 18%
Average return of all EMCs: 25 %
Finding #3 - EMCs' outperformance is sector agnosticStocks of EMCs are likely to outperform benchmarks across sectors, even if the sector itself
is out of market favor. Thus, out of our 22 homogenous sector groupings, EMCs
underperformed the BSE Sensex in only two sectors – Oi l Refining and Texti les
EMCs underperformed the benchmark on only 1 out of 22 sectors
Earnings Moat (1995-2002)
Sector Y N Avg Price
(74 cos) (103 cos) CAGR (2003-12)
Auto Ancillaries - Batteries 43 43
Auto Ancillaries - Bearings 34 34
Auto Ancillaries - Tyres 27 13 19
Automobile - 2W 20 -13 -2
Automobile - CV 27 20 22
Banks 28 28 28
Capital Goods - Engines 23 56 34
Cement 21 25 24
Cigarettes 25 25
Construction / Infrastructure 35 17 23
Fertilizers 30 22 25
Finance 28 13 22
IT - Software 21 -17 -10
Metals & Mining - Steel 43 27 33
Oil & Gas 21 21
Oil & Gas - Refining 11 16 12
Paints 32 33 32
Personal Products 22 22
Pharmaceuticals 18 13 14
Processed Food 22 22
Retai l 36 10 15
Te xt i les 17 10 11
Average return 25 12 18
Price CAGR performance of EMCs by sector
Note: Shaded area is to indicate which of the two group of stocks has outperfomed in a sector
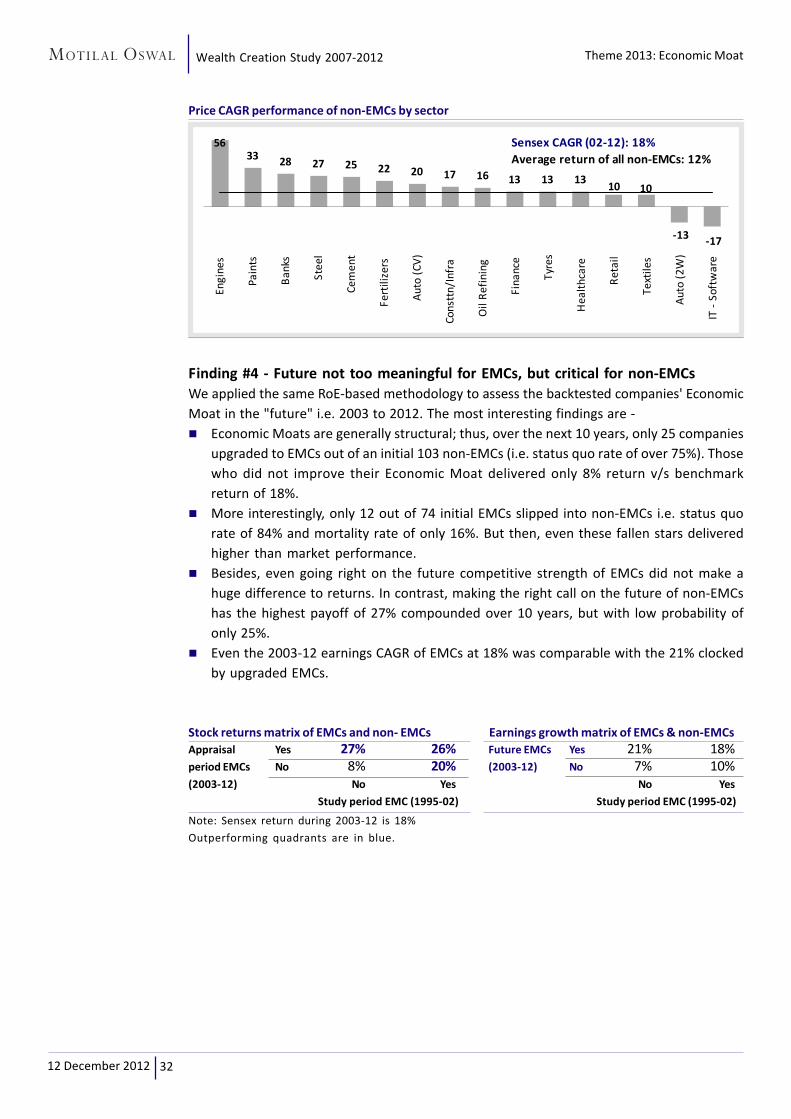
3212 December 2012
Wealth Creation Study 2007-2012 Theme 2013: Economic Moat
5633 28 27 25 22 20 17 16 13 13 13
-17-13
1010
Engi
nes
Pain
ts
Ban
ks
Ste
el
Cem
ent
Fer
tili
zers
Au
to (
CV
)
Con
sttn
/Inf
ra
Oil
Re
fin
ing
Fina
nce
Tyr
es
Hea
lth
care
Ret
ail
Text
iles
Au
to (
2W
)
IT -
Sof
twar
e
Sensex CAGR (02-12): 18%
Average return of all non-EMCs: 12%
Price CAGR performance of non-EMCs by sector
Finding #4 - Future not too meaningful for EMCs, but critical for non-EMCsWe applied the same RoE-based methodology to assess the backtested companies' Economic
Moat in the "future" i.e. 2003 to 2012. The most interesting findings are -
Economic Moats are generally structural; thus, over the next 10 years, only 25 companies
upgraded to EMCs out of an initial 103 non-EMCs (i.e. status quo rate of over 75%). Those
who did not improve their Economic Moat delivered only 8% return v/s benchmark
return of 18%.
More interestingly, only 12 out of 74 initial EMCs slipped into non-EMCs i.e. status quo
rate of 84% and mortality rate of only 16%. But then, even these fallen stars delivered
higher than market performance.
Besides, even going right on the future competitive strength of EMCs did not make a
huge difference to returns. In contrast, making the right call on the future of non-EMCs
has the highest payoff of 27% compounded over 10 years, but with low probability of
only 25%.
Even the 2003-12 earnings CAGR of EMCs at 18% was comparable with the 21% clocked
by upgraded EMCs.
Stock returns matrix of EMCs and non- EMCs Earnings growth matrix of EMCs & non-EMCs
Appraisal Yes 27% 26% Future EMCs Yes 21% 18%period EMCs No 8% 20% (2003-12) No 7% 10%(2003-12) No Yes No Yes
Study period EMC (1995-02) Study period EMC (1995-02)
Note: Sensex return during 2003-12 is 18%
Outperforming quadrants are in blue.

3312 December 2012
Wealth Creation Study 2007-2012 Theme 2013: Economic Moat
EMCs's stock performance is even future agnostic!
Sector EMC (Current Yes; 74 cos) EMC (Current No; 103 cos) Sector Avg
Current-Future Current-Future Price CAGR
Y-Y (62 cos) Y-N (12) N-Y (25) N-N (78) (177 cos)
Auto Ancillaries - Batteries 43 43
Auto Ancillaries - Bearings 39 23 34
Auto Ancillaries - Tyres 27 29 5 19
Automobile - 2W 20 -13 -2
Automobile - CV 27 20 22
Banks 31 16 33 26 28
Capital Goods - Engines 29 18 56 34
Cement 21 28 24 24
Cigarettes 25 25
Construction / Infrastructure 35 19 16 23
Fertilizers 35 21 27 19 25
Finance 27 34 13 22
IT - Software 15 33 7 -26 -10
Metals & Mining - Steel 43 34 23 33
Oil & Gas 21 21
Oil & Gas - Refining 8 16 10
Paints 32 33 32
Personal Products 22 22
Pharmaceuticals 20 10 31 6 14
Processed Food 22 22
Retai l 36 57 -1 15
Texti les 24 3 15 9 11
Average Price CAGR 26 20 27 8 18
3.4 Applying the methodology on Nifty stocksWe backtested our EMC hypothesis on companies which constituted the Nifty in 2002. 38 of
50 companies were common between then Nifty and our Economic Moat Universe of 177
companies. Of these, 29 companies were deemed to be EMCs then and 9 companies to be
non-EMCs. During the price performance period 2003-12, the EMCs clocked price CAGR of
22% v/s 16% for non-EMCs and overall return of 20%.
Further, applying the future EMC test also threw up results similar to that of the broader
universe –
22 of the 29 initial EMCs remained EMCs, but the total return remained the same at 22%
CARG.
7 companies regressed to non-EMC and delivered 14% CAGR.
3 of the 9 initial non-EMCs maintained status quo and returned only 4% CAGR.
The balance 6 non-EMCs upgraded to turn EMCs, and delivered returns of 21%, in line
with that of status quo EMCs.
Avg stock returns on 2002 Nifty EMCs non-EMCS Avg stock returns matrix on Nifty constituents
Price CAGR % No. of cos. Future EMC Yes 21% 22%
EMCs 22 29 (2003-12) No 4% 14%Non-EMCs 16 9 No Yes
Overall 20 38 Study period ECM (1995-02)
Note: Sensex return during 2003-12 is 18%
Outperforming quadrants are in blue.

3412 December 2012
Wealth Creation Study 2007-2012 Theme 2013: Economic Moat
4. Conclusions
Consumer sector has bounced back into wealth creation - ITC is the largest wealth creator,
TTK Prestige the fastest and Hindustan Unilever is back in the top 10.
Financials has emerged the largest wealth creating sector for the second time in a row.
Absence of new entrants is leading to widespread profitability and stock performance.
Economic Moat protects the profit of companies from competitive attack.
Extended CAP (competitive advantage period) of Economic Moat Companies (EMCs)
leads to superior levels of profits and stock returns.
Over 2002-2012, EMCs in India have meaningfully outperformed benchmark indices.
Breach of Economic Moat causes massive wealth destruction e.g. the Telecom sector has
moved from a leading wealth creating sector 4 years ago to the top wealth destroyer in
2012.
Markets seem poised to touch new highs in the next 12 months.
Nifty constituents: EMCs and non-EMCs
Nifty EMCs (27 companies) Nifty non-EMCs (23 companies)
Asian Paints Kotak Mahindra Bank ACC ICICI Bank
Axis Bank Larsen & Toubro Ambuja Cem. JP Associates
Bajaj Auto Lupin B H E L Power Grid Corpn
Bharti Airtel M & M B P C L Ranbaxy Labs
Coal India Maruti Suzuki Bank of Baroda Reliance Inds
GAIL (India) NTPC Cairn India Reliance Infra
Grasim Inds O N G C Cipla Siemens
H D F C Punjab National Bank DLF Tata Motors
HDFC Bank Sesa Goa Dr Reddy's Labs Tata Power
Hero MotoCorp State Bank of India HCL Technologies Tata Steel
Hind Unilever Sun Pharma Hindalco Inds Wipro
Infosys TCS I D F C
ITC UltraTech Cement
Jindal Steel
Based on our backtesting methodology, the current constituent companies of Nifty can be
classified as ECMs as non-ECMs as tabled below. If our findings hold going forward (and we
have reasons to believe they will), the ECMs among Nifty should meaningfully outperform
both the non-ECMs and overall Nifty index.
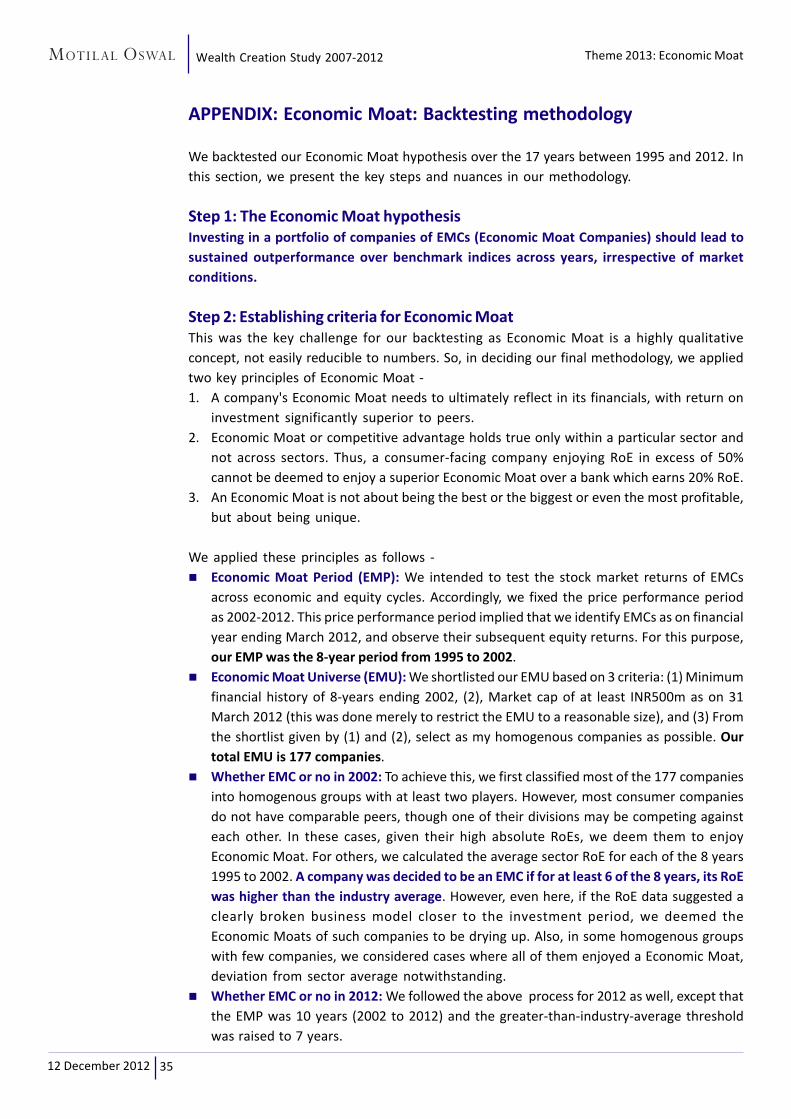
3512 December 2012
Wealth Creation Study 2007-2012 Theme 2013: Economic Moat
APPENDIX: Economic Moat: Backtesting methodology
We backtested our Economic Moat hypothesis over the 17 years between 1995 and 2012. In
this section, we present the key steps and nuances in our methodology.
Step 1: The Economic Moat hypothesisInvesting in a portfolio of companies of EMCs (Economic Moat Companies) should lead to
sustained outperformance over benchmark indices across years, irrespective of market
conditions.
Step 2: Establishing criteria for Economic MoatThis was the key challenge for our backtesting as Economic Moat is a highly qualitative
concept, not easily reducible to numbers. So, in deciding our final methodology, we applied
two key principles of Economic Moat -
1. A company's Economic Moat needs to ultimately reflect in its financials, with return on
investment significantly superior to peers.
2. Economic Moat or competitive advantage holds true only within a particular sector and
not across sectors. Thus, a consumer-facing company enjoying RoE in excess of 50%
cannot be deemed to enjoy a superior Economic Moat over a bank which earns 20% RoE.
3. An Economic Moat is not about being the best or the biggest or even the most profitable,
but about being unique.
We applied these principles as follows -
Economic Moat Period (EMP): We intended to test the stock market returns of EMCs
across economic and equity cycles. Accordingly, we fixed the price performance period
as 2002-2012. This price performance period implied that we identify EMCs as on financial
year ending March 2012, and observe their subsequent equity returns. For this purpose,
our EMP was the 8-year period from 1995 to 2002.
Economic Moat Universe (EMU): We shortlisted our EMU based on 3 criteria: (1) Minimum
financial history of 8-years ending 2002, (2), Market cap of at least INR500m as on 31
March 2012 (this was done merely to restrict the EMU to a reasonable size), and (3) From
the shortlist given by (1) and (2), select as my homogenous companies as possible. Our
total EMU is 177 companies.
Whether EMC or no in 2002: To achieve this, we first classified most of the 177 companies
into homogenous groups with at least two players. However, most consumer companies
do not have comparable peers, though one of their divisions may be competing against
each other. In these cases, given their high absolute RoEs, we deem them to enjoy
Economic Moat. For others, we calculated the average sector RoE for each of the 8 years
1995 to 2002. A company was decided to be an EMC if for at least 6 of the 8 years, its RoE
was higher than the industry average. However, even here, if the RoE data suggested a
clearly broken business model closer to the investment period, we deemed the
Economic Moats of such companies to be drying up. Also, in some homogenous groups
with few companies, we considered cases where all of them enjoyed a Economic Moat,
deviation from sector average notwithstanding.
Whether EMC or no in 2012: We followed the above process for 2012 as well, except that
the EMP was 10 years (2002 to 2012) and the greater-than-industry-average threshold
was raised to 7 years.
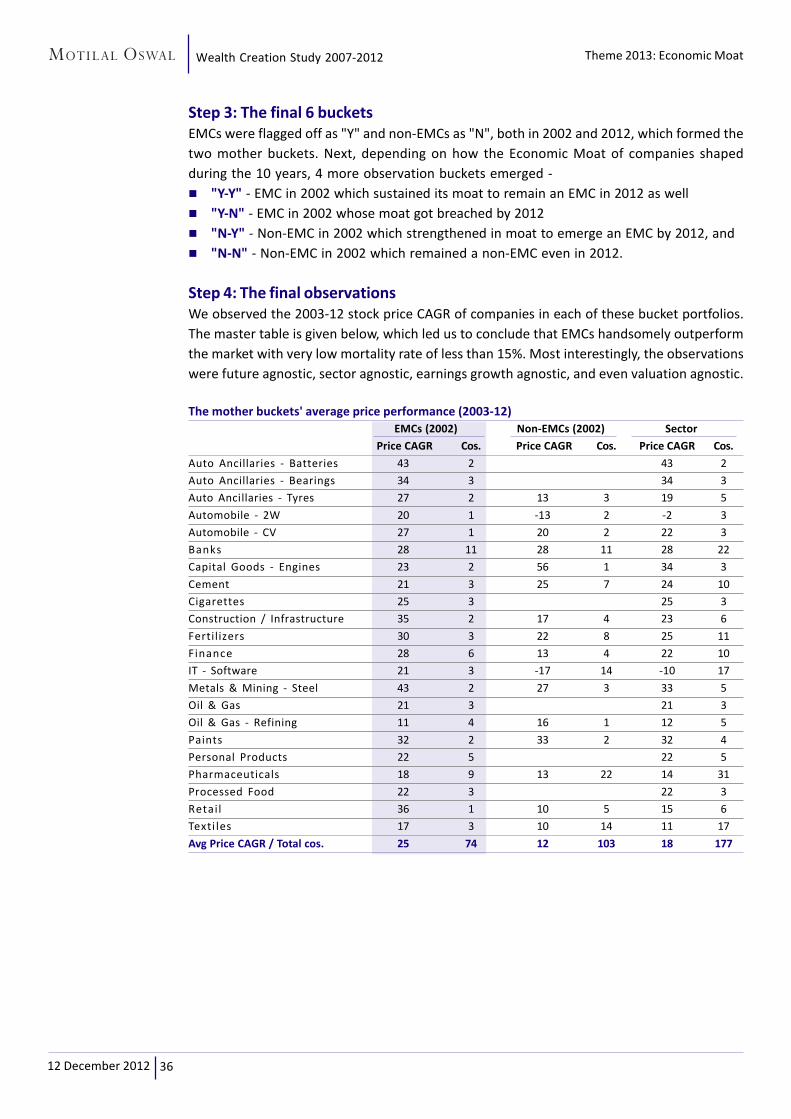
3612 December 2012
Wealth Creation Study 2007-2012 Theme 2013: Economic Moat
Step 3: The final 6 bucketsEMCs were flagged off as "Y" and non-EMCs as "N", both in 2002 and 2012, which formed the
two mother buckets. Next, depending on how the Economic Moat of companies shaped
during the 10 years, 4 more observation buckets emerged -
"Y-Y" - EMC in 2002 which sustained its moat to remain an EMC in 2012 as well
"Y-N" - EMC in 2002 whose moat got breached by 2012
"N-Y" - Non-EMC in 2002 which strengthened in moat to emerge an EMC by 2012, and
"N-N" - Non-EMC in 2002 which remained a non-EMC even in 2012.
Step 4: The final observationsWe observed the 2003-12 stock price CAGR of companies in each of these bucket portfolios.
The master table is given below, which led us to conclude that EMCs handsomely outperform
the market with very low mortality rate of less than 15%. Most interestingly, the observations
were future agnostic, sector agnostic, earnings growth agnostic, and even valuation agnostic.
The mother buckets' average price performance (2003-12)
EMCs (2002) Non-EMCs (2002) Sector
Price CAGR Cos. Price CAGR Cos. Price CAGR Cos.
Auto Ancillaries - Batteries 43 2 43 2
Auto Ancillaries - Bearings 34 3 34 3
Auto Ancillaries - Tyres 27 2 13 3 19 5
Automobile - 2W 20 1 -13 2 -2 3
Automobile - CV 27 1 20 2 22 3
Banks 28 11 28 11 28 22
Capital Goods - Engines 23 2 56 1 34 3
Cement 21 3 25 7 24 10
Cigarettes 25 3 25 3
Construction / Infrastructure 35 2 17 4 23 6
Fertilizers 30 3 22 8 25 11
Finance 28 6 13 4 22 10
IT - Software 21 3 -17 14 -10 17
Metals & Mining - Steel 43 2 27 3 33 5
Oil & Gas 21 3 21 3
Oil & Gas - Refining 11 4 16 1 12 5
Paints 32 2 33 2 32 4
Personal Products 22 5 22 5
Pharmaceuticals 18 9 13 22 14 31
Processed Food 22 3 22 3
Retai l 36 1 10 5 15 6
Texti les 17 3 10 14 11 17
Avg Price CAGR / Total cos. 25 74 12 103 18 177

3712 December 2012
Wealth Creation Study 2007-2012
Wealth Creation
2007-2012The 17TH Annual Study
Market Outlook
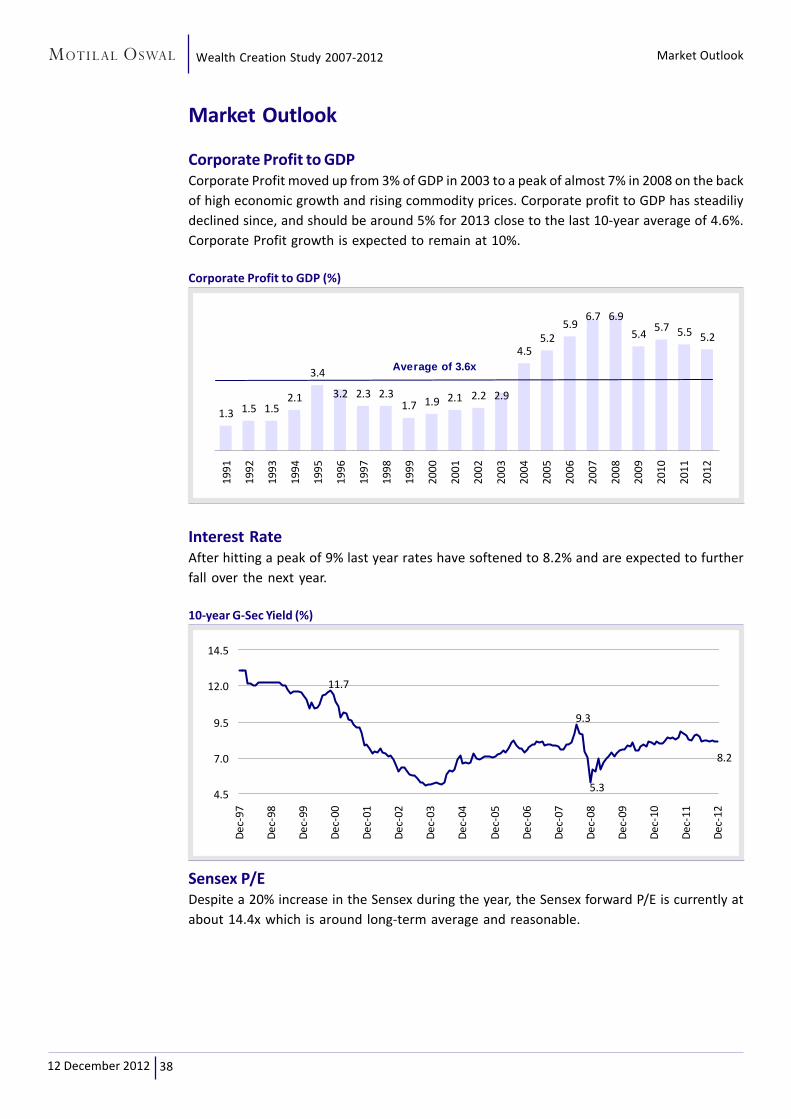
3812 December 2012
Wealth Creation Study 2007-2012 Market Outlook
Market Outlook
Corporate Profit to GDPCorporate Profit moved up from 3% of GDP in 2003 to a peak of almost 7% in 2008 on the back
of high economic growth and rising commodity prices. Corporate profit to GDP has steadiliy
declined since, and should be around 5% for 2013 close to the last 10-year average of 4.6%.
Corporate Profit growth is expected to remain at 10%.
Corporate Profit to GDP (%)
Interest RateAfter hitting a peak of 9% last year rates have softened to 8.2% and are expected to further
fall over the next year.
10-year G-Sec Yield (%)
Sensex P/EDespite a 20% increase in the Sensex during the year, the Sensex forward P/E is currently at
about 14.4x which is around long-term average and reasonable.
1.3 1.5 1.52.1
3.4
2.3 2.31.7 1.9 2.1 2.2
4.55.2
5.96.7 6.9
5.45.7 5.5 5.2
3.2 2.9
199
1
199
2
199
3
199
4
199
5
199
6
199
7
199
8
199
9
200
0
200
1
200
2
200
3
200
4
200
5
200
6
200
7
200
8
200
9
201
0
201
1
201
2
Average of 3.6x
11.7
9.3
5.3
8.2
4.5
7.0
9.5
12.0
14.5
De
c-97
De
c-98
De
c-99
De
c-00
De
c-01
De
c-02
De
c-03
De
c-04
De
c-05
De
c-06
De
c-07
De
c-08
De
c-09
De
c-10
De
c-11
De
c-12

3912 December 2012
Wealth Creation Study 2007-2012
Sensex P/E (x)
Earnings Yield to Bond YieldThe current Earnings Yield to Bond Yield at 0.9x is just below parity, and is reasonable in the
backdrop of current high interest rates, and expected fall in rates over the next one year.
Sensex Earning Yield to Bond Yield (x) Market Cap to GDP (%)
Sensex EPS
ConclusionEarnings growth of around 10%, imminent moderation in interest rate, and reasonable current
valuation has improved the probability of the market going into new highs in the next 12
months.
820 834
1,389
1,2151,124
1,024
833718
523450348
27223621628027829126625018112981
FY93
FY94
FY95
FY96
FY97
FY98
FY99
FY00
FY01
FY02
FY03
FY04
FY05
FY06
FY07
FY08
FY09
FY10
FY11
FY12
FY1
3E
FY1
4E
FY93-96:
45% CAGR
FY96-03: 1% CAGR
FY03-08:
25% CAGR
FY08-12E:
8% CAGR
FY12-14E:
11% CAGR
24.6
16.5
10.37
12
17
22
27
Dec
-12
Jun-
12
Dec
-11
Jun-
11
Dec
-10
Jun-
10
Dec
-09
Jun-
09
Dec
-08
Jun-
08
Dec
-07
Jun-
07
Dec
-06
Jun-
06
Dec
-05
Jun-
05
Dec
-04
Jun-
04
Dec
-03
Jun-
03
Dec
-02
10 Year Avg: 14.9x
2.0
0.5
0.9
0.2
0.7
1.2
1.7
2.2
De
c-97
Jun
-99
De
c-00
Jun
-02
De
c-03
Jun
-05
De
c-06
Jun
-08
De
c-09
Jun
-11
De
c-12
15 Year Avg is 0.92x 53
103
70
15
40
65
90
115
199
1
199
4
199
7
200
0
200
3
200
6
200
9
201
2
Avg of 50%
for the period
Market Outlook
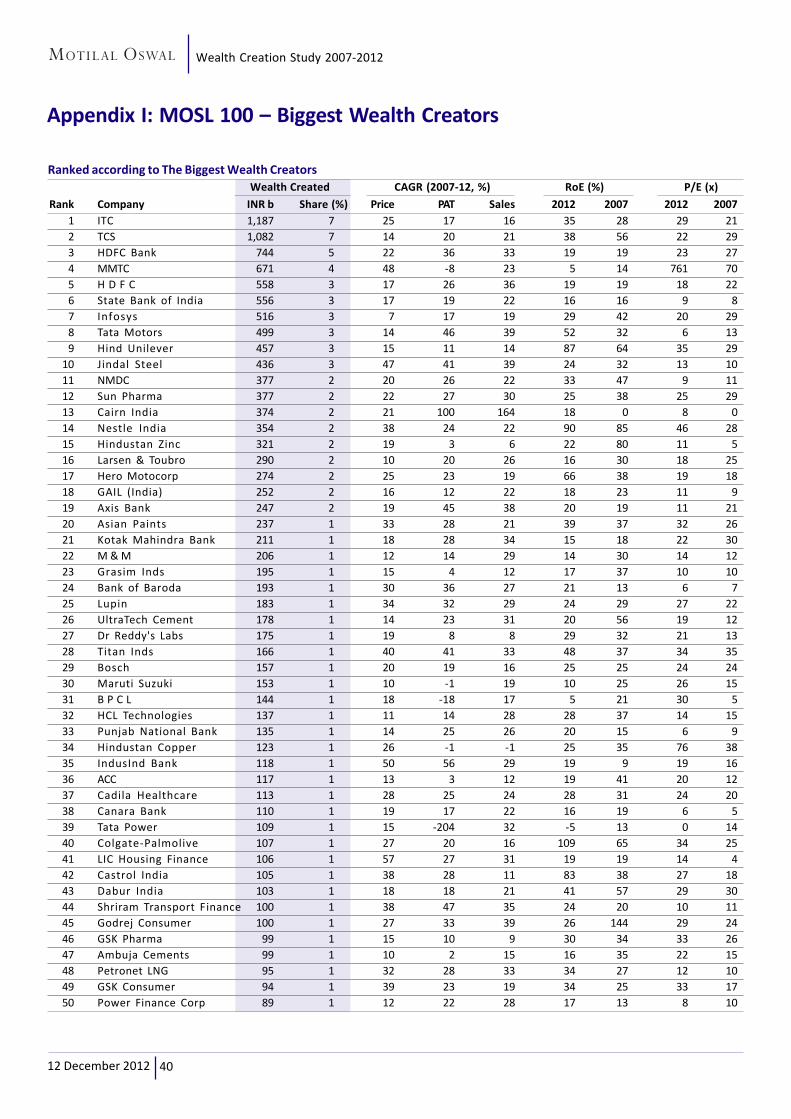
4012 December 2012
Wealth Creation Study 2007-2012
Appendix I: MOSL 100 – Biggest Wealth Creators
Ranked according to The Biggest Wealth Creators
Wealth Created CAGR (2007-12, %) RoE (%) P/E (x)
Rank Company INR b Share (%) Price PAT Sales 2012 2007 2012 2007
1 ITC 1,187 7 25 17 16 35 28 29 21
2 TCS 1,082 7 14 20 21 38 56 22 29
3 HDFC Bank 744 5 22 36 33 19 19 23 27
4 MMTC 671 4 48 -8 23 5 14 761 70
5 H D F C 558 3 17 26 36 19 19 18 22
6 State Bank of India 556 3 17 19 22 16 16 9 8
7 Infosys 516 3 7 17 19 29 42 20 29
8 Tata Motors 499 3 14 46 39 52 32 6 13
9 Hind Unilever 457 3 15 11 14 87 64 35 29
10 Jindal Steel 436 3 47 41 39 24 32 13 10
11 NMDC 377 2 20 26 22 33 47 9 11
12 Sun Pharma 377 2 22 27 30 25 38 25 29
13 Cairn India 374 2 21 100 164 18 0 8 0
14 Nestle India 354 2 38 24 22 90 85 46 28
15 Hindustan Zinc 321 2 19 3 6 22 80 11 5
16 Larsen & Toubro 290 2 10 20 26 16 30 18 25
17 Hero Motocorp 274 2 25 23 19 66 38 19 18
18 GAIL (India) 252 2 16 12 22 18 23 11 9
19 Axis Bank 247 2 19 45 38 20 19 11 21
20 Asian Paints 237 1 33 28 21 39 37 32 26
21 Kotak Mahindra Bank 211 1 18 28 34 15 18 22 30
22 M & M 206 1 12 14 29 14 30 14 12
23 Grasim Inds 195 1 15 4 12 17 37 10 10
24 Bank of Baroda 193 1 30 36 27 21 13 6 7
25 Lupin 183 1 34 32 29 24 29 27 22
26 UltraTech Cement 178 1 14 23 31 20 56 19 12
27 Dr Reddy's Labs 175 1 19 8 8 29 32 21 13
28 Titan Inds 166 1 40 41 33 48 37 34 35
29 Bosch 157 1 20 19 16 25 25 24 24
30 Maruti Suzuki 153 1 10 -1 19 10 25 26 15
31 B P C L 144 1 18 -18 17 5 21 30 5
32 HCL Technologies 137 1 11 14 28 28 37 14 15
33 Punjab National Bank 135 1 14 25 26 20 15 6 9
34 Hindustan Copper 123 1 26 -1 -1 25 35 76 38
35 IndusInd Bank 118 1 50 56 29 19 9 19 16
36 ACC 117 1 13 3 12 19 41 20 12
37 Cadila Healthcare 113 1 28 25 24 28 31 24 20
38 Canara Bank 110 1 19 17 22 16 19 6 5
39 Tata Power 109 1 15 -204 32 -5 13 0 14
40 Colgate-Palmolive 107 1 27 20 16 109 65 34 25
41 LIC Housing Finance 106 1 57 27 31 19 19 14 4
42 Castrol India 105 1 38 28 11 83 38 27 18
43 Dabur India 103 1 18 18 21 41 57 29 30
44 Shriram Transport Finance 100 1 38 47 35 24 20 10 11
45 Godrej Consumer 100 1 27 33 39 26 144 29 24
46 GSK Pharma 99 1 15 10 9 30 34 33 26
47 Ambuja Cements 99 1 10 2 15 16 35 22 15
48 Petronet LNG 95 1 32 28 33 34 27 12 10
49 GSK Consumer 94 1 39 23 19 34 25 33 17
50 Power Finance Corp 89 1 12 22 28 17 13 8 10

4112 December 2012
Wealth Creation Study 2007-2012
Appendix I: MOSL 100 – Biggest Wealth Creators (contd.)
Ranked according to The Biggest Wealth Creators
Wealth Created CAGR (2007-12, %) RoE (%) P/E (x)
Rank Company INR b Share (%) Price PAT Sales 2012 2007 2012 2007
51 Exide Inds 88 1 29 46 19 19 31 28 48
52 Cummins India 85 1 21 15 14 31 29 26 20
53 Bank of India 81 0 17 20 26 15 20 7 7
54 Sesa Goa 81 0 18 33 32 15 47 6 10
55 Shree Cement 79 0 28 25 27 21 44 23 20
56 Yes Bank 75 0 21 60 61 23 14 13 42
57 Siemens 72 0 7 17 15 23 36 30 48
58 United Breweries 70 0 15 18 25 11 17 113 104
59 Marico 70 0 23 26 21 31 43 34 38
60 Coromandel Inter 69 0 54 43 36 29 23 12 7
61 Torrent Power 67 0 28 53 23 24 5 8 19
62 Indian Bank 64 0 22 16 24 20 28 6 5
63 Divi's Lab 61 0 20 23 21 27 42 19 21
64 Pidilite Inds 61 0 26 24 20 27 25 29 26
65 Engineers India 60 0 27 34 45 38 14 14 18
66 M R P L 60 0 15 12 14 13 20 13 11
67 Neyveli Lignite 59 0 11 20 19 12 7 10 15
68 Union Bank (I) 57 0 18 16 23 14 19 7 6
69 I D F C 57 0 10 25 33 13 18 13 19
70 Piramal Enterprises 56 0 14 -20 -2 1 22 102 22
71 Alfa Laval (I) 56 0 36 14 14 29 31 56 23
72 Gillette India 56 0 25 0 22 12 22 108 35
73 CRISIL 51 0 30 28 23 51 38 34 33
74 Apollo Hospitals 50 0 21 25 27 10 10 39 36
75 Eicher Motors 47 0 52 41 23 23 13 19 13
76 P & G Hygiene 47 0 23 15 19 28 32 40 29
77 Havells India 46 0 21 30 35 46 47 19 23
78 Allahabad Bank 45 0 21 20 26 19 18 5 4
79 Emami 45 0 33 31 23 37 41 24 18
80 Motherson Sumi 43 0 21 15 57 9 38 28 20
81 Bhushan Steel 43 0 32 26 21 15 30 9 7
82 G M D C 43 0 31 39 23 26 12 12 16
83 M & M Financial 41 0 23 37 28 23 18 11 15
84 Britannia Inds 41 0 19 14 19 54 18 37 30
85 Bata India 41 0 41 42 15 34 14 32 33
86 Indraprastha Gas 39 0 31 17 32 27 33 17 10
87 Astrazeneca Pharma 37 0 28 -17 15 11 36 266 31
88 Blue Dart Express 37 0 35 19 17 20 23 38 20
89 Torrent Pharma 37 0 26 29 16 30 25 16 18
90 Guj Gas Company 34 0 25 25 20 33 21 18 19
91 Federal Bank 33 0 21 21 25 14 21 10 6
92 Tata Chemicals 32 0 11 13 19 16 21 9 9
93 Tata Global 32 0 13 1 11 8 17 21 11
94 TTK Prestige 32 0 89 58 31 48 24 29 12
95 Kansai Nerolac 31 0 22 16 15 22 21 23 17
96 Godrej Inds 30 0 10 83 19 4 3 39 454
97 Ashok Leyland 30 0 10 6 13 20 27 14 12
98 BOC India 28 0 30 33 19 10 9 34 23
99 MRF 28 0 24 52 21 17 5 12 33
100 Ipca Labs 27 0 23 18 20 24 28 15 12
TOTAL / AVG 16,380 100 20 21 23 19 21 16 16
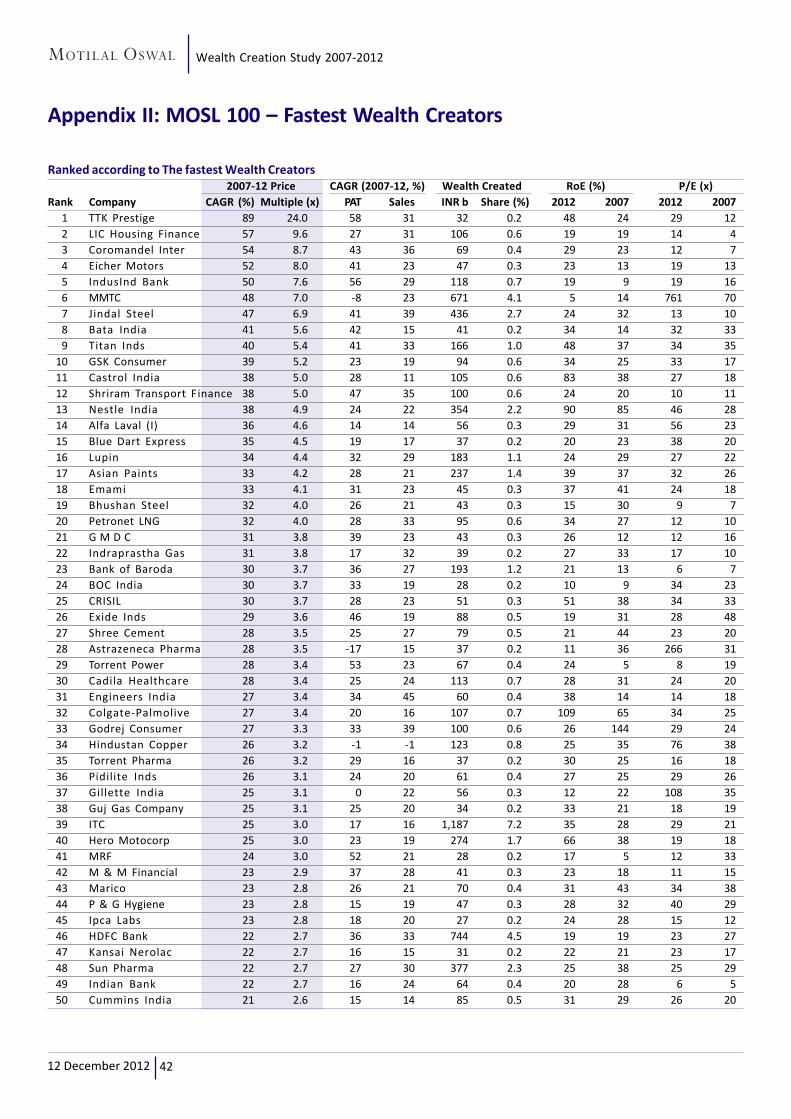
4212 December 2012
Wealth Creation Study 2007-2012
Appendix II: MOSL 100 – Fastest Wealth Creators
Ranked according to The fastest Wealth Creators 2007-12 Price CAGR (2007-12, %) Wealth Created RoE (%) P/E (x)
Rank Company CAGR (%) Multiple (x) PAT Sales INR b Share (%) 2012 2007 2012 2007
1 TTK Prestige 89 24.0 58 31 32 0.2 48 24 29 12
2 LIC Housing Finance 57 9.6 27 31 106 0.6 19 19 14 4
3 Coromandel Inter 54 8.7 43 36 69 0.4 29 23 12 7
4 Eicher Motors 52 8.0 41 23 47 0.3 23 13 19 13
5 IndusInd Bank 50 7.6 56 29 118 0.7 19 9 19 16
6 MMTC 48 7.0 -8 23 671 4.1 5 14 761 70
7 Jindal Steel 47 6.9 41 39 436 2.7 24 32 13 10
8 Bata India 41 5.6 42 15 41 0.2 34 14 32 33
9 Titan Inds 40 5.4 41 33 166 1.0 48 37 34 35
10 GSK Consumer 39 5.2 23 19 94 0.6 34 25 33 17
11 Castrol India 38 5.0 28 11 105 0.6 83 38 27 18
12 Shriram Transport F inance 38 5.0 47 35 100 0.6 24 20 10 11
13 Nestle India 38 4.9 24 22 354 2.2 90 85 46 28
14 Alfa Laval (I) 36 4.6 14 14 56 0.3 29 31 56 23
15 Blue Dart Express 35 4.5 19 17 37 0.2 20 23 38 20
16 Lupin 34 4.4 32 29 183 1.1 24 29 27 22
17 Asian Paints 33 4.2 28 21 237 1.4 39 37 32 26
18 Emami 33 4.1 31 23 45 0.3 37 41 24 18
19 Bhushan Steel 32 4.0 26 21 43 0.3 15 30 9 7
20 Petronet LNG 32 4.0 28 33 95 0.6 34 27 12 10
21 G M D C 31 3.8 39 23 43 0.3 26 12 12 16
22 Indraprastha Gas 31 3.8 17 32 39 0.2 27 33 17 10
23 Bank of Baroda 30 3.7 36 27 193 1.2 21 13 6 7
24 BOC India 30 3.7 33 19 28 0.2 10 9 34 23
25 CRISIL 30 3.7 28 23 51 0.3 51 38 34 33
26 Exide Inds 29 3.6 46 19 88 0.5 19 31 28 48
27 Shree Cement 28 3.5 25 27 79 0.5 21 44 23 20
28 Astrazeneca Pharma 28 3.5 -17 15 37 0.2 11 36 266 31
29 Torrent Power 28 3.4 53 23 67 0.4 24 5 8 19
30 Cadila Healthcare 28 3.4 25 24 113 0.7 28 31 24 20
31 Engineers India 27 3.4 34 45 60 0.4 38 14 14 18
32 Colgate-Palmolive 27 3.4 20 16 107 0.7 109 65 34 25
33 Godrej Consumer 27 3.3 33 39 100 0.6 26 144 29 24
34 Hindustan Copper 26 3.2 -1 -1 123 0.8 25 35 76 38
35 Torrent Pharma 26 3.2 29 16 37 0.2 30 25 16 18
36 Pidilite Inds 26 3.1 24 20 61 0.4 27 25 29 26
37 Gillette India 25 3.1 0 22 56 0.3 12 22 108 35
38 Guj Gas Company 25 3.1 25 20 34 0.2 33 21 18 19
39 ITC 25 3.0 17 16 1,187 7.2 35 28 29 21
40 Hero Motocorp 25 3.0 23 19 274 1.7 66 38 19 18
41 MRF 24 3.0 52 21 28 0.2 17 5 12 33
42 M & M Financial 23 2.9 37 28 41 0.3 23 18 11 15
43 Marico 23 2.8 26 21 70 0.4 31 43 34 38
44 P & G Hygiene 23 2.8 15 19 47 0.3 28 32 40 29
45 Ipca Labs 23 2.8 18 20 27 0.2 24 28 15 12
46 HDFC Bank 22 2.7 36 33 744 4.5 19 19 23 27
47 Kansai Nerolac 22 2.7 16 15 31 0.2 22 21 23 17
48 Sun Pharma 22 2.7 27 30 377 2.3 25 38 25 29
49 Indian Bank 22 2.7 16 24 64 0.4 20 28 6 5
50 Cummins India 21 2.6 15 14 85 0.5 31 29 26 20

4312 December 2012
Wealth Creation Study 2007-2012
Appendix II: MOSL 100 – Fastest Wealth Creators (contd.)
Ranked according to The fastest Wealth Creators 2007-12 Price CAGR (2007-12, %) Wealth Created RoE (%) P/E (x)
Rank Company CAGR (%) Multiple (x) PAT Sales INR b Share (%) 2012 2007 2012 2007
51 Havells India 21 2.6 30 35 46 0.3 46 47 19 23
52 Yes Bank 21 2.6 60 61 75 0.5 23 14 13 42
53 Motherson Sumi 21 2.6 15 57 43 0.3 9 38 28 20
54 Federal Bank 21 2.6 21 25 33 0.2 14 21 10 6
55 Apollo Hospitals 21 2.6 25 27 50 0.3 10 10 39 36
56 Allahabad Bank 21 2.6 20 26 45 0.3 19 18 5 4
57 Cairn India 21 2.5 100 164 374 2.3 18 0 8 0
58 Bosch 20 2.5 19 16 157 1.0 25 25 24 24
59 Divi's Lab 20 2.5 23 21 61 0.4 27 42 19 21
60 NMDC 20 2.4 26 22 377 2.3 33 47 9 11
61 Canara Bank 19 2.4 17 22 110 0.7 16 19 6 5
62 Dr Reddy's Labs 19 2.4 8 8 175 1.1 29 32 21 13
63 Britannia Inds 19 2.4 14 19 41 0.2 54 18 37 30
64 Hindustan Zinc 19 2.3 3 6 321 2.0 22 80 11 5
65 Axis Bank 19 2.3 45 38 247 1.5 20 19 11 21
66 B P C L 18 2.3 -18 17 144 0.9 5 21 30 5
67 Sesa Goa 18 2.3 33 32 81 0.5 15 47 6 10
68 Kotak Mahindra Bank 18 2.3 28 34 211 1.3 15 18 22 30
69 Union Bank (I) 18 2.3 16 23 57 0.4 14 19 7 6
70 Dabur India 18 2.2 18 21 103 0.6 41 57 29 30
71 State Bank of India 17 2.2 19 22 556 3.4 16 16 9 8
72 H D F C 17 2.2 26 36 558 3.4 19 19 18 22
73 Bank of India 17 2.2 20 26 81 0.5 15 20 7 7
74 GAIL (India) 16 2.1 12 22 252 1.5 18 23 11 9
75 GSK Pharma 15 2.1 10 9 99 0.6 30 34 33 26
76 United Breweries 15 2.0 18 25 70 0.4 11 17 113 104
77 Grasim Inds 15 2.0 4 12 195 1.2 17 37 10 10
78 M R P L 15 2.0 12 14 60 0.4 13 20 13 11
79 Hind Unilever 15 2.0 11 14 457 2.8 87 64 35 29
80 Tata Power 15 2.0 -204 32 109 0.7 -5 13 0 14
81 Punjab National Bank 14 2.0 25 26 135 0.8 20 15 6 9
82 Tata Motors 14 2.0 46 39 499 3.0 52 32 6 13
83 UltraTech Cement 14 2.0 23 31 178 1.1 20 56 19 12
84 Piramal Enterprises 14 1.9 -20 -2 56 0.3 1 22 102 22
85 TCS 14 1.9 20 21 1,082 6.6 38 56 22 29
86 ACC 13 1.8 3 12 117 0.7 19 41 20 12
87 Tata Global 13 1.8 1 11 32 0.2 8 17 21 11
88 M & M 12 1.8 14 29 206 1.3 14 30 14 12
89 Power Finance Corp 12 1.8 22 28 89 0.5 17 13 8 10
90 Neyveli Lignite 11 1.7 20 19 59 0.4 12 7 10 15
91 Tata Chemicals 11 1.7 13 19 32 0.2 16 21 9 9
92 HCL Technologies 11 1.7 14 28 137 0.8 28 37 14 15
93 Maruti Suzuki 10 1.6 -1 19 153 0.9 10 25 26 15
94 Larsen & Toubro 10 1.6 20 26 290 1.8 16 30 18 25
95 I D F C 10 1.6 25 33 57 0.3 13 18 13 19
96 Ambuja Cements 10 1.6 2 15 99 0.6 16 35 22 15
97 Godrej Inds 10 1.6 83 19 30 0.2 4 3 39 454
98 Ashok Leyland 10 1.6 6 13 30 0.2 20 27 14 12
99 Infosys 7 1.4 17 19 516 3.1 29 42 20 29
100 Siemens 7 1.4 17 15 72 0.4 23 36 30 48
TOTAL / AVG 20 2.5 21 23 16,380 100 19 21 16 16

4412 December 2012
Wealth Creation Study 2007-2012
Appendix III: MOSL 100 – Wealth Creators (alphabetical)
Company WC Rank Wealth Created
Biggest Fastest INR b Price Price
CAGR Multi.
(%) (x)
ACC 36 86 117 13 1.8
Alfa Laval (I) 71 14 56 36 4.6
Allahabad Bank 78 56 45 21 2.6
Ambuja Cements 47 96 99 10 1.6
Apollo Hospitals 74 55 50 21 2.6
Ashok Leyland 97 98 30 10 1.6
Asian Paints 20 17 237 33 4.2
Astrazeneca Pharma 87 28 37 28 3.5
Axis Bank 19 65 247 19 2.3
B P C L 31 66 144 18 2.3
Bank of Baroda 24 23 193 30 3.7
Bank of India 53 73 81 17 2.2
Bata India 85 8 41 41 5.6
Bhushan Steel 81 19 43 32 4.0
Blue Dart Express 88 15 37 35 4.5
BOC India 98 24 28 30 3.7
Bosch 29 58 157 20 2.5
Britannia Inds 84 63 41 19 2.4
Cadila Healthcare 37 30 113 28 3.4
Cairn India 13 57 374 21 2.5
Canara Bank 38 61 110 19 2.4
Castrol India 42 11 105 38 5.0
Colgate-Palmolive 40 32 107 27 3.4
Coromandel Inter 60 3 69 54 8.7
CRISIL 73 25 51 30 3.7
Cummins India 52 50 85 21 2.6
Dabur India 43 70 103 18 2.2
Divi's Lab 63 59 61 20 2.5
Dr Reddy's Labs 27 62 175 19 2.4
Eicher Motors 75 4 47 52 8.0
Emami 79 18 45 33 4.1
Engineers India 65 31 60 27 3.4
Exide Inds 51 26 88 29 3.6
Federal Bank 91 54 33 21 2.6
G M D C 82 21 43 31 3.8
GAIL (India) 18 74 252 16 2.1
Gillette India 72 37 56 25 3.1
Godrej Consumer 45 33 100 27 3.3
Godrej Inds 96 97 30 10 1.6
Grasim Inds 23 77 195 15 2.0
GSK Consumer 49 10 94 39 5.2
GSK Pharma 46 75 99 15 2.1
Guj Gas Company 90 38 34 25 3.1
H D F C 5 72 558 17 2.2
Havells India 77 51 46 21 2.6
HCL Technologies 32 92 137 11 1.7
HDFC Bank 3 46 744 22 2.7
Hero Motocorp 17 40 274 25 3.0
Hind Unilever 9 79 457 15 2.0
Hindustan Copper 34 34 123 26 3.2
Alphabetically arranged
Company WC Rank Wealth Created
Biggest Fastest INR b Price Price
CAGR Multi.
(%) (x)
Hindustan Zinc 15 64 321 19 2.3
I D F C 69 95 57 10 1.6
Indian Bank 62 49 64 22 2.7
Indraprastha Gas 86 22 39 31 3.8
IndusInd Bank 35 5 118 50 7.6
Infosys 7 99 516 7 1.4
Ipca Labs 100 45 27 23 2.8
ITC 1 39 1,187 25 3.0
Jindal Steel 10 7 436 47 6.9
Kansai Nerolac 95 47 31 22 2.7
Kotak Mahindra Bank 21 68 211 18 2.3
Larsen & Toubro 16 94 290 10 1.6
LIC Housing Finance 41 2 106 57 9.6
Lupin 25 16 183 34 4.4
M & M 22 88 206 12 1.8
M & M Financial 83 42 41 23 2.9
M R P L 66 78 60 15 2.0
Marico 59 43 70 23 2.8
Maruti Suzuki 30 93 153 10 1.6
MMTC 4 6 671 48 7.0
Motherson Sumi 80 53 43 21 2.6
MRF 99 41 28 24 3.0
Nestle India 14 13 354 38 4.9
Neyveli Lignite 67 90 59 11 1.7
NMDC 11 60 377 20 2.4
P & G Hygiene 76 44 47 23 2.8
Petronet LNG 48 20 95 32 4.0
Pidilite Inds 64 36 61 26 3.1
Piramal Enterprises 70 84 56 14 1.9
Power Finance Corp 50 89 89 12 1.8
Punjab National Bank 33 81 135 14 2.0
Sesa Goa 54 67 81 18 2.3
Shree Cement 55 27 79 28 3.5
Shriram Transport 44 12 100 38 5.0
Siemens 57 100 72 7 1.4
State Bank of India 6 71 556 17 2.2
Sun Pharma 12 48 377 22 2.7
Tata Chemicals 92 91 32 11 1.7
Tata Global 93 87 32 13 1.8
Tata Motors 8 82 499 14 2.0
Tata Power 39 80 109 15 2.0
TCS 2 85 1,082 14 1.9
Titan Inds 28 9 166 40 5.4
Torrent Pharma 89 35 37 26 3.2
Torrent Power 61 29 67 28 3.4
TTK Prestige 94 1 32 89 24.0
UltraTech Cement 26 83 178 14 2.0
Union Bank (I) 68 69 57 18 2.3
United Breweries 58 76 70 15 2.0
Yes Bank 56 52 75 21 2.6

DisclosuresThis report is for personal information of the authorized recipient and does not construe to be any investment, legal or taxation advice to you. This research report does not constitute an offer, invitation or inducementto invest in securities or other investments and Motilal Oswal Securities Limited (hereinafter referred as MOSt) is not soliciting any action based upon it. This report is not for public distribution and has beenfurnished to you solely for your information and should not be reproduced or redistributed to any other person in any form.
Unauthorized disclosure, use, dissemination or copying (either whole or partial) of this information, is prohibited. The person accessing this information specifically agrees to exempt MOSt or any of its affiliatesor employees from, any and all responsibility/liability arising from such misuse and agrees not to hold MOSt or any of its affiliates or employees responsible for any such misuse and further agrees to hold MOStor any of its affiliates or employees free and harmless from all losses, costs, damages, expenses that may be suffered by the person accessing this information due to any errors and delays.
The information contained herein is based on publicly available data or other sources believed to be reliable. While we would endeavour to update the information herein on reasonable basis, MOSt and/or itsaffiliates are under no obligation to update the information. Also there may be regulatory, compliance, or other reasons that may prevent MOSt and/or its affiliates from doing so. MOSt or any of its affiliates oremployees shall not be in any way responsible and liable for any loss or damage that may arise to any person from any inadvertent error in the information contained in this report . MOSt or any of its affiliatesor employees do not provide, at any time, any express or implied warranty of any kind, regarding any matter pertaining to this report, including without limitation the implied warranties of merchantability, fitnessfor a particular purpose, and non-infringement. The recipients of this report should rely on their own investigations.
This report is intended for distribution to institutional investors. Recipients who are not institutional investors should seek advice of their independent financial advisor prior to taking any investment decisionbased on this report or for any necessary explanation of its contents.
MOSt and/or its affiliates and/or employees may have interests/positions, financial or otherwise in the securities mentioned in this report. To enhance transparency, MOSt has incorporated a Disclosure of InterestStatement in this document. This should, however, not be treated as endorsement of the views expressed in the report.
Disclosure of Interest Statement Companies where there is interest1. Analyst ownership of the stock Sesa Goa2. Group/Directors ownership of the stock Bharti Airtel, Birla Corporation, Cairn India, GSK Pharma, Hero MotoCorp, IOC, Marico, Nestle India,
Oriental Bank,State Bank of India3. Broking relationship with company covered State Bank of India4. Investment Banking relationship with company covered PTC India
Analyst CertificationThe views expressed in this research report accurately reflect the personal views of the analyst(s) about the subject securities or issues, and no part of the compensation of the research analyst(s) was, is, orwill be directly or indirectly related to the specific recommendations and views expressed by research analyst(s) in this report. The research analysts, strategists, or research associates principally responsiblefor preparation of MOSt research receive compensation based upon various factors, including quality of research, investor client feedback, stock picking, competitive factors and firm revenues.
Regional Disclosures (outside India)This report is not directed or intended for distribution to or use by any person or entity resident in a state, country or any jurisdiction, where such distribution, publication, availability or use would be contrary tolaw, regulation or which would subject MOSt & its group companies to registration or licensing requirements within such jurisdictions.
For U.K.This report is intended for distribution only to persons having professional experience in matters relating to investments as described in Article 19 of the Financial Services and Markets Act 2000 (FinancialPromotion) Order 2005 (referred to as "investment professionals"). This document must not be acted on or relied on by persons who are not investment professionals. Any investment or investment activity towhich this document relates is only available to investment professionals and will be engaged in only with such persons.
For U.S.Motilal Oswal Securities Limited (MOSL) is not a registered broker - dealer under the U.S. Securities Exchange Act of 1934, as amended (the"1934 act") and under applicable state laws in the United States.In addition MOSL is not a registered investment adviser under the U.S. Investment Advisers Act of 1940, as amended (the "Advisers Act" and together with the 1934 Act, the "Acts), and under applicable statelaws in the United States. Accordingly, in the absence of specific exemption under the Acts, any brokerage and investment services provided by MOSL, including the products and services described hereinare not available to or intended for U.S. persons.
This website and its respective contents does not constitute an offer or invitation to purchase or subscribe for any securities or solicitation of any investments or investment services and/or shall not be consideredas an advertisement tool. "U.S. Persons" are generally defined as a natural person, residing in the United States or any entity organized or incorporated under the laws of the United States. US Citizens livingabroad may also be deemed "U.S. Persons " under certain rules.
For SingaporeMotilal Oswal Capital Markets Singapore Pte Limited is an exempt financial advisor under the Singapore Financial Advisers Act and a subsidiary of Motilal Oswal Securities Limited in India This research isdistributed in Singapore by Motilal Oswal Capital Markets Singapore Pte Limited and it is only directed in Singapore to accredited investors, and institutional investors as defined in the Financial AdvisersRegulations and the Securities and Futures Act (Chapter 289), as amended from time to time.
By virtue of distribution to these category of investors Motilal Oswal Capital Markets Singapore Pte Limited and its representatives are not required to comply with Section 36 of the Financial Advisers Act (Chapter110) (Section 36 relates to disclosure of Motilal Oswal Capital Markets Singapore Pte Limited's interest and/or its representative's interest in securities). Recipients of this research in Singapore may contactMotilal Oswal Capital Markets Singapore Pte Limited in respect of any matter arising from or in connection with the research. Please contact Nihar Oza Motilal Oswal Capital Markets Singapore Pte Limited,21 (Suite 31), 16 Collyer Quay, Singapore 049318 at (+65) 68189232/68189233/65249115 in respect of any matters arising from or in connection with this report.
Motilal Oswal Securities LtdMotilal Oswal Tower, Level 9, Sayani Road, Prabhadevi, Mumbai 400 025
Phone: +91 22 3982 5500 E-mail: [email protected]
Motilal Oswal Wealth Creation Gallery
Related Documents