A S 0 9 4 - 0 0 0 0 8 8 SM P R I ME HOL D I NG S , I N C . AN D S U B S I D I AR I E S 1 0 t h F l o o r , M a l l o f A s i a A r e n a A n n e x B u i l d i n g , C o r a l Wa y c o r . J . W . D i o k n o B l v d . , M a l l o f A s i a C o m p l e x , B r g y . 7 6 , Z o n e 1 0 , C B P - 1 A , P a s a y C i t y 1 3 0 0 !! 1 7 - Q " ! " ! #! 831-1000 $ %! ! # #& ! ’ #& 2,445 March 31 ( ) ! ! & #! Mr. John Nai Peng C. Ong 831-1000 ! "" #$ " " " % & " ! " ’ ( ) "" ’ * ( ’ * & " !

Welcome message from author
This document is posted to help you gain knowledge. Please leave a comment to let me know what you think about it! Share it to your friends and learn new things together.
Transcript

� ���������������������� �
����������� ���������
A S 0 9 4 - 0 0 0 0 8 8
��������� ����� ������
S M P R I M E H O L D I N G S , I N C . A N D S U
B S I D I A R I E S
��� ������������������������������ ���������������� ������� ����
1 0 t h F l o o r , M a l l o f A s i a A r e n a
A n n e x B u i l d i n g , C o r a l W a y c o r .
J . W . D i o k n o B l v d . , M a l l o f A s i
a C o m p l e x , B r g y . 7 6 , Z o n e 1 0 ,
C B P - 1 A , P a s a y C i t y 1 3 0 0
� �������� � � � ������������������������� �� � � � ��� ���������������������� ��!����!��
1 7 - Q
��������� ������� ��������������� �
� � �����"�����!� ����� � � �����"���!��� ���������� � # ��!��������� �
831-1000
�� $� ��� �%� !���� �
����!�#������# ��&���� �
����!�'����# ��&����
�
2,445 March 31
�� �������� �� ������ �
�������������� ������� �������������(������� ������ �� ��� ��
����� ��� ����)�� �� � ����!� ����� � ��!��� ���������&� � # ��!���������
Mr. John Nai Peng C. Ong 831-1000
�� �������� ����������
����� ����� ����������������� ���� ���������� �������������������������� ��������� �������� �������� ��� ����� �!��������������""����� ������ ��������#$���� ����������"�������� ������������� ��"���� �� ����"� ���� ��������� �������� ���� �������� ����� ������ �� � � � % � ��&�� "���� !� ��� �� � �� ��"� � �� �� �'���� � (�� �� ��� ��� ��� ��� � ����� ��� � ��� � � ������ �� ��� �������� )�� ����� ����������""����� �� ���� � '�����������������*���� ������(����� � '�����������������*���� ������� � ���&��������������� ���"� ��!� ���������������� �����
SECURITIES AND EXCHANGE COMMISSION SEC FORM 17-Q
QUARTERLY REPORT PURSUANT TO SECTION 17 OF THE SECURITIES REGULATION CODE AND SRC RULE 17(2)(b) THEREUNDER
1. For the quarterly period ended March 31, 2017
2. SEC Identification Number AS0940000-88 3. BIR Tax Identification No. 003-058-789 4. Exact name of registrant as specified in its charter SM PRIME HOLDINGS, INC.
5. PHILIPPINES 6. (SEC Use Only) Province, Country or other jurisdiction of
incorporation or organization Industry Classification Code:
7. 10th Floor, Mall of Asia Arena Annex Building, Coral Way cor. J.W. Diokno Blvd., Mall of Asia Complex, Brgy. 76, Zone 10, CBP-1A, Pasay City 1300
Address of principal office Postal Code
8. (632) 831-1000 ________ Registrant's telephone number, including area code
9. __________________________________________ Former name, former address, and former fiscal year, if changed since last report.
10. Securities registered pursuant to Sections 4 and 8 of the SRC
Title of Each Class Number of Shares of Common Stock Outstanding and Amount of Debt Outstanding
CAPITAL STOCK, P 1 PAR VALUE 28,879,231,694
11. Are any or all of these securities listed on the Philippine Stock Exchange. Yes [X] No [ ]
12. Indicate by check mark whether the registrant:
(a) has filed all reports required to be filed by Section 11 of the Securities Regulation Code (SRC) and SRC Rule 11(a)-1 thereunder and Sections 26 and 141 of The Corporation Code of the Philippines during the preceding 12 months (or for such shorter period that the registrant was required to file such reports);
Yes [X] No [ ] (b) has been subject to such filing requirements for the past 90 days. Yes [X] No [ ]

������������ ����� ���
� ���������������
*���������������� �������� � !��������������!�������� ���#�����+,��-.,/������ ����������0# ���)��� ��������#�����+,��-.,/�����-.,1�23���� ������4�� ������� � !�������5�!�����������������������+,��-.,16�
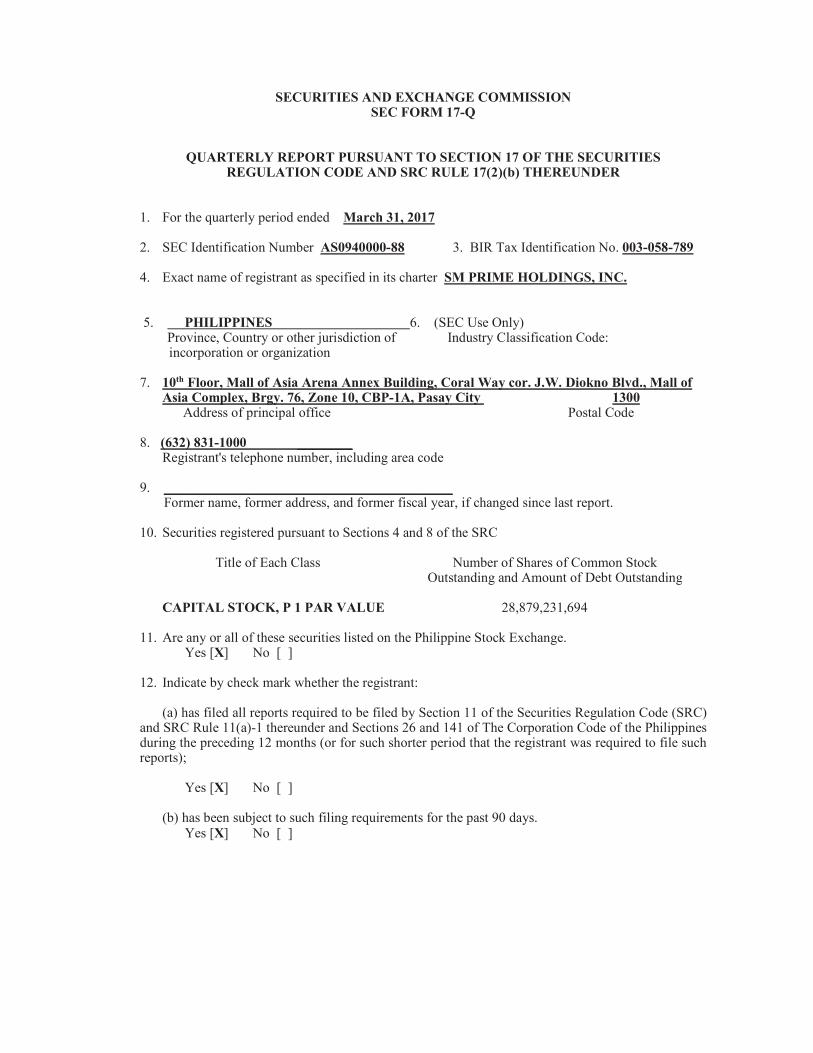
SM PRIME HOLDINGS, INC. AND SUBSIDIARIES
INTERIM CONSOLIDATED BALANCE SHEET March 31, 2017
(With Comparative Audited Figures as at December 31, 2016)
(Amounts in Thousands)
March 31,
2017
(Unaudited)
December 31, 2016
(Audited)
ASSETS
Current Assets Cash and cash equivalents (Notes 6, 20 and 24) P=26,972,322 P=25,200,982Investments held for trading (Notes 7, 20, 24 and 25) 965,258 918,702 Receivables (Notes 8, 16, 20, 24 and 25) 30,689,179 32,833,330 Condominium and residential units for sale (Note 9) 6,940,920 5,205,511 Land and development (Note 10) 25,197,912 27,228,525 Available-for-sale investments (Notes 11, 24 and 25) 689,156 664,606 Prepaid expenses and other current assets (Notes 12, 20, 24 and 25) 12,306,815 11,898,900
Total Current Assets 103,761,562 103,950,556
Noncurrent Assets Investments in associates and joint ventures (Note 14) 23,834,638 22,833,079 Available-for-sale investments - net of current portion
(Notes 11, 20, 24 and 25) 24,516,512 20,548,119 Investment properties - net (Note 13) 257,631,641 251,499,064 Land and development - net of current portion (Note 10) 27,209,838 19,472,641 Derivative assets (Notes 24 and 25) 4,536,301 5,102,735Deferred tax assets – net 1,170,882 1,137,729 Other noncurrent assets – net (Notes 15, 20, 24 and 25) 44,470,697 41,016,209
Total Noncurrent Assets 383,370,509 361,609,576
P=487,132,071 P=465,560,132
LIABILITIES AND EQUITY
Current Liabilities Loans payable (Notes 16, 20, 24 and 25) P=4,705,000 P=840,000 Accounts payable and other current liabilities (Notes 17, 20, 24 and 25) 42,085,300 40,324,504 Current portion of long-term debt (Notes 18, 20, 24 and 25) 31,696,138 7,154,151 Income tax payable 1,992,335 1,102,621
Total Current Liabilities 80,478,773 49,421,276
Noncurrent Liabilities Long-term debt - net of current portion (Notes 18, 20, 24 and 25) 134,146,879 156,383,534 Tenants’ and customers’ deposits (Notes 17, 24 and 25) 15,281,161 14,812,280 Liability for purchased land - net of current portion
(Notes 17, 24 and 25) 1,169,090 1,211,658 Deferred tax liabilities - net 2,654,252 2,552,812 Other noncurrent liabilities (Notes 17, 24 and 25 9,551,960 5,815,028
Total Noncurrent Liabilities 162,803,342 180,775,312
Total Liabilities (Carried Forward) 243,282,115 230,196,588

- 2 -
March 31,
2017
(Unaudited)
December 31, 2016
(Audited)
Total Liabilities (Brought Forward) P=243,282,115 P=230,196,588
Equity Attributable to Equity Holders of the Parent
Capital stock (Notes 19 and 26) 33,166,300 33,166,300 Additional paid-in capital - net 39,547,782 39,545,625 Cumulative translation adjustment 1,572,671 1,400,373 Net unrealized gain on available-for-sale investments (Note 11) 20,258,349 17,502,410 Net fair value changes on cash flow hedges 241,081 811,625 Remeasurement loss on defined benefit obligation 39,687 39,687 Retained earnings (Note 19): Appropriated 42,200,000 42,200,000 Unappropriated 106,765,579 100,170,486 Treasury stock (Notes 19 and 26) (3,355,474) (3,355,474)
Total Equity Attributable to Equity Holders of the Parent 240,435,975 231,481,032
Non-controlling Interests 3,413,981 3,882,512
Total Equity 243,849,956 235,363,544
P=487,132,071 P=465,560,132
See accompanying Notes to Interim Condensed Consolidated Financial Statements.

SM PRIME HOLDINGS, INC. AND SUBSIDIARIES
UNAUDITED INTERIM CONSOLIDATED STATEMENTS OF INCOME(Amounts in Thousands, Except Per Share Data)
Three-Month Periods Ended March 31
2017 2016
REVENUERent (Note 20) P=12,071,460 P=10,753,180Sales: Real estate 5,923,992 5,546,364 Cinema and event ticket 1,229,855 1,059,093Others (Notes 20 and 21) 1,282,393 887,512
20,507,700 18,246,149
COSTS AND EXPENSES (Note 22) 10,941,188 9,859,426
INCOME FROM OPERATIONS 9,566,512 8,386,723
OTHER INCOME (CHARGES) Interest expense (Notes 20 and 23) (1,249,974) (995,293)Interest and dividend income (Notes 11, 20 and 23) 279,259 270,880Others - net (Notes 7 and 18) 88,889 (49,376)
(881,826) (773,789)
INCOME BEFORE INCOME TAX 8,684,686 7,612,934
PROVISION FOR INCOME TAX
Current 1,868,351 1,483,398Deferred 71,417 148,054
1,939,768 1,631,452
NET INCOME P=6,744,918 P=5,981,482
Attributable to
Equity holders of the Parent (Notes 19 and 26) P=6,595,093 P=5,835,882Non-controlling interests (Note 19) 149,825 145,600
P=6,744,918 P=5,981,482
Basic/Diluted earnings per share (Note 26) P=0.229 P=0.202
See accompanying Notes to Unaudited Interim Consolidated Financial Statements.

SM PRIME HOLDINGS, INC. AND SUBSIDIARIES
UNAUDITED INTERIM CONSOLIDATED STATEMENTS OF
COMPREHENSIVE INCOME (Amounts in Thousands)
Three-Month Periods Ended March 31
2017 2016
NET INCOME P=6,744,918 P=5,981,482
OTHER COMPREHENSIVE INCOME (LOSS)
Other comprehensive income transferred to profit or loss: Realized gain from sale of available-for-sale investments
(Note 11) – (10)Other comprehensive income (loss) to be reclassified to profit or
loss in subsequent periods: Unrealized gain (loss) due to changes in fair value in
available-for-sale investments (Note 11) 2,755,939 (32,911) Net fair value changes on cash flow hedges (570,544) (324,195) Cumulative translation adjustment 172,298 (156,772)
2,357,693 (513,888)
TOTAL COMPREHENSIVE INCOME P=9,102,611 P=5,467,594
Attributable to Equity holders of the Parent (Notes 19 and 26) P=8,952,786 P=5,321,994Non-controlling interests (Note 19) 149,825 145,600
P=9,102,611 P=5,467,594
See accompanying Notes to Unaudited Interim Consolidated Financial Statements.

SM PRIME HOLDINGS, INC. AND SUBSIDIARIES
INTERIM CONSOLIDATED STATEMENTS OF CHANGES IN EQUITY FOR THE THREE-MONTH PERIODS ENDED MARCH 31, 2017 AND 2016
(Amounts in Thousands)
Equity Attributable to Equity Holders of the Parent (Notes 19 and 26)
Capital Stock
Additional
Paid-in
Cumulative
Translation
Net Unrealized
Gain (Loss) on
Available-
for-Sale
Investments
Net Fair Value
Changes on
Cash Flow
Remeasurement
Loss on
Defined Benefit Retained Earnings (Note 19)Treasury
Stock Non-controlling Total
(Notes 19 and 26) Capital - Net Adjustment (Note 11) Hedges Obligation Appropriated Unappropriated (Notes 19 and 26) Total Interests Equity
At December 31, 2016 (Audited) P=33,166,300 P=39,545,625 P=1,400,373 P=17,502,410 P=811,625 P=39,687 P=42,200,000 P=100,170,486 (P=3,355,474) P=231,481,032 P=3,882,512 P=235,363,544
Net income for the period – – – – – – – 6,595,093 – 6,595,093 149,825 6,744,918
Other comprehensive income (loss) – – 172,298 2,755,939 (570,544) – – – – 2,357,693 – 2,357,693
Total comprehensive income (loss) for the period – – 172,298 2,755,939 (570,544) – – 6,595,093 – 8,952,786 149,825 9,102,611
Cash dividends received by non-controlling interests – – – – – – – – – – (530,791) (530,791)
Sale (acquisition) of non-controlling interest – 2,157 – – – – – – – 2,157 (87,565) (85,408)
At March 31, 2017 (Unaudited) P=33,166,300 P=39,547,782 P=1,572,671 P=20,258,349 P=241,081 P=39,687 P=42,200,000 P=106,765,579 (P=3,355,474) P=240,435,975 P=3,413,981 P=243,849,956
At December 31, 2015 (Audited) P=33,166,300 P=39,304,027 P=1,005,978 P=16,621,547 P=428,799 (P=50,458) P=42,200,000 P=83,168,103 (P=3,355,474) P=212,488,822 P=3,354,025 P=215,842,847
Net income for the period – – – – – – – 5,835,882 – 5,835,882 145,600 5,981,482 Other comprehensive loss – – (156,772) (32,921) (324,195) – – – – (513,888) – (513,888)
Total comprehensive income (loss) for the period – – (156,772) (32,921) (324,195) – – 5,835,882 – 5,321,994 145,600 5,467,594
Cash dividends received by non-controlling interests – – – – – – – – – – (485,292) (485,292)
At March 31, 2016 (Unaudited) P=33,166,300 P=39,304,027 P=849,206 P=16,588,626 P=104,604 (P=50,458) P=42,200,000 P=89,003,985 (P=3,355,474) P=217,810,816 P=3,014,333 P=220,825,149
See accompanying Notes to Interim Condensed Consolidated Financial Statements.

SM PRIME HOLDINGS, INC. AND SUBSIDIARIES
UNAUDITED INTERIM CONSOLIDATED STATEMENTS OF CASH FLOWS (Amounts in Thousands)
Three-Month Periods Ended March 31
2017 2016
CASH FLOWS FROM OPERATING ACTIVITIES Income before income tax P=8,684,686 P=7,612,934Adjustments for:
Depreciation and amortization (Notes 13 and 15) 2,141,191 1,888,493 Interest expense (Note 23) 1,249,974 995,293 Interest and dividend income (Notes 7, 11 and 23) (279,259) (270,880)
Equity in net earnings of associates and joint ventures
(Note 14) (215,205) (92,260) Loss (gain) on: Unrealized foreign exchange (141,640) 250,956 Mark-to-market on investments held for trading (Note 7) (44,202) (29,559)
Sale of available-for-sale investments (Note 11) – (10)
Operating income before working capital changes 11,395,545 10,354,967Decrease (increase) in: Receivables 2,255,539 (421,960) Condominium and residential units for sale 801,803 1,250,424
Land and development (8,132,959) (383,414) Prepaid expenses and other current assets (404,613) (114,410)Increase (decrease) in:
Accounts payable and other current liabilities 4,975,107 (2,277,324)
Tenants’ and customers’ deposits 447,874 753,797
Cash generated from operations 11,338,295 9,162,080
Income tax paid (980,744) (728,519)
Cash provided by operating activities 10,357,551 8,433,561
CASH FLOWS FROM INVESTING ACTIVITIES
Proceeds from sale of available-for-sale investments (Note 11) – 29Dividends received 56,470 52,419Interest received 128,254 155,528Additions to: Investment properties (Note 13) (7,559,202) (6,271,037) Available-for-sale investments (Note 11) (1,237,004) –
Increase in investments to associates and joint ventures (Note 14) (775,500) –
Increase in other noncurrent assets (3,314,096) (1,246,213)
Net cash used in investing activities (12,701,078) (7,309,274)
(Forward)

- 2 -
Three-Month Periods Ended March 31
2017 2016
CASH FLOWS FROM FINANCING ACTIVITIES
Availments of bank loans and long-term debt (Notes 16 and 18) P=6,450,880 P=12,938,792
Payments of: Interest (Note 17) (924,816) (971,477) Long-term debt (Note 18) (770,289) (13,562,374)
Dividends (Note 19) (530,791) (485,292)
Bank loans (Note 16) (135,000) (3,900,000)
Net cash provided by (used in) financing activities 4,089,984 (5,980,351)
EFFECT OF EXCHANGE RATE CHANGES ON CASH AND
CASH EQUIVALENTS 24,883 10,197
NET INCREASE (DECREASE) IN CASH
AND CASH EQUIVALENTS 1,771,340 (4,845,867)
CASH AND CASH EQUIVALENTS
AT BEGINNING OF PERIOD 25,200,982 25,869,908
CASH AND CASH EQUIVALENTS AT END OF PERIOD P=26,972,322 P=21,024,041
See accompanying Notes to Interim Condensed Consolidated Financial Statements.

SM PRIME HOLDINGS, INC. AND SUBSIDIARIES
NOTES TO INTERIM CONDENSED CONSOLIDATED
FINANCIAL STATEMENTS
1. Corporate Information
SM Prime Holdings, Inc. (SMPH or the Parent Company) was incorporated in the Philippines and registered with the Securities and Exchange Commission (SEC) on January 6, 1994. SMPH and its subsidiaries (collectively known as “the Company”) are incorporated to acquire by purchase, exchange, assignment, gift or otherwise, and to own, use, improve, subdivide, operate, enjoy, sell, assign, transfer, exchange, lease, let, develop, mortgage, pledge, traffic, deal in and hold for investment or otherwise, including but not limited to real estate and the right to receive, collect and dispose of, any and all rentals, dividends, interest and income derived therefrom; the right to vote on any proprietary or other interest on any shares of stock, and upon any bonds, debentures, or other securities; and the right to develop, conduct, operate and maintain modernized commercial shopping centers and all the businesses appurtenant thereto, such as but not limited to the conduct, operation and maintenance of shopping center spaces for rent, amusement centers, movie or cinema theatres within the compound or premises of the shopping centers, to construct, erect, manage and administer buildings such as condominium, apartments, hotels, restaurants, stores or other structures for mixed use purposes.
SMPH’s shares of stock are publicly traded in the Philippine Stock Exchange (PSE).
As at March 31, 2017, SMPH is 49.70% and 25.71% directly-owned by SM Investments Corporation (SMIC) and the Sy Family, respectively. SMIC, the ultimate parent company, is a Philippine corporation which listed its common shares with the PSE in 2005. SMIC and all its subsidiaries are herein referred to as the “SM Group”.
The registered office and principal place of business of the Parent Company is at 10th Floor, Mall of Asia Arena Annex Building, Coral Way cor. J.W. Diokno Blvd., Mall of Asia Complex, Brgy. 76, Zone 10, CBP-1A, Pasay City 1300.
2. Basis of Preparation
The accompanying interim condensed consolidated financial statements have been prepared on a historical cost basis, except for derivative financial instruments, investments held for trading and available-for-sale (AFS) investments which have been measured at fair value.
Statement of Compliance The interim condensed consolidated financial statements have been prepared in accordance with Philippine Accounting Standard (PAS) 34, Interim Financial Reporting. The interim condensed consolidated financial statements are presented in Philippine peso, which is the Parent Company’s functional and presentation currency under Philippine Financial Reporting Standards (PFRS). All values are rounded to the nearest thousand peso, except when otherwise indicated.
The interim condensed consolidated financial statements do not include all the information and disclosures required in the annual consolidated financial statements, and should be read in conjunction with the Company’s annual audited consolidated financial statements as at December 31, 2016.

- 2 -
Basis of Consolidation The interim condensed consolidated financial statements include the accounts of the Parent Company and all of its subsidiaries. As at March 31, 2017, there were no significant changes in the composition of the Company and in the Parent Company’s ownership interests in its subsidiaries.
Significant Accounting Judgments, Estimates and Assumptions The preparation of the interim condensed consolidated financial statements requires management to make judgments, estimates and assumptions that affect the reported amounts of revenue, expenses, assets and liabilities, and the disclosure of contingent liabilities, at the reporting date. However, uncertainty about these estimates and assumptions could result in outcomes that could require a material adjustment to the carrying amount of the affected asset or liability in the future.
Except as otherwise stated, there were no significant changes in the significant accounting judgments, estimates, and assumptions used by the Company for the three-month period ended March 31, 2017.
3. Summary of Significant Accounting and Financial Reporting Policies
Changes in Accounting Policies and Disclosures The accounting policies and method of computation adopted in the preparation of the interim condensed consolidated financial statements are consistent with those followed in the preparation of the Company’s annual consolidated financial statements for the year ended December 31, 2016, except for the following amendments which the Company has adopted starting January 1, 2017:
� Amendment to PFRS 12, Clarification of the Scope of the Standard (Part of Annual
Improvements to PFRS 2014–2016 Cycle), clarify that the disclosure requirements in PFRS 12, other than those relating to summarized financial information, apply to an entity’s interest in a subsidiary, a joint venture or an associate (or a portion of its interest in a joint venture or an associate) that is classified (or included in a disposal group that is classified) as held for sale. The amendments did not have any impact on the Company’s consolidated financial statements.
� Amendments to PAS 7, Statement of Cash Flows, Disclosure Initiative, require an entity to provide disclosures that enable users of financial statements to evaluate changes in liabilities arising from financing activities, including both changes arising from cash flows and non-cash changes (such as foreign exchange gains or losses). On initial application of the amendments, entities are not required to provide comparative information for preceding periods. Early application of the amendments is permitted. The amendments did not have any material impact on the Company’s consolidated financial statements.
� Amendments to PAS 12, Income Taxes, Recognition of Deferred Tax Assets for Unrealized
Losses, clarify that an entity needs to consider whether tax law restricts the sources of taxable profits against which it may make deductions on the reversal of that deductible temporary difference. Furthermore, the amendments provide guidance on how an entity should determine future taxable profits and explain the circumstances in which taxable profit may include the recovery of some assets for more than their carrying amount.
Entities are required to apply the amendments retrospectively. However, on initial application of the amendments, the change in the opening equity of the earliest comparative period may be recognized in opening retained earnings (or in another component of equity, as

- 3 -
appropriate), without allocating the change between opening retained earnings and other components of equity. Entities applying this relief must disclose that fact. Early application of the amendments is permitted. The amendments did not have any impact on the Company’s consolidated financial statements.
4. Segment Information
For management purposes, the Company is organized into business units based on their products and services, and has four reportable operating segments as follows: mall, residential, commercial and hotels and convention centers.
Mall segment develops, conducts, operates and maintains the business of modern commercial shopping centers and all businesses related thereto such as the conduct, operation and maintenance of shopping center spaces for rent, amusement centers, or cinema theaters within the compound of the shopping centers.
Residential and commercial segments are involved in the development and transformation of major residential, commercial, entertainment and tourism districts through sustained capital investments in buildings and infrastructure.
Hotels and convention centers segment engages in and carry on the business of hotel and convention centers and operates and maintains any and all services and facilities incident thereto.
Management monitors the operating results of its business units separately for the purpose of making decisions about resource allocation and performance assessment. Segment performance is evaluated based on operating profit or loss and is measured consistently with the operating profit or loss in the interim condensed consolidated financial statements.
The amount of segment assets and liabilities and segment profit or loss are based on measurement principles that are similar to those used in measuring the assets and liabilities and profit or loss in the interim condensed consolidated financial statements, which is in accordance with PFRS.
Inter-segment Transactions Inter-segment transactions are eliminated in the interim condensed consolidated financial statements.

- 4 -
Business Segment Data
Three-month period ended March 31, 2017 (Unaudited)
Mall Residential Commercial
Hotels and
Convention
Centers
Eliminations/
Adjustments
Consolidated
Balances
Revenue: (In Thousands)
External customers P=12,643,033 P=6,018,420 P=731,437 P=1,114,810 P=− P=20,507,700 Inter-segment 11,978 – 17,110 7,404 (36,492) −
P=12,655,011 P=6,018,420 P=748,547 P=1,122,214 (P=36,492) P=20,507,700
Segment results:
Income before income tax P=6,081,561 P=1,590,246 P=654,353 P=274,961 P=83,565 P=8,684,686
Provision for income tax (1,531,483) (229,152) (116,321) (62,812) – (1,939,768)
Net income P=4,550,078 P=1,361,094 P=538,032 P=212,149 P=83,565 P=6,744,918
Net income attributable to:
Equity holders of the Parent P=4,400,216 P=1,361,131 P=538,032 P=212,149 P=83,565 P=6,595,093 Non-controlling interests 149,862 (37) – – – 149,825
Other information: Capital expenditures P=5,643,001 P= 10,446,980 P=1,335,285 P=660,381 P=– P=18,085,647 Depreciation and amortization 1,878,079 45,910 84,797 132,405 – 2,141,191
Three-month period ended March 31, 2016 (Unaudited)
Mall Residential Commercial
Hotels andConvention
Centers Eliminations/Adjustments
ConsolidatedBalances
Revenue: (In Thousands)
External customers P=11,354,606 P=5,645,023 P=629,276 P=617,244 P=– P=18,246,149 Inter-segment 6,817 – 16,758 789 (24,364) −
P=11,361,423 P=5,645,023 P=646,034 P=618,033 (P=24,364) P=18,246,149
Segment results: Income before income tax P=5,438,332 P=1,507,342 P=507,883 P=121,190 P=38,187 P=7,612,934 Provision for income tax (1,304,840) (205,437) (88,088) (33,087) – (1,631,452)
Net income P=4,133,492 P=1,301,905 P=419,795 P=88,103 P=38,187 P=5,981,482
Net income attributable to: Equity holders of the Parent P=3,987,892 P=1,301,905 P=419,795 P=88,103 P=38,187 P=5,835,882 Non-controlling interests 145,600 – – – – 145,600
Other information: Capital expenditures P=5,365,994 P=2,352,525 P=127,412 P=589,784 P=– P=8,435,715 Depreciation and amortization 1,690,356 41,863 85,352 70,922 – 1,888,493
March 31, 2017 (Unaudited)
Mall Residential Commercial
Hotels and
Convention
Centers Eliminations
Consolidated
Balances
(In Thousands)
Segment assets P=323,373,589 P=118,263,989 P=34,088,250 P=12,570,319 (P=1,164,076) P=487,132,071
Segment liabilities P=182,096,103 P=58,110,373 P=2,723,196 P=1,516,519 (P=1,164,076) P=243,282,115
December 31, 2016 (Audited)
Mall Residential Commercial
Hotels andConvention
Centers Eliminations Consolidated
Balances
(In Thousands)
Segment assets P=311,310,987 P=110,461,400 P=33,195,556 P=11,748,400 (P=1,156,211) P=465,560,132
Segment liabilities P=176,037,532 P=52,504,057 P=2,190,109 P=621,101 (P=1,156,211) P=230,196,588
For the three-month periods ended March 31, 2017 and 2016, there were no revenue transactions with a single external customer which accounted for 10% or more of the consolidated revenue from external customers.

- 5 -
5. Business Combination
Common Control Business Acquisitions In December 2016, the Parent Company, through Prime_Commercial Property Management Corporation, acquired 90% each of the outstanding common stock of Shopping Center Management Corporation and SM Lifestyle Entertainment Inc. The companies involved are all under the common control by the Sy Family. Thus, the acquisitions were considered as common control business combinations and were accounted for using the pooling of interest method. Assets, liabilities and equity of the acquired businesses are included in the consolidated financial statements at their carrying amounts. No restatement of prior period was made as a result of the acquisitions due to immateriality. The excess of the cost of business combination over the net carrying amounts amounting to P=242 million is included under “Additional paid-in capital - net” account in the equity section of the consolidated balance sheets.
6. Cash and Cash Equivalents
Cash and cash equivalents comprised the following:
March 31,
2017
(Unaudited)
December 31, 2016
(Audited)
(In Thousands)
Cash on hand and in banks (see Note 20) P=1,829,798 P=1,657,565 Temporary investments (see Note 20) 25,142,524 23,543,417
P=26,972,322 P=25,200,982
Interest income earned from cash in banks and temporary investments amounted to P=110 million and P=95 million for the three-month periods ended March 31, 2017 and 2016, respectively (see Note 23).
7. Investments Held for Trading
This account consists of investments in Philippine and United States (U.S.) corporate bonds and listed common shares. The Philippine government and corporate bonds have yields ranging from 2.58% to 7.22% as at March 31, 2017 and December 31, 2016. The Philippine-denominated and U.S. dollar-denominated corporate bonds will mature in 2017.
The movements in this account are as follows:
March 31,
2017
(Three Months)
(Unaudited)
December 31, 2016
(One Year)(Audited)
(In Thousands)
At beginning of the period P=918,702 P=843,256 Mark-to-market gain (loss) during the period 44,202 61,424 Unrealized foreign exchange gain 2,354 14,022
At end of the period P=965,258 P=918,702
- 6 -
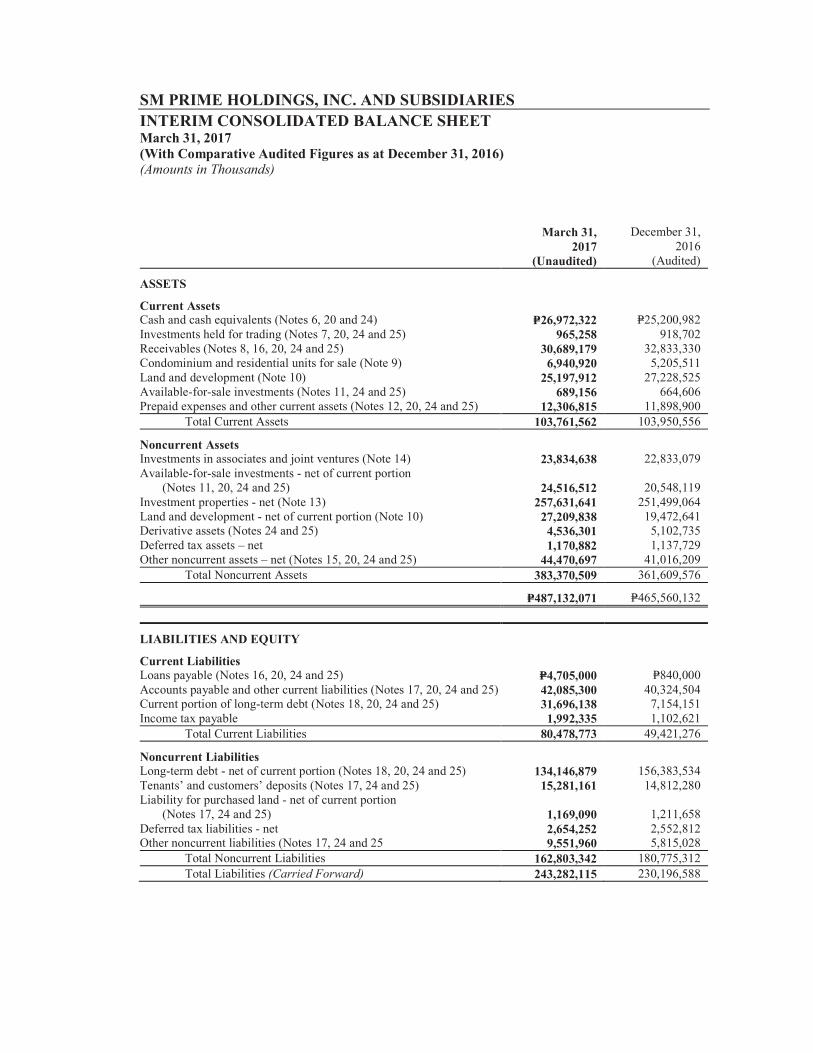
Mark-to-market gain (loss) on changes in fair value of investments held for trading are included under “Others - net” account in the interim consolidated statements of income.
Interest income earned from investments held for trading amounted to P=5 million and P=4 million for the three-month periods ended March 31, 2017 and 2016, respectively (see Note 23).
8. Receivables
This account consists of:
March 31,
2017
(Unaudited)
December 31, 2016
(Audited) (In Thousands)
Trade: Sale of real estate P=36,065,108 P=34,390,089 Rent:
Third parties 4,473,941 4,553,363 Related parties (see Note 20) 2,031,405 2,495,732 Others 53,064 143,754 Receivable from a co-investor 272,022 267,390Accrued interest (see Note 20) 131,509 115,680 Due from related parties (see Note 20) 40,855 166,818 Nontrade 23,289 19,145 Others (see Note 20) 1,958,420 2,174,413
45,049,613 44,326,384 Less allowance for impairment 969,978 966,427
44,079,635 43,359,957 Less noncurrent portion of receivables from sale
of real estate (see Note 15) 13,390,456 10,526,627
P=30,689,179 P=32,833,330
Receivables, except for those that are impaired, are assessed by the Company’s management as not impaired, good and collectible.
Interest income earned from receivables amounted to P=16 million and P=13 million for the three-month periods ended March 31, 2017 and 2016, respectively (see Note 23).
The movements in the allowance for impairment related to receivables from sale of real estate and other receivables are as follows:
March 31,
2017
(Three Months)
(Unaudited)
December 31,2016
(One Year)(Audited)
(In Thousands)
At beginning of the period P=966,427 P=965,859Provision for impairment - net 3,551 568
At end of the period P=969,978 P=966,427
- 7 -
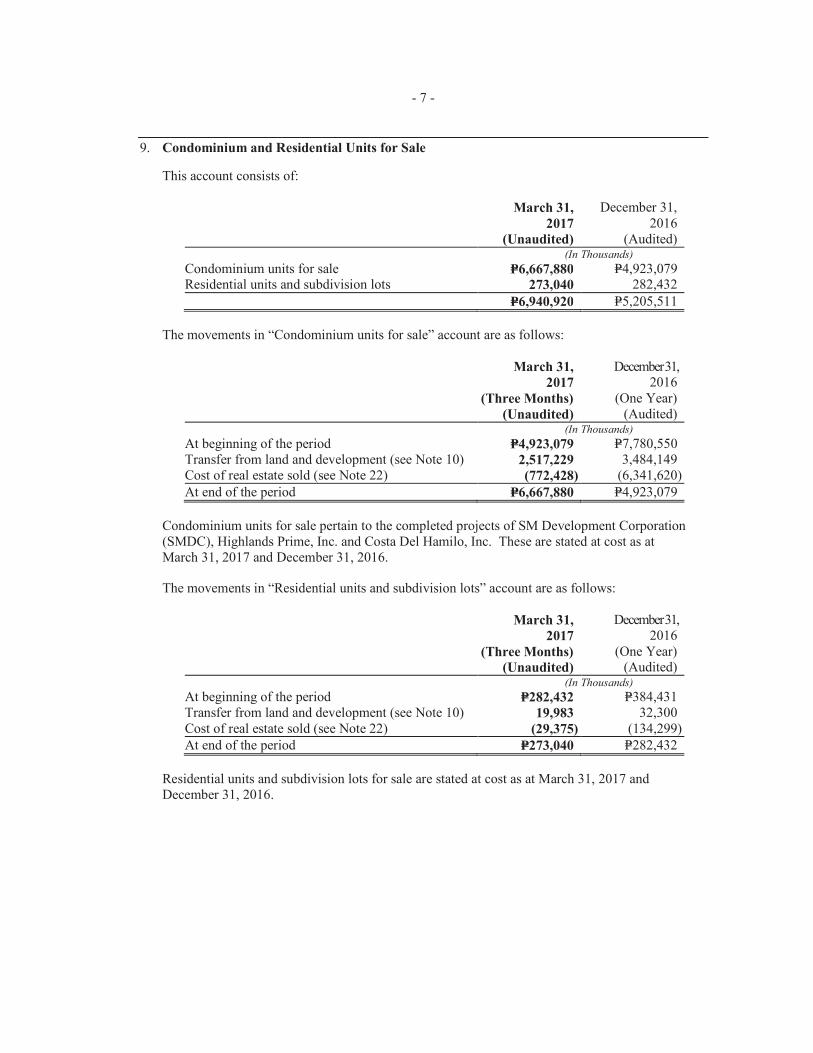
9. Condominium and Residential Units for Sale
This account consists of:
March 31,
2017
(Unaudited)
December 31, 2016
(Audited) (In Thousands)
Condominium units for sale P=6,667,880 P=4,923,079Residential units and subdivision lots 273,040 282,432
P=6,940,920 P=5,205,511
The movements in “Condominium units for sale” account are as follows:
March 31,
2017
(Three Months)
(Unaudited)
December 31,2016
(One Year)(Audited)
(In Thousands)
At beginning of the period P=4,923,079 P=7,780,550 Transfer from land and development (see Note 10) 2,517,229 3,484,149 Cost of real estate sold (see Note 22) (772,428) (6,341,620)
At end of the period P=6,667,880 P=4,923,079
Condominium units for sale pertain to the completed projects of SM Development Corporation (SMDC), Highlands Prime, Inc. and Costa Del Hamilo, Inc. These are stated at cost as at March 31, 2017 and December 31, 2016.
The movements in “Residential units and subdivision lots” account are as follows:
March 31,
2017
(Three Months)
(Unaudited)
December 31,2016
(One Year)(Audited)
(In Thousands)
At beginning of the period P=282,432 P=384,431 Transfer from land and development (see Note 10) 19,983 32,300 Cost of real estate sold (see Note 22) (29,375) (134,299)
At end of the period P=273,040 P=282,432
Residential units and subdivision lots for sale are stated at cost as at March 31, 2017 and December 31, 2016.
- 8 -
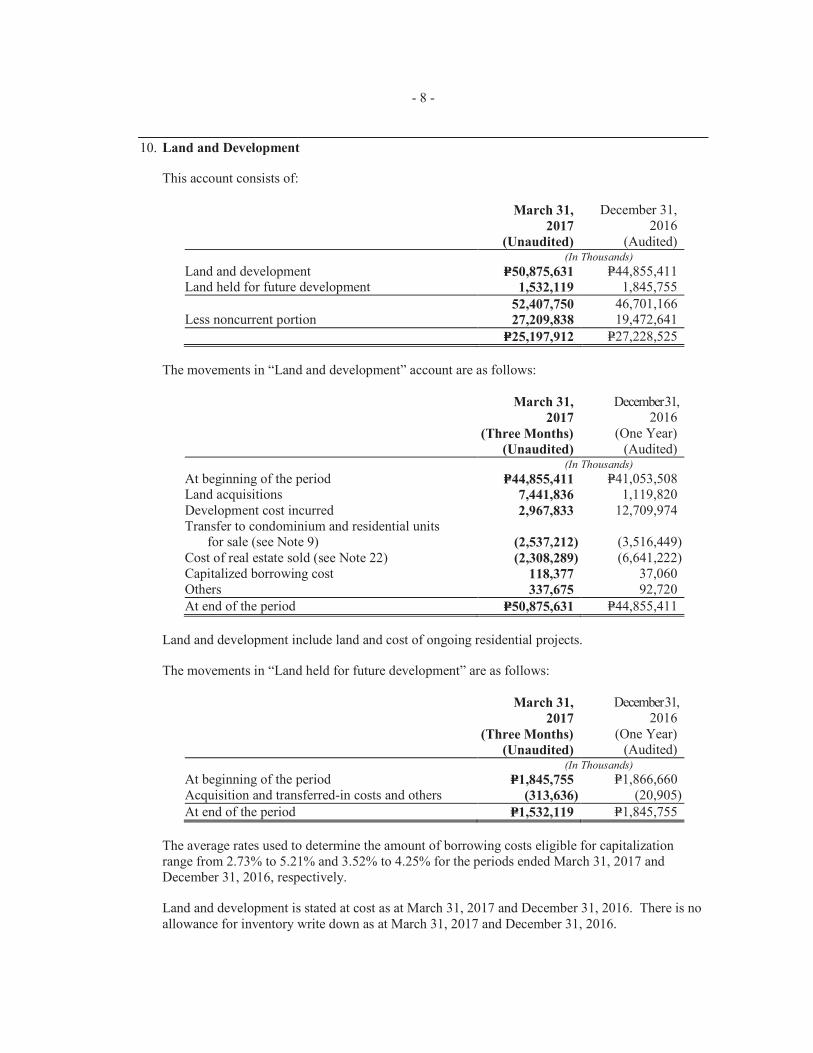
10. Land and Development
This account consists of:
March 31,
2017
(Unaudited)
December 31, 2016
(Audited) (In Thousands)
Land and development P=50,875,631 P=44,855,411Land held for future development 1,532,119 1,845,755
52,407,750 46,701,166Less noncurrent portion 27,209,838 19,472,641
P=25,197,912 P=27,228,525
The movements in “Land and development” account are as follows:
March 31,
2017
(Three Months)
(Unaudited)
December 31,2016
(One Year)(Audited)
(In Thousands)
At beginning of the period P=44,855,411 P=41,053,508Land acquisitions 7,441,836 1,119,820 Development cost incurred 2,967,833 12,709,974 Transfer to condominium and residential units
for sale (see Note 9) (2,537,212) (3,516,449)Cost of real estate sold (see Note 22) (2,308,289) (6,641,222)Capitalized borrowing cost 118,377 37,060 Others 337,675 92,720
At end of the period P=50,875,631 P=44,855,411
Land and development include land and cost of ongoing residential projects.
The movements in “Land held for future development” are as follows:
March 31,
2017
(Three Months)
(Unaudited)
December 31,2016
(One Year)(Audited)
(In Thousands)
At beginning of the period P=1,845,755 P=1,866,660 Acquisition and transferred-in costs and others (313,636) (20,905)
At end of the period P=1,532,119 P=1,845,755
The average rates used to determine the amount of borrowing costs eligible for capitalization range from 2.73% to 5.21% and 3.52% to 4.25% for the periods ended March 31, 2017 and December 31, 2016, respectively.
Land and development is stated at cost as at March 31, 2017 and December 31, 2016. There is no allowance for inventory write down as at March 31, 2017 and December 31, 2016.
- 9 -
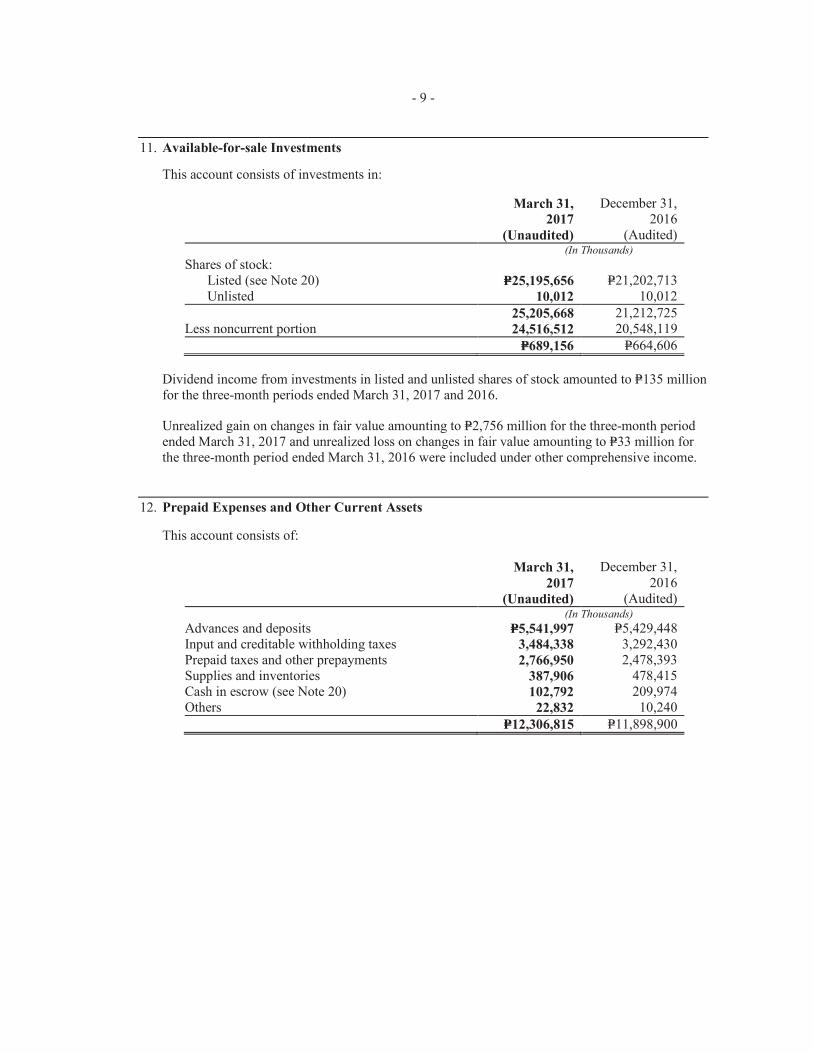
11. Available-for-sale Investments
This account consists of investments in:
March 31,
2017
(Unaudited)
December 31, 2016
(Audited) (In Thousands)
Shares of stock: Listed (see Note 20) P=25,195,656 P=21,202,713 Unlisted 10,012 10,012
25,205,668 21,212,725 Less noncurrent portion 24,516,512 20,548,119
P=689,156 P=664,606
Dividend income from investments in listed and unlisted shares of stock amounted to P=135 million for the three-month periods ended March 31, 2017 and 2016.
Unrealized gain on changes in fair value amounting to P=2,756 million for the three-month period ended March 31, 2017 and unrealized loss on changes in fair value amounting to P=33 million for the three-month period ended March 31, 2016 were included under other comprehensive income.
12. Prepaid Expenses and Other Current Assets
This account consists of:
March 31,
2017
(Unaudited)
December 31, 2016
(Audited) (In Thousands)
Advances and deposits P=5,541,997 P=5,429,448 Input and creditable withholding taxes 3,484,338 3,292,430 Prepaid taxes and other prepayments 2,766,950 2,478,393 Supplies and inventories 387,906 478,415 Cash in escrow (see Note 20) 102,792 209,974 Others 22,832 10,240
P=12,306,815 P=11,898,900

- 10 -
13. Investment Properties
The movements in this account are as follows:
Land andImprovements
Buildings andImprovements
BuildingEquipment,
Furnitureand Others
Constructionin Progress Total
(In Thousands)
Cost Balance as at December 31, 2015 P=59,205,015 P=161,396,681 P=29,014,566 P=31,964,876 P=281,581,138 Effect of common control business combination
(Notes 2 and 5) 34,819 – 102,634 – 137,453
Additions 5,638,320 7,002,148 3,580,221 13,212,070 29,432,759Reclassifications (see Note 15) (1,523,350) 21,476,766 354,248 (20,575,261) (267,597)Translation adjustment (18,575) (271,994) (30,712) (162,890) (484,171)Disposals (173,291) (10,535) (29,063) – (212,889)
Balance as at December 31, 2016 63,162,938 189,593,066 32,991,894 24,438,795 310,186,693 Additions 900,141 1,174,769 443,757 5,118,098 7,636,765 Reclassifications (356,919) 3,041,768 (43,957) (2,640,892) –
Translation adjustment 18,248 592,926 46,727 52,055 709,956 Disposals – (62,480) (252) – (62,732)
Balance as at March 31, 2017 P=63,724,408 P=194,340,049 P=33,438,169 P=26,968,056 P=318,470,682
Accumulated Depreciation and Amortization Balance as at December 31, 2015 P=1,625,432 P=32,894,247 P=16,721,060 P=– P=51,240,739 Effect of common control business combination
(Notes 2 and 5) 20,972 89,402 – – 110,374 Depreciation and amortization (see Note 22) 192,761 4,891,150 2,465,397 – 7,549,308 Reclassifications (see Note 15) (53,910) 82,369 (67,651) – (39,192)Translation adjustment (5,838) (42,625) (13,615) – (62,078)Disposals (78,986) (10,535) (22,001) – (111,522)
Balance as at December 31, 2016 1,700,431 37,904,008 19,083,190 – 58,687,629 Depreciation and amortization (see Note 22) 36,689 1,383,065 652,954 – 2,072,708
Reclassifications – 5,983 (5,983) – –
Translation adjustment 8,554 71,503 21,619 – 101,676 Disposals – (22,746) (226) – (22,972)
Balance as at March 31, 2017 P=1,745,674 P=39,341,813 P=19,751,554 P=– P=60,839,041
Net Book Value As at December 31, 2016 P=61,462,507 P=151,689,058 P=13,908,704 P=24,438,795 P=251,499,064
As at March 31, 2017 61,978,734 154,998,236 13,686,615 26,968,056 257,631,641
In 2017, shopping mall complex under construction mainly pertains to cost incurred for the development of SM Cagayan de Oro Premier, SM Puerto Princesa, SM Tuguegarao Downtown, SM Lemery and the ongoing redevelopment of SM Mall of Asia.
Construction contracts with various contractors related to the construction of the on-going projects amounted to P=104,725 million and P=109,324 million as at March 31, 2017 and December 31, 2016, respectively, inclusive of overhead, cost of labor and materials and all other costs necessary for the proper execution of the works. The outstanding contracts are valued at P=18,490 million and P=20,059 million as at March 31, 2017 and December 31, 2016, respectively.
Interest capitalized to the construction of investment properties amounted to P=600 million and P=2,921 million and capitalization rates used range from 2.35% to 4.14% and from 2.35% to 4.82%, for the periods ended March 31, 2017 and December 31, 2016, respectively.
The fair value of investment properties amounted to P=800,445 million as at December 31, 2015 as determined by an independent appraiser who holds a recognized and relevant professional qualification. The valuation of investment properties was based on market values using income approach. The fair value represents the amount at which the assets can be exchanged between a knowledgeable, willing seller and a knowledgeable, willing buyer in an arm’s length transaction at the date of valuation, in accordance with International Valuation Standards as set out by the International Valuation Standards Committee.

- 11 -
Below are the significant assumptions used in the valuation:
Discount rate 8.00%–11.00% Capitalization rate 5.75%–8.50%Average growth rate 2.34%–12.08%
Investment properties are categorized under Level 3 fair value measurement.
While fair value of the investment properties was not determined as at March 31, 2017, the Company’s management believes that there were no conditions present in 2016 and 2017 that would significantly reduce the fair value of the investment properties from that determined on December 31, 2015.
The Company has no restriction on the realizability of its investment properties and no obligation to either purchase, construct or develop or for repairs, maintenance and enhancements.
14. Investments in Associates and Joint Ventures
Investments in Associates This pertains mainly to investments in the following companies:
• OCLP Holdings, Inc. (OHI)
• Fei Hua Real Estate Company (FHREC)
On May 7, 2015, SMPH acquired 39.96% collective ownership interest in OHI, through acquisition of 100% interest in six (6) holding entities, for a total consideration of P=15,433 million, which approximates the proportionate share of SMPH in the fair values of the identifiable net assets of OHI based on the provisional amounts. OHI owns strategic residential, commercial and landbank areas in key cities in Metro Manila.
As at March 31, 2017, OHI’s total assets, total liabilities and total equity amounted to P=22,477 million, P=17,955 million and P=4,522 million, respectively, and the carrying value of investment in OHI amounted to P=15,762 million, which consists of its proportionate share in the net assets of OHI amounting to P=1,661 million and fair value adjustments and others totaling P=14,101 million.
As at December 31, 2016, OHI’s total assets, total liabilities and total equity amounted to P=22,017 million, P=17,866 million and P=4,151 million, respectively.
The share in profit and total comprehensive income amounted to P=158 million and P=40 million for the three-month periods ended March 31, 2017 and 2016.
The carrying value of investment in FHREC amounted to P=1,177 million and P=1,156 million as at March 31, 2017 and December 31, 2016, respectively, with cumulative equity in net earnings amounting to P=898 million and P=882 million as at March 31, 2017 and December 31, 2016, respectively.
Investment in Joint Ventures This significantly pertains to the 51% ownership interest of the Company in Waltermart. Waltermart is involved in shopping mall operations and currently owns 23 malls across Metro Manila and Luzon.

- 12 -
The aggregate carrying values of investments in Waltermart amounted to P=5,823 million and P=5,773 million as at March 31, 2017 and December 31, 2016, respectively. These consist of the acquisition costs totaling P=5,145 million and cumulative equity in net earnings and dividend totaling P=678 million and P=628 million as at March 31, 2017 and December 31, 2016, respectively. The aggregate share in profit and total comprehensive income, net of dividend received, amounted to P=50 million and P=45 million for the three-month periods ended March 31, 2017 and 2016, respectively.
In June 2016, SMDC entered into a shareholder’s agreement through ST 6747 Resources Corporation (STRC) for the development of a high-end luxury residential project. Under the provisions of the agreement, each party shall have 50% ownership interest and is required to maintain each party’s equal equity interest in STRC.
As at March 31, 2017 the development of the high-end luxury residential project has not yet started. The carrying value of investment in STRC amounted to P=1,000 million and P=250 million as at March 31, 2017 and December 31, 2016, respectively.
Investments in associates and joint ventures are accounted for using the equity method.
The Company has no outstanding contingent liabilities or capital commitments related to its investments in associates and joint ventures as at March 31, 2017 and December 31, 2016.
15. Other Noncurrent Assets
This account consists of:
March 31,
2017
(Unaudited)
December 31, 2016
(Audited) (In Thousands)
Receivables from sale of real estate - net of current portion (see Note 8) P=13,390,456 P=10,526,627
Bonds and deposits 11,936,062 11,757,626 Land use rights (see Note 13) 10,298,445 9,727,575 Time deposits (see Note 20) 3,739,270 3,955,706 Deferred input tax 1,877,581 1,793,284Property and equipment - net 1,590,129 1,619,601 Others 1,638,754 1,635,790
P=44,470,697 P=41,016,209
Interest income earned from time deposits amounted to P=12 million and P=20 million for the three-month periods ended March 31, 2017 and 2016, respectively (see Note 23).
Property and equipment is net of accumulated depreciation of P=1,517 million and P=1,449 million as of March 31, 2017 and December 31, 2016, respectively.

- 13 -
16. Loans Payable
This account consists of unsecured Philippine peso-denominated loans obtained from local banks amounting to P=4,705 million and P=840 million as at March 31, 2017 and December 31, 2016, respectively, with due dates of less than one year. These loans bear interest rates of 2.60% to 3.75% in 2017 and 2.50% to 3.00% in 2016.
Interest expense incurred from loans payable amounted to P=5 million and P=12 million for the three-month periods ended March 31, 2017 and 2016, respectively (see Note 23).
17. Accounts Payable and Other Current Liabilities
This account consists of:
March 31,
2017
(Unaudited)
December 31, 2016
(Audited) (In Thousands)
Trade: Third parties P=20,341,650 P=18,307,072
Related parties (see Note 20) 47,694 66,577Tenants’ and customers’ deposits 20,057,802 20,751,201 Accrued operating expenses:
Third parties 10,124,401 9,546,512 Related parties (see Note 20) 574,599 574,278 Liability for purchased land 4,427,969 4,279,327 Deferred output VAT 1,537,318 1,426,140 Accrued interest (see Note 20) 1,358,280 1,118,214 Payable to government agencies 395,623 570,947 Nontrade 384,018 370,827Due to related parties (see Note 20) 71,065 66,356 Others 598,788 541,007
59,919,207 57,618,458 Less noncurrent portion 17,833,907 17,293,954
P=42,085,300 P=40,324,504
Accrued operating expenses - third parties consist of:
March 31,
2017
(Unaudited)
December 31, 2016
(Audited) (In Thousands)
Utilities P=3,576,878 P=4,572,637Marketing and advertising 593,620 581,957 Payable to contractors and others 5,953,903 4,391,918
P=10,124,401 P=9,546,512

- 14 -
18. Long-term Debt
This account consists of: Availment Date Maturity Date Interest Rate Condition Outstanding Balance
March 31, 2017 December 31, 2016
Parent Company (In Thousands)
U.S. dollar-denominated loans December 7, 2012–September 3, 2013 August 30, 2017–March 25, 2018 LIBOR + spread; semi-annual Unsecured P=27,588,000 P=27,346,000 Philippine peso-denominated loans January 12, 2012–July 26, 2016 January 13, 2017–July 26, 2026 Floating PDST-R2 + margin; 4.20%–6.74% Unsecured 76,438,100 77,201,000 Subsidiaries
U.S. dollar-denominated loans April 23, 2014–March 21, 2016 April 14, 2019–January 29, 2021 LIBOR + spread; semi-annual Unsecured 28,178,741 27,895,172 Philippine peso-denominated loans June 3, 2013–March 9, 2017 December 18, 2018–June 27, 2023 Floating PDST-R2 + margin; 3.13%–5.88% Unsecured 33,612,953 31,612,567 China yuan renminbi-denominated loans July 28, 2015–March 29, 2017 December 31, 2019–June 1, 2020 CBC rate less 10%; quarterly Secured 980,984 524,743
166,798,778 164,579,482 Less debt issue cost 955,761 1,041,797
165,843,017 163,537,685 Less current portion 31,696,138 7,154,151
P=134,146,879 P=156,383,534
LIBOR – London Interbank Offered Rate
PDST-R2 – Philippine Treasury Reference Rates – PM
CBC – Central Bank of China
- 15 -
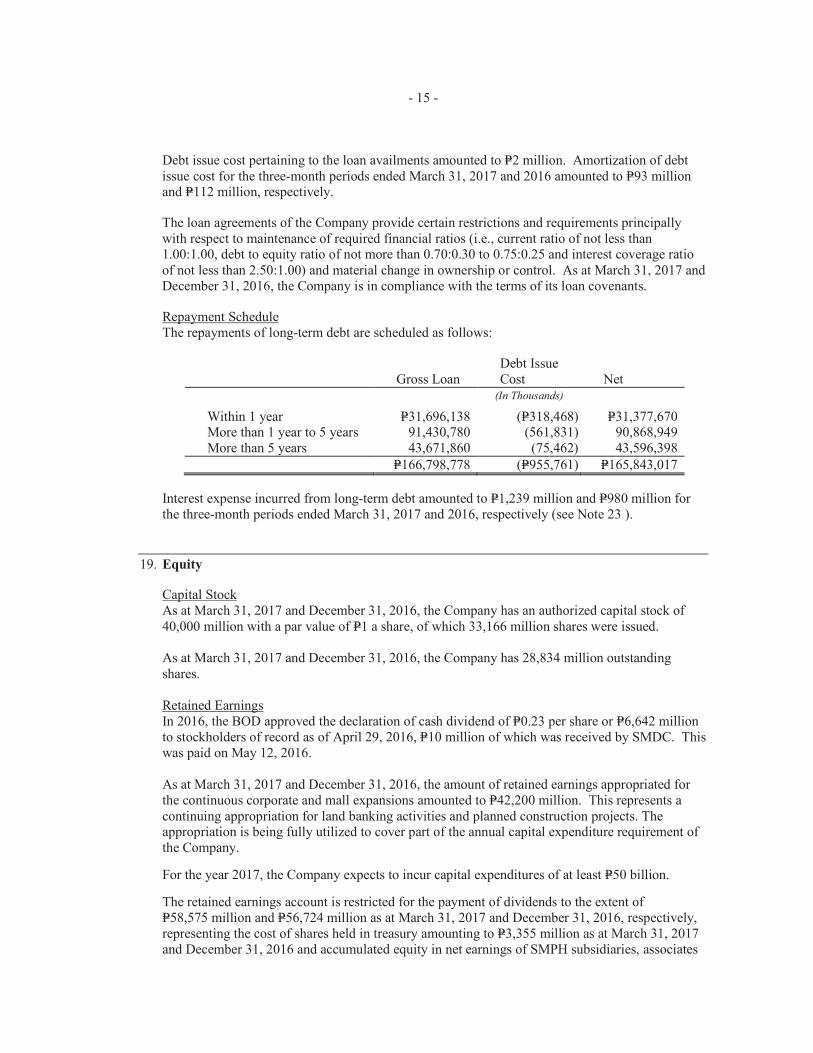
Debt issue cost pertaining to the loan availments amounted to P=2 million. Amortization of debt issue cost for the three-month periods ended March 31, 2017 and 2016 amounted to P=93 million and P=112 million, respectively.
The loan agreements of the Company provide certain restrictions and requirements principally with respect to maintenance of required financial ratios (i.e., current ratio of not less than 1.00:1.00, debt to equity ratio of not more than 0.70:0.30 to 0.75:0.25 and interest coverage ratio of not less than 2.50:1.00) and material change in ownership or control. As at March 31, 2017 and December 31, 2016, the Company is in compliance with the terms of its loan covenants.
Repayment Schedule The repayments of long-term debt are scheduled as follows:
Gross Loan Debt Issue Cost Net
(In Thousands)
Within 1 year P=31,696,138 (P=318,468) P=31,377,670 More than 1 year to 5 years 91,430,780 (561,831) 90,868,949 More than 5 years 43,671,860 (75,462) 43,596,398
P=166,798,778 (P=955,761) P=165,843,017
Interest expense incurred from long-term debt amounted to P=1,239 million and P=980 million for the three-month periods ended March 31, 2017 and 2016, respectively (see Note 23 ).
19. Equity
Capital Stock As at March 31, 2017 and December 31, 2016, the Company has an authorized capital stock of 40,000 million with a par value of P=1 a share, of which 33,166 million shares were issued.
As at March 31, 2017 and December 31, 2016, the Company has 28,834 million outstanding shares.
Retained Earnings In 2016, the BOD approved the declaration of cash dividend of P=0.23 per share or P=6,642 million to stockholders of record as of April 29, 2016, P=10 million of which was received by SMDC. This was paid on May 12, 2016.
As at March 31, 2017 and December 31, 2016, the amount of retained earnings appropriated for the continuous corporate and mall expansions amounted to P=42,200 million. This represents a continuing appropriation for land banking activities and planned construction projects. The appropriation is being fully utilized to cover part of the annual capital expenditure requirement of the Company.
For the year 2017, the Company expects to incur capital expenditures of at least P=50 billion.
The retained earnings account is restricted for the payment of dividends to the extent of P=58,575 million and P=56,724 million as at March 31, 2017 and December 31, 2016, respectively, representing the cost of shares held in treasury amounting to P=3,355 million as at March 31, 2017 and December 31, 2016 and accumulated equity in net earnings of SMPH subsidiaries, associates
- 16 -
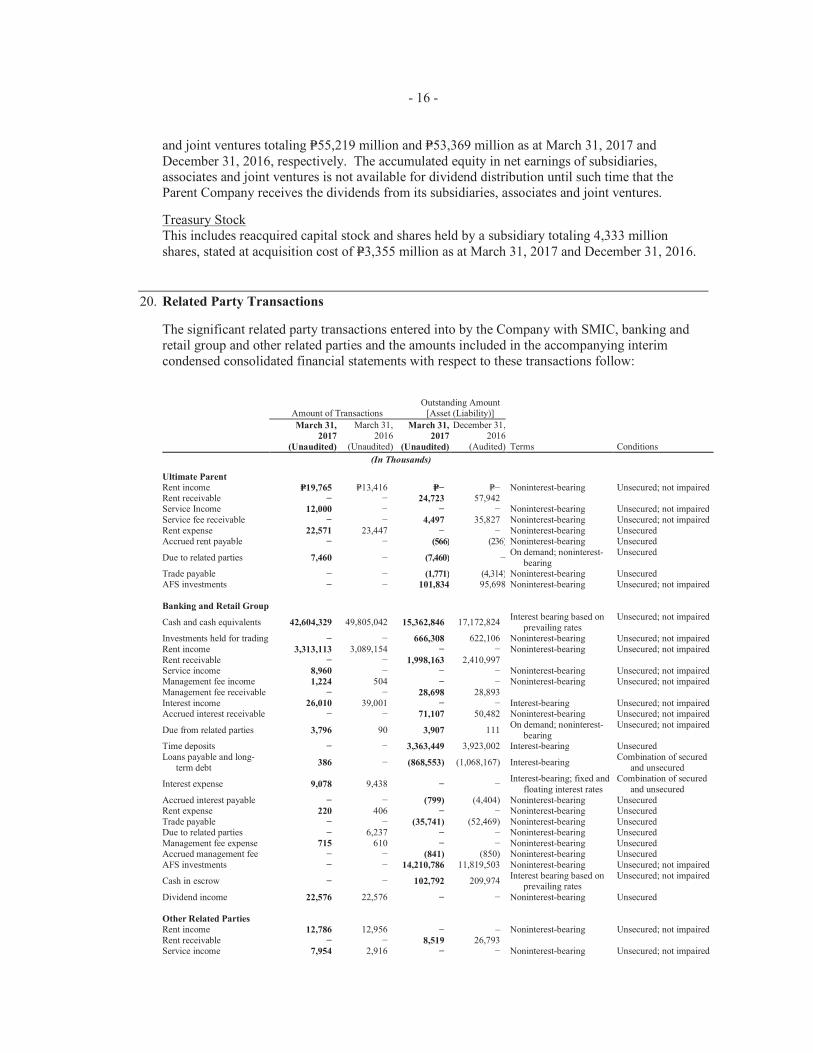
and joint ventures totaling P=55,219 million and P=53,369 million as at March 31, 2017 and December 31, 2016, respectively. The accumulated equity in net earnings of subsidiaries, associates and joint ventures is not available for dividend distribution until such time that the Parent Company receives the dividends from its subsidiaries, associates and joint ventures.
Treasury Stock This includes reacquired capital stock and shares held by a subsidiary totaling 4,333 million shares, stated at acquisition cost of P=3,355 million as at March 31, 2017 and December 31, 2016.
20. Related Party Transactions
The significant related party transactions entered into by the Company with SMIC, banking and retail group and other related parties and the amounts included in the accompanying interim condensed consolidated financial statements with respect to these transactions follow:
Amount of Transactions Outstanding Amount
[Asset (Liability)]
March 31,
2017
(Unaudited)
March 31, 2016
(Unaudited)
March 31,
2017
(Unaudited)
December 31, 2016
(Audited) Terms Conditions
(In Thousands)
Ultimate Parent Rent income P=19,765 P=13,416 P=− P=− Noninterest-bearing Unsecured; not impairedRent receivable − − 24,723 57,942 Service Income 12,000 − − − Noninterest-bearing Unsecured; not impairedService fee receivable − − 4,497 35,827 Noninterest-bearing Unsecured; not impairedRent expense 22,571 23,447 − − Noninterest-bearing Unsecured Accrued rent payable − − (566) (236) Noninterest-bearing Unsecured
Due to related parties 7,460 − (7,460) −On demand; noninterest-
bearing Unsecured
Trade payable − − (1,771) (4,314) Noninterest-bearing Unsecured AFS investments − − 101,834 95,698 Noninterest-bearing Unsecured; not impaired
Banking and Retail Group
Cash and cash equivalents 42,604,329 49,805,042 15,362,846 17,172,824 Interest bearing based on
prevailing rates Unsecured; not impaired
Investments held for trading − − 666,308 622,106 Noninterest-bearing Unsecured; not impairedRent income 3,313,113 3,089,154 − − Noninterest-bearing Unsecured; not impairedRent receivable − − 1,998,163 2,410,997 Service income 8,960 − − − Noninterest-bearing Unsecured; not impairedManagement fee income 1,224 504 − − Noninterest-bearing Unsecured; not impairedManagement fee receivable − − 28,698 28,893 Interest income 26,010 39,001 − − Interest-bearing Unsecured; not impairedAccrued interest receivable − − 71,107 50,482 Noninterest-bearing Unsecured; not impaired
Due from related parties 3,796 90 3,907 111 On demand; noninterest-
bearing Unsecured; not impaired
Time deposits − − 3,363,449 3,923,002 Interest-bearing UnsecuredLoans payable and long-
term debt 386 − (868,553) (1,068,167) Interest-bearing
Combination of secured and unsecured
Interest expense 9,078 9,438 − − Interest-bearing; fixed and
floating interest rates Combination of secured
and unsecured Accrued interest payable − − (799) (4,404) Noninterest-bearing Unsecured Rent expense 220 406 − − Noninterest-bearing Unsecured Trade payable − − (35,741) (52,469) Noninterest-bearing Unsecured Due to related parties − 6,237 − − Noninterest-bearing Unsecured Management fee expense 715 610 − − Noninterest-bearing Unsecured Accrued management fee − − (841) (850) Noninterest-bearing Unsecured AFS investments − − 14,210,786 11,819,503 Noninterest-bearing Unsecured; not impaired
Cash in escrow − − 102,792 209,974 Interest bearing based on
prevailing ratesUnsecured; not impaired
Dividend income 22,576 22,576 − − Noninterest-bearing Unsecured
Other Related Parties
Rent income 12,786 12,956 − – Noninterest-bearing Unsecured; not impairedRent receivable − − 8,519 26,793 Service income 7,954 2,916 − − Noninterest-bearing Unsecured; not impaired

- 17 -
Amount of Transactions Outstanding Amount
[Asset (Liability)]
March 31,
2017
(Unaudited)
March 31, 2016
(Unaudited)
March 31,
2017
(Unaudited)
December 31, 2016
(Audited) Terms Conditions
(In Thousands)
Due from related parties P=− P=130,913 P=36,948 P=166,707 On demand; noninterest-
bearing Unsecured; not impaired
Management fee income 790 − − −
Management fee receivable − − 7,993 7,993 Noninterest-bearing Unsecured; not impaired
Rent expense 1,337 1,275 − − Due to related parties − 1,373 (63,605) (66,356) Noninterest-bearing Unsecured Accrued expenses − − (573,192) (573,192) Noninterest-bearing Unsecured Accrued management fee − − − − Noninterest-bearing Unsecured Trade payable 388 − (10,182) (9,794) Noninterest-bearing Unsecured AFS investments − − 2,942,213 2,353,772 Noninterest-bearing Unsecured; not impairedDividend income 69,878 69,878 − − Noninterest-bearing Unsecured
Compensation of Key Management Personnel The aggregate compensation and benefits related to key management personnel for the three-month periods ended March 31, 2017 and 2016 consist of short-term employee benefits amounting to P=192 million and P=96 million, respectively, and post-employment benefits (pension benefits) amounting to P=40 million and P=12 million in both periods.
21. Other Revenue
This account consists of:
March 31,
2017
(Unaudited)
March 31, 2016
(Unaudited) (In Thousands)
Food and beverages P=415,388 P=216,488 Amusement and others 225,087 208,093 Net merchandise sales 184,321 160,786
Bowling and ice skating fees 53,355 59,688 Advertising income 41,755 51,452 Others 362,487 191,005
P=1,282,393 P=887,512
Others include service fees, parking terminal, sponsorships, commissions and membership revenue.
22. Costs and Expenses
This account consists of:
March 31,
2017
(Unaudited)
March 31, 2016
(Unaudited)
(In Thousands)
Cost of real estate sold (see Notes 9 and 10) P=3,110,092 P=2,918,738 Depreciation and amortization
(see Notes 13 and 15) 2,141,191 1,888,493 (Forward)
- 18 -
March 31,
2017
(Unaudited)
March 31, 2016
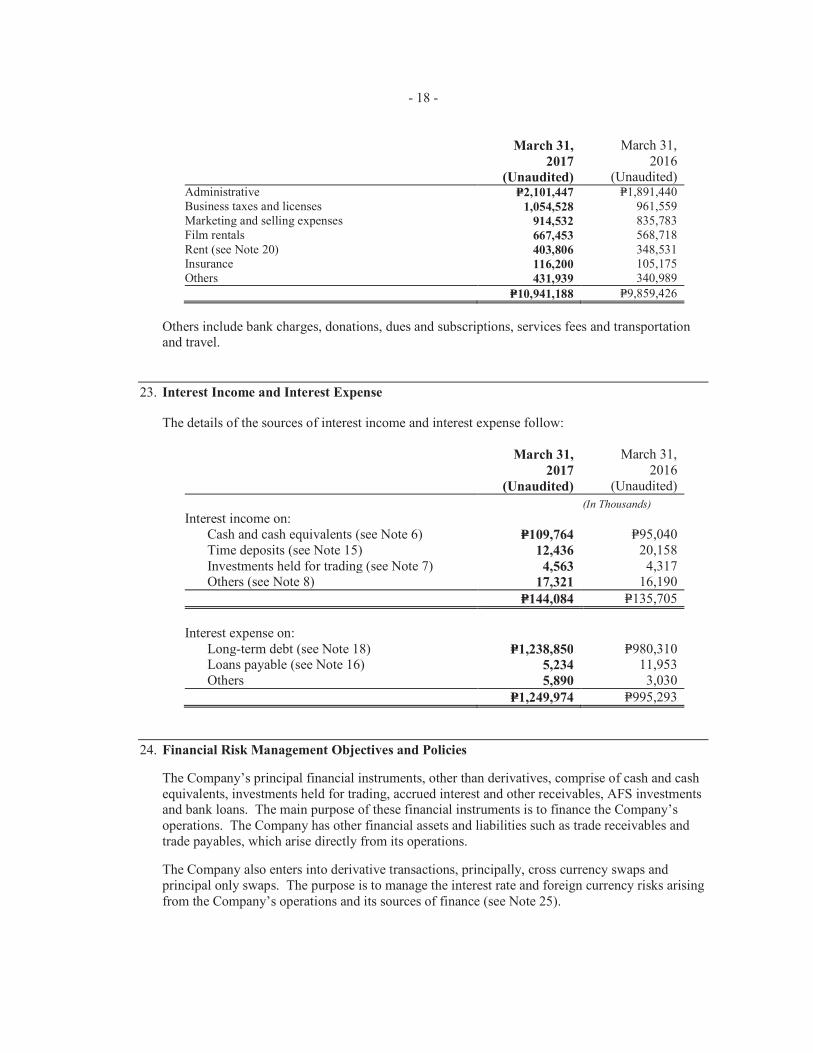
(Unaudited) Administrative P=2,101,447 P=1,891,440 Business taxes and licenses 1,054,528 961,559 Marketing and selling expenses 914,532 835,783 Film rentals 667,453 568,718
Rent (see Note 20) 403,806 348,531 Insurance 116,200 105,175 Others 431,939 340,989
P=10,941,188 P=9,859,426
Others include bank charges, donations, dues and subscriptions, services fees and transportation and travel.
23. Interest Income and Interest Expense
The details of the sources of interest income and interest expense follow:
March 31,
2017
(Unaudited)
March 31, 2016
(Unaudited)
(In Thousands)
Interest income on: Cash and cash equivalents (see Note 6) P=109,764 P=95,040 Time deposits (see Note 15) 12,436 20,158
Investments held for trading (see Note 7) 4,563 4,317 Others (see Note 8) 17,321 16,190
P=144,084 P=135,705
Interest expense on: Long-term debt (see Note 18) P=1,238,850 P=980,310
Loans payable (see Note 16) 5,234 11,953 Others 5,890 3,030
P=1,249,974 P=995,293
24. Financial Risk Management Objectives and Policies
The Company’s principal financial instruments, other than derivatives, comprise of cash and cash equivalents, investments held for trading, accrued interest and other receivables, AFS investments and bank loans. The main purpose of these financial instruments is to finance the Company’s operations. The Company has other financial assets and liabilities such as trade receivables and trade payables, which arise directly from its operations.
The Company also enters into derivative transactions, principally, cross currency swaps and principal only swaps. The purpose is to manage the interest rate and foreign currency risks arising from the Company’s operations and its sources of finance (see Note 25).

- 19 -
The main risks arising from the Company’s financial instruments are interest rate risk, foreign currency risk, liquidity risk, credit risk and equity price risk. The Company’s BOD and management review and agree on the policies for managing each of these risks.
Interest Rate Risk The Company’s policy is to manage its interest cost using a mix of fixed and floating rate debts. To manage this mix in a cost-efficient manner, it enters into interest rate swaps, in which the Company agrees to exchange, at specified intervals, the difference between fixed and floating rate interest amounts calculated by reference to an agreed-upon notional principal amount. These swaps are designated to economically hedge underlying debt obligations. As at March 31, 2017 and December 31, 2016, after taking into account the effect of interest rate swaps, approximately 70% of its long-term borrowings are at a fixed rate of interest.
Foreign Currency Risk Foreign currency risk is the risk that the fair value or future cash flows of a financial instrument will fluctuate because of changes in foreign exchange rates.
The Company’s exposure to foreign currency risk arises mainly from its debt issuances which are denominated in U.S. dollars. To manage its foreign currency risk, the Company enters into foreign currency swap contracts, cross-currency swaps, foreign currency call options, non-deliverable forwards and foreign currency range options aimed at reducing and/or managing the adverse impact of changes in foreign exchange rates on financial performance and cash flow.
The Company’s foreign currency-denominated monetary assets amounted to US$58 million (P=2,915 million) as at March 31, 2017 and US$45 million (P=2,242 million) as at December 31, 2016. The Company’s foreign currency-denominated monetary liabilities amounted to US$306 million (P=15,334 million) as at March 31, 2017, and US$391 million (P=19,460 million) as at December 31, 2016.
In translating the foreign currency-denominated monetary assets and liabilities to peso amounts, the exchange rates used were P=50.16 to US$1.00 and P=49.72 to US$1.00, the Philippine peso to U.S. dollar exchange rate as at March 31, 2017 and December 31, 2016, respectively.
Liquidity Risk Liquidity risk arises from the possibility that the Company may encounter difficulties in raising funds to meet commitments from financial instruments or that a market for derivatives may not exist in some circumstance.
The Company seeks to manage its liquidity profile to be able to finance capital expenditures and service maturing debts. To cover its financing requirements, the Company intends to use internally generated funds and proceeds from debt and equity issues.
As part of its liquidity risk management program, the Company regularly evaluates its projected and actual cash flow information and continuously assesses conditions in the financial markets for opportunities to pursue fund-raising initiatives. These initiatives may include bank loans, export credit agency-guaranteed facilities and debt capital and equity market issues.
Credit Risk The Company trades only with recognized, creditworthy related and third parties. It is the Company’s policy that all customers who wish to trade on credit terms are subject to credit verification procedures. In addition, receivable balances are monitored on a regular basis which
- 20 -
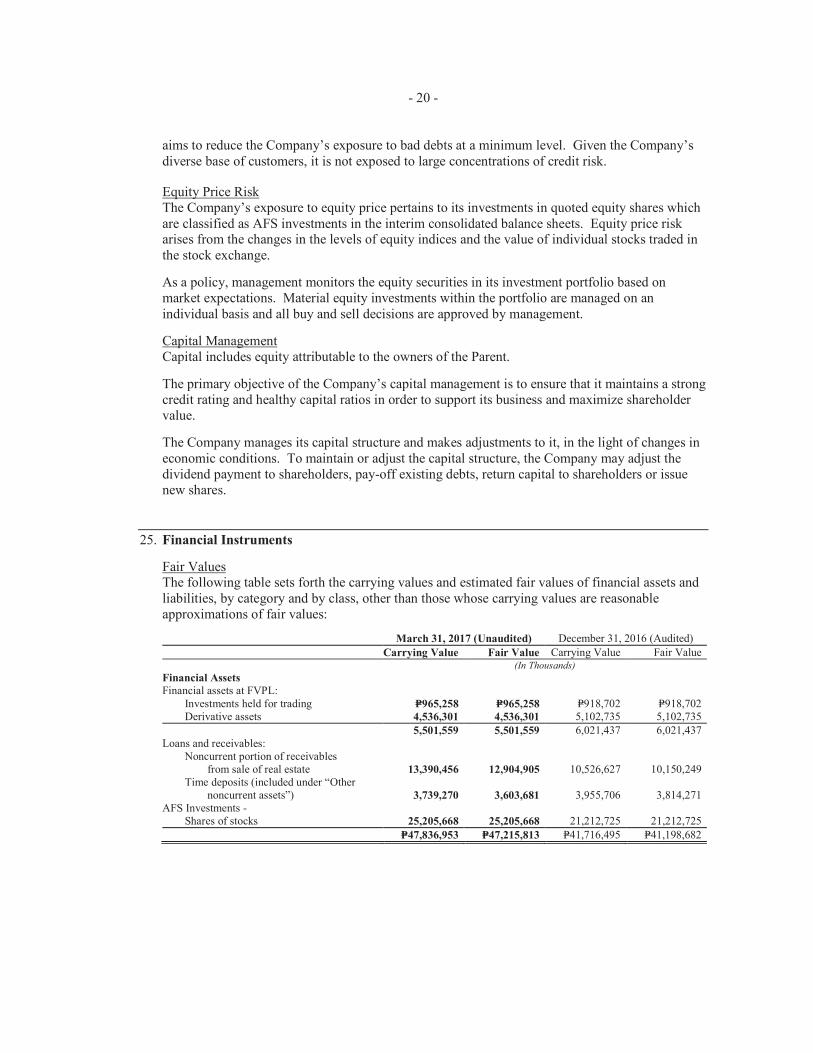
aims to reduce the Company’s exposure to bad debts at a minimum level. Given the Company’s diverse base of customers, it is not exposed to large concentrations of credit risk.
Equity Price Risk The Company’s exposure to equity price pertains to its investments in quoted equity shares which are classified as AFS investments in the interim consolidated balance sheets. Equity price risk arises from the changes in the levels of equity indices and the value of individual stocks traded in the stock exchange.
As a policy, management monitors the equity securities in its investment portfolio based on market expectations. Material equity investments within the portfolio are managed on an individual basis and all buy and sell decisions are approved by management.
Capital Management Capital includes equity attributable to the owners of the Parent.
The primary objective of the Company’s capital management is to ensure that it maintains a strong credit rating and healthy capital ratios in order to support its business and maximize shareholder value.
The Company manages its capital structure and makes adjustments to it, in the light of changes in economic conditions. To maintain or adjust the capital structure, the Company may adjust the dividend payment to shareholders, pay-off existing debts, return capital to shareholders or issue new shares.
25. Financial Instruments
Fair Values The following table sets forth the carrying values and estimated fair values of financial assets and liabilities, by category and by class, other than those whose carrying values are reasonable approximations of fair values:
March 31, 2017 (Unaudited) December 31, 2016 (Audited)
Carrying Value Fair Value Carrying Value Fair Value (In Thousands)
Financial Assets
Financial assets at FVPL: Investments held for trading P=965,258 P=965,258 P=918,702 P=918,702 Derivative assets 4,536,301 4,536,301 5,102,735 5,102,735
5,501,559 5,501,559 6,021,437 6,021,437Loans and receivables: Noncurrent portion of receivables
from sale of real estate 13,390,456 12,904,905 10,526,627 10,150,249Time deposits (included under “Other
noncurrent assets”) 3,739,270 3,603,681 3,955,706 3,814,271AFS Investments - Shares of stocks 25,205,668 25,205,668 21,212,725 21,212,725
P=47,836,953 P=47,215,813 P=41,716,495 P=41,198,682
- 21 -
March 31, 2017 (Unaudited) December 31, 2016 (Audited)
Carrying Value Fair Value Carrying Value Fair Value (In Thousands)
Financial Liabilities
Other financial liabilities: Liability for purchased land - net
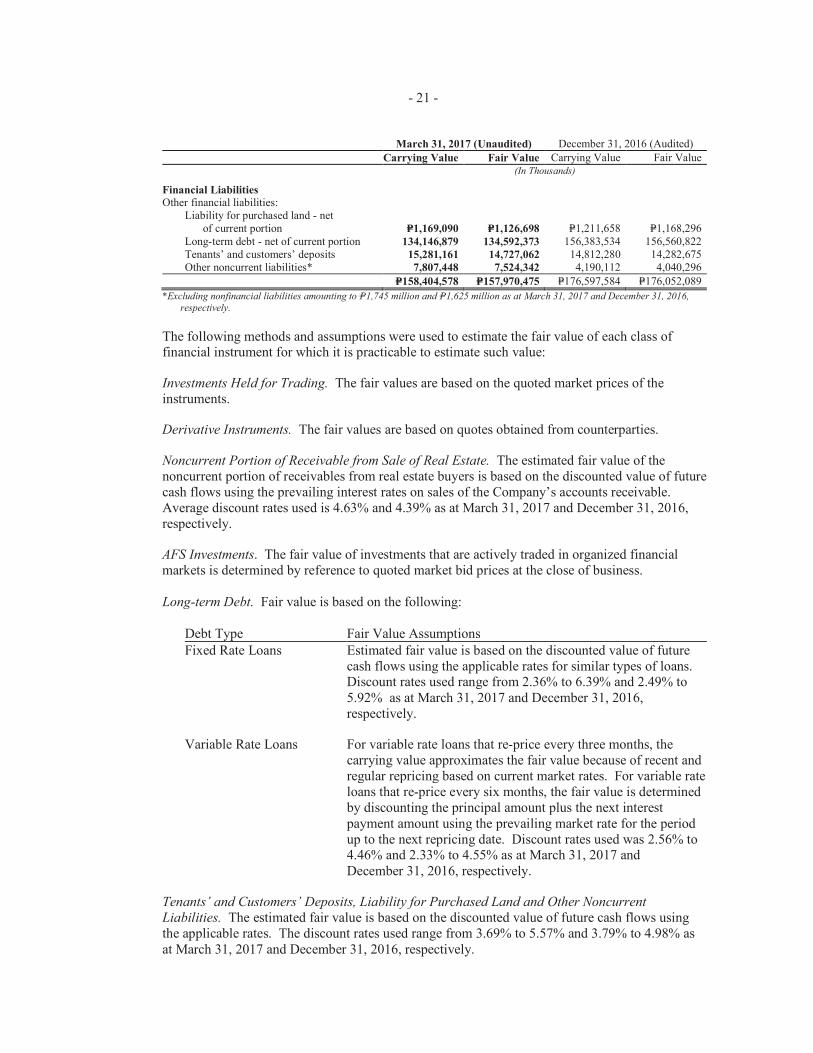
of current portion P=1,169,090 P=1,126,698 P=1,211,658 P=1,168,296 Long-term debt - net of current portion 134,146,879 134,592,373 156,383,534 156,560,822 Tenants’ and customers’ deposits 15,281,161 14,727,062 14,812,280 14,282,675 Other noncurrent liabilities* 7,807,448 7,524,342 4,190,112 4,040,296
P=158,404,578 P=157,970,475 P=176,597,584 P=176,052,089
*Excluding nonfinancial liabilities amounting to P=1,745 million and P=1,625 million as at March 31, 2017 and December 31, 2016,
respectively.
The following methods and assumptions were used to estimate the fair value of each class of financial instrument for which it is practicable to estimate such value:
Investments Held for Trading. The fair values are based on the quoted market prices of the instruments.
Derivative Instruments. The fair values are based on quotes obtained from counterparties.
Noncurrent Portion of Receivable from Sale of Real Estate. The estimated fair value of the noncurrent portion of receivables from real estate buyers is based on the discounted value of future cash flows using the prevailing interest rates on sales of the Company’s accounts receivable. Average discount rates used is 4.63% and 4.39% as at March 31, 2017 and December 31, 2016, respectively.
AFS Investments. The fair value of investments that are actively traded in organized financial markets is determined by reference to quoted market bid prices at the close of business.
Long-term Debt. Fair value is based on the following:
Debt Type Fair Value Assumptions
Fixed Rate Loans Estimated fair value is based on the discounted value of future cash flows using the applicable rates for similar types of loans. Discount rates used range from 2.36% to 6.39% and 2.49% to 5.92% as at March 31, 2017 and December 31, 2016, respectively.
Variable Rate Loans For variable rate loans that re-price every three months, the carrying value approximates the fair value because of recent and regular repricing based on current market rates. For variable rate loans that re-price every six months, the fair value is determined by discounting the principal amount plus the next interest payment amount using the prevailing market rate for the period up to the next repricing date. Discount rates used was 2.56% to 4.46% and 2.33% to 4.55% as at March 31, 2017 and December 31, 2016, respectively.
Tenants’ and Customers’ Deposits, Liability for Purchased Land and Other Noncurrent
Liabilities. The estimated fair value is based on the discounted value of future cash flows using the applicable rates. The discount rates used range from 3.69% to 5.57% and 3.79% to 4.98% as at March 31, 2017 and December 31, 2016, respectively.

- 22 -
The Company assessed that the carrying values of cash and cash equivalents, cash in escrow, bank loans and accounts payable and other current liabilities approximate their fair values due to the short-term nature and maturities of these financial instruments. For AFS investments related to unlisted equity securities, these are carried at cost less allowance for impairment loss since there are no quoted prices and due to the unpredictable nature of future cash flows and lack of suitable methods for arriving at reliable fair value.
There were no financial instruments subject to an enforceable master netting arrangement that were not set-off in the interim consolidated balance sheets.
Fair Value Hierarchy The Company uses the following hierarchy for determining and disclosing the fair value of financial instruments by valuation technique:
Level 1: Quoted prices in active markets for identical assets or liabilities, except for related embedded derivatives which are either classified as Level 2 or 3;
Level 2: Those measured using inputs other than quoted prices included in Level 1 that are observable for the asset or liability, either directly (as prices) or indirectly (derived from prices); and,
Level 3: Those with inputs for the asset or liability that are not based on observable market data (unobservable inputs).
The following tables show the fair value hierarchy of Company’s financial instruments as at:
March 31, 2017 (Unaudited)
Level 1 Level 2 Level 3
(In Thousands)
Financial Assets
Financial assets at FVPL: Investments held-for-trading: Bonds P=298,950 P=– P=–
Shares 666,308 – –
Derivative assets – 4,536,301 –
965,258 4,536,301 –
Loans and receivables:
Noncurrent portion of receivables from sale of real estate – – 12,904,905
Time deposits (included under “Othernoncurrent assets”) – 3,603,681 –
AFS Investments - Shares of stocks 25,195,656 – 10,012
P=26,160,914 P=8,139,982 P=12,914,917
Financial Liabilities
Other financial liabilities: Liability for purchased land - net of
current portion P=– P=– P=1,126,698
Long-term debt - net of current portion – – 134,592,373
Tenants’ and customers’ deposits – – 14,727,062
Other noncurrent liabilities* – – 7,524,342
P=– P=– P=157,970,475
*Excluding nonfinancial liabilities amounting to P=1,745 million as at March 31, 2017.
- 23 -
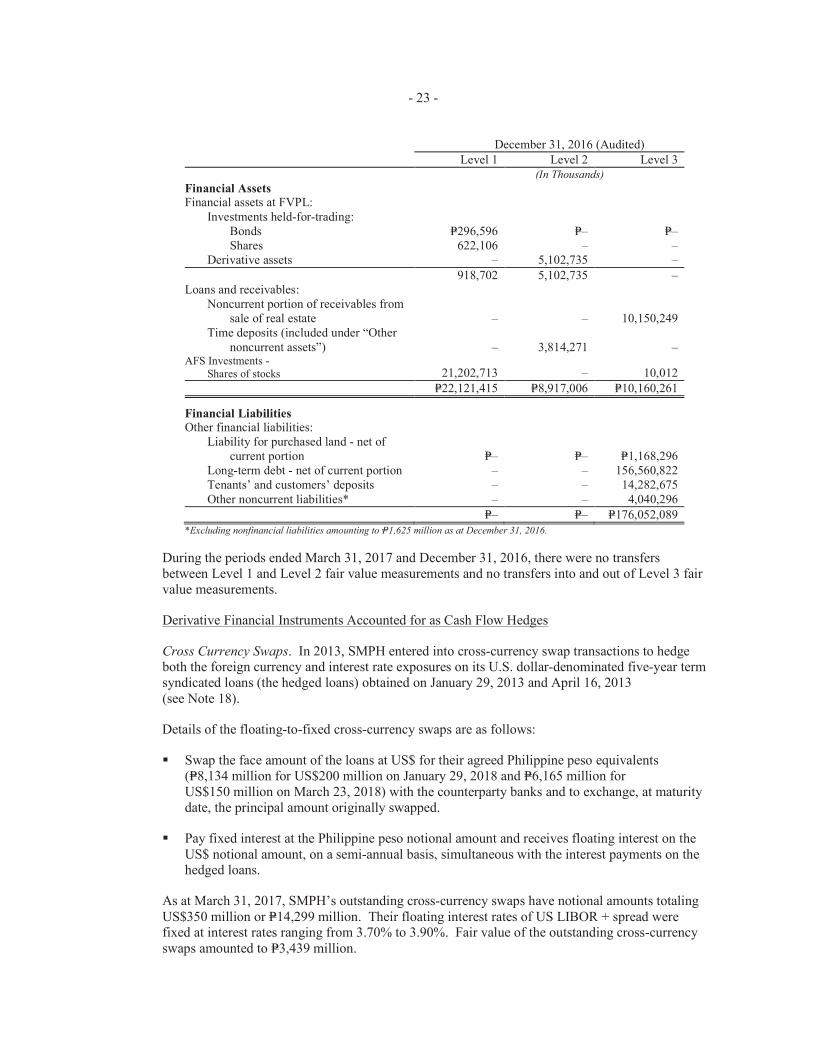
December 31, 2016 (Audited)
Level 1 Level 2 Level 3(In Thousands)
Financial Assets
Financial assets at FVPL:
Investments held-for-trading: Bonds P=296,596 P=– P=– Shares 622,106 – – Derivative assets – 5,102,735 –
918,702 5,102,735 –Loans and receivables: Noncurrent portion of receivables from
sale of real estate – – 10,150,249Time deposits (included under “Other
noncurrent assets”) – 3,814,271 –AFS Investments - Shares of stocks 21,202,713 – 10,012
P=22,121,415 P=8,917,006 P=10,160,261
Financial Liabilities
Other financial liabilities: Liability for purchased land - net of
current portion P=– P=– P=1,168,296 Long-term debt - net of current portion – – 156,560,822 Tenants’ and customers’ deposits – – 14,282,675
Other noncurrent liabilities* – – 4,040,296
P=– P=– P=176,052,089
*Excluding nonfinancial liabilities amounting to P=1,625 million as at December 31, 2016.
During the periods ended March 31, 2017 and December 31, 2016, there were no transfers between Level 1 and Level 2 fair value measurements and no transfers into and out of Level 3 fair value measurements.
Derivative Financial Instruments Accounted for as Cash Flow Hedges
Cross Currency Swaps. In 2013, SMPH entered into cross-currency swap transactions to hedge both the foreign currency and interest rate exposures on its U.S. dollar-denominated five-year term syndicated loans (the hedged loans) obtained on January 29, 2013 and April 16, 2013 (see Note 18).
Details of the floating-to-fixed cross-currency swaps are as follows:
� Swap the face amount of the loans at US$ for their agreed Philippine peso equivalents (P=8,134 million for US$200 million on January 29, 2018 and P=6,165 million for US$150 million on March 23, 2018) with the counterparty banks and to exchange, at maturity date, the principal amount originally swapped.
� Pay fixed interest at the Philippine peso notional amount and receives floating interest on the US$ notional amount, on a semi-annual basis, simultaneous with the interest payments on the hedged loans.
As at March 31, 2017, SMPH’s outstanding cross-currency swaps have notional amounts totaling US$350 million or P=14,299 million. Their floating interest rates of US LIBOR + spread were fixed at interest rates ranging from 3.70% to 3.90%. Fair value of the outstanding cross-currency swaps amounted to P=3,439 million.
- 24 -
Principal only Swaps. In 2016, SM Land (China) Limited entered into principal only swap transactions (¥2,472 million for US$380 million) at a premium to hedge the foreign currency exposures on its U.S. dollar-denominated five-year term syndicated loan and advances (the hedged items) obtained on February 16, 2016 to March 22, 2016 (see Note 18).
In 2017, SM Land (China) Limited entered into principal only swap transactions (¥620 million for US$90 million) at a premium to hedge the foreign currency exposures on its U.S. dollar-denominated five-year term syndicated loan (the hedged item) obtained on January 11, 2017 to January 17, 2017 (see Note 18).
As at March 31, 2017, SM Land (China) Limited’s outstanding principal only swaps have notional amounts totaling US$470 million were fixed to US$:¥ exchange rates ranging from 6.458 to 6.889. Of the notional amounts, US$50 million, US$150 million, and US$270 million will mature on August 30, 2017, March 23, 2018, and January 29, 2021, respectively. Fair value of the outstanding principal swaps amounted to P=814 million.
Interest Rate Swaps. SM Land (China) Limited entered into US$ interest rate swap agreement with notional amount of US$270 million in 2016. Under the agreement, SM Land effectively converts the floating rate U.S. dollar-denominated to fixed rate loan (see Note 18).
As the terms of the swaps have been negotiated to match the terms of the hedged loans, the hedges were assessed to be highly effective. No ineffectiveness was recognized in the consolidated statement of income for the year ended March 31, 2017.
Hedge Effectiveness Results As the terms of the swaps have been negotiated to match the terms of the hedged loan, the hedges were assessed to be highly effective. The fair value of the outstanding cross-currency swaps amounting to P=4,536 million gain and P=5,103 million gain as at March 31, 2017 and December 31, 2016, respectively, which movement was taken to equity under other comprehensive income. No ineffectiveness was recognized in the interim consolidated statements of income for the three-month periods ended March 31, 2017 and 2016. Foreign currency translation arising from the hedged loan recognized in the interim consolidated statements of income amounted to P=4 million loss and P=453 million gain for the three-month periods ended March 31, 2017 and 2016, respectively. Foreign exchange loss equivalent to the same amounts were recycled from equity to the interim consolidated statements of income during the same period.
- 25 -
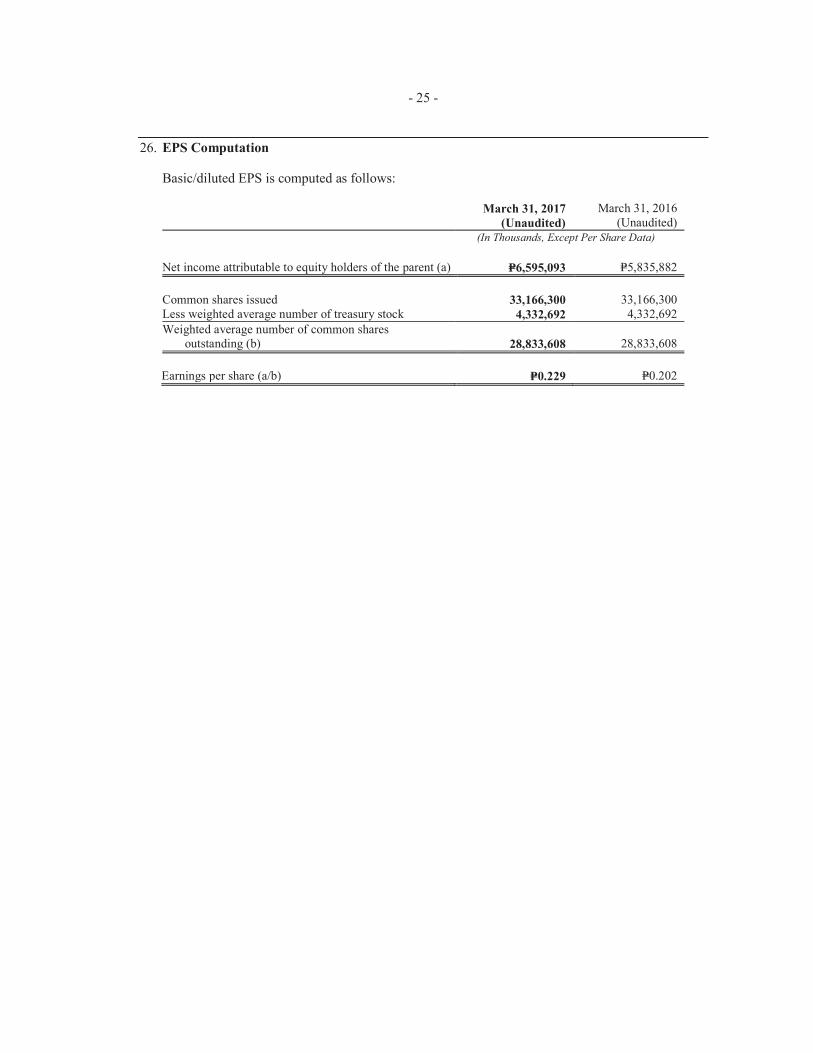
26. EPS Computation
Basic/diluted EPS is computed as follows:
March 31, 2017
(Unaudited)
March 31, 2016(Unaudited)
(In Thousands, Except Per Share Data)
Net income attributable to equity holders of the parent (a) P=6,595,093 P=5,835,882
Common shares issued 33,166,300 33,166,300 Less weighted average number of treasury stock 4,332,692 4,332,692
Weighted average number of common shares outstanding (b) 28,833,608 28,833,608
Earnings per share (a/b) P=0.229 P=0.202

SM PRIME HOLDINGS, INC. AND SUBSIDIARIES FINANCIAL RATIOS - KEY PERFORMANCE INDICATORS AS OF MARCH 31, 2017 and 2016 March 31,
2017 March 31,
2016 i. Current ratio
Total current assets Total current liabilities 1.29 1.93
Acid - Test Ratio Total current assets less inventory and prepaid expenses Total current liabilities
0.74
1.12
ii. Debt-to-equity ratio
Total interest-bearing liabilities Total equity attributable to equity holders of the parent + Total interest-bearing liabilities
41:59
41:59
Net debt-to-equity ratio Total interest-bearing liabilities less cash and cash equivalents and investment securities Total equity attributable to equity holders of the parent + Total interest-bearing liabilities less cash and cash equivalents and investment securities
37:63
37:63
Solvency Ratio Total assets Total liabilities
2.00
2.04
iii. Asset to equity ratio
Total assets Total equity attributable to equity holders of the parent
2.03
1.99
(Annualized) iv. Interest Service Coverage
Earnings before interest, income taxes, depreciation and amortization (EBITDA)
Interest expense
9.25
10.18
Debt to EBITDA Total interest-bearing liabilities EBITDA 3.69 3.71
v. Return on equity
Net income attributable to equity holders of the parent Total average equity attributable to equity holders of the parent 11% 11%
Return on investment properties Net income attributable to equity holders of the parent Total average investment properties (excluding shopping mall complex under construction) 12% 12%
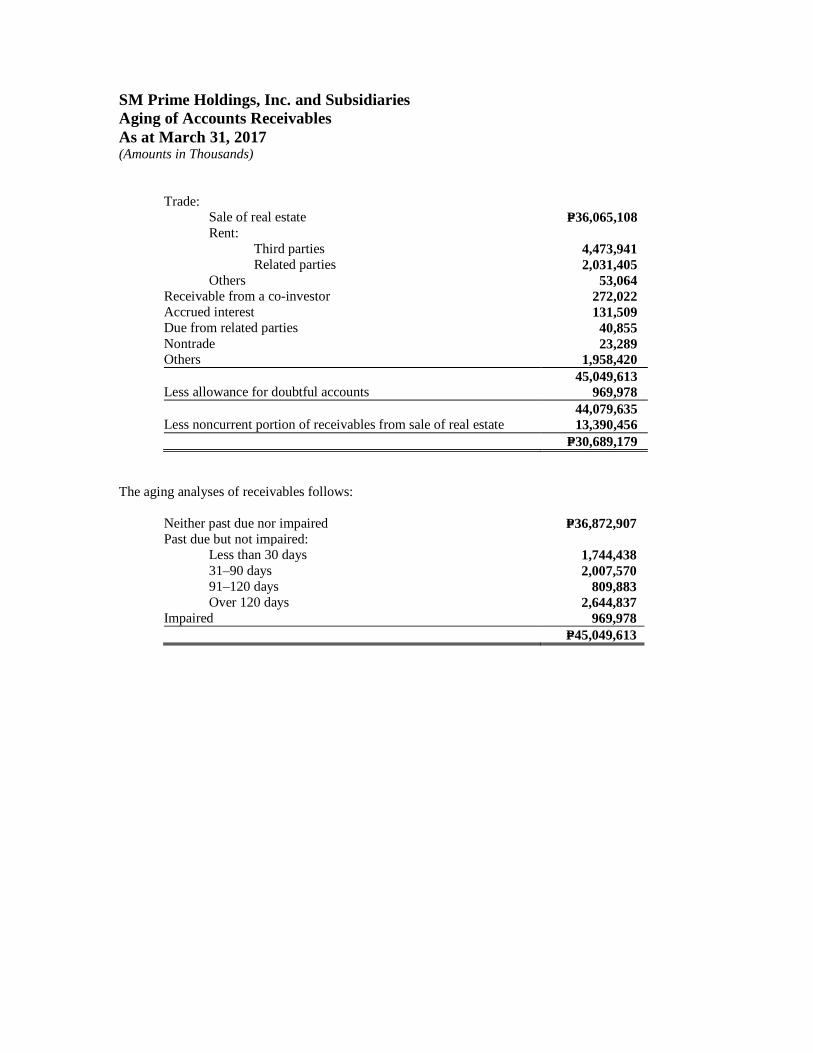
SM Prime Holdings, Inc. and Subsidiaries Aging of Accounts Receivables As at March 31, 2017 (Amounts in Thousands)
Trade: Sale of real estate P=36,065,108 Rent: Third parties 4,473,941 Related parties 2,031,405 Others 53,064 Receivable from a co-investor 272,022 Accrued interest 131,509 Due from related parties 40,855 Nontrade 23,289 Others 1,958,420 45,049,613 Less allowance for doubtful accounts 969,978 44,079,635 Less noncurrent portion of receivables from sale of real estate 13,390,456 P=30,689,179
The aging analyses of receivables follows:
Neither past due nor impaired P=36,872,907 Past due but not impaired: Less than 30 days 1,744,438 31–90 days 2,007,570 91–120 days 809,883 Over 120 days 2,644,837 Impaired 969,978 P=45,049,613
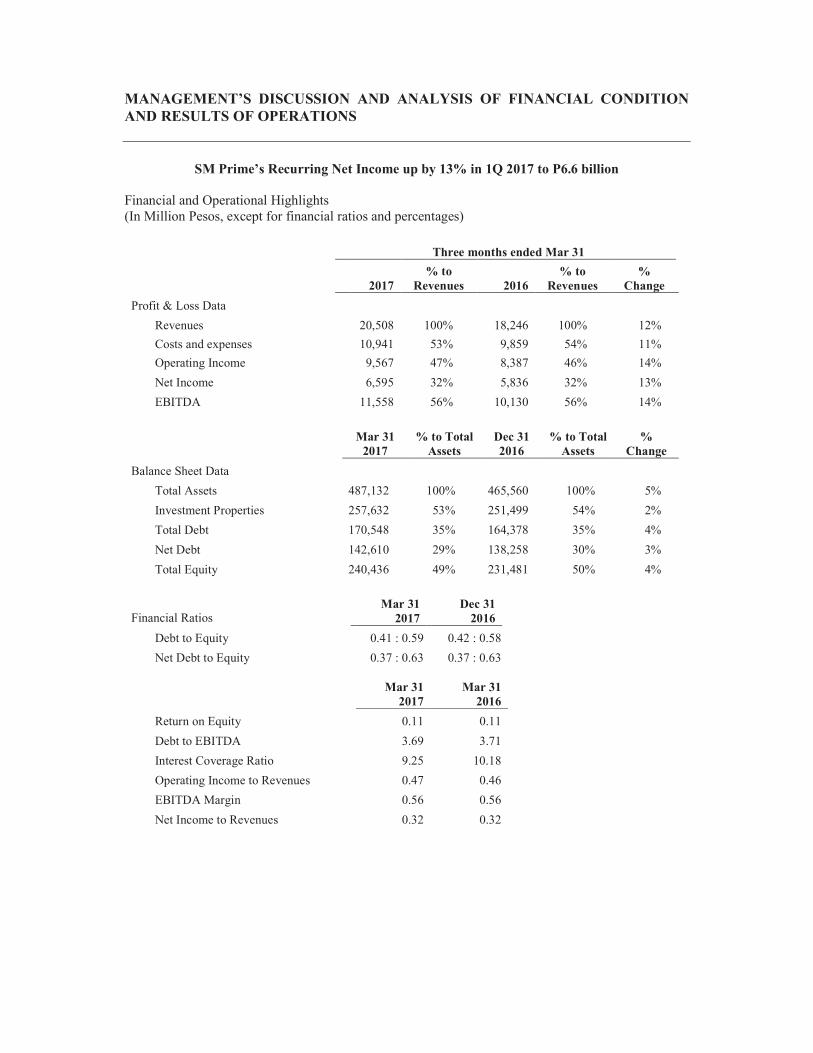
MANAGEMENT’S DISCUSSION AND ANALYSIS OF FINANCIAL CONDITION
AND RESULTS OF OPERATIONS
SM Prime’s Recurring Net Income up by 13% in 1Q 2017 to P6.6 billion
Financial and Operational Highlights (In Million Pesos, except for financial ratios and percentages)
Three months ended Mar 31
2017
% to
Revenues 2016
% to
Revenues
%
Change
Profit & Loss Data
Revenues 20,508 100% 18,246 100% 12%
Costs and expenses 10,941 53% 9,859 54% 11%
Operating Income 9,567 47% 8,387 46% 14%
Net Income 6,595 32% 5,836 32% 13%
EBITDA 11,558 56% 10,130 56% 14%
Mar 31
2017
% to Total
Assets
Dec 31
2016
% to Total
Assets
%
Change
Balance Sheet Data
Total Assets 487,132 100% 465,560 100% 5%
Investment Properties 257,632 53% 251,499 54% 2%
Total Debt 170,548 35% 164,378 35% 4%
Net Debt 142,610 29% 138,258 30% 3%
Total Equity 240,436 49% 231,481 50% 4%
Financial Ratios Mar 31
2017
Dec 31
2016
Debt to Equity 0.41 : 0.59 0.42 : 0.58
Net Debt to Equity 0.37 : 0.63 0.37 : 0.63
Mar 31
2017
Mar 31
2016
Return on Equity 0.11 0.11
Debt to EBITDA 3.69 3.71
Interest Coverage Ratio 9.25 10.18
Operating Income to Revenues 0.47 0.46
EBITDA Margin 0.56 0.56
Net Income to Revenues 0.32 0.32

� 2
Revenue
SM Prime recorded consolidated revenues of P20.51 billion for the first three months of 2017, an increase of 12% from P18.25 billion in the same period in 2016, primarily due to the following:
Rent
SM Prime recorded consolidated revenues from rent of P12.07 billion in 2017, an increase of 12% from P10.75 billion in 2016. The increase in rental revenue was primarily due to the new malls and expansions opened in 2015 and 2016, namely, SM Seaside City Cebu, SM City East Ortigas, SM City San Mateo, SM City Cabanatuan, SM City San Jose Del Monte, SM City Trece Martires, SM City Iloilo Expansion, S Maison in SM Mall of Asia and SM Center Molino Expansion with a total gross floor area of 1.1 million square meters. Out of the total rental revenues, 88% is contributed by the malls and the rest from office and hotels and convention centers. Excluding the new malls and expansions, same-store rental growth is at 7%. Room rentals from hotels and convention centers contributed to the increase due to the opening of Conrad Manila in June 2016 and the improvement in average room rates and occupancy rates.
Real Estate Sales
SM Prime recorded a 7% increase in real estate sales in 2017 from P5.55 billion to P5.92 billion primarily due to higher construction accomplishments of projects launched in 2014 up to 2015 namely Shore 2, Air, Cool, Fame and South Residences and continued increase in sales take-up of Ready-for-Occupancy (RFO) projects due to strong demand. Actual construction of projects usually starts within twelve to eighteen months from launch date and revenues are recognized in the books based on percentage of completion.
Cinema and Event Ticket Sales
SM Prime cinema and event ticket sales increased by 16% to P1.23 billion in 2017 from P1.06 billion in 2016 due to increase in international movie sales and higher event ticket sales. The major blockbusters screened in 2017 were “Beauty and the Beast”, “My Ex and Whys”, “Logan”, “Kung Fu Yoga” and “Kong: Skull Island”, accounting for 49% of gross ticket sales. The major blockbusters shown in 2016 were “Beauty and the Bestie”, “Batman vs. Superman: Dawn of Justice”, “Deadpool”, “Gods of Egypt” and “My Bebe Love” accounting for 48% of gross ticket sales.
Other Revenues
Other revenues increased by 44% to P1.28 billion in 2017 from P0.89 billion in 2016. The increase was due to increase in hotels’ food and beverages income due to the opening of Conrad Manila, opening of new amusement rides, increase in sponsorship income and merchandise sales as a result of new malls and expansions. This account includes amusement income from rides, bowling and ice skating operations, merchandise sales from snackbars and sale of food and beverages in hotels.
Costs and Expenses
SM Prime recorded consolidated costs and expenses of P10.94 billion in 2017, an increase of 11% from P9.86 billion in the same period in 2016, as a result of the following:

� 3
Costs of Real Estate Sold
Consolidated costs of real estate sold increased by 7% to P3.11 billion in 2017 from P2.92 billion in 2016 primarily due to costs related to higher recognized real estate sales. Gross profit margin for residential improved to 48% in 2017 compared to 47% in 2016 as a result of improving cost efficiencies, tighter monitoring and control of construction costs.
Operating Expenses
SM Prime’s consolidated operating expenses increased by 13% to P7.83 billion in 2017 compared to last year’s P6.94 billion. Out of the total operating expenses, 72% is contributed by the malls where same-store mall growth in operating expenses is 4%. Operating expenses include administrative expenses, depreciation and amortization, taxes and licenses and film rentals, and the increase is in line with related increase in revenues from same-store as well as the opening of new malls and expansions.
Other Income (Charges)
Interest Expense
SM Prime’s consolidated interest expense increased by 26% to P1.25 billion in 2017 compared to P1.00 billion in 2016 due to the P10.0 billion retail bond issued in July 2016 and new bank loans availed for working capital and capital expenditure requirements, net of the capitalized interest on proceeds spent for construction and development of investment properties.
Interest and Dividend Income
Interest and dividend income increased by 3% to P0.28 billion in 2017 from P0.27 billion in 2016. This account is mainly composed of dividend and interest income received from cash and cash equivalents, investments held for trading and AFS investments.
Other income (charges) - net
This account reflected a P0.89 million other income in 2017 from a P0.49 million other charges in 2016 due to increase in net income of associates and other incidental income.
Provision for income tax
SM Prime’s consolidated provision for income tax increased by 19% to P1.94 billion in 2017 from P1.63 billion in 2016 due to the related increase in taxable income.
Net income
SM Prime’s consolidated net income for the three months ended March 31, 2017 increased by 13% to P6.60 billion as compared to P5.84 billion in the same period last year.
Balance Sheet Accounts
SM Prime’s total assets amounted to P=487.13 billion as of March 31, 2017, an increase of 5% from P=465.56 billion as of December 31, 2016.
Cash and cash equivalents increased by 7% from P=25.20 billion to P=26.98 billion as of December 31, 2016 and March 31, 2017, respectively mainly due to increase in the Company’s income from operations, net of payments for capital expenditure projects during the period.

� 4
Investments held for trading increased by 5% from P=919 million to P=965 million as of December 31, 2016 and March 31, 2017, respectively, mainly due to increase in the fair value changes of the listed shares.
Receivables decreased by 7% from P=32.83 billion to P=30.69 billion as of December 31, 2016 and March 31, 2017, respectively, in spite of the increase in sales of residential projects due to subsequent collections from recently completed projects and subsequent collections of rent receivables. Out of the total receivables, 74% pertains to sale of real estate and 21% from leases of shopping mall and commercial spaces.
Condominium and residential units for sale increased by 33% from P=5.21 billion to P=6.94 billion as of December 31, 2016 and March 31, 2017, respectively, mainly due to completion of condominium towers in Grace, Wind, Trees and Field Residences, net of cost of sold units.
Land and development increased by 12% from P=46.70 billion to P=52.41 billion as of December 31, 2016 and March 31, 2017, respectively, mainly due to landbanking and construction accomplishments for the period, net of cost of sold units and transfers of RFO units to condominium and residential units for sale.
AFS investments increased by 19% from P=21.21 billion to P=25.21 billion as of December 31, 2016 and March 31, 2017, respectively, mainly due the exercise of stock rights and unrealized gain on changes in fair values under this portfolio.
Derivative assets decreased by 11% from P=5.10 billion to P=4.54 billion as of December 31, 2016 and March 31, 2017, respectively, mainly resulting from net fair value changes on $270 million interest rate swap transaction and $470 million principal only swap transaction entered into in 2017 and 2016 and the $350 million cross currency swap transaction in 2013.
Other noncurrent assets, which includes the noncurrent portion of receivable from sale of real estate,increased by 8% from P=41.02 billion to P=44.47 billion as of December 31, 2016 and March 31, 2017, due to additional bonds and deposits for real estate acquisitions and construction accomplishments of sold units as well as new sales for the period.
Loans payable increased from P=0.84 billion to P=4.71 billion as of December 31, 2016 and March 31, 2017, respectively, due to availment of loans in 2017.
Accounts payable and other current liabilities increased by 4% from P=40.32 billion to P=42.09 billion as of December 31, 2016 and March 31, 2017, respectively, mainly due to payables to contractors and suppliers related to ongoing projects and other accrued payables related to construction and operating expenses.
Liability for purchased land decreased by 4% from P=1.21 billion to P=1.17 billion as of December 31, 2016 and March 31, 2017, respectively, due to payments made. Other noncurrent liabilities increased by 64% from P=5.82 billion to P=9.55 billion as of December 31, 2016 and March 31, 2017, respectively, due to increase in retention payable and output VAT on residential sales.
The Company’s key performance indicators are measured in terms of the following: (1) debt to equity which measures the ratio of interest bearing liabilities to equity; (2) net debt to equity which measures the ratio of interest bearing liabilities net of cash and cash equivalents and investment held for trading to equity; (3) return on equity (ROE) which measures the ratio of net income to capital provided by stockholders; (4) earnings before interest expense, income taxes, depreciation and amortization (EBITDA); (5) debt to EBITDA which measures the ratio of EBITDA to total interest-bearing liabilities; (6) interest coverage ratio which measures the ratio of EBITDA to interest expense;
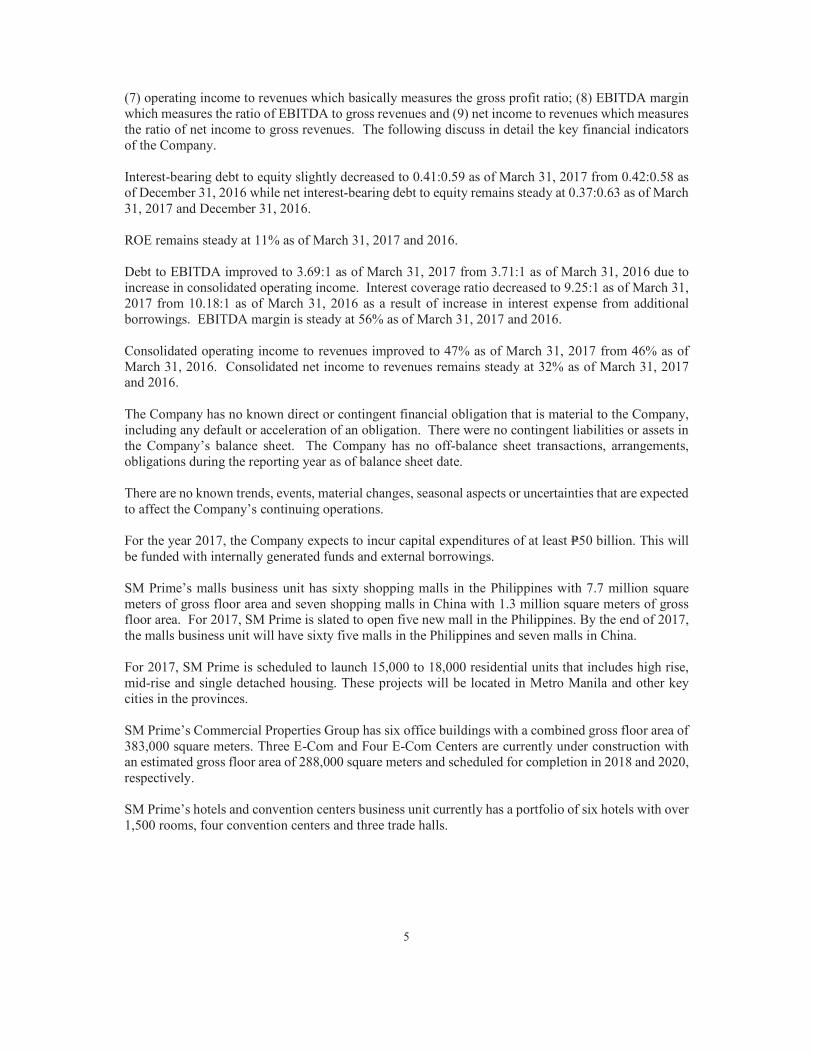
� 5
(7) operating income to revenues which basically measures the gross profit ratio; (8) EBITDA margin which measures the ratio of EBITDA to gross revenues and (9) net income to revenues which measures the ratio of net income to gross revenues. The following discuss in detail the key financial indicators of the Company.
Interest-bearing debt to equity slightly decreased to 0.41:0.59 as of March 31, 2017 from 0.42:0.58 as of December 31, 2016 while net interest-bearing debt to equity remains steady at 0.37:0.63 as of March 31, 2017 and December 31, 2016.
ROE remains steady at 11% as of March 31, 2017 and 2016.
Debt to EBITDA improved to 3.69:1 as of March 31, 2017 from 3.71:1 as of March 31, 2016 due to increase in consolidated operating income. Interest coverage ratio decreased to 9.25:1 as of March 31, 2017 from 10.18:1 as of March 31, 2016 as a result of increase in interest expense from additional borrowings. EBITDA margin is steady at 56% as of March 31, 2017 and 2016.
Consolidated operating income to revenues improved to 47% as of March 31, 2017 from 46% as of March 31, 2016. Consolidated net income to revenues remains steady at 32% as of March 31, 2017 and 2016.
The Company has no known direct or contingent financial obligation that is material to the Company, including any default or acceleration of an obligation. There were no contingent liabilities or assets in the Company’s balance sheet. The Company has no off-balance sheet transactions, arrangements, obligations during the reporting year as of balance sheet date.
There are no known trends, events, material changes, seasonal aspects or uncertainties that are expected to affect the Company’s continuing operations.
For the year 2017, the Company expects to incur capital expenditures of at least P=50 billion. This will be funded with internally generated funds and external borrowings.
SM Prime’s malls business unit has sixty shopping malls in the Philippines with 7.7 million square meters of gross floor area and seven shopping malls in China with 1.3 million square meters of gross floor area. For 2017, SM Prime is slated to open five new mall in the Philippines. By the end of 2017, the malls business unit will have sixty five malls in the Philippines and seven malls in China.
For 2017, SM Prime is scheduled to launch 15,000 to 18,000 residential units that includes high rise, mid-rise and single detached housing. These projects will be located in Metro Manila and other key cities in the provinces.
SM Prime’s Commercial Properties Group has six office buildings with a combined gross floor area of 383,000 square meters. Three E-Com and Four E-Com Centers are currently under construction with an estimated gross floor area of 288,000 square meters and scheduled for completion in 2018 and 2020, respectively.
SM Prime’s hotels and convention centers business unit currently has a portfolio of six hotels with over 1,500 rooms, four convention centers and three trade halls.

Related Documents