CYBG PLC PRELIMINARY FINANCIAL RESULTS

Welcome message from author
This document is posted to help you gain knowledge. Please leave a comment to let me know what you think about it! Share it to your friends and learn new things together.
Transcript

CYBG PLCPRELIMINARY FINANCIAL RESULTS

Strategic progressDavid DuffyChief Executive Officer

964 989 1,016
727 729 675
…AND ULTIMATELY RETURNS
CLEAR STRATEGIC DIRECTION…
…DRIVING REVENUE / COST JAWS…
159221
293
5.1% 5.2%
7.5%
Underlying RoTEUnderlying PBTUnderlying operating income
Underlying operating expenses
FY 15 FY 16 FY 17FY 15 FY 16 FY 17
75% 74% 67%
964 989 1,016
727 729 675
% Underlying cost : income ratio
Sustainable customer growth
EfficiencyCapital
optimisation
Underpinned by digital transformation
3

B U S I N E S S T R A N S F O R M A T I O N C O N T I N U E S T O E N H A N C E T H E C U S T O M E R E X P E R I E N C E
4
Reduced site footprint
Procurement capability enhanced
Streamlined mortgage approval process
GROWTH
EFFICIENCY
Expanded product & channel suite
New flagship branches
Fintech collaborations

Financial resultsIan SmithChief Financial Officer

NIM 227 bps 226 bps +1 bpsCost of risk 14 bps 9 bps +5 bpsUnderlying cost income ratio 67% 74% (7) %ptsUnderlying RoTE 7.5% 5.2% +2.3 %ptsUnderlying EPS (pence) 21.5 16.2 +33%Dividend per share (pence) 1.0 - n/a
S T R O N G P R O F I T G R O W T H
Income statement Year to Change
£m 30 Sep 2017 30 Sep 2016 FY17 vs. FY16
Net interest income 844 806 +5%
Non-interest income 172 183 (6)%
Total operating income 1,016 989 +3%
Total operating and administrative expenses (675) (729) (7)%
Operating profit before impairment losses 341 260 +31%
Impairment losses on credit exposures (48) (39) +23%
Underlying profit on ordinary activities before tax 293 221 +33%
6
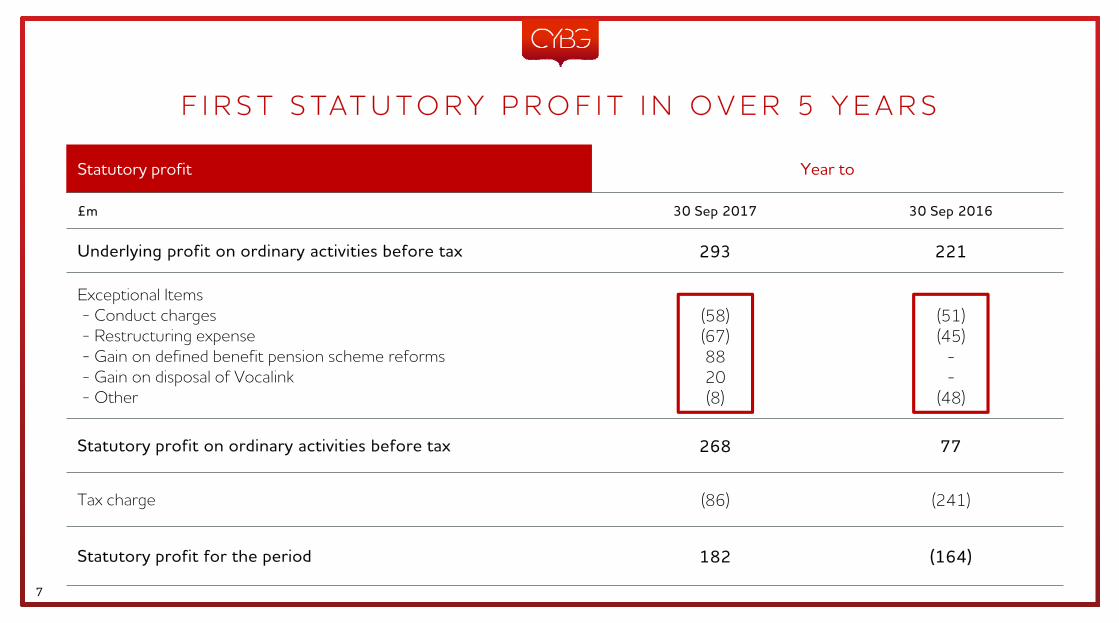
Statutory profit Year to
£m 30 Sep 2017 30 Sep 2016
Underlying profit on ordinary activities before tax 293 221
Exceptional Items- Conduct charges- Restructuring expense - Gain on defined benefit pension scheme reforms- Gain on disposal of Vocalink- Other
(58)(67)8820(8)
(51)(45)
--
(48)
Statutory profit on ordinary activities before tax 268 77
Tax charge (86) (241)
Statutory profit for the period 182 (164)
F I R S T S TAT U T O R Y P R O F I T I N O V E R 5 Y E A R S
7
Ian SmithChief Financial Officer
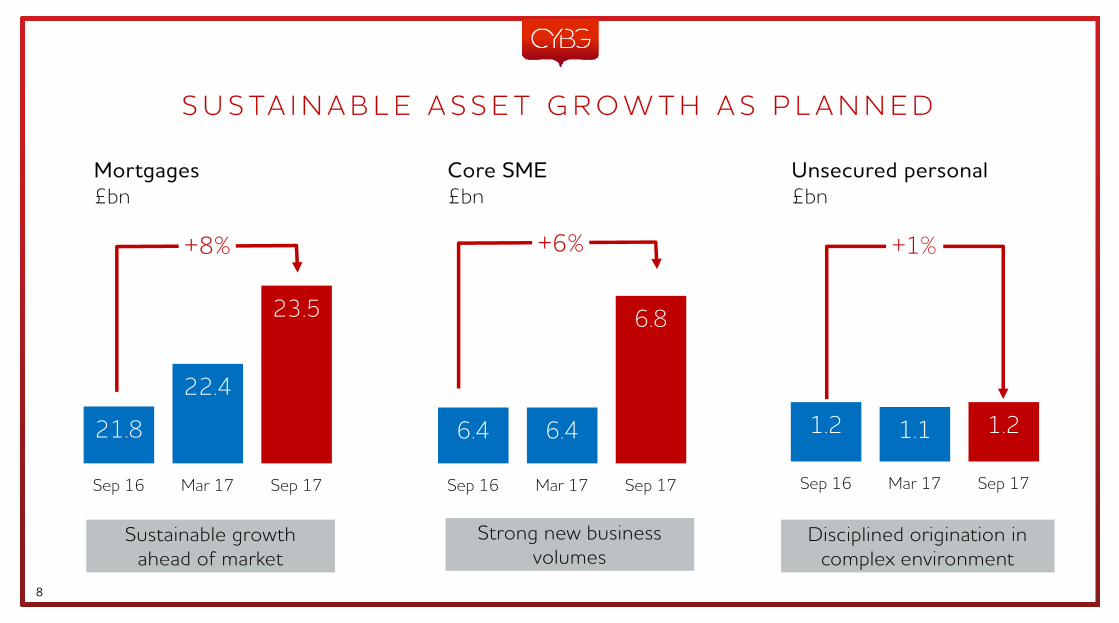
21.8
22.4
23.5
Sep 16 Mar 17 Sep 17
6.4 6.4
6.8
Sep 16 Mar 17 Sep 17
1.2 1.1 1.2
Sep 16 Mar 17 Sep 17
Mortgages£bn
Core SME£bn
Unsecured personal£bn
S U S TA I N A B L E A S S E T G R O W T H A S P L A N N E D
8
+8% +6% +1%
Sustainable growth ahead of market
Strong new business volumes
Disciplined origination in complex environment

FY16 FY17
Mortgage origination£bn
SME drawdowns£bn
S T R O N G N E W B U S I N E S S F L O W S W I T H I N R I S K A P P E T I T E
4.9 5.5
41% 30%
59% 70%
Owner occupied BTL
Strong growth ahead of market Increased new business drawdowns
Front book LTV 69% 71%
Front book LTI 2.72 2.93
9
FY16 FY17
1.8 2.1
+13%+13%
• Origination pace maintained: £2.1bn approvals (FY16: £2.2bn)
• Stable internal risk rating
• Lower average probability of default

277246
FY16 FY17
P R I C I N G R E F L E C T S C O M P E T I T I V E E N V I R O N M E N T
Mortgage front book GIM (bps)
Front book mortgage swap rates (bps)
6655
FY16 FY17
(11)
5534
FY16 FY17
(21)
351 325
FY16 FY17
SME front book GIM (bps)
Average 3-month LIBOR(bps)
Mortgage market continues to be competitive… …though SME pricing remains robust
10
(31) (26)

11
27.0 27.3
26.3 26.2
27.7
Sep-16 Dec-16 Mar-17 Jun-17 Sep-17
M A I N TA I N I N G A B R O A D M I X O F F U N D I N G S O U R C E S
13.2 13.9
8.2 7.75.5 6.0
27.0 27.7
Sep-16 Sep-17
Deposit balances £bn
• Wholesale funding cost 151bps (FY16: 196bps)
• No TFS drawdowns in H2, £1.9bn drawn at 30-Sep
• Inaugural £300m MREL issuance completed in June
Restructured deposit portfolio… …with strong H2 deposit growth
…and lower funding costs
Deposit balances £bn
+6%
Cost (bps) 72 47
LDR 112% 115%
Current accounts Savings Term deposits
11

12
27
23
7
33
90
100+
Run ratesavings
achieved todate
Run ratesavings to bedelivered inFY18-19
Savingsreinvested in
business
Target netcost savings by
FY19
C O S T S A V I N G S R U N N I N G A H E A D O F S C H E D U L E
Network efficiency
Organisational design
Operational efficiency
Central cost management
Underlying operating costs £m Reinvestment in business to
enhance customer proposition
Driven by central cost management and organisational
efficiency
729
675
FY16 FY17
Run rate savings delivered: £90m provides cost
momentum into FY18 and capacity for reinvestment
One year in, 2/3rds of initiatives delivered Cost savings facilitating reinvestment
Run rate cost savings£m
(54)
(1) Relative to FY16
(1)
12

N O C O M P R O M I S E O N A S S E T Q U A L I T Y
21
9 14
35
25 26
2015 2016 2017
Net Gross (2)
(1) Cost of risk includes credit risk adjustment on loans at fair value(2) Excluding provision releases/recoveries and debt sales
Gross cost of risk (2)
(bps)
12 4 2
FY15 FY16 FY17
Mortgages£23.5bn
72 60 62
FY15 FY16 FY17
SME£7.3bn
189 210 266
FY15 FY16 FY17
Unsecured£1.2bn
Credit performance remains stable…
Cost of risk (1)
(bps)
13
…across our key asset classes
Impairment charge £78m £39m £48m

168
21 7
42
93
20 34
27
12.6% 12.4%
Sep-16 Generated Assetgrowth
Investmentspend
AT1distribution
Restructuring Conduct Pension Other Sep-17
C A P I TA L G E N E R AT I O N S U P P O R T I N G G R O W T H A N D R E S T R U C T U R I N G
CET1 ratio evolution (bps)
Underlying capital generation 13bps
Impact of increase in RWAs
£58m impact of increased provisions
Elimination of IAS19 pension deficit less £50m contribution
14
18.2% Total capital 17.9%
6.8% Leverage ratio 6.3%

O P T I M I S I N G O U R C A P I TA L
• Expectations for transition timeline and impact unchanged
– Mortgage portfolio – 1 October 2018
– Full bank – by 1 October 2019
• c.£5bn mortgage RWA reduction when IRB achieved (1)
8.0 8.6
7.1 7.43.9 3.7
19.0 19.7
Sep-16 Sep-17
Retail mortgages Business lending Other
RWAs£bn
DB scheme closed to
future accruals
• Harmonised colleagues’ pension benefits
• Cost savings reinvested in colleague rewards
• Scheme liabilities reduced
• Improves deficit, reduces capital risk
Triennial valuation agreed
• Deficit reduced from £450m to £290m
• Contribution plan of c.£50m per annum from FY19 to FY23
• Route to fully-funded scheme agreed
Note: More detail in appendix, slide 29(1) Based on internal models and 31 March 2016 balance sheet15
Management action on pensions delivering clear benefits
Targeted lending growth increased RWAs….
…with IRB programme on track

4056
79 73
FY15 FY16 FY17 To Aug-19
Experience Provision Indemnity
F U R T H E R P R O G R E S S O N L E G A C Y C O N D U C T
16
0.4
0.10.3
0.1
1.5
0.7
Sep-16 Remediation PBR Walk-ins Other Sep-17
PPI provision Other conduct provisions Indemnity
Unutilised cover £bn
PPI walk in complaints ‘000
c.2x
PBR now complete, Remediation expected to complete in Q1 2018
Indemnity drawn down by £534m in FY17,
principally PPI
FY17 assumed to be high watermark for walk ins: • Increased CMC activity ahead of time
bar/denial of Judicial Review• Increased media attention around FCA
advertising campaign
Management believe cover is sufficient… …based on updated assumptions

Metric Medium term guidance
RoTE Double digit by FY19
CIR 55% - 58% by FY19
Loan growth Mid single digit % CAGR to FY19
CET1 12-13%
LDR (1) < 120%
Dividend 50% pay out ratio over time
F Y 1 8 A N D M E D I U M T E R M G U I D A N C E
(1) Including TFS
Metric FY18 guidance
NIM c.220bps
Underlying costs < £650m
Loan growth Mid-single digit %
CET1 12-13%
LDR (1) <120%
17
Medium term guidance on track

Summary & outlookDavid DuffyChief Executive Officer

C O N T I N U I N G O U R E V O LU T I O N
Business transformation is delivering improved financial performance…
…and a better bank for customers and colleagues
19 (1) Financials as at 30 September 2015
STATUTORY PROFIT £182m(£229m)
5.1% UNDERLYING ROTE 7.5%
£28.8bn LOANS £32.0bn
75% UNDERLYING CTI 67%
FY 17IPO (1)• Clear, customer-focused strategy
• Expanded channel and product capability
• Reinvigorated SME business
• Reshaped distribution network
• Overhauled colleague proposition
• Embedded prudent risk management culture
• Built market-leading digital platform£26.3bn DEPOSITS £27.7bn
£159m UNDERLYING PBT £293m

D E L I V E R I N G G R O W T H B Y L E V E R A G I N G O U R S T R O N G B R A N D S A N D D I G I TA L P L AT F O R M …
Three brands, one digital platform…
20
….powering national customer growth
Proud Scottish heritage since 1838
Powerful regional brand since 1859
Dynamic, digitalbrand
Expansion
National Digital Presence

21
FUTURE TODAY…AND WE’RE READY FOR THE
B Aggregation
B for Business
B @ Home
B TravellerB Smart
B MoneyB Secure
B Connected
Q&A

Contact details:
Andrew DowneyHead of Investor RelationsCYBG PLC m: +44 7823 443 150e: [email protected]
Owen PriceInvestor RelationsCYBG PLC m: +44 7484 908 949e: [email protected]
www.cybg.com

Appendix

2.67 2.72
2.93
2015 2016 2017
Repayment and borrower profile
OO - C/I50%
OO - I/O19%
BTL - I/O29%
BTL - C/I2%
M O R T G A G E P O R T F O L I O – 2 0 1 7
Gross new mortgage lending
Gross new mortgage lending Gross new mortgage lending (2)
Note: Excludes loans where data is not currently available due to front book data matching still to be completed and historic data capture requirements(1) Other includes Wales, Northern Ireland, Channel Islands and those new accounts where the region might be unknown until collateral matching has occurred(2) Excludes BTL portfolio
Scotland8%
England North12%
England Midlands5%
Greater London34%
Rest of South28%
Other13%
<50%11%
50-80%66%
80-90%19%
>90%4%
(1)
Gross new mortgage lending
25
Mortgage lending location
Loan-to-income breakdownLTV of gross new mortgage lending

B R O K E R O R I G I N AT I O N – 2 0 1 7
Gross new mortgage lending volumes Indexed LTV band (value)
Geographic split LTI split
(£bn)
3.6 3.7 4.4
1.3 1.11.0
4.9 4.8 5.4
2015 2016 2017Broker Proprietary Channels
73% 77%
broker % total new business volume
Intermediary stock
<50%28%
50-80%63%
80-90%8%
>90%1%
Scotland5% England North
8%
England Midlands5%
Greater London46%
Rest of South31%
Other5%
<=216%
2-326%
3-431%
4-523%
>54%
Note: Excludes loans where data is not currently available due to front book data matching still to be completed and historic data capture requirements(1) Other includes Wales, Northern Ireland, Channel Islands and those new accounts where the region might be unknown until collateral matching has occurred
(1) Intermediary stock
Intermediary stock81%
26

B T L L O A N B O O K – 2 0 1 7
BTL stock Indexed LTV
LTI split Rent cover
(£bn)
New lendingTotal BTL
5.7 6.7 7.1
0.7 0.7 0.7 6.4 7.4 7.8
2015 2016 2017I/O C&I
<50%26%
50-80%73%
80-90%1%
<=227%
2-329%
3-424%
4-514%
>56%
<=75%2%
75-100%3% 100-125%
5%125-150%
10%
>150%80%
Note: Excludes loans where data is not currently available due to front book data matching still to be completed and historic data capture requirements(1) Other includes Wales, Northern Ireland, Channel Islands and those new accounts where the region might be unknown until collateral matching has occurred
Total BTL
27

S M E L O A N B O O K – 2 0 1 7
SME book Business lending portfolio by collateral cover
Business banking clients
% of total business lending
(1) Other includes utilities, post and telecommunications, resources and finance sectors
CRE: 7%Housing
Associations: 3%
Retail & wholesale trade11%
Gov’t, health and education12%
Business services11%
Manufacturing9%
Hospitality7%
CRE10%
Transport and storage4%
Construction2%
Other 8%
Entertainment3%
Agriculture23%
Fully secured47%
Partially secured21%
Largely/fully unsecured
32%
Top 53% 6-20 largest
5%
Other92%
(1)
28

S I G N I F I C A N T P R O G R E S S O N D E F I N E D B E N E F I T S C H E M E
Closure of DB scheme to future accruals Triennial valuation
• P&L:– £88m exceptional gain (pre-tax)
• Balance sheet:– £88m positive impact to IAS19 position– Positive TNAV impact of £57m
• Triennial valuation concluded by trustees of the DB scheme
• Deficit reduced from £450m to £290m– Agreement to close DB scheme delivered £131m
reduction
• Value of contributions agreed with trustees pre-IPO is unchanged:
– £50m in May 2017; plus– £50 million in each financial year 2019 to 2022; plus– £55 million in 2023
• Elimination of the IAS19 deficit – Removal of £75m deficit has a positive CET1 impact– No capital benefit once in surplus, although surplus
position protects CET1 ratio from future adverse actuarial movements
• Future contributions will therefore reduce capital:– Cash contributions reduce CET1– IAS 19 surplus increases are capital neutral
• Contributions are already included in CYBG’s capital plan
29
IAS 19 impact
CET1 impact
Actuarial position

B A L A N C E S H E E T
£m September 2017 September 2016
Mortgages 23,480 21,836SME - Core Book 6,821 6,438SME – Non-Core Book 504 720Unsecured personal lending 1,162 1,153
Total Customer Loans 31,967 30,147Liquid Assets and other 9,013 7,686Other Assets 2,251 2,096
Total Assets 43,231 39,929Customer Deposits 27,679 27,000Wholesale Funding (excl. TFS) 6,702 5,810TFS 1,900 -Notes in Circulation 2,197 1,912Other Liabilities 1,351 1,996
Total Liabilities 39,829 36,718Equity and Reserves 3,402 3,211
Liabilities and Equity 43.231 39,92930

R W A
£m September 2017 September 2016
Retail mortgages 8,646 7,998
Business lending 7,359 7,087
Other retail lending 932 915
Other lending 815 906
Total credit risk 17,752 16,906
Credit valuation adjustment 167 286
Operational risk 1,621 1,623
Counterparty risk 138 214
Total RWAs 19,678 19,029
Total Loans 31,967 30,147
Credit RWAs / total loans 56% 56%
Total RWAs / Assets 46% 48%
31
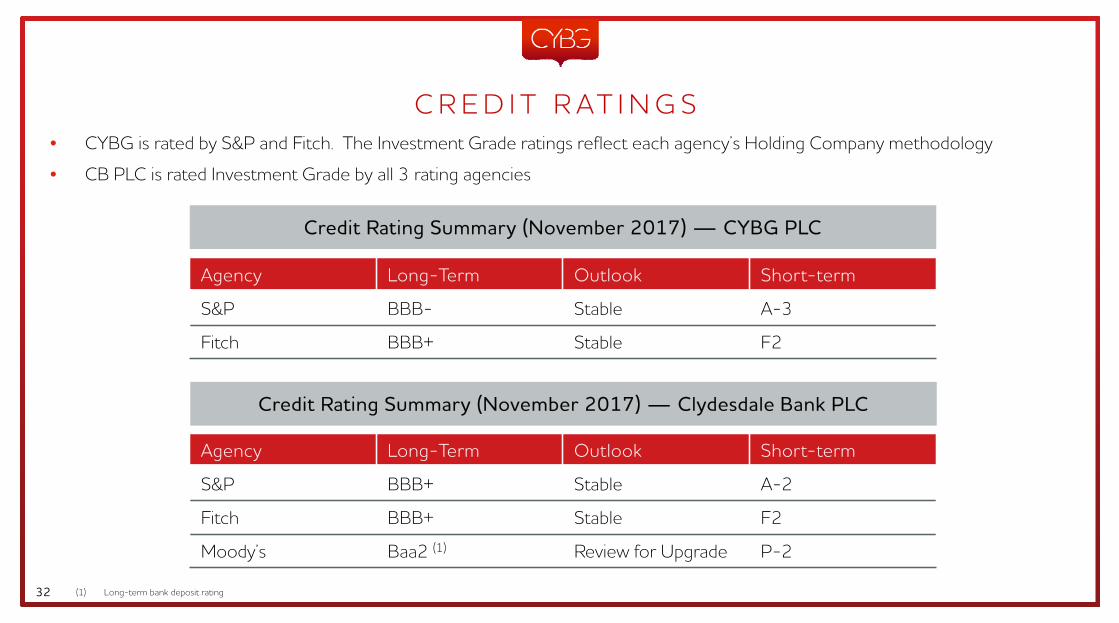
C R E D I T R AT I N G S
Credit Rating Summary (November 2017) — CYBG PLC
Credit Rating Summary (November 2017) — Clydesdale Bank PLC
Agency Long-Term Outlook Short-term
S&P BBB- Stable A-3
Fitch BBB+ Stable F2
Agency Long-Term Outlook Short-term
S&P BBB+ Stable A-2
Fitch BBB+ Stable F2
Moody’s Baa2 (1) Review for Upgrade P-2
• CYBG is rated by S&P and Fitch. The Investment Grade ratings reflect each agency’s Holding Company methodology
• CB PLC is rated Investment Grade by all 3 rating agencies
32 (1) Long-term bank deposit rating

F T E B R E A K D O W N
September 2017
September 2016
September 2015
Core FTE 5,739 6,313 6,848
Legacy conduct FTE 621 533 396
Total FTE 6,360 6,846 7,244
33

D I S C L A I M E RThis document has been prepared by CYBG PLC (the “Company”) and is the responsibility of the Company. It was prepared for the purpose of, and comprises the written materials usedin and/ or discussed at, the presentation(s) given to stakeholders concerning the financial results of the Company and its subsidiaries (which together comprise the “Group”) for thetwelve months ending 30 September 2017. This document is a marketing communication and should not be regarded as a research recommendation.
The information in this document may include forward looking statements, which are based on assumptions, expectations, valuations, targets, estimates, forecasts and projections aboutfuture events. These can be identified by the use of words such as 'expects', 'aims', 'targets', 'seeks', 'anticipates', 'plans', 'intends', 'prospects' 'outlooks', 'projects', 'believes', 'estimates','potential', 'possible', and similar words or phrases. These forward looking statements, as well as those included in any other material discussed at the presentation, are subject to risks,uncertainties and assumptions about the Group and its securities, investments and the environment in which it operates, including, among other things, the development of its businessand strategy, trends in its operating industry, changes to customer behaviours and covenant, macroeconomic and/or geopolitical factors, changes to its board and/ or employeecomposition, exposures to terrorist activity, IT system failures, cyber-crime, fraud and pension scheme liabilities, changes to law and/or the policies and practices of the BoE, the FCAand/or other regulatory bodies, inflation, deflation, interest rates, exchange rates, changes in the liquidity, capital, funding and/ or asset position and/or credit ratings of the Group, therepercussions of the UK's referendum vote to leave the European Union, and future capital expenditures and acquisitions.
In light of these risks, uncertainties and assumptions, the events in the forward looking statements may not occur. Forward looking statements involve inherent risks and uncertainties.Other events not taken into account may occur and may significantly affect the analysis of the forward looking statements. No member of the Group or their respective directors,officers, employees, agents, advisers or affiliates gives any assurance that any such projections or estimates will be realised or that actual returns or other results will not be materiallylower than those set out in this document and/or discussed at any presentation. All forward looking statements should be viewed as hypothetical. No representation or warranty is madethat any forward looking statement will come to pass. No member of the Group or their respective directors, officers, employees, agents, advisers or affiliates undertakes any obligationto update or revise any such forward looking statement following the publication of this document nor accepts any responsibility, liability or duty of care whatsoever for (whether incontract, tort or otherwise) or makes any representation or warranty, express or implied, as to the truth, fullness, fairness, merchantability, accuracy, sufficiency or completeness of, theinformation in this document or the materials used in and/ or discussed at, the presentation.
The information, statements and opinions contained in this document and the materials used in and/ or discussed at, the presentation, do not constitute a public offer under anyapplicable legislation or an offer to sell or solicitation of any offer to buy any securities or financial instruments or any advice or recommendation with respect to such securities or otherfinancial instruments.
The distribution of this document in certain jurisdictions may be restricted by law. Recipients are required by the Group to inform themselves about and to observe any such restrictions.No liability to any person is accepted in relation to the distribution or possession of this document in any jurisdiction. The information, statements and opinions contained in thisdocument and the materials used in and/ or discussed at, the presentation are subject to change.
Certain figures contained in this document, including financial information, may have been subject to rounding adjustments and foreign exchange conversions. Accordingly, in certaininstances, the sum or percentage change of the numbers contained in this document may not conform exactly to the total figure given.
34
Related Documents