17 - 1 © 2014 Pearson Education, Inc. Maintenance and Reliability PowerPoint presentation to accompany Heizer and Render Operations Management, Eleventh Edition Principles of Operations Management, Ninth Edition PowerPoint slides by Jeff Heyl Additional content from Gerry Cook 17 17 © 2014 Pearson Education, Inc.

17 - 1© 2014 Pearson Education, Inc. Maintenance and Reliability PowerPoint presentation to accompany Heizer and Render Operations Management, Eleventh.
Dec 25, 2015
Welcome message from author
This document is posted to help you gain knowledge. Please leave a comment to let me know what you think about it! Share it to your friends and learn new things together.
Transcript
17 - 1© 2014 Pearson Education, Inc.
Maintenance and Reliability
PowerPoint presentation to accompany Heizer and Render Operations Management, Eleventh EditionPrinciples of Operations Management, Ninth Edition
PowerPoint slides by Jeff HeylAdditional content from Gerry Cook
1717
© 2014 Pearson Education, Inc.

17 - 2© 2014 Pearson Education, Inc.
Outline► Global Company Profile:
Orlando Utilities Commission
► The Strategic Importance of Maintenance and Reliability
► Reliability► Maintenance► Total Productive Maintenance
17 - 3© 2014 Pearson Education, Inc.
Learning ObjectivesWhen you complete this chapter you should be able to:
1. Describe how to improve system reliability
2. Determine system reliability
3. Determine mean time between failure (MTBF)
4. Distinguish between preventive and breakdown maintenance

17 - 4© 2014 Pearson Education, Inc.
When you complete this chapter you should be able to:
Learning Objectives
5. Describe how to improve maintenance
6. Compare preventive and breakdown maintenance costs
7. Define autonomous maintenance

17 - 5© 2014 Pearson Education, Inc.
Orlando Utilities Commission
► Maintenance of power generating plants► Every year each plant is taken off-line for 1-
3 weeks maintenance► Every three years each plant is taken off-
line for 6-8 weeks for complete overhaul and turbine inspection
► Each overhaul has 1,800 tasks and requires 72,000 labor hours
► OUC performs over 12,000 maintenance tasks each year
© 2014 Pearson Education, Inc.
17 - 6© 2014 Pearson Education, Inc.
Orlando Utilities Commission
► Every day a plant is down costs OUC $110,000
► Unexpected outages cost between $350,000 and $600,000 per day
► Preventive maintenance discovered a cracked rotor blade which could have destroyed a $27 million piece of equipment
© 2014 Pearson Education, Inc.

17 - 7© 2014 Pearson Education, Inc.
Strategic Importance of Maintenance and Reliability
The objective of maintenance and reliability is to maintain the capability of the system
17 - 8© 2014 Pearson Education, Inc.
Strategic Importance of Maintenance and Reliability
▶Failure has far reaching effects on a firm’s▶Operation
▶Reputation
▶Profitability
▶Customer satisfaction
▶Reducing idle time
▶Protecting investment in plant and equipment

17 - 9© 2014 Pearson Education, Inc.
Maintenance and Reliability
▶Maintenance is all activities involved in keeping a system’s equipment in working order
▶Reliability is the probability that a machine will function properly for a specified time
17 - 10© 2014 Pearson Education, Inc.
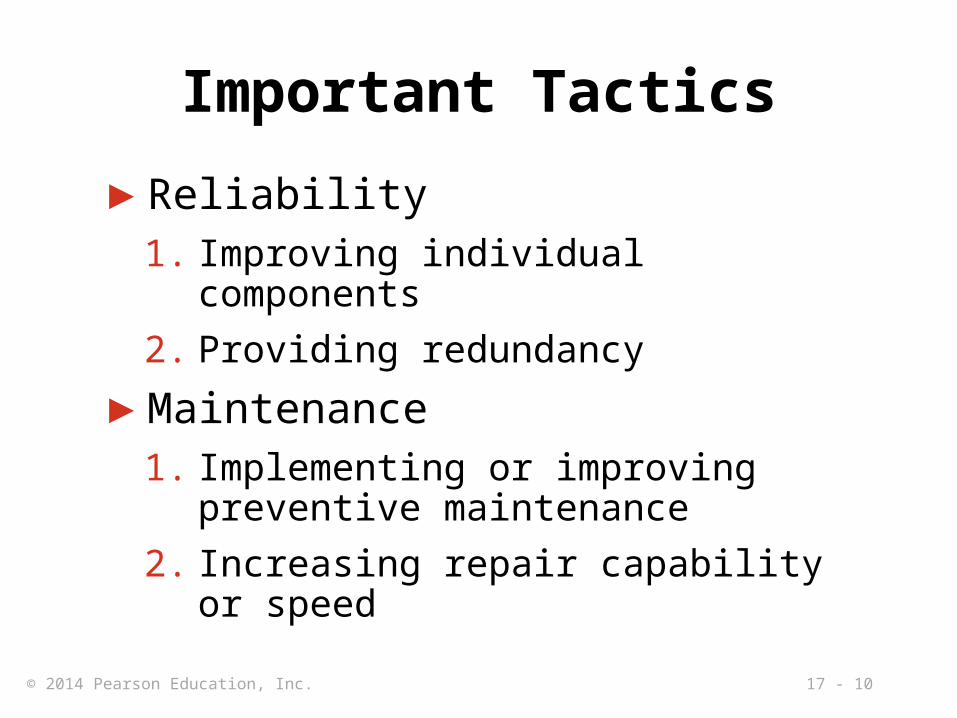
Important Tactics
▶Reliability1. Improving individual components
2. Providing redundancy
▶Maintenance1. Implementing or improving preventive
maintenance
2. Increasing repair capability or speed
17 - 11© 2014 Pearson Education, Inc.
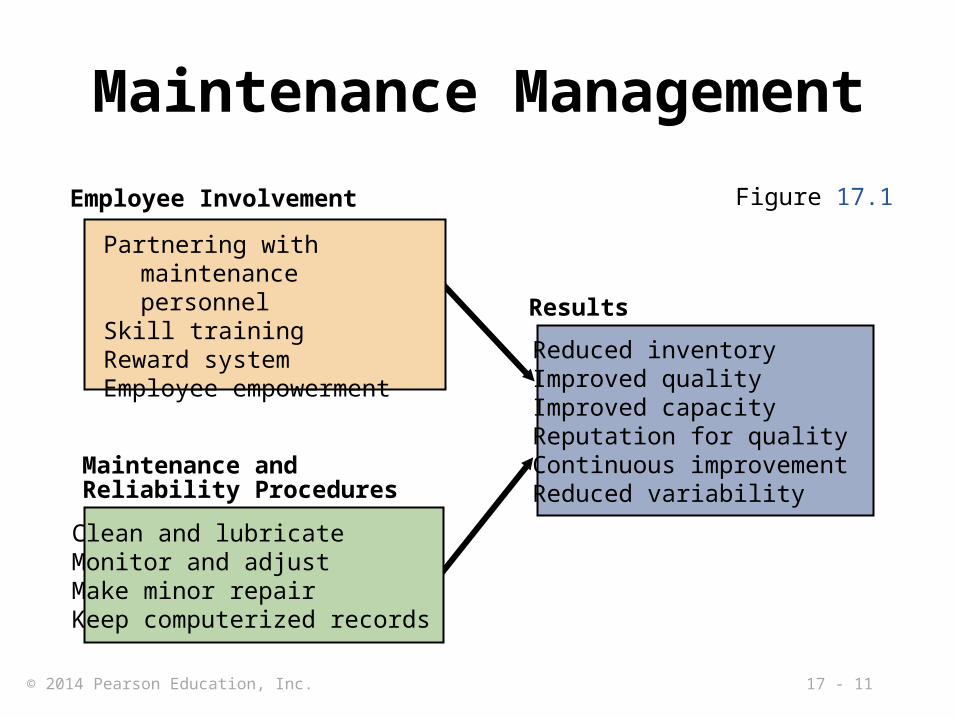
Maintenance Management
Employee Involvement
Partnering with maintenance personnel
Skill trainingReward systemEmployee empowerment
Maintenance and Reliability Procedures
Clean and lubricateMonitor and adjustMake minor repairKeep computerized records
Results
Reduced inventoryImproved qualityImproved capacityReputation for qualityContinuous improvementReduced variability
Figure 17.1
17 - 12© 2014 Pearson Education, Inc.
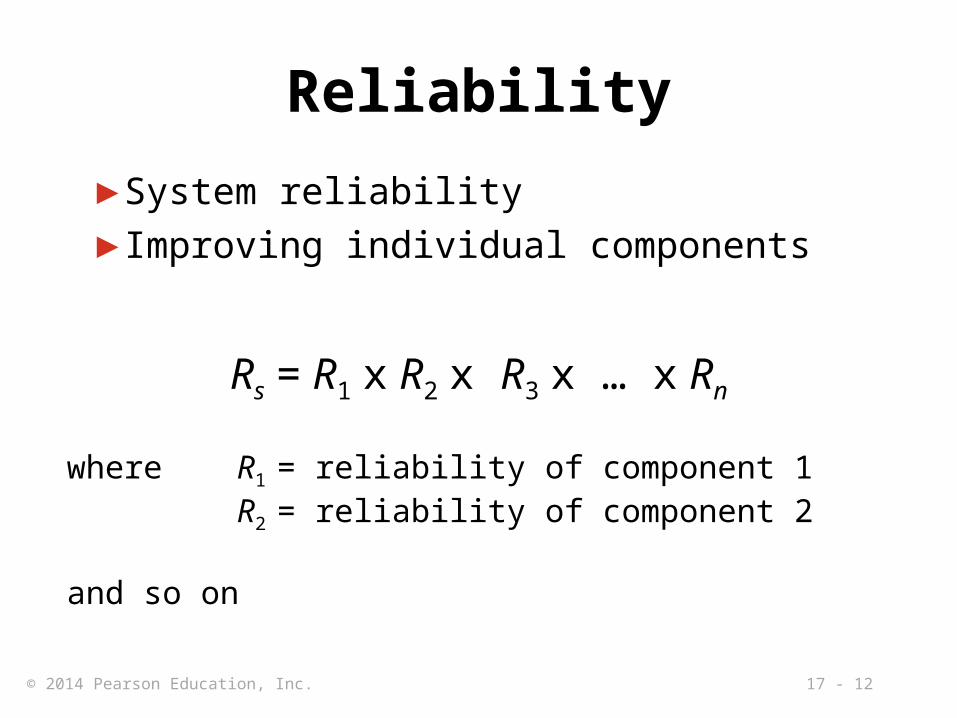
Reliability
▶System reliability
▶Improving individual components
Rs = R1 x R2 x R3 x … x Rn
where R1 = reliability of component 1R2 = reliability of component 2
and so on

17 - 13© 2014 Pearson Education, Inc.
Overall System ReliabilityR
elia
bilit
y of
the
sys
tem
(pe
rcen
t)
Average reliability of each component (percent)
| | | | | | | | |
100 99 98 97 96
100 –
80 –
60 –
40 –
20 –
0 –
n = 10
n = 1
n = 50n = 100n = 200n = 300
n = 400
Figure 17.2
17 - 14© 2014 Pearson Education, Inc.
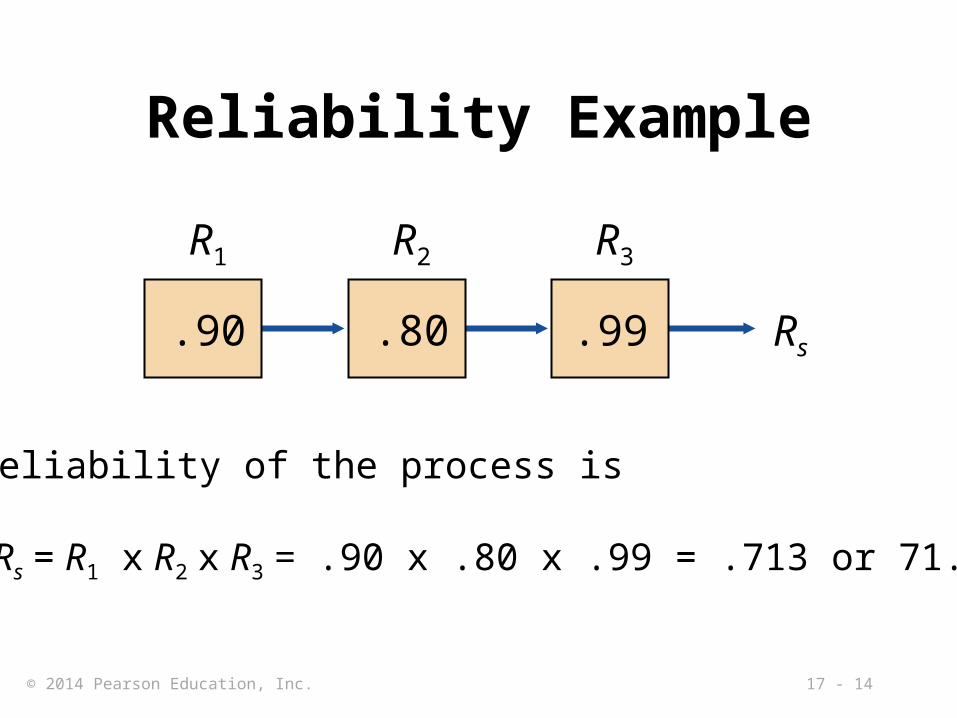
Rs
R3
.99
R2
.80
Reliability Example
R1
.90
Reliability of the process is
Rs = R1 x R2 x R3 = .90 x .80 x .99 = .713 or 71.3%

17 - 15© 2014 Pearson Education, Inc.
Product Failure Rate (FR)
Basic unit of measure for reliability
FR(%) = x 100%Number of failures
Number of units tested
FR(N) =Number of failures
Number of unit-hours of operating time
Mean time between failures
MTBF =1
FR(N)
17 - 16© 2014 Pearson Education, Inc.
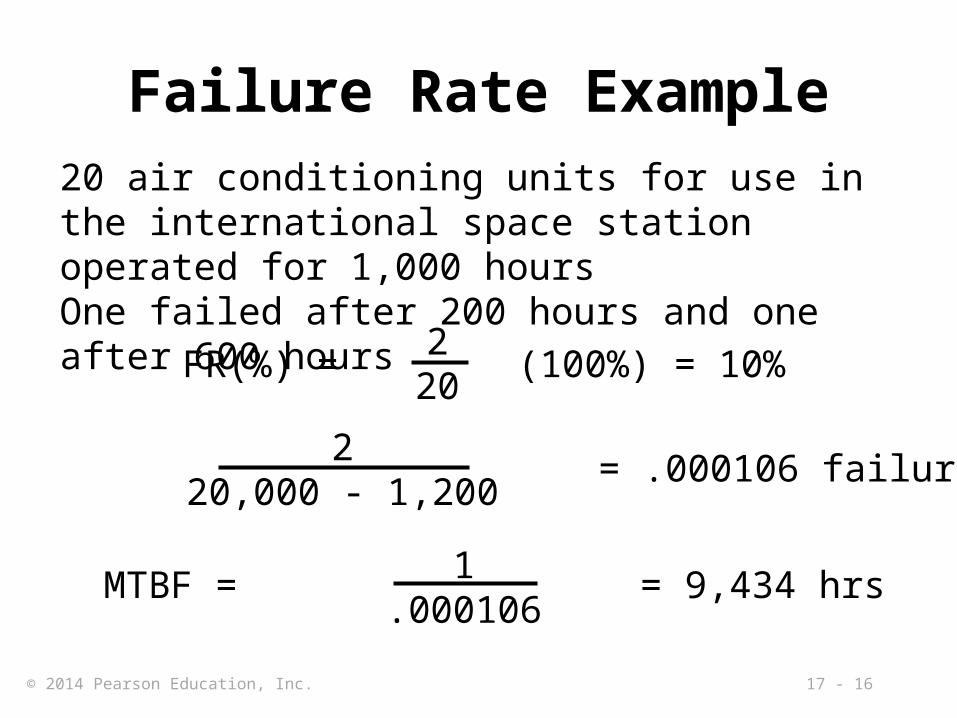
Failure Rate Example20 air conditioning units for use in the international space station operated for 1,000 hoursOne failed after 200 hours and one after 600 hours
FR(%) = (100%) = 10%2
20
FR(N) = = .000106 failure/unit hr2
20,000 - 1,200
MTBF = = 9,434 hrs1.000106
17 - 17© 2014 Pearson Education, Inc.
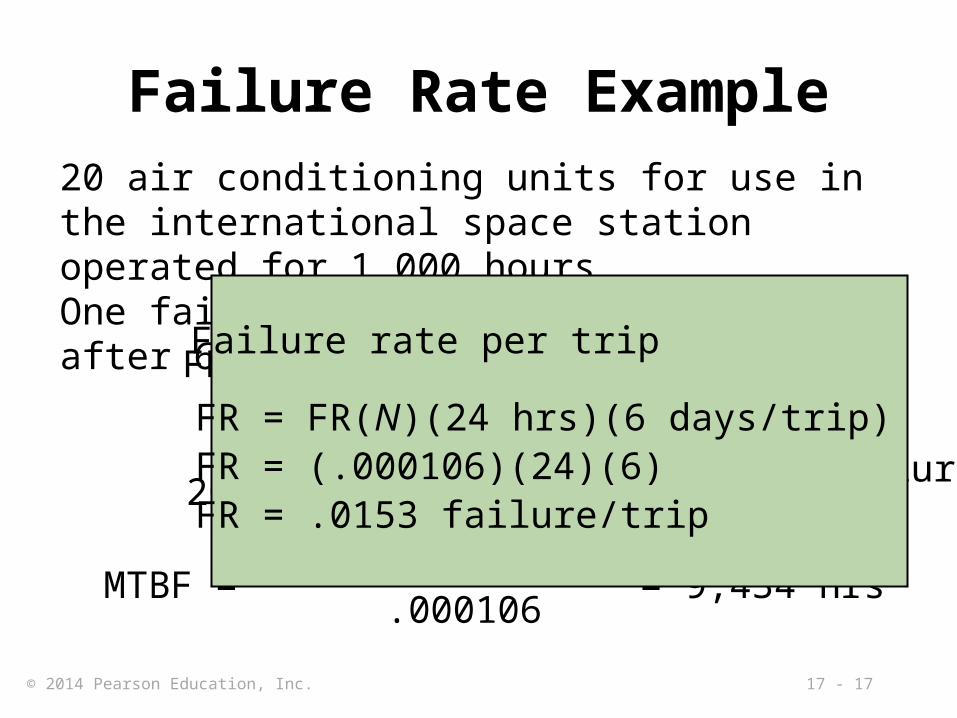
Failure Rate Example20 air conditioning units for use in the international space station operated for 1,000 hoursOne failed after 200 hours and one after 600 hours
FR(%) = (100%) = 10%2
20
FR(N) = = .000106 failure/unit hr2
20,000 - 1,200
MTBF = = 9,434 hrs1.000106
Failure rate per trip
FR = FR(N)(24 hrs)(6 days/trip)FR = (.000106)(24)(6)FR = .0153 failure/trip

17 - 18© 2014 Pearson Education, Inc.
Providing RedundancyProvide backup components to increase reliability
+ x
Probability of first
component working
Probability of needing second
component
Probability of second
component working
RS =
(.8) + (.8) x (1 - .8)
= .8 + .16 = .96
=
17 - 19© 2014 Pearson Education, Inc.
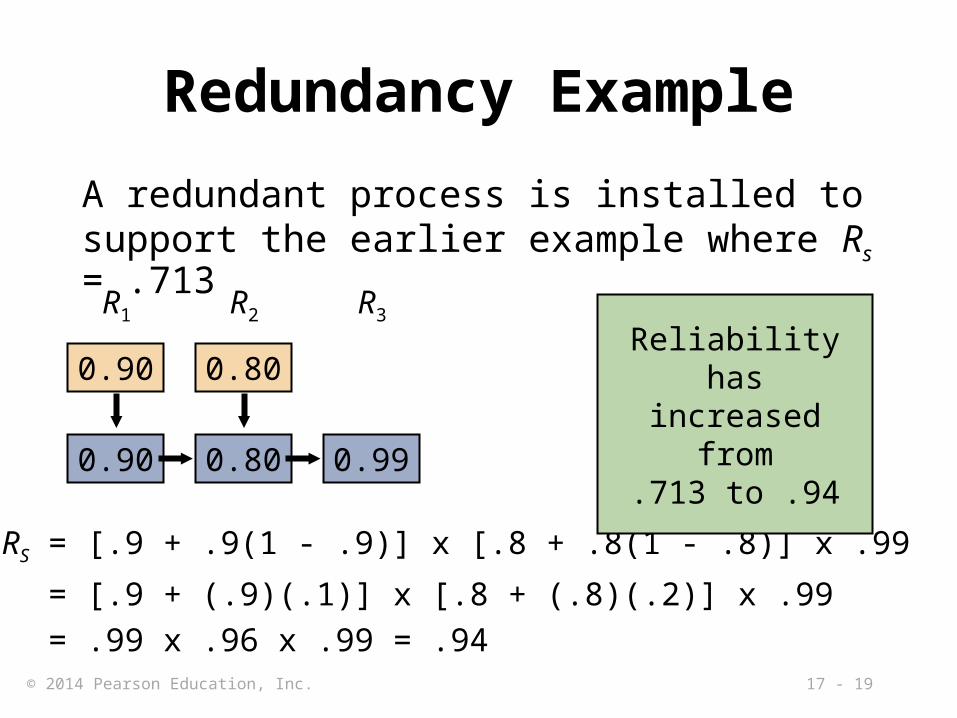
Redundancy Example
A redundant process is installed to support the earlier example where Rs = .713
R1
0.90
0.90
R2
0.80
0.80
R3
0.99
RS = [.9 + .9(1 - .9)] x [.8 + .8(1 - .8)] x .99
= [.9 + (.9)(.1)] x [.8 + (.8)(.2)] x .99
= .99 x .96 x .99 = .94
Reliability has increased from
.713 to .94
17 - 20© 2014 Pearson Education, Inc.
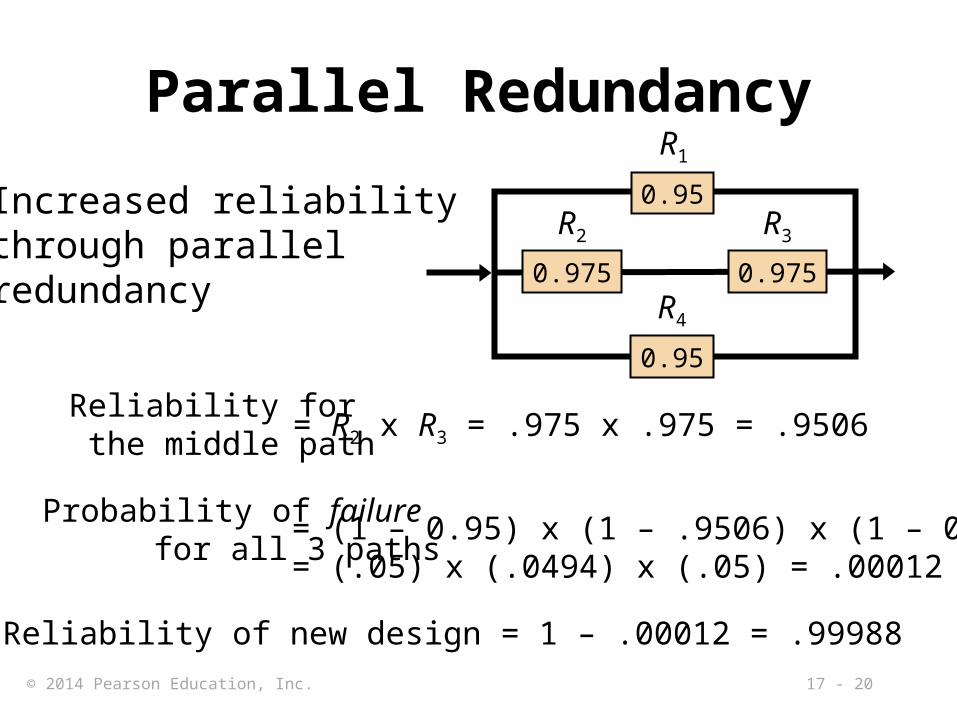
Parallel Redundancy
Increased reliability through parallel redundancy
R1
0.95
0.95
R4
0.975
R2
0.975
R3
Reliability for the middle path
= R2 x R3 = .975 x .975 = .9506
Probability of failure for all 3 paths
= (1 – 0.95) x (1 – .9506) x (1 – 0.95)= (.05) x (.0494) x (.05) = .00012
Reliability of new design = 1 – .00012 = .99988

17 - 21© 2014 Pearson Education, Inc.
Maintenance
▶Two types of maintenance▶Preventive maintenance – routine
inspection and servicing to keep facilities in good repair
▶Breakdown maintenance – emergency or priority repairs on failed equipment
17 - 22© 2014 Pearson Education, Inc.
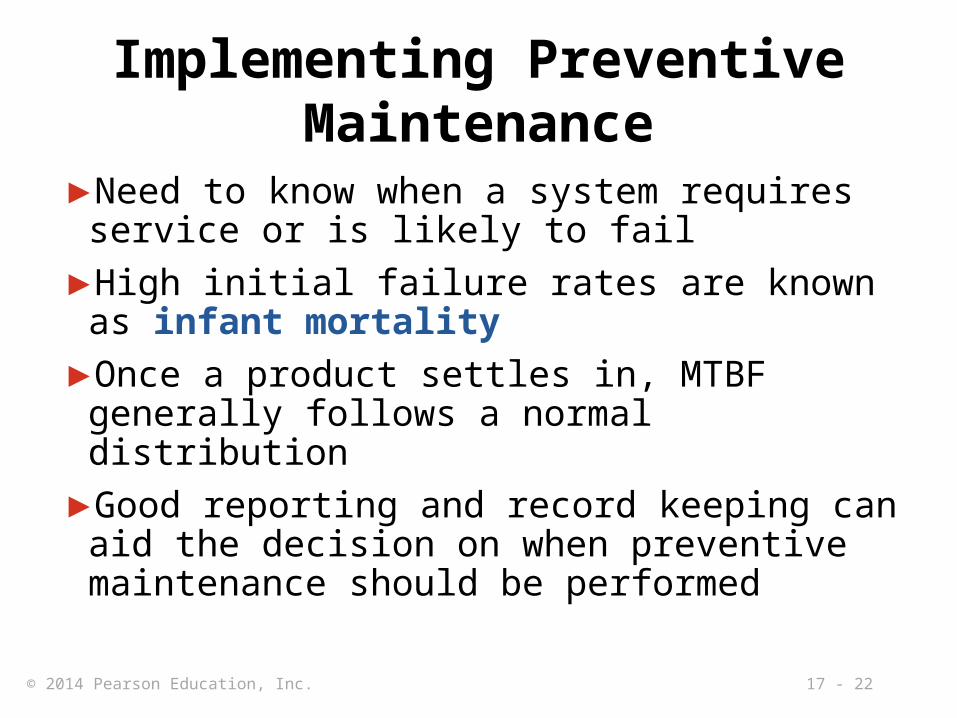
Implementing Preventive Maintenance
▶Need to know when a system requires service or is likely to fail
▶High initial failure rates are known as infant mortality
▶Once a product settles in, MTBF generally follows a normal distribution
▶Good reporting and record keeping can aid the decision on when preventive maintenance should be performed
17 - 23© 2014 Pearson Education, Inc.
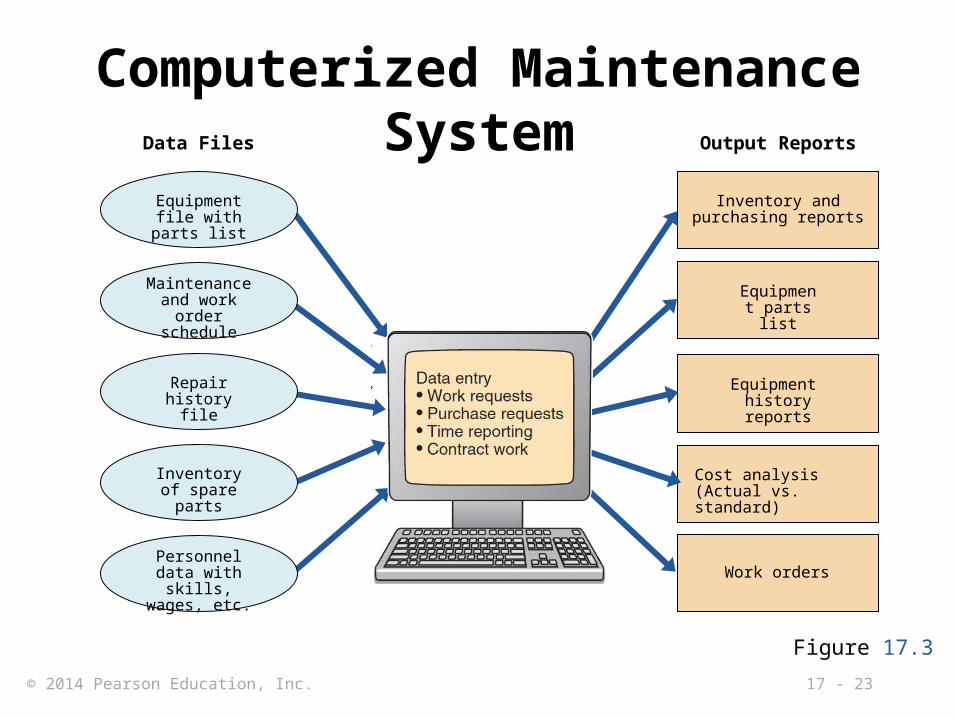
Computerized Maintenance System
Figure 17.3
Output Reports
Inventory and purchasing reports
Equipment parts list
Equipment history reports
Cost analysis (Actual vs. standard)
Work orders
Data Files
Personnel data with skills,
wages, etc.
Equipment file with parts list
Maintenanceand work order
schedule
Inventory of spare parts
Repair history file
17 - 24© 2014 Pearson Education, Inc.
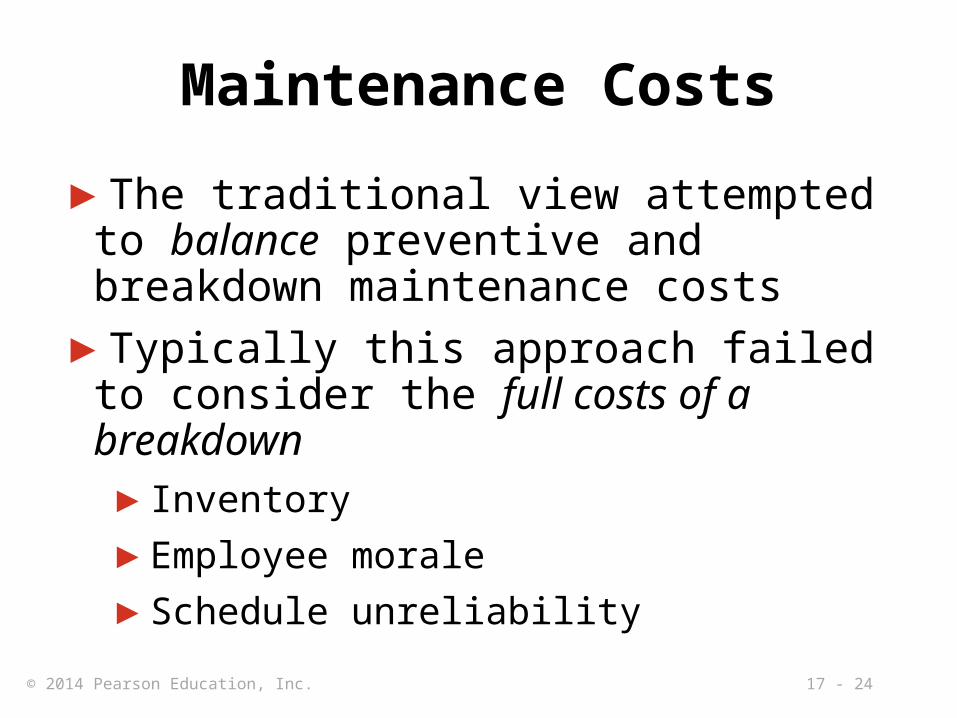
Maintenance Costs
▶The traditional view attempted to balance preventive and breakdown maintenance costs
▶Typically this approach failed to consider the full costs of a breakdown▶Inventory
▶Employee morale
▶Schedule unreliability
17 - 25© 2014 Pearson Education, Inc.
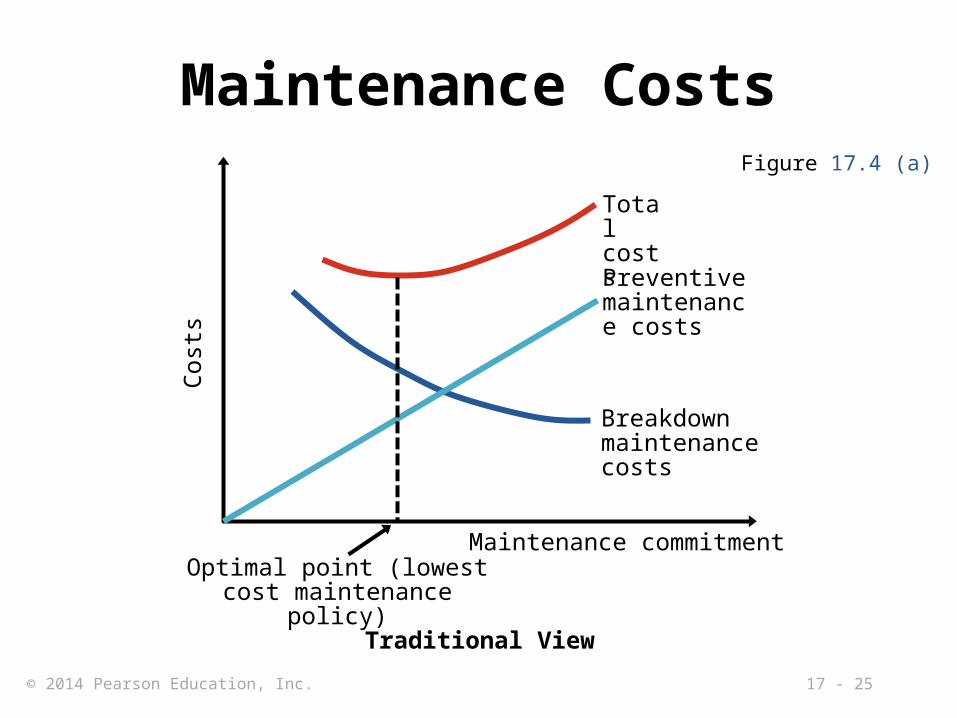
Maintenance CostsFigure 17.4 (a)
Total costs
Breakdown maintenance costs
Cos
ts
Maintenance commitment
Traditional View
Preventive maintenance costs
Optimal point (lowestcost maintenance policy)
17 - 26© 2014 Pearson Education, Inc.
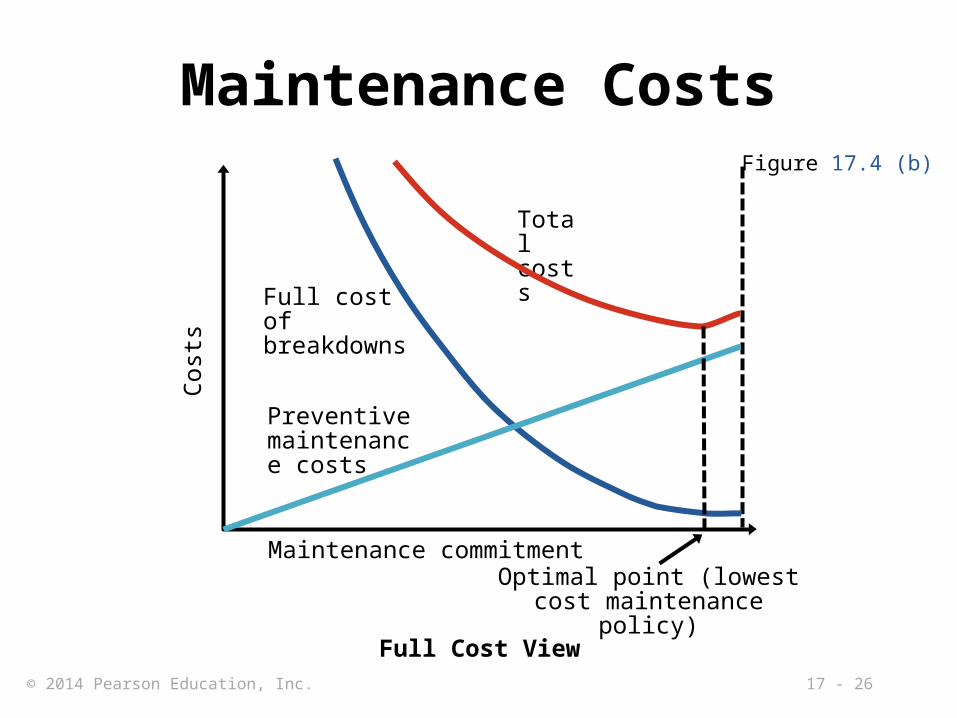
Maintenance CostsFigure 17.4 (b)
Cos
ts
Maintenance commitment
Full Cost View
Optimal point (lowestcost maintenance policy)
Total costs
Full cost of breakdowns
Preventive maintenance costs

17 - 27© 2014 Pearson Education, Inc.
Maintenance Cost Example▶Should the firm contract for maintenance
on their printers?
NUMBER OF BREAKDOWNS
NUMBER OF MONTHS THAT BREAKDOWNS OCCURRED
0 2
1 8
2 6
3 4
Total : 20
Average cost of breakdown = $300

17 - 28© 2014 Pearson Education, Inc.
Maintenance Cost Example
1. Compute the expected number of breakdowns
NUMBER OF BREAKDOWNS FREQUENCY
NUMBER OF BREAKDOWNS FREQUENCY
0 2/20 = .1 2 6/20 = .3
1 8/20 = .4 3 4/20 = .2
∑ Number of breakdowns
Expected number of breakdowns
Corresponding frequency= x
= (0)(.1) + (1)(.4) + (2)(.3) + (3)(.2)
= 0 + .4 + .6 + .6
= 1.6 breakdowns / month
17 - 29© 2014 Pearson Education, Inc.
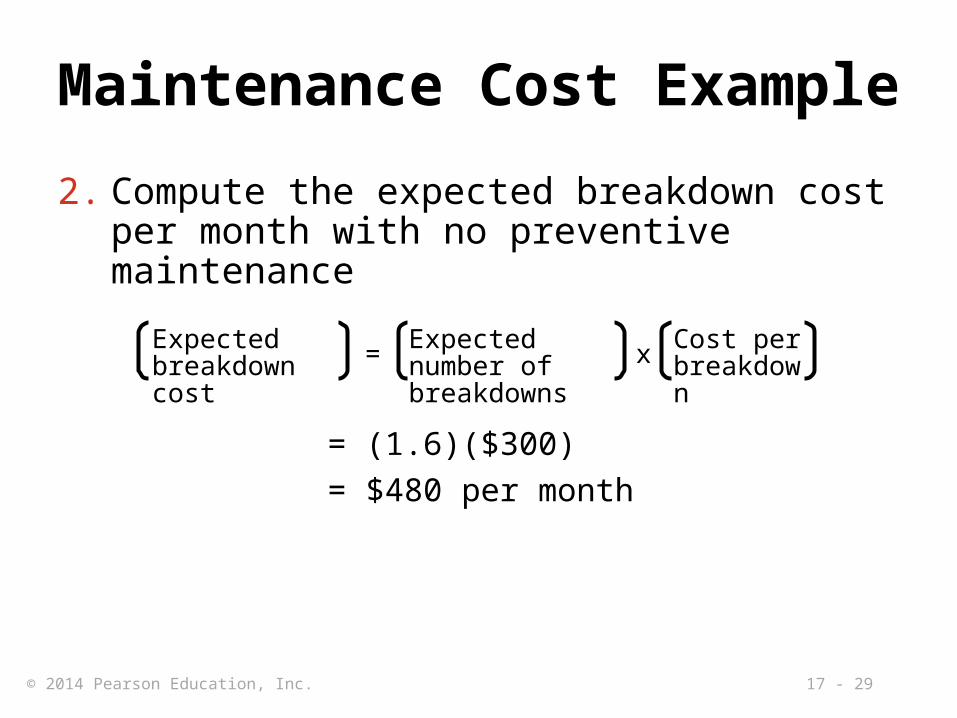
Maintenance Cost Example
2. Compute the expected breakdown cost per month with no preventive maintenance
Expected breakdown cost
Expected number of breakdowns
Cost per breakdown= x
= (1.6)($300)
= $480 per month

17 - 30© 2014 Pearson Education, Inc.
Maintenance Cost Example
3. Compute the cost of preventive maintenance
Preventive maintenance cost
Cost of expected breakdowns if service contract signed
Cost of service contract
=
+
= (1 breakdown / month)($300) + $150 / month
= $450 / month
Hire the service firm; it is less expensive

17 - 31© 2014 Pearson Education, Inc.
Increasing Repair Capabilities
1. Well-trained personnel
2. Adequate resources
3. Ability to establish repair plan and priorities
4. Ability and authority to do material planning
5. Ability to identify the cause of breakdowns
6. Ability to design ways to extend MTBF

17 - 32© 2014 Pearson Education, Inc.
Increasing Repair Capabilities
Figure 17.5
Operator(autonomous maintenance)
Maintenance department
Manufacturer’s field service
Depot service(return equipment)
Increasing Operator Ownership Increasing Complexity
Preventive maintenance costs less and is faster the more we move to the left
Competence is higher as we move to the right
17 - 33© 2014 Pearson Education, Inc.
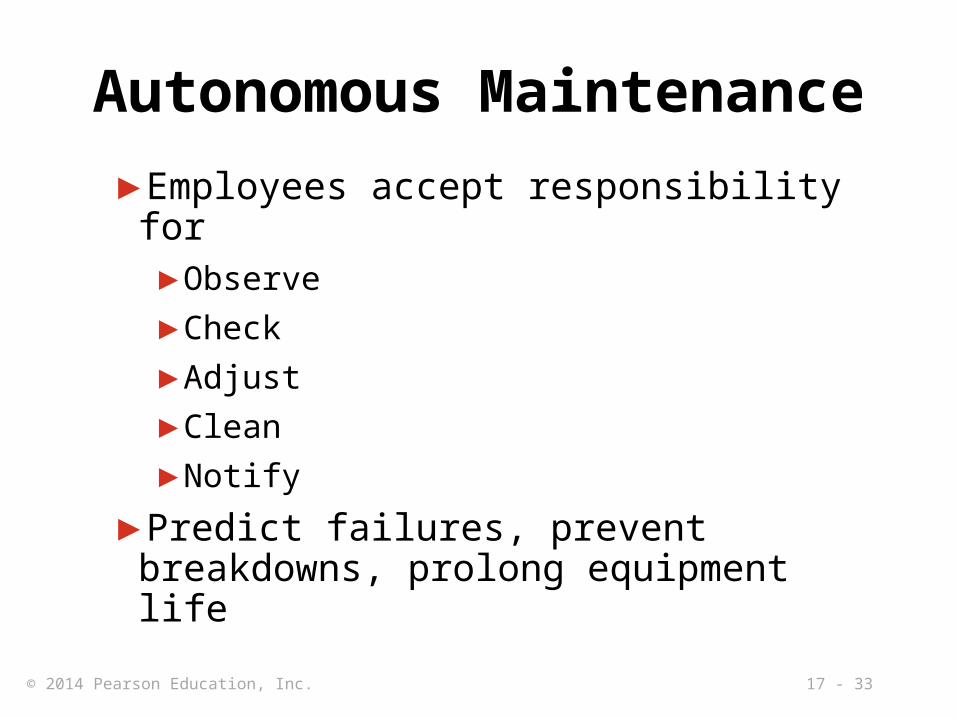
Autonomous Maintenance
▶Employees accept responsibility for▶Observe
▶Check
▶Adjust
▶Clean
▶Notify
▶Predict failures, prevent breakdowns, prolong equipment life
17 - 34© 2014 Pearson Education, Inc.
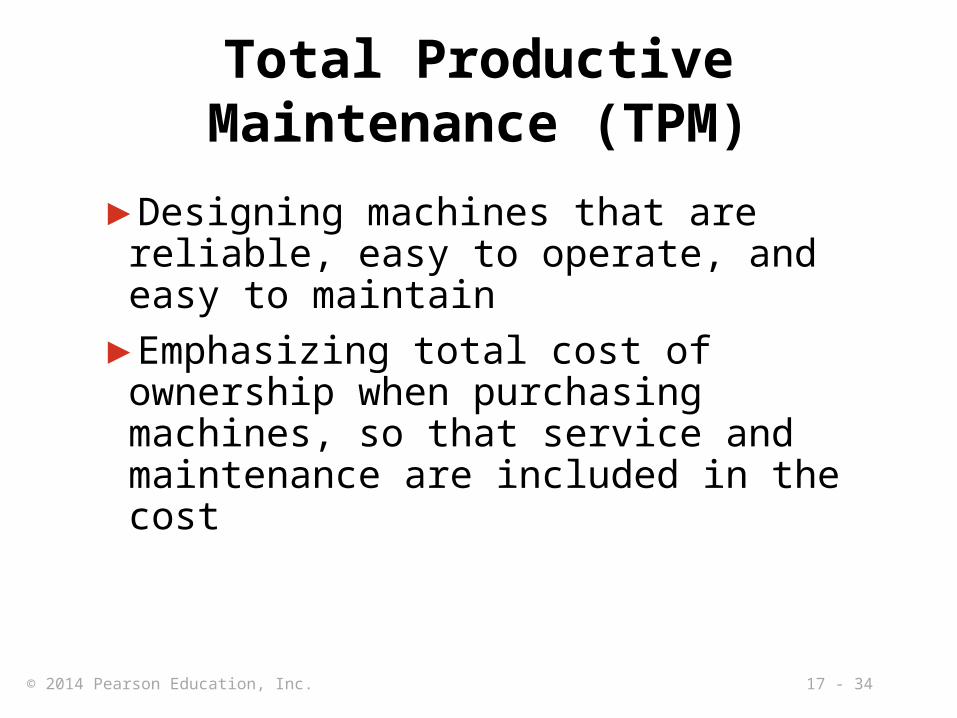
Total Productive Maintenance (TPM)
▶Designing machines that are reliable, easy to operate, and easy to maintain
▶Emphasizing total cost of ownership when purchasing machines, so that service and maintenance are included in the cost
17 - 35© 2014 Pearson Education, Inc.
Total Productive Maintenance (TPM)
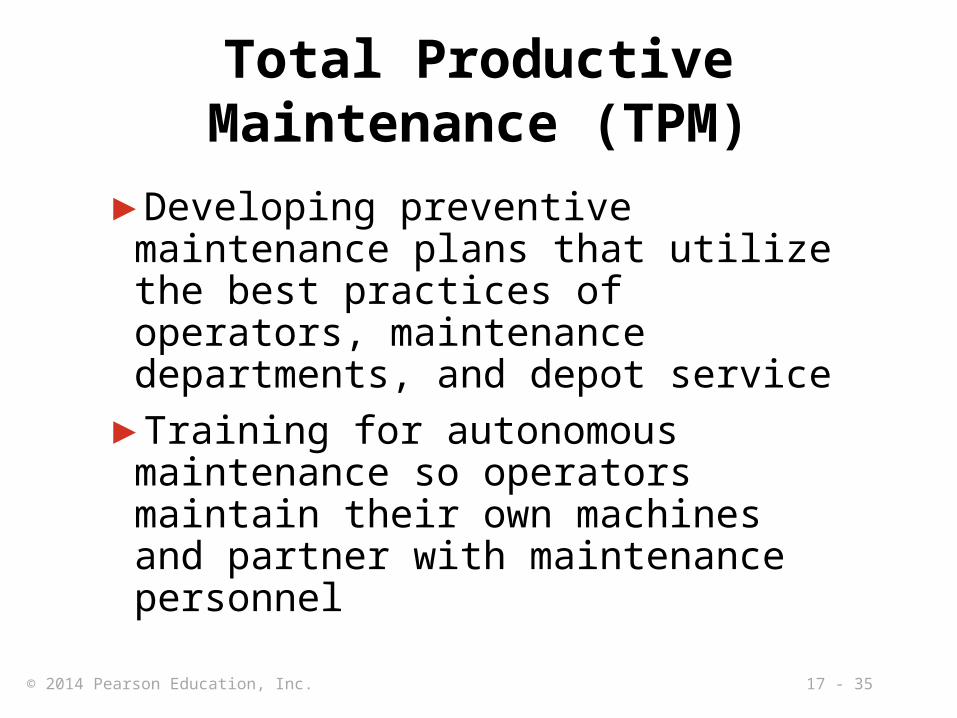
▶Developing preventive maintenance plans that utilize the best practices of operators, maintenance departments, and depot service
▶Training for autonomous maintenance so operators maintain their own machines and partner with maintenance personnel

17 - 36© 2014 Pearson Education, Inc.
More on Maintenance –
▶A simple redundancy formula
▶Problems with breakdown and preventive maintenance
▶Predictive maintenance
▶Predictive maintenance tools
▶Maintenance strategy implementation
▶Effective reliability
Supplemental Material
17 - 37© 2014 Pearson Education, Inc.
Providing Redundancy – An Alternate Formula
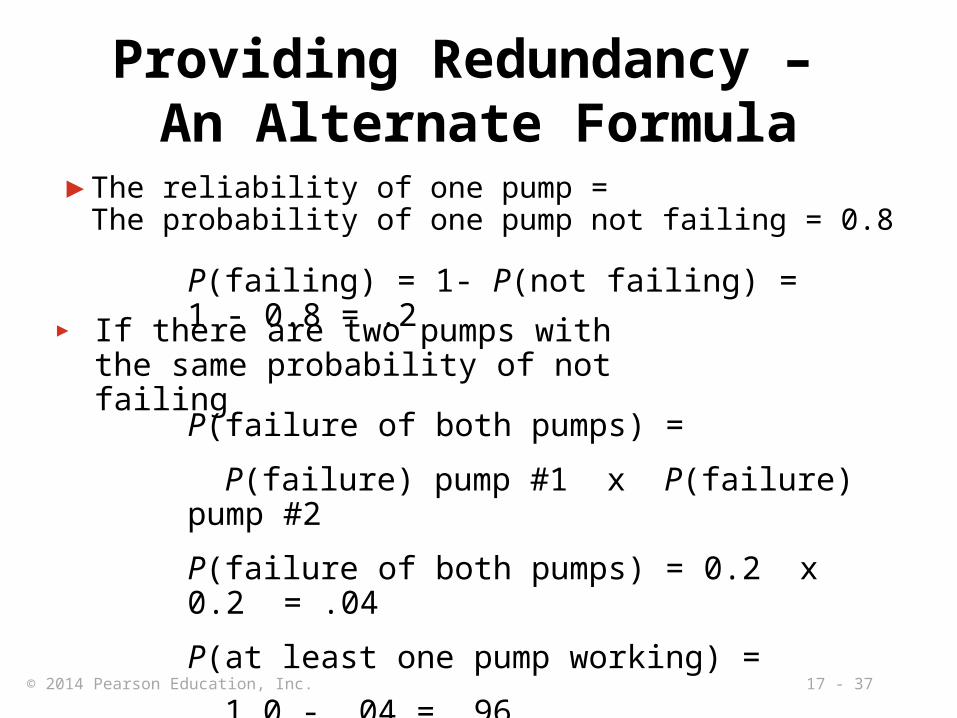
▶ The reliability of one pump =The probability of one pump not failing = 0.8
P(failing) = 1- P(not failing) = 1 - 0.8 = .2
P(failure of both pumps) =
P(failure) pump #1 x P(failure) pump #2
P(failure of both pumps) = 0.2 x 0.2 = .04
P(at least one pump working) =
1.0 - .04 = .96
► If there are two pumps with the same probability of not failing
17 - 38© 2014 Pearson Education, Inc.
Problems With Breakdown Maintenance
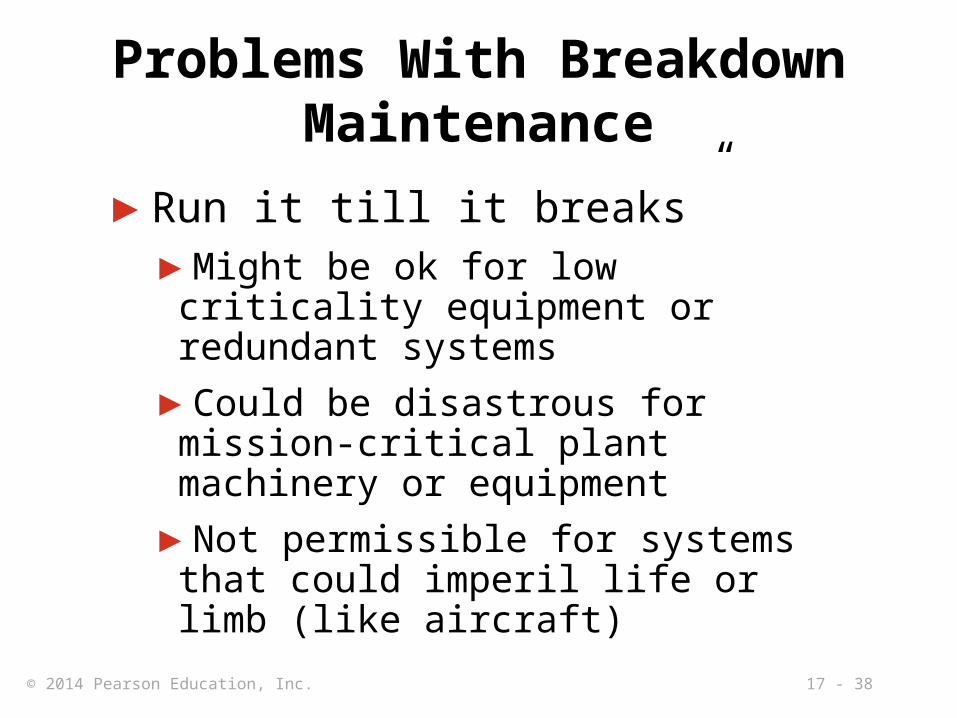
▶Run it till it breaks”▶Might be ok for low criticality equipment
or redundant systems
▶Could be disastrous for mission-critical plant machinery or equipment
▶Not permissible for systems that could imperil life or limb (like aircraft)
17 - 39© 2014 Pearson Education, Inc.
Problems With Preventive Maintenance
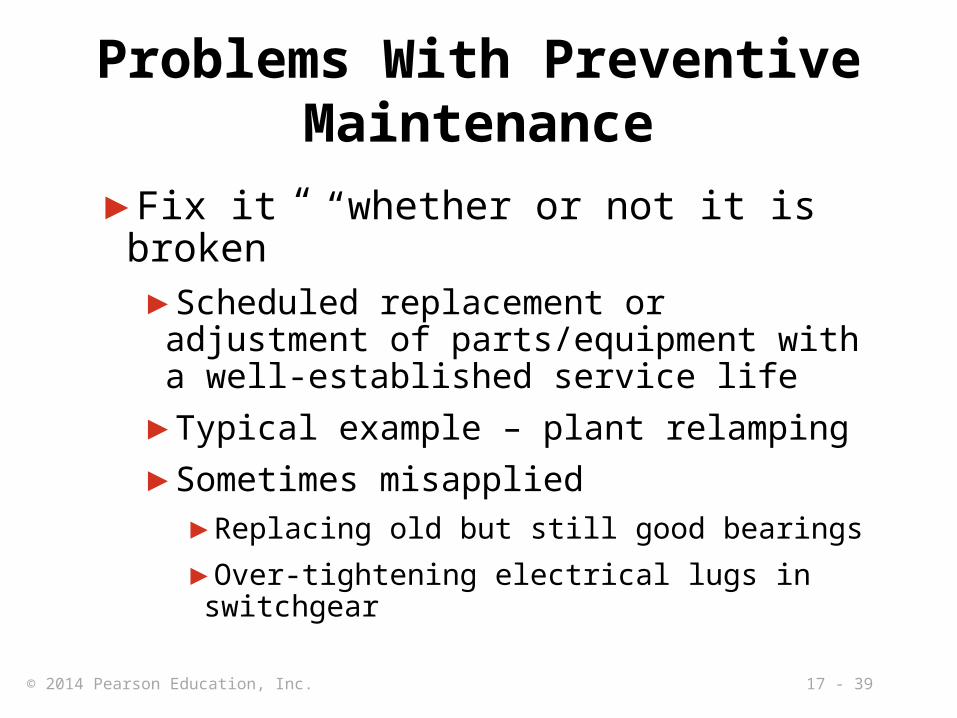
▶Fix it “whether or not it is broken”▶Scheduled replacement or adjustment of
parts/equipment with a well-established service life
▶Typical example – plant relamping
▶Sometimes misapplied▶Replacing old but still good bearings
▶Over-tightening electrical lugs in switchgear
17 - 40© 2014 Pearson Education, Inc.
Another Maintenance Strategy
▶Predictive maintenance – Using advanced technology to monitor equipment and predict failures▶Using technology to detect and predict imminent
equipment failure
▶Visual inspection and/or scheduled measurements of vibration, temperature, oil and water quality
▶Measurements are compared to a “healthy” baseline
▶Equipment that is trending towards failure can be scheduled for repair

17 - 41© 2014 Pearson Education, Inc.
Predictive Maintenance Tools
▶Vibration analysis
▶Infrared Thermography
▶Oil and Water Analysis
▶Other Tools:▶Ultrasonic testing
▶Liquid Penetrant Dye testing
▶Shock Pulse Measurement (SPM)
17 - 42© 2014 Pearson Education, Inc.
Predictive Maintenance Vibration Analysis
▶Using sensitive transducers and instruments to detect and analyze vibration
▶ Typically used on expensive, mission-critical equipment–large turbines, motors, engines or gearboxes
▶Sophisticated frequency (FFT) analysis can pinpoint the exact moving part that is worn or defective
▶Can utilize a monitoring service

17 - 43© 2014 Pearson Education, Inc.
Predictive Maintenance Infrared (IR) Thermography
▶Using IR cameras to look for temperature “hot spots” on equipment
▶ Typically used to check electrical equipment for wiring problems or poor/loose connections
▶Can also be used to look for “cold (wet) spots” when inspecting roofs for leaks
▶High quality IR cameras are expensive – most pay for IR thermography services
17 - 44© 2014 Pearson Education, Inc.
Predictive Maintenance Oil and Water Analysis
▶ Taking oil samples from large gearboxes, compressors or turbines for chemical and particle analysis▶Particle size can indicate abnormal wear
▶ Taking cooling water samples for analysis – can detect excessive rust, acidity, or microbiological fouling
▶Services usually provided by oil vendors and water treatment companies
17 - 45© 2014 Pearson Education, Inc.
Predictive Maintenance Other Tools and Techniques
▶Ultrasonic and dye testing – used to find stress cracks in tubes, turbine blades and load bearing structures▶Ultrasonic waves sent through metal
▶Surface coated with red dye, then cleaned off, dye shows cracks
▶Shock-pulse testing – a specialized form of vibration analysis used to detect flaws in ball or roller bearings at high frequency (32kHz)
17 - 46© 2014 Pearson Education, Inc.
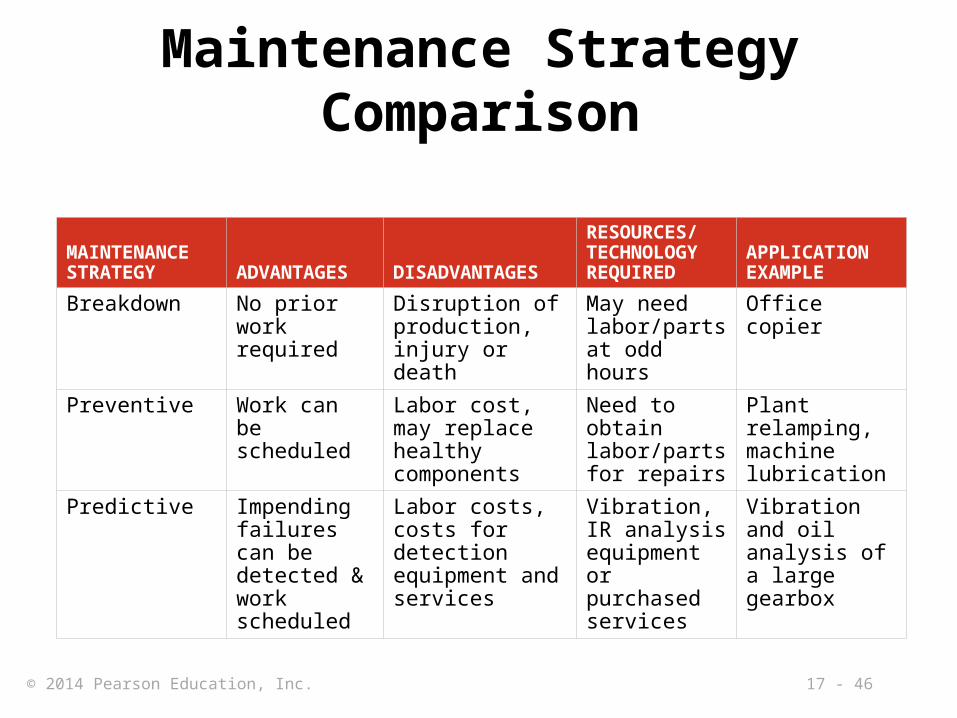
Maintenance Strategy Comparison
MAINTENANCE STRATEGY ADVANTAGES DISADVANTAGES
RESOURCES/ TECHNOLOGY REQUIRED
APPLICATION EXAMPLE
Breakdown No prior work required
Disruption of production, injury or death
May need labor/parts at odd hours
Office copier
Preventive Work can be scheduled
Labor cost, may replace healthy components
Need to obtain labor/parts for repairs
Plant relamping, machine lubrication
Predictive Impending failures can be detected & work scheduled
Labor costs, costs for detection equipment and services
Vibration, IR analysis equipment or purchased services
Vibration and oil analysis of a large gearbox
17 - 47© 2014 Pearson Education, Inc.
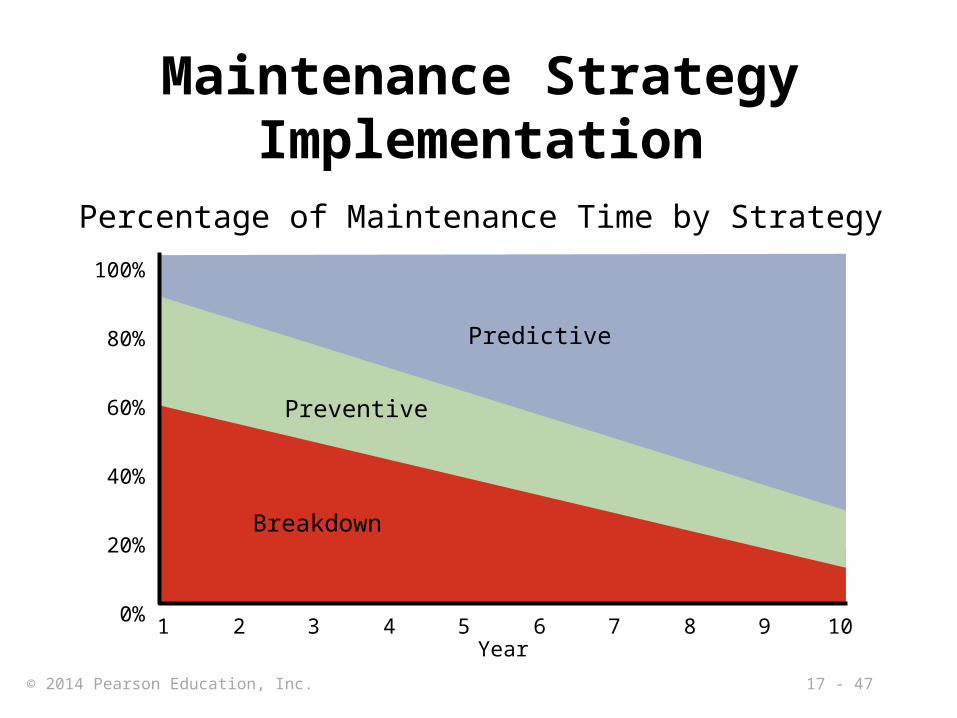
Maintenance Strategy Implementation
Breakdown
Preventive
Predictive
1 2 3 4 5 6 7 8 9 10Year
100%
80%
60%
40%
20%
0%
Percentage of Maintenance Time by Strategy

17 - 48© 2014 Pearson Education, Inc.
Is Predictive Maintenance Cost Effective?
▶ In most industries the average rate of return is 7:1 to 35:1 for each predictive maintenance dollar spent
▶Vibration analysis, IR thermography and oil/water analysis are all economically proven technologies
▶ The real savings is the avoidance of manufacturing downtime – especially crucial in JIT
17 - 49© 2014 Pearson Education, Inc.
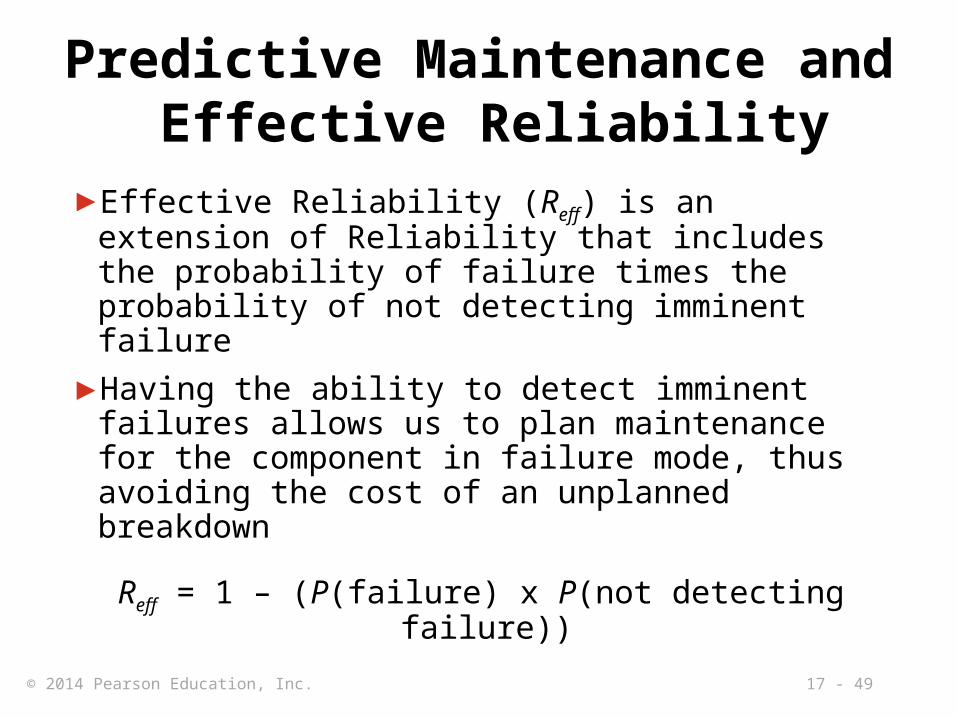
Predictive Maintenance and Effective Reliability
▶Effective Reliability (Reff) is an extension of Reliability that includes the probability of failure times the probability of not detecting imminent failure
▶Having the ability to detect imminent failures allows us to plan maintenance for the component in failure mode, thus avoiding the cost of an unplanned breakdown
Reff = 1 – (P(failure) x P(not detecting failure))

17 - 50© 2014 Pearson Education, Inc.
How Predictive Maintenance Improves Effective Reliability
▶Example: a large gearbox with a reliability of .90 has vibration transducers installed for vibration monitoring. The probability of early detection of a failure is .70. What is the effective reliability of the gearbox?
Reff = 1 – (P(failure) x P(not detecting failure))
Reff = 1 – (.10 x .30) = 1 - .03 = .97
▶Vibration monitoring has increased the effective reliability from .90 to .97!
17 - 51© 2014 Pearson Education, Inc.
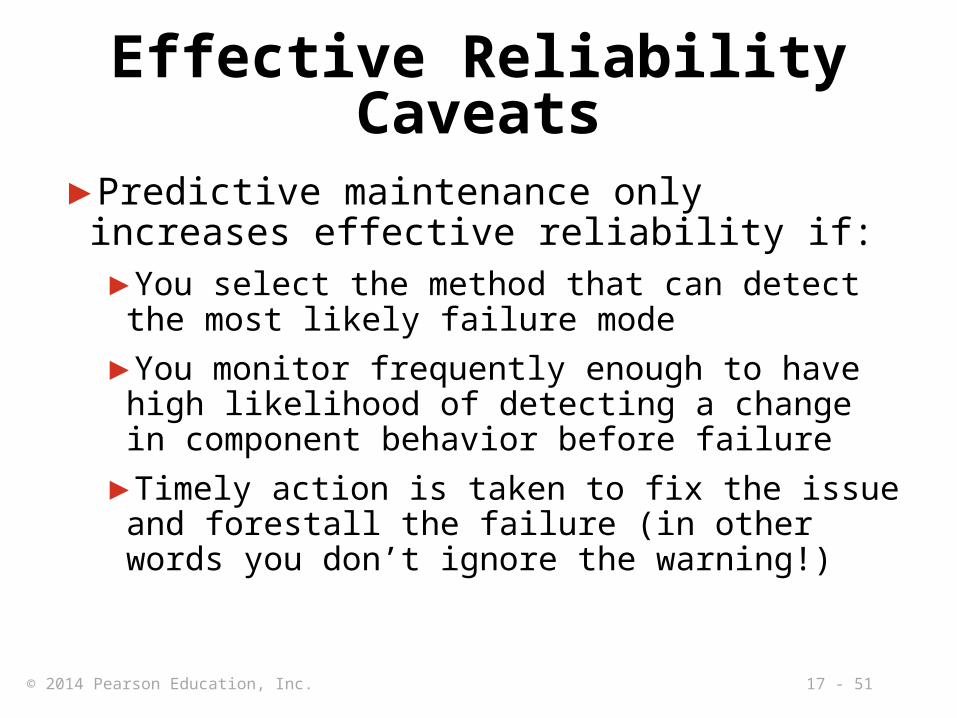
Effective Reliability Caveats
▶Predictive maintenance only increases effective reliability if:▶You select the method that can detect the
most likely failure mode
▶You monitor frequently enough to have high likelihood of detecting a change in component behavior before failure
▶Timely action is taken to fix the issue and forestall the failure (in other words you don’t ignore the warning!)
17 - 52© 2014 Pearson Education, Inc.
Increasing Repair Capabilities
1. Well-trained personnel
2. Adequate resources
3. Proper application of the three maintenance strategies
4. Continual improvement to improve equipment/system reliability
17 - 53© 2014 Pearson Education, Inc.
All rights reserved. No part of this publication may be reproduced, stored in a retrieval system, or transmitted, in any form or by any means, electronic, mechanical, photocopying, recording, or
otherwise, without the prior written permission of the publisher. Printed in the United States of America.
Related Documents


![[Jay Heizer, Barry Render]Operations Management 10e](https://static.cupdf.com/doc/110x72/55cf8e81550346703b92d9f3/jay-heizer-barry-renderoperations-management-10e-56427fb5ecb7b.jpg)