! "# $ $ %&’( )!**! + , $ , $ , -./ , ! 0$$$!$ !$$ 12"-3445/637 + !"#$ %& $’(#!(& !)*+$*,-!,%)* !,! + 8 9 :3, -3;<-:=, -( ;/// -3/ + 8 9($ ( 9$ !.$-/0/ 1 2 :8$<>$>$ SUGI 29 Posters

Welcome message from author
This document is posted to help you gain knowledge. Please leave a comment to let me know what you think about it! Share it to your friends and learn new things together.
Transcript

�
��������
����������� ��� ���������������������������������������������������������������������������������������� ����������������������������������������������������������������������������������������������� �������������
!��������������������������������������
���� ������ ������� ���� �� �������� ���� ���� � ���������� �������� ������ ���� ������ ���� ���� ��������������� ���
��������������������������������"��#��$����������$��������������������%&'(���������
���������
������������)�����������!�*������������ ������������� ��*������!������� �����������������������������������
��������������������������������������������������������������������������������������������������������������
���������������������������������������������������������������������������������������������������� ��������
�������������������������������������������������������������
������������������������� �������������������������� ����������������������������������� �����������
�����������+
, �����������������������������������$
, ��������������������������������$
, ���������������������������������������������������-��./�
, ���������������������������������������������������������������
����������������������������������������������������������� �������������������!����������������
������0��������������������������������������������������������������������������������$�����$������$�!��$
��!��$������$����������������������������������������������������������������������������������������������
������������������������������ �����������������������������
���� �������������������
����������������������������������������������������������������������������1�2 ��"����-3445/637�� ���������
����������������������������������� ������� +
������������ ����������������������
��������� ���������������������
��������� ���������������������
��������� ���������������������
��������� ���������������������
��������� ���������������������
��������� ���������������������
��������� ������������������� �
�������� ������������������� �
���������������������������������!"#$�����%&$�'( ��#!(&!��)*+$*,-!,%)*�!,!
�������������������������������������������������+
�������������������������������������8�9�:��3�,�-�3�;��<�-�:=�,�-�(�;���///�������������-3/
�����+�������������������8����9�������������������������($�������������������(����9����������������������$
�!.$-���/0�/
��������������1��������������2������������������������������������
����������������������������������:���8��$����<�����>����$�>�����������$���
SUGI 29 Posters

�
��������������������3��9��������������������$�������������������=����9������������$������������������������9������������������������
���������������������������������������� ������������3$�=$�������� �������������������������������������������
� �������!���?�����@�
�� 3 �
� ���� � ���� �� /��
�������������!"#$���� 4*+,%)*!#� )-&������(,%&!,$5��!-!&$,$-(
��������� ��������������������� ��������6����
������� ���������������� � �������������� ���
������� ����������������� � ��������������� ���
������� ����������������� � ��������������/ /�/
������� ����������������� � ��������������� ���
������� ����������������� � ��������������� ���
������� ����������������� � ��������������� ���
������� ������������������ � ���������������� �/�
������ ������������������ � ���������������� /��
����������������������������!"#$����-$5%+,$5�6!#4$(�7-)&��(,%&!,%)*�)7��!-!&$,$-(
������������������������������������ ��������������������������.������3�
gopt i ons devi ce=cgmof 97l gsf mode=r epl ace gsf name=gsasf i l e r eset =gl obal ; symbol 1 c=r ed v=none i =j ; symbol 2 v=dot c=bl ue i =none; symbol 3 c=gr een v=none i =j ; t i t l e c=r ed ' Ti me vs. Pl asma Concent r at i on' ; axi s1 l abel = ( angl e=90 c=bl ue ' Concent r at i on( nmol / L/ mg) ' ) ; axi s2 l engt h = 60 pct or der = ( - 1 t o 11 by 1) l abel =( c=bl ue ' Ti me( hr s) ' ) ; pr oc gpl ot dat a = nul l ; pl ot cc* t t =1 ac* t t =2 / nol egend over l ay vaxi s=axi s1 haxi s=axi s2 r un;
������������������������������������������������ %84-$�����!&.#$�4,.4,�)7��#!(&!��)*+$*,-!,%)*
.������3�������������������������������������������������
SUGI 29 Posters

�
�����9�����������3��������
8�������������A2 '1��A��������������������������=���������������A2 '1��9�A���������������������� �����-�������������������<��/�����������������2 '1������������������������������� ��������������
symbol 1 c=r ed v=none i =j wi dt h=20; symbol 2 v=dot c=bl ue i =none wi dt h=16;
axi s1 l abel = ( angl e=90 c=bl ue ' Concent r at i on( nmol / L/ mg) ' ) wi dt h=20; axi s2 l engt h = 60 pct or der = ( - 1 t o 11 by 1) l abel = ( c=bl ue ' Ti me( hr s) ' ) wi dt h = 20 ; r un;
��������������������������������������������� %84-$�����(%*8�:�����,!,$&$*,�7)-�������*;!*+$&$*,
�����9���������� ���
��������������!��� ���������������� �����������������A������������� �������������A������������������������������������!���������#B��.C&���
gopt i ons devi ce=cgmof 97l gsf mode=r epl ace gsf name=gsasf i l e r eset =gl obal f t ext =zapf b ; t i t l e c=r ed h=2. 8 ' Ti me vs. Pl asma Concent r at i on' ;
axi s1 l abel = ( angl e=90 c=bl ue h=2. 3 ' Concent r at i on( nmol / L/ mg) ' ) wi dt h=20 val ue = ( c=bl ack ) ;
axi s2 l engt h = 60 pct or der = ( - 1 t o 11 by 1) l abel = ( c=bl ue h=2. 3 ' Ti me( hr s) ' ) wi dt h=20 val ue = ( c=bl ack ) ; r un;
SUGI 29 Posters

�
��������������������������������������� %84-$�� ��(%*8��)#5� )*,�7)-��!"$#�!*5��%,#$��*;!*+$&$*,
�����9����������:��������������������� �:���� ����������
������������������������!�����������������������������������������������������������������������������2 �������
�������� ��������$� ��� ������� �� ����� ��� ����� ������� !�������� ��� ������ �������� �������� ��� ��� � "��� ��������� ��
��������������������������������������
����������������� ����������������������������������������������� ������� � ���������8�������������������������� ������������������������� ������=+
, %����������������� ����������������������������������������
, '����� ��������������������������������D�������!��$������$������$���������$������������
, )�!���� �������������
, ����������������������������������������
������� ����� �������$��.������E�����5$��������������<�������������!����� �������������������
�������������������������� %84-$�� ��)&"%*%*8�,;$-��..#%+!,%)*��)7,<!-$�7)-��**),!,%)*��=!&.#$����
SUGI 29 Posters

�
�������������������������������� %84-$�� ��)&"%*%*8�,;$-��..#%+!,%)*��)7,<!-$�7)-��**),!,%)*��=!&.#$����
�����9����������������>��������
���������� �� ���� ��� � ���� ���� �� ������� ���� �<�� ����� !�� �('��� ��������� ���� -C�1#�� 9� - '&� �� �(� !�
'&�#�F�B//�������'�������������C�1#���!�����������������$����������� ���� ���������������������������������<�
����������������������������������������������������������������������������.������G�� ������������������
��������C�1#�����������
����������������������������������������������� %84-$�� �4,.4,�7-)&�,;$�$7!4#,�����(,!,$&$*,
SUGI 29 Posters

�
B��6?7������������������������������������<��������+�3/��������������<���������������������������!���������������
3H$�?/���!�����������������������!��������=����=$�����@/������������������������������ �����3$�?$�5���3H��������� ���
������B�A������������������������������<�������
8����������������������������������C�1#������������+
����������������������������������������-�����9��H���I��<�����!��I��������/�
'��������������������������!���������$����������������������������
�����9�������������6��������� ����������������������� ���������������
���� �������� ���� ���� ��������� ������� ���������� �� ���������� ��������� ������� �� ���������� ������ ���� �������
���������������������$�������������������������������������������������� �����<�������������C%��%����������
������������������������������:������������������������������������������������������������!�����!��������
��������������������������1���������!���3�����������������<������
pr oc nl i n dat a=ser um maxi t er =30 conver ge=. 00001 nopr i nt ; par ms p1=0. 13 k=0. 3 c=15; bound 0 < p1 <= 1, 0 < k <= 1, 10 < c; model ac = - p1 * ( 1 - exp( - k * ( t t - c) ) ) ; out put out =p2 par ms=p1 k c; r un;
dat a p2;
SUGI 29 Posters

�
set p2; i f _n_= 1; keep p1 k c; r un;
dat a p2; set p2; cal l symput ( ' p1' , compr ess( r ound( p1, . 001) ) ) ; cal l symput ( ' k ' , compr ess( r ound( k, . 001) ) ) ; cal l symput ( ' c ' , compr ess( r ound( c, . 001) ) ) ; r un;
gopt i ons devi ce=cgmof 97l gsf mode=r epl ace gsf name=gsasf i l e r eset =gl obal f t ext =zapf b ; symbol 1 c=r ed v=none i =j wi dt h=20; symbol 3 c=gr een v=none i =j ; symbol 2 v=dot c=bl ue i =none wi dt h=16;
t i t l e c=r ed h=3 ' Ti me vs. Pl asma Concent r at i on' ;
axi s1 l abel = ( angl e=90 c=bl ue h=2. 3 ' Concent r at i on( nmol / L/ mg) ' ) wi dt h=20 val ue = ( c=bl ack ) ; f oot not e1 h=2 c=gr een " Cur ve Expr essi on: Conc. = - P1* ( 1- exp( - k* ( Ti me- c) ) ) " ; f oot not e2 h=2 c=gr een " Est i mat ed Par amet er s: p1= &p1 k= &k c= &c" ; axi s2 l engt h = 60 pct or der = ( - 1 t o 11 by 1) l abel = ( c=bl ue h=2. 6 ' Ti me( hr s) ' ) wi dt h=20 val ue = ( c=bl ack ) ; pr oc gpl ot dat a = nul l ; pl ot cc* t t =1 ac* t t =2 / nol egend over l ay vaxi s=axi s1 haxi s=axi s2; r un;
��������� %84-$�� ��=!&.#$�)7��(%*8��!+-)�6!-%!"#$(�7)-��!((%*8��,!,%(,%+(�,)� )),*),$��,!,$&$*,(
�����9������������������6��������� �������������������� ���������������
SUGI 29 Posters

�
��������C������1��������������-C1�/���� ������������������������������������������������������ �����������
�������������������<�������������C1����������������!������������C1����������������������������C)
B'.#�#��������������������������������������������������
ods l i s t i ng c l ose; ods out put Quar t i l es=quar Pr oduct Li mi t Est i mat es =s_est Censor edSummar y=censor ; pr oc l i f et est dat a=f i nal ; t i me &var 1 * &var 2( 0) ; st r at a t r t gr pt ; r un; ods out put c l ose; ods l i s t i ng;
��C)���'&������������������� ������������������ ������!���
���������������������������������������������������!"#$�� �'$-!##��4-'%'!#��$*()-$5���4&&!-?��,!,%(,%+(
������� ��������������������������������������������������!���
cal l symput ( ' gr oupf ' | | compr ess( _n_) , t r t gr pt ) ; cal l symput ( ' ng' | | compr ess( _n_) , compr ess( put ( t ot al , 8. ) ) ) ; cal l symput ( ' ngevt ' | | compr ess( _n_) , compr ess( put ( f ai l ed, 8. ) ) ) ; cal l symput ( ' ngecn' | | compr ess( _n_) , compr ess( put ( censor ed, 8. ) ) ) ; cal l symput ( ' pgcen' | | compr ess( _n_) , compr ess( put ( pct cens, 8. 1) ) ) ; r un;
���������������������������!���������������������������������������
f oot not e1 h=0. 7 f =swi ssbu ' ODS Censor ed Summar y ' ; f oot not e2 h=0. 7 f =swi ssbu ' Gr oup t ot al f ai l ed censor edpct cens' ; f oot not e3 h=0. 7 f =swi ssbu " &gr oupf 1 &ng1 &ngevt 1 &ngecn1&pgcen1" ; f oot not e4 h=0. 7 f =swi ssbu " &gr oupf 2 &ng2 &ngevt 2 &ngecn2&pgcen2" ; f oot not e5 h=0. 7 f =swi ssbu " &gr oupf 3 &ng3 &ngevt 3 &ngecn3&pgcen3" ;
.������J�� �������������������������������������������������������������
��� %84-$�� ��=!&.#$�)7��!((%*8����$*()-$5��4&&!-?��,!,%(,%+(�,)� )),*),$��,!,$&$*,(
SUGI 29 Posters

�����9������������� �������������
����������!������������������������������������������������������������������������������� ������������������
�������.������4�
gopt i ons devi ce=cgmof 97l gsf mode=r epl ace gsf name=gsasf i l e r eset =gl obal f t ext =zapf b; symbol 1 v=dot c=r ed i =none wi dt h=16; symbol 2 v=dot c=bl ue i =none wi dt h=16; symbol 3 c=bl ack v=none i =j wi dt h=20; symbol 4 c=bl ue v=none i =j wi dt h=20; symbol 5 c=r ed v=none i =j wi dt h=20; t i t l e c=r ed h=2. 7 ' FSH Compar i son: Basel i ne vs. Week 4' ; axi s1 l abel = ( angl e=90 c=bl ue h=2. 3 ' Week 4' ) wi dt h=20 val ue = ( c=bl ack ) ; axi s2 l engt h = 60 pct l abel = ( c=bl ue h=2. 6 ' Basel i ne' ) wi dt h=20 val ue= ( c=bl ack ) ; pr oc gpl ot dat a = f ad; pl ot week4a* basea=1 week4d* based=2 i * i i =3 aa* i =4 dd* i =5 / nol egend over l ay vaxi s=axi s1 haxi s=axi s2; r un;
������������������������������������������������ %84-$�/ ��=!&.#$�)7��(%*8��)#)-(�7)-�!,!��-)4.%*8
�����9��������������>�������������
�����('�������������� ����������������������������������<������������������������������ �����<��������
!��� ����� ���� ������ �<�� ����������� ��� ������ ���������� �� ����� ������ ���� ��� ���� ������� ��� ��������� �('�
�������������������������������������<�������������
gopt i ons devi ce=cgmof 97l gsf mode=r epl ace gsf name=gsasf i l e r eset =gl obal f t ext =zapf b ; symbol 1 v=dot c=r ed i =none wi dt h=16; symbol 2 v=dot c=bl ue i =none wi dt h=16; symbol 3 c=bl ack v=none i =j wi dt h=20; t i t l e c=r ed h=2. 7 ' FSH Compar i son: Basel i ne vs. Week 4' ; axi s1 l abel =( angl e=90 c=bl ue h=2. 3 ' Week 4' ) wi dt h=20 or der =( 0 t o 140 by 10) val ue=( c=bl ack ) ; axi s2 l abel = none or der = ( 0 t o 140 by 10) val ue = ( c=bl ack ) ; axi s3 l engt h= 60 pct l abel =( c=bl ue h=2. 6 ' Basel i ne' ) wi dt h=20 or der = ( 0 t o 140 by 10) val ue= ( c=bl ack) ; pr oc gpl ot dat a = f ad; pl ot week4a* basea=1 week4d* based=2 i * i i =3 / nol egend over l ay vaxi s=axi s1 haxi s=axi s3; pl ot 2 week4a* basea=1 week4d* based=2 i * i i =3 / nol egend over l ay vaxi s=axi s2 haxi s=axi s3; r un;
SUGI 29 Posters
�
������������������������������������������������ %84-$��� ��=!&.#$�)7��55%*8��%8;,��=%(��..$!-!*+$
����/9������������� �����6����������������6��������������
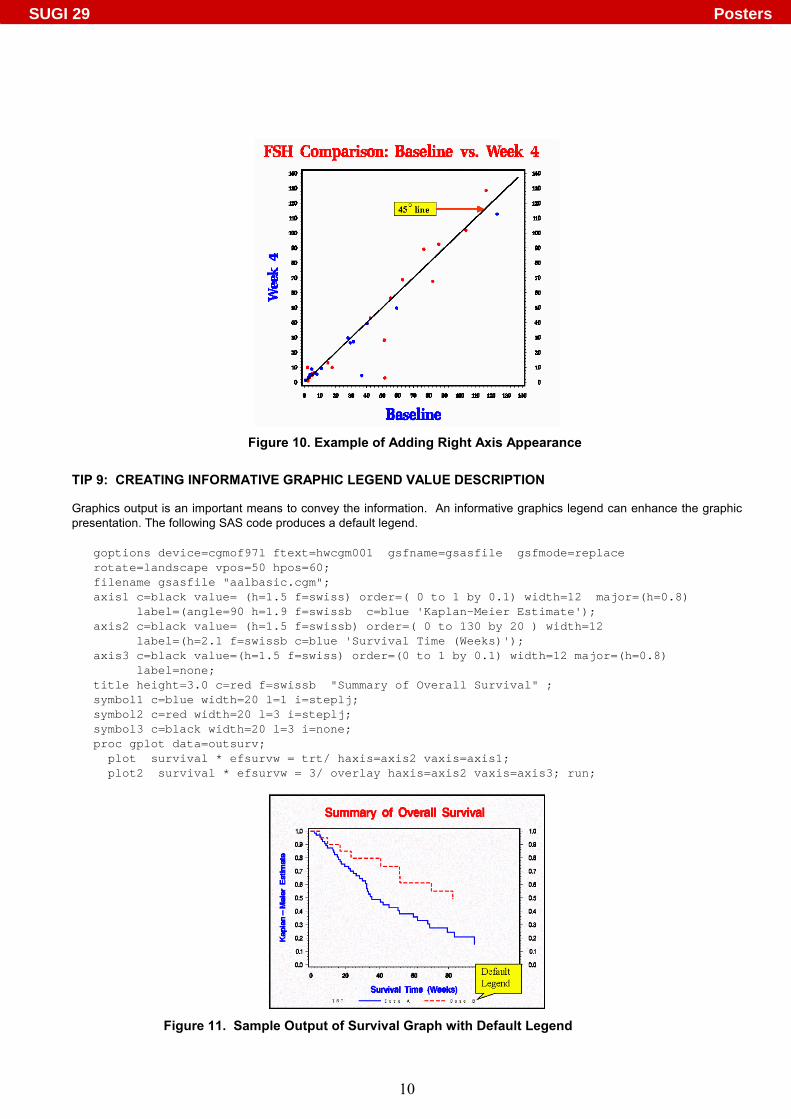
�������������������������������������������������������������������������������������������������������������
������������������� ������������������������������������
gopt i ons devi ce=cgmof 97l f t ext =hwcgm001 gsf name=gsasf i l e gsf mode=r epl ace r ot at e=l andscape vpos=50 hpos=60; f i l ename gsasf i l e " aal basi c. cgm" ; axi s1 c=bl ack val ue= ( h=1. 5 f =swi ss) or der =( 0 t o 1 by 0. 1) wi dt h=12 maj or =( h=0. 8) l abel =( angl e=90 h=1. 9 f =swi ssb c=bl ue ' Kapl an- Mei er Est i mat e' ) ; axi s2 c=bl ack val ue= ( h=1. 5 f =swi ssb) or der =( 0 t o 130 by 20 ) wi dt h=12 l abel =( h=2. 1 f =swi ssb c=bl ue ' Sur vi val Ti me ( Weeks) ' ) ; axi s3 c=bl ack val ue=( h=1. 5 f =swi ss) or der =( 0 t o 1 by 0. 1) wi dt h=12 maj or =( h=0. 8) l abel =none; t i t l e hei ght =3. 0 c=r ed f =swi ssb " Summar y of Over al l Sur vi val " ; symbol 1 c=bl ue wi dt h=20 l =1 i =st epl j ; symbol 2 c=r ed wi dt h=20 l =3 i =st epl j ; symbol 3 c=bl ack wi dt h=20 l =3 i =none; pr oc gpl ot dat a=out sur v; pl ot sur vi val * ef sur vw = t r t / haxi s=axi s2 vaxi s=axi s1; pl ot 2 sur vi val * ef sur vw = 3/ over l ay haxi s=axi s2 vaxi s=axi s3; r un;
������������������������� %84-$��� ���!&.#$�4,.4,�)7��4-'%'!#��-!.;�<%,;�$7!4#,��$8$*5
SUGI 29 Posters

��
.������33�������������������������������������B'.#�#���C%��%�F������������������������������ ���������������
���������������!������!0����������������������������'����� ���������������������������������������������-&9<</
�������������������������
������� ��������������� ����������������+
l egend1 posi t i on=( l ef t bot t om i nsi de) f r ame acr oss=1 mode=pr ot ect l abel =none val ue=( h=1. 3 f =swi ssb) ;pr oc gpl ot dat a=out sur v;pl ot sur vi val * ef sur vw = t r t / haxi s=axi s2 vaxi s=axi s1 l egend=l egend1 ; pl ot 2 sur vi val * ef sur vw = 3 / over l ay haxi s=axi s2 vaxi s=axi s3; r un;
������ ���� ������ ������� ����� ��������+� ����������$� �����$� ���� ��<��� ���� ��� ���� ��!��� � � ���� ������� ����������!�������������
�!,$8)-? .,%)*�6!-%!"#$ �?.$ �,,-%"4,$(
���������� ��� ��� ���!����������
�!��= ���� !��=����
�!���� ���� ���������
��� ���� ��� ����
� � ��� ���!������
�����
� ���� ��� ����=��������
���� ��<�� !��- ����$������/K����L�M
����-������/K����L�M
��!�-�����$������/K����L
����� ��� ���� �������M��������M�����
���� ��<�� -K<LK$�L/K����L�M
K<�K����LLK$��K����LL/
����� ��<�� -K<LK$�L/K����L�M
K<�K����LLK$��K����LL/
����� ���� -K!����M��������M���L
K�����M��������M�������L
K������M������L/
��<� ��!�� ���� -��<����������-//�M
���
���� ��� ���������
����� ���� -��<����������-//�M
���
�����������������������������������������������������������!"#$�� ��$8$*5�.,%)*(
.������3?�� ����������B#�#&1����������������������������������������
SUGI 29 Posters

��
����������������������������������� %84-$��� ��(%*8��������,!,$&$*,�,)��)*,-)#�,;$��$8$*5
������6��������������������������
����������������������������������<����-&9<</�������������������������������.������3@���������������������-&9<</���������������������������������������������� ���������� ����������!���������������������� �������������������������
�������������������� %84-$��� �%(.#!?%*8���@>>��%*��$8$*5�!(��$8$*5�6!#4$�$(+-%.,%)*��*;!*+$&$*,
SUGI 29 Posters

��
������9�������������������������������2�����������������A��������������������������A����������
��������������6�������
���������������C)��% ��8���������������!������!0������������������������������������������������������
�������C)��% ��8�������������������������!����������������������8����������������� ������!���������������-&9<</
��������������!���������
dat a f i nal ; set f i nal ; count =1; r un; pr oc sor t ; by t r t gr pt ; pr oc summar y dat a=f i nal ; by t r t gr pt ; var count ; out put out =al l b sum=al l b; dat a f i nal ; mer ge f i nal al l b; by t r t gr pt ; l engt h t r t $15. ; t r t =l ef t ( t r i m( t r t gr pt ) ) | | ' ( N=' | | compr ess( al l b) | | ' ) ' ;
������9��������������A�������������������������6�������
�������������������!����������������� ����������!0����������������������������������=� ���8�����������������
�!0������������������������������!���
dat a f i nal ; set f i nal ; l engt h t r t $15. ; t r t = t r t gr pt ; i f t r t = ' Dose A' t hen t r t = ' Dose A ( N=67) ' ; el se i f t r t = ' Dose B' t hen t r t = ' Dose B ( N=20) ' ;
������9�����������������6����������������������A����������������������������� �����6����
���������
�����@������������������������������ ����������������������������������������������������!���������
�!0��������������������������������������+
���������+��������������������
����������+���������������������!����������������������
��������+��������������������
���������+�������������������!�����������������������������!:�����
%macr o gpcount ( dsi n=, var i n=, dsout =, var out =) ; dat a _dsi n; set &dsi n; count = 1; keep &var i n count ; pr oc sor t dat a= _dsi n; by &var i n;
pr oc summar y dat a = _dsi n; c l ass &var i n; var count ; out put out = &dsout sum = &var out ; r un;
dat a &dsout ; set &dsout ;
SUGI 29 Posters

��
i f _t ype_ = 0 t hen cal l symput ( ' nal l ' , put ( &var out , 4. ) ) ; keep &var i n &var out _t ype_;
%gl obal nal l ;
dat a &dsout ; set &dsout ; i f _t ype_ = 1; dr op _t ype_;
dat a t 1; set &dsout ; keep &var out ;
dat a &dsout ; set &dsout nobs = _nobs; cal l symput ( ' _nobs' , put ( _nobs, 3. ) ) ;
%macr o t p; pr oc t r anspose dat a=t 1 out = t 2; dat a t 2; set t 2; %do i = 1 %t o &_nobs; cal l symput ( " n&i " , put ( col &i , 4. ) ) ; %end; %mend t p; %t p; %mend gpcount ;
�������<�����������������$��������������������������������!��+
3/�I�����+��������������!0���$
?/�I�3$�I�?$�N $�I�=�����������������!:����$� �����=����������!������!:������������������������!���I�3$�I�?
����!����������������������������������
'���������������������������������!��� �������A�������������������������������!����������I�3$�I�?$N �$�I�=�����
!�������������������������
pr oc f or mat ; val ue $t r t ' Dose A' = " Dose A ( N = &n1) " ' Dose B' = " Dose B ( N = &n2) " ; dat a f i nal ;
set f i nal ; l engt h t r t $15. ; t r t = put ( t r t gr pt , $t r t . ) ;
������9��������������A���������������� �����6��������������
�������������������������!����������������� ����������!0����������������������������������=� ���8������������������!0������������������������������������
pr oc f or mat ; val ue $t r t ' Dose A' = ' Dose A ( N = 67) ' ' Dose B' = ' Dose B ( N = 20) ' ; dat a f i nal ; set f i nal ; l engt h t r t $15. ; t r t = put ( t r t gr pt , $t r t . ) ;
������9��6����2�������������� ���� �����������������������
SUGI 29 Posters

��
'�� ��� ���$� ��� ����� ������ �� �����!����� ������ ����� ���� �������� ���� ��C)� ��BC�� ���� ������ ���� ��C)
�)����������������������'���������������������=����������������������������������������������������8��������
������#�B�8�����������������������������������������������������������)������������������������� ���$������
������� ������$������������������� ����������� ������������������������.������33�
gopt i ons devi ce=cgmof 97l gsf mode=r epl ace gsf name=gsasf i l e r eset =gl obal f t ext =zapf b; pat t er n1 c=gr een ; pat t er n2 c=r ed ; pat t er n3 c=br own ; pat t er n4 c=or ange ; pat t er n5 c=bl ue ; pat t er n6 c=pi nk ; pat t er n7 c=yel l ow ; t i t l e1 c=r ed h=2. 2 ' Di st r i but i on of Mal e Test ost er one' ; axi s1 l abel = ( angl e=90 c=bl ue h=2. 3 ' Number of Sampl e' ) wi dt h=20 val ue= ( c=bl ack ) ; axi s2 l engt h= 60 pct l abel = ( c=bl ue h=2. 6 ' Test ost er one( NG/ DL) ' ) wi dt h=20 val ue= ( c=bl ack ) ; pr oc gchar t dat a = p1; vbar cat / di scr et e r axi s = axi s1 cout l i ne=bl ack maxi s = axi s2 sumvar = scount space=3 pat t er ni d=mi dpoi nt ; r un;
������������������������������������������������������ �����.������3?���������� +
symbol 1 c=bl ack i =spl i nes wi dt h=55; pr oc gpl ot dat a=p2; pl ot scount * cat =1/ noaxi s nof r ame; r un;
�������������������������������������������������������������������� %84-$��� �4,.4,�)7�������
SUGI 29 Posters

��
��������������������������������������������������������� %84-$��� ��!&.#$�%(,-%"4,%)*��#),
.������35�������������������������8�������������!���.������3E�����35������������������.������3G�
���������������������������������������������������������������������� %84-$��� �'$-#!%5��-!.;%+(
���������
�������� ������ �� ��� ��������� ����� �� ������ ���� ����������� ���� ������������ �� ������� �� ������ ���� �������
���������������!�����������!��������������������������������<���� ���������������������� ����
SUGI 29 Posters

��
������������������������ ������������������������������������
B %��A2 '1��A��������������������������=��������������
B %��!��������������������<��
B )�!���� ���������������������� ����
B %����������<�������
B %��C%��%����������������������������������������������������!��������������������!����
�������������������������
B %�� C1�� ������ ������� ���� ������� ���� �������� �� ����� �����!��� ���� ���� ����� �����!��� �
�������������������������
B %����������������������
B �����������<������������������������������������
B )������������������������������������������������
B C������������������������������������������
�� �������
637�"����$�1�2 ���+������������ ���� �������������������� ����������O�%�����������C=������)�����������������3445��K�����+��35P�3E?�P?�3E@������=!��)�HE�)�HEH@����L
6?7� B�$� 1�-?HH@/+� *������ �� 1�������� �<�� ������ ��� ���� ������ Q� �� ������� ���� ��� ��������� C�����D���� �������*$������������������������������� �� ��������������������������������$��������%��?HH@$�3?@:3?5
6@7�����'��������'���-344@/+������ ��!�����"��#�$%����&�'������(&�������$��������)����&)$�����'��������'���
6E7�8��$�����-?HH@/+�*������#�������8��������������������������C�����*$� ����������� ��� ��������������� ��� � � ��������������������������������$��������%��?HH@$�@E@:@EJ
657�R��$�S-?HH@/+�*���#���������������������������*$��������������������������������� �� �������������������������������$��������%��?HH@$�EH@:EHJ
�������3��������
��������������������������=�������'��������'���$���������%��������������������
����������� �����������������������������=��� �������)�������$���������%��������������������
�����������%��������������
��������������� ������
���:���8��$�����1�-G3H/PJP:@J5G-2 /#:����+���:��T���:3U �=���
SUGI 29 Posters
Related Documents