Investor Update January 2015

Welcome message from author
This document is posted to help you gain knowledge. Please leave a comment to let me know what you think about it! Share it to your friends and learn new things together.
Transcript

InvestorUpdateJanuary 2015
Property of Continental Resources, Inc. Reproduction and distribution only with written permission2
Forward‐Looking InformationCautionary Statement for the Purpose of the “Safe Harbor” Provisions of the Private Securities Litigation Reform Act of 1995
This presentation includes “forward‐looking statements” within the meaning of Section 27A of the Securities Act of 1933 and Section 21E of the Securities Exchange Act of 1934. All statements included in this presentation other than statements of historical fact, including, but not limited to, statements or information concerning the Company’s future operations, performance, financial condition, production and reserves, schedules, plans, timing of development, returns, budgets, costs, business strategy, objectives, and cash flow, are forward‐looking statements. When used in this presentation, the words “could,” “may,” “believe,” “anticipate,” “intend,” “estimate,” “expect,” “project,” “budget,” “plan,” “continue,” “potential,” “guidance,” “strategy,” and similar expressions are intended to identify forward‐looking statements, although not all forward‐looking statements contain such identifying words. Forward‐looking statements are based on the Company’s current expectations and assumptions about future events and currently available information as to the outcome and timing of future events. Although the Company believes the expectations reflected in the forward‐looking statements are reasonable and based on reasonable assumptions, no assurance can be given that such expectations will be correct or achieved or that the assumptions are accurate. When considering forward‐looking statements, readers should keep in mind the risk factors and other cautionary statements described under Part I, Item 1A. Risk Factors included in the Company’s Annual Report on Form 10‐K for the year ended December 31, 2013, registration statements and other reports filed from time to time with the Securities and Exchange Commission (“SEC”), and other announcements the Company makes from time to time.
The Company cautions readers these forward‐looking statements are subject to all of the risks and uncertainties, most of which are difficult to predict and many of which are beyond the Company’s control, incident to the exploration for, and development, production, and sale of, crude oil and natural gas. These risks include, but are not limited to, commodity price volatility, inflation, lack of availability of drilling, completion and production equipment and services and transportation infrastructure, environmental risks, drilling and other operating risks, lack of availability and security of computer‐based systems, regulatory changes, the uncertainty inherent in estimating crude oil and natural gas reserves and in projecting future rates of production, cash flows and access to capital, the timing of development expenditures, and the other risks described under Part I, Item 1A. Risk Factors in the Company’s Annual Report on Form 10‐K for the year ended December 31, 2013, registration statements and other reports filed from time to time with the SEC, and other announcements the Company makes from time to time.
Readers are cautioned not to place undue reliance on forward‐looking statements, which speak only as of the date hereof. Should one or more of the risks or uncertainties described in this presentation occur, or should underlying assumptions prove incorrect, the Company’s actual results and plans could differ materially from those expressed in any forward‐looking statements. All forward‐looking statements are expressly qualified in their entirety by this cautionary statement. This cautionary statement should also be considered in connection with any subsequent written or oral forward‐looking statements that the Company, or persons acting on its behalf, may make.
Except as otherwise required by applicable law, the Company disclaims any duty to update any forward‐looking statements to reflect events or circumstances after the date of this presentation.
Property of Continental Resources, Inc. Reproduction and distribution only with written permission
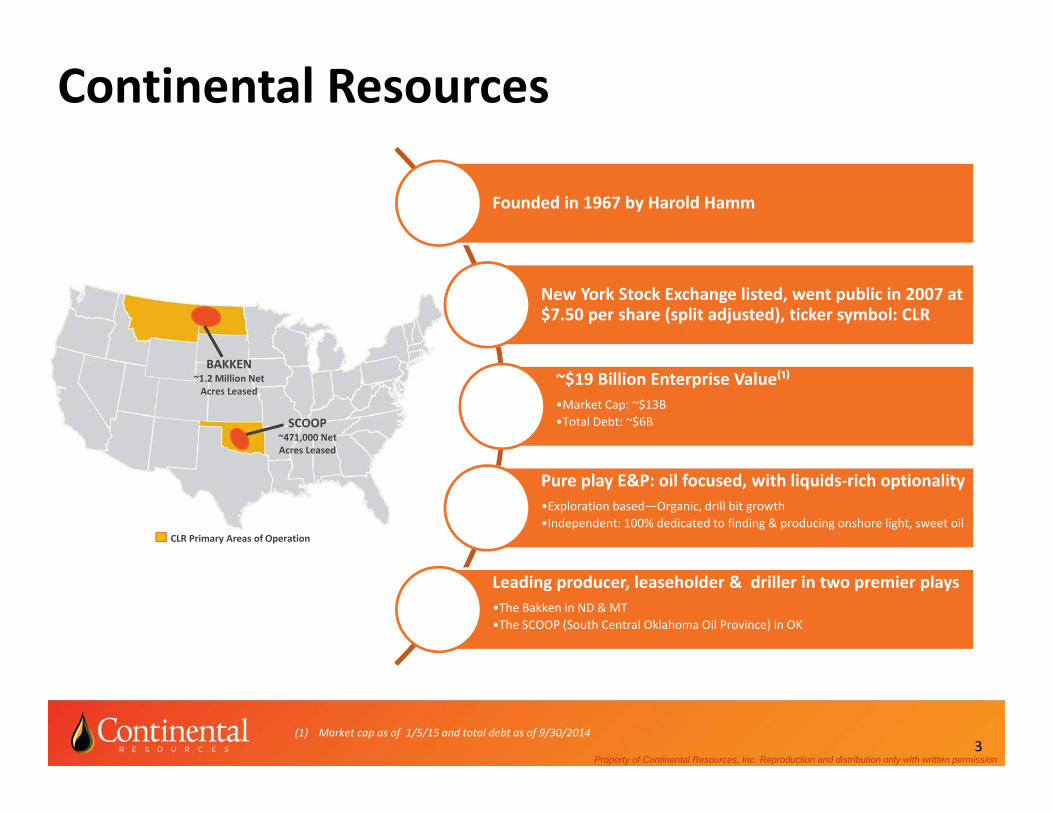
BAKKEN~1.2 Million Net Acres Leased
SCOOP~471,000 Net Acres Leased
CLR Primary Areas of Operation
Continental Resources
Founded in 1967 by Harold Hamm
New York Stock Exchange listed, went public in 2007 at $7.50 per share (split adjusted), ticker symbol: CLR
~$19 Billion Enterprise Value⁽¹⁾•Market Cap: ~$13B •Total Debt: ~$6B
Pure play E&P: oil focused, with liquids‐rich optionality•Exploration based—Organic, drill bit growth•Independent: 100% dedicated to finding & producing onshore light, sweet oil
Leading producer, leaseholder & driller in two premier plays•The Bakken in ND & MT•The SCOOP (South Central Oklahoma Oil Province) in OK
3(1) Market cap as of 1/5/15 and total debt as of 9/30/2014
Property of Continental Resources, Inc. Reproduction and distribution only with written permission
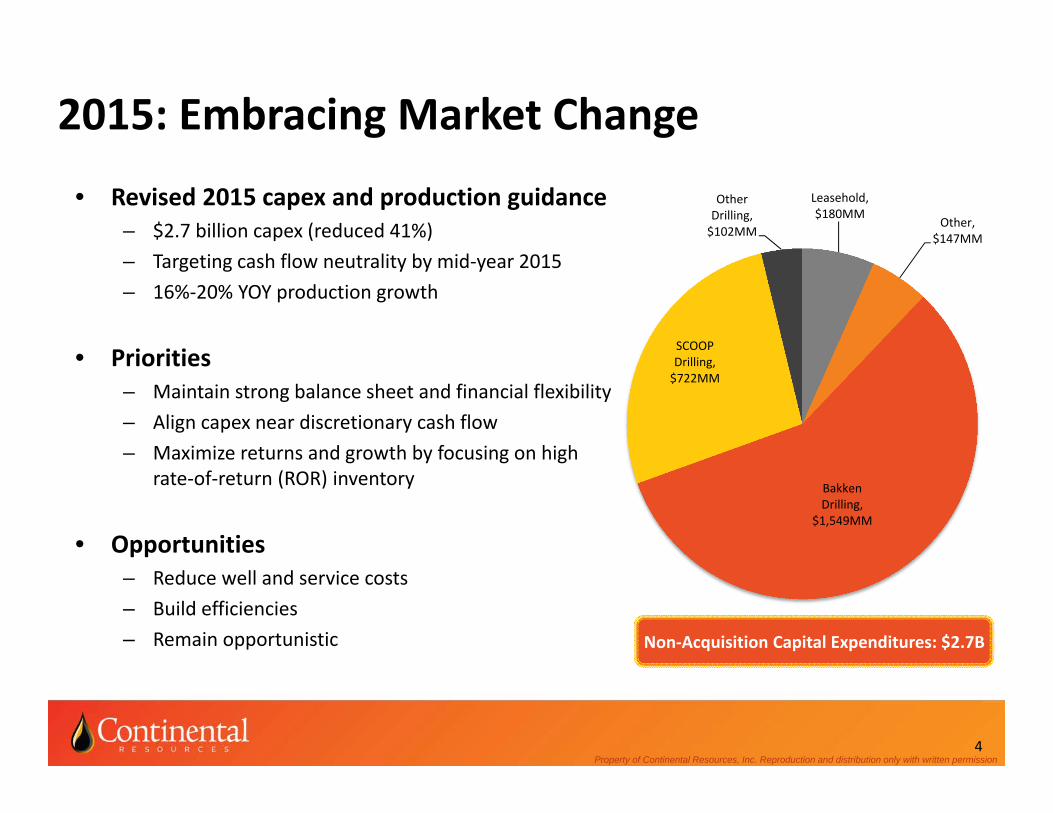
2015: Embracing Market Change
• Revised 2015 capex and production guidance– $2.7 billion capex (reduced 41%)– Targeting cash flow neutrality by mid‐year 2015– 16%‐20% YOY production growth
• Priorities– Maintain strong balance sheet and financial flexibility– Align capex near discretionary cash flow– Maximize returns and growth by focusing on high
rate‐of‐return (ROR) inventory
• Opportunities– Reduce well and service costs – Build efficiencies – Remain opportunistic
4
Leasehold, $180MM
Other, $147MM
Bakken Drilling,
$1,549MM
SCOOP Drilling, $722MM
Other Drilling, $102MM
Non‐Acquisition Capital Expenditures: $2.7B

Property of Continental Resources, Inc. Reproduction and distribution only with written permission
Utilizing Strengths and Flexibility• Asset Strength
– High quality, high ROR assets in Bakken and SCOOP– 2015 drilling program targeting 35% ROR, and 45% ROR at 15% reduced completed well costs
(CWC)*
• Inventory Flexibility– Deep and diverse inventory provides optionality in oil and liquids‐rich plays– Flexibility to deliver high ROR in changing commodity price environments– 2015 drilling program focusing on high ROR inventory
• Operational Flexibility– Reducing operated rig count by ~40% (50 rigs at YE14 to average 31 rigs in 2015)– Reducing non‐drilling capex by ~40% (land, seismic and facilities)
• Financial Strength– Ample liquidity with $1.7 billion available on revolver as of 9/30/14– No near‐term debt maturities (earliest is $200 million in 2020)– Investment grade credit rating
• Organizational Strength– Strong track record of execution and leadership in various commodity environments– Lean, low‐cost, high‐margin operator
5*Based on $60 oil and $3.50 gas

Property of Continental Resources, Inc. Reproduction and distribution only with written permission
• Leading positions in both the Bakken and SCOOP
– Largest leasehold owner• Bakken 1.2 million net acres• SCOOP 471,000 net acres• Captured “core of the basin” leasehold as an
early entrant and first mover in both plays
• Decades of repeatable, low risk inventory to fuel future growth
– Bakken• 4.1 Billion Boe net unrisked resource potential
(11,817 net unrisked potential locations)• 10 years of inventory averaging 775 MBoe/well*• 25 years of inventory averaging 600 MBoe/well*
– SCOOP• 3.6 Billion Boe net unrisked resource potential
(~4,750 net unrisked potential locations)
6
Two World‐Class Platforms for Growth:
Production Growth (Boe per Day)
* Based on current run rate of 188 net wells /year
37,32443,318
61,865
97,583
135,919
182,335
0
20,000
40,000
60,000
80,000
100,000
120,000
140,000
160,000
180,000
200,000
2009 2010 2011 2012 2013 3Q 2014
Boe/Day
Legacy Bakken SCOOP

Property of Continental Resources, Inc. Reproduction and distribution only with written permission7
High Quality Assets Provide Optionality
Area EUR, MBoe Lateral Length, ftBakken Oil 800 9,800Springer Oil 940 4,500Woodford Condensate 1,725 7,500Woodford Oil 650 7,500NW Cana Gas 1,525 7,500
0%
20%
40%
60%
80%
100%
120%
140%
$40 $45 $50 $55 $60 $65 $70 $75 $80 $85 $90
ROR
Oil Price, $/BBL
ROR vs. Oil Price: Current & Expected Lower CWC ComparisonBakken Oil Bakken Oil 15% CWC ReductionNW Cana Gas with Carry NW Cana Gas With Carry 15% CWC ReductionSCOOP Woodford Condensate SCOOP Woodford Condensate 15% CWC ReductionSpringer Oil Springer Oil 15% CWC ReductionSCOOP Woodford Oil SCOOP Woodford Oil 15% CWC Reduction
Gas Price = $3.50
Property of Continental Resources, Inc. Reproduction and distribution only with written permission8
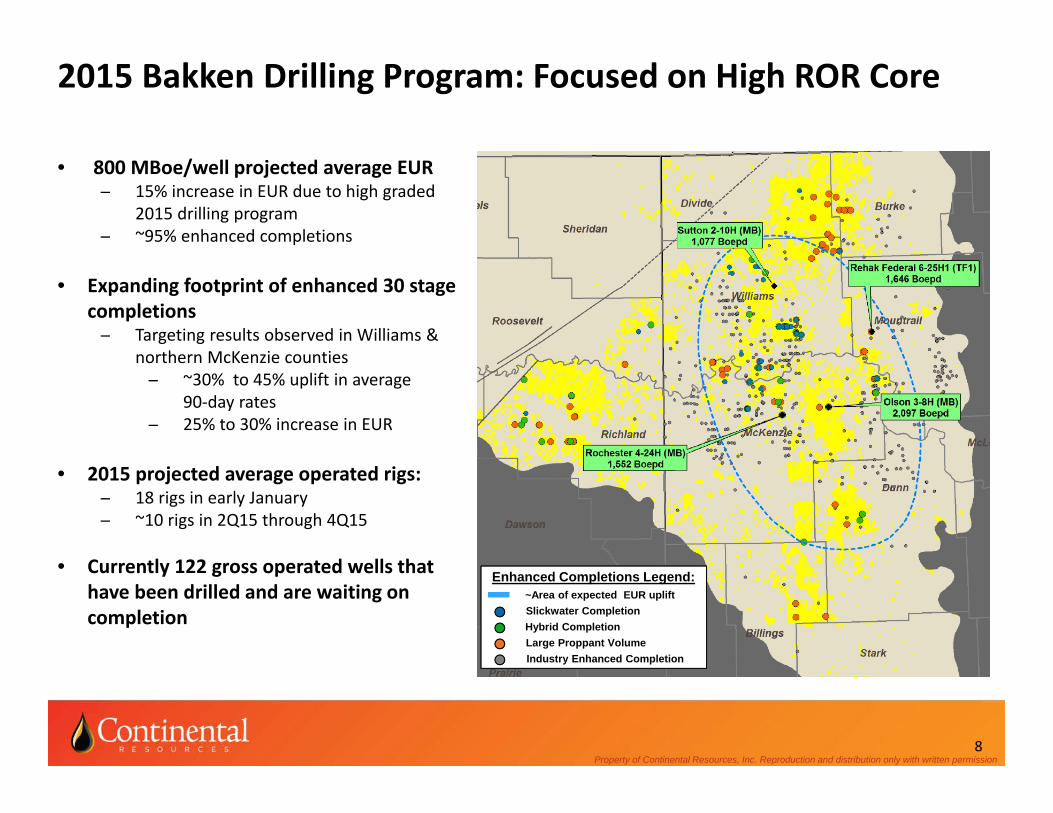
2015 Bakken Drilling Program: Focused on High ROR Core
• 800 MBoe/well projected average EUR 15% increase in EUR due to high graded
2015 drilling program ~95% enhanced completions
• Expanding footprint of enhanced 30 stage completions Targeting results observed in Williams &
northern McKenzie counties ~30% to 45% uplift in average
90‐day rates 25% to 30% increase in EUR
• 2015 projected average operated rigs: 18 rigs in early January ~10 rigs in 2Q15 through 4Q15
• Currently 122 gross operated wells that have been drilled and are waiting on completion
Enhanced Completions Legend:~Area of expected EUR upliftSlickwater CompletionHybrid CompletionLarge Proppant VolumeIndustry Enhanced Completion
Property of Continental Resources, Inc. Reproduction and distribution only with written permission9
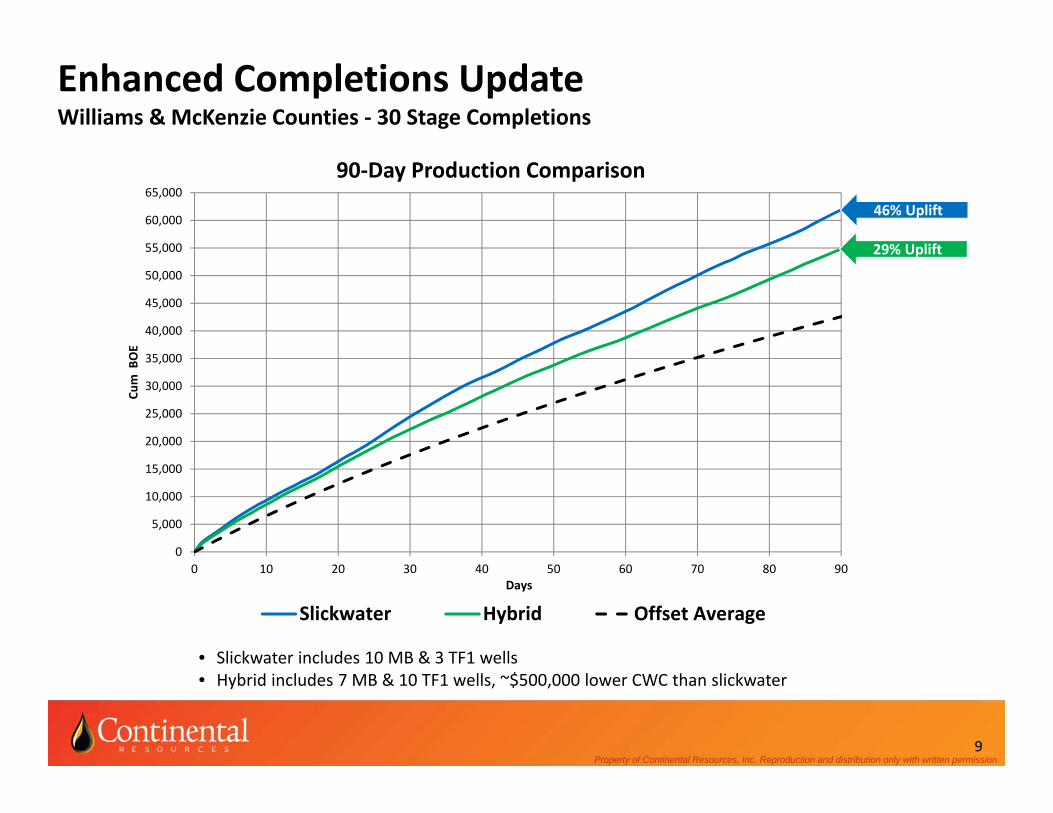
Enhanced Completions UpdateWilliams & McKenzie Counties ‐ 30 Stage Completions
0
5,000
10,000
15,000
20,000
25,000
30,000
35,000
40,000
45,000
50,000
55,000
60,000
65,000
0 10 20 30 40 50 60 70 80 90
Cum BOE
Days
90‐Day Production Comparison
Slickwater Hybrid Offset Average
• Slickwater includes 10 MB & 3 TF1 wells• Hybrid includes 7 MB & 10 TF1 wells, ~$500,000 lower CWC than slickwater
46% Uplift46% Uplift
29% Uplift 29% Uplift
Property of Continental Resources, Inc. Reproduction and distribution only with written permission10
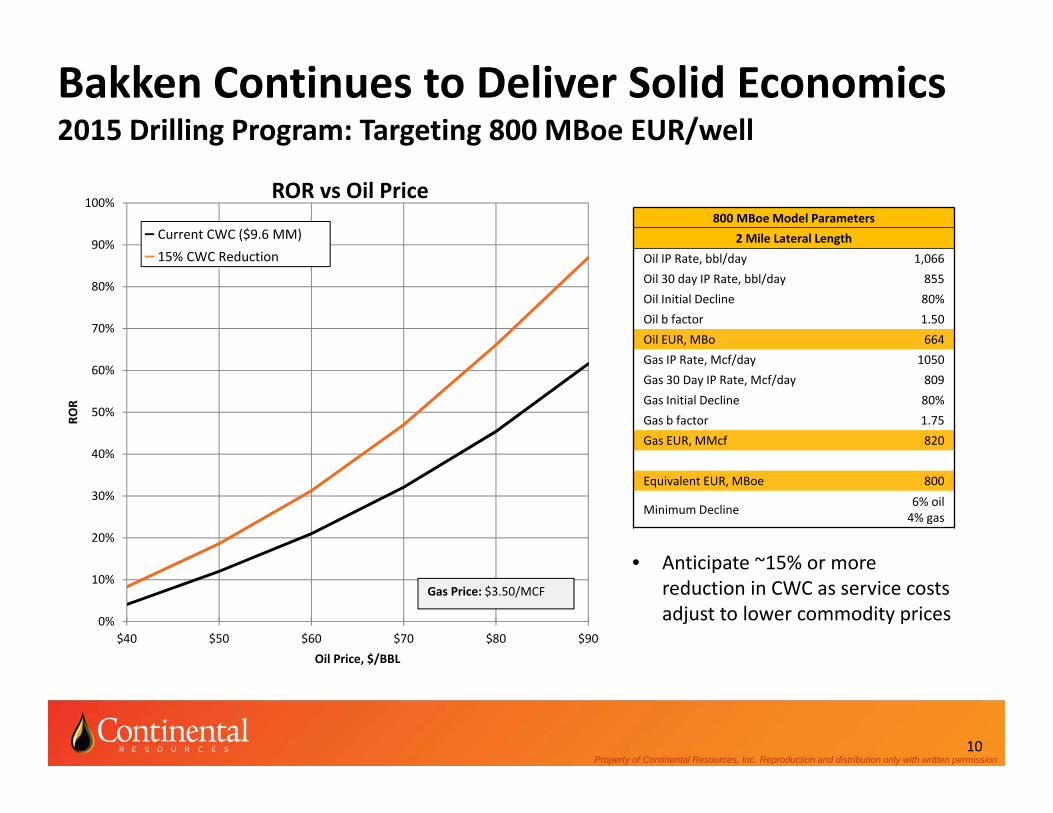
Bakken Continues to Deliver Solid Economics2015 Drilling Program: Targeting 800 MBoe EUR/well
• Anticipate ~15% or more reduction in CWC as service costs adjust to lower commodity prices
800 MBoe Model Parameters2 Mile Lateral Length
Oil IP Rate, bbl/day 1,066Oil 30 day IP Rate, bbl/day 855Oil Initial Decline 80%Oil b factor 1.50Oil EUR, MBo 664Gas IP Rate, Mcf/day 1050Gas 30 Day IP Rate, Mcf/day 809Gas Initial Decline 80%Gas b factor 1.75Gas EUR, MMcf 820
Equivalent EUR, MBoe 800
Minimum Decline 6% oil 4% gas
0%
10%
20%
30%
40%
50%
60%
70%
80%
90%
100%
$40 $50 $60 $70 $80 $90
ROR
Oil Price, $/BBL
ROR vs Oil Price
$9.6 MM CWC‐15% CWC
Gas Price: $3.50/MCF
Current CWC ($9.6 MM) 15% CWC Reduction

Property of Continental Resources, Inc. Reproduction and distribution only with written permission11
SCOOP Woodford: Continues to Grow • Excellent production extended another 12 miles
south– Connell 1‐13‐12XH: IP 10,951 Mcfd and 518 Bopd
• 9,500’ lateral
– Ritter 1‐3‐34XH: IP 11,747 Mcfd• 6,500’ lateral• Rich gas – 1,100+ BTU
• Continue to encounter strong production moving west
– Wilkins 1‐29H: IP 11,461 Mcfpd and 51 Bopd– Wilbern 1‐15H: IP 8,021 Mcfpd and 47 Bopd– Both average 4,500’ laterals
• Plan to average ~10‐13 operated rigs in 2015
Oklahoma City
CLR Acreage
Condensate FairwayGas Fairway
Oil Fairway
CLR: Connell 1‐13‐12XH IP: 518 Bopd & 10,951 Mcfpd
CLR: Ritter 1‐3‐34XHIP: 11,747 Mcfpd(1,100+ BTU)
CLR: Love 1‐26‐23XHIP: 291 Bopd & 6,691 Mcfpd
CLR: George 1‐17HIP: 279 Bopd &4,773 Mcfpd
CLR: Galvin 1‐22‐27XHIP: 739 Bopd & 1,074 Mcfpd
Peer CompletionsCLR Completions
CLR: Wilkins 1‐29HIP: 51 Bopd & 11,461 Mcfpd
CLR: Wilbern 1‐15HIP: 47 Bopd & 8,021 Mcfpd
Property of Continental Resources, Inc. Reproduction and distribution only with written permission
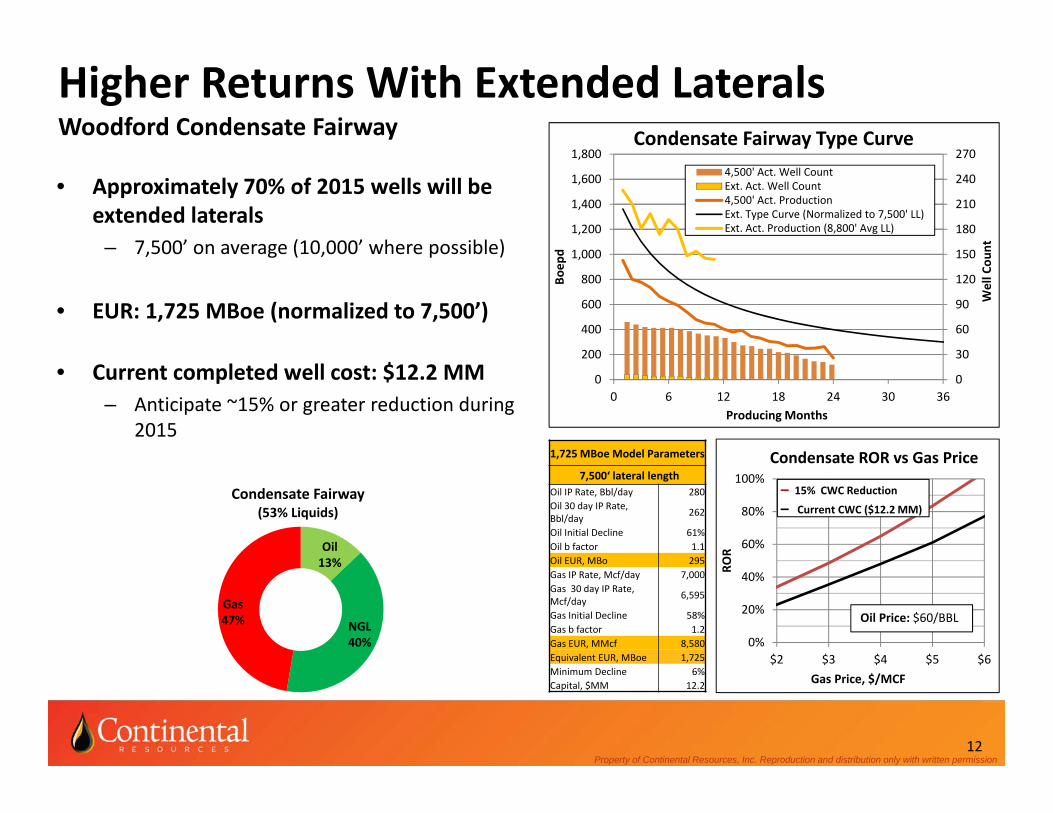
• Approximately 70% of 2015 wells will be extended laterals
– 7,500’ on average (10,000’ where possible)
• EUR: 1,725 MBoe (normalized to 7,500’)
• Current completed well cost: $12.2 MM– Anticipate ~15% or greater reduction during
2015
12
Higher Returns With Extended LateralsWoodford Condensate Fairway
0%
20%
40%
60%
80%
100%
$2 $3 $4 $5 $6
ROR
Gas Price, $/MCF
Condensate ROR vs Gas Price
Oil Price: $60/BBL
1,725 MBoe Model Parameters
7,500‘ lateral lengthOil IP Rate, Bbl/day 280Oil 30 day IP Rate,Bbl/day 262
Oil Initial Decline 61%Oil b factor 1.1Oil EUR, MBo 295Gas IP Rate, Mcf/day 7,000Gas 30 day IP Rate, Mcf/day 6,595
Gas Initial Decline 58%Gas b factor 1.2Gas EUR, MMcf 8,580Equivalent EUR, MBoe 1,725Minimum Decline 6%Capital, $MM 12.2
15% CWC Reduction
Current CWC ($12.2 MM)Condensate Fairway
(53% Liquids)
Gas47%
Oil13%
NGL40%
0
30
60
90
120
150
180
210
240
270
0 6 12 18 24 30 360
200
400
600
800
1,000
1,200
1,400
1,600
1,800
Well Cou
nt
Producing Months
Boep
d
Condensate Fairway Type Curve4,500' Act. Well CountExt. Act. Well Count4,500' Act. ProductionExt. Type Curve (Normalized to 7,500' LL)Ext. Act. Production (8,800' Avg LL)

Property of Continental Resources, Inc. Reproduction and distribution only with written permission
SCOOP Springer: Expanding Oil Discovery
13
• Continued success with oil fairway step‐outs – Schoof 1‐17H: IP 1,465 Boepd– Lyle Land 1‐25H: IP 1,134 Boepd– Martha 1‐34H: IP 934 Boepd– Wells average ~4,500’ laterals and 75% oil
• First extended lateral underway
• 195,000 net acres in the heart of SCOOP– 118,000 net acres in oil fairway
• 46,000 net acres de‐risked– 127 MMBoe net unrisked resource
potential– 188 net (252 gross) operated locations– 27 net (147 gross) non‐operated locations
• 72,000 net acres of additional upside being tested
– 77,000 net acres in gas/condensate fairway to be tested
• 6 rigs currently drilling
• Plan to average ~3‐6 operated rigs in 2015
SCOOP
Springer Fairway
12 Miles
Springer Fairway
SCOOP Outline
CLR Springer Shale Producers
CLR Leasehold
CLR 2013 Key Delineation Wells
Non‐Op. Springer Shale Producer
CLR: Lyle Land 1‐25HIP: 1,134 Boepd
CLR: Schoof 1‐17HIP: 1,465 Boepd
CLR: Martha 1‐34HIP: 934 Boepd

Property of Continental Resources, Inc. Reproduction and distribution only with written permission14
SCOOP Springer Oil: Exceptional Economics
• Current EUR/Well Model: 940 MBoe
• 4,500’ lateral
• Current completed well cost: $9.7 MM– Expect ~15% or more reduction in cost during
2015
20%
40%
60%
80%
100%
120%
140%
$40 $50 $60 $70 $80 $90 $100
ROR
Oil Price, $/BBL
Oil ROR vs Oil Price
Gas Price: $3.50/MCF
15% CWC Reduction
Current CWC ($9.7 MM)
Springer Fairway(84% Liquids)
Gas16%
Oil67%
NGL17%
0
10
20
30
40
0 6 12 18 24 30 360
100
200
300
400
500
600
700
800
900
Well Cou
nt
Producing Months
Boep
d
Springer Shale Type CurveWell Count
Type Curve (Normalized to 4,500' LL)
Act. Production (4,275' Avg LL)
Install Tubing and Gas Lift
940 MBoe Model Parameters
4,500‘ lateral lengthOil IP Rate, Bbl/day 670Oil 30 day IP Rate,bbl/day 618
Oil Initial Decline 62%Oil b factor 1.25Oil EUR, MBo 735Gas IP Rate, Mcf/day 867Gas 30 day IP Rate, Mcf/day 810
Gas Initial Decline 56%Gas b factor 1.4Gas EUR, MMcf 1,230Equivalent EUR, MBoe 940Minimum Decline 6%
Property of Continental Resources, Inc. Reproduction and distribution only with written permission15
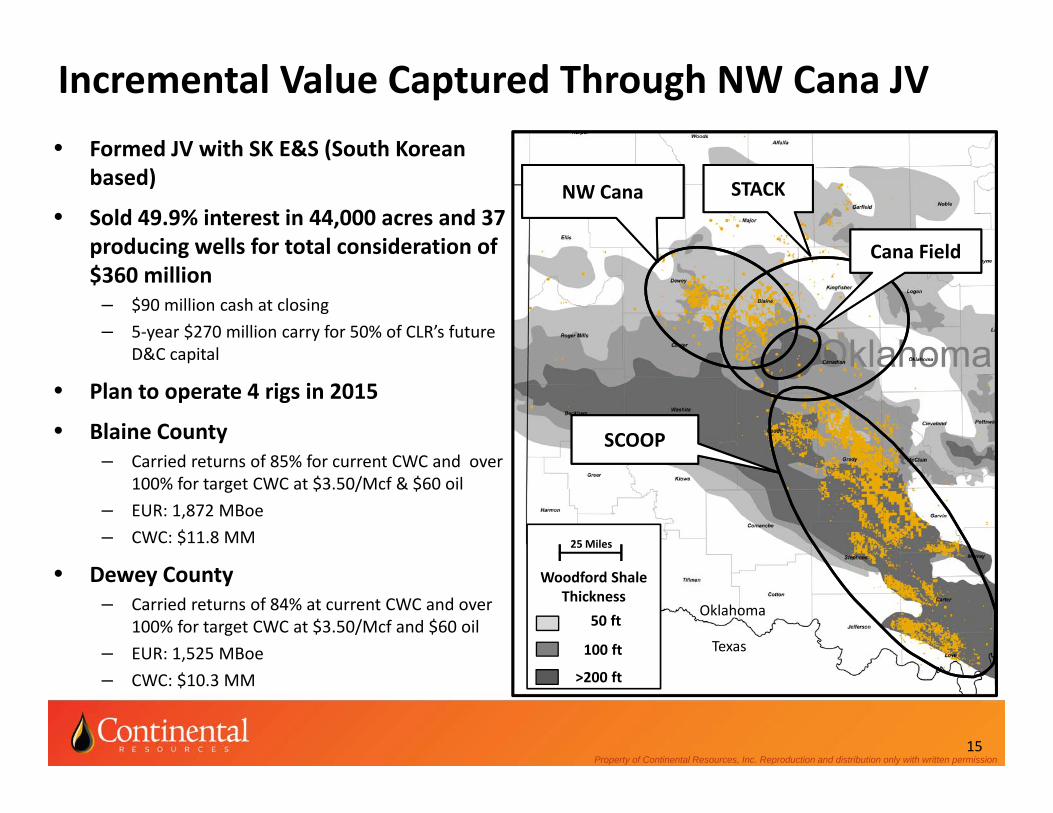
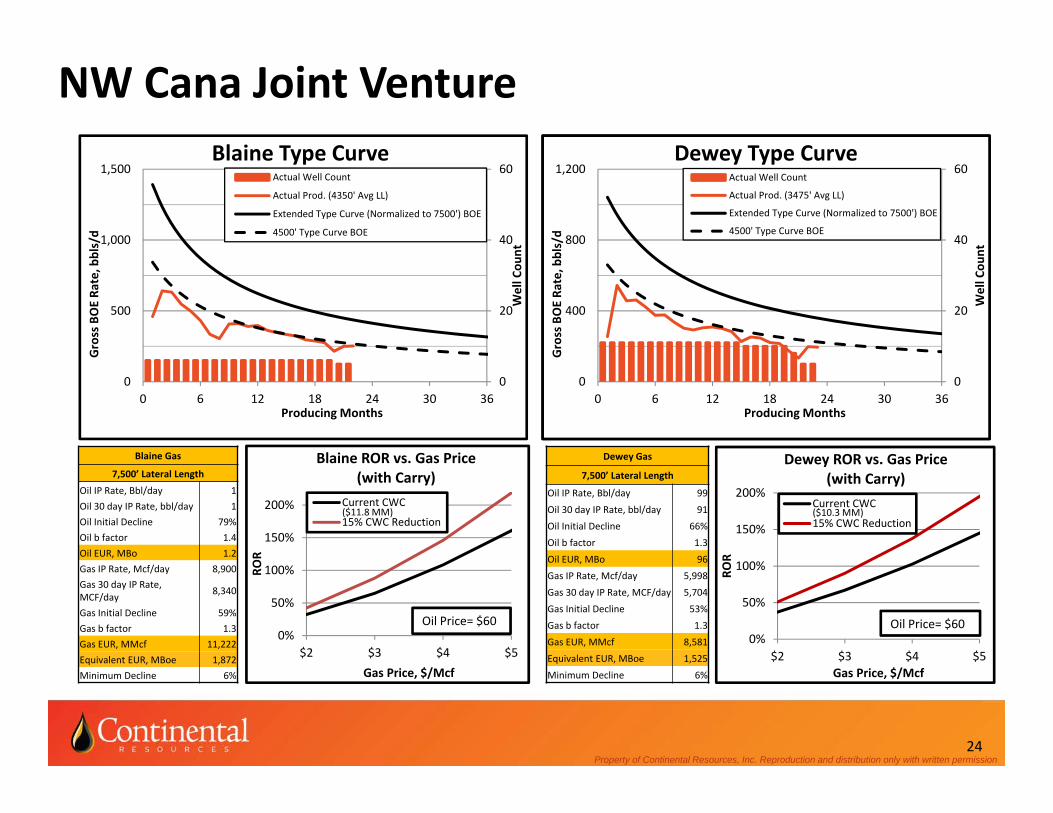
Incremental Value Captured Through NW Cana JV• Formed JV with SK E&S (South Korean
based)
• Sold 49.9% interest in 44,000 acres and 37 producing wells for total consideration of $360 million
– $90 million cash at closing– 5‐year $270 million carry for 50% of CLR’s future
D&C capital
• Plan to operate 4 rigs in 2015
• Blaine County– Carried returns of 85% for current CWC and over
100% for target CWC at $3.50/Mcf & $60 oil– EUR: 1,872 MBoe– CWC: $11.8 MM
• Dewey County– Carried returns of 84% at current CWC and over
100% for target CWC at $3.50/Mcf and $60 oil– EUR: 1,525 MBoe– CWC: $10.3 MM
Oklahoma
Texas
Woodford Shale Thickness
>200 ft
50 ft
100 ft
25 Miles
SCOOP
NW Cana STACK
Cana Field
Property of Continental Resources, Inc. Reproduction and distribution only with written permission
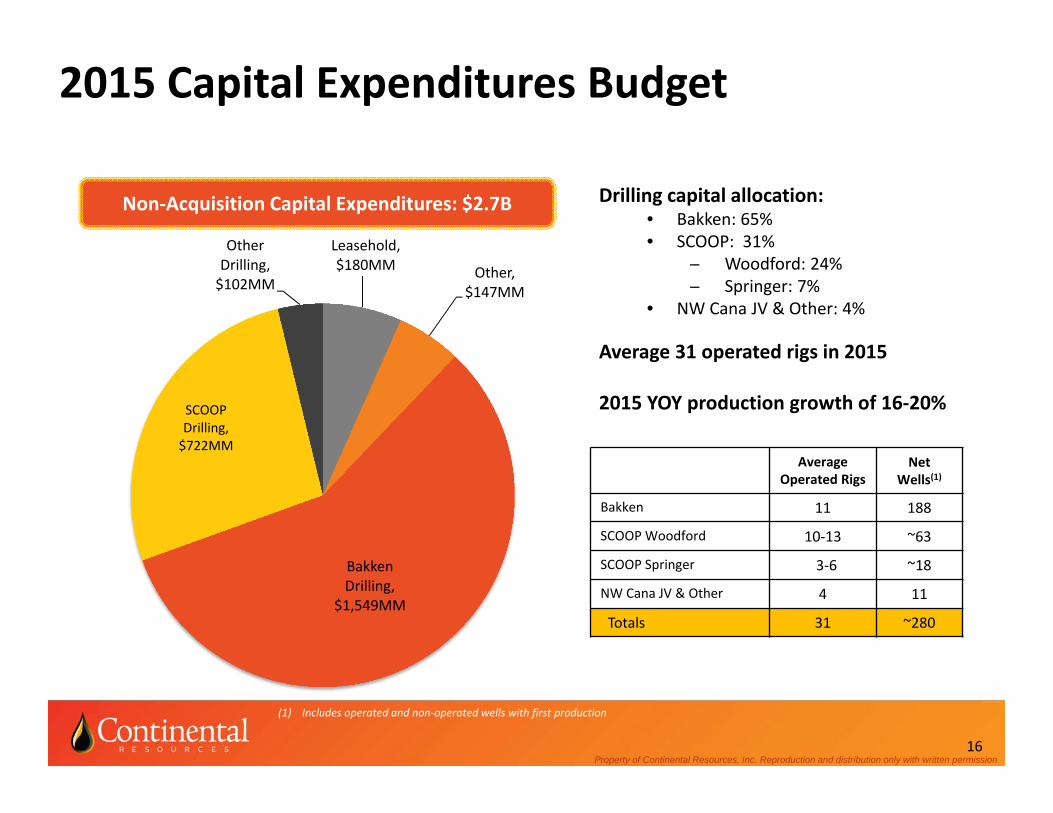
2015 Capital Expenditures Budget
Non‐Acquisition Capital Expenditures: $2.7B
Leasehold, $180MM Other,
$147MM
Bakken Drilling,
$1,549MM
SCOOP Drilling, $722MM
Other Drilling, $102MM
Drilling capital allocation:• Bakken: 65%• SCOOP: 31%
Woodford: 24% Springer: 7%
• NW Cana JV & Other: 4%
Average 31 operated rigs in 2015
2015 YOY production growth of 16‐20%
16
AverageOperated Rigs
Net Wells(1)
Bakken 11 188
SCOOP Woodford 10‐13 ~63
SCOOP Springer 3‐6 ~18
NW Cana JV & Other 4 11
Totals 31 ~280
(1) Includes operated and non‐operated wells with first production

Property of Continental Resources, Inc. Reproduction and distribution only with written permission
Low Cash Cost Drives Excellent Margins
(1) See “Continuing to Deliver Excellent Margins” in the Appendix for the method of calculating cash margin.(2) Excludes G&A related to Equity based compensation and relocation expense.(3) Based on average oil equivalent price (excluding derivatives and including natural gas) 17
$6.89 $5.87 $6.13 $5.49 $5.69 $5.80 $5.69
$2.95 $4.47 $5.82 $5.58 $6.02 $5.80 $5.99$2.19 $2.35 $2.36 $2.38 $2.07 $1.82 $2.09$1.72 $3.34
$3.40 $3.95 $4.74 $4.40 $4.61
$30.93
$43.32
$54.74 $48.59
$53.52 $51.26
$54.14
$44.68
$59.35
$72.45
$65.99
$72.04 $69.08
$72.52
$0
$10
$20
$30
$40
$50
$60
$70
$80
2009 2010 2011 2012 2013 3Q2014 9 MonthsEnded
9/30/2014Production Expense Production/Severance Tax & OtherG&A⁽²⁾ InterestCash Margin⁽¹⁾ Avg. Realized Price per BOE⁽³⁾
($ per Boe)
74%74%
74%76%
73%
75%
69%
Low cash cost of ~$18 per barrel
Property of Continental Resources, Inc. Reproduction and distribution only with written permission
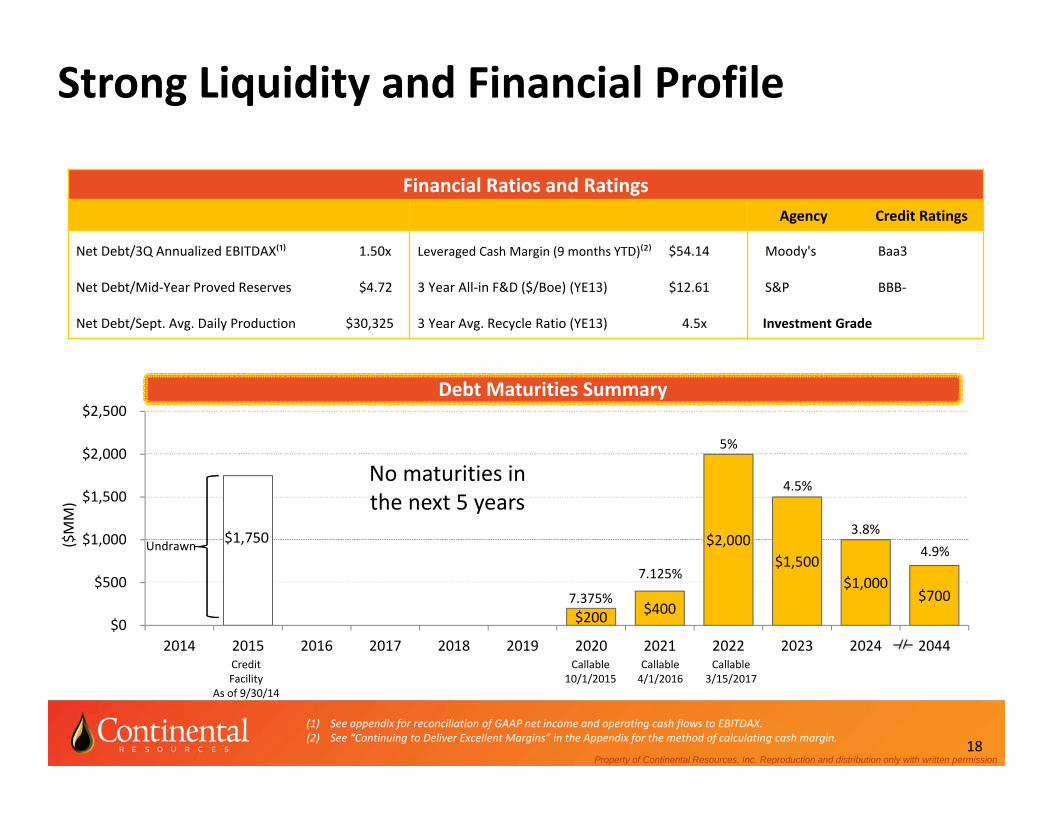
Strong Liquidity and Financial Profile
$1,750
$200 $400
$2,000 $1,500
$1,000 $700
$0
$500
$1,000
$1,500
$2,000
$2,500
2014 2015 2016 2017 2018 2019 2020 2021 2022 2023 2024 2044
Debt Maturities Summary
4.5%
5%
7.125%
7.375%
Callable 4/1/2016
Callable10/1/2015
Callable 3/15/2017
($MM)
CreditFacility
As of 9/30/14
(1) See appendix for reconciliation of GAAP net income and operating cash flows to EBITDAX.(2) See “Continuing to Deliver Excellent Margins” in the Appendix for the method of calculating cash margin.
3.8%4.9%
Financial Ratios and RatingsAgency Credit Ratings
Net Debt/3Q Annualized EBITDAX⁽¹⁾ 1.50x Leveraged Cash Margin (9 months YTD)⁽²⁾ $54.14 Moody's Baa3
Net Debt/Mid‐Year Proved Reserves $4.72 3 Year All‐in F&D ($/Boe) (YE13) $12.61 S&P BBB‐
Net Debt/Sept. Avg. Daily Production $30,325 3 Year Avg. Recycle Ratio (YE13) 4.5x Investment Grade
No maturities in the next 5 years
18
Undrawn
Property of Continental Resources, Inc. Reproduction and distribution only with written permission
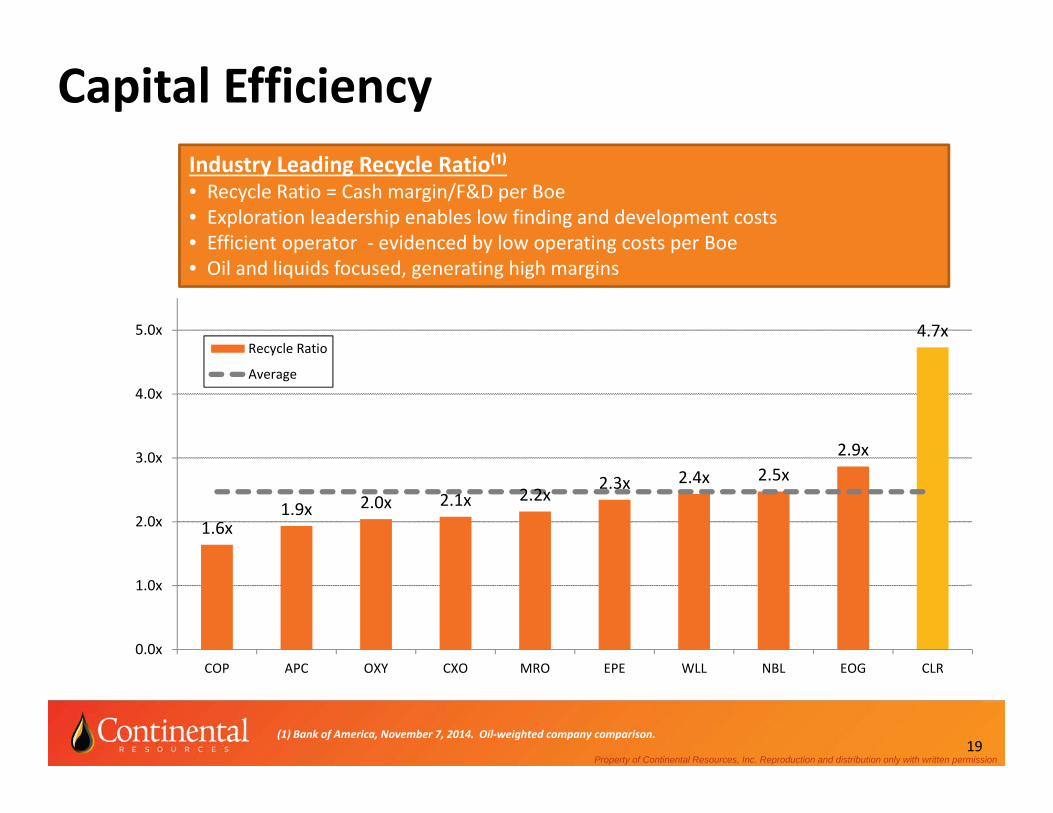
Capital Efficiency
(1) Bank of America, November 7, 2014. Oil‐weighted company comparison. 19
Industry Leading Recycle Ratio⁽¹⁾• Recycle Ratio = Cash margin/F&D per Boe• Exploration leadership enables low finding and development costs• Efficient operator ‐ evidenced by low operating costs per Boe• Oil and liquids focused, generating high margins
1.6x1.9x 2.0x 2.1x 2.2x
2.3x 2.4x 2.5x2.9x
4.7x
0.0x
1.0x
2.0x
3.0x
4.0x
5.0x
COP APC OXY CXO MRO EPE WLL NBL EOG CLR
Recycle Ratio
Average
Property of Continental Resources, Inc. Reproduction and distribution only with written permission20
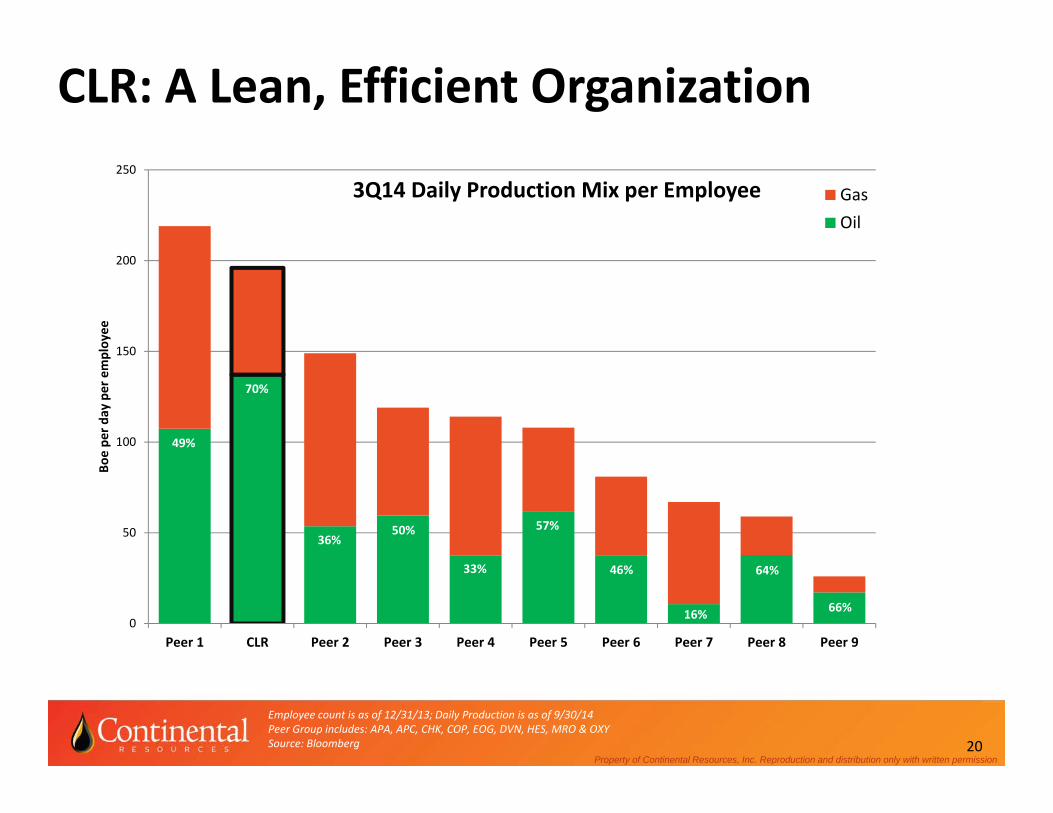
Employee count is as of 12/31/13; Daily Production is as of 9/30/14Peer Group includes: APA, APC, CHK, COP, EOG, DVN, HES, MRO & OXYSource: Bloomberg
CLR: A Lean, Efficient Organization
0
50
100
150
200
250
Peer 1 CLR Peer 2 Peer 3 Peer 4 Peer 5 Peer 6 Peer 7 Peer 8 Peer 9
Boe pe
r day per employee
3Q14 Daily Production Mix per Employee GasOil
49%
70%
64%
16%
36%50%
66%
46%
57%
33%
Property of Continental Resources, Inc. Reproduction and distribution only with written permission
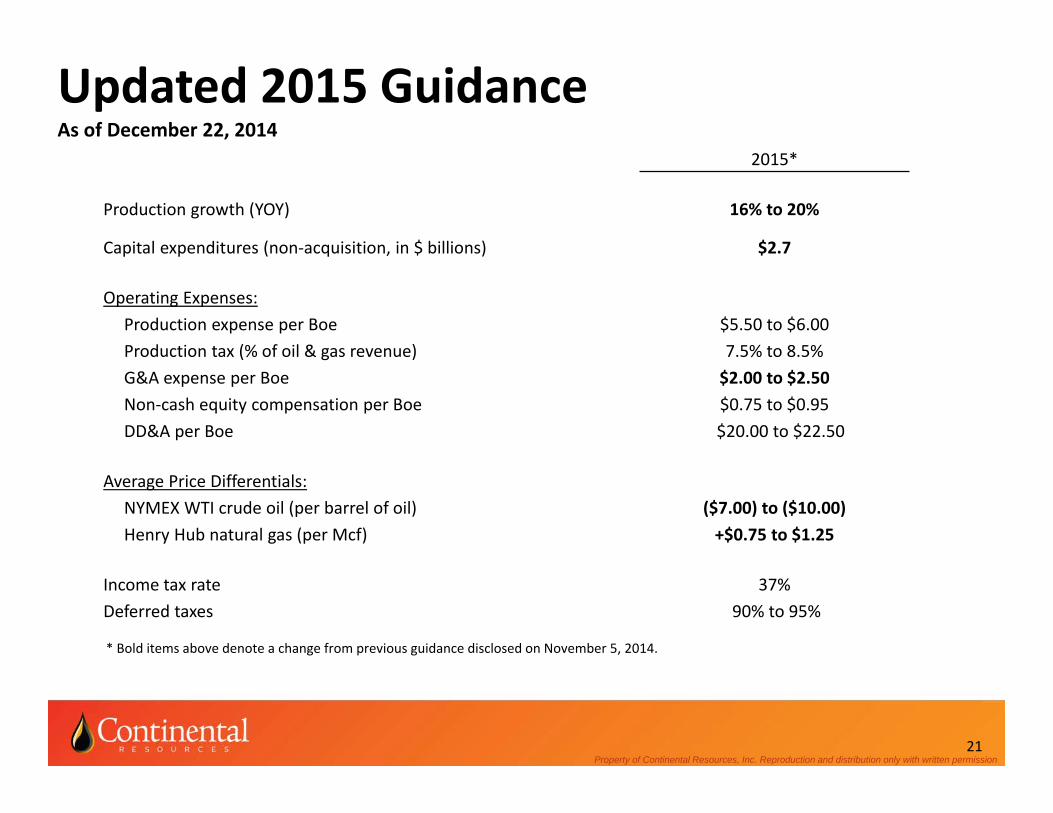
Updated 2015 GuidanceAs of December 22, 2014
2015*
Production growth (YOY) 16% to 20%
Capital expenditures (non‐acquisition, in $ billions) $2.7
Operating Expenses:Production expense per Boe $5.50 to $6.00Production tax (% of oil & gas revenue) 7.5% to 8.5%G&A expense per Boe $2.00 to $2.50Non‐cash equity compensation per Boe $0.75 to $0.95DD&A per Boe $20.00 to $22.50
Average Price Differentials:NYMEX WTI crude oil (per barrel of oil) ($7.00) to ($10.00)Henry Hub natural gas (per Mcf) +$0.75 to $1.25
Income tax rate 37%Deferred taxes 90% to 95%
21
* Bold items above denote a change from previous guidance disclosed on November 5, 2014.
Appendix

Woodford Thickness Expands Across Leasehold
23
Hunton
South
Woodford950’
380’
560’
245’150’
465’
295’
230’
Development Program Initiated
Brittleness
Gamma Ray
Hunton
North
130’
2013 – 2014 Exploratory Program
25 Mi.
Property of Continental Resources, Inc. Reproduction and distribution only with written permission24
NW Cana Joint Venture
0%
50%
100%
150%
200%
$2 $3 $4 $5
ROR
Gas Price, $/Mcf
Dewey ROR vs. Gas Price (with Carry)
Current CWC
15% CWC Reduction
Oil Price= $600%
50%
100%
150%
200%
$2 $3 $4 $5
ROR
Gas Price, $/Mcf
Blaine ROR vs. Gas Price (with Carry)
Current CWC
15% CWC Reduction
Oil Price= $60
Blaine Gas
7,500’ Lateral Length
Oil IP Rate, Bbl/day 1Oil 30 day IP Rate, bbl/day 1Oil Initial Decline 79%Oil b factor 1.4Oil EUR, MBo 1.2Gas IP Rate, Mcf/day 8,900Gas 30 day IP Rate, MCF/day 8,340
Gas Initial Decline 59%Gas b factor 1.3Gas EUR, MMcf 11,222Equivalent EUR, MBoe 1,872Minimum Decline 6%
Dewey Gas
7,500’ Lateral Length
Oil IP Rate, Bbl/day 99
Oil 30 day IP Rate, bbl/day 91Oil Initial Decline 66%Oil b factor 1.3
Oil EUR, MBo 96Gas IP Rate, Mcf/day 5,998
Gas 30 day IP Rate, MCF/day 5,704Gas Initial Decline 53%Gas b factor 1.3
Gas EUR, MMcf 8,581Equivalent EUR, MBoe 1,525
Minimum Decline 6%
0.00
20.00
40.00
60.00
0
400
800
1,200
0 6 12 18 24 30 36
Well Cou
nt
Gross BOE Ra
te, b
bls/d
Producing Months
Dewey Type Curve4500' Actual Prod.
Extended Type Curve (Normalizedto 7500') BOE4500' Type Curve BOE
4500' Actual Well Count
0
20
40
60
0
500
1,000
1,500
0 6 12 18 24 30 36
Well Cou
nt
Gross BOE Ra
te, b
bls/d
Producing Months
Blaine Type CurveActual Well Count
Actual Prod. (4350' Avg LL)
Extended Type Curve (Normalized to 7500') BOE
4500' Type Curve BOE
0
20
40
60
0
400
800
1,200
0 6 12 18 24 30 36
Well Cou
nt
Gross BOE Ra
te, b
bls/d
Producing Months
Dewey Type CurveActual Well Count
Actual Prod. (3475' Avg LL)
Extended Type Curve (Normalized to 7500') BOE
4500' Type Curve BOE
($10.3 MM)($11.8 MM)

Property of Continental Resources, Inc. Reproduction and distribution only with written permission
Continuing to Deliver Excellent Margins
1) See “EBITDAX Reconciliation to GAAP” in Appendix for a reconciliation of GAAP net income and operating cash flows to EBITDAX. 2) Average costs per Boe have been computed using sales volumes and exclude any effect of derivative transactions.3) Excludes G&A related to Equity based compensation and relocation expense. 25
2009 2010 2011 2012 2013 3Q2014As of 9 Months Ended 9/30/14
Realized oil price ($/Bbl) $54.44 $70.69 $88.51 $84.59 $89.93 $85.49 $89.02
Realized natural gas price ($/Mcf) $2.95 $4.26 $4.87 $3.73 $4.87 $5.10 $5.80
Oil production (Bopd) 27,459 32,385 45,121 68,497 95,859 127,788 116,954
Natural gas production (Mcfpd) 59,194 65,598 100,469 174,521 240,355 327,287 304,453
Total production (Boepd) 37,324 43,318 61,865 97,583 135,919 182,335 167,696
EBITDAX ($000's) (1) $450,648 $810,877 $1,303,959 $1,963,123 $2,839,510 $947,635 $2,590,980
Key Operational Statistics (per Boe) (2)
Average oil equivalent price (excludes derivatives) $44.68 $59.35 $72.45 $65.99 $72.04 $69.08 $72.52
Production expense $6.89 $5.87 $6.13 $5.49 $5.69 $5.80 $5.69
Production tax and other $2.95 $4.47 $5.82 $5.58 $6.02 $5.80 $5.99
G&A (3) $2.19 $2.35 $2.36 $2.38 $2.07 $1.82 $2.09
Interest $1.72 $3.34 $3.40 $3.95 $4.74 $4.40 $4.61
Total cash costs $13.75 $16.03 $17.71 $17.40 $18.52 $17.82 $18.38
Cash margin $30.93 $43.32 $54.74 $48.59 $53.52 $51.26 $54.14
Cash margin % 69% 73% 76% 74% 74% 74% 75%
Property of Continental Resources, Inc. Reproduction and distribution only with written permission26
EBITDAX Reconciliation to GAAP
We use a variety of financial and operational measures to assess our performance. Among these measures is EBITDAX. EBITDAXrepresents earnings (net income) before interest expense, income taxes, depreciation, depletion, amortization and accretion,property impairments, exploration expenses, non‐cash gains and losses resulting from the requirements of accounting forderivatives, non‐cash equity compensation expense, and losses on extinguishment of debt. EBITDAX is not a measure of netincome or operating cash flows as determined by GAAP.
Management believes EBITDAX is useful because it allows us to more effectively evaluate our operating performance andcompare the results of our operations from period to period without regard to our financing methods or capital structure.Further, we believe that EBITDAX is a widely followed measure of operating performance and may also be used by investors tomeasure our ability to meet future debt service requirements, if any. We exclude the items listed above from net income inarriving at EBITDAX because those amounts can vary substantially from company to company within our industry depending uponaccounting methods and book values of assets, capital structures and the method by which the assets were acquired.
EBITDAX should not be considered as an alternative to, or more meaningful than, net income or operating cash flows asdetermined in accordance with GAAP or as an indicator of a company’s operating performance or liquidity. Certain items excludedfrom EBITDAX are significant components in understanding and assessing a company’s financial performance, such as a company’scost of capital and tax structure, as well as the historic costs of depreciable assets, none of which are components of EBITDAX.Our computations of EBITDAX may not be comparable to other similarly titled measures of other companies.
See the following page for reconciliations of our net income and operating cash flows to EBITDAX for the applicable periods.
Property of Continental Resources, Inc. Reproduction and distribution only with written permission
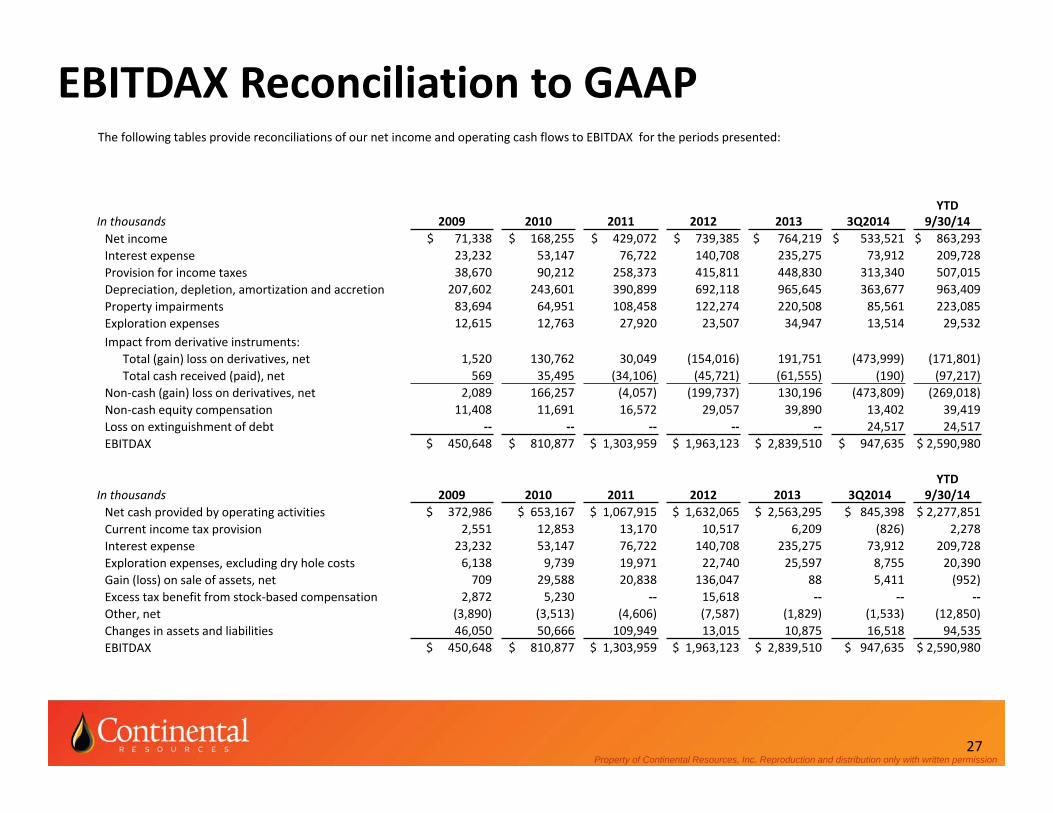
EBITDAX Reconciliation to GAAP The following tables provide reconciliations of our net income and operating cash flows to EBITDAX for the periods presented:
27
In thousands 2009 2010 2011 2012 2013 3Q2014YTD
9/30/14Net income $ 71,338 $ 168,255 $ 429,072 $ 739,385 $ 764,219 $ 533,521 $ 863,293Interest expense 23,232 53,147 76,722 140,708 235,275 73,912 209,728Provision for income taxes 38,670 90,212 258,373 415,811 448,830 313,340 507,015Depreciation, depletion, amortization and accretion 207,602 243,601 390,899 692,118 965,645 363,677 963,409Property impairments 83,694 64,951 108,458 122,274 220,508 85,561 223,085Exploration expenses 12,615 12,763 27,920 23,507 34,947 13,514 29,532Impact from derivative instruments:
Total (gain) loss on derivatives, net 1,520 130,762 30,049 (154,016) 191,751 (473,999) (171,801)Total cash received (paid), net 569 35,495 (34,106) (45,721) (61,555) (190) (97,217)
Non‐cash (gain) loss on derivatives, net 2,089 166,257 (4,057) (199,737) 130,196 (473,809) (269,018)Non‐cash equity compensation 11,408 11,691 16,572 29,057 39,890 13,402 39,419Loss on extinguishment of debt ‐‐ ‐‐ ‐‐ ‐‐ ‐‐ 24,517 24,517EBITDAX $ 450,648 $ 810,877 $ 1,303,959 $ 1,963,123 $ 2,839,510 $ 947,635 $ 2,590,980
In thousands 2009 2010 2011 2012 2013 3Q2014YTD
9/30/14Net cash provided by operating activities $ 372,986 $ 653,167 $ 1,067,915 $ 1,632,065 $ 2,563,295 $ 845,398 $ 2,277,851Current income tax provision 2,551 12,853 13,170 10,517 6,209 (826) 2,278Interest expense 23,232 53,147 76,722 140,708 235,275 73,912 209,728Exploration expenses, excluding dry hole costs 6,138 9,739 19,971 22,740 25,597 8,755 20,390Gain (loss) on sale of assets, net 709 29,588 20,838 136,047 88 5,411 (952)Excess tax benefit from stock‐based compensation 2,872 5,230 ‐‐ 15,618 ‐‐ ‐‐ ‐‐Other, net (3,890) (3,513) (4,606) (7,587) (1,829) (1,533) (12,850)Changes in assets and liabilities 46,050 50,666 109,949 13,015 10,875 16,518 94,535EBITDAX $ 450,648 $ 810,877 $ 1,303,959 $ 1,963,123 $ 2,839,510 $ 947,635 $ 2,590,980
Property of Continental Resources, Inc. Reproduction and distribution only with written permission28
Adjusted Earnings Reconciliation to GAAP
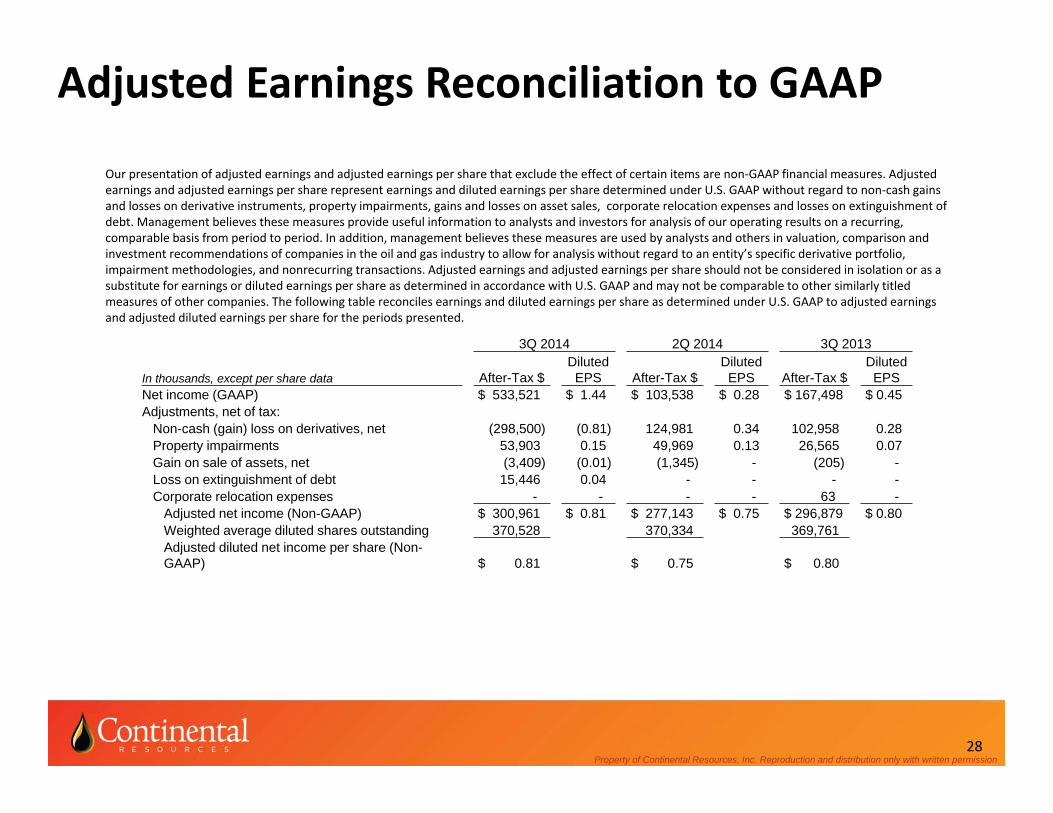
Our presentation of adjusted earnings and adjusted earnings per share that exclude the effect of certain items are non‐GAAP financial measures. Adjusted earnings and adjusted earnings per share represent earnings and diluted earnings per share determined under U.S. GAAP without regard to non‐cash gains and losses on derivative instruments, property impairments, gains and losses on asset sales, corporate relocation expenses and losses on extinguishment of debt. Management believes these measures provide useful information to analysts and investors for analysis of our operating results on a recurring, comparable basis from period to period. In addition, management believes these measures are used by analysts and others in valuation, comparison and investment recommendations of companies in the oil and gas industry to allow for analysis without regard to an entity’s specific derivative portfolio, impairment methodologies, and nonrecurring transactions. Adjusted earnings and adjusted earnings per share should not be considered in isolation or as a substitute for earnings or diluted earnings per share as determined in accordance with U.S. GAAP and may not be comparable to other similarly titled measures of other companies. The following table reconciles earnings and diluted earnings per share as determined under U.S. GAAP to adjusted earnings and adjusted diluted earnings per share for the periods presented.
3Q 2014 2Q 2014 3Q 2013
In thousands, except per share data After-Tax $Diluted
EPS After-Tax $Diluted
EPS After-Tax $Diluted
EPSNet income (GAAP) $ 533,521 $ 1.44 $ 103,538 $ 0.28 $ 167,498 $ 0.45 Adjustments, net of tax:
Non-cash (gain) loss on derivatives, net (298,500) (0.81) 124,981 0.34 102,958 0.28 Property impairments 53,903 0.15 49,969 0.13 26,565 0.07 Gain on sale of assets, net (3,409) (0.01) (1,345) - (205) -Loss on extinguishment of debt 15,446 0.04 - - - -Corporate relocation expenses - - - - 63 -
Adjusted net income (Non-GAAP) $ 300,961 $ 0.81 $ 277,143 $ 0.75 $ 296,879 $ 0.80 Weighted average diluted shares outstanding 370,528 370,334 369,761 Adjusted diluted net income per share (Non-GAAP) $ 0.81 $ 0.75 $ 0.80

Property of Continental Resources, Inc. Reproduction and distribution only with written permission29
Investor Relations Contact Information
John J. Kilgallon Vice President, Investor Relations
Phone:405‐234‐9330
Email:[email protected]
Website:www.CLR.com/Investors
Related Documents