Romanian Journal of Economic Forecasting –XVI (4) 2013 218 CLUSTER ANALYSIS OF MARKET POTENTIAL IN EMERGING MARKETS: A DYNAMIC RESEARCH BASED ON MARKOV CHAIN 1 Da HUO 2 Abstract The emerging economy is playing an important role in the global market. Market potential of emerging markets is also a determinant in a wide range of market decisions of the global managers. For the reason that the market potential consists of a number of different factors across different countries, this research divides the emerging market countries into different clusters, and analyzes their different attributes by cluster analysis. Also, the network relationships between the emerging markets and their attributes across different clusters are further researched. It is found that countries at a higher level of market potential also show a higher level of economic freedom, commercial infrastructure, market intensity and market consumption capacity. With the development of their economies, the emerging markets have experienced different transitions. This research further estimates the switching probabilities across different clusters by a Markov chain model. Future ratios of different country clusters in the emerging markets are also forecasted. This research will be helpful to the global managers and cross-border investors in developing a further understanding of future changes in market potentials of different emerging markets. Keyword: market potential, emerging market, cluster analysis, Markov chain JEL Classification: F23, M31, F47 1 This study was presented at 2013 Global Business, Economics, and Finance Conference, Wuhan University, China, 9-11 May 2013. The author thanks the Central University of Finance and Economics for the support of this research. The author also thanks Professor Tsangyao Chang, Professor Ken Hung, Professor Haibo Wang and anonymous referees for their useful comments and suggestions. The author thanks Professor Joseph Brennan for editing this paper. 2 School of International Trade and Economics, Central University of Finance and Economics, Beijing, China, 100081, Email: [email protected]. 16.

Welcome message from author
This document is posted to help you gain knowledge. Please leave a comment to let me know what you think about it! Share it to your friends and learn new things together.
Transcript
Romanian Journal of Economic Forecasting –XVI (4) 2013 218
CLUSTER ANALYSIS OF MARKET
POTENTIAL IN EMERGING MARKETS: A DYNAMIC RESEARCH BASED ON MARKOV CHAIN1
Da HUO2
Abstract
The emerging economy is playing an important role in the global market. Market potential of emerging markets is also a determinant in a wide range of market decisions of the global managers. For the reason that the market potential consists of a number of different factors across different countries, this research divides the emerging market countries into different clusters, and analyzes their different attributes by cluster analysis. Also, the network relationships between the emerging markets and their attributes across different clusters are further researched. It is found that countries at a higher level of market potential also show a higher level of economic freedom, commercial infrastructure, market intensity and market consumption capacity. With the development of their economies, the emerging markets have experienced different transitions. This research further estimates the switching probabilities across different clusters by a Markov chain model. Future ratios of different country clusters in the emerging markets are also forecasted. This research will be helpful to the global managers and cross-border investors in developing a further understanding of future changes in market potentials of different emerging markets. Keyword: market potential, emerging market, cluster analysis, Markov chain JEL Classification: F23, M31, F47
1 This study was presented at 2013 Global Business, Economics, and Finance Conference,
Wuhan University, China, 9-11 May 2013. The author thanks the Central University of Finance and Economics for the support of this
research. The author also thanks Professor Tsangyao Chang, Professor Ken Hung, Professor Haibo Wang and anonymous referees for their useful comments and suggestions. The author thanks Professor Joseph Brennan for editing this paper.
2 School of International Trade and Economics, Central University of Finance and Economics, Beijing, China, 100081, Email: [email protected].
16.

Cluster Analysis of Market Potential in Emerging Markets
Romanian Journal of Economic Forecasting – XVI (4) 2013 219
1. Introduction
Vernon (1966) pointed out that production in the developed countries can be shifted to the developing countries by foreign direct investment. At this point, the market selection is of great importance to global marketers and investors. Rugman and Verbeke (1992) pointed out that location-related factors have an important influence on the firm-specific resources of multinational companies. Dunning (1993) pointed out that location advantage is one of the three determinants for investors to choose their target markets. Therefore, the market potential of the emerging markets is always a key factor that influences the decisions of cross-border investors from the developed countries. With the further development of emerging economies, a large number of countries in emerging markets have improved their market power in global competition, such as China and India. It is not only the trade between developed countries and emerging markets that has increased; it was also registered an increase in the trade among the emerging markets. Buckly et al. (2007) pointed out that market size, geographic proximity, inflation and market openness, which show the location characteristics, are important determinants to the investment decisions of FDI outflows such as China. Market potential in the emerging markets has also become an important factor for a growing number of investors from the emerging economies. Concerning the rising importance of the emerging markets in the global economy, and the key function of market potential to global marketers and cross-border investors, both from developed countries and emerging markets, it is necessary to analyze the attributes of market potential across different emerging markets, so that global strategies and investment decisions can be made effectively, targeting different country clusters. This research also estimates the future ratios of different clusters of emerging markets by Markov chains, so that global markets and investors can have a deeper understanding of the changes in market potential across different countries.
2. Literature Review
Putler et al. (1996) used market potential as important geodemographic information to evaluate the sales potential and consumer expenditure in segment markets. Perks et al. (2013) found that market potential has a higher level of importance, especially in the performance of multinational companies in small-size emerging markets. Market potential is of great importance to global marketers and investors. (1). Market potential is an important factor to moderate the international involvement of companies across different cultures. Malhotra et al. (2009) found that the market potential is an important factor that mediates the relationship between geographic and cultural distances of different markets in cross-border acquisition. Malhotra and Sivakumar (2011) further pointed out that market potential, interacting with cultural distance, is an important factor of companies’ international involvement, and it has a curve linear effect on the level of equity participation. (2). Market potential is also a determinant to entry mode decisions. Williamson et al. (2005) pointed out that exporters make their market entry decisions based on the trade-off between the market potential and the competitiveness of importing countries.

Institute for Economic Forecasting
Romanian Journal of Economic Forecasting –XVI (4) 2013 220
(3).Market potential plays a key role in cross-border investment decisions. Waheeduzzaman and Rau (2006) pointed out that market potential is an important index to determine the competitiveness of countries in the emerging markets, and the emerging markets have been targeted by increasing foreign direct investment due to their growing market potential. It is found that market openness, market growth, market capacity and infrastructure are important factors of market potential and contribute significant explanatory power to the cross-border investment decisions. In market decisions across countries in emerging economy, understanding of different characteristics of market potential has always been a factor of success. Dou et al. (2010) pointed out that the global professional service companies need to be adaptive to the local clients in emerging markets due to their different characteristics, so that the companies can better satisfy their clients in such markets. Alon (2006) pointed out that companies need their fitted models in emerging markets to address their different market potentials. It is of great importance to analyze the characteristics of different emerging markets, and knowing the differences of market potential across different countries is critical for investment consultants in making their targets. A number of factors have been developed to identify different levels of market potential across the emerging markets. (1). Market size has always been assessed as a factor of market potential. Mahajan (1993) pointed out that the size of emerging markets is an important indicator in the decisions of market entry. (2). Economy growth rate is another important factor, reflecting the market potential of the emerging markets. Ayodeji (2012) pointed out that the venture capital has an important impact on the economy growth, which indicates the development of emerging economies. (3). Development of infrastructure has also a key role in the market potential. Tiwari et al. (2003) pointed out that the emerging markets, such as China, have highly invested in infrastructure, such as highway systems and seaports, and this also facilitates the transportation in the emerging markets. Lee (2003) pointed out that the channel intensity of emerging markets is an important factor to the distribution decisions of investors. (4). Country risk is also widely considered as a factor to evaluate the market potential. Malhotra et al. (2009) also pointed out that there is a need to balance the trade-off between risk and return in market, and thus the country risk is included as an indicator of the market potential in the emerging markets. Baena (2012) pointed out that traditional companies may prefer to reduce risk and invest in the developed countries. As the developed countries are more saturated, investors are more interested in the emerging markets with lower level of uncertainty avoidance. The International Business Center at Michigan State University has developed the market potential index consisting of eight different factors, including market size, market growth rate, market intensity, market consumption capacity, commercial infrastructure, economic freedom, market receptivity, and country risk. This research analyzes the different characteristics of countries across the emerging markets based on the market potential index from the International Business Center at Michigan State University. Cluster analysis is used to analyze the attributes of market potential across different countries, and a 2-Mode network is developed to visualize the relationship
Cluster Analysis of Market Potential in Emerging Markets
Romanian Journal of Economic Forecasting – XVI (4) 2013 221
between country nodes and their attributes. The switching probabilities of different clusters are further estimated by a Markov chain model and the future trend of market potential attributes in the emerging market are forecasted.
3. The Research Method
3.1. Data Source The market potential index is obtained from the International Business Center, Michigan State University, at http://globaledge.msu.edu/mpi. Annual data of market potential index in the emerging markets from 2000-2013 are researched, with missing values in 2006 and 2012 excluded. Sample countries include Singapore, Hong Kong, China, South Korea, Czech Republic, India, Israel, Poland, Hungary, Turkey, Brazil, Mexico, Argentina, Malaysia, Chile, Peru, Indonesia, Thailand, Russian Federation, Egypt, Saudi Arabia, Philippines, Colombia, Pakistan, Venezuela and South Africa. The market potential index consists of eight different variables, including market size, market growth rate, market intensity, market consumption capacity, commercial infrastructure, economic freedom, and country risk. The data sources are originally collected from the World Bank, the Euromonitor Database, and the U.S. Census Bureau et al.
3.2. Cluster Analysis of the Market Potential Index Countries in the emerging markets are divided into 8 clusters by cluster analysis. The market potential index and the eight variables above are used as dimensions to identify the cluster of different countries. Each variable is standardized with mean 0 and standard deviation 1. The SAS 9.2 program is used to perform the cluster analysis. Furthermore, the network relationship between different countries and their market potential attributes are also analyzed by Ucinet 6. The market potential index in 2013 is transformed into binary data by the threshold of average value in each variable. The variable ‘HighPotential’ is equal to 1 if sample value is higher than average. Otherwise, it is equal to 0. In the same manner, the rest of the variables are transformed into binary data. Relationships between different nodes and attributes are visualized by a 2-Mode network.
3.3. Forecasting by Markov Chain Finally, the switching probabilities of different countries into different clusters are analyzed by the Markov chain model. This is a powerful forecasting tool that predicts the movement of different states from the current state. The Markov chain model has been widely used in economics, finance, marketing, and tourism forecasting researches. Lu and Kuo (2006) used the Markov chain model to predict the default probability of bank loans in Taiwan. Otter (2006) used the Markov chain model to support targeting decisions of households for direct marketing. Fukuhara and Saruwatari (2007) used the Markov chain to forecast the currency risk in the emerging markets. Netzer et al. (2008) used the Markov chain model to analyze the latent customer relationship dynamics. Bode and Nunnenkamp (2011) used the Markov chains to analyze the influence of FDI on regional development. Lipták (2011) used

Institute for Economic Forecasting
Romanian Journal of Economic Forecasting –XVI (4) 2013 222
the Markov chain model to predict the state of labor market in Hungary. Choi et al. (2011) used the Markov chain model to estimate the destination switching rate of tourists across different countries. This research uses the Markov chain model to estimates the probabilities of countries switching from one cluster to another. (1). Set X(t) as the cluster that the sample country is at year t. X(t+1) is the cluster that the country will switch into during the next year, t+1. The Markov chain model is applied for the entire set of data containing all countries and all years as a whole. Set i as the cluster choices of X(t), and j as the cluster choices of X(t+1), thus both
),,,,,,,(, 87654321 CCCCCCCCji ∈ . Therefore, one step switching probability from cluster i in year t to cluster j in year t+1 in a homogeneous Markov chain can be P(switch):
}{ ixjxPP ttswitch === + )()1()(. In this research, set the number of samples that are in
Cluster i as Ni, the number of samples that switch from Cluster i into Cluster j as Nij, thus }{ ixjxNN ttij === + )()1(
, and set PciCj as the probability of Cluster i to switch into
Cluster j. Therefore,
⎟⎟⎟⎟⎟⎟
⎠
⎞
⎜⎜⎜⎜⎜⎜
⎝
⎛
=== ∑ =
882818
822212
812111
8
1//)(
cccccc
cccccc
cccccc
CCj ijijiijswitch
PPP
PPPPPP
NNNNP
L
MOMM
L
L
(2). Further, set P(m) as the initial probability of eight different clusters in the emerging markets, and set X(m) as the initial cluster that each country is divided into. Thus,
{ }ixPP mm == )()(. Therefore, the estimation for next step probabilities of different
clusters after initial state can be equal to )()()1( * switchmm PPP =+, and therefore,
)()2013()2014( * switchPPP =
(3). Finally, set 87654321 ,,,,,,, ππππππππ as the probabilities of cluster 1 to cluster 8 in a
stationary distribution, and 10 << iπ . Thus, ( )87654321)( ,,,,,,, ππππππππ=stationaryP and
87654321 ,,,,,,, ππππππππ can be solved by equations:
187654321
8821
2821
1821
888281
282221
181211
=+++++++
=+++
=+++
=+++
ππππππππ
ππππ
ππππ
ππππ
cccccc
cccccc
cccccc
PPP
PPPPPP
L
MMOMM
L
L
The estimation of switching probabilities in Markov chain is performed by Matlab R2010a program. The first-order switching probability is generated from the database collected from 2000 to 2011, with missing values of 2006 excluded. A further one-step estimation for P(2014) is generated by
)()2013()2014( * switchPPP = . The switching probabilities of different clusters in a stationary distribution, 87654321 ,,,,,,, ππππππππ , are further solved.
Cluster Analysis of Market Potential in Emerging Markets
Romanian Journal of Economic Forecasting – XVI (4) 2013 223
4. Results
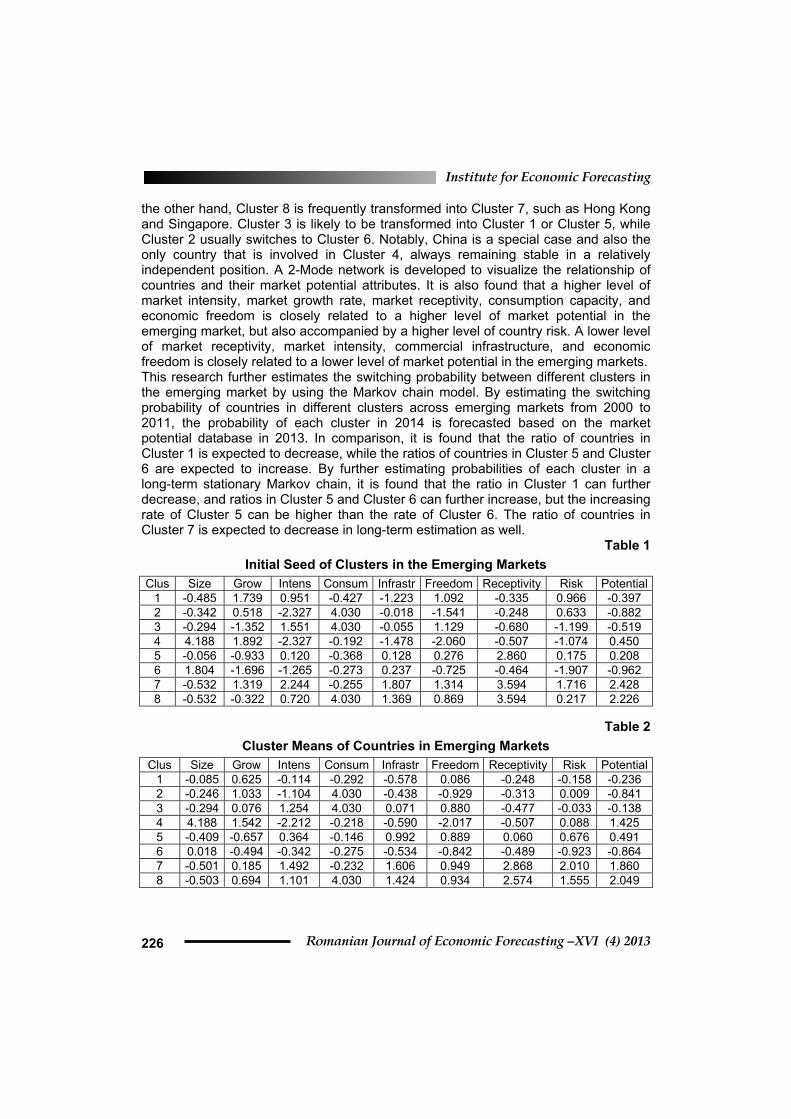
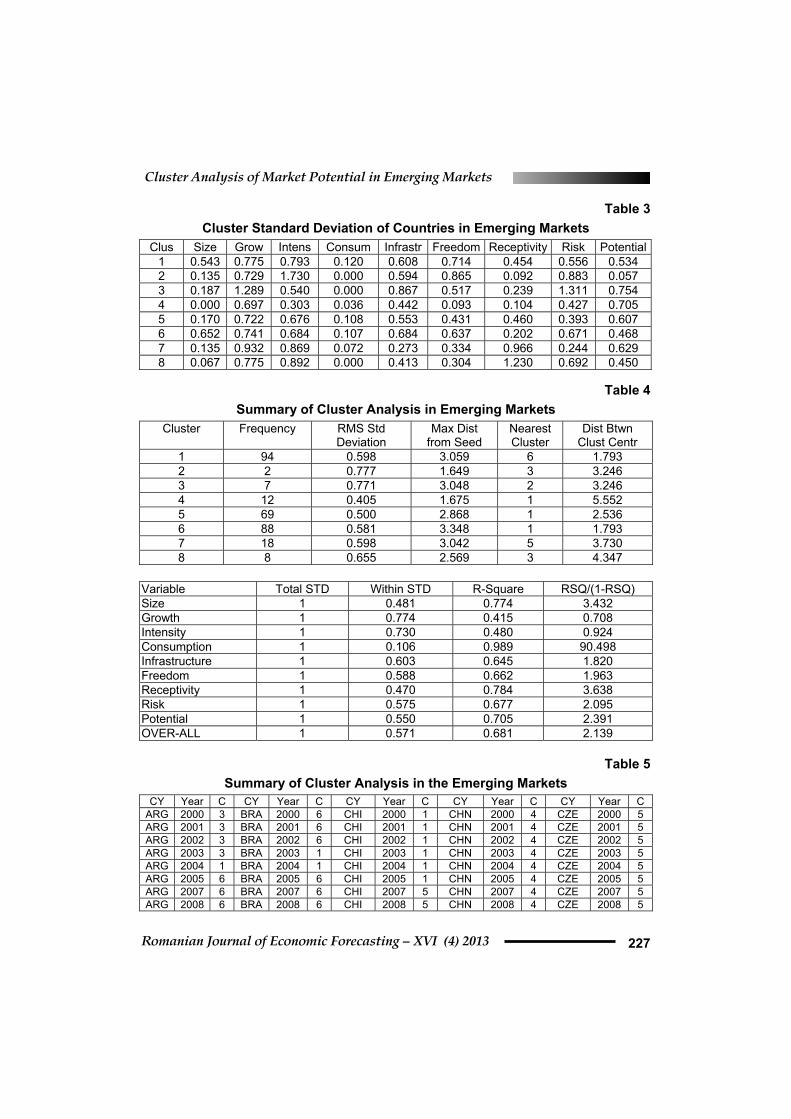
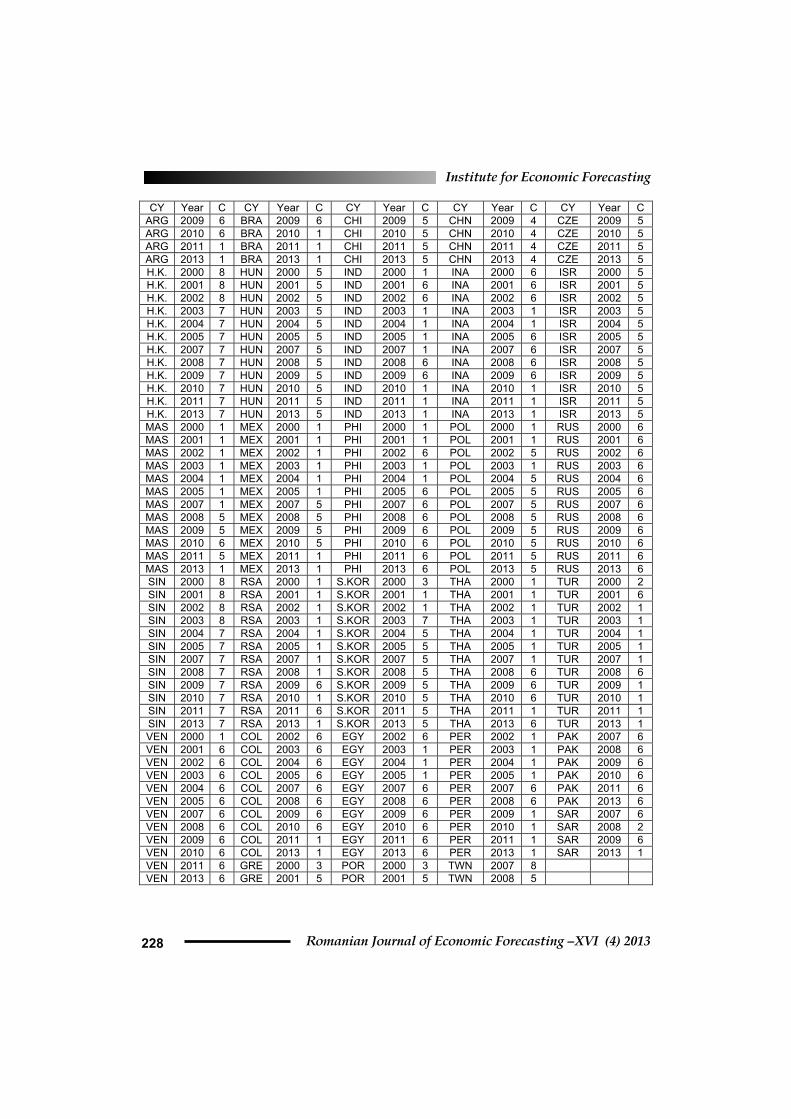
4.1. Cluster Analysis of Market Potential Table 1 shows the initial seeds of different variables. From Table 1 we can find that countries are divided into eight different clusters by market potential index and other eight variables representing different factors of market potentials in the emerging markets. Table 2 shows the means of different variables in each cluster, and Table 3 further shows the standard deviation of variables in each cluster. From Table 2 it is found that countries in the emerging markets have a higher level of market potential in Cluster 4 (mean=1.425), Cluster 7 (mean=1.860), and Cluster 8 (mean=2.049). The average level of countries in Cluster 5 is also positive (mean=0.491). Among the countries with higher level of market potential, in Cluster 4 is China, which is also high in market size, market growth rate, but relatively low in market intensity and economic freedom. On the other hand, countries in Clusters 7 and 8 are high in market intensity, economic freedom, commercial infrastructure, and market receptivity, but are lower in market size with a higher level of country risk, such as Singapore. It is also found from Table 2 that countries in Cluster 2 (mean= -0.841) and Cluster 6 (mean= -0.864) have a lower level of market potential. Countries in Cluster 1 (mean= -0.236) and Cluster 3 (mean= -0.138) are also low in the market potential index. Countries in Cluster 2 have a fast market growth rate, but are lower in market intensity, economic freedom, and market receptivity. Countries in Cluster 6 have a lower country risk, but also low market growth, consumption capacity, commercial infrastructure, and market receptivity. Countries in Cluster 3 have a higher level of market intensity and economic freedom, but are lower in market receptivity. Countries in Cluster 1 are lower in consumption capacity, commercial infrastructure and market receptivity. Table 4 is the summary of cluster analysis. The overall R-square is 0.377, and the Pseudo F statistics is 88.6. Countries in the emerging markets are concentrated into Cluster 1 (frequency=94), Cluster 5 (frequency=69), and Cluster 6 (frequency=88). From Table 4, it is found that both Cluster 5 and Cluster 6 are closely related to Cluster 1. Cluster 7 is closely related to Cluster 5, while Cluster 4 is closely related to Cluster 1. Also, Cluster 2, Cluster 3 and Cluster 8 are closely related to each other. Table 5 shows the clusters where each country is involved in different years.
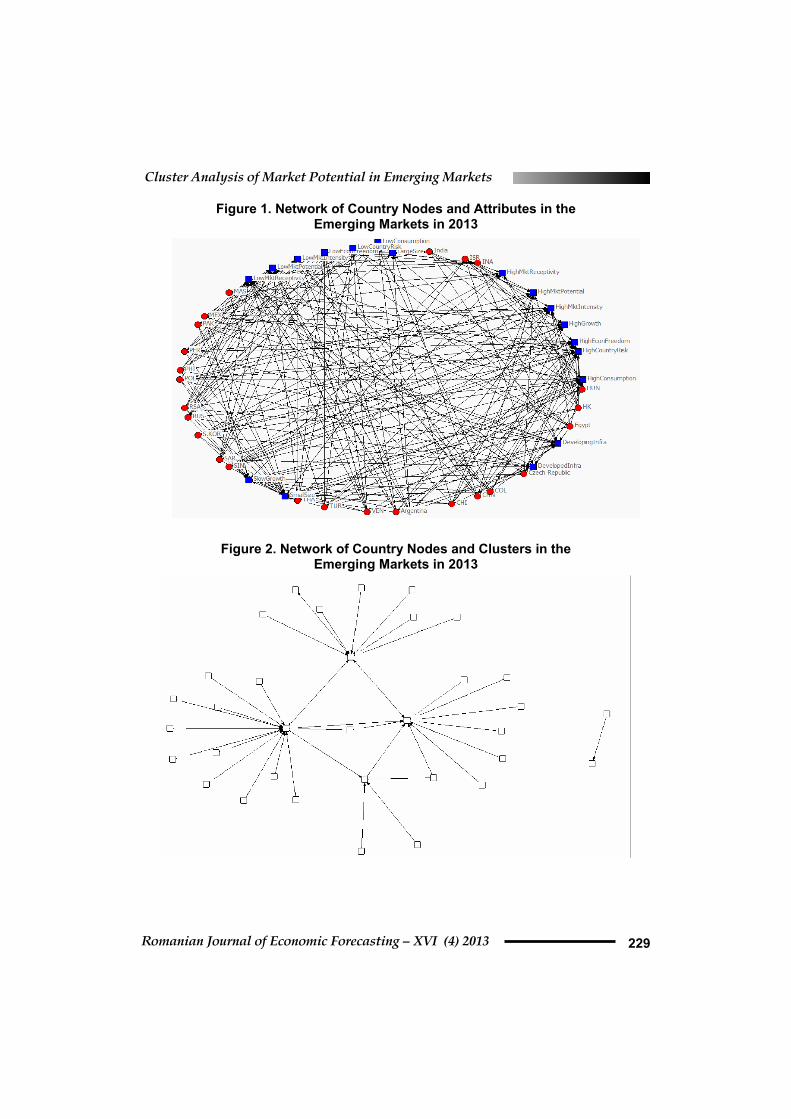
4.2. Relationships between Country Nodes and Attributes The relationships between different country nodes and their attributes are further visualized in a 2-Mode network (Figure 1). Figure 1 shows that higher level of market potential in the emerging markets is closely related to higher level of market intensity, market growth rate, market receptivity, market consumption capacity, and economic freedom, but also to a higher level of country risk. It is also found that lower level of market potential in the emerging markets is closely related to lower level of market receptivity, market intensity, market commercial infrastructure, economic freedom, market consumption capacity, but also to a lower level of country risk. Figure 2 shows the network of different countries and clusters in 2013. The relationship between countries and their clusters are generated from data in 2013. The
Institute for Economic Forecasting
Romanian Journal of Economic Forecasting –XVI (4) 2013 224
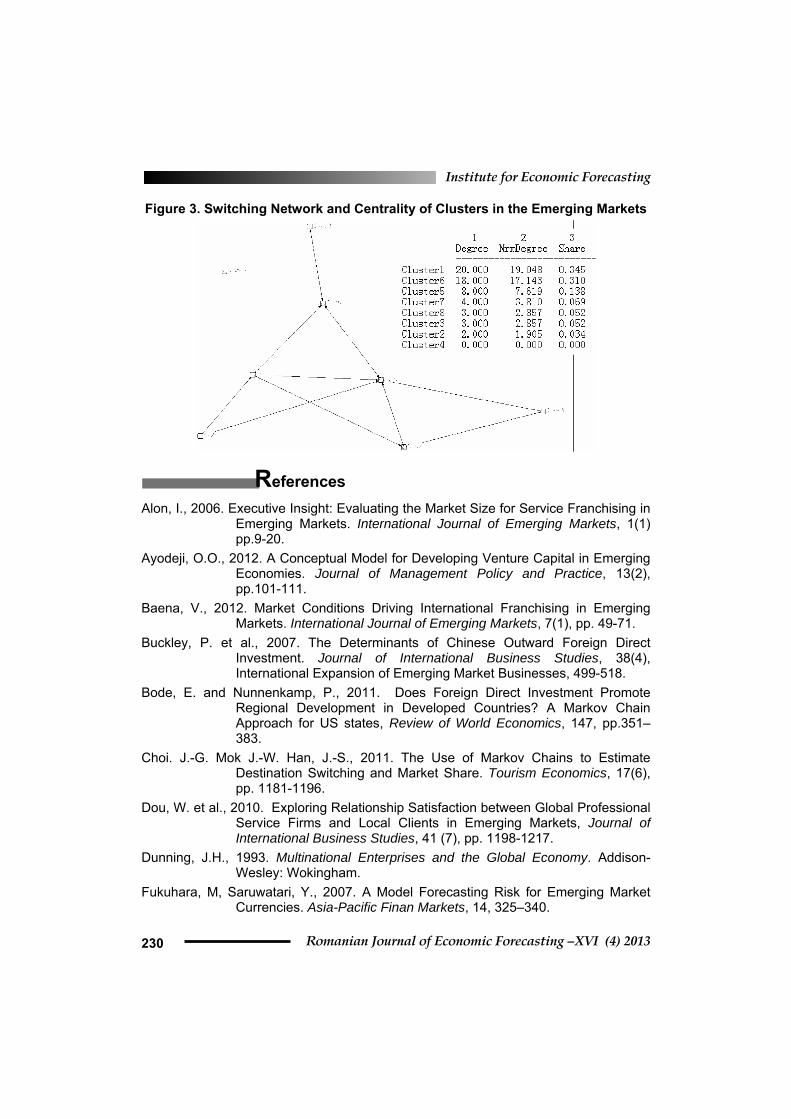
relationship between different clusters is generated from Nij. It is found that Cluster 1, Cluster 5 and Cluster 6 are in the central position of the network. Cluster 1 is closely related to countries such as India and Brazil. Cluster 5 is closely related to countries such as Hungary and Poland. Cluster 6 is closely related to countries such as Russian Federation and Thailand. Furthermore, Cluster 3 and Cluster 7, such as Hong Kong and Singapore, are in the position between Cluster 1 and Cluster 5, and Cluster 8 is usually transformed into Cluster 7, while Cluster 2 is only closely related to Cluster 6. As a special case, China is the only country involved in Cluster 4, and it is independent from other clusters. To understand further the transformation of countries from one cluster to another in the emerging markets, the Markov chain model is performed to analyze the switching probabilities between different clusters. Figure 3 further reveals the network of different clusters switching from each other in the emerging markets and the centrality degree of different cluster. It is found that Cluster 1 is at a top level of centrality, while Cluster 6 and Cluster 5 are also in central positions. In addition, the relationships between different clusters can be further visualized in Figure 3.
4.3. Estimation of Switching Probabilities in Different Clusters The numbers of countries that switch from Cluster i to Cluster j are as follows:
⎟⎟⎟⎟⎟⎟⎟⎟⎟⎟⎟
⎠
⎞
⎜⎜⎜⎜⎜⎜⎜⎜⎜⎜⎜
⎝
⎛
=
⎟⎟⎟⎟⎟⎟
⎠
⎞
⎜⎜⎜⎜⎜⎜
⎝
⎛
=
5201000001101000000511001150015400020000900000020301002000000112300050
882818
822212
812111
cccccc
cccccc
cccccc
ij
NNN
NNNNNN
N
L
MOMM
L
L
The switching probabilities matrix of countries in emerging market, P(switch), is:
⎟⎟⎟⎟⎟⎟⎟⎟⎟⎟⎟
⎠
⎞
⎜⎜⎜⎜⎜⎜⎜⎜⎜⎜⎜
⎝
⎛
=
⎟⎟⎟⎟⎟⎟
⎠
⎞
⎜⎜⎜⎜⎜⎜
⎝
⎛
=
0.6250.2500.125000000.91700.08300000075.0015.000015.0221.000021.0938.00000.04200001000
000333.005.00167.000100000
0015.0182.0046.0000758.0
882818
822212
812111
)(
cccccc
cccccc
cccccc
switch
PPP
PPPPPP
P
L
MOMM
L
L
The frequency and probabilities of different clusters in 2013, P(2013), is: ( )025610010
)821 ,,()2013( == cccNN L
( )0083.0208.025.0042.000417.0/)2013( == ∑ ii cc NNP The estimation of probabilities in different clusters for 2014, P(2014), is:
( )0083.0237.0263.0042.00003.0372.0* )())2013()2014( == switchPPP The estimation of probabilities for different clusters in a stationary distribution is:
Cluster Analysis of Market Potential in Emerging Markets
Romanian Journal of Economic Forecasting – XVI (4) 2013 225
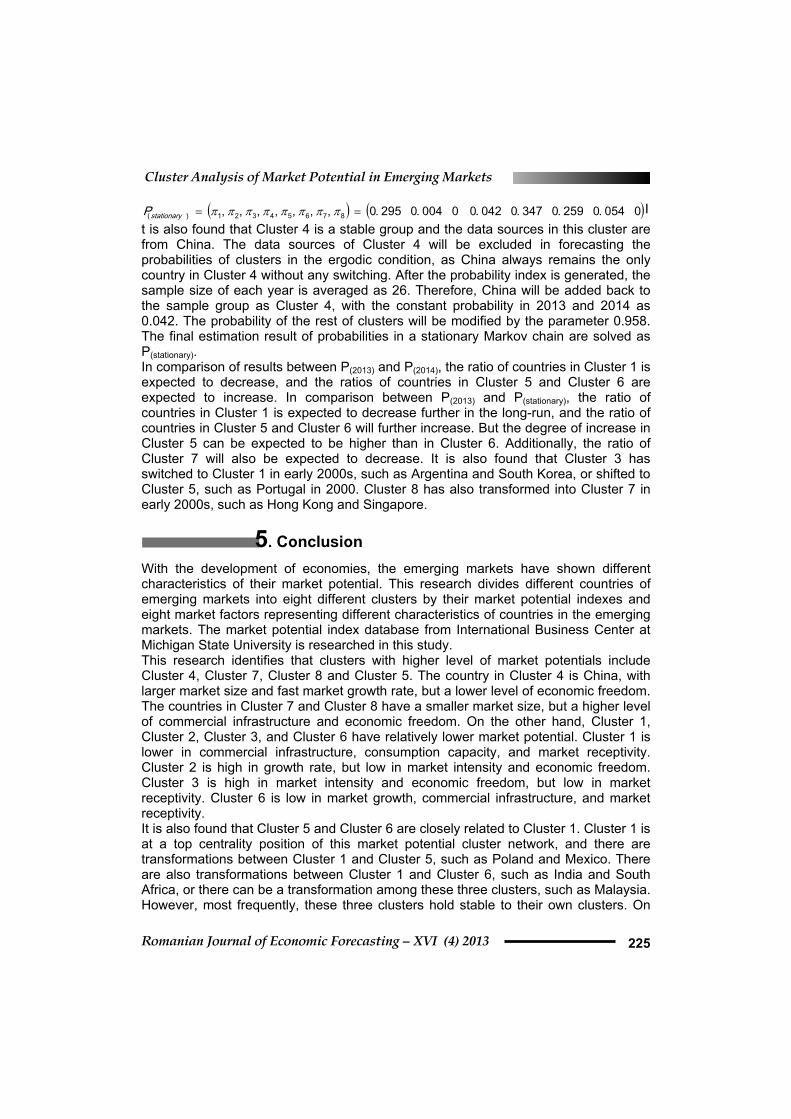
( ) ( )0054.0259.0347.0042.00004.0295.0,,,,,,, 87654321)( == ππππππππstationaryP It is also found that Cluster 4 is a stable group and the data sources in this cluster are from China. The data sources of Cluster 4 will be excluded in forecasting the probabilities of clusters in the ergodic condition, as China always remains the only country in Cluster 4 without any switching. After the probability index is generated, the sample size of each year is averaged as 26. Therefore, China will be added back to the sample group as Cluster 4, with the constant probability in 2013 and 2014 as 0.042. The probability of the rest of clusters will be modified by the parameter 0.958. The final estimation result of probabilities in a stationary Markov chain are solved as P(stationary). In comparison of results between P(2013) and P(2014), the ratio of countries in Cluster 1 is expected to decrease, and the ratios of countries in Cluster 5 and Cluster 6 are expected to increase. In comparison between P(2013) and P(stationary), the ratio of countries in Cluster 1 is expected to decrease further in the long-run, and the ratio of countries in Cluster 5 and Cluster 6 will further increase. But the degree of increase in Cluster 5 can be expected to be higher than in Cluster 6. Additionally, the ratio of Cluster 7 will also be expected to decrease. It is also found that Cluster 3 has switched to Cluster 1 in early 2000s, such as Argentina and South Korea, or shifted to Cluster 5, such as Portugal in 2000. Cluster 8 has also transformed into Cluster 7 in early 2000s, such as Hong Kong and Singapore.
5. Conclusion
With the development of economies, the emerging markets have shown different characteristics of their market potential. This research divides different countries of emerging markets into eight different clusters by their market potential indexes and eight market factors representing different characteristics of countries in the emerging markets. The market potential index database from International Business Center at Michigan State University is researched in this study. This research identifies that clusters with higher level of market potentials include Cluster 4, Cluster 7, Cluster 8 and Cluster 5. The country in Cluster 4 is China, with larger market size and fast market growth rate, but a lower level of economic freedom. The countries in Cluster 7 and Cluster 8 have a smaller market size, but a higher level of commercial infrastructure and economic freedom. On the other hand, Cluster 1, Cluster 2, Cluster 3, and Cluster 6 have relatively lower market potential. Cluster 1 is lower in commercial infrastructure, consumption capacity, and market receptivity. Cluster 2 is high in growth rate, but low in market intensity and economic freedom. Cluster 3 is high in market intensity and economic freedom, but low in market receptivity. Cluster 6 is low in market growth, commercial infrastructure, and market receptivity. It is also found that Cluster 5 and Cluster 6 are closely related to Cluster 1. Cluster 1 is at a top centrality position of this market potential cluster network, and there are transformations between Cluster 1 and Cluster 5, such as Poland and Mexico. There are also transformations between Cluster 1 and Cluster 6, such as India and South Africa, or there can be a transformation among these three clusters, such as Malaysia. However, most frequently, these three clusters hold stable to their own clusters. On
Institute for Economic Forecasting
Romanian Journal of Economic Forecasting –XVI (4) 2013 226
the other hand, Cluster 8 is frequently transformed into Cluster 7, such as Hong Kong and Singapore. Cluster 3 is likely to be transformed into Cluster 1 or Cluster 5, while Cluster 2 usually switches to Cluster 6. Notably, China is a special case and also the only country that is involved in Cluster 4, always remaining stable in a relatively independent position. A 2-Mode network is developed to visualize the relationship of countries and their market potential attributes. It is also found that a higher level of market intensity, market growth rate, market receptivity, consumption capacity, and economic freedom is closely related to a higher level of market potential in the emerging market, but also accompanied by a higher level of country risk. A lower level of market receptivity, market intensity, commercial infrastructure, and economic freedom is closely related to a lower level of market potential in the emerging markets. This research further estimates the switching probability between different clusters in the emerging market by using the Markov chain model. By estimating the switching probability of countries in different clusters across emerging markets from 2000 to 2011, the probability of each cluster in 2014 is forecasted based on the market potential database in 2013. In comparison, it is found that the ratio of countries in Cluster 1 is expected to decrease, while the ratios of countries in Cluster 5 and Cluster 6 are expected to increase. By further estimating probabilities of each cluster in a long-term stationary Markov chain, it is found that the ratio in Cluster 1 can further decrease, and ratios in Cluster 5 and Cluster 6 can further increase, but the increasing rate of Cluster 5 can be higher than the rate of Cluster 6. The ratio of countries in Cluster 7 is expected to decrease in long-term estimation as well.
Table 1 Initial Seed of Clusters in the Emerging Markets
Clus Size Grow Intens Consum Infrastr Freedom Receptivity Risk Potential 1 -0.485 1.739 0.951 -0.427 -1.223 1.092 -0.335 0.966 -0.397 2 -0.342 0.518 -2.327 4.030 -0.018 -1.541 -0.248 0.633 -0.882 3 -0.294 -1.352 1.551 4.030 -0.055 1.129 -0.680 -1.199 -0.519 4 4.188 1.892 -2.327 -0.192 -1.478 -2.060 -0.507 -1.074 0.450 5 -0.056 -0.933 0.120 -0.368 0.128 0.276 2.860 0.175 0.208 6 1.804 -1.696 -1.265 -0.273 0.237 -0.725 -0.464 -1.907 -0.962 7 -0.532 1.319 2.244 -0.255 1.807 1.314 3.594 1.716 2.428 8 -0.532 -0.322 0.720 4.030 1.369 0.869 3.594 0.217 2.226
Table 2
Cluster Means of Countries in Emerging Markets Clus Size Grow Intens Consum Infrastr Freedom Receptivity Risk Potential
1 -0.085 0.625 -0.114 -0.292 -0.578 0.086 -0.248 -0.158 -0.236 2 -0.246 1.033 -1.104 4.030 -0.438 -0.929 -0.313 0.009 -0.841 3 -0.294 0.076 1.254 4.030 0.071 0.880 -0.477 -0.033 -0.138 4 4.188 1.542 -2.212 -0.218 -0.590 -2.017 -0.507 0.088 1.425 5 -0.409 -0.657 0.364 -0.146 0.992 0.889 0.060 0.676 0.491 6 0.018 -0.494 -0.342 -0.275 -0.534 -0.842 -0.489 -0.923 -0.864 7 -0.501 0.185 1.492 -0.232 1.606 0.949 2.868 2.010 1.860 8 -0.503 0.694 1.101 4.030 1.424 0.934 2.574 1.555 2.049
Cluster Analysis of Market Potential in Emerging Markets
Romanian Journal of Economic Forecasting – XVI (4) 2013 227
Table 3 Cluster Standard Deviation of Countries in Emerging Markets
Clus Size Grow Intens Consum Infrastr Freedom Receptivity Risk Potential 1 0.543 0.775 0.793 0.120 0.608 0.714 0.454 0.556 0.534 2 0.135 0.729 1.730 0.000 0.594 0.865 0.092 0.883 0.057 3 0.187 1.289 0.540 0.000 0.867 0.517 0.239 1.311 0.754 4 0.000 0.697 0.303 0.036 0.442 0.093 0.104 0.427 0.705 5 0.170 0.722 0.676 0.108 0.553 0.431 0.460 0.393 0.607 6 0.652 0.741 0.684 0.107 0.684 0.637 0.202 0.671 0.468 7 0.135 0.932 0.869 0.072 0.273 0.334 0.966 0.244 0.629 8 0.067 0.775 0.892 0.000 0.413 0.304 1.230 0.692 0.450
Table 4
Summary of Cluster Analysis in Emerging Markets Cluster Frequency RMS Std
Deviation Max Dist
from Seed Nearest Cluster
Dist Btwn Clust Centr
1 94 0.598 3.059 6 1.793 2 2 0.777 1.649 3 3.246 3 7 0.771 3.048 2 3.246 4 12 0.405 1.675 1 5.552 5 69 0.500 2.868 1 2.536 6 88 0.581 3.348 1 1.793 7 18 0.598 3.042 5 3.730 8 8 0.655 2.569 3 4.347
Variable Total STD Within STD R-Square RSQ/(1-RSQ) Size 1 0.481 0.774 3.432 Growth 1 0.774 0.415 0.708 Intensity 1 0.730 0.480 0.924 Consumption 1 0.106 0.989 90.498 Infrastructure 1 0.603 0.645 1.820 Freedom 1 0.588 0.662 1.963 Receptivity 1 0.470 0.784 3.638 Risk 1 0.575 0.677 2.095 Potential 1 0.550 0.705 2.391 OVER-ALL 1 0.571 0.681 2.139
Table 5
Summary of Cluster Analysis in the Emerging Markets CY Year C CY Year C CY Year C CY Year C CY Year C
ARG 2000 3 BRA 2000 6 CHI 2000 1 CHN 2000 4 CZE 2000 5 ARG 2001 3 BRA 2001 6 CHI 2001 1 CHN 2001 4 CZE 2001 5 ARG 2002 3 BRA 2002 6 CHI 2002 1 CHN 2002 4 CZE 2002 5 ARG 2003 3 BRA 2003 1 CHI 2003 1 CHN 2003 4 CZE 2003 5 ARG 2004 1 BRA 2004 1 CHI 2004 1 CHN 2004 4 CZE 2004 5 ARG 2005 6 BRA 2005 6 CHI 2005 1 CHN 2005 4 CZE 2005 5 ARG 2007 6 BRA 2007 6 CHI 2007 5 CHN 2007 4 CZE 2007 5 ARG 2008 6 BRA 2008 6 CHI 2008 5 CHN 2008 4 CZE 2008 5
Institute for Economic Forecasting
Romanian Journal of Economic Forecasting –XVI (4) 2013 228
CY Year C CY Year C CY Year C CY Year C CY Year C ARG 2009 6 BRA 2009 6 CHI 2009 5 CHN 2009 4 CZE 2009 5 ARG 2010 6 BRA 2010 1 CHI 2010 5 CHN 2010 4 CZE 2010 5 ARG 2011 1 BRA 2011 1 CHI 2011 5 CHN 2011 4 CZE 2011 5 ARG 2013 1 BRA 2013 1 CHI 2013 5 CHN 2013 4 CZE 2013 5 H.K. 2000 8 HUN 2000 5 IND 2000 1 INA 2000 6 ISR 2000 5 H.K. 2001 8 HUN 2001 5 IND 2001 6 INA 2001 6 ISR 2001 5 H.K. 2002 8 HUN 2002 5 IND 2002 6 INA 2002 6 ISR 2002 5 H.K. 2003 7 HUN 2003 5 IND 2003 1 INA 2003 1 ISR 2003 5 H.K. 2004 7 HUN 2004 5 IND 2004 1 INA 2004 1 ISR 2004 5 H.K. 2005 7 HUN 2005 5 IND 2005 1 INA 2005 6 ISR 2005 5 H.K. 2007 7 HUN 2007 5 IND 2007 1 INA 2007 6 ISR 2007 5 H.K. 2008 7 HUN 2008 5 IND 2008 6 INA 2008 6 ISR 2008 5 H.K. 2009 7 HUN 2009 5 IND 2009 6 INA 2009 6 ISR 2009 5 H.K. 2010 7 HUN 2010 5 IND 2010 1 INA 2010 1 ISR 2010 5 H.K. 2011 7 HUN 2011 5 IND 2011 1 INA 2011 1 ISR 2011 5 H.K. 2013 7 HUN 2013 5 IND 2013 1 INA 2013 1 ISR 2013 5 MAS 2000 1 MEX 2000 1 PHI 2000 1 POL 2000 1 RUS 2000 6 MAS 2001 1 MEX 2001 1 PHI 2001 1 POL 2001 1 RUS 2001 6 MAS 2002 1 MEX 2002 1 PHI 2002 6 POL 2002 5 RUS 2002 6 MAS 2003 1 MEX 2003 1 PHI 2003 1 POL 2003 1 RUS 2003 6 MAS 2004 1 MEX 2004 1 PHI 2004 1 POL 2004 5 RUS 2004 6 MAS 2005 1 MEX 2005 1 PHI 2005 6 POL 2005 5 RUS 2005 6 MAS 2007 1 MEX 2007 5 PHI 2007 6 POL 2007 5 RUS 2007 6 MAS 2008 5 MEX 2008 5 PHI 2008 6 POL 2008 5 RUS 2008 6 MAS 2009 5 MEX 2009 5 PHI 2009 6 POL 2009 5 RUS 2009 6 MAS 2010 6 MEX 2010 5 PHI 2010 6 POL 2010 5 RUS 2010 6 MAS 2011 5 MEX 2011 1 PHI 2011 6 POL 2011 5 RUS 2011 6 MAS 2013 1 MEX 2013 1 PHI 2013 6 POL 2013 5 RUS 2013 6 SIN 2000 8 RSA 2000 1 S.KOR 2000 3 THA 2000 1 TUR 2000 2 SIN 2001 8 RSA 2001 1 S.KOR 2001 1 THA 2001 1 TUR 2001 6 SIN 2002 8 RSA 2002 1 S.KOR 2002 1 THA 2002 1 TUR 2002 1 SIN 2003 8 RSA 2003 1 S.KOR 2003 7 THA 2003 1 TUR 2003 1 SIN 2004 7 RSA 2004 1 S.KOR 2004 5 THA 2004 1 TUR 2004 1 SIN 2005 7 RSA 2005 1 S.KOR 2005 5 THA 2005 1 TUR 2005 1 SIN 2007 7 RSA 2007 1 S.KOR 2007 5 THA 2007 1 TUR 2007 1 SIN 2008 7 RSA 2008 1 S.KOR 2008 5 THA 2008 6 TUR 2008 6 SIN 2009 7 RSA 2009 6 S.KOR 2009 5 THA 2009 6 TUR 2009 1 SIN 2010 7 RSA 2010 1 S.KOR 2010 5 THA 2010 6 TUR 2010 1 SIN 2011 7 RSA 2011 6 S.KOR 2011 5 THA 2011 1 TUR 2011 1 SIN 2013 7 RSA 2013 1 S.KOR 2013 5 THA 2013 6 TUR 2013 1 VEN 2000 1 COL 2002 6 EGY 2002 6 PER 2002 1 PAK 2007 6 VEN 2001 6 COL 2003 6 EGY 2003 1 PER 2003 1 PAK 2008 6 VEN 2002 6 COL 2004 6 EGY 2004 1 PER 2004 1 PAK 2009 6 VEN 2003 6 COL 2005 6 EGY 2005 1 PER 2005 1 PAK 2010 6 VEN 2004 6 COL 2007 6 EGY 2007 6 PER 2007 6 PAK 2011 6 VEN 2005 6 COL 2008 6 EGY 2008 6 PER 2008 6 PAK 2013 6 VEN 2007 6 COL 2009 6 EGY 2009 6 PER 2009 1 SAR 2007 6 VEN 2008 6 COL 2010 6 EGY 2010 6 PER 2010 1 SAR 2008 2 VEN 2009 6 COL 2011 1 EGY 2011 6 PER 2011 1 SAR 2009 6 VEN 2010 6 COL 2013 1 EGY 2013 6 PER 2013 1 SAR 2013 1 VEN 2011 6 GRE 2000 3 POR 2000 3 TWN 2007 8 VEN 2013 6 GRE 2001 5 POR 2001 5 TWN 2008 5
Cluster Analysis of Market Potential in Emerging Markets
Romanian Journal of Economic Forecasting – XVI (4) 2013 229
Figure 1. Network of Country Nodes and Attributes in the Emerging Markets in 2013
Figure 2. Network of Country Nodes and Clusters in the Emerging Markets in 2013
Institute for Economic Forecasting
Romanian Journal of Economic Forecasting –XVI (4) 2013 230
Figure 3. Switching Network and Centrality of Clusters in the Emerging Markets
References
Alon, I., 2006. Executive Insight: Evaluating the Market Size for Service Franchising in Emerging Markets. International Journal of Emerging Markets, 1(1) pp.9-20.
Ayodeji, O.O., 2012. A Conceptual Model for Developing Venture Capital in Emerging Economies. Journal of Management Policy and Practice, 13(2), pp.101-111.
Baena, V., 2012. Market Conditions Driving International Franchising in Emerging Markets. International Journal of Emerging Markets, 7(1), pp. 49-71.
Buckley, P. et al., 2007. The Determinants of Chinese Outward Foreign Direct Investment. Journal of International Business Studies, 38(4), International Expansion of Emerging Market Businesses, 499-518.
Bode, E. and Nunnenkamp, P., 2011. Does Foreign Direct Investment Promote Regional Development in Developed Countries? A Markov Chain Approach for US states, Review of World Economics, 147, pp.351–383.
Choi. J.-G. Mok J.-W. Han, J.-S., 2011. The Use of Markov Chains to Estimate Destination Switching and Market Share. Tourism Economics, 17(6), pp. 1181-1196.
Dou, W. et al., 2010. Exploring Relationship Satisfaction between Global Professional Service Firms and Local Clients in Emerging Markets, Journal of International Business Studies, 41 (7), pp. 1198-1217.
Dunning, J.H., 1993. Multinational Enterprises and the Global Economy. Addison-Wesley: Wokingham.
Fukuhara, M, Saruwatari, Y., 2007. A Model Forecasting Risk for Emerging Market Currencies. Asia-Pacific Finan Markets, 14, 325–340.

Cluster Analysis of Market Potential in Emerging Markets
Romanian Journal of Economic Forecasting – XVI (4) 2013 231
Lee, Li, 2003. Determinants of export channel intensity in emerging markets: The British experience in China. Asia Pacific Journal of Management, 20 (4), pp. 501-516.
Lipták, K., 2011. The Application of Markov Chain Model to the Description of Hungarian Labor Market Processes. Zarzadzanie Publiczne, 16, pp.133-149.
Lu, S.-L. and Kuo, C.-J., 2006. The Default Probability of Bank Loans in Taiwan: An Empirical Investigation by the Markov Chain Model. Asia Pacific Management Review, 11 (2), pp. 111-122.
Mahajan, V. Sharma, S. Buzzell, R.D., 1993. Assessing the Impact of Competitive Entry on Market Expansion and Incumbent Sales. Journal of Marketing, 57 (3), pp. 39-52.
Malhotra, S. and Sivakumar, K., 2011. Simultaneous Determination of Optimal Cultural Distance and Market Potential in International Market Entry, International Marketing Review, 28(6), pp.601-626.
Malhotra, S. et al., 2009. Distance Factors and Target Market Selection: the Moderating Effect of Market Potential. International Marketing Review, 26(6), pp. 651-673.
Netzer, O. Lattin, J.M. and Srinivasan, V., 2008. A Hidden Markov Model of Customer Relationship Dynamics. Marketing Science, 27(2), pp. 185-204.
Otter, P.W., 2006. On Dynamic Selection of Households for Direct Marketing based on Markov Chain Models with Memory, Market Letter, 18, 73-84
Perks, K.J. Hogan, S.P. and Shukla, P., 2013. The Effect of Multi-level Factors on MNEs' Market Entry Success in a Small Emerging Market. Asia Pacific Journal of Marketing and Logistics, 25(1),pp.131-143.
Putler, D.S. et al., 1996. A Bayesian Approach for Estimating Target Market Potential with Limited Geodemographic Information. Journal of Marketing Research, 33 (2), pp. 134-149.
Rugman, A.M. and Verbeke, A., 1992. A Note on the Transnational Solution and the Transaction Cost Theory of Multinational Strategic Management. Journal of International Business Studies, 23(4), pp.761-771.
Tiwari, P., Itou, H. Doi, M., 2003. Shippers' Port and Carrier Selection Behaviour in China: A Discrete Choice Analysis. Maritime Economics & Logistics, 5(1), pp. 23-29.
Vernon, R., 1979. The Product Cycle Hypothesis in a New International Environment. Oxford Bulletin of Economics and Statistics, 41(4), pp. 255~267
Waheeduzzaman, A.N.M. and Rau, P.A., 2006. Market Potential and Foreign Direct Investment: Exploring the Relationship in Emerging Markets. Advances in Competitiveness Research ,14(1), pp.44-60.
Williamson, N.C. et al., 2005. Import Market Competitiveness and Add/Drop Foreign Market Decision. Competitiveness Review, 15(1), pp. 57-71.
Related Documents