16-1 pyright © 2004 by Nelson, a division of Thomson Canada Limited. Financial Financial Performance Performance Evaluation and Evaluation and Transfer Transfer Pricing in the Pricing in the Decentralized Decentralized Firm Firm 1 1 6 6 PowerPresentation® prepared by PowerPresentation® prepared by David J. McConomy, Queen’s David J. McConomy, Queen’s University University

16-1 Copyright © 2004 by Nelson, a division of Thomson Canada Limited. Financial Performance Evaluation and Transfer Pricing in the Decentralized Firm.
Dec 22, 2015
Welcome message from author
This document is posted to help you gain knowledge. Please leave a comment to let me know what you think about it! Share it to your friends and learn new things together.
Transcript

16-1Copyright © 2004 by Nelson, a division of Thomson Canada Limited.
Financial Financial Performance Performance Evaluation and Evaluation and Transfer Pricing in Transfer Pricing in the Decentralized the Decentralized FirmFirm
1616
PowerPresentation® prepared by PowerPresentation® prepared by
David J. McConomy, Queen’s UniversityDavid J. McConomy, Queen’s University

16-2Copyright © 2004 by Nelson, a division of Thomson Canada Limited.
Learning ObjectivesLearning Objectives
Define responsibility accounting and
describe four types of responsibility
centres.
Explain why companies decentralize.
16-3Copyright © 2004 by Nelson, a division of Thomson Canada Limited.
Learning ObjectivesLearning Objectives
Compute and interpret return on investment (ROI), residual income (RI)
and economic value added (EVA).
Explain the role of transfer pricing in decentralized companies.

16-4Copyright © 2004 by Nelson, a division of Thomson Canada Limited.
Responsibility AccountingResponsibility Accounting
Responsibility accounting is a system that measures the results of each responsibility centre according to the information managers need to operate their centres.
There are four major types of responsibility centres:
• Cost centre
• Revenue centre
• Profit centre
• Investment centre

16-5Copyright © 2004 by Nelson, a division of Thomson Canada Limited.
Decentralization: The Major IssuesDecentralization: The Major Issues
The degree of decentralization
Performance measurement
Management compensation
The setting of transfer prices

16-6Copyright © 2004 by Nelson, a division of Thomson Canada Limited.
Reasons for DecentralizationReasons for Decentralization
There are many reasons to explain why firms decide to decentralize, including:
1. Utilization of local information
2. Strategic focus of central management
3. Training and motivational opportunities for managers
4. Enhanced competition among divisions
16-7Copyright © 2004 by Nelson, a division of Thomson Canada Limited.
Measuring the Performance of Measuring the Performance of Investment CentresInvestment Centres
Return on Investment (ROI)
Residual Income (RI)
Economic Value Added (EVA)
16-8Copyright © 2004 by Nelson, a division of Thomson Canada Limited.
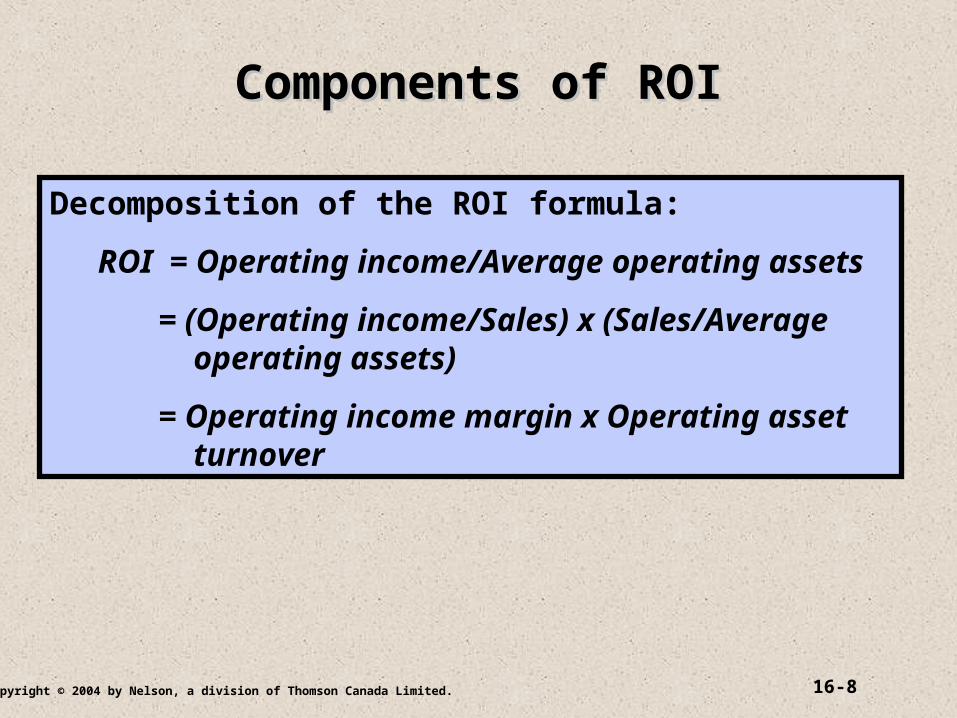
Components of ROIComponents of ROI
Decomposition of the ROI formula:
ROI = Operating income/Average operating assets
= (Operating income/Sales) x (Sales/Average operating assets)
= Operating income margin x Operating asset turnover
16-9Copyright © 2004 by Nelson, a division of Thomson Canada Limited.
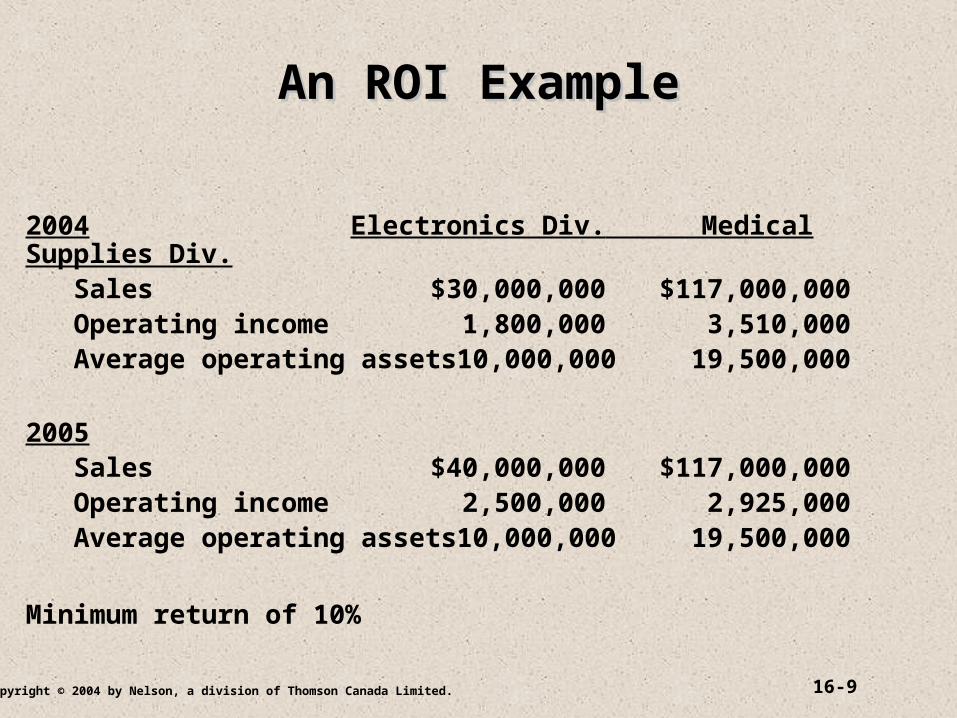
An ROI ExampleAn ROI Example
2004 Electronics Div. Medical Supplies Div. Sales $30,000,000 $117,000,000 Operating income 1,800,000 3,510,000 Average operating assets 10,000,000 19,500,000
2005 Sales $40,000,000 $117,000,000 Operating income 2,500,000 2,925,000 Average operating assets 10,000,000 19,500,000
Minimum return of 10%
16-10Copyright © 2004 by Nelson, a division of Thomson Canada Limited.
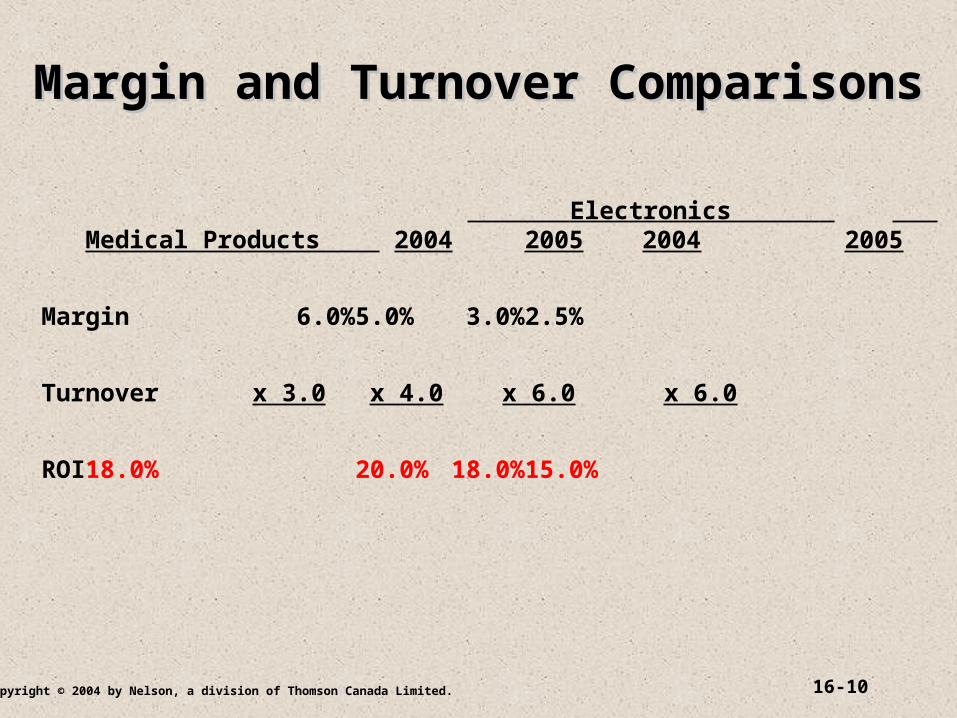
Margin and Turnover ComparisonsMargin and Turnover Comparisons
Electronics Medical Products 2004 2005 2004 2005
Margin 6.0% 5.0% 3.0% 2.5%
Turnover x 3.0 x 4.0 x 6.0 x 6.0
ROI 18.0% 20.0% 18.0% 15.0%
16-11Copyright © 2004 by Nelson, a division of Thomson Canada Limited.
Advantages of ROIAdvantages of ROI
Relationships among sales, expenses, and investments.
Cost efficiency.
Operating asset efficiency.

16-12Copyright © 2004 by Nelson, a division of Thomson Canada Limited.
Disadvantages of the ROI MeasureDisadvantages of the ROI Measure
Focus on divisional profitability at the expense of overall company profitability
Focus on the short term at the expense of the long term

16-13Copyright © 2004 by Nelson, a division of Thomson Canada Limited.
Components of RIComponents of RI
Decomposition of the RI formula:
RI = Operating income- (Minimum rate of return x Operating assets)
= Operating income – Minimum return on Assets

16-14Copyright © 2004 by Nelson, a division of Thomson Canada Limited.
An RI ExampleAn RI Example
Project 1 Project 2 Operating Income $1,300,000 $640,000 Average Operating Assets 10,000,000 4,000,000 Minimum Return 10% 10%
Residual Income $300,000 $240,000
Both projects have a positive residual income, take them both if funds are available.

16-15Copyright © 2004 by Nelson, a division of Thomson Canada Limited.
Advantages of Residual Income Advantages of Residual Income
Focus on accepting projects that are advantageous to the company
16-16Copyright © 2004 by Nelson, a division of Thomson Canada Limited.
Disadvantages of the RI MeasureDisadvantages of the RI Measure
Focus on the short term at the expense of the long term
An absolute measure of profitability makes it difficult to compare alternatives
16-17Copyright © 2004 by Nelson, a division of Thomson Canada Limited.
Economic Value AddedEconomic Value Added
Economic value added (EVA) is after-tax operating profit minus the total annual cost of capital.
EVA = After-tax operating income - (Weighted average cost of capital x total capital employed)
16-18Copyright © 2004 by Nelson, a division of Thomson Canada Limited.
Cost of CapitalCost of Capital
There are two steps involved in computing cost of capital:
1. determine the weighted average cost of capital (a percentage figure)
2. determine the total dollar amount of capital employed

16-19Copyright © 2004 by Nelson, a division of Thomson Canada Limited.
Weighted Average Weighted Average Cost of CapitalCost of Capital
Suppose that a company has two sources of financing: $2 million of long-term bonds paying 9 percent interest and $6 million of common stock, which is considered to be of average risk. If the company’s tax rate is 40 percent and the rate of interest on long-term government bonds is 6 percent, the company’s weighted average cost of capital is computed as follows:
Amount Percent x After-tax cost = Weighted Cost
Bonds $2,000,000 0.25 .09(1.0 - 0.4) = .054 0.0135
Equity 6,000,000 0.75 .06 + .06 = .120 0.0900
Total $8,000,000 0.1035======== =====
16-20Copyright © 2004 by Nelson, a division of Thomson Canada Limited.
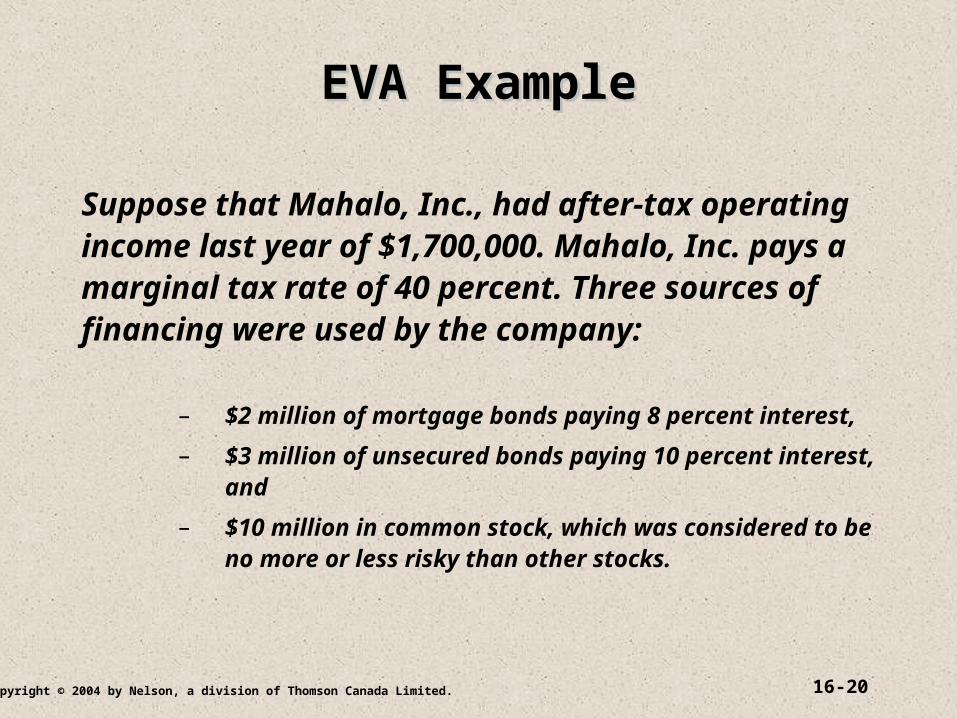
EVA ExampleEVA Example
Suppose that Mahalo, Inc., had after-tax operating income last year of $1,700,000. Mahalo, Inc. pays a marginal tax rate of 40 percent. Three sources of financing were used by the company:
– $2 million of mortgage bonds paying 8 percent interest,
– $3 million of unsecured bonds paying 10 percent interest, and
– $10 million in common stock, which was considered to be no more or less risky than other stocks.
16-21Copyright © 2004 by Nelson, a division of Thomson Canada Limited.
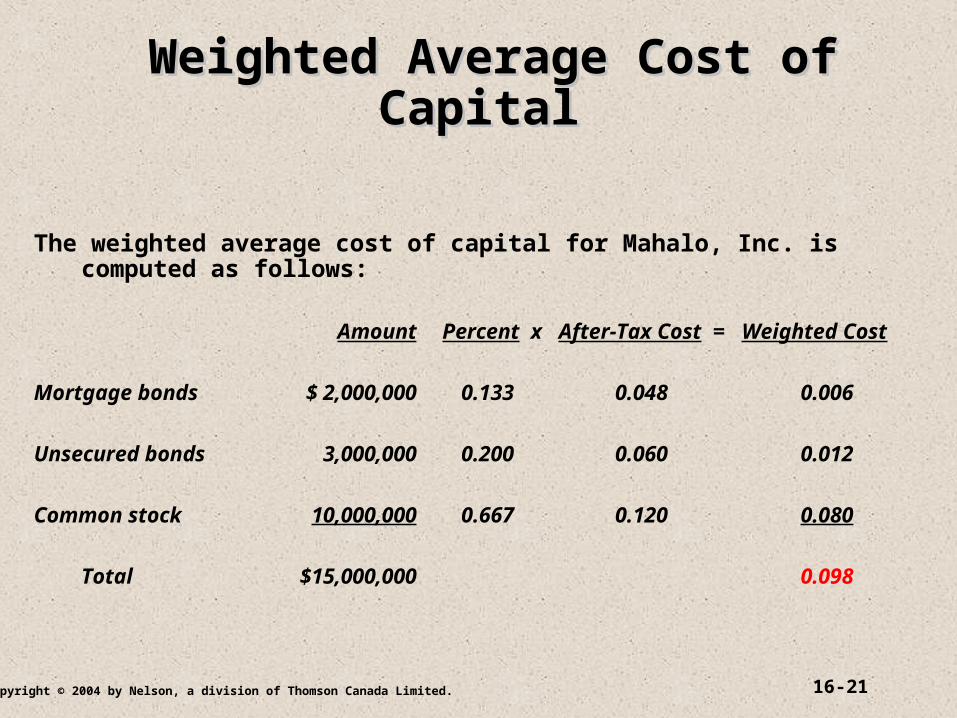
Weighted Average Cost of CapitalWeighted Average Cost of Capital
The weighted average cost of capital for Mahalo, Inc. is computed as follows:
Amount Percent x After-Tax Cost = Weighted Cost
Mortgage bonds $ 2,000,000 0.133 0.048 0.006
Unsecured bonds 3,000,000 0.200 0.060 0.012
Common stock 10,000,000 0.667 0.120 0.080
Total $15,000,000 0.098
========= ====
16-22Copyright © 2004 by Nelson, a division of Thomson Canada Limited.
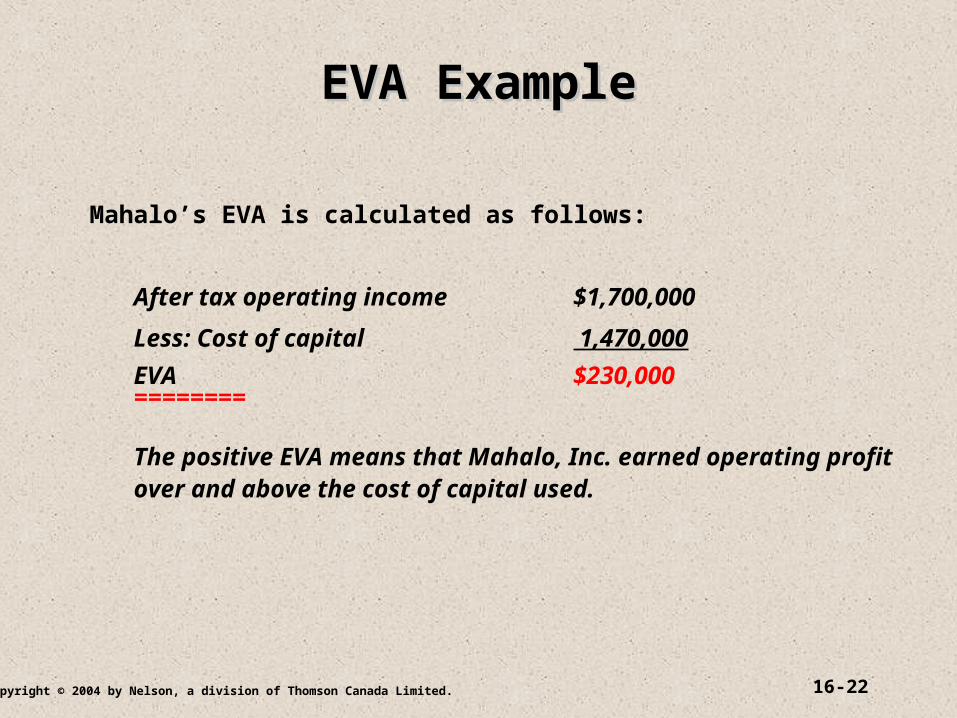
EVA ExampleEVA Example
Mahalo’s EVA is calculated as follows:
After tax operating income $1,700,000
Less: Cost of capital 1,470,000
EVA $230,000========
The positive EVA means that Mahalo, Inc. earned operating profit over and above the cost of capital used.

16-23Copyright © 2004 by Nelson, a division of Thomson Canada Limited.
Behavioural Aspects of EVABehavioural Aspects of EVA A number of companies have discovered that EVA
helps to encourage the right kind of behaviour from their divisions in a way that emphasis on operating income alone cannot. The underlying reason is EVA’s reliance on the true cost of capital.
In many companies, the responsibility for investment decisions rests with corporate management. As a result, the cost of capital is considered a corporate expense. If a division builds inventories and investment, the cost of financing that investment is passed along to the overall (corporate) income statement and does not show up as a reduction from the division’s operating income.
16-24Copyright © 2004 by Nelson, a division of Thomson Canada Limited.
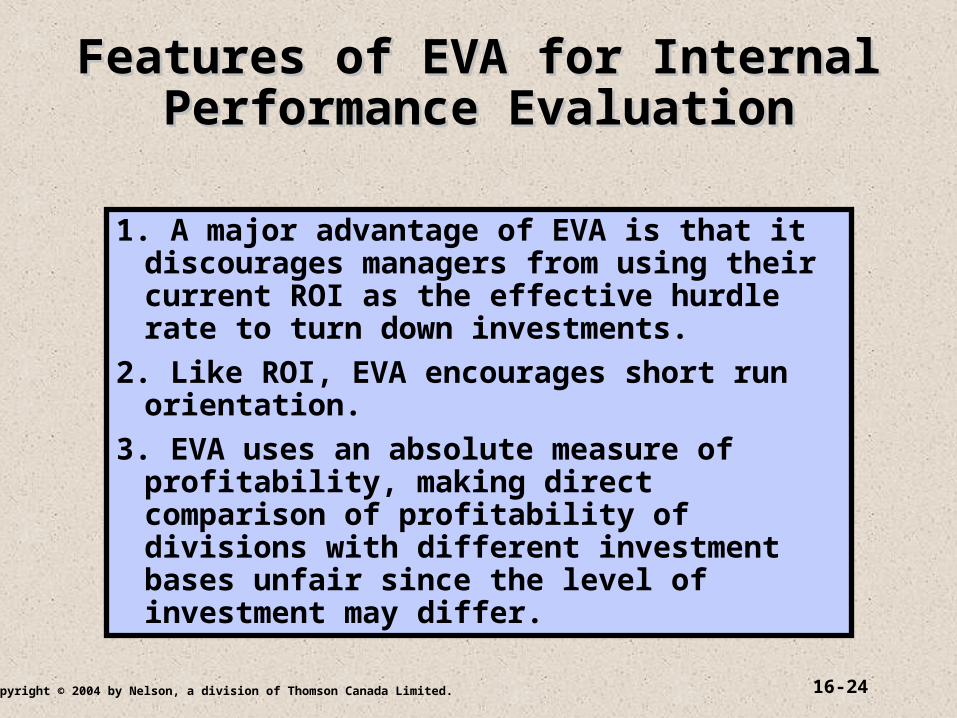
Features of EVA for Internal Features of EVA for Internal Performance EvaluationPerformance Evaluation
1. A major advantage of EVA is that it discourages managers from using their current ROI as the effective hurdle rate to turn down investments.
2. Like ROI, EVA encourages short run orientation.
3. EVA uses an absolute measure of profitability, making direct comparison of profitability of divisions with different investment bases unfair since the level of investment may differ.
16-25Copyright © 2004 by Nelson, a division of Thomson Canada Limited.
Multiple Performance MeasurementsMultiple Performance Measurements
Why have Multiple
Performance
Measures?
Tends to Focus on Long-run Discourages Myopic Behaviour

16-26Copyright © 2004 by Nelson, a division of Thomson Canada Limited.
Transfer PricingTransfer Pricing
The transferred good is revenue to the selling division and cost to the buying division. This value is called a transfer price.

16-27Copyright © 2004 by Nelson, a division of Thomson Canada Limited.
Some Major Issues
Transfer Pricing: General ConcernsTransfer Pricing: General Concerns
Impact on divisional performance measures
Impact on firm-wide profits
Impact on divisional autonomy

16-28Copyright © 2004 by Nelson, a division of Thomson Canada Limited.
Transfer Pricing ApproachesTransfer Pricing Approaches Market price Negotiated transfer prices Cost-based transfer prices
– Variable cost
– Full (absorption cost)
Transfer price = Variable cost per unit + Lost contribution per unit on outside sales
This relationship identifies the minimum and maximum transfer prices

16-29Copyright © 2004 by Nelson, a division of Thomson Canada Limited.
A Transfer Pricing ProblemA Transfer Pricing Problem
Assume the following data for Division A:
Capacity in units 50,000
Selling price to outside $15
Variable cost per unit 8
Fixed costs per unit (based on capacity) 5
Division B would like to purchase units for Division A. Division B is currently purchasing 5,000 units per year from and outside source at a cost of $14.
16-30Copyright © 2004 by Nelson, a division of Thomson Canada Limited.
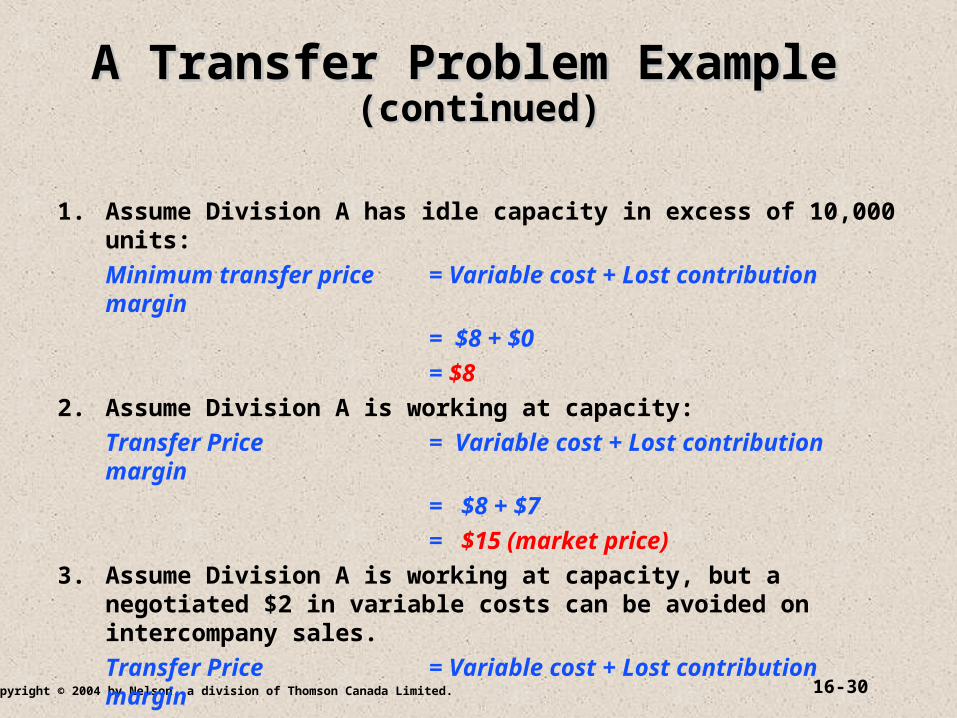
A Transfer Problem Example A Transfer Problem Example (continued)(continued)
1. Assume Division A has idle capacity in excess of 10,000 units:
Minimum transfer price = Variable cost + Lost contribution margin
= $8 + $0
= $8
2. Assume Division A is working at capacity:
Transfer Price = Variable cost + Lost contribution margin
= $8 + $7
= $15 (market price)
3. Assume Division A is working at capacity, but a negotiated $2 in variable costs can be avoided on intercompany sales.
Transfer Price = Variable cost + Lost contribution margin
= $6 + $7
= $13 (negotiated price)
Related Documents