Pulsed Ultrasonic Doppler Blood-Flow Sensing Abstract-Dopplerdetection of pulsed ultrasound is being used to map fluid flows in models and transcutaneously in blood vessels in man. A device has been developed and is being evaluated using I-ps bursts of 5 MHz ultrasound that are projected into the stream under study. The Doppler shift of the backscattered signals is sensed in a phase detector. This Doppler signal corresponds to the mean velocity over a small region in space defined by the ultrasonic beam dimensions, transmitted pulse duration, and transducer bandwidth. By using a comb-type gate and sequential sampling, the flow velocity profile can be mapped at selected intervals over one period of pulsatile flow in a model or in man. From this informa- tion, a three-dimensional surface is generated as a function of velocity, tube diameter, and time. Volume flow, stroke volume, and flow acceleration can be derived directly from the data. HE KEED for a quantitative transcutmeous method of volume-blood-flolv me:tsurement is bc- coming increasingly import:mt. 1Inr1y methods of blood-flow dr:tcction andmeasurementhuvebeent'ried, from plethysmography to nuclear magnetic resonance. These techniques lack the specificity required to sense flow at a p:lrticulnr site.UltrasonicDopplertechniques lmve the c:Lp:Lbility to overcome many of the limitations of these metllocls. I\rnon:ledge xbout the :mounts of oxygen being delivered to various regions of tlle body is : L factor t h t c:ln assist tlle clinicianinhis m:ln:qpntnt, of disease ant1 tr:Lum:t. Volume blood flow may be o11c of tlle best inclic:1tors of :ivailsble oxygen. It is also :III indicator of the ability of the heart tofunction as :L pump to maintnin normal body processes. Other fxtors of blood flow ma>- l~ve c1inic:ll signifie:u~ce. Tlle ;wxler:Ltion of t'he blood flow in t.ho :wending aorta or otller grwt vcssels nxry :rlso be \'er!* useful in :messing the performance of the heart. The velocity profile in the vessels affectrtd by :Lrterial occlusive disease nxay be an important vnri:tble to n1e:lsure nnd to understand. Continuous-wave ultrsonic Doppler motion detection was first demonstrated by Sntamurlr [l] in 19.56. Franldin et al. were t'he first to sl~ow the use of these techniques forblood-flt,\~--velocity detectioninanimalsin 1961 [a]. The first pr:tctic:d device intended for tr:ulscutnneous bloocl-flow-vclocity detection on m:~n \vas shown by Baker et al. [3] in 1961. Since that time, marly nunu- facturers tl~roughout tl~e n-orld Ilsve built ancl sold CW ultrasonic devices for many npplic:itions from fetal-llenrt- wall motion to blood-flow-velocity detection for pripheral vascular disease di:lgnosis. 3I:lny rcsearcllcrs have utilized these devices in their n-ork and hvc reported significant findings regardingthe circulation [4]-[G]. The scope of ultrasonic Doppler applications has increased and become more sophisticatcd. One of the principal limitations of the early continuous-wave Dopplers was their irubility to detect the direction of the flow velocity vector with respect to thetransducer.Andog recording of reversing blood flow t:rl;en with these devices nln-ays indicated the reversals as positive deflections. These flowmeters essent,i:dly rectified the flow w:hveform (Fig. 1). In 1966 JIcCleod demonstrated the first direction- sensing CW Doppler device. He used a version of qutLd- rature phase detection common to single sideband t,ech- niques to sep:u-at8e the upper : L I ~ lolver Doppler sidt:b:tnds from the carrier [7]. His systempresented the tlet'ectetl outputs of form:ml and reverse flow on sep:mtc~ ch:mwls. These could be combirml into :I single output that indic:lt,etl the dirwtion of the blood-flow velocity. Early n.orl;crs tllought the direction of blood flow in the pcripherxl vessels vxs uninlport:mt, particul:wly since man?; felt reversnls only existed :It the root of the :wending :wrta. This has since been shown to be an incorrect concept and, as :L consequence, direction-wnsing flowmeters have fomd erer-increasing use. Some typical n.nveforms are shon-n in E'ig. 2.' iit lcxstthree~n:~nnf:~cturersmarket, sucll devices, bwetl on 11cCleod's circuits, tllrougllout the I,Tnitcd St:Lt,e.: and Europe. ,Ilmost in par:lllel with the development of more effective instruments, c1inici:ms beg:rn to nslc more sopllisticated di:qqlostic questions. .Is tlleir untlcrst:tnding of d3m:rmic blood flow incrc:wxl,they found it important to 1;now vessel dinmlsions, i.e., the site of occhsims, vol~~~ne-flow rates, velocitS7 profiles, nntl volume profiles. The need for :L more pori-erful mensurenmlt method was slowly being defined. It should be kept in nlind t811nt up until now almost all use of these devices \vas qunlitntive, whether the Doppler sign& mre processed and recorded as de nu log waveforms or the clinician based his conclusions on list,eningto the detected Doppler signals. We nlmt conclude for t,he most pnrtthatthe devices currently avdable are not flowmeter;: but rather flow detectors and, further that they :m only velocity detect>or.s. Even a simple measurement of mean flow velocity requires that the anglebet\\-een the sound beam and tfhevelocityvector be known. Thereisonlyone known m:~y to determine thisangle \\-it11 :t CTW device and that involvesfinding the angle at which the Doppler shift is minimal, i.e., 9O0

Welcome message from author
This document is posted to help you gain knowledge. Please leave a comment to let me know what you think about it! Share it to your friends and learn new things together.
Transcript

Pulsed Ultrasonic Doppler Blood-Flow Sensing
Abstract-Doppler detection of pulsed ultrasound is being used to map fluid flows in models and transcutaneously in blood vessels in man. A device has been developed and is being evaluated using I-ps bursts of 5 MHz ultrasound that are projected into the stream under study. The Doppler shift of the backscattered signals is sensed in a phase detector. This Doppler signal corresponds to the mean velocity over a small region in space defined by the ultrasonic beam dimensions, transmitted pulse duration, and transducer bandwidth. By using a comb-type gate and sequential sampling, the flow velocity profile can be mapped at selected intervals over one period of pulsatile flow in a model or in man. From this informa- tion, a three-dimensional surface is generated as a function of velocity, tube diameter, and time. Volume flow, stroke volume, and flow acceleration can be derived directly from the data.
HE KEED for a quantitative transcutmeous method of volume-blood-flolv me:tsurement is bc- coming increasingly import:mt. 1Inr1y methods of
blood-flow dr:tcction and measurement huve been t'ried, from plethysmography to nuclear magnetic resonance. These techniques lack the specificity required to sense flow at a p:lrticulnr site. Ultrasonic Doppler techniques lmve the c:Lp:Lbility to overcome many of the limitations of these metllocls.
I\rnon:ledge xbout the :mounts of oxygen being delivered to various regions o f tlle body is :L factor t h t c:ln assist tlle clinician in his m:ln:qpntnt, o f disease ant1 tr:Lum:t. Volume blood flow may be o11c of tlle best inclic:1tors o f :ivailsble oxygen. It is also :III indicator of the ability of the heart to function as :L pump to maintnin normal body processes.
Other fx to r s of blood flow ma>- l ~ v e c1inic:ll signifie:u~ce. Tlle ;wxler:Ltion of t'he blood flow in t.ho :wending aorta or otller g rwt vcssels nxry :rlso be \'er!* useful i n :messing the performance of the heart. The velocity profile in the vessels affectrtd by :Lrterial occlusive disease nxay be an important vnri:tble to n1e:lsure nnd to understand.
Continuous-wave ultrsonic Doppler motion detection was first demonstrated by Sntamurlr [l] in 19.56. Franldin et al. were t'he first to sl~ow the use of these techniques for blood-flt,\~--velocity detection in animals in 1961 [a]. The first pr:tctic:d device intended for tr:ulscutnneous bloocl-flow-vclocity detection on m:~n \vas shown by Baker et al. [3] in 1961. Since that time, marly nunu- facturers tl~roughout t l ~ e n-orld Ilsve built ancl sold C W ultrasonic devices for many npplic:itions from fetal-llenrt- wall motion to blood-flow-velocity detection for pripheral vascular disease di:lgnosis. 3I:lny rcsearcllcrs have utilized
these devices in their n-ork and h v c reported significant findings regarding the circulation [4]-[G].
The scope of ultrasonic Doppler applications has increased and become more sophisticatcd. One of the principal limitations of the early continuous-wave Dopplers was their irubility to detect the direction of the flow velocity vector with respect t o the transducer. Andog recording of reversing blood flow t:rl;en with these devices nln-ays indicated the reversals as positive deflections. These flowmeters essent,i:dly rectified the flow w:hveform (Fig. 1). In 1966 JIcCleod demonstrated the first direction- sensing CW Doppler device. He used a version of qutLd- rature phase detection common to single sideband t,ech- niques to sep:u-at8e the upper : L I ~ lolver Doppler sidt:b:tnds from the carrier [7]. His system presented the tlet'ectetl outputs of form:ml and reverse flow on sep:mtc~ ch:mwls. These could be combirml into :I single output that indic:lt,etl the dirwtion of the blood-flow velocity.
Early n.orl;crs tllought the direction of blood flow in the pcripherxl vessels vxs uninlport:mt, particul:wly since man?; felt reversnls only existed :It the root of the :wending :wrta. This has since been shown to be an incorrect concept and, as :L consequence, direction-wnsing flowmeters have fomd erer-increasing use. Some typical n.nveforms are shon-n in E'ig. 2.' iit lcxst three ~n:~nnf:~cturers market, sucll devices, bwetl on 11cCleod's circuits, tllrougllout the I,Tnitcd St:Lt,e.: and Europe.
,Ilmost in par:lllel with the development of more effective instruments, c1inici:ms beg:rn to nslc more sopllisticated di:qqlostic questions. .Is tlleir untlcrst:tnding o f d3m:rmic blood flow incrc:wxl, they found it important to 1 ; n o w vessel dinmlsions, i.e., the site of occhsims, vol~~~ne-flow rates, velocitS7 profiles, nntl volume profiles. The need for :L more pori-erful mensurenmlt method was slowly being defined.
It should be kept in nlind t811nt up until now almost all use of these devices \vas qunlitntive, whether the Doppler sign& m r e processed and recorded as de nu log waveforms or the clinician based his conclusions on list,ening to the detected Doppler signals. We nlmt conclude for t,he most pnrt that the devices currently avdab le are not flowmeter;: but rather flow detectors and, further that they : m only velocity detect>or.s. Even a simple measurement of mean flow velocity requires that the angle bet\\-een the sound beam and tfhe velocity vector be known. There is only one known m:~y to determine this angle \\-it11 :t CTW device and that involves finding the angle a t which the Doppler shift is minimal, i.e., 9O0

BAKER: ULTRISOXIC DOPI'LEH BLOOD-FLOW SENSING 171
REACTIVE HYPEREMIA
wllcrt:
In :L pl~ysiologic sJ-+ml a l l o f these terms :\re functions of time ancl sp:~ce. 13loocl-flon- d o c i t y is dependent on the point a t wllicll it i? me:wred in the blood vcssel lumen. This space function is called tlle velocity profile. It is time dependent :is i t varies wit11 pu1s:Ltile flow in blood vessels. Since velocity :~nd cross-sect,ion:ll :Lre:L are v:~riubles, they have to be measured in terms of their true wlue and multiplied together to give :m :Iccur:tte me:~sure of volume
Jlrrsr1sn TE('IISI()I .ES
There :Ire m:my re:~so11: wlly the coIltiriuolls-n-:bve ultrasonic Doppler flow detectors currently :Lv:d:tble can Itot nnnl;c: mc~asurernents, or be cnlibrnt,ccl to give :L qunntit:~tivc volumc, or even velocity flow output. A review of CM- Dopl)ler tecl~niques will clarify tllcse re:tsons.
In its simplest form, I beam of 11igl1-frequency u1tr:t- sound, 3-10 JIHz, is projectd t11ro11gl1 the skirl t o w d the vessel of intert:st'. A lightly londed 1e:d zircon:tte tit:mtte transducer is usu:dly ubml for this purpose. These elements may range in size from l or 2 mm to as large as 2 cm or more. h scparnte clement is used to detect the ultrnsound hnclrscntterecl from the moving blood. The blood appears to scatter ultrnsound in n llnyleigh- like f:tshion ( the details itre not understood completely). The b:tclwxttered sign:d is Ihppler shifted by an amount

172 IEEE TRANSACTIONS ON SONICS .AND ULTRASONICS, JULY 1970
6 dB INTENSITY CONTOURS
Fig. 3. us-wave
determined by the velocity of the scat'terers moving through the sound field. Since the velocity wries with the diameter to form n velocity profile, the returned signal will produce a spectrum corresponding to t,hese velocities.
An example of this spectrum is shon-n in Fig. 3. In this plot (made by a special spectrum analyzer) the Doppler- difference frequency is plotted versus time. The sl1:lding of the plot corresponds to the intensity of the b:tcl;scuttered signal. At any instant of time it is possible to derive from this plot a measure of the velocity distribution. This information could be used to describe the profile a t t h t instant if the relationships between the sound-beam ch:mcteristics and the vessel geometry were lino\\-n. Studies to determine these rc1:ttionships arc currently being undertaken by Albright.* This kind of informxtion is generally not available, nor is it easily arrived at, since each new flow-measurement site and each different trxns- ducer would involve new relationships or a t best new coefficients in those relationships.
The lack of a, solution to this problem arises from some inherent limitations of the met'llod. The most b:asic lim- itation to a CW technique is its sensitivity to :l11 motion in the path of the sound beam. The sound field from some typical transducers is shownin Fig. 4. Underwater Schlieren techniques [S] are used to make these sound fields visible. I n Fig. 4, both the transmitting and receiving elements are energized to show the beam intersection. One ele- ment functions as transmitter and the other as receiver.
Ph.1). dissertation. Ilepnrtmetlt of Electricd Etlgineering, Universit,y o f N'ashitrgton, Seattle.
Since t,he trmsmitting and receiving beam shapes are reciproc:tl functions, we can determine the region of sensitivity by the beam overlaps. In practice, the region of Doppler sensitivity nctu:tlly extends somewhat beyond the discrete region implied by Fig. 4. Generdly a Doppler shift in a CW system will be detected for m y movement of scntters n-itllin the approximxte region of over1:y). It is therefore impossible to determine the rmge to the moving scatter in a simple CW system. In other words, CW Dopplers Ilnre no range resolution. The intercepting region of lligllly focused transmitting nnd receiving elements could locnlize a moving scat'terer. However, since the focal points are generally fixed in space, it is aJT--kw:rd to use in tr:tnscutaneous npplicntions. For these reasons it is not possible with CW techniques to determine the blood-vessel diameter in order to c:tlculate the cross- sectional area. Furthermore, the I d ; of range sensitivity premnts :my mevsurement of velocity versus dinmeter.
Another difficulty arising from the rmging problem occurs when more thnn one blood vessel a t a time passes through the region of Doppler sensitivity. All the flow sign:& in t'he benm will be combined into one composite signxl that cannot be sep;lr:rted into its elemental com- ponents. An example of this problem is illustrated in Fig. 5 .
Pulse Doppler Techniques
m
3Iany of tlle problems associated with continuous-wave systems c m be overcome if the ultrasonic source is pulsed and the Doppler shift of the returning echo is determined. If the return signal is range gated, the distance to the moving interface as well as its velocity with respect to the beam can be measured. I n a generul system the

BAKER: ULTRASONIC DOPPLER BLOOD-FLOW SENSING 173
composite echo when combined with clutter echoes is amplitude and phase modulnted by the moving target or scatterer. The Doppler or velocity information can be reduced in two diff erent J K L ~ S .
Noncoherent Pulse Doppler: I n a biological sy~tem, the echoes returning from moving interfaces are al\~-ays mixed with non-Doppler clutter signals from st:ltion:try inter- faces. ,411 these signals mix at the receiving transducer to produce an amplitude-modulated return. The frequency of the modulation corresponds to the Doppler difference signal. Such a system is sometimes said to be extcrnnlly coherent.
A noncoherent system is more complex tjhan a con- tinuous-wave Doppler, yet it is simpler than the coherent device to be discussed Inter. The noncoherent scheme would use a gated or pulsed transmitting signal, usually a burst of sine wvaves at an appropriate ultrasonic fre- quency. The receiver would have to be a linear or logn- rithmic amplifier to preserve the amplitude components. Range gliting is used to select :m echo for detection from a predetermined depth. The Doppler component, is detected from the range-gated s:mple bya square-lawdiode detector.
To the author's knowledge no tissue motion or blood flow det'ectors have been built on the pulsed noncoherent principal.
The primary difficulty of this system would be erratic fluctuations in the detected Doppler signal due to variations in the mixing ratio of the Doppler and clutter sign:lls.
Coherent Pulse Doppler: The return echoes from moving interfaces are phase modulated as well as amplitude modulated. If a range-gated sample of the return echo is compared with a replica of the transmitted signal in a
VELOCITY VENOUS
phase detector, the Doppler components can be derived easily. Such a spstenl is said to be coherent. m
Some form of amplitude limiting is usually used in the receiving amplifier to remove the amplitude variations in the echoes. These vnriations include an amplitude noise component as well as Doppler.
A pulsed ultrasonic Doppler flow detector of the coherent type has been built and is being evaluated [g], [lo]. A simplified block diagmm is shown in Fig. 6. The system consists of the following:
3)
7)
a mast,er oscillator a ripple counter to divide the master oscillator frequency down to the basic pulse-repetition fre- quency of the system a linear trnrlsmission gate that connects the master oscillator t o a linear power amplifier for exciting the transmitting transducer a linear power amplifier transducers a high-frequency amplifier and limiters to bring the received signal echoes up t o S level for phase de- tection a phase detector for comparing the inst'antaneous phase difference between the received echoes and the reference signal from the master oscillator a range delay and gates that can be set to sample the phase detector output according to the depth of the blood vessel a set of filters that removes the PRF components from the boxcar output an audio amplifier to raise the Doppler difference frequency spectrum up to suitable levels for con- version to an analog voltage.
Master Oscillaior: The selection of the master-oscillator frequency is dependent on several factors. Experience in the development of the continuous-wave Dopplers has

174 IEEE TRANS.4CTIONS O X SONICS A N D ULTRASONICS, JULY 1970
SIMPLIFIED PHASE COHERENT PULSED DOPPLER
Somple
Receiver 8 Low poss Phose Low Poss
Audible Doppler
R e c e l v e r r elementa
output PRF Hold -
Filter Detector Llmlter + + Filler
L Amplifier fo; 7j-
4 c 1
tronsmlthng I ” - Power Pulse
Amphfier *
Amplifier -
c
Somple Pulse
I
Moster - Freq Divlslon - Oscillotor
1.25 K H Z 4.5-5.5 20,lO. 5 . 2 5 - -
M H Z - I F l l
Moster Freq Divlslon Oscillotor
1.25 K H Z 4.5-5.5 20,lO. 5 . 2 5 - -
M H Z - shown tllat .j JIHz is a good compromise frequency for detecting blood flo~v in vessels 4-6 cm in depth. Cnits have becn built with carriers as low as 2.25 3IHz :md as high :is 10 >[Hz. The choice depends on a t r x k off between tr:msmission :tttenu:ltion losses over a given p:ltll length that v:wic,s a t approximately CY ,Z U’ ver.sus the b:tcl<- scattrr sign:d intensity that incre:rses xcording to T b:Lcltsc:Ltteretl M w4. Fig. 7 shows :I plot of optim:d carrier frcqucwcy versus vessel dtq)th.3
The sensitivity of t11e receiver will :tlso influeuce the choicc of transmitted frequency. Doppler echo signals can usu:dly be detected from the larger vessels, i.e., 3 mm or larger, at ranges greater than the opt,in~al frequencies that Fig. 7 would suggest.
The stability of the master oscillator is not a critical f:Lctor, bcing of the order of 0.01 percent per l~our. The jitter or plxise stability is impohrl t . So specification has been established for phase jitter other t l l : m to minimize it. ‘l’his type of noise can p:\ss through the system to produce phase noise sigwls at the receiver phase detector.
The master oscil1:ttor also provides :L continuous reference signal to the receiver p11:~se detector for coherent detectiou of the Doppler shifted echoes, and it also drives the PRF ripple counter.
PIZF Ripple Counle?: I n pulse Doppler equipment of this type, it is essential that e:tch transmitted acoustic burst 11:~ve nn identical phase relationship to the master oscillator. This is accomplislled by dividing the mnster- oscil1:ttor frequency down to the pulse-repetition frequency (1’RFj Tvith integrated circuit binaries and a program- mable “divide-by-N counter.”
The selection of the PRF is dependent on expected Doppler shift, depth of vessel, and attenuation chnr- acterist’ics of the tissue. I n an unnmbiguous system, when it is desirable to measurc depth :ud velocity simultaneously,
3 I h . .J. -\I. Reid.
severe restraints are imposed. The PR17 in the current pulse Doppler designs, functioning in :m unnmbiguous mode, :Ire limited by tlle laws of sampling theory. The I’RF must, be twice the expected Iloppler difference frequency. In :I G-JIHz system, the detected Doppler shift mny be as high :IS G kHz when the u1tr:xsonic beam is projected directly clo\vn n vessel wit11 blood-flow ve- locities to 100 cm/s. Ec1u:ttion (I) c:m he rr~:lrr:~ngetl to c:llcul:ttc A;f for :my beam :~ngle :rnd carrier frcquency fo.
= _U. 3 i7f ro$ B C (3)
Wlen the 1TF is increased to raise the s:tmplc rate for a lligll i l f , range :ambiguities c:m occm. These hnppen when ecllom from t’he previous transmitted burst lmve not yet dec:lyed below the dctection tllrcsllold : ~ n d thereby persist into the nest tr:lnsmission interval, m:~king it difficult t o identify wllicll ecllo is relntcd to which trms- mitted bur&.
There is insufficient I.rnon.ledge :xbo11t transducer losses, t.issne lowes! and backsc;lttcred sign:tl levels t,o predict rigorously wlmt the maximum PI<1? c m be for :L 6’ ylven depth of me:carenwnt. This mill no doubt bc the topic of further research in the future.
The tissue loss f:tctors that Imve been investigated to date fall in the range o f 1-3 dU/cm/JlHz. Ko reliable data are ar:ril:lble tlxrt c m be used to predict the :woustic return from ;I p:uticulnr volume of moving blood in :m ultntsonic field. Experiment’s are in progress to determine the scattering cross section for blood. The tr:msducer gain or loss is unique to ench tr:ulsducer and depends on its p:trticul:tr construction. At the present time, the sensitivity of no tn-o units is alike. A testing program mould be required to establish these factors for each transducer.
It has generally been possible, in the system being described, to adjust the PRF period to be about 20 percent

BAKER: ULTRQSOSIC DOPPLER mmm-wnv S E ~ ~ S I S - G
Optlmum Carrier Frequency f o r Ultrasonlc Doppler
I O 0
5 0
20
.. 10
2 5
2
I
0.1 0.2 0.5 1.0 2 5 10 D e p t h . cm o f m u s c l e
Fig. i. The optirnitl carrier freq1mlc:y for a nmsimtm detection depends 011 b a d e o f T betweell nhsorpt,itrn lossw and scattering return.
155
CW Doppler units and the wide-band width of pulse echo units. The Q of transducers designed for continuous- wave applications range from 10 to 15 upwards to 30 or more. Pulse echo transducers are mass loaded with a tungsten epoxy backing and have Q as low as 1.5-2.5. Units have a backing of aluminum powder in epoxy, for the pulse Doppler has a Q typically in the range of 5-10. Overall transducer efficiency has not been measured but is estimated to be in the range of 10 percent. Using this coupling coefficient, the average radiated acoustical power from the system ranges from 20 to 100 mW. The radiating area of t,hcse transducer plements ranges from approximately 0.5 to 3 cm'.
A typical transducer is shown in Fig. S. A diagram showing the construction of this transducer is shown in Fig. 9.
The pulse Doppler system described uses septtr:Lt8e transducer elements for transmitt'ing and receiving. This choice was made t,o avoid the problem of decoupling the transmitter from the receiver. Ideally, the carrier frequency leakage to the receiver input should be down at least 100 dB from the transmitter burst Jvithin a few- micro- seconds :%fter excitation. Reducing transducer case echoes, etc., to achieve t,hc.se levels is n difficult, problem, even though the trnnsmitter power amplifier output has a11
on-off ratio approaching 120 dB. Pulse ultrnsonic Doppler systems do not, intrinsicnlly
avoid the transmitter-receiver leakage problem as one might think. Even if the t,rnnsceiver had no case echoes and the electrical leakage from the master oscill:Ltor, etc., was reduced to n minimum, there still exists :a situation m:llogous to leuknge in :L CW case.
The concept of spnti:d Irnl<:lge is int~rotluced to describt! a, sigo:~l-to-noise-r~~ti(~ difficulty cllnrneteristic to the transcut:~l~eous apI)lic,:tt'ion of this system. 1 1 tr:tnsdncer element with an itle:tlized beam is sllown in Fig. 10. In :L CW device there is spillover or 1e:llc:rge directly from tr:lnsmit,ting to receiving element. The CW device is :dso sensitive to :my mot>ion occurring within the confines of tlle sound field. T h e vcctors in Fig. 10, lower left, show the rct1:~tionsllip between the Doppler and 1e:tk:tg con]- ponents a t the receiver ir~put termirmls of :I CW systenl for :my instant of time.
When the system is converted to n pulse mode, the rcgion of Doppler ernsitivity in t'lle be:m is reduced to :I
disk as sllon-n in Fig. 10. The locntion of the disk depends on the receiver rmge gate delay and its thickness depends on the range dimcmion of the receiver resolution cell.
Doppler signals will be detected from moving scatterers in the region or volume common to both thc disk and thc blood vessel. The region in the disk out,side the vessel that has little or no motion will return a non-Doppler signal. This signal is called the spat(ia1 leakage and com- bines with the Doppler signal a t the time the echo is received from the sample region (resolution cell). This sample window is sometimes called the Doppler window. Spatial leakage and Doppler echoes combine in the vector diagram, Fig. 10, lower right. Thus, ultrasonic pulse
longer than the delay time to the range gate interval. Despit,e reasons to the contrary, experirnce to date suggests that the choice of PRF may not be a major problem. Generally, insufficient work has been undertaken regarding the ranging and display aspect of pulse Doppler develop- ment to allow one to say what the eventual difficulties may be. The following list' of PRF's and range depths indicate the combinations most commonly used.
Approximate 3Iaximum
25 kHz 3 cm l?..; kHz 18 kHz 4.3 cm U l i H X
12.5 kHz ti cm 6.25 1cHz
PRF Depth Range A! Detectable
Linear Il'r.cz,lsmission Gale and 1'orc.er Av1plif icr: The I'ltF pulse triggers :L 1.0-ps one-shot nau1tivibr:ltor tllat gcnerntes tlle gating signd for :L linear trmm~ission gat<>. When thc gate opens, 5 cycles of t>lle master oscillator pass through t80 a linear power nmplifier. The gxte 1 1 a h
been fixed :it 1.0 p s although other durations are possible. The 0.5-volt peal;-to-pe:ik 5-cycle burst is amplified
t,o an SO-volt pe:d;-to-pcal; signal by a quasi-con~plen~ent:~r~ power amplifier. The circuit uses :L broad-bund pulse transformer to r:tise its output imped:um up t'o 50 ohms to drive the ceramic tr:msmitting transducers. 1Ceedb:lck is used :u-ound the pon-er amplifier to give t.he transducer :L measure of dyn:lmic dnmping to reduce transducer ringing.
The peak power applied to the transmitting t.ransducer is in the range from 10 to 30 watts during the l-,us es- citation burst,. These figures are based on a range o f transducer impedances from 50 t o 200 ohms. The duty cycle at the highest P R F (25 kHz) is 0.035. The average power applied to the transducer ranges from 0.25 to 0.75 watt depending on the transducer irnped.1 L nee.
Transducers: Pulse Doppler t'ransducers should ideally have the sensitivity of the lightly backed narrow-band

176 IEEE TRAPISACTIONS ON SONICS AKD ~ILTR~SONICS, JULY 1970
CERAMIC ELEMENTS
1
Fig. 8. Close up of transmitting and receiving elements in a pulse Doppler transdltcer with lens.
BLOOD VESSEL.,_ SHIFTED BACKSCATTERING REGION OF DOPPLER
“l TRANSMIT RECEIVE
ELEMENT REGION OF FULSE ~ ’ OOPRER SENSITIVITY
CW DOPPLER PULSE WPPLER
Fig. 10. Comparison a t regions of serleitivit,y for CW and pulsed Doppler methods.
Dopplers do not overcome the lealage problem simply because they are operated in ;I pulsc mode.
This problem is partially solved by using acoustic lenses on the transducer to focus the sound field dimen- sions don-11 to the size o f the vessel or smaller. The sound field from :L transducer with a lcns attached is shomn in Fig. 11. Both the transmitting and receiving elements are excited with a CW signal in order to image the complete field. The transducer is constructed, as shown in Fig. 9, with two semidisk elements. The cross section of the beam in the focal region is ellipsoidal as a result of this configuration.
Work remains to be done to determine the effect of sound-beam shape on the size and shape of the Doppler window or resolution cell. With a focused transducer, the window will change size and shape as the range to the window is increased. The manner in which the shape of the window will affect the resolving power of the pulse Doppler flowmeter for detecting velocities at a point in space will be discussed later.
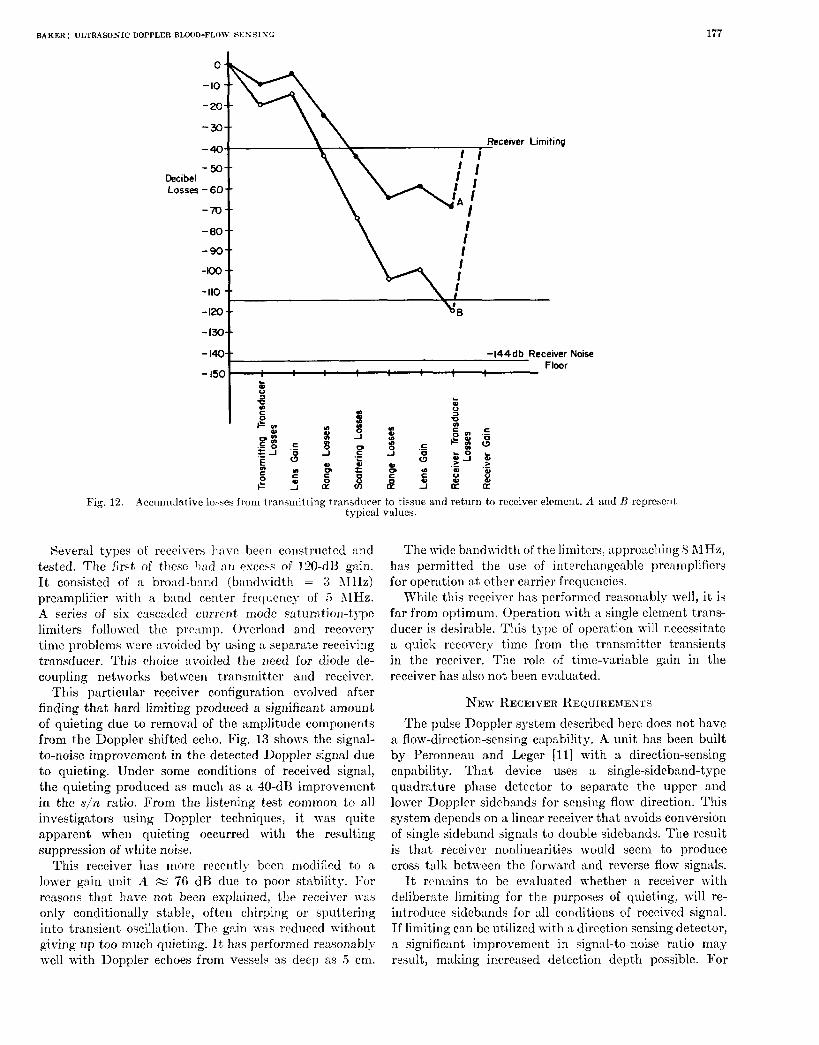
Receicer Limiters: The backscattered Doppler shifted signal from a blood vessel may range in intensity from 50 dB to more than 120 dB down from the transmit,ted signal.
Several factors contribute to the overall losses. These start with the transmitting trmsducer and end at the receiver input terminals. It is not possible to predict all these losses in an exact manner; however, experience indicates that the list of losses shown below are repre- sentative. The exact losses would require detailed measure-
R R
, EPOXY / - / PLASTIC CASE wYRENE ALUMINIUM ,’ BACKING / I
Not to Scale
Fig. 11. Underwater Schlieren photograph o f transducer with focusing. (a ) side view; (b) top view; 5-RZIIz pulse Doppler, Q = S; spherical lens, 3-cm focus.
ments with a specific transducer :trrangcment and at a particular flow-sensing site:
1) transmitting transducer losses: 10-20 dB 2 ) gain of transmitting transducer lens: +5-+l5 dB 3) transmitting tissue losses: x 2 dB/cm/hiHz 4) scattering losses in blood: 20-40 dB 5) receiving tissue losses: ~2 dB/cm/MHz 6) gain of receiver lens: +5-+15 dB 7) receiving trnnsducer losses: 10-20 dB.
The spread of these losses is plotted in Fig. 12 to show the \vide variability of these factors. I n this example, the tissue and scnttering losses have been computed for a system opxlting :It 5 JIHz with n blood vcssel loc:Lt,ed 3 cm au-ay from the transducer. It. should be stressed that t lme values are only represcntntive and :Ire b:wd, in part, on experience : w l on occasional me:Lsurements. X o systematic study has been carried out to define the 1inlit)s of each of tallese factors more precisely. Such data are time consuming to collect and would, if available, contribute to improving the pulse Doppler device.
BAKER: ULTRASONIC DOPPLER BLOOD-FLOW SENSING 177
Decibel Losses
-30 :;h -40
\ I
-loot -110 l \.
- 1 4 0 - FIWI ' - l50
- -144db Rece iver Noise
Fig. 12. .4ccrrmrdative loxxs from transmitting transdrlcer to tissue and return to receiver e!ement. A and R represent typical values.
Several types of receivers have been constructed :md tested. The first of t lme h:~d excess of 120413 gain. It consisted of a brosd-band (bandn-itlth = 3 IIHz) preamplifier with a bnntl center frerplency of 5 AIHz. A series of six carcaded current mode s:ltur:ltion-t?-pe limiters followxl the prcnmp. Overload and recovery time problems n.ere avoided by using a separate receiving transducer. This cl~oice nvoided the need for diode de- coupling networks between tr:tnsmit,t,er and receiver.
This particular receiver configuration evolved after finding that hard limiting produced a significant amour~t of quieting due to removal of the amplitude components from the Doppler shifted echo. Fig. 13 shows the signal- to-noise improvement in the detected Doppler signal due to quieting. Under some conditions of received signal, the quieting produced as much as a 40-dB improvement in the s/n ratio. From the listening test common to all investigators using Doppler techniques, it was quite apparent when quieting occurred with the resulting suppression of white noise.
This receiver has more recently been modified to a lower gain unit' A % 76 dB due to poor stability. Icor rermons that have not been expl:tined, the receiver was only conditionally stable, often chirping or sputtering into transient oscilhtion. The gain W:H reduced without giving up too much quieting. I t has performed reasonably well with Doppler echoes from vessels as deep as 5 em.
The wide bandn-idtll of the limiters, :q]proaching S AIHz, has permitted the use of intercllangesble preamplifiers for operation at' other carrier frequencies.
While this receiver has performed reasonably well, it is far from optimum, Operation with a single clement trans- ducer is desirable. This type of operation will necessitate a quick recovery time from the transmitter tmnsient.s in the receiver. The role of time-variable gain in the receiver has also not been ev:tlusted.
NEW RECEIVER REQUIREMENTS The pulse Doppler system described here does not have
a flow-direction-sensing capability. A unit has been built by Peronneau and Leger [l11 with a direction-sensing capability. That device uses a single-sideband-type quadrature phase detector to separate the upper and lower Doppler sidebands for sensing flow direction. This system depends on a linear receiver that avoids conversion of single sideband signals to double sidebands. The result is that receiver nonlinearit,ies would seem to produce cross talk between the forvmrd and reverse flow signals.
It rrnxtins to be evaluated whether a receiver with deliberate limiting for the purposes of quieting, will re- introduce sidebands for all conditions of received signal. If limiting can be utilized with a direction sensing detector, a. significant improvement in signal-to-noise ratio may result, making increased detection depth possible. For

178 IEEB TRANSACTIONS ON SONICS AND ULTRASONICS, JULY 1970
As mentioned previously, a system of quadrature phase detectors described by McCleod and I'eronneau has been used to separate the upper and lower Doppler sidebands to indicate the direction of blood flow. Since bidirectional flow exists a t many points in the body, direction sensing will be essential to the eventual quantitative application of this inst,rument.
Receiver input p volts
Fig. 13. lfard limiting i n the receiving amplifier improves detected 1)oppler sigllal-to-noise ratio by qllieting effect.
example? a system capable of detecting flow in the ascending aorta or renal artery transcutaneously on man will need every improvement that can be devised.
Another aspect of receiver design relates to the echo- ranging poterha1 of the pulse Doppler system in addition to its flow-sensing capability. I t is quite feasible to consider a conventional A-scan or B-mode display of echo position functioning simultaneously with the Doppler blood-flow detection. This mode of operation may require a quite different type of recciver connected in parallel or partially in cascade with the amplifier described previously. The prospects of this development have barely been considered.
I'IIhSE I)ETE(:TOIt
The Doppler shift of t h e received echo bac1m:ktered by the moving blood is detected by sensing the instnn- taneous phase difference bet'ween the echo and a reference signal from t#he mast,er oscillator. The \rawforms in Figs. 14 and l5 illustrate this process.
All t'he received echoes after :mplificntion and limiting are coupled to a double-balanced miser connected as a phase detector. The reference signal from the master oscillator is present a t a11 times. The output from the phase detector will be a signal of &0.5 volt, which indicates the instantancous phase difference ( G l S O O ) betwcen the echoes and the reference as a function of range following each transmitted burst. Since the PRF is a t least twice the expected Doppler shift, the inst,nntnneous phase difference signal for each transmission will be a stationary function (nontime varying),
If the echo a t a particular range or depth contains a Doppler shift, then the nmplit,ude of a sample of the instantaneous phase difference will vary in amplitude exactly with the Doppler difference frequency. This is shown by the sample points 1, 2 , 3 in Fig. 1.7, taken from the phase-detector output over many PRF samples. The envelope frequency from the phase detector is the Doppler difference frequency. The time a t which this sample is taken in each PRF cycle determines the range or depth a t which the Doppler velocity measurement is made. This method of detection is incapable of sensing the direction of Doppler shift.
l<.LSC;E DEI,.\Y .\NI) S.\MPLE> CIIiCUITS
The depth at which the Doppler signal is sensed within the blood vessel and tissue depends on the delay interval between the transmitted burst and the sample gate. For a velocity of sound in tissue of approximat'ely 1500 meters per second, the range factor is 13-,us delay per centimeter of depth.
A simple one-shot multivibrAtor is used to develop the range delay. The range delay potentiometer is coupled t,o a range dial calibrat'ed in millimeters and centimeters of depth.
With these calibrations, i t is a relatively simple matter to measure the sound path length that intercepts a blood vessel, by noting the depth at which flow signals eommcnce and the depth a t which they disuppear. If the angle between the sound beam and the blood vessel is known, then the true vessel diameter can be determined.
A sample gate is actuated by the range delay multi- vibrator. The duration of the pulse from the sample gate generator depends on the type of Doppler detection that is desired.
Method 1
This method is used when :L velocity measurement with maximum sensitivity is required a t a specific point in the blood vessel. This discrete measurement will be necessary when mapping the velocity profile within a blood vessel. Precise determination of the lumen diameter of n vessel d l d s o necessitate the discrete sensing of velocity to ddernline the margins of blood flow at the vessel walls.
This maximum-resolution nxlximum-sensitivity opera- tion is achieved by using broad-band t,ransducers, short t,ransmitted pulse durations, 0.5 ,us or less, and a boxcar- type sample and hold circuit following the phase detector. The signal from the phase detector, indicating thc instan- taneous phase difference, is sampled by a gate that is turned on for only 0.1 ,us. This sample is stored in a capac- itor. The capacitor voltage is held until the next transmitted burst and subsequent sample. Fig. 15 illustrates the manner in which this sample and hold (boxcar) circuit stretches the 0.1-,us samples to develop a signal corre- sponding to the envelope of the samples over many PRF cycles.
This detection scheme appears to have the maximum possible gain for conversion of the instantaneous phase difference to a voltage representing the Doppler difference frequency.
The spatial resolution cell or sample volume in the blood vessel in this method is dependent on the dimensions

BhKER: ULTRASONIC DOPPLER BIX)OI)-FLOW Y C B P I X ( ;
Master Oscillator
Transmltted Burst
Doppler Shifted Rece i ved Burst
A+ = instantaneous phase difference during Delayed Phase ref. Bunt
C sample interval.
<
Phase Detector output
~~ 7- e fi! A+ t =o + time
l Y 5 0 0 p s
Output
Recelver L - I 1 1 1 Input v -
Reference Phose
Burst n n n
lntegrotor Boxcar
output
Fig. 15. Envelope of phase detector samples 1, 2, 3 forms Doppler signal. Range delay determines depth of Doppler velocity sensing.
of the acoustical packet in the blood rather than the duration of the sample pulse. Tests indicate that the packet is approximately 1.5-2.5 mm in length (depth)
and has st cross section approximated by the sound-beam diameter at the range (depth) of the sample. The packet length is determined by the duration of the burst applied to the transmitting transducer and the bandwidth of the transmitting and receiving elements. The detected Doppler shift frequency will correspond to the mean velocity averaged over the sample volume. As a result, the larger the vessel diameter compared to the dimensions of the sample volume, the more accurate will be measure- ments of velocity profile and of diameter.
Average velocity over the vessel cross section can be measured by another method.
Method 2
Rather than scan across the vessel with a high-resolution small sample volume in an attempt to measure the velocity profile, it is possible to sample the entire vessel diameter at one time and have a direct readout of the average velocity.
The output of the phase detector is sampled in the same manner as Method 1, except that the sanlple duration is set to extend across the vessel lumen diameter.
Since there is a velocity distribution across the vessel (profile), there will be a corresponding Doppler shift distribution developed when the entire lumen is sampled simultaneously. When the detected Doppler shift is coupled to a zero crossing frequency meter, the meter will indicate the mean frequency and, hence, the mean

180
velocity. This sampling and detection method is useful when only the instantaneous mean ve1ocit.y over the whole diameter is desired.
If a direction sensing detector is used to read out the Doppler shift, reverse flow components occurring simul- taneously with forward flow will be subtracted out. Of course, in this method no velocity profile information is av:Lilable from the readout.
This method would be useful for following heart valve or wall motion since these interfaces hnvc rather large excursions that would quiclcly pass out of the range of the short fixed sample gate of Nethod 1.
A ~ D I O AMPLIFIER ASD PRF I;II,TERS The Doppler signals at the output of the sample and
hold amplifier are low in amplitude and contain frequency components from the transmitter pulse repetition rate. I n addition to the Doppler frequency, there are signals due to spatial leakage changes that extend down to dc and are large in amplitude. They could easily block any high-gain amplifier t,h:ht mus connected directly to the sample circuit output.
In the present pulse 1)oppler teclrnique, an active bandpass filter wit'h unity gain follow directly from the sample hold circuit,s. The high pass sections come first to remove the large-amplitude low-frequency spatid leakage components. These leakage components vary widely when the transducer is moved intentionnlly or from r,tndom motion. The nttcnuation slope of thcsct filters is I S dB per octave n.ith the 3-dB point set at 50 H z .
Z~ollowing the high p:w sections, are :L group of ICJW pnss filters that are used to remove the 11igll-frequenc~- PRF components from the detected Doppler signal. The selection of the roll-off frequency depends on the PE€; and on the highest expected Doppler frequency. Usu:llly the highest PIW that avoids rnnge ambiguities is uwd. This I'IW rate is a!most always :tbovct the Iriglrcst I>opl)ler shift frequrncy; therefore, the filtw would be set to roll oft' just above the upper Doppler limits r :~t~l~er than at one-1r:rlf the I'ItF. h i n g this tends to improve tlle detected Doppler signal-to-noise ratio. The attenuation slope of the 10w-p:lss sections rmges from 18 to 24 dB octave.
An audio frequency amplifier with a bandpass exceeding the maximum filter bandn-idtlls follom. The Iloppler signal is raised to tllc l-volt level t o be used to drive external power amplifiers or frequency meters.
APPI,ICATIO\-S OF PULSE DOPPLERS The ability to me:mm thc rmge or distance to a moving
interf$ce or flow, as well as to detect its velocity, opens up many fruitful areas of potential application.
The prospect of measuring volume blood flow qum- titutivcly from outside the body is prob:tbly t,he most intriguing of all. Whether this goal can actually be achieved in a practical way remains to be demonstrated.
It would seem simple enough to locate a vessel beneath the skin, measure its diameter, t h e n the blood flow velocity, and finally the angle between tlle sound beam and the
IEEE TRANSACTIONS O N SONICS AND ULTRASONICS, JULY 1970
velocity vector. All of these factors would be entered into a suitable equation and volume flow thereby com- puted.
Prelimirlary experiments suggest that this is not an easy god and that a great deal more work is necessary before quantization can be cnrricd out routinely with confidence. This early evaluation work is being cnrried out by Drs. Sasser, Rliller, and Yates of the Bioengi- neering Program at the University of Washington. Their results reveal certain in:mcuracics between actual flows and measured values. This work is being done under :I
variety of conditions on models and on animals. The two most important and most difficult parameters
to memure are the vessel diameter and the angle between the velocit,y vector and sound-beam axis.
VESSEL DL4METER MEASUREMENTS Several methods of determining the vessel diameter
:\re possible; each has its difficulties. The principal difficulty relates to the resolving power
of the pulse Doppler range gate. At the present time, diameter is determined by noting when flow signals appear as the range gate is scnnned across the lumen and then when they disappear. Taking the difference in range at each of these points will give the diameter. The t,rue di:mxt)er cun then be computed if the angle with the vessel is kno\\-n.
Tllis nwtlrod n.orl<s very well on plastic tubes in a model if the be:m angle is SOo or morr: and the flow rates :we high. Errors as smdl ns 2-3 percent have been :rchieved. As tilt! nnglc decrmses, it becomes increasingly difficult t o deternine the exact position of the far wall. The size and sh:tpe o f the snmple volume appears t o be the primnry dif-ticult~-. Ttle [inite size of the sample c:mses the ngparcnt vessel diameter to be larger t,hnn xtunlly exists.
Studies to date suggest t8hnt it may be feasible to come up u-it,I~ :I correction fact)or t h a t c m be used to reduce resolution errors. This is :L topic of current research.
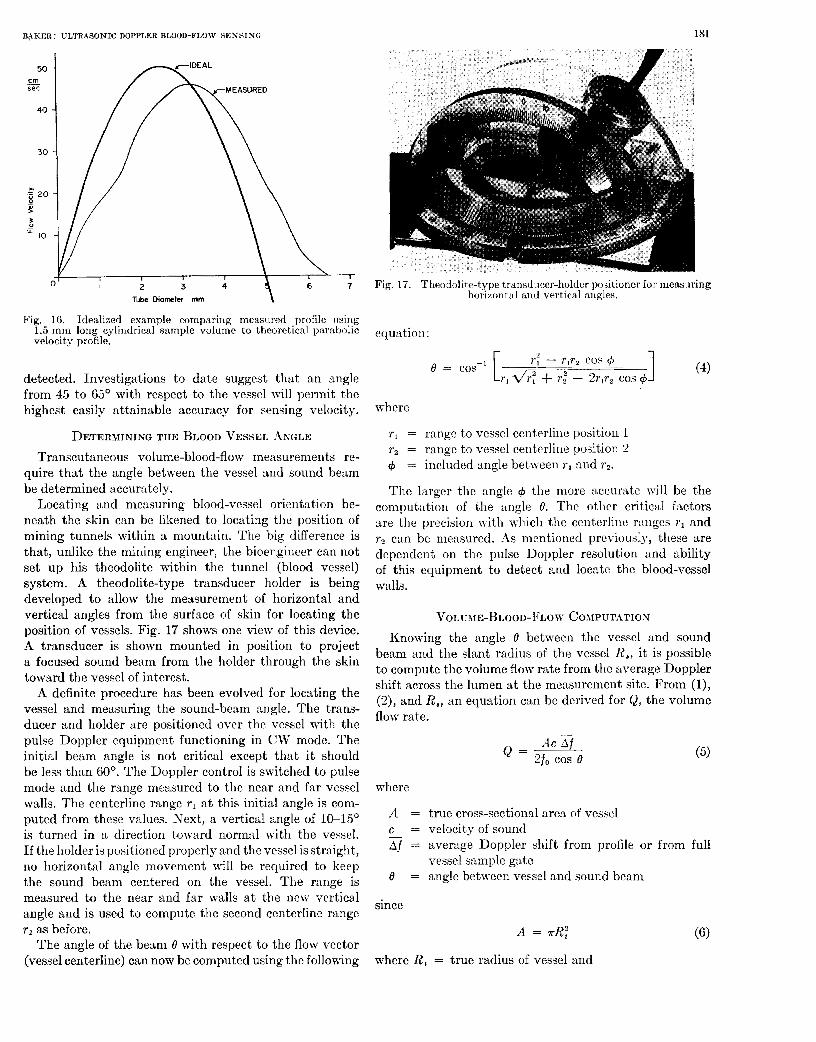
The :tctu:d effect of tllc resolution problem on the xccur:xy of the velocit,y profile is shown in Fig. 16 where the measured profile is compnred to the ideal. The mea- sured profile was arrived at, by convolving a cy1indric:tl s:lmple volume with the idenlized velocity profile on the centerline o f the tube. This illustrntion is included only as ; m example of the problem.
Higher ultrasonic frequencies and shorter acoustic bursts should :dlow t'lle use of a smaller sample volume to reduce this error. Of course, the errors will be propor- tion:ltely less as tlle vessel diameter increases for :L given snmple volume.
At the present time, it may be possible to reduce diameter errors to 10 percent or less if the transducer beam axis is aligned nearly normal t80 the vessel. This is an awlmard :mgle since the detccted Doppler shift appro:~cI~es zero as the be:tm appronehes n normal :mgle.
If diameter is measured in this ~ 1 ~ 7 , it will be necess:wg to sense the velocity at the same point' and at an angle that will give suit'able Doppler shifts to be accurately
B.%KER: ULTRASONIC DOPPLEll BLOOD-FLOW SENSING 181
50 - sec cm
4 0
30
-MEASURED
1 7
Tube Diameter mm \ Fig. 16. Idealized example comparing meas\lred profile Icsing 1.5 mm long cylindrical Rample volume to theoretical paralmlic velocity profile.
detected. Investigations to date suggest that an angle from 45 to 6.5' with respect to the vessel mill permit t,he highest easily attainable accuracy for sensing velocity.
DETEIIMINIKG THE BLOOD VESSEL ANGLE
Transcutaneous volume-blood-flow measurements re- quire that the angle between the vessel and sound beam be determined accurately.
Locating and measuring blood-vessel orientation be- neath the skin can be likened to locating the position of mining tunnels within a mountain. The big difference is that, unlike the mining engineer, the bioengineer can not set up his theodolite within the tunnel (blood vessel) system. A theodolite-type transducer holder is being developed to allow the measurement of horizontal and vertical angles from the surface of skin for locating the position of vessels. Fig. 17 shows one view of this device. A transducer is shown mounted in position to project a focused sound beam from the holder through the skin toward the vessel of interest.
A definite procedure has been evolved for locating the vessel and measuring the sound-beam angle. The trans- ducer and holder are positioned over the vessel with the pulse Doppler equipment functioning in CW mode. The initial beam angle is not critical except that i t should be less than GOo. The Doppler control is switched to pulse mode and the range measured to the near and far vessel walls. The centerline range r1 a t this initial angle is com- puted from these values. Next, a vertical angle of 10-15' is turned in a direction toward normal with the vessel. If the holder is positioned properly and the vessel is straight, no horizontal angle movement will be required to keep the sound beam centered on the vessel. The range is measured to the near and far walls at the new vertical angle and is used to compute the second centerline range r2 a$ before.
The angle of the beam 0 with respect to the flow vector (vessel centerline) can now be computed using the following
Fig. 17. Theodolite-type transducer-holder positioner for measllring hor.izont,nl :tllcl vertical angles.
equation:
where
r1 = range to vessel centerline position 1 rZ = range to vessel centcrline position 2
= included angle between r1 and rz.
The lnrger t,he angle I#J the more nccur:ite will be the comput:ltion of the angle e. The other critical factors are the precision with n-hicll the centerline rmges r , and rz can be measured. As mentioned previously, t,llese are dependent on the pulse Doppler resolution and ability of this equipment to detect and locate the blood-vessel walls.
VOLUME-BLOOD-FLOW COMPUTATION Bnowing the angle e between the vessel and sound
beam and the slant radius of the vessel R,, it is possible to compute t,he volume flow rate from the average Doppler shift across the lumen at the measurement site. From (l), ( 2 ) , and R., an equation can be derived for Q, the volume flow rate.
where
A = true cross-sectional area of vessel c = velocity of sound Af = average Doppler shift from profile or from full
e = angle between vessel and sound beam
-
vessel sample g:lte
since
A = ?rR:
where R, = true radius of vessel and
182
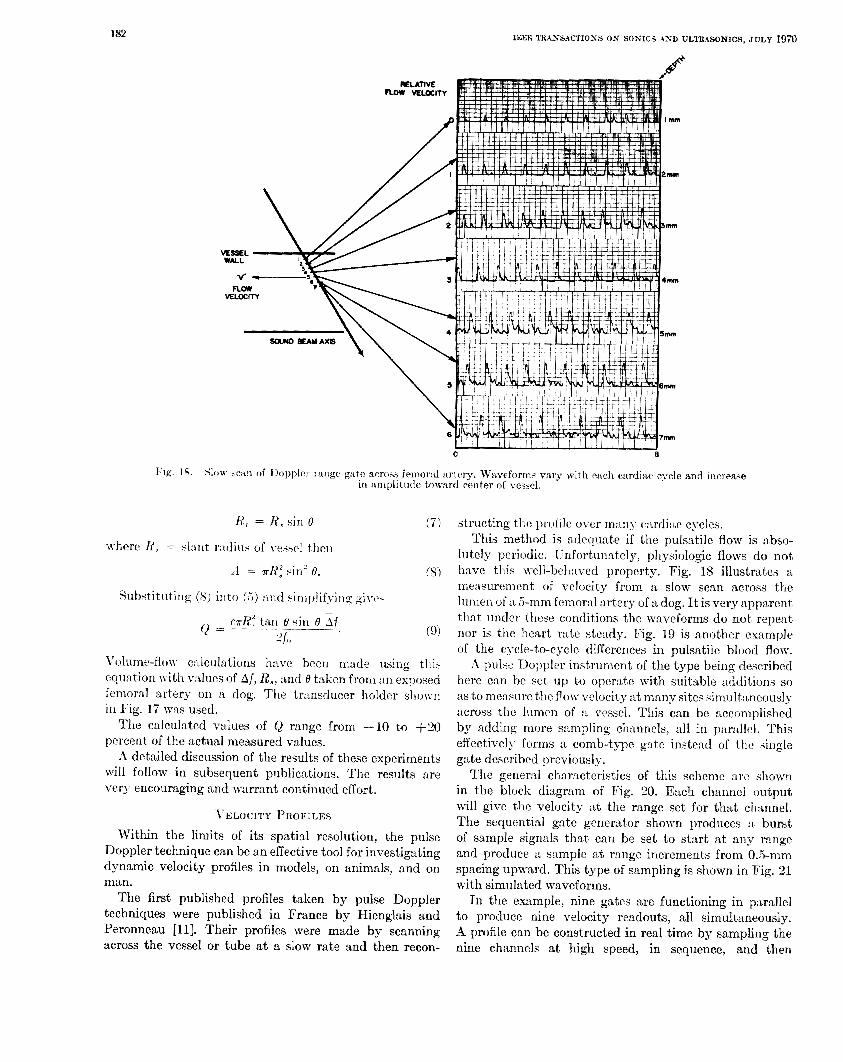
Within the limits of its spatial resolution, the pulse of sample signnls that can be set to start at any range Doppler technique can be an effective tool for investigating and produce n sample a t range increments from 0.5-mm dynamic velocity profiles in models, on animals, and on spacing upward. This type of sampling is shown in Fig. 21 man. with simulated waveforms.
The first published profiles taken by pulse Doppler In the example, nine gates are functioning in pnrallel techniques were published in France by Hienglais and to produce nine velocity readouts, all simultaneously. Peronneau [ll]. Their profiles were made by scanning ,4 profile can be constructed in real time by sampling the across the vessel or tube at a slow rate and then recon- nine channels a t high speed, in sequence, and then

RELATIVE FLOW
M L O C l M
6
I'ig.
QUADRATURE
SIGNAL
l REFERENCE
PHASE
SEOUENTIAL
GENERATOR 1 SYNC.
BOX CAR - HIGH PASS - L W PASS FREWENCY
VOLTAGE INTEGRATOR FILTER FILTER To ----CHANNEL
CONVERTOR 9 -
N IDENTICAL CHANNELS -- VELOCITY OUTPUTS
L BOX CAR ----c HIGH PASS - LOW PASS FREQUENCY
INTEGRATOR FILTER FILTER VOLTAGE TO - ~ -CHANNEL
CONVERTOR t@ - - t GATE N
displaying velocity as a function of range. This last phase of sampling \vould have to be synchronized by the electro- cardiogram in order to present the data properly.
Many types of displays of profile dynamics are possible. A comprehenrive example is s1~0w-n in Fig. 22. Blood-flow velocity is plotted as a function of time :~nd of vessel diameter. Systems could be designed t o display any plane of this 3-dimensional-type plot in real time, or even on other time buses if that seemed advisable.
A three-dimensional model of the blood-flow velocity measured in the femoral artery of a dog is shown in Fig. 23. Close examination wil l reved flow irregularities that result from tlle model being a composite collected over
32 cardiac cycles. A nlodel based on real time measure- ments of velocity over the full vessel dinmet'er, all taken simultaneously, should produce :L much smoother surface.
The role of profile dynamics in research and in clinical diagnosis is not yet clear; however, many interesting ideas are in the prospect. I n any event: a great amount of work is yet to be done to develop :md explore :dl the possibilities fully.
LIMIThTIOSS A S D NEW ~ ~ E V E L O P M E T T
Pulse Doppler ultrasonic measurement of blood flow is probably t>lle most complex method yet attempted, and, as n-it11 : d l new instrumcant teclmiques, m:my design

IISEF: TRANS.4CTIONS O N SONICS A N D UILTRASONICS, JULY 1970 184
EKG SYNC & /L p--==
TRANSDUCER / A
SAMPLE KIIN"IIl_
A B C
Fig. ?:L JIodel depicts blood flow velocity as a fuuct ion o f lime ~ l d c1i:tmeter. Left edge of model is synchronized with ISCG. Flow was sensed in fernoral artery of dog. Diameter was 4.8 mm.
I lEE TR4NSACTIONS ON SONICS A N D ULTR4SONICS, VOL. SU-17. NO. 3. JULY 1970 185
problems must be overcome. In spite of these difficulties, the benefits that accrue to this approach, including non- invasive nondestructive ex:tmination of the flow profiltl in vessels embedded in soft tissue, justify the time and effort required for this development.
Although nlucll has already been accomplisl~cd msing the pulse Doppler appro:xch, some additional problems remain. Some of the most import:lnt, o n e inellde more appropriate transducers and coortliwlte systems. In- creased resolution (both angle and rmge) is required in order to apply these measurement,s to small vessels. Further studies are necessary relating to the :wt,ion betwen ultrasound and flowing blood, before this research tool will be suitable for clinical applic a t‘ Ion.
L 4 C K K O W L E D G J I E S T
Special rccognit,ion is given to the following individuak who have contributed to the various phases o f this instru- ment’s effort: V. E. Simmons, G. R. Bennett,, J . 31. Ofstad, Dr. J. M. lleid, R. F. Olson, C. C. Hnrtley, and D. W . Watkins, for engineering design and development; Drs. D. E. Strandness, C. W . XIiller, M. G. Nasser, and W . G. Yates, for medical :Lpplication and evaluation.
REFERESCES [ I ] P. Satamilra, “Stttdy o f the flow patterns i n peripheral arteries
by ultrmonicj,” J. Acoust. Soc. Japan, vol. 15, pp. 151-15R, l!).X.
[2] I ) . L. Franklin, W . A. Schlegel, and R. F. Rnshmer, “Mood flow measllred bp D o p ~ l e r freqltency shlft of backscattered
[R] 11. JV. Baker et al., “.4 sonic tr:tnscutaneom blood flowmeter,” I~l t rx~olud,” S c i m c e , vol. 132, pp. 564-565, ICJGI.
[1] I). 15. Stmndnese, Jr., IC. P. McCIltcheon, nnd It. F. Itltshmer, Proc. 17th Ann. Con!. Enqrg. Jfed. Niol., p. 76, 196L
tion o f ocdllsive arterial disease,” S t q . Gynec. Obstet., vol. 22, “Applirat io11 of a transclltnneolls Ihppler flowmeter in ev:~In:t-
[.5] I> . Pd. StrandlLess, Jr., el al., “Cltrasonic flow detection: A usef111 terhniq~~e in the evnlllntion of peripheral v:scltlar disease, Am. J . S u g . , vol. 113, pp. 311-830, 1967.
[S] B. SigeI: el al., “A Doppler ultmsollnci method for di:tgnosing lower extremity venolls disease,” S ~ c r g . Gynecol. Obslef., vol. 127, pp. Xl9-3.i0, 1068.
[7] F. D. JIcCleod, Jr., “ h directional Doppler flowmeter,” Digest 7th Conj. d l r - l . Uiol. Engrg. (St.ockholm, Sweden), 1067.
[X] D. C. EIarding and D. W . Baker, “Laser schlieren optical system for andyzing llltrasonic fields, Hiomctl. Sci. In&.,
[g] I). \V. Baker and I>. Watkins, “ B phase coherent pulse Doppler system for cardiovascular measr~rement~,” Proc. 20lh Ann.
[lo] D. W. Baker, “Pulsed ultrasonic Doppler flowmeter biological Conf. Engrg. M e d . Bid., vol. 27, p. 2, 1967.
and engineering applications, presented at the IERIC Ultra- sonics Symp., (St. Louis, RIO.), September 21-26, 1969; also IEEE Trans. Sonics and Lih-nsonies (Abstract), vol. SU-17, Janllary 1970.
Ill] P. Peronneau, et al., “Blood flow velocit,y measurement by
Swg., April 19G9. ultrasonic Dopnler effect,” 4th Cong. European Soc. Exptl.
J’p. 1:):3‘b-104-5, 1966.
vol. 4, pp. 223-230, 1968.
Elastic Surface Waves: Thin-Film Transducers and Layered-System Dispersion
Abstract-Elastic surface waves were launched and received by thii-film transducers. Each transducer was a 2- to 3-pm-thick CdS layer with an interdigital-finger metal-film electrode pattern. Borosilicate glass was the substrate material. Frequencies between 18 and 60 MHz were excited at the fundamental and overtones of the transducers. The measured phase-velocity dispersion of the surface waves produced in the layered system of CdS on glass agreed with theoretical results based on earlier work.
This work is part o f aI’h.1). dissertation, Ijept. of IClec. Engrg., Poly- Manusrript. recrivcd .Janlmry 10, 1069; revised .Janrlary 2, 1970.
technic Irtsiit.ute of Brookl?;n, Brooklyn, N. Y., June 1969, by P. Schnitzler.
P. Schnitzler was with 11CA LahoratoriPs, Princetnn, X. ,J. He is now with 1tCA Jkfeuse IClectrollics Products, Somerville, N. J. 08876.
of Brooklyn, Brooklyn, N. Y. L. Bergstein and I,. Strauss are with the Polytechnic Institute
IXTRODUCTION
HE FIELD of elastic surface waves has been receiving growing attention in recent years. Sug- gested applications include signal processing such as
correlation and guided-\vave systems such as microwave analog acoustic systems. ,4 simple trarslucer that could be used on any type o f substrate would be useful in reducing the system coat.
Previowly, wedge transducers and fluid systems have been the principal nleans used to launch and detect surface elastic waves on nonpiezoelectric substrates. These transducers are not convenient for use in many systems that would benefit from elastic surface ~vaves. Comb trans- ducers have been used also, but they too present dif- ficulties.