Structural Engineering and Mechanics, Vol. 42, No. 4 (2012) 489-505 489 Construction stage analysis of fatih sultan mehmet suspension bridge Murat Günaydin * 1 , Süleyman Adanur 2a , Ahmet Can Altuni ik 2b and Bar Sevim 3c Civil Engineering Department, Gümü hane University, 29000, Trabzon, Turkey Civil Engineering Department, Karadeniz Technical University, 61080, Trabzon, Turkey Civil Engineering Department, Y ld z Technical University, 34220, Istanbul, Turkey (Received March 28, 2011, Revised April 2, 2012, Accepted April 11, 2012) Abstract. In this study, it is aim to perform the construction stage analysis of suspension bridges using time dependent material properties. Fatih Sultan Mehmet Suspension Bridge connecting the Europe and Asia in Istanbul is selected as an example. Finite element models of the bridge are modelled using SAP2000 program considering project drawing. Geometric nonlinearities are taken into consideration in the analysis using P-Delta large displacement criterion. The time dependent material strength variations and geometric variations are included in the analysis. Because of the fact that the bridge has steel structural system, only prestressing steel relaxation is considered as time dependent material properties. The structural behaviour of the bridge at different construction stages has been examined. Two different finite element analyses with and without construction stages are carried out and results are compared with each other. As analyses result, variation of the displacement and internal forces such as bending moment, axial forces and shear forces for bridge deck and towers are given with detail. It is seen that construction stage analysis has remarkable effect on the structural behaviour of the bridge. Keywords: construction stage analysis Fatih Sultan Mehmet Suspension Bridge; finite element analysis; time dependent material properties 1. Introduction Bridges are one of the most important engineering structures which are commonly used transportation. Over the last half century a large number of bridges has been built or are under construction all over the world. The use of suspension bridges which has been one of these structures has increased recently. They are built for both crossing the long spans (>550 m) and giving to rise to the usage of domains under the bridge. This kind of bridges has high cost and logistical importance. So, analysis of suspension bridges must be done on the best possible analytical model since structural elements such as deck, towers and cables show different structural behaviour. s is s i i *Corresponding author, Research Assistant, E-mail: [email protected] a Assistant Professor, E-mail: [email protected] b Assistant Professor, E-mail: [email protected] c Assistant Professor, E-mail: [email protected]

Welcome message from author
This document is posted to help you gain knowledge. Please leave a comment to let me know what you think about it! Share it to your friends and learn new things together.
Transcript
Structural Engineering and Mechanics, Vol. 42, No. 4 (2012) 489-505 489
Construction stage analysis of fatih sultan mehmet suspension bridge
Murat Günaydin*1, Süleyman Adanur2a, Ahmet Can Altuni ik2b and Bar Sevim3c
1Civil Engineering Department, Gümü hane University, 29000, Trabzon, Turkey2Civil Engineering Department, Karadeniz Technical University, 61080, Trabzon, Turkey
3Civil Engineering Department, Y ld z Technical University, 34220, Istanbul, Turkey
(Received March 28, 2011, Revised April 2, 2012, Accepted April 11, 2012)
Abstract. In this study, it is aim to perform the construction stage analysis of suspension bridges usingtime dependent material properties. Fatih Sultan Mehmet Suspension Bridge connecting the Europe andAsia in Istanbul is selected as an example. Finite element models of the bridge are modelled usingSAP2000 program considering project drawing. Geometric nonlinearities are taken into consideration inthe analysis using P-Delta large displacement criterion. The time dependent material strength variationsand geometric variations are included in the analysis. Because of the fact that the bridge has steelstructural system, only prestressing steel relaxation is considered as time dependent material properties.The structural behaviour of the bridge at different construction stages has been examined. Two differentfinite element analyses with and without construction stages are carried out and results are compared witheach other. As analyses result, variation of the displacement and internal forces such as bending moment,axial forces and shear forces for bridge deck and towers are given with detail. It is seen that constructionstage analysis has remarkable effect on the structural behaviour of the bridge.
Keywords: construction stage analysis Fatih Sultan Mehmet Suspension Bridge; finite element analysis;time dependent material properties
1. Introduction
Bridges are one of the most important engineering structures which are commonly used
transportation. Over the last half century a large number of bridges has been built or are under
construction all over the world. The use of suspension bridges which has been one of these
structures has increased recently. They are built for both crossing the long spans (>550 m) and
giving to rise to the usage of domains under the bridge. This kind of bridges has high cost and
logistical importance. So, analysis of suspension bridges must be done on the best possible
analytical model since structural elements such as deck, towers and cables show different structural
behaviour.
sç isç
sç
i i
*Corresponding author, Research Assistant, E-mail: [email protected] Professor, E-mail: [email protected] Professor, E-mail: [email protected] Professor, E-mail: [email protected]
490 Murat Günaydin, Süleyman Adanur, Ahmet Can Altuni ik and Bar Sevimsç isç
To obtain the structural behaviour of the suspension bridges under variable loads, finite element
analysis is carried out. But, in the analytical solutions based on finite element models, it is assumed
that the structure is built and loaded in a second. However, this type of analysis does not always
give the reliable solutions. Because, construction period of this type of the structures continue along
time and loads may be change during this period. So, construction stages and time dependent
material properties should be considered in the analysis to obtain the more reliable results.
Therefore, analysis of suspension bridges is carried out considering construction stages and time
dependent material properties.
In the literature, there are some papers about the construction stage analysis of the bridges
considering time dependent material properties. Ko et al. (1998) calculated the dynamic
characteristics such as natural frequencies and mode shapes of suspension deck in construction
stages. The Tsing Ma suspension bridge with a main span of 1377 m and an overall length of 2160
m is performed. Kwak and Seo (2002) determine the time dependent behaviour of precast
prestressed concrete girder bridge. To analyze the long-term behaviour of bridges, the effects of
creep, the shrinkage of concrete, and the cracking of concrete slabs in the moment regions is
considered. Cheng et al. (2003) carried out the wind induced load capacity of a long span steel arch
bridge during two construction stages. The Lupu Bridge which has 550 m central span length and
100 m side spans is selected as a case study. Wang et al. (2004) analyzed a cable stayed bridge
during construction using the cantilever method. Two computational processes, one is a forward
process analysis and the other is a backward process analysis are established. Pindado et al. (2005)
investigated the influence of the section shape of box girder decks on the moments during
construction stages experimentally. Karakaplan et al. (2007) performed the construction stage
analysis of a cable supported pedestrian bridge considering time dependent material strength
variations. Analysis results are compared with the conventional finite element analysis and the
differences are determined. Cho and Kim (2008) carried out probabilistic risk assessment for the
construction stages of the Hanbit suspension bridge. The bridge is under construction and will be
one of the longest suspension bridges in Korea in 2010. The main span is designed to be 850 m
with two side spans of 255 and 220 m each. Tensile forces for main cables and deflections for
stiffening girders are controlled for each construction stages. Dost and Dedeo lu (2008) studied
about design and construction stages of Fatih Sultan Mehmet Bridge. Design criteria and basic
technical data related to construction phase are explained. Somja and Goyet (2008) studied about
nonlinear finite element analysis of segmentally constructed cable stayed bridge. Time dependent
effects including load history, creep, shrinkage and aging of the concrete are considered in the
analyses. Modification of the bridge topology has been carried out using an efficient procedure for
creating/removing elements. Altun k et al. (2009) performed the construction stage analysis of
Kömürhan Highway Bridge. The bridge is a reinforced concrete box girder bridge and constructed
with balanced cantilever method, located on the 51st km of Elaz -Malatya highway. Adanur and
Günayd n (2010) studied about construction stage analysis of Bosporus Suspension Bridge.
Bosporus Suspension Bridge connecting the Europe and Asia in Istanbul is selected as an example.
Two different finite element analyses with and without construction stages are carried out and
results are compared with each other. Ates (2010) studied about analytical modelling of continuous
concrete box girder bridges considering construction stages. Budan Bridge is selected as a numerical
example. The Bridge constructed with balanced cantilever method and located on Artvin-Erzurum
highway, Turkey, at 55+729-56+079.000 kilometers The structural behaviour of the bridge at
different construction stages has been examined. As analyses result, variation of internal forces such
go
isçi
igo
i
Construction stage analysis of fatih sultan mehmet suspension bridge 491
as bending moment, shear forces and axial forces, and displacements for bridge deck and pier are
given with detail. Soyluk et al. (2010) carried out time dependent nonlinear analysis of segmentally
erected cable-stayed bridges. The analysis phase is divided into two phases: The construction phase
and the service phase. In the analyses, while 33 stages which cover 970 days are considered for the
construction phase, 3 stages which lasts up to 10 years are used for the service phase. The analytical
models of the selected numerical example are solved by considering the self weight and the time-
dependent nonlinear effects. The bridge responses are then compared with respect to the time-
dependent effects. The results of the study show that time-dependent effects can have important
effects on cable-stayed bridges. Beside these studies, more studies exist in the literature about the
structural behaviour of suspension bridges (Li et al. 2010, Ubertini 2010, Wang et al. 2010, Nikitas
et al. 2011, Zhang et al. 2011). As seen in literature, studies on construction stage analysis are
meagre and need to be enlarged by inserting new studies. In the light of aforementioned researches,
construction stage analysis of suspension bridges using time dependent material properties is
performed in this paper. Time dependent material property is considered as relaxation for steel.
2. Description of Fatih Sultan Mehmet Suspension Bridge
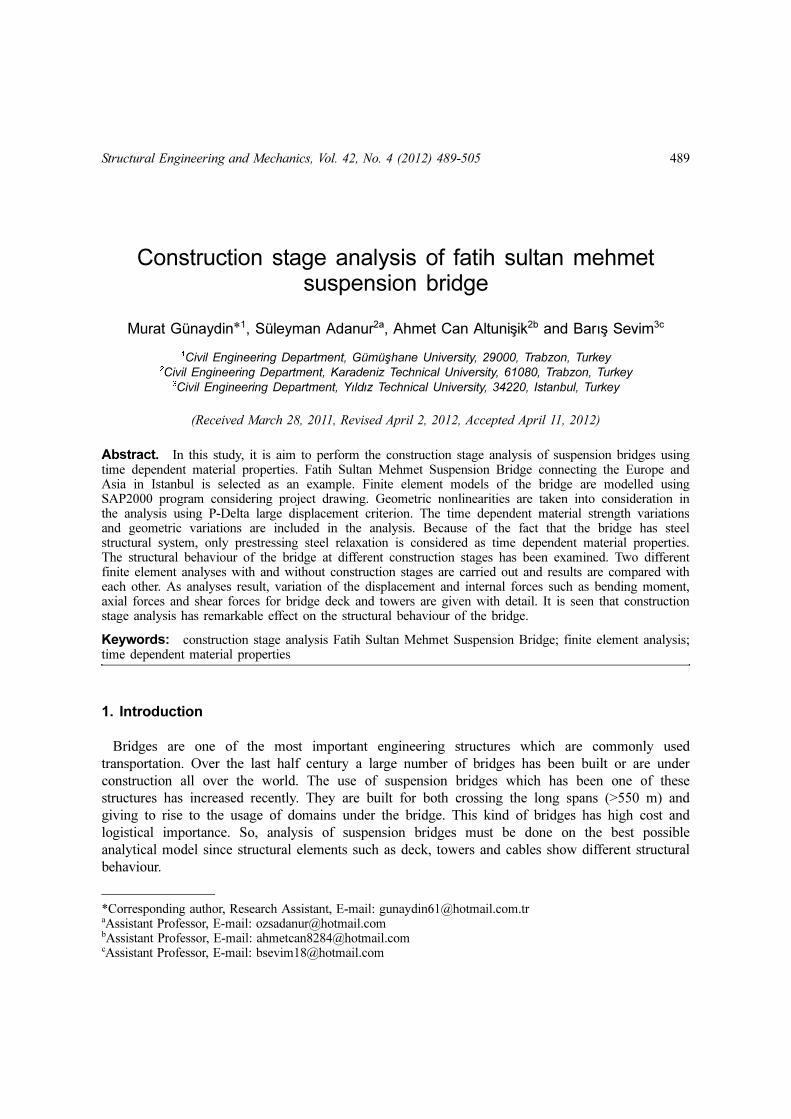
Fatih Sultan Mehmet Suspension Bridge (Fig. 1) connecting the Europe and Asia Continents in
Istanbul, Turkey. Construction of the bridge started in 1985 and completed in 1988. The bridge has
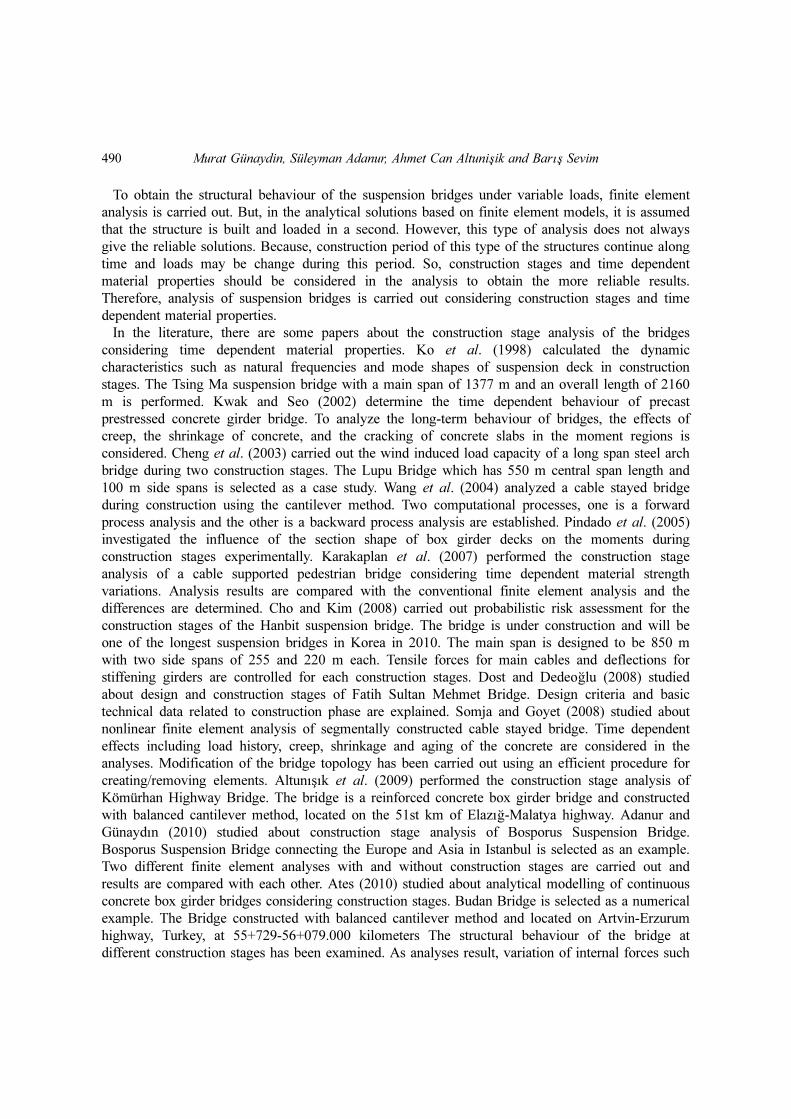
a box girder deck with 39.4 m wide overall and 1090 m long. There are no side spans and the steel
towers rise 110 m above ground level. The hangers are vertical and connect to the deck and cable
with singly hinged bearing. The horizontal distance between the cables is 33.8 m and the roadway
is 28 m wide, accommodating two four-lane highways. The roadway at the mid-span of the bridge
is approximately 64 m above the sea level. Schematic representation of Fatih Sultan Mehmet Bridge
including dimension given in Fig. 2.
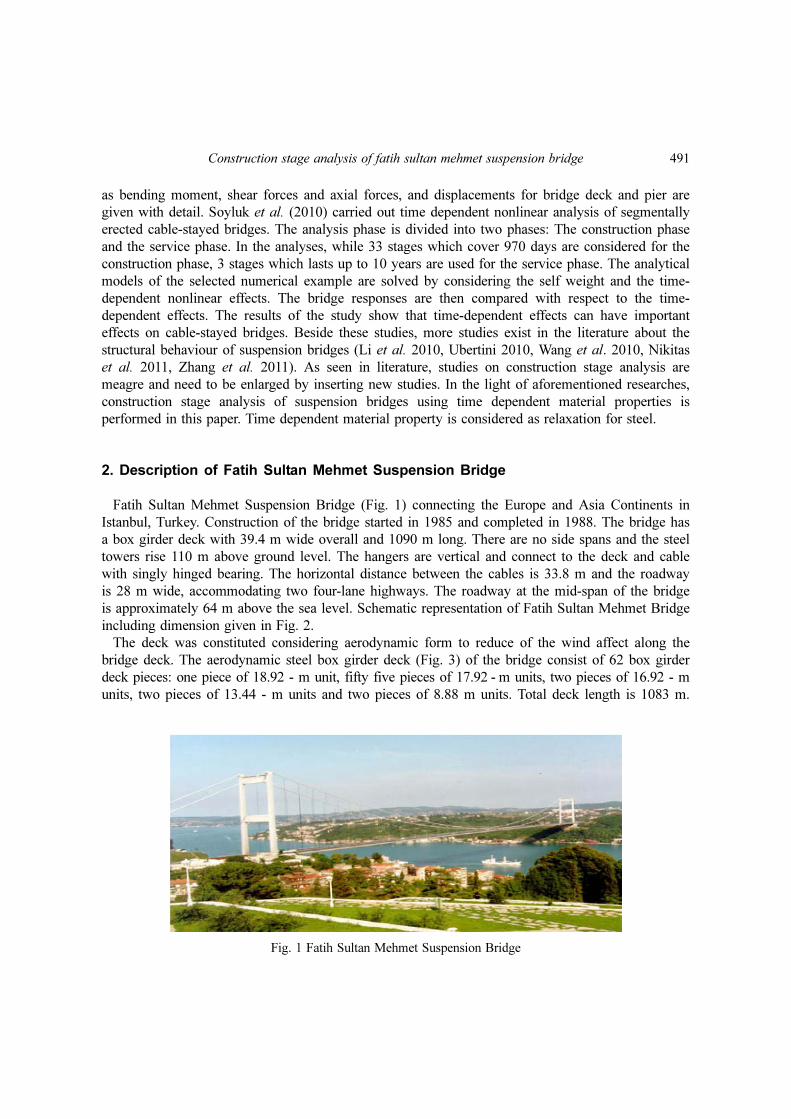
The deck was constituted considering aerodynamic form to reduce of the wind affect along the
bridge deck. The aerodynamic steel box girder deck (Fig. 3) of the bridge consist of 62 box girder
deck pieces: one piece of 18.92 - m unit, fifty five pieces of 17.92 - m units, two pieces of 16.92 - m
units, two pieces of 13.44 - m units and two pieces of 8.88 m units. Total deck length is 1083 m.
Fig. 1 Fatih Sultan Mehmet Suspension Bridge
492 Murat Günaydin, Süleyman Adanur, Ahmet Can Altuni ik and Bar Sevimsç isç
The deck has a 33.80 m × 3 m box section and two cantilever sidewalks of 2.80 m at each side.
Total width of the deck is 39.40 m. The top of each box section constitutes an orthotropic plate on
which 35 mm thickness mastic asphalt surfacing is laid.
The bridge has steel towers of 110 m above ground level. These towers consist of a variable
section. The width of the section decreases from 5000 mm at the base to 3000 mm at the top of the
tower. The tower length could be divided into eight similar section each 13100 mm long - a length
suitable for fabrication. Vertical tower legs are connected by two horizontal portal beams.
Dimension of towers are given in Fig. 4.
The main cables made up highly tensile and galvanized steel wire (Fig. 5). Each main cable has
32 strands, which extend from anchorage to anchorage with an addition of 4 thinner strands in the
backstays between anchorages and main tower saddles. The main strands contain 504 wires each
and the thinner strands 288 and 264 wires. The diameter of wires is 5.38 mm. Finally, the cross-
section area of the cables on the main span is 0.7333 mm2 and of the backstays is 0.7835 mm2.
Hangers of the bridge have been formed at the vertical shape. The cable clamps have been erected
along the main cables with 17.92 m intervals and tightened to the cable surface by mean of rods.
Each hanger has 76 mm diameter and tensile strength of 370 tons.
Fig. 2 Schematic representation including dimension
Fig. 3 Dimensions of aerodynamic steel box girder deck (dimensions as mm)

Construction stage analysis of fatih sultan mehmet suspension bridge 493
Fig. 4 Dimensions of towers (dimensions as mm)
Fig. 5 Cross-section of (a) backstay and (b) between towers of the cables
494 Murat Günaydin, Süleyman Adanur, Ahmet Can Altuni ik and Bar Sevimsç isç
3. Finite element analysis
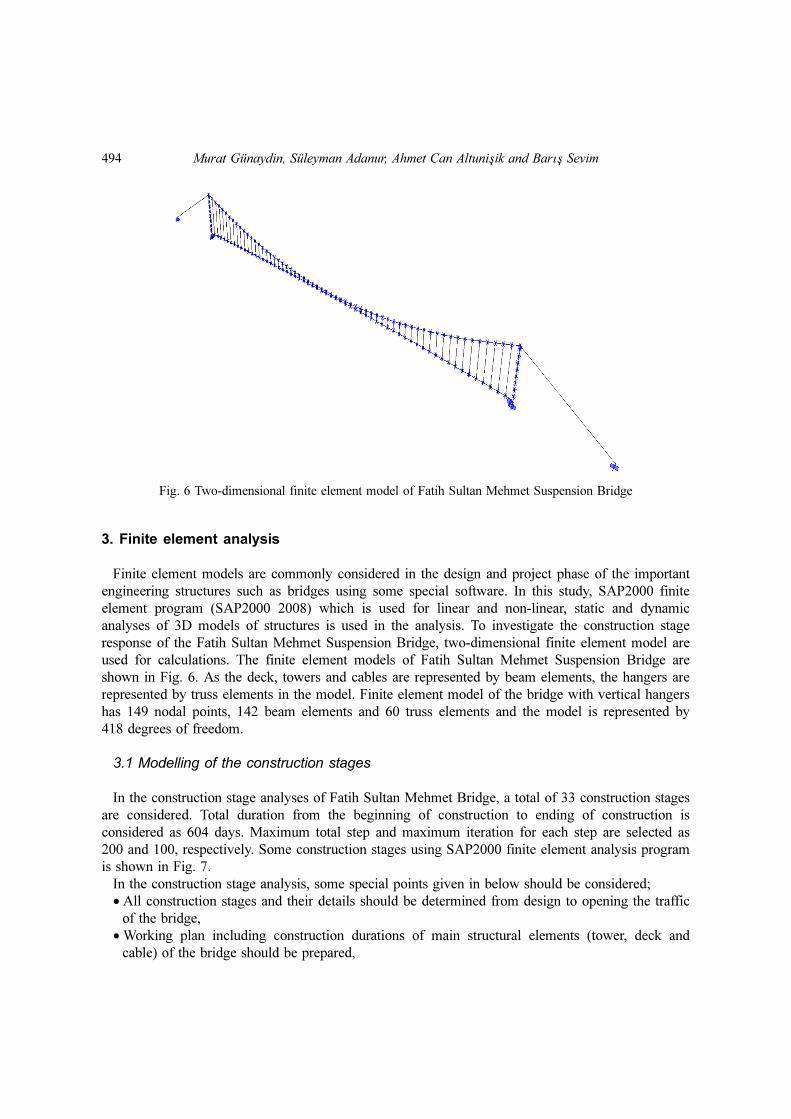
Finite element models are commonly considered in the design and project phase of the important
engineering structures such as bridges using some special software. In this study, SAP2000 finite
element program (SAP2000 2008) which is used for linear and non-linear, static and dynamic
analyses of 3D models of structures is used in the analysis. To investigate the construction stage
response of the Fatih Sultan Mehmet Suspension Bridge, two-dimensional finite element model are
used for calculations. The finite element models of Fatih Sultan Mehmet Suspension Bridge are
shown in Fig. 6. As the deck, towers and cables are represented by beam elements, the hangers are
represented by truss elements in the model. Finite element model of the bridge with vertical hangers
has 149 nodal points, 142 beam elements and 60 truss elements and the model is represented by
418 degrees of freedom.
3.1 Modelling of the construction stages
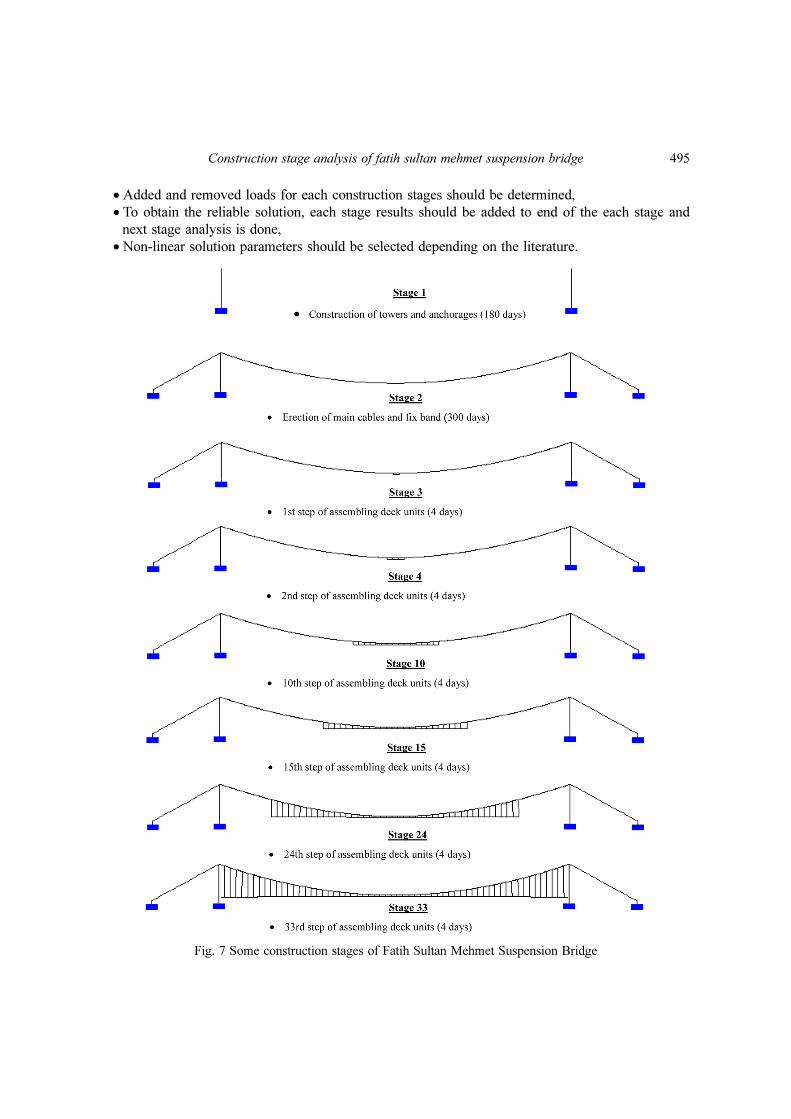
In the construction stage analyses of Fatih Sultan Mehmet Bridge, a total of 33 construction stages
are considered. Total duration from the beginning of construction to ending of construction is
considered as 604 days. Maximum total step and maximum iteration for each step are selected as
200 and 100, respectively. Some construction stages using SAP2000 finite element analysis program
is shown in Fig. 7.
In the construction stage analysis, some special points given in below should be considered;
• All construction stages and their details should be determined from design to opening the traffic
of the bridge,
• Working plan including construction durations of main structural elements (tower, deck and
cable) of the bridge should be prepared,
Fig. 6 Two-dimensional finite element model of Fatih Sultan Mehmet Suspension Bridge
Construction stage analysis of fatih sultan mehmet suspension bridge 495
• Added and removed loads for each construction stages should be determined,
• To obtain the reliable solution, each stage results should be added to end of the each stage and
next stage analysis is done,
• Non-linear solution parameters should be selected depending on the literature.
Fig. 7 Some construction stages of Fatih Sultan Mehmet Suspension Bridge
496 Murat Günaydin, Süleyman Adanur, Ahmet Can Altuni ik and Bar Sevimsç isç
3.2 Time dependent material properties
In the construction stage analysis of bridges, time dependent material properties such as elasticity
modulus, creep and shrinkage for concrete and relaxation for the prestressed steel should be
considered, because they are variable due to the climate during construction (Altun k 2010,
Altun k et al. 2010). For example, strength of the concrete increase continuously at 7th, 28th and
1000th days of concreting. If these properties are not considered in the analysis, analysis of the
bridges may not give the reliable results. In this study, Fatih Sultan Mehmet Suspension Bridge has
steel structural system, so only prestressing steel relaxation is considered as time dependent material
properties.
The iterative calculations at each construction stage considering added stiffness from the initial
equilibrium state. The matrix form of finite element method is given the following equation
{F}= [K]{U} (1)
where [K] is the stiffness matrix including elastic stiffness matrix and geometric stiffness matrix.
The finite element analysis is performed at each construction stages of the bridge by using
SAP2000.
3.2.1 Compressive strength
The compressive strength of concrete at an age t depends on the type of cement, temperature and
curing conditions. The relative compressive strength of concrete at various ages may be estimated
by the following formula (CEB-FIP 1990)
(2)
in which is a coefficient with depends on the age of concrete and is calculated by
(3)
is the mean concrete compressive strength at an age of t days, fcm is the meancompressive
strength after 28 days, t is the age of concrete in days and s is a cement type coefficient.
3.2.2 Aging of concrete
The modulus of elasticity of concrete changes with time. For this reason, the modulus at an age
days may be estimated as below equation
(4)
where is the modulus of elasticity at age of t days, Eci is the modulus of elasticity at an age
of 28 days, is a coefficient which depends on the age of concrete.
3.2.3 Shrinkage of concrete
The CEB-FIP Model Code gives the following equation of total shrinkage strain of concrete
isçi
isçi
fcm t( ) βcc t( )fcm=
βcc t( )
βcc t( ) exp s 128
t/t1-------⎝ ⎠⎛ ⎞ 1/2–
⎩ ⎭⎨ ⎬⎧ ⎫
=
fcm t( )
t 28≠
Eci t( ) Eci βcc t( )=
Eci t( )βcc t( )
Construction stage analysis of fatih sultan mehmet suspension bridge 497
(5)
where is notional shrinkage coefficient, is the coefficient to describe the development of
shrinkage with time, t is the age of concrete in days and is the age of concrete in days at the
beginning of shrinkage. The notional shrinkage coefficient may be obtained from
(6.a)
(6.b)
where fcm is the mean compressive strength of concrete at the age of 28 days in MPa; fcmo is taken
as 10 MPa; is a coefficient ranging from 4 to 8 which depends on the type of cement.
(7)
where
(8)
with RH is the relative humidity of the ambient atmosphere (%) and RHo is 100%. The
development of shrinkage with time is given by
(9)
where h is the notional size of member (mm) and is calculated by in which Ac is the
cross-section and u is the perimeter of the member in contact with the atmosphere; ho = 100 mm
and t1 = 1 day.
3.2.4 Creep
The effect is calculated using CEB-FIP Model Code (1990) creep model. For a constant stress
applied at time to, this leads to
(10)
in which is the stress at an age of loading to, is the creep coefficient and is
calculated from
(11)
where βc is the coefficient to describe the development of creep with time after loading, t is the age
of concrete in days at the moment considered, to is the age of concrete at loading in days. The
creep coefficient is explained by
εcs t ts,( ) εcsoβs t ts–( )=
εcso βs
ts
εcso εs fcm( )βRH=
εs fcm( ) 160 10βsc 9fcmfcmo
--------–⎝ ⎠⎛ ⎞+=
βsc
βRH 1.55βsRH–= 40% RH≤ 99%<
RRH 0.25= RH 99%≥
βsRH 1RH
RHo
----------⎝ ⎠⎛ ⎞3–=
βs t ts–( )t ts–( )/t1
350 h/ho( ) t ts–( )/t1+--------------------------------------------------=
h 2Ac/u=
εcc t to,( )σc to( )
Eci
--------------φ t to,( )=
σc to( ) φ t to,( )
φ t to,( ) βc t to–( )φo=
498 Murat Günaydin, Süleyman Adanur, Ahmet Can Altuni ik and Bar Sevimsç isç
(11.a)
(11.b)
(11.c)
(11.d)
All parameter is defined above. The development of creep with time is given by
(12.a)
(12.b)
where t1 = 1 day; RHo = 100 and ho = 100 mm.
3.2.5 Relaxation of steel
According to CEB-FIB Model Code (1990), relaxation classes referring to the relaxation at 1000
hours are divided into three groups for prestressing steels. The first relaxation class is defined as the
normal relaxation characteristics for wires and strands, the second class is defined as improved
relaxation characteristics for wires and strands, and the last one is defined as relaxation
characteristics for bars.
For an estimate of relaxation up to 30 years the following formula may be applied
(13)
where is the relaxation after t hours; is the relaxation after 1000 hours;
in which k to be 0.12 for relaxation class1, and 0.19 relaxation class2; is the relaxation after
100 hours. Normally, the long-term values of the relaxation are taken from long-term tests.
However, it may be assumed that the relaxation after 50 years and more is three times the relaxation
after 1000 hours.
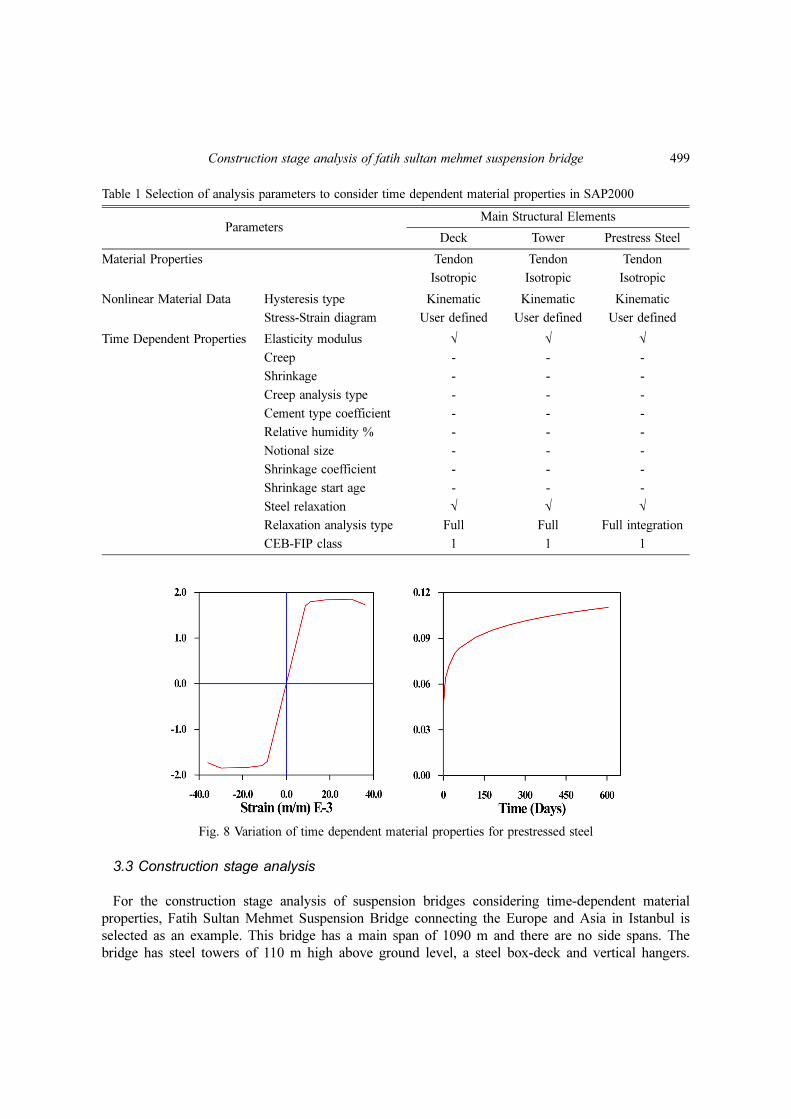
Selected analysis parameters to consider time dependent material properties are given in Table 1.
Variation of time dependent material properties used for prestressed steel is given in Fig. 8. These
parameters are selected from CEB-FIP design code (CEB-FIP 1990) in SAP2000. According to the
parameters given in Table 1, these graphics may be changed automatically. Total duration from the
beginning of construction to ending of construction is considered as 604 days.
φo φRHβ fcm( )β to( )=
φRH 1
1RH
RH0
----------⎝ ⎠⎛ ⎞–
0.46h
ho
-----⎝ ⎠⎛ ⎞ 1/3
--------------------------+=
β fcm( ) 5.3
fcm
fcmo
--------
------------=
β to( )1
0.1to
t1---⎝ ⎠⎛ ⎞
0.2
+
---------------------------=
βo t to–( )t to–( )/t1
βH t to–( )/t1+--------------------------------=
βH 150 1 1.2RH
RHo
----------⎝ ⎠⎛ ⎞ 18+
⎩ ⎭⎨ ⎬⎧ ⎫ h
ho
----- 250+ 1500≤=
ρt ρ1000
t
1000------------⎝ ⎠⎛ ⎞
k
=
ρt ρ1000 k log ρ1000/ρ100( )≈ρ100
Construction stage analysis of fatih sultan mehmet suspension bridge 499
3.3 Construction stage analysis
For the construction stage analysis of suspension bridges considering time-dependent material
properties, Fatih Sultan Mehmet Suspension Bridge connecting the Europe and Asia in Istanbul is
selected as an example. This bridge has a main span of 1090 m and there are no side spans. The
bridge has steel towers of 110 m high above ground level, a steel box-deck and vertical hangers.
Table 1 Selection of analysis parameters to consider time dependent material properties in SAP2000
ParametersMain Structural Elements
Deck Tower Prestress Steel
Material Properties Tendon Tendon Tendon
Isotropic Isotropic Isotropic
Nonlinear Material Data Hysteresis type Kinematic Kinematic Kinematic
Stress-Strain diagram User defined User defined User defined
Time Dependent Properties Elasticity modulus √ √ √
Creep - - -
Shrinkage - - -
Creep analysis type - - -
Cement type coefficient - - -
Relative humidity % - - -
Notional size - - -
Shrinkage coefficient - - -
Shrinkage start age - - -
Steel relaxation √ √ √
Relaxation analysis type Full Full Full integration
CEB-FIP class 1 1 1
Fig. 8 Variation of time dependent material properties for prestressed steel
500 Murat Günaydin, Süleyman Adanur, Ahmet Can Altuni ik and Bar Sevimsç isç
The roadway at the mid-span of the bridge is approximately 64 m above the sea level. Analysis is
performed using SAP2000 program. Nonlinear staged construction and P-Delta plus large
displacements options are selected as analysis type and geometric nonlinearity parameters,
respectively.
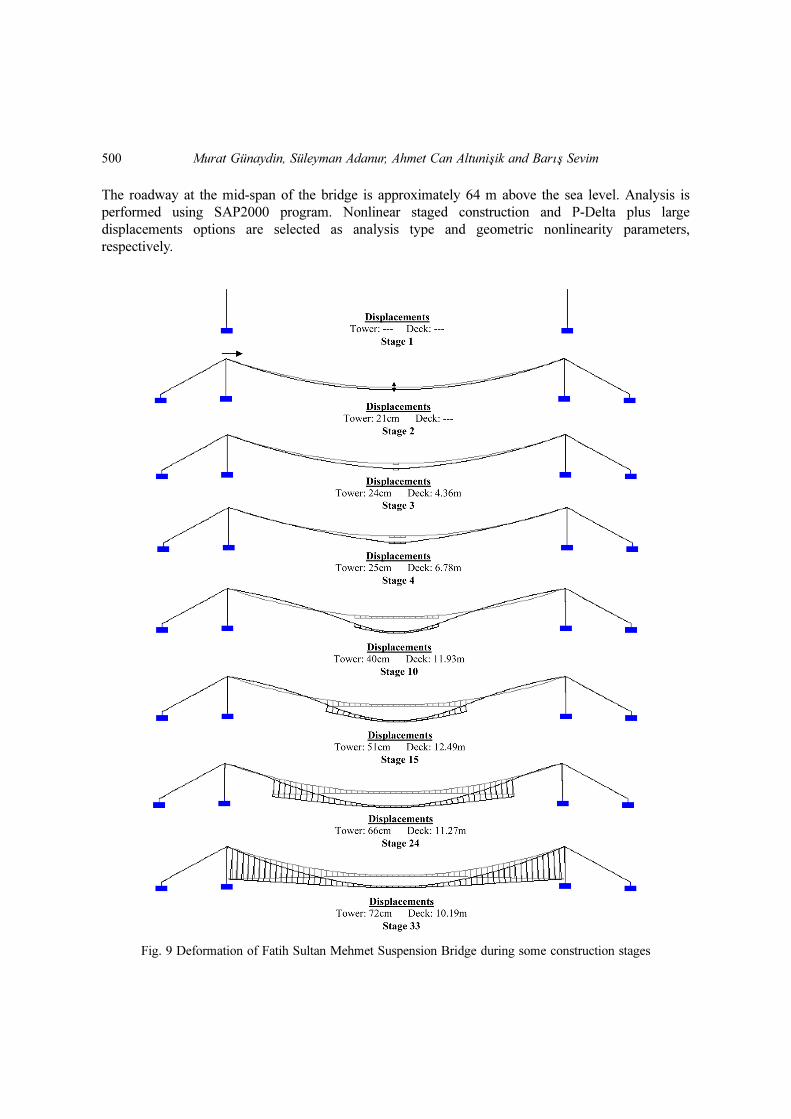
Fig. 9 Deformation of Fatih Sultan Mehmet Suspension Bridge during some construction stages

Construction stage analysis of fatih sultan mehmet suspension bridge 501
3.3.1 Load cases of analysesIn the analyses of the bridge, the following load cases are considered;
• Dead Load: Weight of all elements. They are calculated from the finite element software
directly.
• Additional Mass: Weight of the asphalt, cobble, pipeline and its supports, scarecrow. 40 kN/m
distributed load is added to each segment.
3.3.2 Deformation shapesThe deformations of the bridge at some construction stages are plotted and the maximum vertical
displacements of the bridge deck and maximum horizontal displacements of the bridge tower are
also given in Fig. 9. It is seen that displacements increase along the middle of the bridge deck and
reach a maximum of 12.59 m at the 15th stage for the analysis including the construction stage.
When the construction of the bridge is completed at the 33th stage, maximum displacement is
obtained as 10.19 m at the middle point of the bridge deck. Variation of the displacement increases
along the height of the bridge towers and reach a maximum of 72 cm at the 33th stage.
3.3.3 Deck response
Distributions of vertical displacements and bending moments along the bridge deck are given in
Fig. 10 Changing of maximum displacements and (a) bending moments (b) along the bridge deck

502 Murat Günaydin, Süleyman Adanur, Ahmet Can Altuni ik and Bar Sevimsç isç
Fig. 10. It is seen that displacements have an increasing trend towards to the middle of the bridge
deck and reach a maximum of 10.19 m at the middle for the analysis including the construction
stages. The values of bending moments are nearly equal along the bridge deck as 1.8E4 for the
analysis not including the construction stage. On the other hand, the values of bending moments
increase along to the middle of the bridge deck and reach a maximum of −2.4E5 for the analysis
including the construction stage. Both displacements and bending moments are obtained
symmetrically according to the middle point of the bridge deck. It is seen from Fig. 10 that the
displacements and bending moments obtained from the analyses including construction stages are
significantly bigger than those of not including the construction stages.
3.3.4 Tower response
Variation of maximum displacements along the height of the tower is shown in Fig. 11. It can
easily be seen that the horizontal displacements increase with the height of bridge tower and reach a
maximum of 72 cm at the top for the analysis including the construction stage. But, the value of the
horizontal displacement at the bridge tower top is 67 cm for the analysis not including the
construction stage.
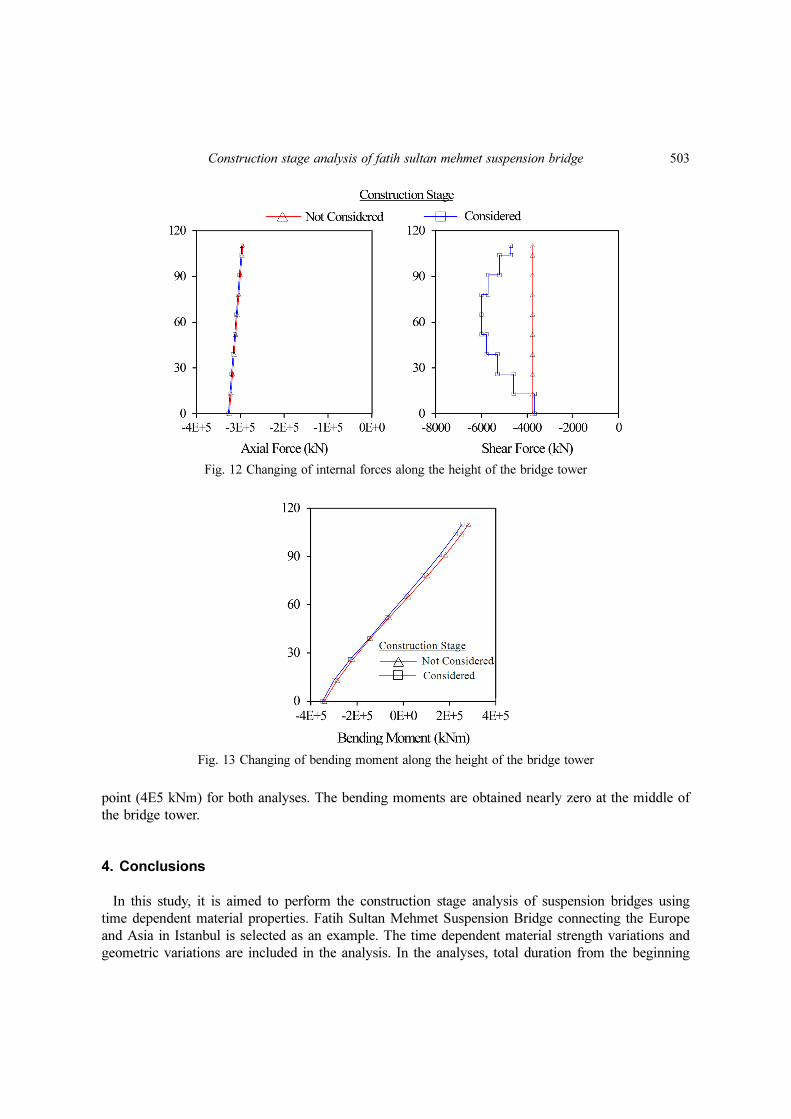
Fig. 12 points out the internal forces such as shear and axial forces of the bridge tower
corresponding to the two analyses. The values of the axial forces are nearly equal along the height
of the bridge tower as −3.3E5 kN for both analyses. The values of the shear forces are nearly equal
along the height of the bridge tower as −0.4E4 kN for the analysis not including the construction
stage, but the values of the shear forces increase along the middle of the bridge tower and degrease
from the middle point to top of the bridge tower for the analysis including the construction stage.
Shear forces increase non-linearly from the base (−0.4E4 kN) to middle point (−0.55E4 kN) and
decrease non-linearly from the middle point (−0.55E4 kN) to top point (−0.4E4 kN). It can be easily
seen from Fig. 12 that construction stage analysis is more effective than the other for both internal
forces.
A variation of bending moment with height of the bridge tower is shown in Fig. 13. It can be
easily seen from Fig. 13 that bending moments changes linearly from the base (-4E5 kNm) to top
Fig. 11 Changing of displacements along to the height of the bridge tower
Construction stage analysis of fatih sultan mehmet suspension bridge 503
point (4E5 kNm) for both analyses. The bending moments are obtained nearly zero at the middle of
the bridge tower.
4. Conclusions
In this study, it is aimed to perform the construction stage analysis of suspension bridges using
time dependent material properties. Fatih Sultan Mehmet Suspension Bridge connecting the Europe
and Asia in Istanbul is selected as an example. The time dependent material strength variations and
geometric variations are included in the analysis. In the analyses, total duration from the beginning
Fig. 12 Changing of internal forces along the height of the bridge tower
Fig. 13 Changing of bending moment along the height of the bridge tower
504 Murat Günaydin, Süleyman Adanur, Ahmet Can Altuni ik and Bar Sevimsç isç
of construction to ending of construction is considered as 604 days. Comparing the results of the
study, the following observations can be made:
• The vertical displacements increase towards to the middle of the bridge deck and reach a
maximum of 10.19 m at the middle for the analysis including the construction stages. On the
other hand, maximum displacement is 8.95 m at the middle for the analysis not including
construction stage. The difference is reached to 1.24 m at the middle of the bridge. The horizontal
displacements increase with the height of bridge tower and reach a maximum of 72 cm at the top
for the analysis including the construction stage. But, maximum displacement is 67 cm at the top
for the analysis not including construction stage.
• The values of bending moments are nearly equal along the bridge deck as 1.8E4 for the analysis
not including the construction stage. On the other hand, the values of bending moments increase
along to the middle of the bridge deck and reach a maximum of −2.4E5 for the analysis including
the construction stage. The values of bending moments obtained from the analyses including
construction stages are significantly bigger than those of not including the construction stages.
• The values of the axial forces are nearly equal along the height of the bridge tower as −3.3E5
kN for both analyses. The values of the shear forces are nearly equal along the height of the
bridge tower as−0.4E4 kN for the analysis not including the construction stage, but the values of
the shear forces increase along the middle of the bridge tower and degrease from the middle point
to top of the bridge tower for the analysis including the construction stage. Shear forces increase
non-linearly from the base (−0.4E4 kN) to middle point (−0.55E4 kN) and decrease non-linearly
from the middle point (−0.55E4 kN) to top point (−0.4E4 kN).
• There are some differences between the results with and without the construction stages. It can
be stated that the analysis without construction stages cannot give the reliable solutions.
• To obtain real behaviour of engineering structures, construction stage analysis using time
dependent material strength variations and geometric variations should be done. Especially it is
very important for suspension bridges, because construction period continue along time and loads
may be change during this period.
References
Adanur, S. and Günayd n, M. (2010), “Construction stage analysis of bosporus suspension bridge”, Proceedingof 9th International Congress on Advances in Civil Engineering, Trabzon, September.
Altun k, A.C., Bayraktar, A., Sevim, B., Domaniç, A. and Adanur, S. (2009), “Construction stage analysis ofbridges using time dependent material properties”, Proceeding of International Symposium on Earthquake,Sakarya, September.
Altun k, A.C., Bayraktar, A., Sevim, B., Adanur, S. and Domaniç, A. (2010), “Construction stage analysis ofkömürhan highway bridge using time dependent material properties”, Struct. Eng. Mech., 36(2), 207-244.
Altun k, A.C. (2010), “Karayolu köprülerinin yapýsal davranýþlarýnýn analitik ve deneysel yöntemlerlebelirlenmesi”, PhD Thesis, Karadeniz Technical University, Trabzon, Turkey. (In Turkish)
Ate , . (2010), “Numerical modelling of continuous concrete box girder bridges considering constructionstages”, Appl. Math. Model., 35(8), 3809-3820.
CEB-FIP Model Code (1990), Thomas Telford, ISBN: 0727716964.Cheng, J., Jiang, J.J., Xiao, R.C. and Xia, M. (2003), “Wind-induced load capacity analysis and parametric study
of a long-span steel arch bridge under construction”, Comput. Struct., 81, 2513-2524.Cho, T. and Kim, T.S. (2008), “Probabilistic risk assessment for the construction phases of a bridge construction
based on finite element analysis”, Finite Elem. Analy. D., 44, 383-400.
i
isçi
isçi
isçi
sç Sç
Construction stage analysis of fatih sultan mehmet suspension bridge 505
Dost, Y. and Dedeo lu, E. (2008), “Design and construction stages of Fatih Sultan Mehmet Bridge”, Proceedingof 1st Collaborative Symposium of Turk-Japan Civil Engineers, Istanbul, June.
Karakaplan, A., Caner, A., Kurç, Ö., Domaniç, A. and Lüleç, A. (2007), “New strategy in the structural analysis:construction stage”, Proceeding of 1st Symposium of Bridges and Viaducts, Antalya, November.
Ko, J.M., Xue, S.D. and Xu, Y.L. (1998), “Modal analysis of suspension bridge deck units in erection stage”,Eng. Struct., 20, 1102-1112.
Kwak, H.G. and Seo, Y.J. (2002), “Numerical analysis of time-dependent behaviour of pre- cast pre-stressedconcrete girder bridges”, Constr. Buil. Mater., 16, 49-63.
Li, Z., Li, A. and Zhang, J. (2010), “Effect of boundary conditions on modal parameters of the Run YangSuspension Bridge”, Smart Struct. Syst., 6(8), 905-920.
Nikitas, N., Macdonald, J.H.G. and Jakobsen, J.B. (2011), “Identification of flutter derivatives from full-scaleambient vibration measurements of the Clifton Suspension Bridge”, Wind Struct., 14(3), 221-238.
Pindado, S., Meseguer, J. and Franchini, S. (2005), “The influence of the section shape of box-girder decks onthe steady aerodynamic yawing moment of double cantilever bridges under construction”, J. Wind Eng. Indus.Aerod., 93, 547-555.
SAP2000 (2008), Integrated Finite Element Analysis and Design of Structures, Computers and Structures Inc,Berkeley, California, USA.
Somja, H. and Goyet, V.V. (2008), “A New strategy for analysis of erection stages including an efficient methodfor creep analysis”, Eng. Struct., 30, 2871-2883.
Soyluk, K., Diri, T.G. and S cac k, E.A. (2010), “Time dependent nonlinear analysis o segmentally erected cable-stayed bridges”, Proceeding of 9th International Congress on Advances in Civil Engineering, Trabzon,September.
Ubertini, F. (2010), “Prevention of Suspension Bridge flutter using multiple tuned mass dampers”, Wind Struct.,13(3), 235-256.
Wang, P.H., Tang, T.Y. and Zheng, H.N. (2004), “Analysis of cable-stayed bridges during construction bycantilever methods”, Comput. Struct., 82, 329-346.
Wang, S.Q., Xia, H., Guo, W.W. and Zhang, N. (2010), “Nonlinear dynamic response analysis of a long-spanSuspension Bridge under running train and turbulent wind”, Interact. Multis. Mech., 3(4), 309-320.
Zhang, W.M., Ge, Y.J. and Levitan, M.L. (2011), “Aerodynamic flutter analysis of a new Suspension Bridgewith double main spans”, Wind Struct., 14(3), 187-208.
go
i i
Related Documents


![1 1 1 1 1 1 1 ¢ 1 1 1 - pdfs.semanticscholar.org€¦ · 1 1 1 [ v . ] v 1 1 ¢ 1 1 1 1 ý y þ ï 1 1 1 ð 1 1 1 1 1 x ...](https://static.cupdf.com/doc/110x72/5f7bc722cb31ab243d422a20/1-1-1-1-1-1-1-1-1-1-pdfs-1-1-1-v-v-1-1-1-1-1-1-y-1-1-1-.jpg)


![1 1 1 1 1 1 1 ¢ 1 , ¢ 1 1 1 , 1 1 1 1 ¡ 1 1 1 1 · 1 1 1 1 1 ] ð 1 1 w ï 1 x v w ^ 1 1 x w [ ^ \ w _ [ 1. 1 1 1 1 1 1 1 1 1 1 1 1 1 1 1 1 1 1 1 1 1 1 1 1 1 1 1 ð 1 ] û w ü](https://static.cupdf.com/doc/110x72/5f40ff1754b8c6159c151d05/1-1-1-1-1-1-1-1-1-1-1-1-1-1-1-1-1-1-1-1-1-1-1-1-1-1-w-1-x-v.jpg)