INTRODUCTION Mathematical skills refer to skills which students are expected to use to solve mathematical problems, for example, approximation and estimation, arithmetic manipulation, algebraic manipulation and data handling. APPROXIMATION AND ESTIMATION This sub-topic will define approximation and estimation in greater depth. 8.1.1 Approximation Approximation is an operation of rounding off a certain number to a value nearest to the place value stated. A number can be rounded to the nearest ten, hundred, thousand, etc. 8.1 T T o o p p i i c c 8 8 X Mathematical Skills LEARNING OUTCOMES By the end of this topic, you should be able to: 1. Differentiate between estimations and approximations of arithmetic results; 2. Apply simple calculations for everyday use; 3. Write algebraic statements; 4. Write simple equations; and 5. Interpret tables, graphs, diagrams and charts which convey quantitative information.

Welcome message from author
This document is posted to help you gain knowledge. Please leave a comment to let me know what you think about it! Share it to your friends and learn new things together.
Transcript
7/28/2019 15152908 Topic 8 Mathematical Skills
http://slidepdf.com/reader/full/15152908-topic-8-mathematical-skills 1/17
INTRODUCTION
Mathematical skills refer to skills which students are expected to use to solvemathematical problems, for example, approximation and estimation, arithmeticmanipulation, algebraic manipulation and data handling.
APPROXIMATION AND ESTIMATION
This sub-topic will define approximation and estimation in greater depth.
8.1.1 Approximation
Approximation is an operation of rounding off a certain number to a value nearestto the place value stated. A number can be rounded to the nearest ten, hundred,thousand, etc.
8.1
TTooppiicc 88
X Mathematical
Skills
LEARNING OUTCOMES
By the end of this topic, you should be able to:
1. Differentiate between estimations and approximations of arithmeticresults;
2. Apply simple calculations for everyday use;
3. Write algebraic statements;
4. Write simple equations; and
5. Interpret tables, graphs, diagrams and charts which conveyquantitative information.

7/28/2019 15152908 Topic 8 Mathematical Skills
http://slidepdf.com/reader/full/15152908-topic-8-mathematical-skills 2/17
7/28/2019 15152908 Topic 8 Mathematical Skills
http://slidepdf.com/reader/full/15152908-topic-8-mathematical-skills 3/17
TOPIC 8 MATHEMATICAL SKILLS W 103
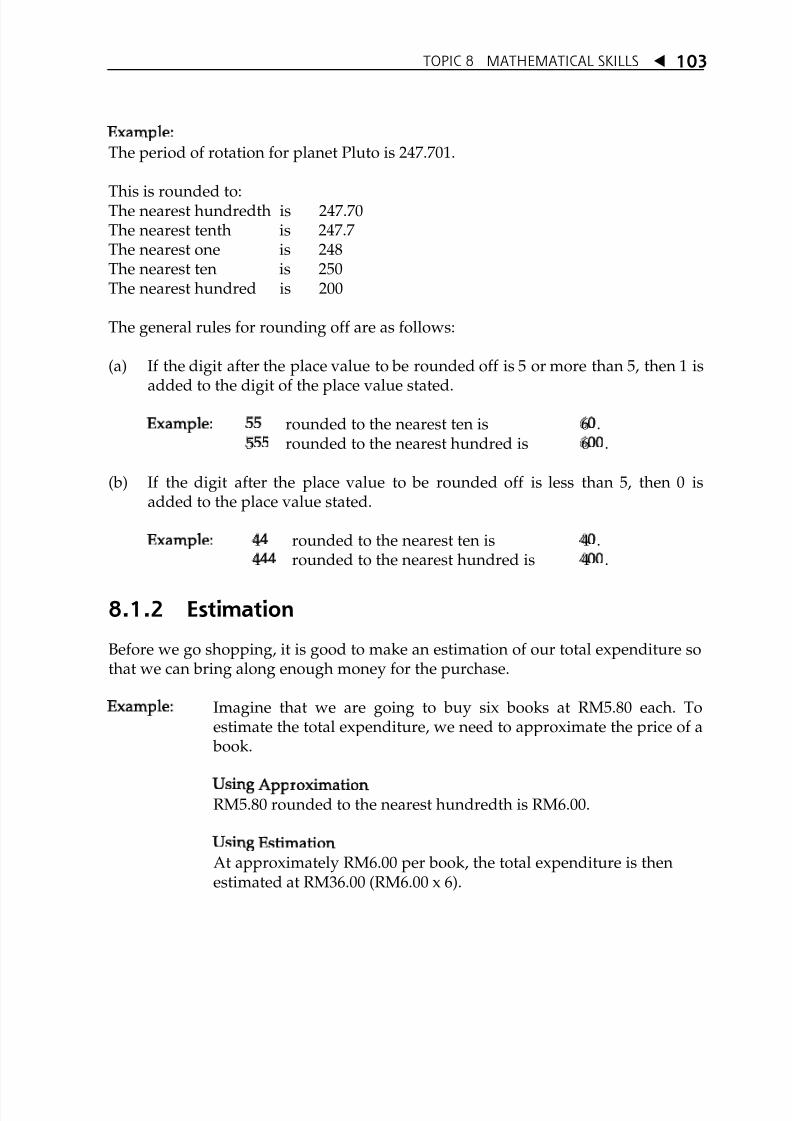
Example: The period of rotation for planet Pluto is 247.701.
This is rounded to:The nearest hundredth is 247.70The nearest tenth is 247.7The nearest one is 248The nearest ten is 250The nearest hundred is 200
The general rules for rounding off are as follows:
(a) If the digit after the place value to be rounded off is 5 or more than 5, then 1 is
added to the digit of the place value stated.
Example: 55 rounded to the nearest ten is 60.555 rounded to the nearest hundred is 600.
(b) If the digit after the place value to be rounded off is less than 5, then 0 isadded to the place value stated.
Example: 44 rounded to the nearest ten is 40.444 rounded to the nearest hundred is 400.
8.1.2 Estimation
Before we go shopping, it is good to make an estimation of our total expenditure sothat we can bring along enough money for the purchase.
Example: Imagine that we are going to buy six books at RM5.80 each. Toestimate the total expenditure, we need to approximate the price of a
book.
Using ApproximationRM5.80 rounded to the nearest hundredth is RM6.00.
Using EstimationAt approximately RM6.00 per book, the total expenditure is thenestimated at RM36.00 (RM6.00 x 6).

7/28/2019 15152908 Topic 8 Mathematical Skills
http://slidepdf.com/reader/full/15152908-topic-8-mathematical-skills 4/17
X TOPIC 8 MATHEMATICAL SKILLS104
ARITHMETIC MANIPULATION
To be successful in any career, a good grasp of basic arithmetic is needed. You musthave a sound foundation of arithmetic skills before you can begin to engage in anyreal problem solving.
8.2.1 Working with Whole Numbers and Their Signs
First, let us learn how to work with whole numbers (called integers), with their signs
(+ or ă).
(a) Multiplying: When you multiply two numbers, the answer is their product.If the two numbers have the same sign, the sign of the productis +. If they differ, the product is ă.
Examples: (+ 7) u (+ 3) = + 21
(ă 4) u (ă 5) = + 20
(ă3) u (+ 6) = ă 18
8.2
What is the difference between approximation and estimation?
SELF-CHECK 8.1
1. Very often, the process of estimation involves approximation. Forinstance, estimate the answer for 49.5 x 1.23. Was there a process of approximation as well? Discuss.
2. Complete the following:The period of rotation for the planet Saturn is 29.458.
Rounded to:
i. The nearest hundredth is _________________
ii. The nearest tenth is _________________
iii. The nearest one is _________________
ACTIVITY 8.1

7/28/2019 15152908 Topic 8 Mathematical Skills
http://slidepdf.com/reader/full/15152908-topic-8-mathematical-skills 5/17
TOPIC 8 MATHEMATICAL SKILLS W 105
(b) Dividing: If you divide one number by another number, the rules arethe same as multiplication.
Examples: (+ 25) / (+ 5) = + 5(ă 40) /(ă 8) = + 5(+ 21)/ (ă 3) = ă 7
(c) Adding: If the two numbers have the same sign, you add theirabsolute values and affix their common sign. If they differ,find the difference of their absolute values and affix the sign of the number with the larger absolute value.
Examples: (+ 13) + (ă 3) = 13 ă 3 = 10
(ă 5) + (ă 6) = ă5 ă 6 = ă 11
(d) Subtracting: To subtract one number with a negative sign from another,change the sign of the number being subtracted and proceed asin addition.
Examples: (+ 18) ă (ă 3) = 18 + 3 = 21(ă 21) ă (ă 5) = ă21 + 5 = ă16
It is important for everyone to know the order in which the operations areperformed so that the right result is obtained. The following order of operations isuniversally accepted:
(i) First, perform operations within parentheses.
(ii) Then, perform multiplications and divisions from left to right.
(iii) After that, perform additions and subtractions from left to right.

7/28/2019 15152908 Topic 8 Mathematical Skills
http://slidepdf.com/reader/full/15152908-topic-8-mathematical-skills 6/17
X TOPIC 8 MATHEMATICAL SKILLS106
8.2.2 Working with Fractions
Here are a number of rules to follow when working with fractions.
(a) When you add or subtract fractions, express both fractions to the samedenominator before you simplify it.
If the denominators are of different multiples, then use the highest multiple.For instance, in the following example, 3 and 9 are both multiples of 3, so thehighest multiple of both denominators is 9.
Example: 2 5 11 2
or 13 9 9 9
In order for4
5to have a denominator of 9, the denominator 3 is multiplied by
3. Hence, the numerator 2 must also be multiplied by 3 to become 6. Now that both fractions have the same denominator, you can add or subtract thenumbers.
If one or more of the fractions is a mixed number, turn them into improperfractions. An improper fraction has a numerator larger than the denominator.
Example: 1 5 1 9
2 , 42 2 2 2
After your birthday party, there were two and three quarter cakes lefton the table. Express the number of cakes in terms of a mixed numberand then convert the number into an improper fraction.
SELF-CHECK 8.2
7/28/2019 15152908 Topic 8 Mathematical Skills
http://slidepdf.com/reader/full/15152908-topic-8-mathematical-skills 7/17
TOPIC 8 MATHEMATICAL SKILLS W 107
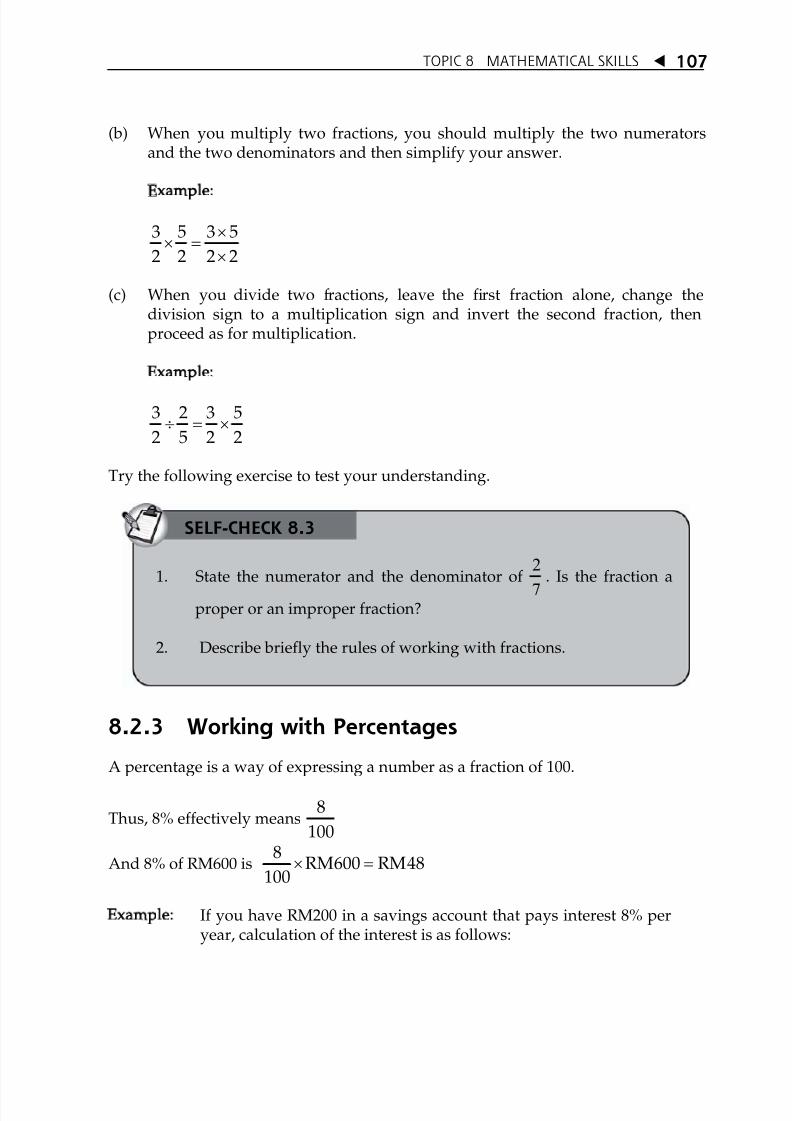
(b) When you multiply two fractions, you should multiply the two numeratorsand the two denominators and then simplify your answer.
Example:
uu
u
3 5 3 5
2 2 2 2
(c) When you divide two fractions, leave the first fraction alone, change thedivision sign to a multiplication sign and invert the second fraction, thenproceed as for multiplication.
Example:
3 2 3 5
2 5 2 2y u
Try the following exercise to test your understanding.
8.2.3 Working with Percentages
A percentage is a way of expressing a number as a fraction of 100.
Thus, 8% effectively means8
100
And 8% of RM600 is u 8
RM600 RM48100
Example: If you have RM200 in a savings account that pays interest 8% peryear, calculation of the interest is as follows:
1. State the numerator and the denominator of 4
9
. Is the fraction a
proper or an improper fraction?
2. Describe briefly the rules of working with fractions.
SELF-CHECK 8.3
7/28/2019 15152908 Topic 8 Mathematical Skills
http://slidepdf.com/reader/full/15152908-topic-8-mathematical-skills 8/17
X TOPIC 8 MATHEMATICAL SKILLS108
Interest for 1 year =§ ·
u ¨ ¸© ¹
8200 RM16
100
New amount = Savings + Interest = RM200 + RM16 = RM216
Sometimes, the value of an asset depreciates with time.
Example: Let us say the depreciation rate of an asset is 10% per year. Thus, if theinitial cost of the asset was RM100,000, the depreciation in the firstyear will be as follows:
10Depreciation= RM100,000 RM10,000
100u
Value of the asset = Initial cost ă Depreciation= RM 100,000 ă RM 10,000= RM 90,000
ALGEBRAIC MANIPULATION
Algebra has its roots in ancient Egypt and Babylon but it was not until the thirdcentury AD that Arab mathematicians created this discipline as we know it today.
Algebra uses symbols, including letters of the alphabet, in place of numbers.
8.3.1 Algebraic Expressions
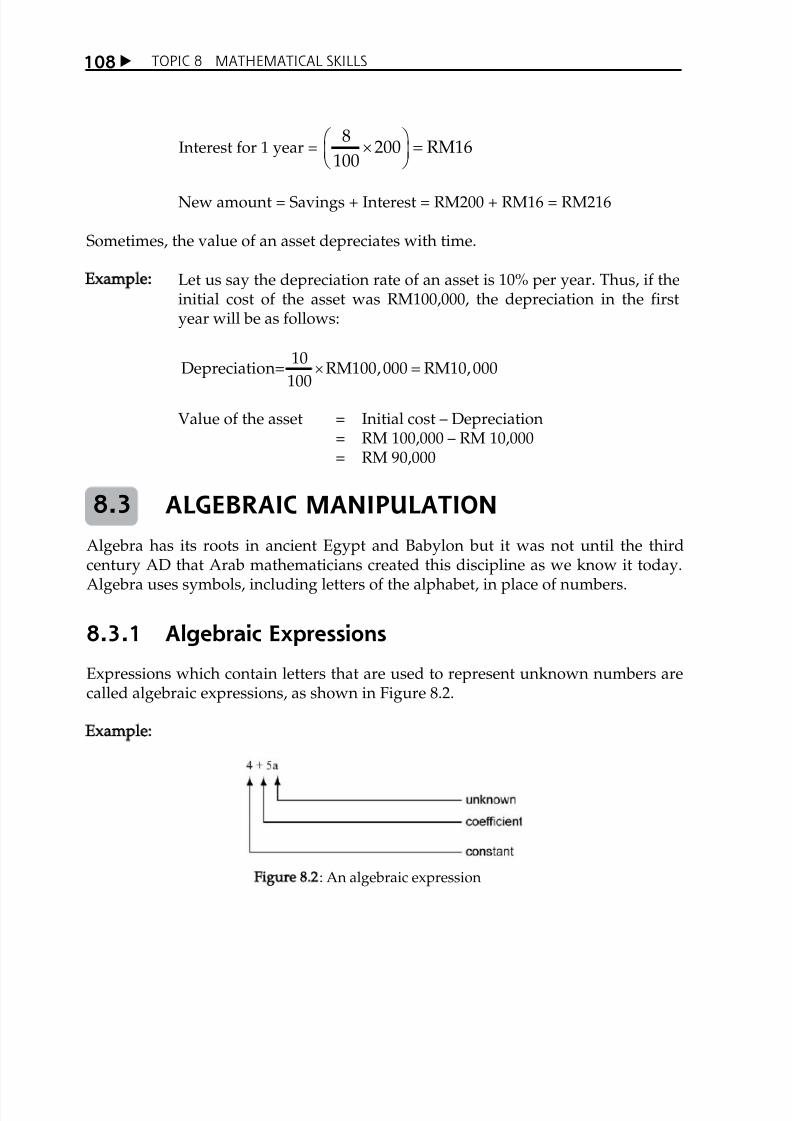
Expressions which contain letters that are used to represent unknown numbers arecalled algebraic expressions, as shown in Figure 8.2.
Example:
Figure 8.2: An algebraic expression
8.3

7/28/2019 15152908 Topic 8 Mathematical Skills
http://slidepdf.com/reader/full/15152908-topic-8-mathematical-skills 9/17
TOPIC 8 MATHEMATICAL SKILLS W 109
Other examples of algebraic expressions are as follows:
(a) a + 4
(b) 8 z c or 8c(c) xy
(d) 1/4 h
We simplify expressions that involve „like terms.‰ These are terms of the samekind. For example, we cannot simplify 8c + 3d.
8.3.2 Algebraic Equations
An equation contains an equal sign. In an equation, the symbol whose value is to befound is called the unknown. The process of finding this value is described assolving the equation. An equation of the form y = mx + c, where x is an unknownand m and c are constants, is called a linear equation.
These are examples of linear equations: (a) y = 2x - 3
(b) y = ă 3
(c) x = ă 2
The following are steps in solving algebraic linear equations (with oneunknown):
(i) Analyse the problem carefully. Identify the unknown in the problem.
(ii) Use a letter to represent the unknown number in the problem (e.g., let theunknown be x).
(iii) Formulate the problem in the form of an equation.
(iv) Solve the equation.
(v) Substitute your solution into the equation to verify that the solution/answeris correct.
Can you provide other examples of „like terms‰?
SELF-CHECK 8.4

7/28/2019 15152908 Topic 8 Mathematical Skills
http://slidepdf.com/reader/full/15152908-topic-8-mathematical-skills 10/17
X TOPIC 8 MATHEMATICAL SKILLS110
Remember that before you can solve algebraic linear equations, you must first beable to form an algebraic equation.
Example: When 5 is added to a certain number, the result is 13. Express thisstatement using algebraic symbols.
Let the unknown number be x.
Thus, the following equation expresses the information above viaalgebraic symbols.
x + 5 = 13
8.3.3 Inequality
When we talk about algebra, most people tend to think it only involves equality.However, this is not always true. In real life, inequality is more common thanequality. In dealing with equality, we use the symbol „=‰, which means „is equalto.‰ Table 8.2 shows the symbols for various forms of inequality and theirinterpretations.
Table 8.2: Symbols for Inequality
Symbol Meaning
> is greater than
< is less than
t is greater than or equal to
d is less than or equal to
Rewrite each of the following open sentences in the form of an equation:
(a) 6 more than y is 14.
(b) 15 subtracted from z gives 12.
(c) Adding 50 to the sum of X and y gives 450.
(d) The length m cm of a rectangle is 7cm more than the breadth n cm.
(e) The difference between x and y is 32, where y is less than x .
ACTIVITY 8.2
7/28/2019 15152908 Topic 8 Mathematical Skills
http://slidepdf.com/reader/full/15152908-topic-8-mathematical-skills 11/17
TOPIC 8 MATHEMATICAL SKILLS W 111
The equation x = 7 is true for only one value of x , whereas the statement x > 7 istrue for all values of x greater than 7. However, to solve ax 2 ă 6x < 7, we needspecial techniques to find the solution.
HANDLING DATA
In statistical analysis, the first step is the collection of data. We use various statisticaltools and techniques to help us summarise raw data, analyse it and drawconclusions from it. Usually, we use a graph to represent statistical data. A graphhas the advantage of showing us clearly the relationship between different parts of a particular set of information. However, the data shown is often an approximation.There are many ways of showing information in a graph, some of which will bediscussed here.
8.4.1 Types of Data
Statistical information has to be collected in the form of data. The data collected iscalled raw data. You can have either qualitative or quantitative data.
(a) Qualitative data involves quality that we cannot measure such as colour, tasteof food and types of clothes. However, quantitative data can be measuredsuch as length, weight, volume and temperature. We can order them andassign numeric values to them.
(b) Quantitative data can be divided into two types, namely, continuous anddiscrete. Continuous data includes time, weight and length while discretedata includes number of persons, shoe sizes and clothing sizes.
8.4
Give examples of continuous and discrete data.
ACTIVITY 8.3
Explain the importance of statistics in our everyday life.
SELF-CHECK 8.5
7/28/2019 15152908 Topic 8 Mathematical Skills
http://slidepdf.com/reader/full/15152908-topic-8-mathematical-skills 12/17
X TOPIC 8 MATHEMATICAL SKILLS112
8.4.2 Tables
The raw data collected needs to be organised so that it is easier to interpret.
One of the ways to add meaning to data is to organise it in the form of tables.Consider the following information collected from people employed by a certaincompany (see Table 8.3).
Table 8.3: Frequency Distribution Table
Employee Number
Salesman 10
Secretaries 3
Drivers 5
Accountants 8
Engineers 6
The numbers in the second column are called the data. This column gives us thefrequency. Frequency means the number of times an observation appears. The tableabove is also called a frequency distribution table. However, most people believethat „a picture is worth a thousand words‰ and prefer information presented in a
graphic form. There are a number of ways to show information in this form andthese will be discussed in the ensuing sub-topics.
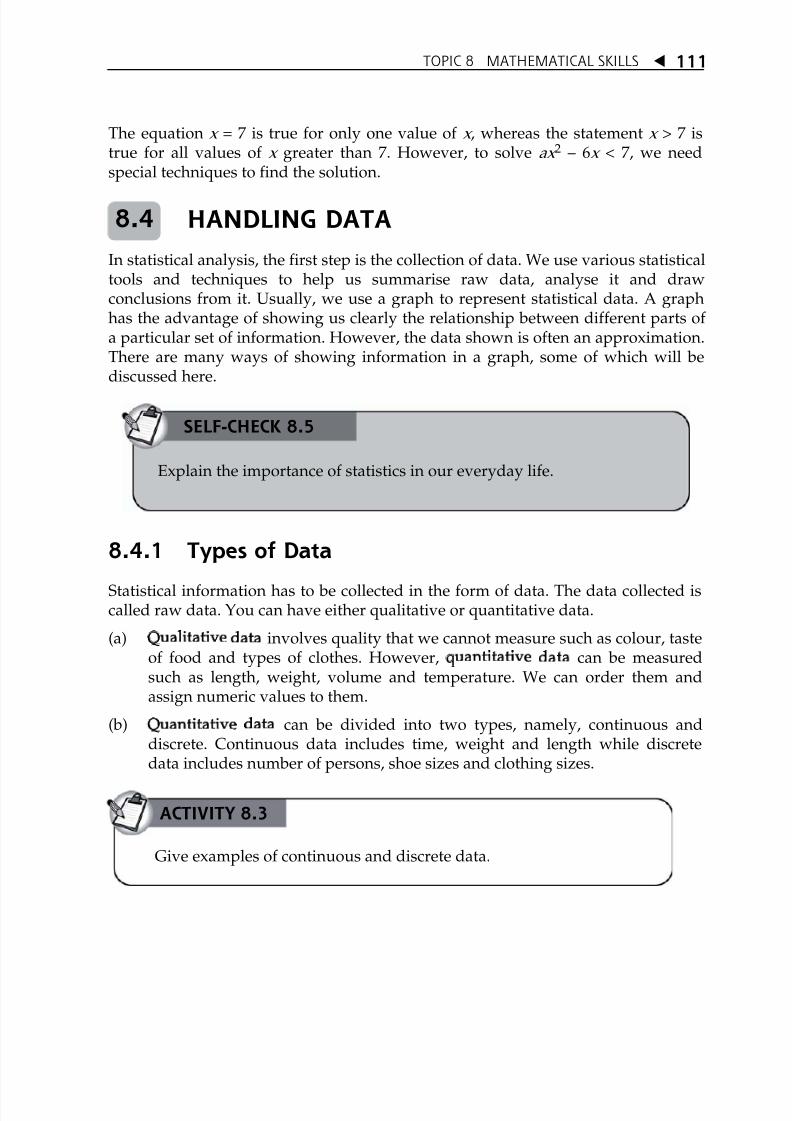
8.4.3 Bar ChartsThe bars of a bar chart are of equal width. The vertical scale on the left of the chartindicate frequency, so equal intervals on the scale stand for equal changes infrequency. The bars stand on a horizontal axis with gaps between them and withlabels to show what each category represents (see Figure 8.3).
Ask about the hobbies of students in your tutorial class. Can you makea table like the one in Table 8.3?
SELF-CHECK 8.6
7/28/2019 15152908 Topic 8 Mathematical Skills
http://slidepdf.com/reader/full/15152908-topic-8-mathematical-skills 13/17
TOPIC 8 MATHEMATICAL SKILLS W 113
Figure 8.3: Example of a bar chart
8.4.4 Pie Charts
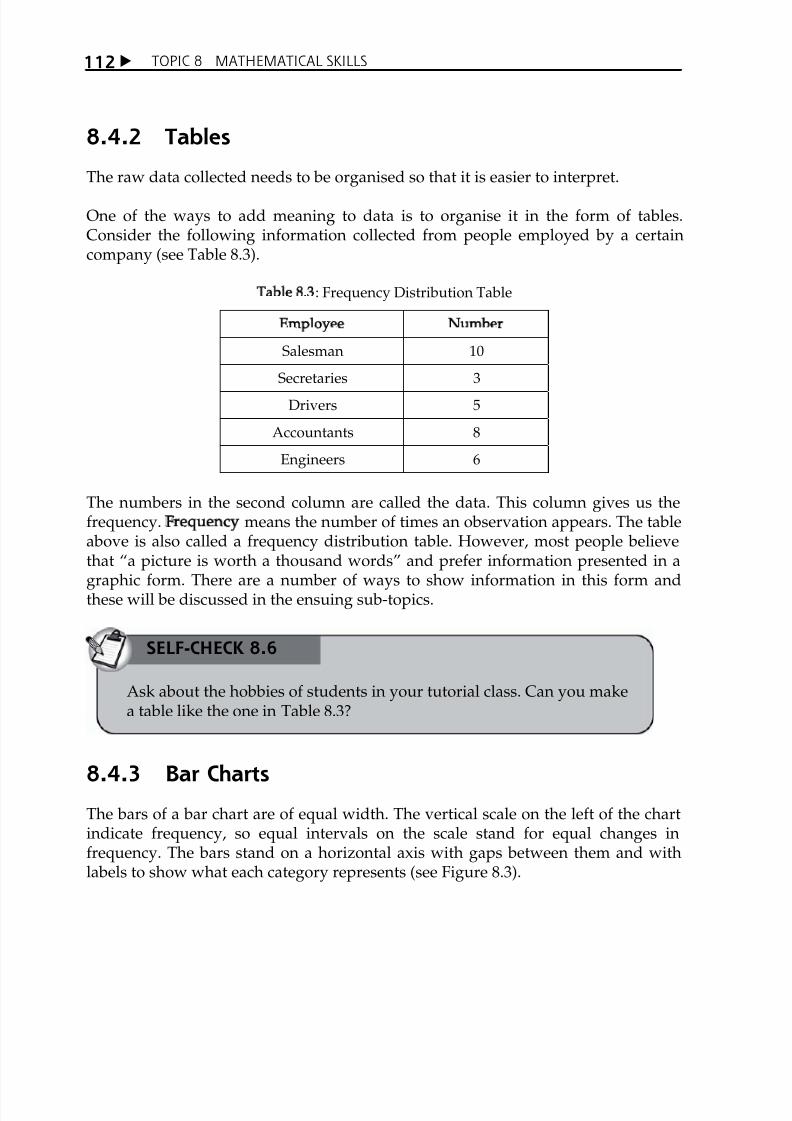
Pie chart is another interesting way of presenting information in pictorial form. Piecharts create a visual representation that help students understand the relationshipsand meanings of numbers. Pie charts are useful in representing percentages,proportions and fractions. A pie chart uses a circle for the whole distribution andan individual sector to represent the classes. The angle at the centre of each sector isproportional to the frequency of the value that sector represents. The area of thesector is also proportional to the angle at the centre (see Table 8.4 and Figure 8.4).
Table 8.4: Distribution of Staff in a Computer Centre
Class Number of Staff
Operators 20
Programmers 25
Analysts 10
Managers 5
7/28/2019 15152908 Topic 8 Mathematical Skills
http://slidepdf.com/reader/full/15152908-topic-8-mathematical-skills 14/17
X TOPIC 8 MATHEMATICAL SKILLS114
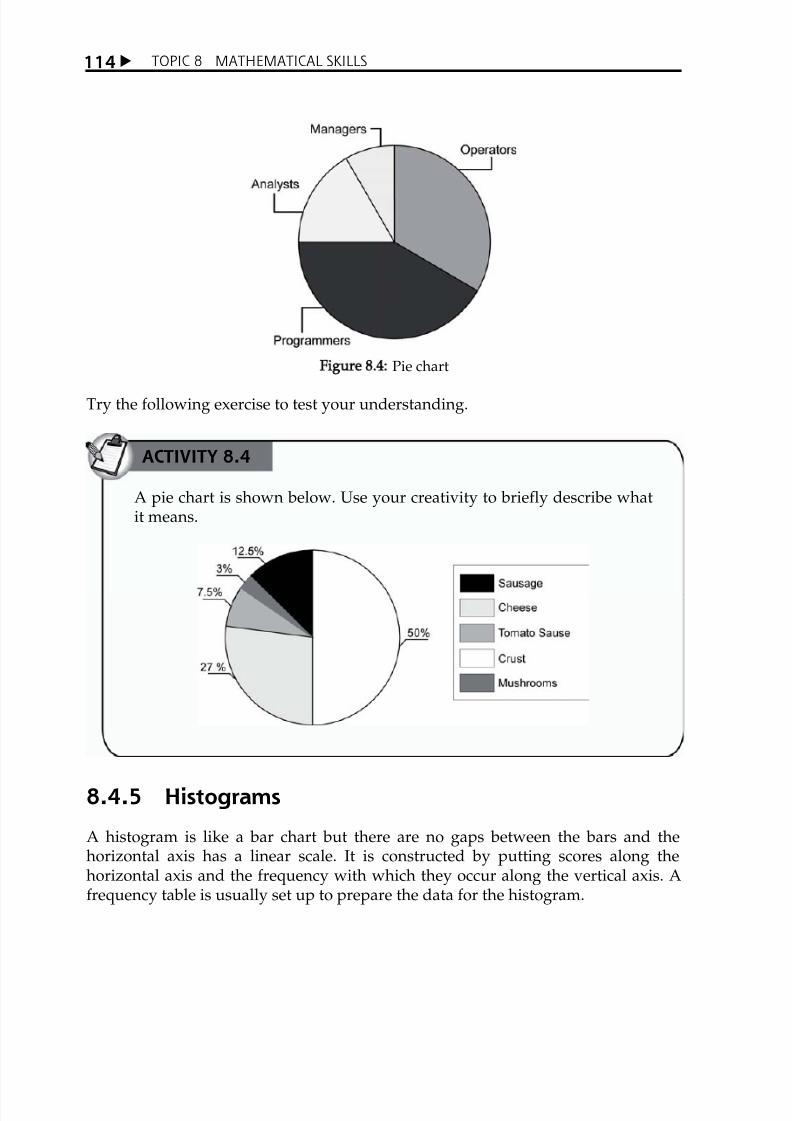
Figure 8.4: Pie chart
Try the following exercise to test your understanding.
8.4.5 Histograms
A histogram is like a bar chart but there are no gaps between the bars and thehorizontal axis has a linear scale. It is constructed by putting scores along thehorizontal axis and the frequency with which they occur along the vertical axis. Afrequency table is usually set up to prepare the data for the histogram.
A pie chart is shown below. Use your creativity to briefly describe whatit means.
ACTIVITY 8.4

7/28/2019 15152908 Topic 8 Mathematical Skills
http://slidepdf.com/reader/full/15152908-topic-8-mathematical-skills 15/17
TOPIC 8 MATHEMATICAL SKILLS W 115
Example 1 (see Table 8.5 and Figure 8.5):
Table 8.5: Frequency Table 1
Score Frequency
30 1
31 2
32 4
33 4
34 3
35 2
Figure 8.5: Histogram of the frequency of scores
8.4.6 Scatter Diagrams
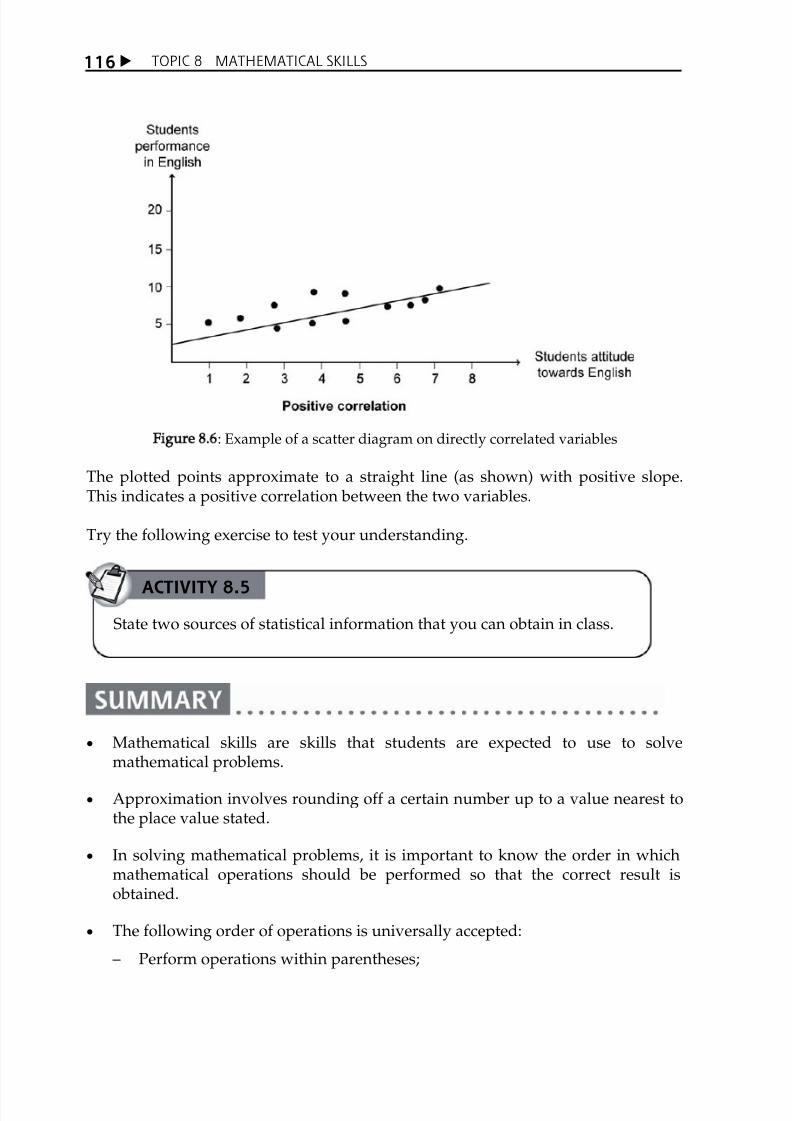
A scatter diagram is used to examine and help you visualise the relationship between two sets of data. Consider Figure 8.6 which highlights data collected byobserving variations in two variables:
x StudentsÊ performance in English.
x StudentsÊ attitudes towards English.
7/28/2019 15152908 Topic 8 Mathematical Skills
http://slidepdf.com/reader/full/15152908-topic-8-mathematical-skills 16/17
X TOPIC 8 MATHEMATICAL SKILLS116
Figure 8.6: Example of a scatter diagram on directly correlated variables
The plotted points approximate to a straight line (as shown) with positive slope.This indicates a positive correlation between the two variables.
Try the following exercise to test your understanding.
x Mathematical skills are skills that students are expected to use to solvemathematical problems.
x Approximation involves rounding off a certain number up to a value nearest tothe place value stated.
x In solving mathematical problems, it is important to know the order in whichmathematical operations should be performed so that the correct result isobtained.
x The following order of operations is universally accepted:
ă Perform operations within parentheses;
ACTIVITY 8.5
State two sources of statistical information that you can obtain in class.

7/28/2019 15152908 Topic 8 Mathematical Skills
http://slidepdf.com/reader/full/15152908-topic-8-mathematical-skills 17/17
TOPIC 8 MATHEMATICAL SKILLS W 117
ă Perform multiplications and divisions from left to right; and
ă Perform additions and subtractions from left to right.
x Expressions which contain letters that are used to represent unknown numbersare called algebraic expressions.
x Data is regarded as statistical data if the numbers collected have somerelationship with each other.
x Statistical information has to be collected in the form of raw data.
x Qualitative data involves quality that we cannot measure such as colour, foodsand types of clothes.
x Quantitative data can be divided into two types ă continuous and discrete.
x Examples of continuous data include time, weight and length while examples of discrete data include number of persons, shoe sizes and clothing sizes.
x A histogram is like a bar chart but there are no gaps between the bars and thehorizontal axis has a linear scale.
x The scatter diagram is a set of points scattered between the axes. It is unlikelythat the points will lie along some curve or straight line but they may
approximate to one.
Approximation
Bar chart
Continuous data
Discreet dataEquals to
Estimation
Histogram
Less than
Linear equation
More than
Pie chartQualitative
Quantitative
Scatter diagram
Related Documents