351 15 Interfacial Rheology of Viscoelastic Surfactant– Polymer Layers Theodor D. Gurkov, Boryana Nenova, Elena K. Kostova, and Wolfgang Gaschler 15.1 INTRODUCTION The two-dimensional rheology of fluid interfaces has been a subject of numerous studies, because of its link with the stability of foams and emulsions (Langevin 2000; Wilde 2000). Basically, when the stress response to deformation is stronger, this immobilizes the surfaces and the thin films and prevents them from being disturbed too much, and the dispersion is stabilized. Experimental measurements with various systems, containing surfactants, proteins, polymers, and so on, have revealed that the interfacial rheological behavior is often of the viscoelastic type (Sagis 2011). The dilatational rheology relies on widely used experimental methods that are based on small harmonic (sinusoidal) deformations—waves on a flat surface or pul- sating expansion/compression of deformed or spherical drops and bubbles (Miller et al. 2010; Mucic et al. 2011). Two moduli are measured directly—storage, E′ , and loss, E″ . They are commonly regarded as characteristics of elasticity and viscous CONTENTS 15.1 Introduction .................................................................................................. 351 15.2 Experimental Measurements ........................................................................ 353 15.2.1 Materials ........................................................................................... 353 15.2.2 Methods ............................................................................................ 354 15.3 Rheological Interpretation of the Data from Periodic Deformation ............ 356 15.3.1 Theoretical Description of the Stress Response in Terms of a Rheological Model............................................................................ 356 15.3.2 Physical Relevance of the Material Constants.................................. 358 15.4 Discussion of Measured Data and the Resulting Rheological Parameters... 362 15.5 Conclusions ................................................................................................... 365 Acknowledgments.................................................................................................. 366 References .............................................................................................................. 366 © 2014 by Taylor & Francis Group, LLC

Welcome message from author
This document is posted to help you gain knowledge. Please leave a comment to let me know what you think about it! Share it to your friends and learn new things together.
Transcript
351
15 Interfacial Rheology of Viscoelastic Surfactant–Polymer Layers
Theodor D. Gurkov, Boryana Nenova, Elena K. Kostova, and Wolfgang Gaschler
15.1 IntroductIon
The two-dimensional rheology of fluid interfaces has been a subject of numerous studies, because of its link with the stability of foams and emulsions (Langevin 2000; Wilde 2000). Basically, when the stress response to deformation is stronger, this immobilizes the surfaces and the thin films and prevents them from being disturbed too much, and the dispersion is stabilized. Experimental measurements with various systems, containing surfactants, proteins, polymers, and so on, have revealed that the interfacial rheological behavior is often of the viscoelastic type (Sagis 2011).
The dilatational rheology relies on widely used experimental methods that are based on small harmonic (sinusoidal) deformations—waves on a flat surface or pul-sating expansion/compression of deformed or spherical drops and bubbles (Miller et al. 2010; Mucic et al. 2011). Two moduli are measured directly—storage, E′, and loss, E″. They are commonly regarded as characteristics of elasticity and viscous
contents
15.1 Introduction .................................................................................................. 35115.2 Experimental Measurements ........................................................................ 353
15.2.1 Materials ........................................................................................... 35315.2.2 Methods ............................................................................................ 354
15.3 Rheological Interpretation of the Data from Periodic Deformation ............ 35615.3.1 Theoretical Description of the Stress Response in Terms of a
Rheological Model ............................................................................ 35615.3.2 Physical Relevance of the Material Constants .................................. 358
15.4 Discussion of Measured Data and the Resulting Rheological Parameters ... 36215.5 Conclusions ................................................................................................... 365Acknowledgments ..................................................................................................366References ..............................................................................................................366
© 2014 by Taylor & Francis Group, LLC
352 Colloid and Interface Chemistry for Nanotechnology
dissipation, respectively. However, the exact relation between E′, E″, and physical coefficients of elasticity and viscosity (G, η) depends on the rheological model or, in general, on the physical processes underlying the rheological response or how the material actually behaves.
A case of great practical importance is when surfactant can be exchanged between the interface and the volume phase in which it is soluble. Then, surface expansion (or contraction) will be accompanied by adsorption (or desorption) and diffusion of molecules from (or toward) the bulk interior. This leads to complicated dependence of the rheological moduli upon the oscillation frequency. Theoretical analysis of this scenario was carried out in comprehensive details (Horozov et al. 1997; Kotsmar et al. 2009; Lucassen and van den Tempel 1972).
Freer et al. (2004) applied the diffusion theory for analysis of storage and loss moduli of β-casein. They reached the conclusion that the Lucassen–van den Tempel framework should be supplemented with a static modulus ′( )∞E of irreversibly adsorbed protein molecules. The latter quantity could be obtained as the limit of the elasticity at zero frequency (Freer et al. 2004). For interpretation of our data in this work, we also need such an elastic modulus at very slow deformation—see G2 in Section 15.3.2. It takes into account the contribution of adsorbed molecules that cannot be exchanged with the bulk or subsurface.
It has been recognized that the diffusion is not the only possible relaxation mech-anism that leads to effective viscous dissipation in the 2D rheology. For example, proteins may undergo reorientation after adsorption, internal reconformation, molec-ular shrinking under increased surface pressure, and so on (Benjamins et al. 2006). With simpler molecules, a feasible scenario is a reversible exchange between the adsorbed layer and the adjacent subsurface (Boury et al. 1995; Liggieri and Miller 2010; Wantke et al. 2005). In the present work, we elaborate on this mechanism and derive an explicit equation that connects the apparent viscosity with the mass trans-fer coefficient.
Surfaces that exhibit linear viscoelasticity are often described in terms of the Maxwell rheological model; a number of literature citations for this are listed in the review by Sagis (2011). With an additional elastic element, responsible for the insoluble molecules, attached in parallel to the Maxwell model, one obtains the Zener model (Boury et al. 1995); the latter turns out to be adequate for our needs. In Section 15.3.2, we discuss the physical relevance of the parameters that take part in the Maxwell and Zener models, in the case when the relaxation is due to out-of-plane mass transport.
In this work, we investigate the layer response to deformation whose time depen-dence is not sinusoidal, but has a triangle-shaped waveform. Correspondingly, the strain is represented as a Fourier series. When the constitutive equation for the rheo-logical model is solved, it predicts the engendered stress, again as a Fourier series. Here, we demonstrate that this theoretical development is suitable for fitting experi-mental data, collected from Langmuir trough measurements with a mixed layer of surfactant and polymer. Fourier transform rheology has recently been proposed by Hilles et al. (2006), but they used harmonic disturbances with high amplitude (in the non-linear regime) and studied only insoluble layers.
© 2014 by Taylor & Francis Group, LLC
353Interfacial Rheology of Viscoelastic Surfactant–Polymer Layers
15.2 experImental measurements
15.2.1 Materials
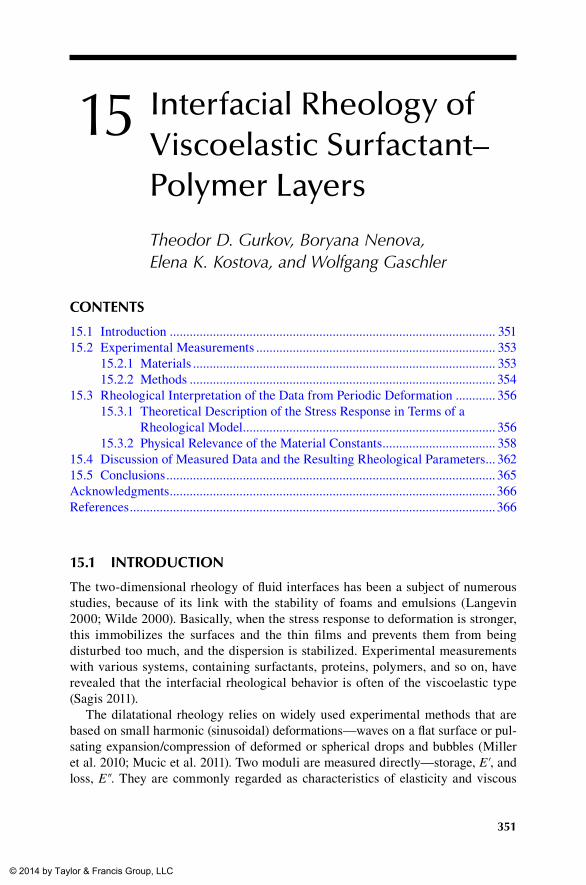
The main surfactant is a mixture of acids (sodium salts) from wood resin. We use the commercial product Dynakoll VS 50 FS (CAS No. 68201-59-2), supplied by Akzo Nobel, which contains 50% surface-active ingredients—the so-called resin acids. The abietic and levopimaric acids are among the predominant chemical substances; their structure is shown in Figure 15.1a and b. Further information about these and other similar components in the resin can be found in Peng and Roberts (2000). For us, the most important property of the molecules in Dynakoll is that they adsorb readily on the air/water interface and cause a significant decrease of the surface tension.
We investigate adsorbed layers of resin acids in the presence of a cationic polymer. Solvitose BPN (CAS No. 56780-58-6), from Avebe GmbH (Germany), represents
(a) (b)
H
H
H O
O
H
H
H O
O
(c) (d)
FIgure 15.1 Substances used in this work: (a) abietic acid; (b) levopimaric acid; (c) cat-ionized starch, with ~4.0%–4.5% trimethylammonium groups; (d) possible attachment of polymer to adsorbed surfactant at the air/water boundary.
© 2014 by Taylor & Francis Group, LLC
354 Colloid and Interface Chemistry for Nanotechnology
a derivative of potato starch, namely, hydroxypropyl-trimethylammonium chloride ether. This is a hydrophilic polymer, whose degree of substitution with cationic groups is approximately 4.0–4.5 mol%. The chemical structure is sketched in Figure 15.1c. The Solvitose itself does not possess surface activity; there is no adsorption from solutions of Solvitose alone.
The subject of our study is the mixed system of 0.01 wt% Dynakoll and 0.1 wt% Solvitose. All solutions were prepared with deionized water from a Milli-Q Organex purification system (Millipore, USA).
15.2.2 Methods
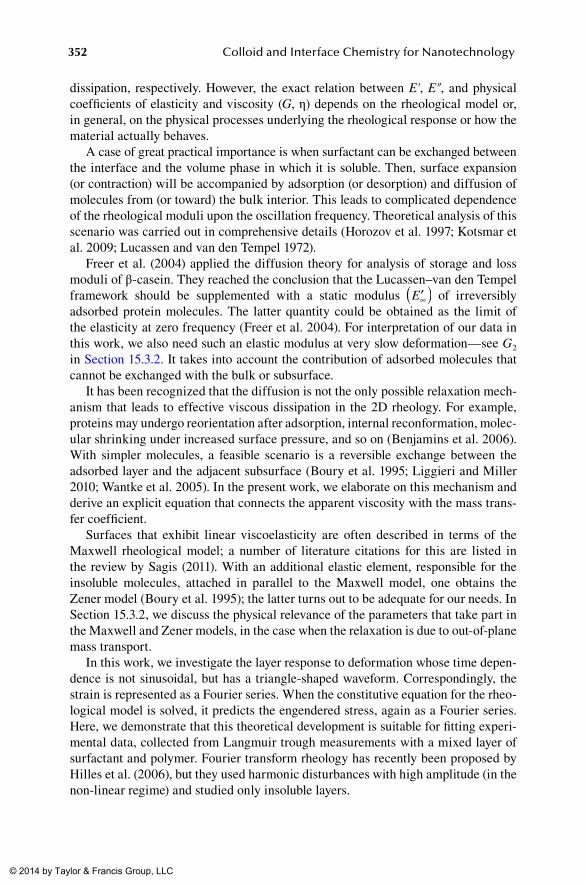
The dilatational rheology of adsorbed layers on A/W boundary is studied by means of a Langmuir trough with a traditional design, sketched in Figure 15.2. The model of the apparatus is 302 LL/D1, manufactured by Nima Technology Ltd., UK. The area of the trough is varied with two parallel Teflon barriers that move symmetri-cally; their speed of linear translation is constant and can be set by the software. The surface tension, σ, is measured with a Wilhelmy plate, made of chromatographic paper. The choice of paper ensures complete wetting and also prevents contamina-tion by impurities (a new piece is used for each experiment). The Wilhelmy plate is positioned exactly in the middle between the two barriers. It is oriented in parallel direction to the barriers. As far as our layers are fluid-like, the orientation actually does not matter (the surface tension is isotropic). The measurements are performed at 40.0°C of the aqueous solution. The setup is equipped with thermostating jacket, contacting with the bottom of the Teflon trough from below.
Data acquisition is performed continuously; the apparatus records the area between the barriers, A(t), and the surface pressure, Π(t), as functions of time. By def-inition, Π is the decrease of the surface tension caused by the presence of surfactant: Π = σ0 − σ, where σ0 refers to the bare air/water interface. At 40°C, σ0 = 69.6 mN/m.
Initially, the solution is loaded in the Langmuir trough with open barriers, at A = 150 cm2. Some time is allowed for equilibration of the layer (typically, it is left at rest
FIgure 15.2 Sketch of the Langmuir trough; symmetric deformation is created by the two barriers, and the Wilhelmy plate sensor is positioned at the midpoint.
© 2014 by Taylor & Francis Group, LLC
355Interfacial Rheology of Viscoelastic Surfactant–Polymer Layers
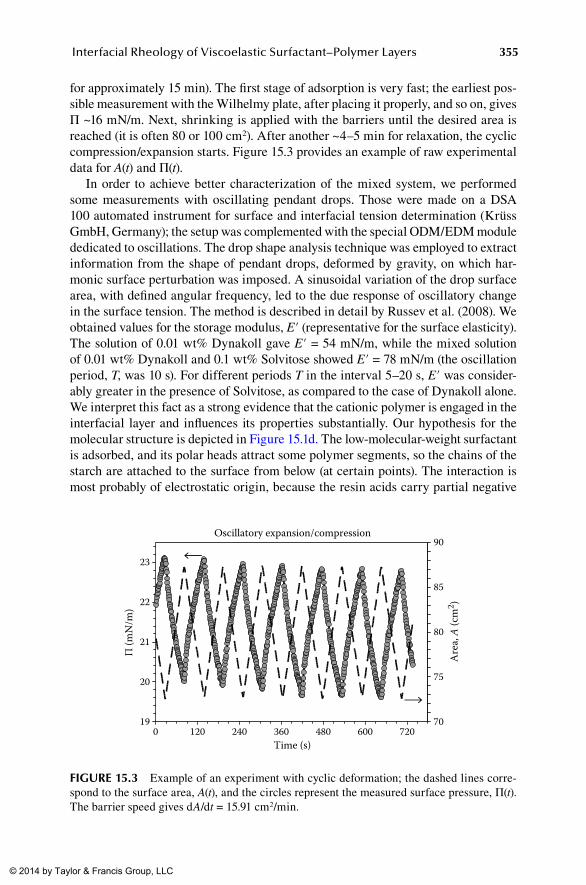
for approximately 15 min). The first stage of adsorption is very fast; the earliest pos-sible measurement with the Wilhelmy plate, after placing it properly, and so on, gives Π ~16 mN/m. Next, shrinking is applied with the barriers until the desired area is reached (it is often 80 or 100 cm2). After another ~4–5 min for relaxation, the cyclic compression/expansion starts. Figure 15.3 provides an example of raw experimental data for A(t) and Π(t).
In order to achieve better characterization of the mixed system, we performed some measurements with oscillating pendant drops. Those were made on a DSA 100 automated instrument for surface and interfacial tension determination (Krüss GmbH, Germany); the setup was complemented with the special ODM/EDM module dedicated to oscillations. The drop shape analysis technique was employed to extract information from the shape of pendant drops, deformed by gravity, on which har-monic surface perturbation was imposed. A sinusoidal variation of the drop surface area, with defined angular frequency, led to the due response of oscillatory change in the surface tension. The method is described in detail by Russev et al. (2008). We obtained values for the storage modulus, E′ (representative for the surface elasticity). The solution of 0.01 wt% Dynakoll gave E′ = 54 mN/m, while the mixed solution of 0.01 wt% Dynakoll and 0.1 wt% Solvitose showed E′ = 78 mN/m (the oscillation period, T, was 10 s). For different periods T in the interval 5–20 s, E′ was consider-ably greater in the presence of Solvitose, as compared to the case of Dynakoll alone. We interpret this fact as a strong evidence that the cationic polymer is engaged in the interfacial layer and influences its properties substantially. Our hypothesis for the molecular structure is depicted in Figure 15.1d. The low-molecular-weight surfactant is adsorbed, and its polar heads attract some polymer segments, so the chains of the starch are attached to the surface from below (at certain points). The interaction is most probably of electrostatic origin, because the resin acids carry partial negative
Oscillatory expansion/compression
19
20
21
22
23
0 120 240 360 480 600 720Time (s)
Π (m
N/m
)
70
75
80
85
90
Are
a, A
(cm
2 )
FIgure 15.3 Example of an experiment with cyclic deformation; the dashed lines corre-spond to the surface area, A(t), and the circles represent the measured surface pressure, Π(t). The barrier speed gives dA/dt = 15.91 cm2/min.
© 2014 by Taylor & Francis Group, LLC
356 Colloid and Interface Chemistry for Nanotechnology
charge at the carboxylic group, while the Solvitose contains 4.0%–4.5% cationic groups.
15.3 rheologIcal InterpretatIon oF the data From perIodIc deFormatIon
15.3.1 theoretical description of the stress response in terMs of a rheological Model
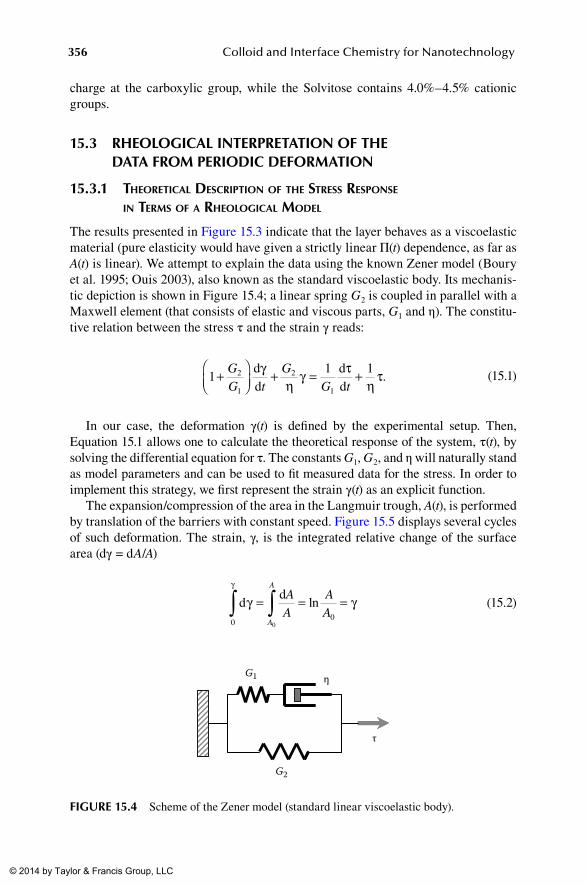
The results presented in Figure 15.3 indicate that the layer behaves as a viscoelastic material (pure elasticity would have given a strictly linear Π(t) dependence, as far as A(t) is linear). We attempt to explain the data using the known Zener model (Boury et al. 1995; Ouis 2003), also known as the standard viscoelastic body. Its mechanis-tic depiction is shown in Figure 15.4; a linear spring G2 is coupled in parallel with a Maxwell element (that consists of elastic and viscous parts, G1 and η). The constitu-tive relation between the stress τ and the strain γ reads:
1
1 12
1
2
1
+
+ = +GG t
GG t
dd
dd
γη
γ τη
τ. (15.1)
In our case, the deformation γ(t) is defined by the experimental setup. Then, Equation 15.1 allows one to calculate the theoretical response of the system, τ(t), by solving the differential equation for τ. The constants G1, G2, and η will naturally stand as model parameters and can be used to fit measured data for the stress. In order to implement this strategy, we first represent the strain γ(t) as an explicit function.
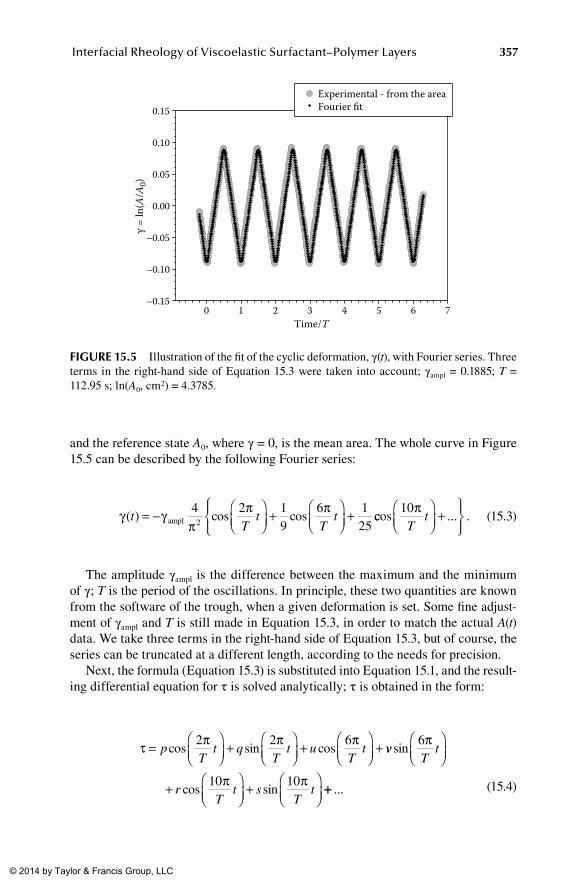
The expansion/compression of the area in the Langmuir trough, A(t), is performed by translation of the barriers with constant speed. Figure 15.5 displays several cycles of such deformation. The strain, γ, is the integrated relative change of the surface area (dγ = dA/A)
ddγ γ
γ
00
0
∫ ∫= = =AA
AA
A
A
ln (15.2)
τ
G1
G2
η
FIgure 15.4 Scheme of the Zener model (standard linear viscoelastic body).
© 2014 by Taylor & Francis Group, LLC
357Interfacial Rheology of Viscoelastic Surfactant–Polymer Layers
and the reference state A0, where γ = 0, is the mean area. The whole curve in Figure 15.5 can be described by the following Fourier series:
γ γπ
π π( ) cos cost
Tt
Tt= −
+
+ampl4 2 1
96 1
252ccos ...
10πT
t
+
. (15.3)
The amplitude γampl is the difference between the maximum and the minimum of γ; T is the period of the oscillations. In principle, these two quantities are known from the software of the trough, when a given deformation is set. Some fine adjust-ment of γampl and T is still made in Equation 15.3, in order to match the actual A(t) data. We take three terms in the right-hand side of Equation 15.3, but of course, the series can be truncated at a different length, according to the needs for precision.
Next, the formula (Equation 15.3) is substituted into Equation 15.1, and the result-ing differential equation for τ is solved analytically; τ is obtained in the form:
τ π π π=
+
+
+pT
t qT
t uT
tcos sin cos2 2 6
vvT
t
rT
t sT
t
sin
cos sin
6
10 10
π
π π
+
+
++ ... (15.4)
Time/T0 1 2 3 4 5 6 7
γ =
ln(A
/A0)
–0.15
–0.10
–0.05
0.00
0.05
0.10
0.15
Experimental - from the areaFourier fit
FIgure 15.5 Illustration of the fit of the cyclic deformation, γ(t), with Fourier series. Three terms in the right-hand side of Equation 15.3 were taken into account; γampl = 0.1885; T = 112.95 s; ln(A0, cm2) = 4.3785.
© 2014 by Taylor & Francis Group, LLC
358 Colloid and Interface Chemistry for Nanotechnology
Here, the constant coefficients p, q, u, v, r, and s are related to the material param-eters of the model, G1, G2, η, and γampl. For the sake of completeness, we list these coefficients below:
pBD AC
D Cq
BC AD
D C= − +
+ = − −
+4 4
2
2
2 2 2 2 2
γπ
ωω
γπ
ampl , ampl22 2
2
2
2 2 2
4
9
3
3
4ω
ω
γπ
ωω
γ
,
( )
( ),u
BD AC
D Cv= − +
+ = −ampl amppl
ampl
3 3
4
25
5
2 2 2 2
2
2
π ωω
γπ
ω
BC AD
D C
rBD AC
D
−+
= − +( )
,
( )22 2 2 2 2 2 25
4
5 5+ = − −
+Cs
BC AD
D C( ),
( )ωγ
π ωωampl
(15.5)
where
A
GG
BG
CG
D T= + = = = =11 1
22
1
2
1
, , , ,η η
ω π / .
The jth and the ( j + 1)st terms in Equation 15.4 read:
τγ
πω
ωπ= − +
+
...( )
( )cos
4 22 2
2
2 2 2ampl
j
BD AC j
D C j
jT
t
− −+
−4 2
2 2 2 2
γπ ω
ω πampl
j
BC AD
D C j
jT
t( )
sin ....
(15.4a)
where j = 1, 3, 5, 7, … (odd integer numbers).Thus, Equation 15.4 represents the theoretical prediction for the layer response
to a deformation of triangular shape, such as that depicted in Figure 15.5. We use Equation 15.4 for fitting of experimental results for τ(t); the rheological characteris-tics G1, G2, and η serve as three adjustable parameters to be varied and determined from the best fit.
15.3.2 physical relevance of the Material constants
According to the Zener model (Figure 15.4 and Equation 15.1), at very fast deforma-tion, the strain on the viscous element approaches zero and the system will become purely elastic, with a modulus G1 + G2; specifically, dτ = (G1 + G2)dγ. In the opposite case of very slow deformation, the viscous element will fully relax to zero stress and only the element G2 will deform. The system will be again elastic, but with a modulus G2. This behavior suggests that one can attribute the viscous dissipation (η) to a certain exchange of molecules from the interface with the subsurface or the bulk phase. Such an exchange should have a characteristic timescale and will happen only when the deformation is sufficiently slow.
A plausible physical picture might be that two types of molecules are present in the interfacial layer: (I) Irreversibly adsorbed ones, which are associated with
© 2014 by Taylor & Francis Group, LLC
359Interfacial Rheology of Viscoelastic Surfactant–Polymer Layers
the elasticity G2. Such species are commonly called “insoluble surfactant” in the literature. (II) Molecules that go to the interface reversibly; they can be exchanged with the bulk phase or the subsurface: adsorption will take place upon expansion, and desorption will happen on compression. If the change of surface area is made in a quasi-static way (infinitely slowly), these molecules (II) will have equilibrium adsorption, Γr, eq, and will not bring about any deviation in the surface tension, σ (hence, there will be no contribution to the stress, τ). Here, we assume that σ depends only on the instantaneous number of molecules per unit area at the interface, which is denoted by Γr for the reversibly adsorbed species and by Γir for the insoluble ones. In other words, σ = σ(Γr(t), Γir(t)). Any effects of interfacial reconfiguration, gradual reorganization, and so on, are discarded.
In general,
Nr = AΓr, (15.6)
where Nr is the number of reversibly adsorbed molecules on the whole area A. When a change δ is applied because of deformation, Equation 15.6 yields a differential expression that can be cast into the following convenient form:
δ ln A = δ(−ln Γr) + δ ln Nr. (15.7)
Let us now consider the Maxwell section of the rheological model in Figure 15.4 (that consists of G1 and η connected in series). One writes the total strain δγ as a sum of two contributions, on G1 and on η:
δγ = δγ1elastic + δγviscous. (15.8)
Comparing Equations 15.7 and 15.8, we can identify the corresponding terms; it is already set that δγ = δlnA, Equation 15.2, and the dissipation is supposedly associated with mass exchange to or from the interface—reversible adsorption/ desorption—and the concomitant variation of Nr.
δγ1elastic = −δ ln Γr; δγviscous = δ ln Nr (15.9)
The full stress δτ, according to the Zener model, is
δτ = δτ1 + δτ2 = G1δγ1elastic + G2δγ. (15.10)
We wish to reveal the physical meaning of the elasticities G1 and G2. For this pur-pose, it should be specified how the adsorbed surfactant molecules influence the surface tension, σ. Under the restriction of small deviations, the following expansion holds:
δσ σ δ σ δ= ∂∂
+ ∂∂
ln
lnln
lnΓ
ΓΓ
ΓΓ Γr
rir
ir
ir r
. (15.11)
© 2014 by Taylor & Francis Group, LLC
360 Colloid and Interface Chemistry for Nanotechnology
This equation takes into account the independent effects from the reversibly adsorbed species, Γr, and the insoluble ones, Γir. The number of irreversibly adsorbed mole-cules, Nir = AΓir, should remain constant; therefore, δln Γir = −δ ln A = −δγ.
The stress is in fact the change of σ, so that δτ = δσ; now, one can compare Equations 15.10 and 15.11, in view of the first equation of Equation 15.9. The result reads
G E1 = − ∂
∂=σ
ln Γ rG. (15.12)
Hence, the modulus G1 coincides with the Gibbs elasticity of the soluble surfactant, EG; this is the physical meaning of G1. It is known that EG is a thermodynamic quan-tity that characterizes the adsorption layer; it may be found from the equation of state. If an alternative elasticity is defined as [dσ/d(lnA)], the latter will be influenced by the surfactant transfer rate and the rate of strain (see, e.g., Liggieri and Miller 2010).
Similarly to the above calculation, from Equations 15.10 and 15.11, we deduce
GA2 = ∂
∂
= − ∂∂
=
σ σln lnΓ ΓΓ
r rconst. ir
. (15.13)
It is confirmed that G2 is the mechanical elasticity of the layer at very slow deforma-tion (when Γr stays constant). G2 is due to the presence of molecules that cannot be transferred between the interface and the bulk or subsurface, at least not during our experiments of cyclic expansion/compression.
In general, both G1 and G2 are expected to depend on the density of the surfactant-laden interface, that is, on the particular values of Γr and Γir. This implies a possibil-ity that G1 and G2 may exhibit a trend when the layer is subjected to different degrees of compression or with the increase of the average surface pressure ⟨Π⟩.
For the dissipative component of the rheological model, the stress is determined according to the usual constitutive relation for (apparent) viscosity and the second equation of Equation 15.9:
δτ η δγ η δ η1
1= = =dd
dd
ddviscous r
r
r
t tN
NNt
( ) ( ln ) . (15.14)
The deviation δNr is assumed to be with respect to some reference state (e.g., at the mean area of the surface during the deformation cycles), and the latter state is essen-tially independent of time—it may be equilibrium, or at least it should change much more slowly, as compared to the expansions/compressions. This conjecture has led to the last equality in Equation 15.14.
© 2014 by Taylor & Francis Group, LLC
361Interfacial Rheology of Viscoelastic Surfactant–Polymer Layers
The kinetics of mass exchange between the interface and the adjacent bulk region can be described in a usual macroscopic way, as flux proportional to the driving force:
1 1A
Nt
Kk T N
Nt
Kk T
dd
, ordd
rr r
B K r
rr
B K
= − = −Γ δµ δµ. (15.15)
Here, the driving force is the change of the chemical potential of the reversibly adsorbed molecules, δμ, when the layer is deformed with respect to the reference (equilibrium) state. δμ > 0 would correspond to desorption, since the molecules will have lower chemical potential in the bulk, while δμ < 0 would lead to adsorption. In Equation 15.15, Kr is a kinetic coefficient of mass transfer, whose dimension is time–1; kBTK denotes the thermal energy (kB is the Boltzmann constant and TK is the temperature in Kelvin).
The surface chemical potential, μ, is a function of the adsorption, Γr; the type of this function depends on the specific equation of state (the isotherm) for the given system. In a general form, we will write δμ as follows:
δμ = kBTK f (Γr) δ ln Γr , (15.16)
where the dimensionless function f (Γr ) pertains to a particular isotherm. The μ(Γr) relations, for a number of different widely used equations of state, are listed in the work of Kralchevsky et al. (2008). For instance, the well-known Langmuir isotherm gives f (Γr) = (1 − Γr /Γ∞)−1, where Γ∞ is the maximum attainable value of Γr.
Now, we can find a connection between the apparent viscosity, in the frames of the Zener model, and the transfer kinetics of surfactant from/to the interface, repre-sented by the coefficient Kr. The stress component δτ1 is the same on the elastic (G1) and the viscous (η) elements in Figure 15.4, whence
δτ1 = –EG δ ln Γr (15.17)
from Equations 15.9, 15.10, and 15.12, and
δτ1 = −ηKr f (Γr) δ ln Γr (15.18)
from Equations 15.14 through 15.16. The combination of Equations 15.17 and 15.18 easily yields the desired relation:
K
Efr
G
r
=η ( )Γ
(15.19)
It is seen that Maxwell’s relaxation time, η/EG, can be of the order of the charac-teristic time of mass exchange from/to the surface, Kr
−1; however, the two quantities are not identical. The macroscopic viscosity η is influenced by the equation of state
© 2014 by Taylor & Francis Group, LLC
362 Colloid and Interface Chemistry for Nanotechnology
of the surfactant layer. Equation 15.19 suggests that larger values of the apparent vis-cosity η correspond to slower transfer of molecules between the interface and its bulk surroundings. On the other hand, in the limiting case of very fast mass exchange, Γr will not significantly deviate from equilibrium, and η → 0.
Existing previous studies of other authors, which address the role of surface–bulk transfer, describe the process in the framework of diffusion. Theories were devel-oped to account for the frequency dependence of the elastic and viscous moduli by solving the diffusion problem (Horozov et al. 1997; Lucassen and van den Tempel 1972; Lucassen-Reynders et al. 2001). However, one can encounter physical scenar-ios in which it is more important what happens locally, in the immediate vicinity of the interface, rather than how the concentration disturbance propagates further away to the bulk. Thus, the diffusion is not the only possible mechanism to interfere with the distribution of material in and around a phase boundary that undergoes deforma-tion. For example, reversible out-of-plane escape of molecules, polymer fragments, aggregates, and so on, may affect the surface tension considerably. In this context, it seems feasible that some segments of proteins or other polymers may be expelled, because of steric repulsion within the plane of the interface, and after subsequent expansion, these segments can adsorb back. There may be no time for diffusion, or no freedom to leave the interfacial zone completely. Such cases are envisaged in this work, where exchange with the subsurface is only considered (Equation 15.15). A similar idea was followed by Wantke et al. (2005) and Boury et al. (1995), who found that the interface/subsurface transfer of surfactant molecules and protein segments can be important in different systems.
15.4 dIscussIon oF measured data and the resultIng rheologIcal parameters
The rheological response of the adsorbed layer is studied by keeping track of the changes in the surface tension, σ, during oscillatory deformation. The measured stress, τ, is defined as the difference between the running value of σ and the average, ⟨σ⟩, from several full cycles:
τ = σ − ⟨σ⟩ = ⟨Π⟩ − Π. (15.20)
Equation 15.20 gives τ also in terms of the surface pressure, Π; the relation dΠ = −dσ always holds. We present the raw data in the scale of stress, τ, as a function of the strain, γ (see Figure 15.6). The experimental points that are selected for analy-sis span about three complete compression/expansion cycles, with the time interval being centered at around ~550 s from the start of the deformation (cf. Figure 15.3). There is an initial slight decrease of ⟨Π⟩ for a few oscillations (Figure 15.3), which we would like to avoid.
The results for the stress are fitted with the theoretical function for its time depen-dence, τ(t) (Equation 15.4). The adjustable parameters G1, G2, and η are varied until the standard error of the regression, RMSE, is minimized.
© 2014 by Taylor & Francis Group, LLC
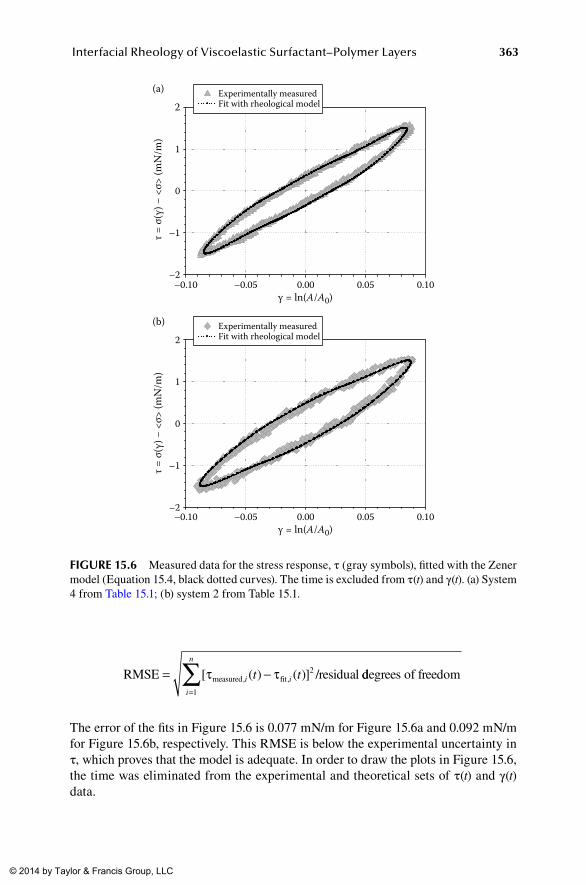
363Interfacial Rheology of Viscoelastic Surfactant–Polymer Layers
RMSE /residualmeasured fit= −=
∑[ ( ) ( )], ,τ τi i
i
n
t t 2
1
ddegrees of freedom
The error of the fits in Figure 15.6 is 0.077 mN/m for Figure 15.6a and 0.092 mN/m for Figure 15.6b, respectively. This RMSE is below the experimental uncertainty in τ, which proves that the model is adequate. In order to draw the plots in Figure 15.6, the time was eliminated from the experimental and theoretical sets of τ(t) and γ(t) data.
(a)
(b)
–2
–1
0
1
2Experimentally measuredFit with rheological model
γ = ln(A/A0)–0.10 –0.05 0.00 0.05 0.10
γ = ln(A/A0)–0.10 –0.05 0.00 0.05 0.10
τ =
σ(γ)
− <
σ> (m
N/m
)τ
= σ(
γ) −
<σ>
(mN
/m)
–2
–1
0
1
2Experimentally measuredFit with rheological model
FIgure 15.6 Measured data for the stress response, τ (gray symbols), fitted with the Zener model (Equation 15.4, black dotted curves). The time is excluded from τ(t) and γ(t). (a) System 4 from Table 15.1; (b) system 2 from Table 15.1.
© 2014 by Taylor & Francis Group, LLC
364 Colloid and Interface Chemistry for Nanotechnology
One notices that Figure 15.6 contains results for several consecutive compressions and expansions of the interface, which lie on the same curve; moreover, both the stage of compression and that of expansion are described by one and the same model, whose rheological constants G1, G2, and η are determined from the fit of all points. These facts show definitely that the physical processes during the cyclic deformation are fully reversible (at least for ~3 oscillations and to the extent that ⟨Π⟩ does not change). Such a reversible dissipation (apparent viscosity) could be due to expulsion and readsorption of some surfactant molecules and polymer segments, which are exchanged between the planar interface and the immediately adjacent subsurface.
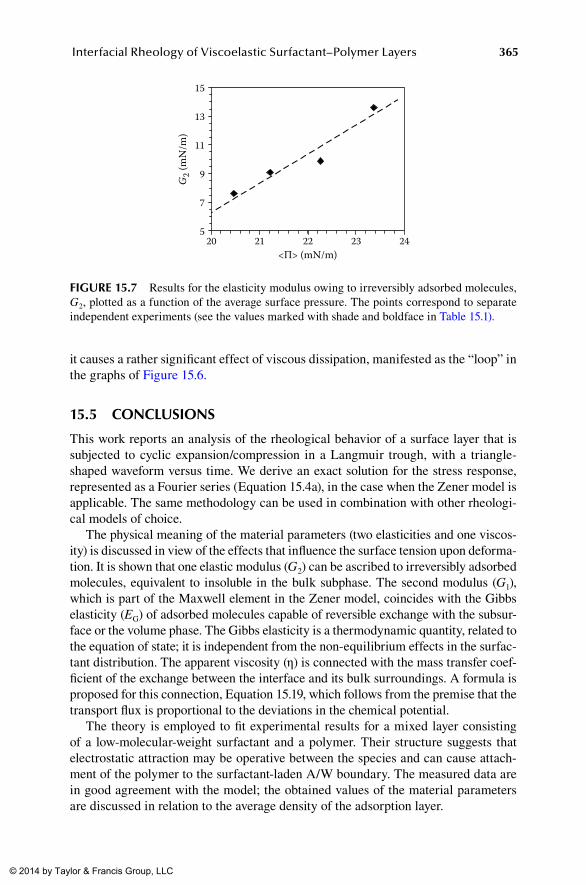
The values of the material parameters G1, G2, and η are listed in Table 15.1. The columns are labeled in direction of increasing ⟨Π⟩; the rate of strain, dγ/dt, and the overall extent of layer compression [⟨A⟩] are different. We observe a clear trend that G2 rises with ⟨Π⟩. This behavior is illustrated in Figure 15.7 and can be attributed to the higher density of the layer (or greater Γir) at higher ⟨Π⟩. The slope in Figure 15.7 is approximately 2.0. It seems physically plausible to anticipate such a trend: The work by Boury et al. (1995) reports increasing elasticity (E, corresponding to our G1 + G2) of bovine serum albumin with growing density (Γ) and surface pressure (Π) of the adsorbed layer, with E(Π) being linear. Other examples can be found in the arti-cle of Benjamins et al. (2006), with proteins on oil/water and air/water boundaries.
There is no particular dependence of G1 and η on ⟨Π⟩ (Table 15.1). Perhaps the differences in ⟨Π⟩, and in the layer density, between experimental runs 1–4 are too small to affect these two rheological properties. As far as the rate of strain, dγ/dt does indeed have an influence on the results in Table 15.1, the mean adsorption ⟨Γr⟩ is not expected to be in full equilibrium with the bulk. Still, the deviations from the true Γr,eq seem to be modest in the studied range of conditions.
The Maxwell characteristic time for the reversibly exchangeable molecules, tM = η/G1, is confined in the interval 15.5–18.9 s for the data in Table 15.1. This tM is shorter in comparison with the oscillation period, T (the latter varies between 99.5 and 191.1 s, see Table 15.1). Hence, the mass transfer is relatively fast. Nevertheless,
table 15.1Values of the material parameters, determined from the best Fit of τ(γ) data for different deformation rates and degrees of layer compression [⟨A⟩]
system #
1 2 3 4
G1 (mN/m) 13.90 13.22 10.40 12.76
G2 (mN/m) 7.62 9.10 9.88 13.59
η (Pa s m) (or ×103 sP) 0.2149 0.2421 0.1968 0.2064
⟨Π⟩ (mN/m) 20.47 21.22 22.27 23.38
⟨A⟩ (cm2) 99.93 79.72 99.68 79.72
dγ/dt (s−1) 3.51 × 10⁻³ 3.40 × 10⁻³ 1.89 × 10⁻³ 1.85 × 10⁻³
T (s) 99.51 112.95 170.51 191.05
© 2014 by Taylor & Francis Group, LLC
365Interfacial Rheology of Viscoelastic Surfactant–Polymer Layers
it causes a rather significant effect of viscous dissipation, manifested as the “loop” in the graphs of Figure 15.6.
15.5 conclusIons
This work reports an analysis of the rheological behavior of a surface layer that is subjected to cyclic expansion/compression in a Langmuir trough, with a triangle-shaped waveform versus time. We derive an exact solution for the stress response, represented as a Fourier series (Equation 15.4a), in the case when the Zener model is applicable. The same methodology can be used in combination with other rheologi-cal models of choice.
The physical meaning of the material parameters (two elasticities and one viscos-ity) is discussed in view of the effects that influence the surface tension upon deforma-tion. It is shown that one elastic modulus (G2) can be ascribed to irreversibly adsorbed molecules, equivalent to insoluble in the bulk subphase. The second modulus (G1), which is part of the Maxwell element in the Zener model, coincides with the Gibbs elasticity (EG) of adsorbed molecules capable of reversible exchange with the subsur-face or the volume phase. The Gibbs elasticity is a thermodynamic quantity, related to the equation of state; it is independent from the non-equilibrium effects in the surfac-tant distribution. The apparent viscosity (η) is connected with the mass transfer coef-ficient of the exchange between the interface and its bulk surroundings. A formula is proposed for this connection, Equation 15.19, which follows from the premise that the transport flux is proportional to the deviations in the chemical potential.
The theory is employed to fit experimental results for a mixed layer consisting of a low-molecular-weight surfactant and a polymer. Their structure suggests that electrostatic attraction may be operative between the species and can cause attach-ment of the polymer to the surfactant-laden A/W boundary. The measured data are in good agreement with the model; the obtained values of the material parameters are discussed in relation to the average density of the adsorption layer.
5
7
9
11
13
15
20 21 22 23 24<Π> (mN/m)
G2 (
mN
/m)
FIgure 15.7 Results for the elasticity modulus owing to irreversibly adsorbed molecules, G2, plotted as a function of the average surface pressure. The points correspond to separate independent experiments (see the values marked with shade and boldface in Table 15.1).
© 2014 by Taylor & Francis Group, LLC
366 Colloid and Interface Chemistry for Nanotechnology
acknowledgments
This work was funded by BASF SE. T. Gurkov also wishes to acknowledge par-tial financial support from the project DCVP 02/2-2009 with the Bulgarian Science Fund (National Centre for Advanced Materials “UNION”: Module 1, Centre for Advanced Materials).
reFerences
Benjamins, J., J. Lyklema and E. H. Lucassen-Reynders. 2006. Compression/expansion rheol-ogy of oil/water interfaces with adsorbed proteins. Comparison with the air/water sur-face. Langmuir 22: 6181–88.
Boury, F., Tz. Ivanova, I. Panaiotov, J. E. Proust, A. Bois and J. Richou. 1995. Dilatational properties of adsorbed poly(d,l-lactide) and bovine serum albumin monolayers at the DCM/water interface. Langmuir 11: 1636–44.
Freer, E. M., K. S. Yim, G. G. Fuller and C. J. Radke. 2004. Shear and dilatational relax-ation mechanisms of globular and flexible proteins at the hexadecane/water interface. Langmuir 20: 10159–67.
Hilles, H., F. Monroy, L. J. Bonales, F. Ortega and R. G. Rubio. 2006. Fourier-transform rheol-ogy of polymer Langmuir monolayers: Analysis of the non-linear and plastic behaviors. Adv. Colloid Interface Sci. 122: 67–77.
Horozov, T. S., P. A. Kralchevsky, K. D. Danov and I. B. Ivanov. 1997. Interfacial rheol-ogy and kinetics of adsorption from surfactant solutions. J. Dispersion Sci. Technol. 18: 593–607.
Kotsmar, Cs., V. Pradines, V. S. Alahverdjieva, E. V. Aksenenko, V. B. Fainerman, V. I. Kovalchuk, J. Krägel, M. E. Leser, B. A. Noskov and R. Miller. 2009. Thermodynamics, adsorption kinetics and rheology of mixed protein–surfactant interfacial layers. Adv. Colloid Interface Sci. 150: 41–54.
Kralchevsky, P. A., K. D. Danov and N. D. Denkov. 2008. Chemical physics of colloid sys-tems and interfaces. In Handbook of Surface and Colloid Chemistry, ed. K. S. Birdi, 3rd updated edition, 197–377. Boca Raton, FL: CRC Press.
Langevin, D. 2000. Influence of interfacial rheology on foam and emulsion properties. Adv. Colloid Interface Sci. 88: 209–222.
Liggieri, L. and R. Miller. 2010. Relaxation of surfactants adsorption layers at liquid inter-faces. Curr. Opin. Colloid Interface Sci. 15: 256–63.
Lucassen, J. and M. van den Tempel. 1972. Dynamic measurements of dilational properties of a liquid interface. Chem. Eng. Sci. 27: 1283–91.
Lucassen-Reynders, E. H., A. Cagna and J. Lucassen. 2001. Gibbs elasticity, surface dilational modulus and diffusional relaxation in nonionic surfactant monolayers. Colloids Surf. A Physicochem. Eng. Aspects 186: 63–72.
Miller, R., J. K. Ferri, A. Javadi, J. Krägel, N. Mucic and R. Wüstneck. 2010. Rheology of interfacial layers. Colloid Polym. Sci. 288: 937–50.
Mucic, N., A. Javadi, N. M. Kovalchuk, E. V. Aksenenko and R. Miller. 2011. Dynamics of interfacial layers—Experimental feasibilities of adsorption kinetics and dilational rheol-ogy. Adv. Colloid Interface Sci. 168: 167–78.
Ouis, D. 2003. Combination of a standard viscoelastic model and fractional derivate calculus to the characterization of polymers. Mater. Res. Innovat. 7: 42–6.
Peng, G. and J. C. Roberts. 2000. Solubility and toxicity of resin acids. Water Res. 34: 2779–85.Russev, S. C., N. Alexandrov, K. G. Marinova, K. D. Danov, N. D. Denkov, L. Lyutov, V.
Vulchev and C. Bilke-Krause. 2008. Instrument and methods for surface dilatational rheology measurements. Rev. Sci. Instrum. 79: 104102 (1–10).
© 2014 by Taylor & Francis Group, LLC
367Interfacial Rheology of Viscoelastic Surfactant–Polymer Layers
Sagis, L. M. C. 2011. Dynamic properties of interfaces in soft matter: Experiments and theory. Rev. Mod. Phys. 83: 1367–403.
Wantke, K.-D., J. Örtegren, H. Fruhner, A. Andersen and H. Motschmann. 2005. The influence of the sublayer on the surface dilatational modulus. Colloids Surf. A Physicochem. Eng. Aspects 261: 75–83.
Wilde, P. J. 2000. Interfaces: Their role in foam and emulsion behaviour. Curr. Opin. Colloid Interface Sci. 5: 176–81.
© 2014 by Taylor & Francis Group, LLC
Related Documents
![1 Interfacial Rheology System. 2 Background of Interfacial Rheology Interfacial Shear Stress Interfacial Shear Viscosity = [ ]](https://static.cupdf.com/doc/110x72/56649d1f5503460f949f3d29/1-interfacial-rheology-system-2-background-of-interfacial-rheology-interfacial.jpg)