1 No. 15-024E 3:00 P.M. JST, March 17, 2015 Consolidated Financial Results for the Third Quarter Ended December 31, 2014 Tokyo, March 17, 2015 -- Sony Corporation (“Sony”) today announced its consolidated financial results for the third quarter ended December 31, 2014 (October 1, 2014 to December 31, 2014). On February 4, 2015, Sony announced third quarter results for each of its segments, with the exception of the Pictures segment, and third quarter forecasts for consolidated results and the Pictures segment based on the information available to management at that time. Consolidated results and Pictures segment results have been updated to reflect actual results as shown below. (Billions of yen, millions of U.S. dollars, except per share amounts) Third Quarter ended December 31 2013 2014 Change in yen 2014* Sales and operating revenue ¥2,410.7 ¥2,566.7 +6.5 % $21,213 Operating income 88.9 182.1 +104.9 1,505 Income before income taxes 88.3 167.8 +90.1 1,387 Net income attributable to Sony Corporation’s stockholders 26.4 90.0 +241.0 744 Net income attributable to Sony Corporation’s stockholders per share of common stock: - Basic ¥25.43 ¥78.12 +207.2 $0.65 - Diluted 22.58 76.96 +240.8 0.64 * U.S. dollar amounts have been translated from yen, for convenience only, at the rate of 121 yen = 1 U.S. dollar, the approximate Tokyo foreign exchange market rate as of December 31, 2014. The average foreign exchange rates during the quarters ended December 31, 2013 and 2014 are presented below. Third Quarter ended December 31 2013 2014 Change The average rate of yen 1 U.S. dollar ¥ 100.5 ¥ 114.5 12.3 % (yen depreciation) 1 Euro 136.7 143.0 4.4 (yen depreciation) Consolidated Results for the Third Quarter Ended December 31, 2014 Sales and operating revenue (“Sales”) were 2,566.7 billion yen (21,213 million U.S. dollars), an increase of 6.5% compared to the same quarter of the previous fiscal year (“year-on-year”). This increase is primarily due to the favorable impact of foreign exchange rates, a significant increase in Mobile Communications (“MC”) segment sales reflecting an increase in unit sales of smartphones, a significant increase in Devices segment sales due to the strong performance of image sensors, and a significant increase in Game & Network Services (“G&NS”) segment sales reflecting the strong performance of PlayStation 4 (“PS4”). This increase was partially offset by a significant decrease in sales in All Other, primarily related to Sony’s exit from the PC business, and a decrease in sales in the Pictures segment, mainly due to lower Motion Pictures and Television Productions sales. On a constant currency basis, sales decreased by 0.3% year-on-year. For further details about sales on a constant currency basis, see Note on page 10. News & Information 1-7-1 Konan, Minato-ku Tokyo 108-0075 Japan

Welcome message from author
This document is posted to help you gain knowledge. Please leave a comment to let me know what you think about it! Share it to your friends and learn new things together.
Transcript

1
No. 15-024E
3:00 P.M. JST, March 17, 2015
Consolidated Financial Results for the Third Quarter Ended December 31, 2014
Tokyo, March 17, 2015 -- Sony Corporation (“Sony”) today announced its consolidated financial results for the third quarter ended December 31, 2014 (October 1, 2014 to December 31, 2014). On February 4, 2015, Sony announced third quarter results for each of its segments, with the exception of the Pictures segment, and third quarter forecasts for consolidated results and the Pictures segment based on the information available to management at that time. Consolidated results and Pictures segment results have been updated to reflect actual results as shown below. (Billions of yen, millions of U.S. dollars, except per share amounts)
Third Quarter ended December 31 2013 2014 Change in yen 2014*
Sales and operating revenue ¥2,410.7 ¥2,566.7 +6.5 % $21,213 Operating income 88.9 182.1 +104.9 1,505 Income before income taxes 88.3 167.8 +90.1 1,387 Net income attributable to Sony Corporation’s
stockholders 26.4 90.0 +241.0 744 Net income attributable to Sony Corporation’s
stockholders per share of common stock: - Basic ¥25.43 ¥78.12 +207.2 $0.65 - Diluted 22.58 76.96 +240.8 0.64 * U.S. dollar amounts have been translated from yen, for convenience only, at the rate of 121 yen = 1 U.S. dollar, the approximate Tokyo
foreign exchange market rate as of December 31, 2014. The average foreign exchange rates during the quarters ended December 31, 2013 and 2014 are presented below. Third Quarter ended December 31 2013 2014 Change
The average rate of yen 1 U.S. dollar ¥ 100.5 ¥ 114.5 12.3 % (yen depreciation)
1 Euro 136.7 143.0 4.4 (yen depreciation) Consolidated Results for the Third Quarter Ended December 31, 2014 Sales and operating revenue (“Sales”) were 2,566.7 billion yen (21,213 million U.S. dollars), an increase of 6.5% compared to the same quarter of the previous fiscal year (“year-on-year”). This increase is primarily due to the favorable impact of foreign exchange rates, a significant increase in Mobile Communications (“MC”) segment sales reflecting an increase in unit sales of smartphones, a significant increase in Devices segment sales due to the strong performance of image sensors, and a significant increase in Game & Network Services (“G&NS”) segment sales reflecting the strong performance of PlayStation 4 (“PS4”). This increase was partially offset by a significant decrease in sales in All Other, primarily related to Sony’s exit from the PC business, and a decrease in sales in the Pictures segment, mainly due to lower Motion Pictures and Television Productions sales. On a constant currency basis, sales decreased by 0.3% year-on-year. For further details about sales on a constant currency basis, see Note on page 10.
News & Information
1-7-1 Konan, Minato-ku Tokyo 108-0075 Japan

2
Operating income increased 93.2 billion yen year-on-year to 182.1 billion yen (1,505 million U.S. dollars). This significant increase was primarily due to a significant improvement in the operating results of the Devices, Home Entertainment & Sound (“HE&S”), G&NS, and Imaging Products & Solutions (“IP&S”) segments. This improvement was partially offset by a significant decrease in operating income in the Pictures segment. Operating income in the current quarter includes an 11.2 billion yen (93 million U.S dollars) write-down of PlayStation®Vita (“PS Vita”) and PlayStation TV (“PS TV”) components in the G&NS segment. In the same quarter of the previous fiscal year, a 32.1 billion yen impairment charge related to long-lived assets in the battery business in the Devices segment and a 6.2 billion yen write-off of certain PC software titles in the G&NS segment were recorded. During the current quarter, restructuring charges, net, decreased 4.6 billion yen year-on-year to 9.0 billion yen (75 million U.S. dollars). PC exit costs decreased 6.1 billion yen year-on-year to 4.9 billion yen (41 million U.S. dollars) which includes 1.4 billion yen (11 million U.S. dollars) of restructuring charges. For further details about PC exit costs, see page 7. Equity in net loss of affiliated companies, recorded within operating income, of 0.1 billion yen (1 million U.S. dollars) was recorded, compared to income of 1.7 billion yen in the same period of the previous fiscal year. This deterioration was mainly due to a deterioration of equity in net income (loss) for EMI Music Publishing. The net effect of other income and expenses was an expense of 14.3 billion yen (118 million U.S. dollars), a deterioration of 13.7 billion yen year-on-year primarily due to a decrease in the gain on sales of securities investments. In the same quarter of the previous fiscal year, a 7.4 billion yen gain on the sale of Sony’s share in SKY Perfect JSAT Holdings Inc. was recorded. Income before income taxes increased 79.5 billion yen to 167.8 billion yen (1,387 million U.S. dollars). Income taxes: During the current quarter, Sony recorded 56.2 billion yen (464 million U.S. dollars) of income tax expense, resulting in an effective tax rate of 33.5%. Net income attributable to Sony Corporation’s stockholders, which excludes net income attributable to noncontrolling interests, increased 63.6 billion yen year-on-year to 90.0 billion yen (744 million U.S. dollars). Operating Performance Highlights by Business Segment “Sales and operating revenue” in each business segment represents sales and operating revenue recorded before intersegment transactions are eliminated. “Operating income (loss)” in each business segment represents operating income (loss) reported before intersegment transactions are eliminated and excludes unallocated corporate expenses.
Mobile Communications (MC) (Billions of yen, millions of U.S. dollars)
Third Quarter ended December 31 2013 2014 Change in yen 2014 Sales and operating revenue ¥333.2 ¥429.0 +28.7 % $3,545 Operating income 6.3 9.3 +46.2 76 Sales increased 28.7% year-on-year (a 23% increase on a constant currency basis) to 429.0 billion yen (3,545 million U.S. dollars), primarily due to an increase in smartphone unit sales, an improvement in product mix and the favorable impact of foreign exchange rates. Operating income increased 2.9 billion yen year-on-year to 9.3 billion yen (76 million U.S. dollars). This increase was primarily due to the above-mentioned improvement in product mix and increase in smartphone unit sales, partially offset mainly by the unfavorable impact of the appreciation of the U.S. dollar, reflecting the high ratio of U.S. dollar-denominated costs.

3
Game & Network Services (G&NS) (Billions of yen, millions of U.S. dollars)
Third Quarter ended December 31 2013 2014 Change in yen 2014 Sales and operating revenue ¥454.9 ¥531.5 +16.8 % $4,393 Operating income 12.4 27.6 +122.8 228 Sales increased 16.8% year-on-year (an 8% increase on a constant currency basis) to 531.5 billion yen (4,393 million U.S. dollars). This significant increase was primarily due to an increase in PS4 hardware unit sales, the favorable impact of foreign exchange rates and a significant increase in network services revenue, partially offset by a decrease in PlayStation®3 (“PS3”) hardware and PS3 software sales. Sales to external customers increased 19.7% year-on-year. Operating income increased 15.2 billion yen year-on-year to 27.6 billion yen (228 million U.S. dollars). This significant increase was primarily due to the impact of the above-mentioned increase in sales, partially offset by the impact of the decrease in PS3 software sales, the unfavorable impact of the appreciation of the U.S. dollar reflecting the high ratio of U.S. dollar-denominated costs, as well as the recording of an 11.2 billion yen (93 million U.S. dollars) write-down of PS Vita and PS TV components. This write-down was recorded because the latest forecast of PS TV unit sales does not reach our original forecast as a result of lower than expected unit sales in the current quarter. In the same quarter of the previous fiscal year, a 6.2 billion yen write-off of certain PC software titles was recorded. Imaging Products & Solutions (IP&S) (Billions of yen, millions of U.S. dollars)
Third Quarter ended December 31 2013 2014 Change in yen 2014 Sales and operating revenue ¥198.1 ¥201.0 +1.5 % $1,661 Operating income 12.1 23.0 +90.4 190 The IP&S segment includes the Digital Imaging Products and Professional Solutions categories. Digital Imaging Products includes compact digital cameras, interchangeable single-lens cameras and video cameras; Professional Solutions includes broadcast- and professional-use products. Due to certain changes in Sony’s organizational structure, sales and operating revenue and operating income of the IP&S segment of the comparable prior period have been reclassified to conform to the current presentation. Sales increased 1.5% year-on-year (a 5% decrease on a constant currency basis) to 201.0 billion yen (1,661 million U.S. dollars), primarily due to the favorable impact of foreign exchange rates, partially offset by a significant decrease in unit sales of digital cameras*. Operating income increased 10.9 billion yen year-on-year to 23.0 billion yen (190 million U.S. dollars). This significant increase was mainly due to a reduction in selling, general and administrative expenses and the favorable impact of foreign exchange rates, partially offset by the above-mentioned decrease in sales of digital cameras. * Digital cameras includes compact digital cameras and interchangeable single-lens cameras.
4
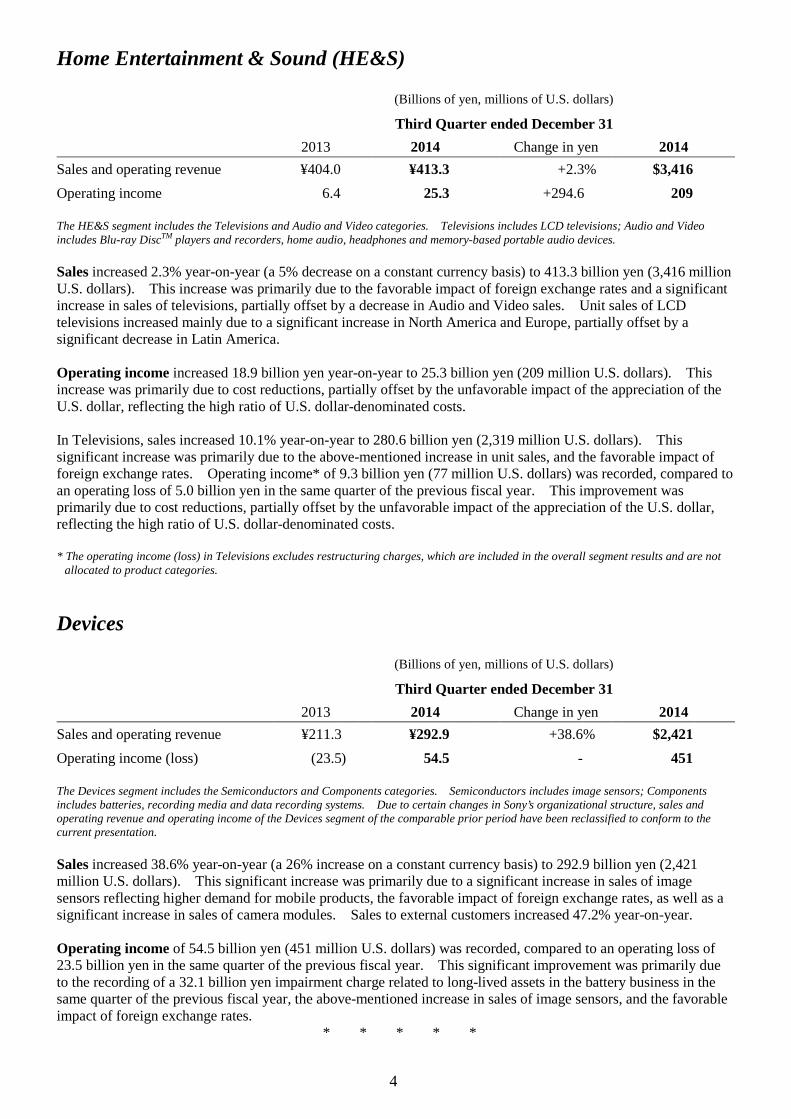
Home Entertainment & Sound (HE&S) (Billions of yen, millions of U.S. dollars)
Third Quarter ended December 31 2013 2014 Change in yen 2014 Sales and operating revenue ¥404.0 ¥413.3 +2.3 % $3,416 Operating income 6.4 25.3 +294.6 209 The HE&S segment includes the Televisions and Audio and Video categories. Televisions includes LCD televisions; Audio and Video includes Blu-ray DiscTM players and recorders, home audio, headphones and memory-based portable audio devices. Sales increased 2.3% year-on-year (a 5% decrease on a constant currency basis) to 413.3 billion yen (3,416 million U.S. dollars). This increase was primarily due to the favorable impact of foreign exchange rates and a significant increase in sales of televisions, partially offset by a decrease in Audio and Video sales. Unit sales of LCD televisions increased mainly due to a significant increase in North America and Europe, partially offset by a significant decrease in Latin America. Operating income increased 18.9 billion yen year-on-year to 25.3 billion yen (209 million U.S. dollars). This increase was primarily due to cost reductions, partially offset by the unfavorable impact of the appreciation of the U.S. dollar, reflecting the high ratio of U.S. dollar-denominated costs. In Televisions, sales increased 10.1% year-on-year to 280.6 billion yen (2,319 million U.S. dollars). This significant increase was primarily due to the above-mentioned increase in unit sales, and the favorable impact of foreign exchange rates. Operating income* of 9.3 billion yen (77 million U.S. dollars) was recorded, compared to an operating loss of 5.0 billion yen in the same quarter of the previous fiscal year. This improvement was primarily due to cost reductions, partially offset by the unfavorable impact of the appreciation of the U.S. dollar, reflecting the high ratio of U.S. dollar-denominated costs. * The operating income (loss) in Televisions excludes restructuring charges, which are included in the overall segment results and are not
allocated to product categories. Devices (Billions of yen, millions of U.S. dollars)
Third Quarter ended December 31 2013 2014 Change in yen 2014 Sales and operating revenue ¥211.3 ¥292.9 +38.6 % $2,421 Operating income (loss) (23.5 ) 54.5 - 451 The Devices segment includes the Semiconductors and Components categories. Semiconductors includes image sensors; Components includes batteries, recording media and data recording systems. Due to certain changes in Sony’s organizational structure, sales and operating revenue and operating income of the Devices segment of the comparable prior period have been reclassified to conform to the current presentation. Sales increased 38.6% year-on-year (a 26% increase on a constant currency basis) to 292.9 billion yen (2,421 million U.S. dollars). This significant increase was primarily due to a significant increase in sales of image sensors reflecting higher demand for mobile products, the favorable impact of foreign exchange rates, as well as a significant increase in sales of camera modules. Sales to external customers increased 47.2% year-on-year. Operating income of 54.5 billion yen (451 million U.S. dollars) was recorded, compared to an operating loss of 23.5 billion yen in the same quarter of the previous fiscal year. This significant improvement was primarily due to the recording of a 32.1 billion yen impairment charge related to long-lived assets in the battery business in the same quarter of the previous fiscal year, the above-mentioned increase in sales of image sensors, and the favorable impact of foreign exchange rates.
* * * * *

5
Total inventory of the five Electronics* segments above as of December 31, 2014 was 669.9 billion yen (5,536 million U.S. dollars), a decrease of 34.6 billion yen, or 4.9% year-on-year. Inventory decreased by 153.1 billion yen, or 18.6% compared with the level as of September 30, 2014. * The term “Electronics” refers to the sum of the MC, G&NS, IP&S, HE&S and Devices segments. In connection with the realignment made from the first quarter of the fiscal year ending March 31, 2015, total inventory of the five Electronics segments as of December 31, 2013 has been reclassified to conform to the presentation for the fiscal year ending March 31, 2015. For further details, please see Note on page 10.
* * * * *
Pictures (Billions of yen, millions of U.S. dollars)
Third Quarter ended December 31 2013 2014 Change in yen 2014 Sales and operating revenue ¥223.7 ¥206.6 -7.7 % $1,707 Operating income 24.3 6.2 -74.4 51 The Pictures segment is comprised of the Motion Pictures, Television Productions, and Media Networks categories. Motion Pictures includes the production, acquisition and distribution of motion pictures; Television Productions includes the production, acquisition and distribution of television programming; Media Networks includes the operation of television and digital networks. The results presented in Pictures are a yen-translation of the results of Sony Pictures Entertainment Inc. (“SPE”), a U.S.-based operation that aggregates the results of its worldwide subsidiaries on a U.S. dollar basis. Management analyzes the results of SPE in U.S. dollars, so discussion of certain portions of its results is specified as being on “a U.S. dollar basis.” Sales decreased 7.7% year-on-year (a 20% decrease on a constant currency (U.S. dollar) basis) to 206.6 billion yen (1,707 million U.S. dollars). The significant decrease in sales on a U.S. dollar basis was primarily due to a decrease in sales for Motion Pictures and Television Productions. The decrease in Motion Pictures sales was due to significantly lower home entertainment and theatrical revenues. The decrease in home entertainment revenues was due to fewer major home entertainment releases in the current quarter as compared to the same quarter of the previous fiscal year while theatrical revenues decreased due to the stronger worldwide performance of theatrical releases in the same quarter of the previous fiscal year. The decrease in Television Productions sales was due to the same quarter of the previous fiscal year benefitting from higher home entertainment and subscription video on demand (“SVOD”) revenues for the U.S. television series Breaking Bad. Operating income decreased 18.0 billion yen year-on-year to 6.2 billion yen (51 million U.S. dollars) primarily due to the above-mentioned decrease in Motion Pictures and Television Productions sales. The current quarter includes approximately 15 million U.S. dollars (1.8 billion yen) in investigation and remediation costs relating to a cyberattack on SPE’s network and IT infrastructure which was identified in November, 2014 (“the cyberattack”). Music (Billions of yen, millions of U.S. dollars)
Third Quarter ended December 31 2013 2014 Change in yen 2014 Sales and operating revenue ¥144.7 ¥163.6 +13.1 % $1,352
Operating income 21.7 25.4 +17.0 210 The Music segment is comprised of the Recorded Music, Music Publishing and Visual Media and Platform categories. Recorded Music includes the distribution of physical and digital recorded music and revenue derived from artists’ live performances; Music Publishing includes the management and licensing of the words and music of songs; Visual Media and Platform includes various service offerings for music and visual products and the production and distribution of animation titles. The results presented in Music include the yen-translated results of Sony Music Entertainment (“SME”), a U.S.-based operation which aggregates the results of its worldwide subsidiaries on a U.S. dollar basis, the results of Sony Music Entertainment (Japan) Inc., a
6
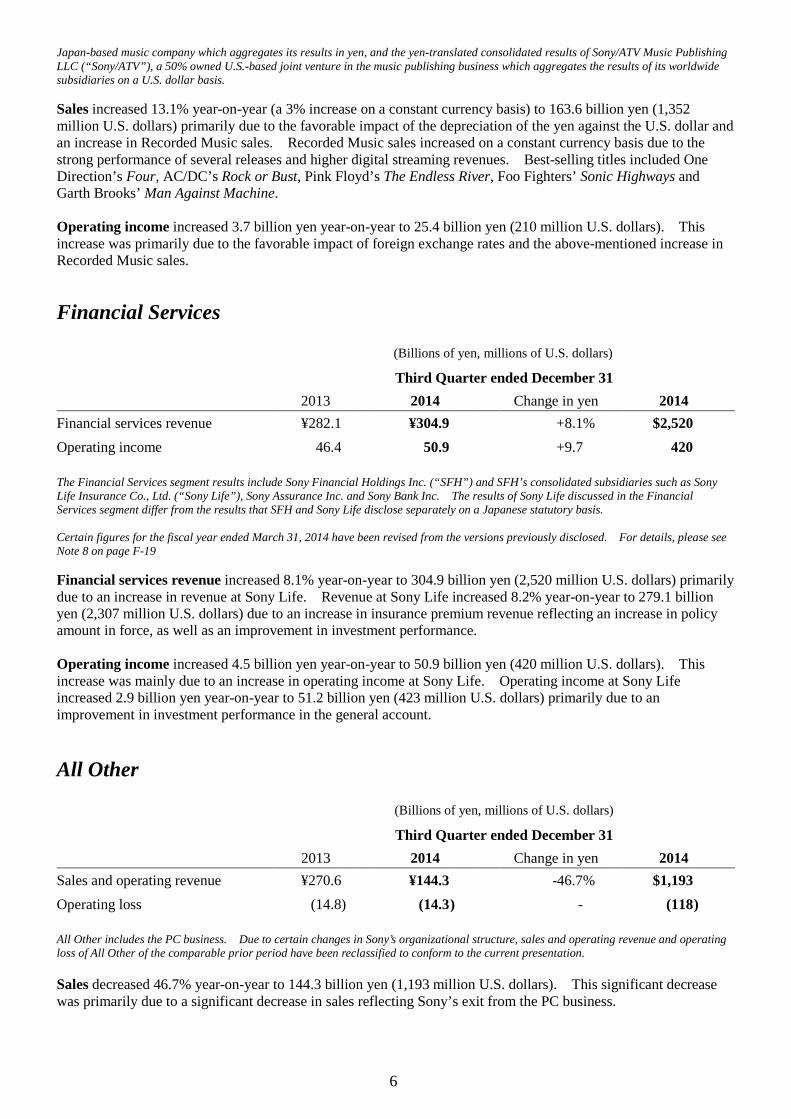
Japan-based music company which aggregates its results in yen, and the yen-translated consolidated results of Sony/ATV Music Publishing LLC (“Sony/ATV”), a 50% owned U.S.-based joint venture in the music publishing business which aggregates the results of its worldwide subsidiaries on a U.S. dollar basis. Sales increased 13.1% year-on-year (a 3% increase on a constant currency basis) to 163.6 billion yen (1,352 million U.S. dollars) primarily due to the favorable impact of the depreciation of the yen against the U.S. dollar and an increase in Recorded Music sales. Recorded Music sales increased on a constant currency basis due to the strong performance of several releases and higher digital streaming revenues. Best-selling titles included One Direction’s Four, AC/DC’s Rock or Bust, Pink Floyd’s The Endless River, Foo Fighters’ Sonic Highways and Garth Brooks’ Man Against Machine. Operating income increased 3.7 billion yen year-on-year to 25.4 billion yen (210 million U.S. dollars). This increase was primarily due to the favorable impact of foreign exchange rates and the above-mentioned increase in Recorded Music sales.
Financial Services (Billions of yen, millions of U.S. dollars)
Third Quarter ended December 31 2013 2014 Change in yen 2014 Financial services revenue ¥282.1 ¥304.9 +8.1 % $2,520 Operating income 46.4 50.9 +9.7 420 The Financial Services segment results include Sony Financial Holdings Inc. (“SFH”) and SFH’s consolidated subsidiaries such as Sony Life Insurance Co., Ltd. (“Sony Life”), Sony Assurance Inc. and Sony Bank Inc. The results of Sony Life discussed in the Financial Services segment differ from the results that SFH and Sony Life disclose separately on a Japanese statutory basis. Certain figures for the fiscal year ended March 31, 2014 have been revised from the versions previously disclosed. For details, please see Note 8 on page F-19 Financial services revenue increased 8.1% year-on-year to 304.9 billion yen (2,520 million U.S. dollars) primarily due to an increase in revenue at Sony Life. Revenue at Sony Life increased 8.2% year-on-year to 279.1 billion yen (2,307 million U.S. dollars) due to an increase in insurance premium revenue reflecting an increase in policy amount in force, as well as an improvement in investment performance. Operating income increased 4.5 billion yen year-on-year to 50.9 billion yen (420 million U.S. dollars). This increase was mainly due to an increase in operating income at Sony Life. Operating income at Sony Life increased 2.9 billion yen year-on-year to 51.2 billion yen (423 million U.S. dollars) primarily due to an improvement in investment performance in the general account. All Other (Billions of yen, millions of U.S. dollars)
Third Quarter ended December 31 2013 2014 Change in yen 2014 Sales and operating revenue ¥270.6 ¥144.3 -46.7 % $1,193 Operating loss (14.8 ) (14.3 ) - (118 ) All Other includes the PC business. Due to certain changes in Sony’s organizational structure, sales and operating revenue and operating loss of All Other of the comparable prior period have been reclassified to conform to the current presentation. Sales decreased 46.7% year-on-year to 144.3 billion yen (1,193 million U.S. dollars). This significant decrease was primarily due to a significant decrease in sales reflecting Sony’s exit from the PC business.

7
Operating loss decreased 0.5 billion yen year-on-year to 14.3 billion yen (118 million U.S. dollars). Operating loss was essentially flat year-on-year primarily due to a decrease in PC operating loss, partially offset by the deterioration of operating results in the disc manufacturing business. The following table provides PC exit costs and the total PC business operating loss. In the same quarter of the previous fiscal year, an 11.0 billion yen impairment charge related to long-lived assets in the PC business was recorded in PC exit costs. (Billions of yen, millions of U.S. dollars) Third quarter ended December 31, 2014
All Other Corporate and Elimination
Consolidated Total
Year-on-year change
Consolidated Total
(I) Restructuring charges ¥0.3 ¥1.1 ¥1.4 - ¥9.6 $11 (II) After-sales service expenses etc. 3.5 - 3.5 +3.5 29
PC exit costs (I+II) 3.8 1.1 4.9 -6.1 41 Operating loss excluding exit costs (8.5 ) - (8.5 ) +0.3 (70 ) Total PC operating loss ¥(12.3 ) ¥(1.1 ) ¥(13.4 ) +¥6.4 $(111 )
* * * * * Consolidated Results for the Nine Months ended December 31, 2014 For Conslidated Statements of Income and Business Segment Information for the nine months ended December 31, 2014 and 2013, please refer to pages F-3 and F-7 respectively. Sales for the current nine months increased 6.5% year-on-year to 6,278.2 billion yen (51,886 million U.S. dollars). This increase was primarily due to a significant increase in sales in the G&NS, MC and Devices segments, and the favorable impact of foreign exchange rates, partially offset by a significant decrease in sales in All Other, primarily related to Sony’s exit from the PC business. During the current nine months, the average rates of the yen were 106.9 yen against the U.S. dollar and 140.3 yen against the euro, which were 7.0% lower and 5.7% lower, respectively, as compared with the same period in the previous fiscal year. On a constant currency basis, consolidated sales increased 2%. For further detail about sales on a constant currency basis, see Note on page 10. In the MC segment, sales increased significantly primarily due to an improvement in product mix and the favorable impact of foreign exchange rates. In the G&NS segment, sales increased significantly primarily due to increases in PS4 hardware unit sales and network services revenues. In the IP&S segment, sales decreased primarily due to a decrease in sales of digital cameras. In the HE&S segment, sales increased primarily due to a significant increase in sales of televisions and the favorable impact of foreign exchange rates. In the Devices segment, sales increased significantly mainly due to an increase in sales of image sensors for mobile devices and the favorable impact of foreign exchange rates. In the Pictures segment, sales increased due to the favorable impact of the depreciation of the yen against the U.S. dollar, partially offset by lower Television Productions sales as the same period of the previous fiscal year benefitted from higher home entertainment and SVOD revenues for the U.S. television series Breaking Bad. In the Music segment, sales increased primarily due to the favorable impact of the depreciation of the yen against the U.S. dollar and an increase in Visual Media and Platform sales. In the Financial Services segment, revenue increased primarily due to higher insurance premiums revenue and an improvement in investment performance in the general account at Sony Life. Operating income increased 28.0 billion yen year-on-year to 166.3 billion yen (1,375 million U.S. dollars) for the current nine months. This significant increase was primarily due to a significant improvement in the operating results of the Devices, G&NS, HE&S, and IP&S segments. The operating results in the MC segment deteriorated significantly primarily due to the recording of a 176.0 billion yen (1,615 million U.S. dollars) impairment of goodwill. Operating income during the current nine months includes a net benefit of 6.2 billion yen (51 million U.S. dollars) from insurance recoveries related to damages and losses incurred from the floods in Thailand in the fiscal year ended March 31, 2012 (“the Floods”). The same period of the previous fiscal year included a 32.1 billion yen impairment charge related to long-lived assets in the battery business in the Devices segments, a gain of 12.8 billion yen from the sale of certain shares of M3, Inc., a net benefit of 8.8 billion yen from insurance recoveries related to damages and losses incurred from the Floods and a benefit of 7.0 billion yen from the reversal of a patent royalty accrual.

8
In the MC segment, operating results significantly deteriorated year-on-year mainly due to the above-mentioned impairment charge recorded in this segment as well as the unfavorable impact of the appreciation of the U.S. dollar, reflecting the high ratio of U.S. dollar-denominated costs. In the G&NS segment, operating results improved significantly year-on-year primarily due to an increase in PS4 hardware and software sales. In the IP&S segment, operating income increased significantly year-on-year primarily due to a reduction in costs and an improvement in product mix reflecting a shift to high value-added models. In the HE&S segment, operating income was recorded compared to a loss in the same period of the previous fiscal year primarily due to cost reductions and an improvement in product mix reflecting a shift to high value-added models. In the Devices segment, operating results improved significantly mainly due to the recording of a 32.1 billion yen impairment charge related to long-lived assets in the battery business in the same period of the previous fiscal year and the increase in sales of image sensors. In the Pictures segment, operating income increased primarily due to the stronger performance of the current fiscal year’s film release slate as the previous fiscal year reflected the theatrical underperformance of White House Down and After Earth, partially offset by the gain recognized on the sale of SPE’s music publishing catalog in the same period of the previous fiscal year, higher programming costs for Sony’s television networks in India, and the above mentioned decrease in Television Productions sales. In the Music segment, operating income increased primarily due to the favorable impact of foreign exchange rates and a shift in Recorded Music to digital streaming revenues. In the Financial Services segment, operating income increased primarily due to an improvement in investment performance in the general account at Sony Life. Restructuring charges, recorded as operating expenses, amounted to 33.7 billion yen (279 million U.S. dollars) for the current nine months compared to 26.1 billion yen for the same period of the previous fiscal year. Equity in net income of affiliated companies, recorded within operating income, was 3.7 billion yen (31 million U.S. dollars), compared to a loss of 0.8 billion yen in the same period of the previous fiscal year. This improvement was mainly due to an improvement of equity in net income (loss) for Intertrust Technologies Corporation. The net effect of other income and expenses was an expense of 20.1 billion yen (166 million U.S. dollars), compared to income of 0.5 billion yen in the same period of the previous fiscal year. This deterioration was mainly due to an increase in foreign exchange loss, net and a decrease in the gain on sales of securities investments. In the same period of the previous fiscal year, a 7.4 billion yen gain on the sale of Sony’s share in SKY Perfect JSAT Holdings Inc. was recorded. Income before income taxes increased by 7.4 billion yen year-on-year to 146.3 billion yen (1,209 million U.S. dollars). Income taxes: During the current nine months, Sony recorded 112.3 billion yen (928 million U.S. dollars) of income tax expense, and Sony’s effective tax rate exceeded the Japanese statutory tax rate. This is primarily due to nondeductible goodwill impairments recorded during the current nine months. Net loss attributable to Sony Corporation’s stockholders for the current nine months was 19.2 billion yen (159 million U.S. dollars) compared to income of 9.9 billion yen in the same period of the previous fiscal year.
* * * * * Cash Flows For Consolidated Statements of Cash Flows, charts showing Sony’s cash flow information for all segments, all segments excluding the Financial Services segment and the Financial Services segment alone, please refer to pages F-5 and F-17. In the Financial Services segment, certain figures for the fiscal year ended March 31, 2014 have been revised from the versions previously disclosed. For further details, please see Note 8 on page F-19. Operating Activities: During the current nine months, there was a net cash inflow of 382.9 billion yen (3,165 million U.S. dollars) from operating activities, an increase of 139.4 billion yen, or 57.3% year-on-year. For all segments excluding the Financial Services segment, there was a net cash inflow of 112.5 billion yen (931 million U.S. dollars) for the current nine months, compared to a net cash outflow of 10.8 billion yen in the same period of the previous fiscal year. The net cash inflow was primarily due to the positive impact of a year-on-year
9
improvement in net income after taking into account non-cash adjustments (including depreciation and amortization, other operating expenses, net, deferred income taxes and equity in net loss of affiliated companies). In addition, there was the positive impact of a decrease in inventories, compared to an increase in the same period of the previous fiscal year, and a smaller increase in other receivables from component assembly companies, included in other current assets, partially offset by the negative impact of a smaller year-on-year increase in notes and accounts payable, trade. The Financial Services segment had a net cash inflow of 278.2 billion yen (2,300 million U.S. dollars), an increase of 17.2 billion yen, or 6.6% year-on-year. This increase was primarily due to an increase of insurance premium revenue in line with a growing policy amount in force at Sony Life. Investing Activities: During the current nine months, Sony used 363.8 billion yen (3,007 million U.S. dollars) of net cash in investing activities, a decrease of 73.0 billion yen, or 16.7% year-on-year. For all segments excluding the Financial Services segment, there was a 46.7 billion yen (386 million U.S. dollars) net cash outflow, an increase of 0.5 billion yen, or 1.2% year-on-year. This increase was primarily due to a year-on-year decrease in proceeds from the sales of fixed assets and investment securities. Sales of fixed assets and investment securities in the current nine months included the intersegment sale of Sony Corporation’s headquarters’ land to Sony Life, the sale of certain buildings and premises at the Gotenyama Technology Center and the sale of Sony’s shares in SQUARE ENIX HOLDINGS CO., LTD. The Financial Services segment used 317.1 billion yen (2,621 million U.S. dollars) of net cash, a decrease of 73.6 billion yen, or 18.8% year-on-year. This decrease was mainly due to a decrease in payments for investments and advances at Sony Life and a year-on-year increase in proceeds from the sale of investment securities. This decrease was partially offset by the negative impact of the intersegment purchase of Sony Corporation’s headquarters’ land by Sony Life, which is eliminated in the consolidated financial statements. In all segments excluding the Financial Services segment, net cash generated in operating and investing activities combined*1 for the current nine months was 65.9 billion yen (544 million U.S. dollars), a 122.8 billion yen improvement from cash used in the same period of the previous fiscal year. Financing Activities: During the current nine months, 184.6 billion yen (1,525 million U.S. dollars) of net cash and cash equivalents was used in financing activities, compared to 151.0 billion yen of net cash and cash equivalents provided in the same period of the previous fiscal year. For all segments excluding the Financial Services segment, there was a 281.5 billion yen (2,327 million U.S. dollars) net cash outflow, an increase of 256.8 billion yen, or 1,041% year-on-year. This increase was primarily due to an issuance of straight bonds for Japanese retail investors in the same period of the previous fiscal year and a year-on-year increase in repayments of long-term debt, net. In the Financial Services segment, financing activities provided 89.1 billion yen (736 million U.S. dollars) of net cash, a decrease of 79.9 billion yen, or 47.3% year-on-year. This decrease was mainly due to a smaller increase in customer deposits at Sony Life, compared to the figure in the same period of the previous fiscal year. Total Cash and Cash Equivalents: Accounting for the above factors and the effect of fluctuations in foreign exchange rates, the total outstanding balance of cash and cash equivalents at December 31, 2014 was 933.5 billion yen (7,715 million U.S. dollars). Cash and cash equivalents of all segments excluding the Financial Services segment was 642.9 billion yen (5,314 million U.S. dollars) at December 31, 2014, an increase of 34.6 billion yen, or 5.7% compared with the balance as of December 31, 2013, and a decrease of 163.2 billion yen, or 20.2% compared with the balance as of March 31, 2014. Sony believes that it continues to maintain sufficient liquidity through access to a total, translated into yen, of 775.0 billion yen (6,405 million U.S. dollars) of unused committed lines of credit with financial institutions in addition to the cash and cash equivalents balance at December 31, 2014. Within the Financial Services segment, the outstanding balance of cash and cash equivalents was 290.6 billion yen (2,401 million U.S. dollars) at December 31, 2014, an increase of 49.6 billion yen, or 20.6% compared with the balance as of December 31, 2013, and an increase of 50.2 billion yen, or 20.9% compared with the balance as of March 31, 2014. *1 Sony has included the information for cash flow from operating and investing activities combined, excluding the Financial Services
segment’s activities, as Sony’s management frequently monitors this financial measure, and believes this non-U.S. GAAP measurement is important for use in evaluating Sony’s ability to generate cash to maintain liquidity and fund debt principal and dividend payments from
10
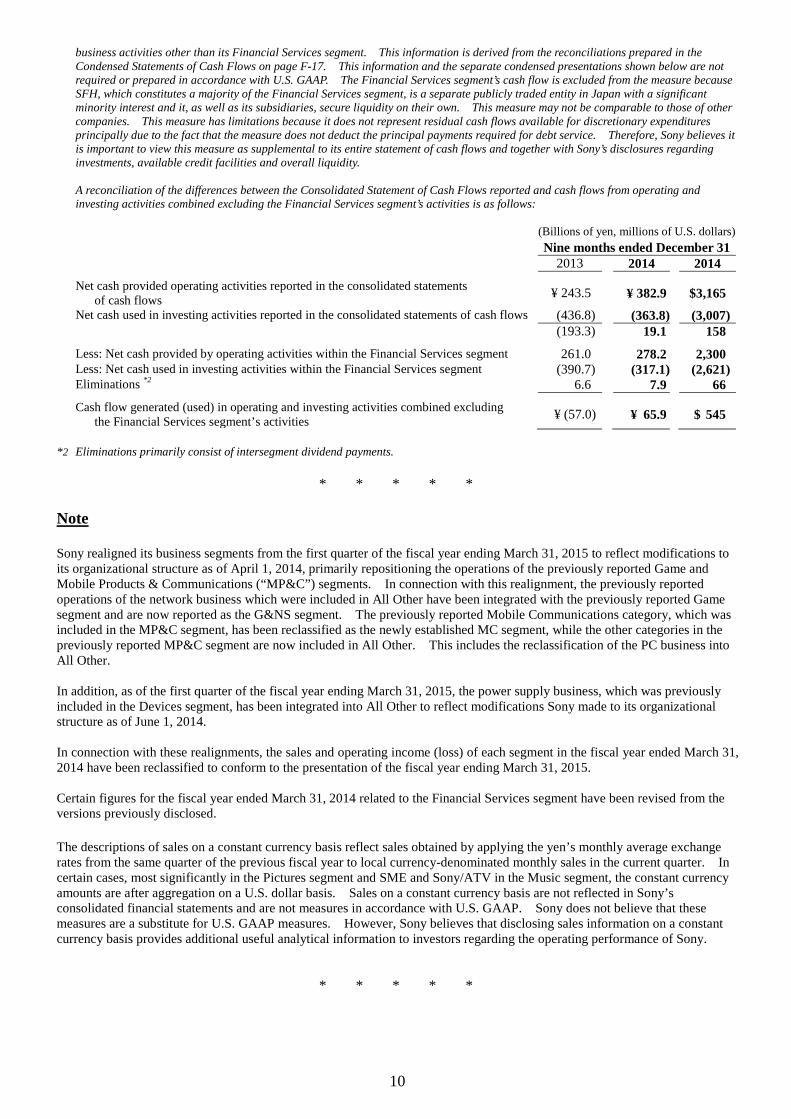
business activities other than its Financial Services segment. This information is derived from the reconciliations prepared in the Condensed Statements of Cash Flows on page F-17. This information and the separate condensed presentations shown below are not required or prepared in accordance with U.S. GAAP. The Financial Services segment’s cash flow is excluded from the measure because SFH, which constitutes a majority of the Financial Services segment, is a separate publicly traded entity in Japan with a significant minority interest and it, as well as its subsidiaries, secure liquidity on their own. This measure may not be comparable to those of other companies. This measure has limitations because it does not represent residual cash flows available for discretionary expenditures principally due to the fact that the measure does not deduct the principal payments required for debt service. Therefore, Sony believes it is important to view this measure as supplemental to its entire statement of cash flows and together with Sony’s disclosures regarding investments, available credit facilities and overall liquidity.
A reconciliation of the differences between the Consolidated Statement of Cash Flows reported and cash flows from operating and investing activities combined excluding the Financial Services segment’s activities is as follows: (Billions of yen, millions of U.S. dollars) Nine months ended December 31 2013 2014 2014 Net cash provided operating activities reported in the consolidated statements
of cash flows ¥ 243.5 ¥ 382.9 $3,165 Net cash used in investing activities reported in the consolidated statements of cash flows (436.8) (363.8) (3,007) (193.3) 19.1 158 Less: Net cash provided by operating activities within the Financial Services segment 261.0 278.2 2,300 Less: Net cash used in investing activities within the Financial Services segment (390.7) (317.1) (2,621) Eliminations *2 6.6 7.9 66 Cash flow generated (used) in operating and investing activities combined excluding
the Financial Services segment’s activities ¥ (57.0) ¥ 65.9 $ 545
*2 Eliminations primarily consist of intersegment dividend payments.
* * * * *
Note Sony realigned its business segments from the first quarter of the fiscal year ending March 31, 2015 to reflect modifications to its organizational structure as of April 1, 2014, primarily repositioning the operations of the previously reported Game and Mobile Products & Communications (“MP&C”) segments. In connection with this realignment, the previously reported operations of the network business which were included in All Other have been integrated with the previously reported Game segment and are now reported as the G&NS segment. The previously reported Mobile Communications category, which was included in the MP&C segment, has been reclassified as the newly established MC segment, while the other categories in the previously reported MP&C segment are now included in All Other. This includes the reclassification of the PC business into All Other. In addition, as of the first quarter of the fiscal year ending March 31, 2015, the power supply business, which was previously included in the Devices segment, has been integrated into All Other to reflect modifications Sony made to its organizational structure as of June 1, 2014. In connection with these realignments, the sales and operating income (loss) of each segment in the fiscal year ended March 31, 2014 have been reclassified to conform to the presentation of the fiscal year ending March 31, 2015. Certain figures for the fiscal year ended March 31, 2014 related to the Financial Services segment have been revised from the versions previously disclosed. The descriptions of sales on a constant currency basis reflect sales obtained by applying the yen’s monthly average exchange rates from the same quarter of the previous fiscal year to local currency-denominated monthly sales in the current quarter. In certain cases, most significantly in the Pictures segment and SME and Sony/ATV in the Music segment, the constant currency amounts are after aggregation on a U.S. dollar basis. Sales on a constant currency basis are not reflected in Sony’s consolidated financial statements and are not measures in accordance with U.S. GAAP. Sony does not believe that these measures are a substitute for U.S. GAAP measures. However, Sony believes that disclosing sales information on a constant currency basis provides additional useful analytical information to investors regarding the operating performance of Sony.
* * * * *
11
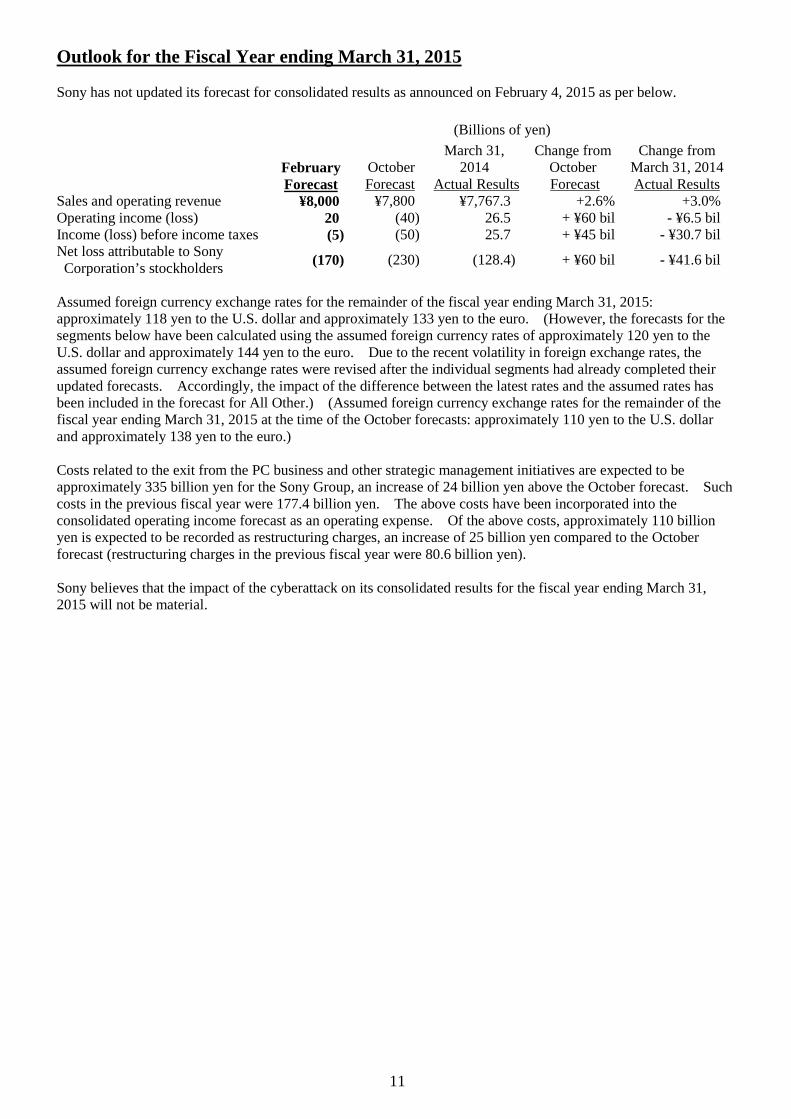
Outlook for the Fiscal Year ending March 31, 2015 Sony has not updated its forecast for consolidated results as announced on February 4, 2015 as per below. (Billions of yen)
FebruaryForecast
October Forecast
March 31, 2014
Actual Results
Change from October Forecast
Change from March 31, 2014 Actual Results
Sales and operating revenue ¥8,000 ¥7,800 ¥7,767.3 +2.6% +3.0% Operating income (loss) 20 (40) 26.5 + ¥60 bil - ¥6.5 bil Income (loss) before income taxes (5) (50) 25.7 + ¥45 bil - ¥30.7 bil Net loss attributable to Sony
Corporation’s stockholders (170) (230) (128.4) + ¥60 bil - ¥41.6 bil
Assumed foreign currency exchange rates for the remainder of the fiscal year ending March 31, 2015: approximately 118 yen to the U.S. dollar and approximately 133 yen to the euro. (However, the forecasts for the segments below have been calculated using the assumed foreign currency rates of approximately 120 yen to the U.S. dollar and approximately 144 yen to the euro. Due to the recent volatility in foreign exchange rates, the assumed foreign currency exchange rates were revised after the individual segments had already completed their updated forecasts. Accordingly, the impact of the difference between the latest rates and the assumed rates has been included in the forecast for All Other.) (Assumed foreign currency exchange rates for the remainder of the fiscal year ending March 31, 2015 at the time of the October forecasts: approximately 110 yen to the U.S. dollar and approximately 138 yen to the euro.) Costs related to the exit from the PC business and other strategic management initiatives are expected to be approximately 335 billion yen for the Sony Group, an increase of 24 billion yen above the October forecast. Such costs in the previous fiscal year were 177.4 billion yen. The above costs have been incorporated into the consolidated operating income forecast as an operating expense. Of the above costs, approximately 110 billion yen is expected to be recorded as restructuring charges, an increase of 25 billion yen compared to the October forecast (restructuring charges in the previous fiscal year were 80.6 billion yen). Sony believes that the impact of the cyberattack on its consolidated results for the fiscal year ending March 31, 2015 will not be material.
12
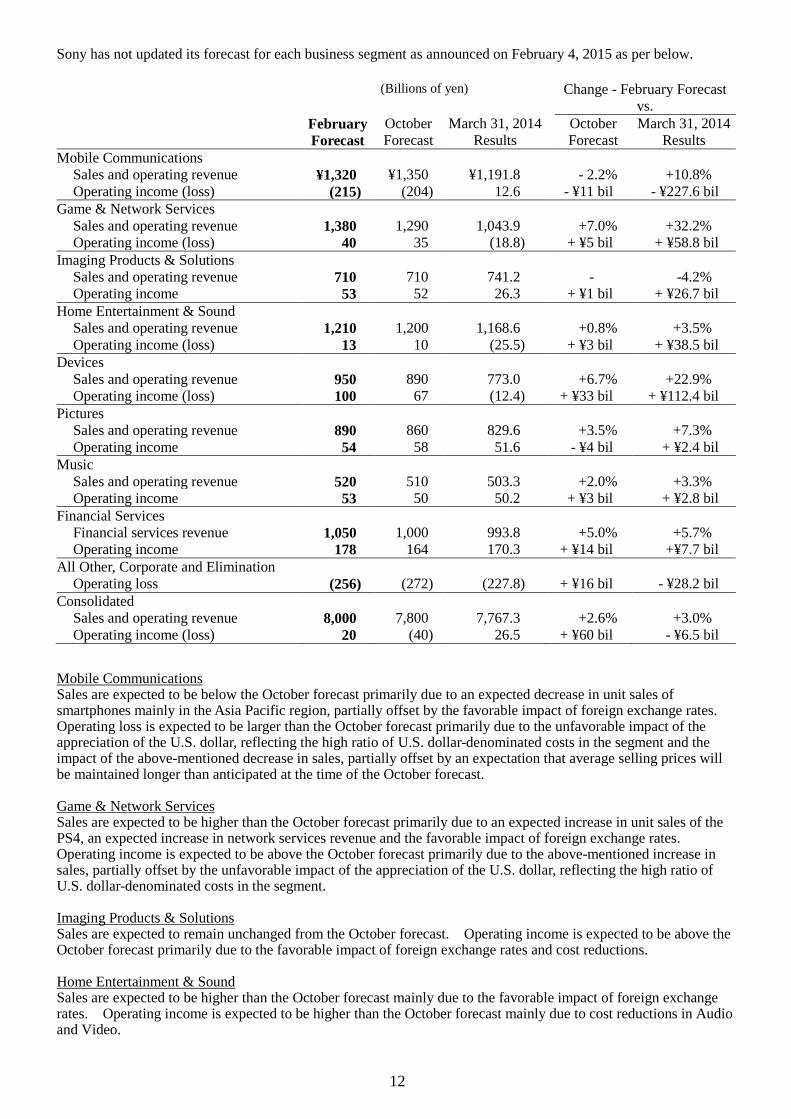
Sony has not updated its forecast for each business segment as announced on February 4, 2015 as per below. (Billions of yen) Change - February Forecast
vs. February
Forecast October Forecast
March 31, 2014 Results
October Forecast
March 31, 2014 Results
Mobile Communications Sales and operating revenue ¥1,320 ¥1,350 ¥1,191.8 - 2.2% +10.8% Operating income (loss) (215) (204) 12.6 - ¥11 bil - ¥227.6 bil Game & Network Services Sales and operating revenue 1,380 1,290 1,043.9 +7.0% +32.2% Operating income (loss) 40 35 (18.8) + ¥5 bil + ¥58.8 bil Imaging Products & Solutions Sales and operating revenue 710 710 741.2 - -4.2% Operating income 53 52 26.3 + ¥1 bil + ¥26.7 bil Home Entertainment & Sound Sales and operating revenue 1,210 1,200 1,168.6 +0.8% +3.5% Operating income (loss) 13 10 (25.5) + ¥3 bil + ¥38.5 bil Devices Sales and operating revenue 950 890 773.0 +6.7% +22.9% Operating income (loss) 100 67 (12.4) + ¥33 bil + ¥112.4 bil Pictures Sales and operating revenue 890 860 829.6 +3.5% +7.3% Operating income 54 58 51.6 - ¥4 bil + ¥2.4 bil Music Sales and operating revenue 520 510 503.3 +2.0% +3.3% Operating income 53 50 50.2 + ¥3 bil + ¥2.8 bil Financial Services Financial services revenue 1,050 1,000 993.8 +5.0% +5.7% Operating income 178 164 170.3 + ¥14 bil +¥7.7 bil All Other, Corporate and Elimination Operating loss (256) (272) (227.8) + ¥16 bil - ¥28.2 bil Consolidated Sales and operating revenue 8,000 7,800 7,767.3 +2.6% +3.0% Operating income (loss) 20 (40) 26.5 + ¥60 bil - ¥6.5 bil Mobile Communications Sales are expected to be below the October forecast primarily due to an expected decrease in unit sales of smartphones mainly in the Asia Pacific region, partially offset by the favorable impact of foreign exchange rates. Operating loss is expected to be larger than the October forecast primarily due to the unfavorable impact of the appreciation of the U.S. dollar, reflecting the high ratio of U.S. dollar-denominated costs in the segment and the impact of the above-mentioned decrease in sales, partially offset by an expectation that average selling prices will be maintained longer than anticipated at the time of the October forecast. Game & Network Services Sales are expected to be higher than the October forecast primarily due to an expected increase in unit sales of the PS4, an expected increase in network services revenue and the favorable impact of foreign exchange rates. Operating income is expected to be above the October forecast primarily due to the above-mentioned increase in sales, partially offset by the unfavorable impact of the appreciation of the U.S. dollar, reflecting the high ratio of U.S. dollar-denominated costs in the segment. Imaging Products & Solutions Sales are expected to remain unchanged from the October forecast. Operating income is expected to be above the October forecast primarily due to the favorable impact of foreign exchange rates and cost reductions. Home Entertainment & Sound Sales are expected to be higher than the October forecast mainly due to the favorable impact of foreign exchange rates. Operating income is expected to be higher than the October forecast mainly due to cost reductions in Audio and Video.

13
Devices Sales are expected to be higher than the October forecast primarily due to an anticipated increase in sales of image sensors and the favorable impact of foreign exchange rates. Operating income is expected to be higher than the October forecast primarily due to the above-mentioned increase in sales and the favorable impact of foreign exchange rates. Pictures Sales are expected to be higher than the October forecast primarily due to the favorable impact of the depreciation of the yen against the U.S. dollar. Operating income is expected to be lower than the October forecast primarily due to lower Media Networks advertising revenues as well as investigation and remediation costs relating to the cyberattack. Music Sales are expected to be higher than the October forecast primarily due to the favorable impact of foreign exchange rates. Operating income is expected to be higher that the October forecast primarily due to the favorable impact of foreign exchange rates and an increase in Recorded Music sales in Japan. Financial Services Financial services revenue and operating income are expected to exceed the October forecast because results in the current quarter exceeded expectations. Year-on-year, financial services revenue and operating income are expected to increase. The effects of future gains and losses on investments held by the Financial Services segment due to market fluctuations have not been incorporated within the above forecast as it is difficult for Sony to predict market trends in the future. Accordingly, future market fluctuations could further impact the current forecast. Sony has not updated its forecast for capital expenditures, depreciation and amortization, as well as research and development expenses for the current fiscal year as announced on February 4, 2015 as per below. Consolidated (Billions of yen) Change - February Forecast
vs. February
Forecast October Forecast
March 31, 2014 Results
October Forecast
March 31, 2014 Results
Capital expenditures* ¥285 ¥295 ¥261.0 -3.4 % +9.2 % [additions to property, plant and
equipment (included above) 195 195 164.6 - +18.5]
[additions to intangible assets (included above) * 90 100 96.4 -10.0 -6.7]
Depreciation and amortization** 350 355 376.7 -1.4 -7.1 [for property, plant and equipment
(included above) 170 170 195.8 - -13.2]
[for intangible assets (included above) 180 185 135.7 -2.7 +32.7] Research and development expenses 480 485 466.0 -1.0 +3.0 * Does not include the increase in intangible assets resulting from business acquisitions. ** The forecast for depreciation and amortization includes amortization expenses for deferred insurance acquisition costs.

14
Sony without Financial Services (Billions of yen) Change - February Forecast
vs. February
Forecast October Forecast
March 31, 2014 Results
October Forecast
March 31, 2014 Results
Capital expenditures* ¥274 ¥284 ¥250.8 -3.5 % +9.3 % [additions to property, plant and
equipment (included above) 193 193 161.4 - +19.6]
[additions to intangible assets (included above) * 81 91 89.4 -11.0 -9.4]
Depreciation and amortization 291 293 322.3 -0.7 -9.7 [for property, plant and equipment
(included above) 169 169 194.9 - -13.3]
[for intangible assets (included above) 122 124 127.4 -1.6 -4.3] * Does not include the increase in intangible assets resulting from business acquisitions. This forecast is based on management’s current expectations and is subject to uncertainties and changes in circumstances. Actual results may differ materially from those included in this forecast due to a variety of factors. See “Cautionary Statement” below.
15
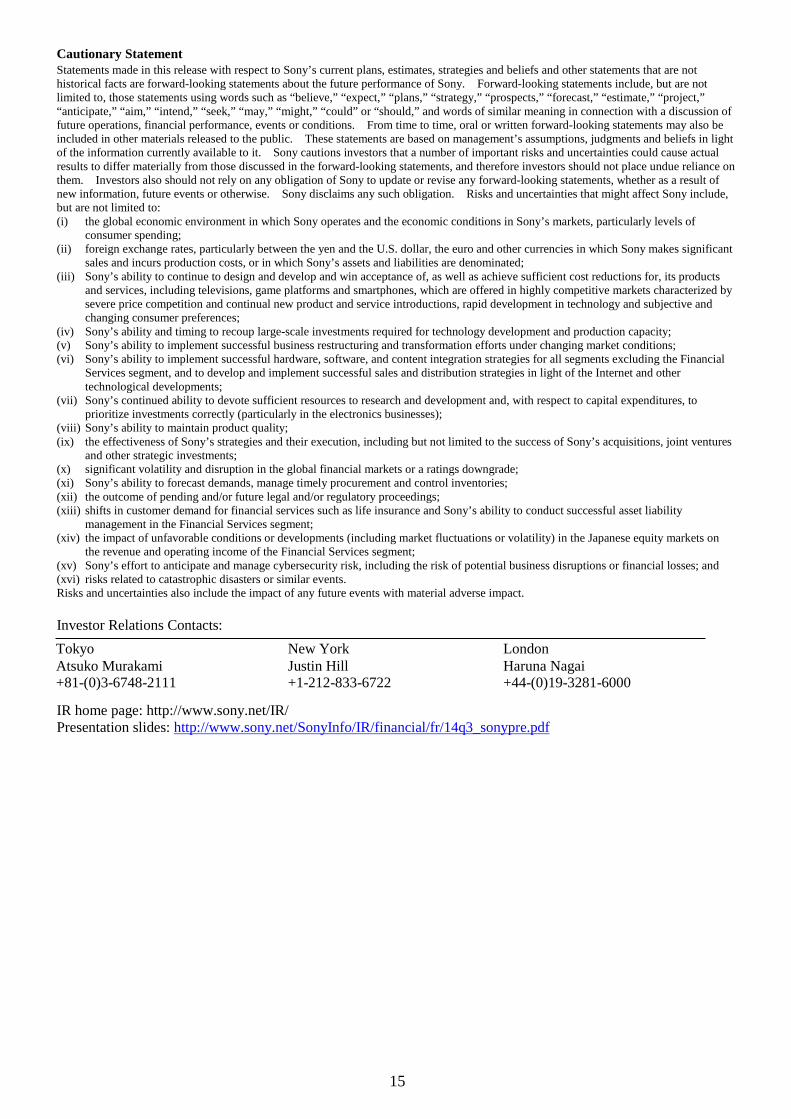
Cautionary Statement
Statements made in this release with respect to Sony’s current plans, estimates, strategies and beliefs and other statements that are not historical facts are forward-looking statements about the future performance of Sony. Forward-looking statements include, but are not limited to, those statements using words such as “believe,” “expect,” “plans,” “strategy,” “prospects,” “forecast,” “estimate,” “project,” “anticipate,” “aim,” “intend,” “seek,” “may,” “might,” “could” or “should,” and words of similar meaning in connection with a discussion of future operations, financial performance, events or conditions. From time to time, oral or written forward-looking statements may also be included in other materials released to the public. These statements are based on management’s assumptions, judgments and beliefs in light of the information currently available to it. Sony cautions investors that a number of important risks and uncertainties could cause actual results to differ materially from those discussed in the forward-looking statements, and therefore investors should not place undue reliance on them. Investors also should not rely on any obligation of Sony to update or revise any forward-looking statements, whether as a result of new information, future events or otherwise. Sony disclaims any such obligation. Risks and uncertainties that might affect Sony include, but are not limited to: (i) the global economic environment in which Sony operates and the economic conditions in Sony’s markets, particularly levels of
consumer spending; (ii) foreign exchange rates, particularly between the yen and the U.S. dollar, the euro and other currencies in which Sony makes significant
sales and incurs production costs, or in which Sony’s assets and liabilities are denominated; (iii) Sony’s ability to continue to design and develop and win acceptance of, as well as achieve sufficient cost reductions for, its products
and services, including televisions, game platforms and smartphones, which are offered in highly competitive markets characterized by severe price competition and continual new product and service introductions, rapid development in technology and subjective and changing consumer preferences;
(iv) Sony’s ability and timing to recoup large-scale investments required for technology development and production capacity; (v) Sony’s ability to implement successful business restructuring and transformation efforts under changing market conditions; (vi) Sony’s ability to implement successful hardware, software, and content integration strategies for all segments excluding the Financial
Services segment, and to develop and implement successful sales and distribution strategies in light of the Internet and other technological developments;
(vii) Sony’s continued ability to devote sufficient resources to research and development and, with respect to capital expenditures, to prioritize investments correctly (particularly in the electronics businesses);
(viii) Sony’s ability to maintain product quality; (ix) the effectiveness of Sony’s strategies and their execution, including but not limited to the success of Sony’s acquisitions, joint ventures
and other strategic investments; (x) significant volatility and disruption in the global financial markets or a ratings downgrade; (xi) Sony’s ability to forecast demands, manage timely procurement and control inventories; (xii) the outcome of pending and/or future legal and/or regulatory proceedings; (xiii) shifts in customer demand for financial services such as life insurance and Sony’s ability to conduct successful asset liability
management in the Financial Services segment; (xiv) the impact of unfavorable conditions or developments (including market fluctuations or volatility) in the Japanese equity markets on
the revenue and operating income of the Financial Services segment; (xv) Sony’s effort to anticipate and manage cybersecurity risk, including the risk of potential business disruptions or financial losses; and (xvi) risks related to catastrophic disasters or similar events. Risks and uncertainties also include the impact of any future events with material adverse impact. Investor Relations Contacts:
Tokyo New York London Atsuko Murakami Justin Hill Haruna Nagai +81-(0)3-6748-2111 +1-212-833-6722 +44-(0)19-3281-6000
IR home page: http://www.sony.net/IR/ Presentation slides: http://www.sony.net/SonyInfo/IR/financial/fr/14q3_sonypre.pdf
F-1
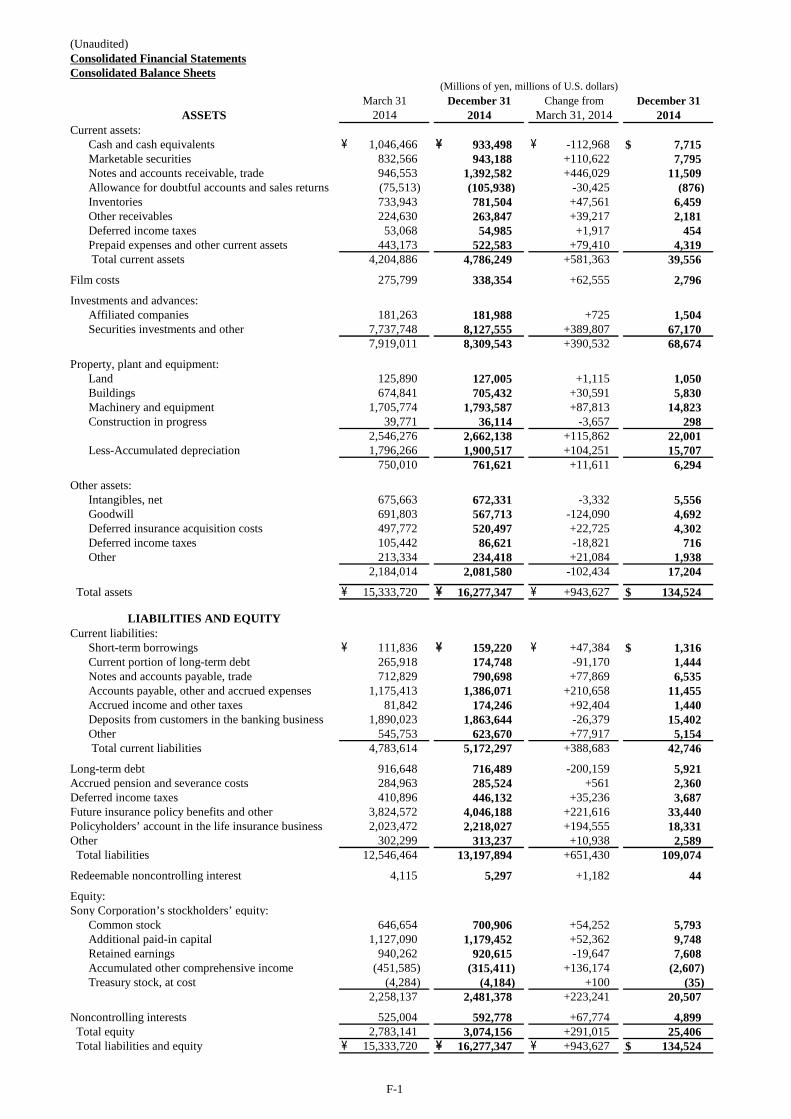
(Unaudited)Consolidated Financial StatementsConsolidated Balance Sheets
Current assets:Cash and cash equivalents \ 1,046,466 \ 933,498 \ -112,968 $ 7,715 Marketable securities 832,566 943,188 +110,622 7,795 Notes and accounts receivable, trade 946,553 1,392,582 +446,029 11,509 Allowance for doubtful accounts and sales returns (75,513) (105,938) -30,425 (876)Inventories 733,943 781,504 +47,561 6,459 Other receivables 224,630 263,847 +39,217 2,181 Deferred income taxes 53,068 54,985 +1,917 454 Prepaid expenses and other current assets 443,173 522,583 +79,410 4,319 Total current assets 4,204,886 4,786,249 +581,363 39,556
Film costs 275,799 338,354 +62,555 2,796
Investments and advances:Affiliated companies 181,263 181,988 +725 1,504 Securities investments and other 7,737,748 8,127,555 +389,807 67,170
7,919,011 8,309,543 +390,532 68,674
Property, plant and equipment:Land 125,890 127,005 +1,115 1,050 Buildings 674,841 705,432 +30,591 5,830 Machinery and equipment 1,705,774 1,793,587 +87,813 14,823 Construction in progress 39,771 36,114 -3,657 298
2,546,276 2,662,138 +115,862 22,001 Less-Accumulated depreciation 1,796,266 1,900,517 +104,251 15,707
750,010 761,621 +11,611 6,294
Other assets:Intangibles, net 675,663 672,331 -3,332 5,556 Goodwill 691,803 567,713 -124,090 4,692 Deferred insurance acquisition costs 497,772 520,497 +22,725 4,302 Deferred income taxes 105,442 86,621 -18,821 716 Other 213,334 234,418 +21,084 1,938
2,184,014 2,081,580 -102,434 17,204
Total assets \ 15,333,720 \ 16,277,347 \ +943,627 $ 134,524
Current liabilities:Short-term borrowings \ 111,836 \ 159,220 \ +47,384 $ 1,316 Current portion of long-term debt 265,918 174,748 -91,170 1,444 Notes and accounts payable, trade 712,829 790,698 +77,869 6,535 Accounts payable, other and accrued expenses 1,175,413 1,386,071 +210,658 11,455 Accrued income and other taxes 81,842 174,246 +92,404 1,440 Deposits from customers in the banking business 1,890,023 1,863,644 -26,379 15,402 Other 545,753 623,670 +77,917 5,154 Total current liabilities 4,783,614 5,172,297 +388,683 42,746
Long-term debt 916,648 716,489 -200,159 5,921 Accrued pension and severance costs 284,963 285,524 +561 2,360 Deferred income taxes 410,896 446,132 +35,236 3,687 Future insurance policy benefits and other 3,824,572 4,046,188 +221,616 33,440 Policyholders’ account in the life insurance business 2,023,472 2,218,027 +194,555 18,331 Other 302,299 313,237 +10,938 2,589 Total liabilities 12,546,464 13,197,894 +651,430 109,074
Redeemable noncontrolling interest 4,115 5,297 +1,182 44
Equity:Sony Corporation’s stockholders’ equity:
Common stock 646,654 700,906 +54,252 5,793 Additional paid-in capital 1,127,090 1,179,452 +52,362 9,748 Retained earnings 940,262 920,615 -19,647 7,608 Accumulated other comprehensive income (451,585) (315,411) +136,174 (2,607)Treasury stock, at cost (4,284) (4,184) +100 (35)
2,258,137 2,481,378 +223,241 20,507
Noncontrolling interests 525,004 592,778 +67,774 4,899 Total equity 2,783,141 3,074,156 +291,015 25,406 Total liabilities and equity \ 15,333,720 \ 16,277,347 \ +943,627 $ 134,524
(Millions of yen, millions of U.S. dollars)March 31 December 31 Change from December 31
March 31, 2014
LIABILITIES AND EQUITY
ASSETS 2014 2014 2014
F-2
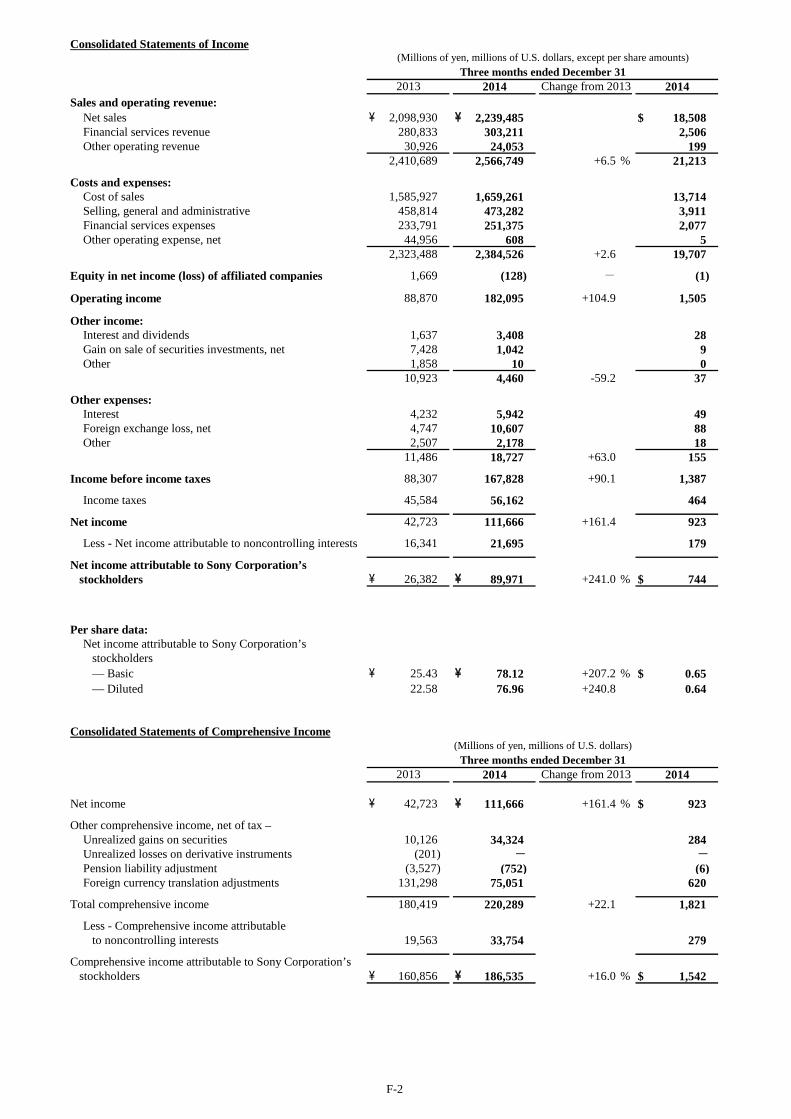
Consolidated Statements of Income
Sales and operating revenue:Net sales \ 2,098,930 \ 2,239,485 $ 18,508 Financial services revenue 280,833 303,211 2,506 Other operating revenue 30,926 24,053 199
2,410,689 2,566,749 +6.5 % 21,213
Costs and expenses:Cost of sales 1,585,927 1,659,261 13,714 Selling, general and administrative 458,814 473,282 3,911 Financial services expenses 233,791 251,375 2,077 Other operating expense, net 44,956 608 5
2,323,488 2,384,526 +2.6 19,707
Equity in net income (loss) of affiliated companies 1,669 (128) - (1)
Operating income 88,870 182,095 +104.9 1,505
Other income:Interest and dividends 1,637 3,408 28 Gain on sale of securities investments, net 7,428 1,042 9 Other 1,858 10 0
10,923 4,460 -59.2 37
Other expenses:Interest 4,232 5,942 49 Foreign exchange loss, net 4,747 10,607 88 Other 2,507 2,178 18
11,486 18,727 +63.0 155
Income before income taxes 88,307 167,828 +90.1 1,387
Income taxes 45,584 56,162 464
Net income 42,723 111,666 +161.4 923
Less - Net income attributable to noncontrolling interests 16,341 21,695 179
Net income attributable to Sony Corporation’s stockholders \ 26,382 \ 89,971 +241.0 % $ 744
Per share data:Net income attributable to Sony Corporation’s stockholders — Basic \ 25.43 \ 78.12 +207.2 % $ 0.65 — Diluted 22.58 76.96 +240.8 0.64
Net income \ 42,723 \ 111,666 +161.4 % $ 923
Other comprehensive income, net of tax –Unrealized gains on securities 10,126 34,324 284 Unrealized losses on derivative instruments (201) - -Pension liability adjustment (3,527) (752) (6)Foreign currency translation adjustments 131,298 75,051 620
Total comprehensive income 180,419 220,289 +22.1 1,821
Less - Comprehensive income attributable to noncontrolling interests 19,563 33,754 279
Comprehensive income attributable to Sony Corporation’s stockholders \ 160,856 \ 186,535 +16.0 % $ 1,542
(Millions of yen, millions of U.S. dollars, except per share amounts)Three months ended December 31
2013 2014 2014Change from 2013
Consolidated Statements of Comprehensive Income(Millions of yen, millions of U.S. dollars)
Three months ended December 312013 2014 Change from 2013 2014

F-3
Consolidated Statements of Income
Sales and operating revenue:Net sales \ 5,048,906 \ 5,385,450 $ 44,508 Financial services revenue 773,498 817,153 6,753 Other operating revenue 73,939 75,565 625
5,896,343 6,278,168 +6.5 % 51,886
Costs and expenses:Cost of sales 3,839,922 3,978,983 32,885 Selling, general and administrative 1,256,185 1,302,932 10,768 Financial services expenses 641,684 673,884 5,569 Other operating expense, net 19,475 159,750 1,320
5,757,266 6,115,549 +6.2 50,542
Equity in net income (loss) of affiliated companies (781) 3,702 - 31
Operating income 138,296 166,321 +20.3 1,375
Other income:Interest and dividends 11,081 9,160 76 Gain on sale of securities investments, net 8,044 8,628 71 Other 11,229 2,092 17
30,354 19,880 -34.5 164
Other expenses:Interest 18,280 18,401 152 Foreign exchange loss, net 4,300 15,175 125 Other 7,241 6,375 53
29,821 39,951 +34.0 330
Income before income taxes 138,829 146,250 +5.3 1,209
Income taxes 83,391 112,286 928
Net income 55,438 33,964 -38.7 281
Less - Net income attributable to noncontrolling interests 45,560 53,154 440
Net income (loss) attributable to Sony Corporation’s stockholders \ 9,878 \ (19,190) - % $ (159)
Per share data:Net income (loss) attributable to Sony Corporation’s stockholders — Basic \ 9.66 \ (17.50) - % $ (0.14) — Diluted 8.45 (17.50) - (0.14)
Net income \ 55,438 \ 33,964 -38.7 % $ 281
Other comprehensive income, net of tax –Unrealized gains on securities 12,672 49,390 408 Unrealized gains on derivative instruments 394 - -Pension liability adjustment (6,711) (2) (0)Foreign currency translation adjustments 195,093 105,768 874
Total comprehensive income 256,886 189,120 -26.4 1,563
Less - Comprehensive income attributable to noncontrolling interests 45,162 72,136 596
Comprehensive income attributable to Sony Corporation’s stockholders \ 211,724 \ 116,984 -44.7 % $ 967
(Millions of yen, millions of U.S. dollars, except per share amounts)Nine months ended December 31
2013 2014 Change from 2013 2014
Consolidated Statements of Comprehensive Income(Millions of yen, millions of U.S. dollars)
Nine months ended December 312013 2014 Change from 2013 2014

F-4
Supplemental equity and comprehensive income information
Balance at March 31, 2013 \ 2,192,262 \ 479,742 \ 2,672,004 Exercise of stock acquisition rights 100 100 Conversion of zero coupon convertible bonds 25,520 25,520 Stock based compensation 689 689
Comprehensive income:Net income 9,878 45,560 55,438 Other comprehensive income, net of tax –
Unrealized gains (losses) on securities 14,122 (1,450) 12,672 Unrealized gains on derivative instruments 394 394 Pension liability adjustment (6,723) 12 (6,711)Foreign currency translation adjustments 194,053 1,040 195,093
Total comprehensive income 211,724 45,162 256,886
Dividends declared (12,970) (11,837) (24,807)Transactions with noncontrolling interests shareholders and other 713 (781) (68)Balance at December 31, 2013 \ 2,418,038 \ 512,286 \ 2,930,324
Balance at March 31, 2014 \ 2,258,137 \ 525,004 \ 2,783,141 Exercise of stock acquisition rights 703 703 Conversion of zero coupon convertible bonds 107,660 107,660 Stock based compensation 845 845
Comprehensive income:Net income (loss) (19,190) 53,154 33,964 Other comprehensive income, net of tax –
Unrealized gains on securities 33,778 15,612 49,390 Pension liability adjustment 44 (46) (2)Foreign currency translation adjustments 102,352 3,416 105,768
Total comprehensive income 116,984 72,136 189,120
Dividends declared (13,075) (13,075)Transactions with noncontrolling interests shareholders and other (2,951) 8,713 5,762 Balance at December 31, 2014 \ 2,481,378 \ 592,778 \ 3,074,156
Balance at March 31, 2014 $ 18,663 $ 4,339 $ 23,002 Exercise of stock acquisition rights 7 7 Conversion of zero coupon convertible bonds 890 890 Stock based compensation 7 7
Comprehensive income:Net income (loss) (159) 440 281 Other comprehensive income, net of tax –
Unrealized gains on securities 279 129 408 Pension liability adjustment 0 (0) (0)Foreign currency translation adjustments 847 27 874
Total comprehensive income 967 596 1,563
Dividends declared (108) (108)Transactions with noncontrolling interests shareholders and other (27) 72 45 Balance at December 31, 2014 $ 20,507 $ 4,899 $ 25,406
(Millions of yen, millions of U.S. dollars)Sony Corporation’sstockholders’ equity
Noncontrollinginterests Total equity
Sony Corporation’sstockholders’ equity
Noncontrollinginterests Total equity
F-5
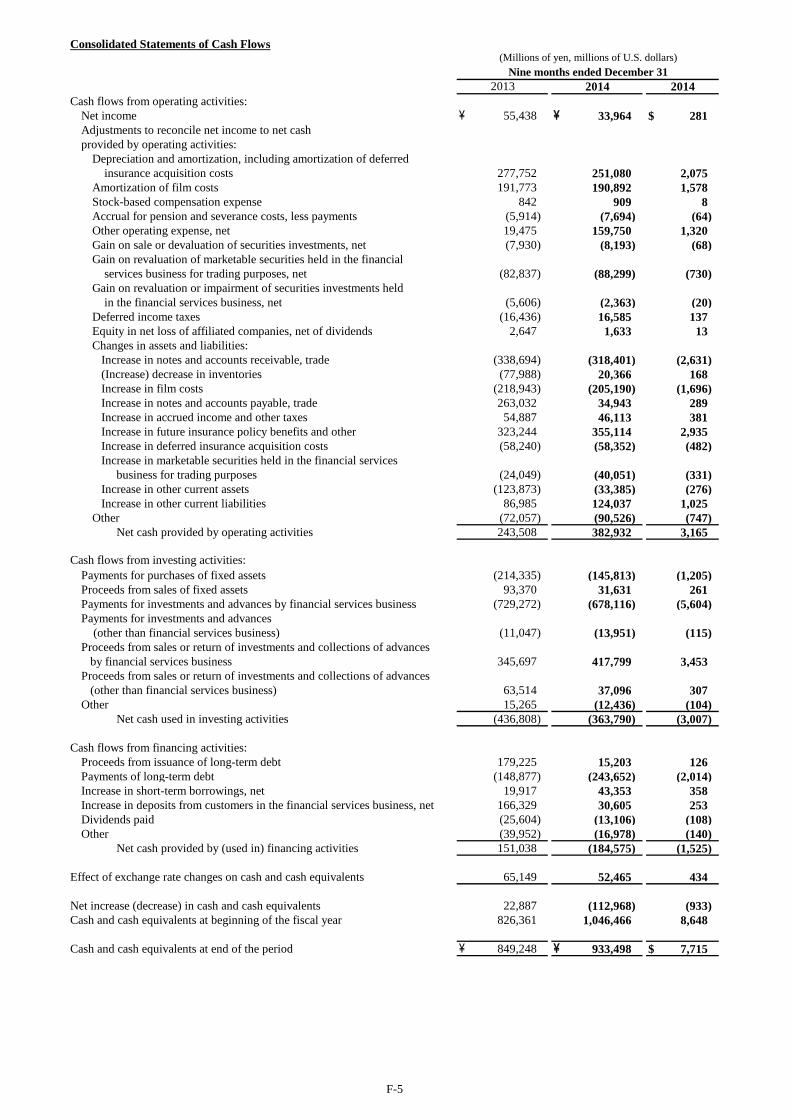
Consolidated Statements of Cash Flows
Cash flows from operating activities:Net income \ 55,438 \ 33,964 $ 281 Adjustments to reconcile net income to net cashprovided by operating activities:
Depreciation and amortization, including amortization of deferred insurance acquisition costs 277,752 251,080 2,075 Amortization of film costs 191,773 190,892 1,578 Stock-based compensation expense 842 909 8 Accrual for pension and severance costs, less payments (5,914) (7,694) (64) Other operating expense, net 19,475 159,750 1,320 Gain on sale or devaluation of securities investments, net (7,930) (8,193) (68) Gain on revaluation of marketable securities held in the financial services business for trading purposes, net (82,837) (88,299) (730) Gain on revaluation or impairment of securities investments held in the financial services business, net (5,606) (2,363) (20) Deferred income taxes (16,436) 16,585 137 Equity in net loss of affiliated companies, net of dividends 2,647 1,633 13 Changes in assets and liabilities: Increase in notes and accounts receivable, trade (338,694) (318,401) (2,631) (Increase) decrease in inventories (77,988) 20,366 168 Increase in film costs (218,943) (205,190) (1,696) Increase in notes and accounts payable, trade 263,032 34,943 289 Increase in accrued income and other taxes 54,887 46,113 381 Increase in future insurance policy benefits and other 323,244 355,114 2,935 Increase in deferred insurance acquisition costs (58,240) (58,352) (482) Increase in marketable securities held in the financial services business for trading purposes (24,049) (40,051) (331) Increase in other current assets (123,873) (33,385) (276) Increase in other current liabilities 86,985 124,037 1,025 Other (72,057) (90,526) (747) Net cash provided by operating activities 243,508 382,932 3,165
Cash flows from investing activities:Payments for purchases of fixed assets (214,335) (145,813) (1,205) Proceeds from sales of fixed assets 93,370 31,631 261 Payments for investments and advances by financial services business (729,272) (678,116) (5,604) Payments for investments and advances (other than financial services business) (11,047) (13,951) (115) Proceeds from sales or return of investments and collections of advances by financial services business 345,697 417,799 3,453 Proceeds from sales or return of investments and collections of advances (other than financial services business) 63,514 37,096 307 Other 15,265 (12,436) (104)
Net cash used in investing activities (436,808) (363,790) (3,007)
Cash flows from financing activities:Proceeds from issuance of long-term debt 179,225 15,203 126 Payments of long-term debt (148,877) (243,652) (2,014) Increase in short-term borrowings, net 19,917 43,353 358 Increase in deposits from customers in the financial services business, net 166,329 30,605 253 Dividends paid (25,604) (13,106) (108) Other (39,952) (16,978) (140)
Net cash provided by (used in) financing activities 151,038 (184,575) (1,525)
Effect of exchange rate changes on cash and cash equivalents 65,149 52,465 434
Net increase (decrease) in cash and cash equivalents 22,887 (112,968) (933) Cash and cash equivalents at beginning of the fiscal year 826,361 1,046,466 8,648
Cash and cash equivalents at end of the period \ 849,248 \ 933,498 $ 7,715
(Millions of yen, millions of U.S. dollars)
2013 2014 2014Nine months ended December 31

F-6
Business Segment Information
Sales and operating revenueMobile Communications
Customers \ 333,277 \ 428,956 +28.7 % $ 3,545 Intersegment (39) 25 0 Total 333,238 428,981 +28.7 3,545
Game & Network ServicesCustomers 417,043 499,242 +19.7 4,126 Intersegment 37,894 32,295 267 Total 454,937 531,537 +16.8 4,393
Imaging Products & SolutionsCustomers 197,196 200,429 +1.6 1,656 Intersegment 867 612 5 Total 198,063 201,041 +1.5 1,661
Home Entertainment & SoundCustomers 403,741 412,744 +2.2 3,411 Intersegment 287 562 5 Total 404,028 413,306 +2.3 3,416
DevicesCustomers 157,399 231,696 +47.2 1,915 Intersegment 53,858 61,188 506 Total 211,257 292,884 +38.6 2,421
PicturesCustomers 223,450 206,470 -7.6 1,706 Intersegment 272 110 1 Total 223,722 206,580 -7.7 1,707
MusicCustomers 141,901 160,757 +13.3 1,329 Intersegment 2,764 2,853 23 Total 144,665 163,610 +13.1 1,352
Financial ServicesCustomers 280,833 303,211 +8.0 2,506 Intersegment 1,217 1,715 14 Total 282,050 304,926 +8.1 2,520
All OtherCustomers 245,746 116,185 -52.7 960 Intersegment 24,877 28,127 233 Total 270,623 144,312 -46.7 1,193
Corporate and elimination (111,894) (120,428) - (995)Consolidated total \ 2,410,689 \ 2,566,749 +6.5 % $ 21,213
Mobile Communications \ 6,331 \ 9,253 +46.2 % $ 76 Game & Network Services 12,394 27,608 +122.8 228 Imaging Products & Solutions 12,071 22,986 +90.4 190 Home Entertainment & Sound 6,408 25,286 +294.6 209 Devices (23,515) 54,537 - 451 Pictures 24,258 6,219 -74.4 51 Music 21,717 25,411 +17.0 210 Financial Services 46,353 50,850 +9.7 420 All Other (14,818) (14,280) - (118)Total 91,199 207,870 +127.9 1,717 Corporate and elimination (2,329) (25,775) - (212)Consolidated total \ 88,870 \ 182,095 +104.9 % $ 1,505
(Millions of yen, millions of U.S. dollars)Three months ended December 31
2013 2014 Change 2014
Game & Network Services (“G&NS”) intersegment amounts primarily consist of transactions with All Other.Devices intersegment amounts primarily consist of transactions with the Mobile Communications (“MC”) segment, the G&NS segment and theImaging Products & Solutions (“IP&S”) segment.All Other intersegment amounts primarily consist of transactions with the Pictures segment, the Music segment and the G&NS segment.Corporate and elimination includes certain brand and patent royalty income.
The 2013 segment disclosure above has been reclassified to reflect the change in the business segment classification discussed in Note 5.Operating income (loss) is sales and operating revenue less costs and expenses, and includes equity in net income (loss) of affiliated companies.Corporate and elimination includes headquarters restructuring costs and certain other corporate expenses, including the amortization of certainintellectual property assets such as the cross-licensing of intangible assets acquired from Ericsson at the time of the Sony Mobile Communicationsacquisition, which are not allocated to segments.
Within the Home Entertainment & Sound (“HE&S”) segment, the operating income (loss) of Televisions, which primarily consists of LCDtelevisions, for the three months ended December 31, 2013 and 2014 was (4,992) million yen and 9,256 million yen, respectively. The operatingincome (loss) of Televisions excludes restructuring charges which are included in the overall segment results and are not allocated to productcategories.
(Millions of yen, millions of U.S. dollars)Three months ended December 31
Operating income (loss) 2013 2014 Change 2014

F-7
Business Segment Information
Sales and operating revenueMobile Communications
Customers \ 923,270 \ 1,051,605 +13.9 % $ 8,691 Intersegment 22 57 0 Total 923,292 1,051,662 +13.9 8,691
Game & Network ServicesCustomers 677,210 1,016,364 +50.1 8,400 Intersegment 78,268 82,182 679 Total 755,478 1,098,546 +45.4 9,079
Imaging Products & SolutionsCustomers 551,645 541,717 -1.8 4,477 Intersegment 2,812 2,534 21 Total 554,457 544,251 -1.8 4,498
Home Entertainment & SoundCustomers 941,238 979,356 +4.0 8,094 Intersegment 1,746 2,052 17 Total 942,984 981,408 +4.1 8,111
DevicesCustomers 447,828 557,577 +24.5 4,608 Intersegment 155,094 167,107 1,381 Total 602,922 724,684 +20.2 5,989
PicturesCustomers 559,972 583,043 +4.1 4,819 Intersegment 505 490 4 Total 560,477 583,533 +4.1 4,823
MusicCustomers 363,807 388,904 +6.9 3,214 Intersegment 7,788 8,321 69 Total 371,595 397,225 +6.9 3,283
Financial ServicesCustomers 773,498 817,153 +5.6 6,753 Intersegment 3,671 4,316 36 Total 777,169 821,469 +5.7 6,789
All OtherCustomers 616,736 308,614 -50.0 2,551 Intersegment 60,389 73,114 604 Total 677,125 381,728 -43.6 3,155
Corporate and elimination (269,156) (306,338) - (2,532)Consolidated total \ 5,896,343 \ 6,278,168 +6.5 % $ 51,886
Mobile Communications \ 27,699 \ (165,485) - % $ (1,368)Game & Network Services (8,140) 53,717 - 444 Imaging Products & Solutions 18,860 60,493 +220.7 500 Home Entertainment & Sound (2,319) 40,913 - 338 Devices (791) 96,646 - 799 Pictures 10,244 13,009 +27.0 108 Music 42,184 48,612 +15.2 402 Financial Services 129,850 142,308 +9.6 1,176 All Other (34,212) (50,875) - (421)Total 183,375 239,338 +30.5 1,978 Corporate and elimination (45,079) (73,017) - (603)Consolidated total \ 138,296 \ 166,321 +20.3 % $ 1,375
(Millions of yen, millions of U.S. dollars)Nine months ended December 31
2013 2014 Change 2014
The 2013 segment disclosure above has been reclassified to reflect the change in the business segment classification discussed in Note 5.Operating income (loss) is sales and operating revenue less costs and expenses, and includes equity in net income (loss) of affiliated companies.Corporate and elimination includes headquarters restructuring costs and certain other corporate expenses, including the amortization of certainintellectual property assets such as the cross-licensing of intangible assets acquired from Ericsson at the time of the Sony Mobile Communicationsacquisition, which are not allocated to segments.
Within the HE&S segment, the operating income (loss) of Televisions, which primarily consists of LCD televisions, for the nine months endedDecember 31, 2013 and 2014 was (9,046) million yen and 22,094 million yen, respectively. The operating income (loss) of Televisions excludesrestructuring charges which are included in the overall segment results and are not allocated to product categories.
The G&NS intersegment amounts primarily consist of transactions with All Other.Devices intersegment amounts primarily consist of transactions with the MC segment, the G&NS segment and the IP&S segment.All Other intersegment amounts primarily consist of transactions with the Pictures segment, the Music segment and the G&NS segment.Corporate and elimination includes certain brand and patent royalty income.
(Millions of yen, millions of U.S. dollars)Nine months ended December 31
Operating income (loss) 2013 2014 Change 2014
F-8
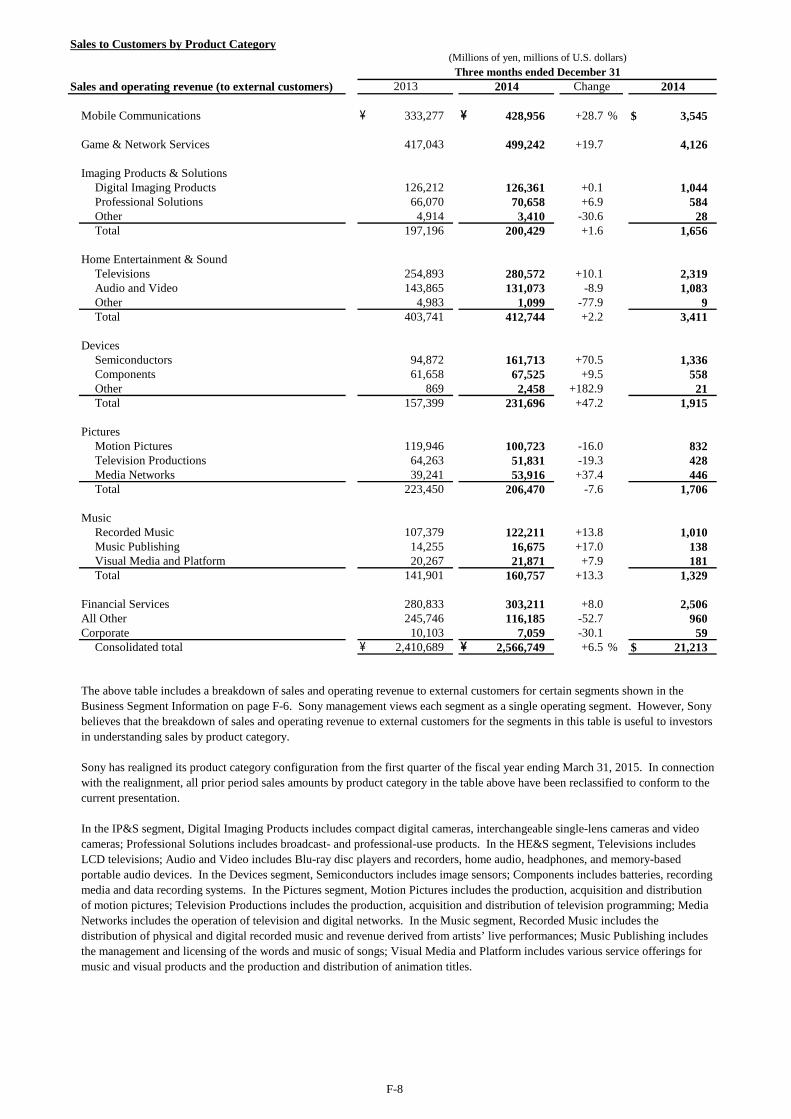
Sales to Customers by Product Category
Mobile Communications \ 333,277 \ 428,956 +28.7 % $ 3,545
Game & Network Services 417,043 499,242 +19.7 4,126
Imaging Products & SolutionsDigital Imaging Products 126,212 126,361 +0.1 1,044 Professional Solutions 66,070 70,658 +6.9 584 Other 4,914 3,410 -30.6 28 Total 197,196 200,429 +1.6 1,656
Home Entertainment & SoundTelevisions 254,893 280,572 +10.1 2,319 Audio and Video 143,865 131,073 -8.9 1,083 Other 4,983 1,099 -77.9 9 Total 403,741 412,744 +2.2 3,411
DevicesSemiconductors 94,872 161,713 +70.5 1,336 Components 61,658 67,525 +9.5 558 Other 869 2,458 +182.9 21 Total 157,399 231,696 +47.2 1,915
PicturesMotion Pictures 119,946 100,723 -16.0 832 Television Productions 64,263 51,831 -19.3 428 Media Networks 39,241 53,916 +37.4 446 Total 223,450 206,470 -7.6 1,706
MusicRecorded Music 107,379 122,211 +13.8 1,010 Music Publishing 14,255 16,675 +17.0 138 Visual Media and Platform 20,267 21,871 +7.9 181 Total 141,901 160,757 +13.3 1,329
Financial Services 280,833 303,211 +8.0 2,506 All Other 245,746 116,185 -52.7 960 Corporate 10,103 7,059 -30.1 59
Consolidated total \ 2,410,689 \ 2,566,749 +6.5 % $ 21,213
The above table includes a breakdown of sales and operating revenue to external customers for certain segments shown in theBusiness Segment Information on page F-6. Sony management views each segment as a single operating segment. However, Sonybelieves that the breakdown of sales and operating revenue to external customers for the segments in this table is useful to investorsin understanding sales by product category.
Sony has realigned its product category configuration from the first quarter of the fiscal year ending March 31, 2015. In connectionwith the realignment, all prior period sales amounts by product category in the table above have been reclassified to conform to thecurrent presentation.
In the IP&S segment, Digital Imaging Products includes compact digital cameras, interchangeable single-lens cameras and videocameras; Professional Solutions includes broadcast- and professional-use products. In the HE&S segment, Televisions includesLCD televisions; Audio and Video includes Blu-ray disc players and recorders, home audio, headphones, and memory-basedportable audio devices. In the Devices segment, Semiconductors includes image sensors; Components includes batteries, recordingmedia and data recording systems. In the Pictures segment, Motion Pictures includes the production, acquisition and distributionof motion pictures; Television Productions includes the production, acquisition and distribution of television programming; MediaNetworks includes the operation of television and digital networks. In the Music segment, Recorded Music includes thedistribution of physical and digital recorded music and revenue derived from artists’ live performances; Music Publishing includesthe management and licensing of the words and music of songs; Visual Media and Platform includes various service offerings formusic and visual products and the production and distribution of animation titles.
(Millions of yen, millions of U.S. dollars)Three months ended December 31
2013 2014 Change 2014Sales and operating revenue (to external customers)

F-9
Sales to Customers by Product Category
Mobile Communications \ 923,270 \ 1,051,605 +13.9 % $ 8,691
Game & Network Services 677,210 1,016,364 +50.1 8,400
Imaging Products & SolutionsDigital Imaging Products 346,347 342,061 -1.2 2,827 Professional Solutions 193,268 191,196 -1.1 1,580 Other 12,030 8,460 -29.7 70 Total 551,645 541,717 -1.8 4,477
Home Entertainment & SoundTelevisions 614,585 685,303 +11.5 5,664 Audio and Video 318,813 292,210 -8.3 2,415 Other 7,840 1,843 -76.5 15 Total 941,238 979,356 +4.0 8,094
DevicesSemiconductors 263,471 362,587 +37.6 2,997 Components 182,322 189,320 +3.8 1,565 Other 2,035 5,670 +178.6 46 Total 447,828 557,577 +24.5 4,608
PicturesMotion Pictures 288,736 302,688 +4.8 2,502 Television Productions 149,581 138,452 -7.4 1,144 Media Networks 121,655 141,903 +16.6 1,173 Total 559,972 583,043 +4.1 4,819
MusicRecorded Music 266,110 282,035 +6.0 2,331 Music Publishing 45,109 49,329 +9.4 408 Visual Media and Platform 52,588 57,540 +9.4 475 Total 363,807 388,904 +6.9 3,214
Financial Services 773,498 817,153 +5.6 6,753 All Other 616,736 308,614 -50.0 2,551 Corporate 41,139 33,835 -17.8 279
Consolidated total \ 5,896,343 \ 6,278,168 +6.5 % $ 51,886
The above table includes a breakdown of sales and operating revenue to external customers for certain segments shown in theBusiness Segment Information on page F-7. Sony management views each segment as a single operating segment. However, Sonybelieves that the breakdown of sales and operating revenue to external customers for the segments in this table is useful to investorsin understanding sales by product category.
Sony has realigned its product category configuration from the first quarter of the fiscal year ending March 31, 2015. In connectionwith the realignment, all prior period sales amounts by product category in the table above have been reclassified to conform to thecurrent presentation.
In the IP&S segment, Digital Imaging Products includes compact digital cameras, interchangeable single-lens cameras and videocameras; Professional Solutions includes broadcast- and professional-use products. In the HE&S segment, Televisions includesLCD televisions; Audio and Video includes Blu-ray disc players and recorders, home audio, headphones, and memory-basedportable audio devices. In the Devices segment, Semiconductors includes image sensors; Components includes batteries, recordingmedia and data recording systems. In the Pictures segment, Motion Pictures includes the production, acquisition and distributionof motion pictures; Television Productions includes the production, acquisition and distribution of television programming; MediaNetworks includes the operation of television and digital networks. In the Music segment, Recorded Music includes thedistribution of physical and digital recorded music and revenue derived from artists’ live performances; Music Publishing includesthe management and licensing of the words and music of songs; Visual Media and Platform includes various service offerings formusic and visual products and the production and distribution of animation titles.
(Millions of yen, millions of U.S. dollars)Nine months ended December 31
Sales and operating revenue (to external customers) 2013 2014 Change 2014
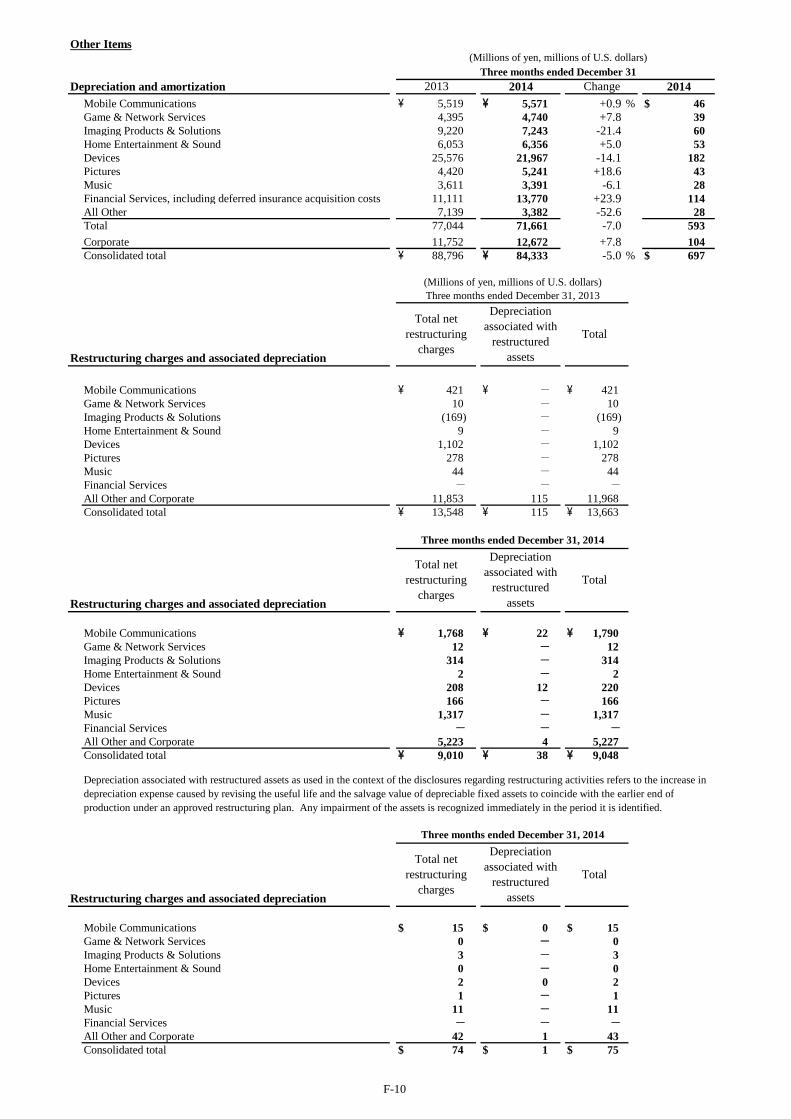
F-10
Other Items
Mobile Communications \ 5,519 \ 5,571 +0.9 % $ 46 Game & Network Services 4,395 4,740 +7.8 39 Imaging Products & Solutions 9,220 7,243 -21.4 60 Home Entertainment & Sound 6,053 6,356 +5.0 53 Devices 25,576 21,967 -14.1 182 Pictures 4,420 5,241 +18.6 43 Music 3,611 3,391 -6.1 28 Financial Services, including deferred insurance acquisition costs 11,111 13,770 +23.9 114 All Other 7,139 3,382 -52.6 28 Total 77,044 71,661 -7.0 593 Corporate 11,752 12,672 +7.8 104 Consolidated total \ 88,796 \ 84,333 -5.0 % $ 697
Mobile Communications \ 421 \ - \ 421 Game & Network Services 10 - 10 Imaging Products & Solutions (169) - (169)Home Entertainment & Sound 9 - 9 Devices 1,102 - 1,102 Pictures 278 - 278 Music 44 - 44 Financial Services - - -All Other and Corporate 11,853 115 11,968 Consolidated total \ 13,548 \ 115 \ 13,663
Mobile Communications \ 1,768 \ 22 \ 1,790 Game & Network Services 12 - 12 Imaging Products & Solutions 314 - 314 Home Entertainment & Sound 2 - 2 Devices 208 12 220 Pictures 166 - 166 Music 1,317 - 1,317 Financial Services - - -All Other and Corporate 5,223 4 5,227 Consolidated total \ 9,010 \ 38 \ 9,048
Mobile Communications $ 15 $ 0 $ 15 Game & Network Services 0 - 0 Imaging Products & Solutions 3 - 3 Home Entertainment & Sound 0 - 0 Devices 2 0 2 Pictures 1 - 1 Music 11 - 11 Financial Services - - -All Other and Corporate 42 1 43 Consolidated total $ 74 $ 1 $ 75
Three months ended December 31, 2014
Restructuring charges and associated depreciation
Total netrestructuring
charges
Depreciationassociated with
restructuredassets
Three months ended December 31, 2013
Restructuring charges and associated depreciation
Total netrestructuring
charges
Depreciationassociated with
restructuredassets
Total
Total
Restructuring charges and associated depreciation
Total netrestructuring
charges
Depreciationassociated with
restructuredassets
Total
Depreciation associated with restructured assets as used in the context of the disclosures regarding restructuring activities refers to the increase indepreciation expense caused by revising the useful life and the salvage value of depreciable fixed assets to coincide with the earlier end ofproduction under an approved restructuring plan. Any impairment of the assets is recognized immediately in the period it is identified.
Three months ended December 31, 2014
(Millions of yen, millions of U.S. dollars)
(Millions of yen, millions of U.S. dollars)Three months ended December 31
Depreciation and amortization 2013 2014 2014Change

F-11
Other Items
Mobile Communications \ 16,440 \ 16,450 +0.1 % $ 136 Game & Network Services 12,262 13,166 +7.4 109 Imaging Products & Solutions 28,542 22,503 -21.2 186 Home Entertainment & Sound 19,281 18,599 -3.5 154 Devices 77,436 64,569 -16.6 534 Pictures 13,406 14,497 +8.1 120 Music 10,802 10,158 -6.0 84 Financial Services, including deferred insurance acquisition costs 40,614 42,991 +5.9 355 All Other 21,715 10,074 -53.6 83 Total 240,498 213,007 -11.4 1,761 Corporate 37,254 38,073 +2.2 314 Consolidated total \ 277,752 \ 251,080 -9.6 % $ 2,075
Mobile Communications \ 3,567 \ - \ 3,567 Game & Network Services 392 - 392 Imaging Products & Solutions 1,991 - 1,991 Home Entertainment & Sound 941 19 960 Devices 3,531 - 3,531 Pictures 1,149 - 1,149 Music 148 - 148 Financial Services - - -All Other and Corporate 13,927 458 14,385 Consolidated total \ 25,646 \ 477 \ 26,123
Mobile Communications \ 1,825 \ 22 \ 1,847 Game & Network Services 76 - 76 Imaging Products & Solutions 513 - 513 Home Entertainment & Sound 580 - 580 Devices 3,565 16 3,581 Pictures 182 - 182 Music 1,377 - 1,377 Financial Services - - -All Other and Corporate 24,922 656 25,578 Consolidated total \ 33,040 \ 694 \ 33,734
Mobile Communications $ 15 $ 0 $ 15 Game & Network Services 1 - 1 Imaging Products & Solutions 4 - 4 Home Entertainment & Sound 5 - 5 Devices 29 1 30 Pictures 2 - 2 Music 11 - 11 Financial Services - - -All Other and Corporate 206 5 211 Consolidated total $ 273 $ 6 $ 279
(Millions of yen, millions of U.S. dollars)Nine months ended December 31
Depreciation and amortization 2013 2014 Change 2014
Depreciation associated with restructured assets as used in the context of the disclosures regarding restructuring activities refers to the increase indepreciation expense caused by revising the useful life and the salvage value of depreciable fixed assets to coincide with the earlier end ofproduction under an approved restructuring plan. Any impairment of the assets is recognized immediately in the period it is identified.
(Millions of yen, millions of U.S. dollars)Nine months ended December 31, 2013
Restructuring charges and associated depreciation
Total netrestructuring
charges
Depreciationassociated with
restructuredassets
Total
Nine months ended December 31, 2014
Restructuring charges and associated depreciation
Total netrestructuring
charges
Depreciationassociated with
restructuredassets
Total
Nine months ended December 31, 2014
Restructuring charges and associated depreciation
Total netrestructuring
charges
Depreciationassociated with
restructuredassets
Total
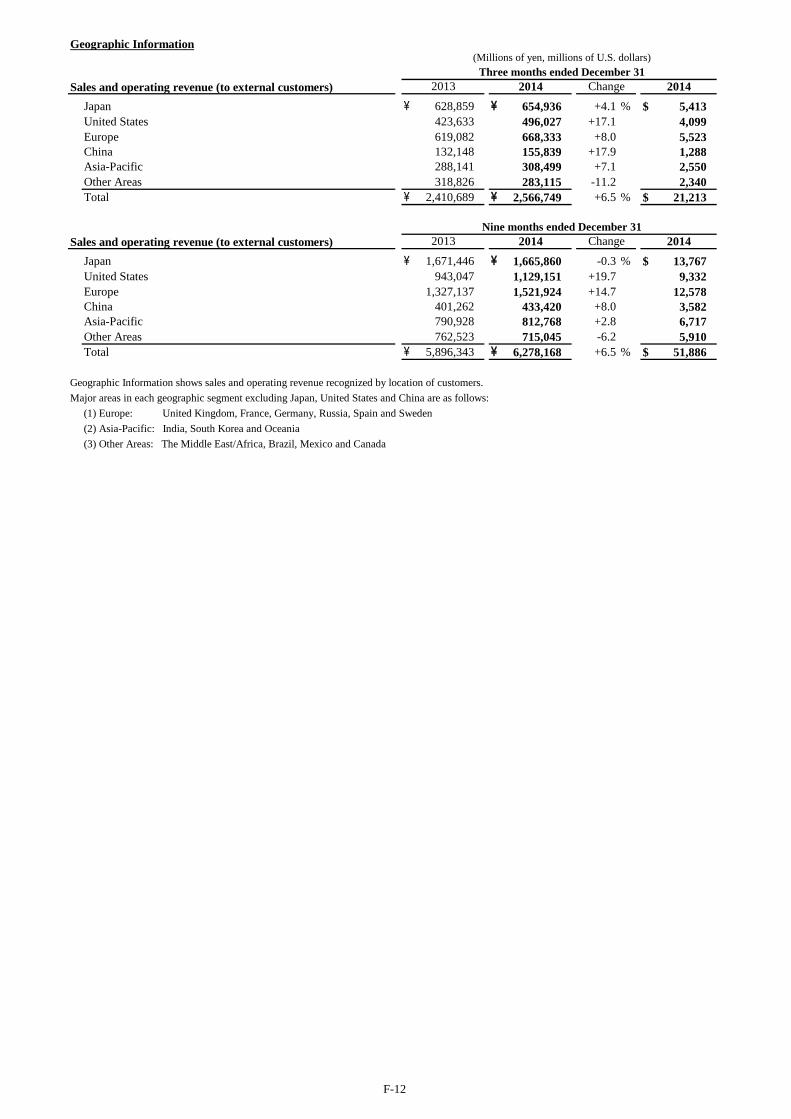
F-12
Geographic Information
Sales and operating revenue (to external customers)Japan \ 628,859 \ 654,936 +4.1 % $ 5,413 United States 423,633 496,027 +17.1 4,099 Europe 619,082 668,333 +8.0 5,523 China 132,148 155,839 +17.9 1,288 Asia-Pacific 288,141 308,499 +7.1 2,550 Other Areas 318,826 283,115 -11.2 2,340 Total \ 2,410,689 \ 2,566,749 +6.5 % $ 21,213
Sales and operating revenue (to external customers)Japan \ 1,671,446 \ 1,665,860 -0.3 % $ 13,767 United States 943,047 1,129,151 +19.7 9,332 Europe 1,327,137 1,521,924 +14.7 12,578 China 401,262 433,420 +8.0 3,582 Asia-Pacific 790,928 812,768 +2.8 6,717 Other Areas 762,523 715,045 -6.2 5,910 Total \ 5,896,343 \ 6,278,168 +6.5 % $ 51,886
Geographic Information shows sales and operating revenue recognized by location of customers.Major areas in each geographic segment excluding Japan, United States and China are as follows:
(1) Europe: United Kingdom, France, Germany, Russia, Spain and Sweden(2) Asia-Pacific: India, South Korea and Oceania(3) Other Areas: The Middle East/Africa, Brazil, Mexico and Canada
2014
Nine months ended December 312013 2014 Change 2014
(Millions of yen, millions of U.S. dollars)Three months ended December 31
2013 2014 Change
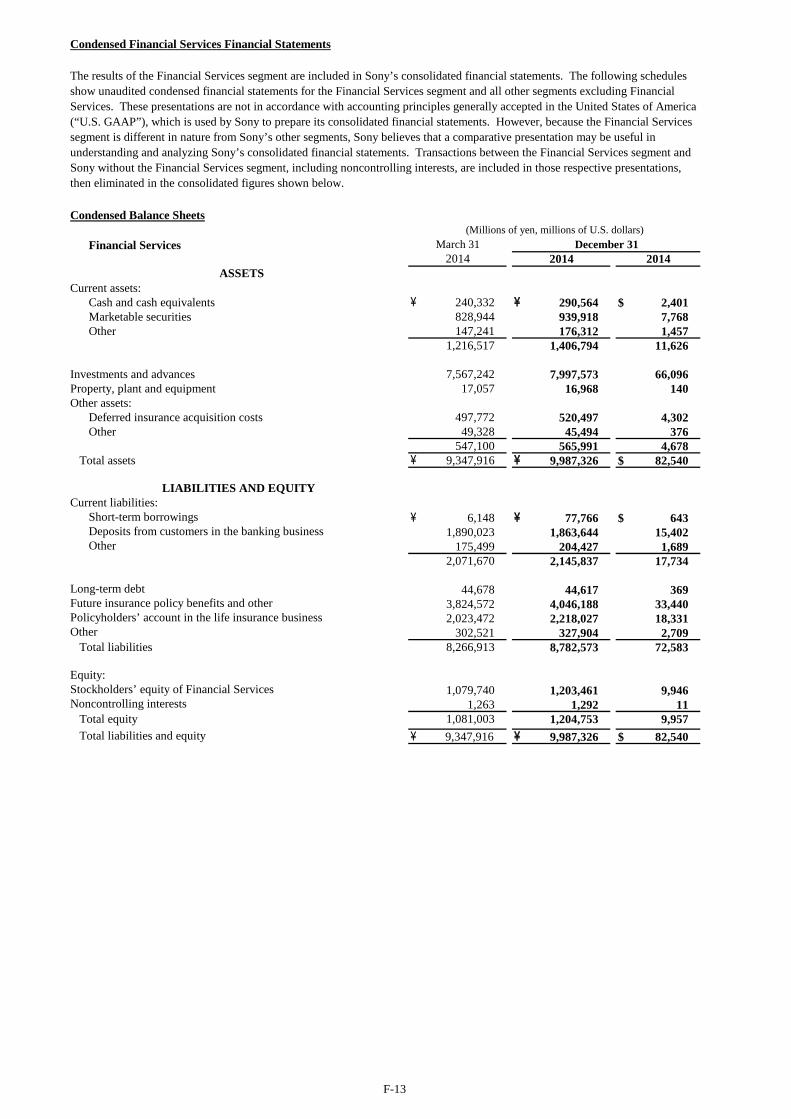
F-13
Condensed Financial Services Financial Statements
Condensed Balance Sheets
Financial Services
Current assets:Cash and cash equivalents \ 240,332 \ 290,564 $ 2,401 Marketable securities 828,944 939,918 7,768 Other 147,241 176,312 1,457
1,216,517 1,406,794 11,626
Investments and advances 7,567,242 7,997,573 66,096 Property, plant and equipment 17,057 16,968 140 Other assets:
Deferred insurance acquisition costs 497,772 520,497 4,302 Other 49,328 45,494 376
547,100 565,991 4,678 Total assets \ 9,347,916 \ 9,987,326 $ 82,540
Current liabilities:Short-term borrowings \ 6,148 \ 77,766 $ 643 Deposits from customers in the banking business 1,890,023 1,863,644 15,402 Other 175,499 204,427 1,689
2,071,670 2,145,837 17,734
Long-term debt 44,678 44,617 369 Future insurance policy benefits and other 3,824,572 4,046,188 33,440 Policyholders’ account in the life insurance business 2,023,472 2,218,027 18,331 Other 302,521 327,904 2,709
Total liabilities 8,266,913 8,782,573 72,583
Equity:Stockholders’ equity of Financial Services 1,079,740 1,203,461 9,946 Noncontrolling interests 1,263 1,292 11
Total equity 1,081,003 1,204,753 9,957 Total liabilities and equity \ 9,347,916 \ 9,987,326 $ 82,540
The results of the Financial Services segment are included in Sony’s consolidated financial statements. The following schedulesshow unaudited condensed financial statements for the Financial Services segment and all other segments excluding FinancialServices. These presentations are not in accordance with accounting principles generally accepted in the United States of America(“U.S. GAAP”), which is used by Sony to prepare its consolidated financial statements. However, because the Financial Servicessegment is different in nature from Sony’s other segments, Sony believes that a comparative presentation may be useful inunderstanding and analyzing Sony’s consolidated financial statements. Transactions between the Financial Services segment andSony without the Financial Services segment, including noncontrolling interests, are included in those respective presentations,then eliminated in the consolidated figures shown below.
(Millions of yen, millions of U.S. dollars)
ASSETS
LIABILITIES AND EQUITY
2014 2014 2014March 31 December 31

F-14
Current assets:Cash and cash equivalents \ 806,134 \ 642,934 $ 5,314 Marketable securities 3,622 3,270 27 Notes and accounts receivable, trade 864,178 1,279,815 10,577 Other 1,316,653 1,455,201 12,026
2,990,587 3,381,220 27,944 Film costs 275,799 338,354 2,796 Investments and advances 381,076 392,946 3,247 Investments in Financial Services, at cost 111,476 111,476 921 Property, plant and equipment 732,953 743,367 6,145 Other assets 1,640,385 1,519,058 12,554
Total assets \ 6,132,276 \ 6,486,421 $ 53,607
Current liabilities:Short-term borrowings \ 371,606 \ 256,202 $ 2,117 Notes and accounts payable, trade 712,829 790,698 6,535 Other 1,629,728 1,981,325 16,375
2,714,163 3,028,225 25,027 Long-term debt 875,440 675,343 5,581 Accrued pension and severance costs 262,558 261,681 2,163 Other 462,386 483,482 3,995
Total liabilities 4,314,547 4,448,731 36,766 Redeemable noncontrolling interest 4,115 5,297 44 Equity:Stockholders’ equity of Sony without Financial Services 1,722,743 1,923,266 15,895 Noncontrolling interests 90,871 109,127 902
Total equity 1,813,614 2,032,393 16,797 Total liabilities and equity \ 6,132,276 \ 6,486,421 $ 53,607
Current assets:Cash and cash equivalents \ 1,046,466 \ 933,498 $ 7,715 Marketable securities 832,566 943,188 7,795 Notes and accounts receivable, trade 871,040 1,286,644 10,633 Other 1,454,814 1,622,919 13,413
4,204,886 4,786,249 39,556 Film costs 275,799 338,354 2,796 Investments and advances 7,919,011 8,309,543 68,674 Property, plant and equipment 750,010 761,621 6,294 Other assets:
Deferred insurance acquisition costs 497,772 520,497 4,302 Other 1,686,242 1,561,083 12,902
2,184,014 2,081,580 17,204 Total assets \ 15,333,720 \ 16,277,347 $ 134,524
Current liabilities:Short-term borrowings \ 377,754 \ 333,968 $ 2,760 Notes and accounts payable, trade 712,829 790,698 6,535 Deposits from customers in the banking business 1,890,023 1,863,644 15,402 Other 1,803,008 2,183,987 18,049
4,783,614 5,172,297 42,746 Long-term debt 916,648 716,489 5,921 Accrued pension and severance costs 284,963 285,524 2,360 Future insurance policy benefits and other 3,824,572 4,046,188 33,440 Policyholders’ account in the life insurance business 2,023,472 2,218,027 18,331 Other 713,195 759,369 6,276
Total liabilities 12,546,464 13,197,894 109,074 Redeemable noncontrolling interest 4,115 5,297 44 Equity:Sony Corporation’s stockholders’ equity 2,258,137 2,481,378 20,507 Noncontrolling interests 525,004 592,778 4,899
Total equity 2,783,141 3,074,156 25,406 Total liabilities and equity \ 15,333,720 \ 16,277,347 $ 134,524
2014 2014
Sony without Financial Services
ASSETS
LIABILITIES AND EQUITY
ASSETS
LIABILITIES AND EQUITY
Consolidated2014
(Millions of yen, millions of U.S. dollars)December 31
2014 2014 2014March 31
March 31(Millions of yen, millions of U.S. dollars)
December 31
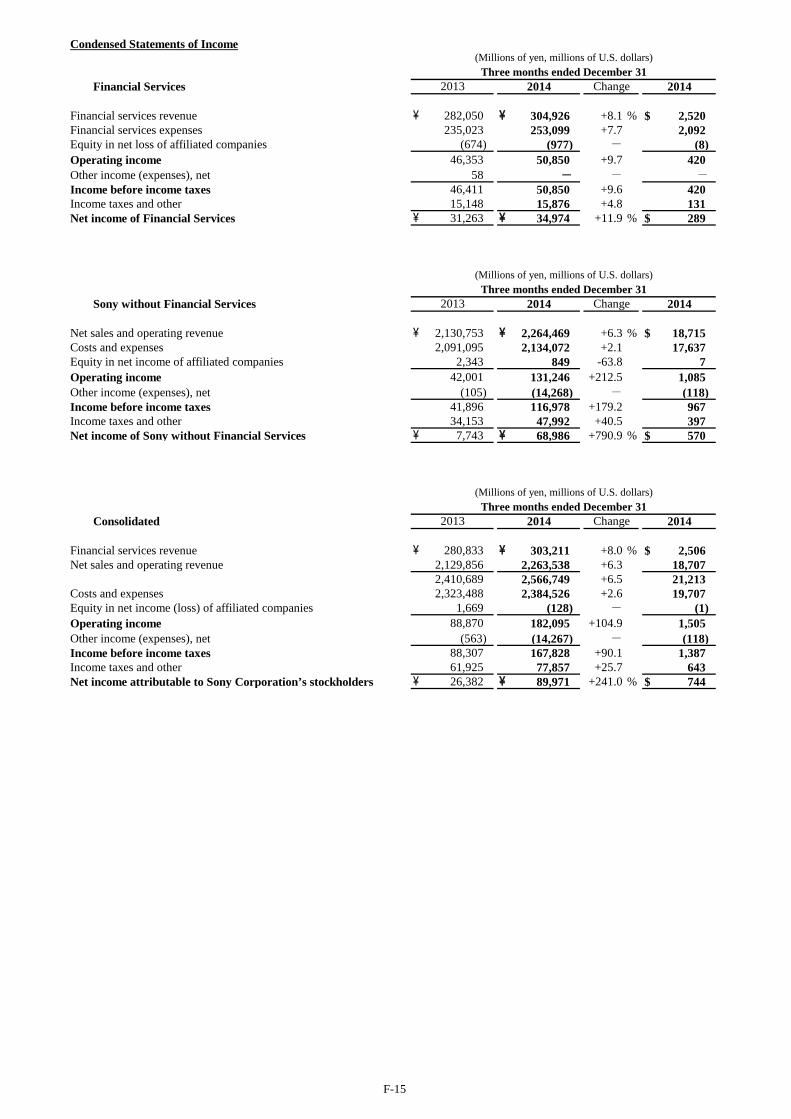
F-15
Condensed Statements of Income
Financial services revenue \ 282,050 \ 304,926 +8.1 % $ 2,520 Financial services expenses 235,023 253,099 +7.7 2,092 Equity in net loss of affiliated companies (674) (977) - (8)Operating income 46,353 50,850 +9.7 420 Other income (expenses), net 58 - - -Income before income taxes 46,411 50,850 +9.6 420 Income taxes and other 15,148 15,876 +4.8 131 Net income of Financial Services \ 31,263 \ 34,974 +11.9 % $ 289
Net sales and operating revenue \ 2,130,753 \ 2,264,469 +6.3 % $ 18,715 Costs and expenses 2,091,095 2,134,072 +2.1 17,637 Equity in net income of affiliated companies 2,343 849 -63.8 7 Operating income 42,001 131,246 +212.5 1,085 Other income (expenses), net (105) (14,268) - (118)Income before income taxes 41,896 116,978 +179.2 967 Income taxes and other 34,153 47,992 +40.5 397 Net income of Sony without Financial Services \ 7,743 \ 68,986 +790.9 % $ 570
Financial services revenue \ 280,833 \ 303,211 +8.0 % $ 2,506 Net sales and operating revenue 2,129,856 2,263,538 +6.3 18,707
2,410,689 2,566,749 +6.5 21,213 Costs and expenses 2,323,488 2,384,526 +2.6 19,707 Equity in net income (loss) of affiliated companies 1,669 (128) - (1)Operating income 88,870 182,095 +104.9 1,505 Other income (expenses), net (563) (14,267) - (118)Income before income taxes 88,307 167,828 +90.1 1,387 Income taxes and other 61,925 77,857 +25.7 643 Net income attributable to Sony Corporation’s stockholders \ 26,382 \ 89,971 +241.0 % $ 744
Sony without Financial Services 2013 2014
Financial Services 2013 2014
Consolidated 2013 2014 Change 2014
(Millions of yen, millions of U.S. dollars)Three months ended December 31
2014
(Millions of yen, millions of U.S. dollars)Three months ended December 31
(Millions of yen, millions of U.S. dollars)Three months ended December 31
Change 2014
Change

F-16
Condensed Statements of Income
Financial services revenue \ 777,169 \ 821,469 +5.7 % $ 6,789 Financial services expenses 645,395 678,240 +5.1 5,605 Equity in net loss of affiliated companies (1,924) (921) - (8)Operating income 129,850 142,308 +9.6 1,176 Other income (expenses), net 177 - - -Income before income taxes 130,027 142,308 +9.4 1,176 Income taxes and other 42,416 44,513 +4.9 368 Net income of Financial Services \ 87,611 \ 97,795 +11.6 % $ 808
Net sales and operating revenue \ 5,124,921 \ 5,463,978 +6.6 % $ 45,157 Costs and expenses 5,119,133 5,393,075 +5.4 44,571 Equity in net income of affiliated companies 1,143 4,623 +304.5 39 Operating income 6,931 75,526 +989.7 625 Other income (expenses), net 8,395 (12,241) - (101)Income before income taxes 15,326 63,285 +312.9 524 Income taxes and other 51,282 81,809 +59.5 677 Net loss of Sony without Financial Services \ (35,956) \ (18,524) - % $ (153)
Financial services revenue \ 773,498 \ 817,153 +5.6 % $ 6,753 Net sales and operating revenue 5,122,845 5,461,015 +6.6 45,133
5,896,343 6,278,168 +6.5 51,886 Costs and expenses 5,757,266 6,115,549 +6.2 50,542 Equity in net income (loss) of affiliated companies (781) 3,702 - 31 Operating income 138,296 166,321 +20.3 1,375 Other income (expenses), net 533 (20,071) - (166)Income before income taxes 138,829 146,250 +5.3 1,209 Income taxes and other 128,951 165,440 +28.3 1,368 Net income (loss) attributable to Sony Corporation’s stockholders \ 9,878 \ (19,190) - % $ (159)
(Millions of yen, millions of U.S. dollars)Nine months ended December 31
Financial Services 2013 2014 Change 2014
(Millions of yen, millions of U.S. dollars)Nine months ended December 31
Sony without Financial Services 2013 2014 Change 2014
(Millions of yen, millions of U.S. dollars)Nine months ended December 31
Consolidated 2013 2014 Change 2014
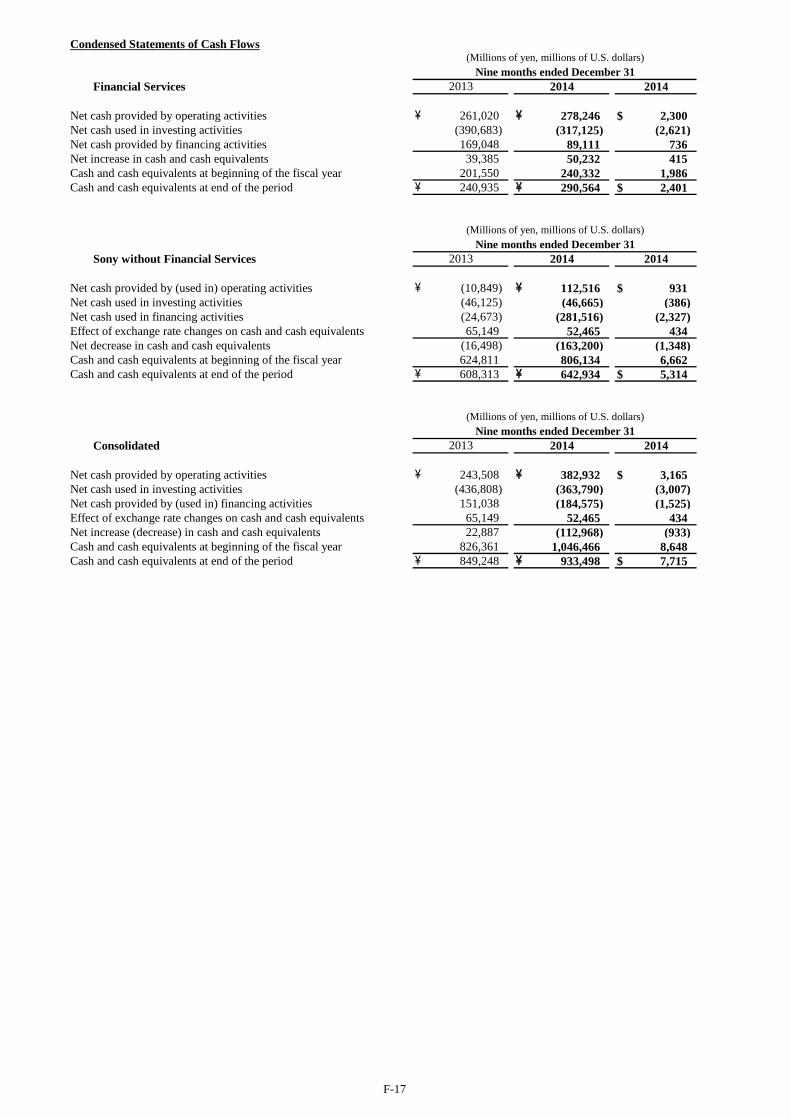
F-17
Condensed Statements of Cash Flows
Net cash provided by operating activities \ 261,020 \ 278,246 $ 2,300 Net cash used in investing activities (390,683) (317,125) (2,621)Net cash provided by financing activities 169,048 89,111 736 Net increase in cash and cash equivalents 39,385 50,232 415 Cash and cash equivalents at beginning of the fiscal year 201,550 240,332 1,986 Cash and cash equivalents at end of the period \ 240,935 \ 290,564 $ 2,401
Net cash provided by (used in) operating activities \ (10,849) \ 112,516 $ 931 Net cash used in investing activities (46,125) (46,665) (386)Net cash used in financing activities (24,673) (281,516) (2,327)Effect of exchange rate changes on cash and cash equivalents 65,149 52,465 434 Net decrease in cash and cash equivalents (16,498) (163,200) (1,348)Cash and cash equivalents at beginning of the fiscal year 624,811 806,134 6,662 Cash and cash equivalents at end of the period \ 608,313 \ 642,934 $ 5,314
Net cash provided by operating activities \ 243,508 \ 382,932 $ 3,165 Net cash used in investing activities (436,808) (363,790) (3,007)Net cash provided by (used in) financing activities 151,038 (184,575) (1,525)Effect of exchange rate changes on cash and cash equivalents 65,149 52,465 434 Net increase (decrease) in cash and cash equivalents 22,887 (112,968) (933)Cash and cash equivalents at beginning of the fiscal year 826,361 1,046,466 8,648 Cash and cash equivalents at end of the period \ 849,248 \ 933,498 $ 7,715
Financial Services
Nine months ended December 31(Millions of yen, millions of U.S. dollars)
2013
Sony without Financial Services
Consolidated
2014
2013 2014 2014
(Millions of yen, millions of U.S. dollars)
Nine months ended December 31
Nine months ended December 3120142013
(Millions of yen, millions of U.S. dollars)
2014 2014
(Notes) 1. U.S. dollar amounts have been translated from yen, for convenience only, at the rate of ¥121 = U.S. $1, the approximate Tokyo
foreign exchange market rate as of December 31, 2014. 2. As of December 31, 2014, Sony had 1,247 consolidated subsidiaries (including variable interest entities) and 100 affiliated
companies accounted for under the equity method.
3. The weighted-average number of outstanding shares used for the computation of earnings per share of common stock are as follows:
Weighted-average number of outstanding shares (Thousands of shares) Three months ended December 31 Net income attributable to Sony Corporation’s stockholders 2013 2014
— Basic 1,037,640 1,151,770 — Diluted 1,168,523 1,168,990
Weighted-average number of outstanding shares (Thousands of shares) Nine months ended December 31 Net income (loss) attributable to Sony Corporation’s stockholders 2013 2014
— Basic 1,022,810 1,096,392 — Diluted 1,168,549 1,096,392
All potential shares were excluded as anti-dilutive for the nine months ended December 31, 2014 due to Sony incurring a net loss attributable to Sony Corporation’s stockholders for this period. The dilutive effect in the weighted-average number of outstanding shares for the three and nine months ended December 31, 2013 and three months ended December 31, 2014 substantially resulted from the zero coupon convertible bonds which were issued in November 2012.
4. Recently adopted accounting pronouncements: Obligations resulting from joint and several liability arrangements for which the total amount of the obligation is fixed at the reporting date In February 2013, the Financial Accounting Standards Board (“FASB”) issued new accounting guidance for obligations resulting from joint and several liability arrangements for which the total amount of the obligation is fixed at the reporting date. The guidance requires an entity to measure obligations resulting from joint and several liability arrangements for which the total amount of the obligation within the scope of this guidance is fixed at the reporting date, as the sum of the amount the reporting entity agreed to pay on the basis of its arrangement among its co-obligors, plus any additional amount the reporting entity expects to pay on behalf of its co-obligors. This guidance was effective for Sony as of April 1, 2014. The adoption of this guidance did not have a material impact on Sony’s results of operations and financial position. Parent’s accounting for the cumulative translation adjustment upon derecognition of certain subsidiaries or groups of assets within a foreign entity or of an investment in a foreign entity In March 2013, the FASB issued new accounting guidance for the parent’s accounting for the cumulative translation adjustment upon derecognition of certain subsidiaries or groups of assets within a foreign entity or of an investment in a foreign entity. The guidance resolved diversity in practice and clarifies the applicable guidance for the release of the cumulative translation adjustment when the parent sells a part or all of its investment in a foreign entity, ceases to have a controlling financial interest in a subsidiary or group of assets that is a business within a foreign entity, or obtains control in a business combination achieved in stages involving an equity method investment that is a foreign entity. After adoption of this guidance, any accumulated translation adjustments associated with a previously held equity interest, are included in earnings in a business combination achieved in stages. This guidance was effective for Sony as of April 1, 2014. The adoption of this guidance did not have a material impact on Sony’s results of operations and financial position.
F-18
Presentation of an unrecognized tax benefit when a net operating loss carryforward, a similar tax loss, or a tax credit carryforward exists In July 2013, the FASB issued new accounting guidance for the presentation of an unrecognized tax benefit when a net operating loss carryforward, a similar tax loss, or a tax credit carryforward exists. The guidance requires an unrecognized tax benefit to be presented as a reduction to a deferred tax asset for a net operating loss, a similar tax loss, or a tax credit carryforward if certain criteria are met. This guidance was effective for Sony as of April 1, 2014. The adoption of this guidance did not have a material impact on Sony’s results of operations and financial position.
5. Sony realigned its business segments for the first quarter of the fiscal year ending March 31, 2015 to reflect modifications to its organizational structure as of April 1, 2014, primarily repositioning the operations of the previously reported Game and Mobile Products & Communications (“MP&C”) segments. In connection with this realignment, the previously-reported operations of the network business which were included in All Other are now integrated with the previously-reported Game segment and are reported as the G&NS segment. The previously reported Mobile Communications category which was included in the MP&C segment has been reclassified as the newly established MC segment, while the other categories in the previously reported MP&C segment are now included in All Other. This includes the reclassification of the PC business into All Other. As of the first quarter of the fiscal year ending March 31, 2015, the power supply business, which was previously included in the Devices segment, has been integrated into All Other to reflect modifications Sony made to its organizational structure as of June 1, 2014. For further details of new segments and categories, see page F-8 and F-9. In connection with this realignment, the sales and operating revenue and operating income (loss) of each segment for the comparable period have been reclassified to conform to the current quarter’s presentation.
6. Sony estimates the annual effective tax rate ("ETR") derived from a projected annual net income before taxes and calculates the interim period income tax provision based on the year-to-date income tax provision computed by applying the ETR to the year-to-date net income before taxes at the end of each interim period. The income tax provision based on the ETR reflects anticipated income tax credits and net operating loss carryforwards; however, it excludes the income tax provision related to significant unusual or extraordinary transactions. Such income tax provision is separately reported from the provision based on the ETR in the interim period in which they occur.
7. Certain reclassifications of the financial statements and accompanying footnotes for the three and nine months ended December 31, 2013 have been made to conform to the presentation for the three and nine months ended December 31, 2014. Reclassifications include changes in the presentation and disclosure related to internal-use software, effective on March 31, 2014. Due to the changes, the amortization of internal-use software was reclassified from other to depreciation and amortization, including amortization of deferred insurance acquisition costs in the cash flows from operating activities section of the consolidated statements of cash flows. Depreciation and amortization in the business segment information were also reclassified, accordingly.
8. During the fourth quarter of the fiscal year ended March 31, 2014, Sony revised its financial statements related to the recognition of revenue for certain of its universal life insurance contracts as disclosed in the previous fiscal year. Accordingly, certain financial information for the comparable period has been revised. The principal amounts that have been revised are indicated below.
(Millions of yen)
Three months ended December 31, 2013
As previously reported
As adjusted
Consolidated Statements of Income Financial services revenue
¥ 282,963
¥ 280,833
Financial services expenses
234,459
233,791 Net income 43,719 42,723 Consolidated Statements of Comprehensive Income Unrealized gains on securities 9,987 10,126 Comprehensive income attributable to Sony Corporation’s stockholders 161,370 160,856
F-19

(Millions of yen)
Nine months ended December 31, 2013
As previously reported
As adjusted
Consolidated Statements of Income Financial services revenue
¥ 778,172
¥ 773,498
Financial services expenses
643,201
641,684 Net income 57,595 55,438 Consolidated Statements of Comprehensive Income Unrealized gains on securities 12,863 12,672 Comprehensive income attributable to Sony Corporation’s stockholders 213,132 211,724 Consolidated Statements of Cash Flows Increase in future insurance policy benefits and other 323,906 323,244 Increase in deposits from customers in the financial services business, net 161,656 166,329
9. For the nine months ended December 31, 2014, Sony recorded an out-of-period adjustment to correct an error in the amounts of
revenue and certain capitalizable assets being recorded at a subsidiary. The error began in 2012 and continued until it was identified by Sony during the nine months ended December 31, 2014. The adjustment, which related entirely to All Other, impacted net sales, cost of sales, and selling, general and administrative expenses, and, in the aggregate, decreased income before income taxes in the consolidated statements of income by 5,104 million yen for the nine months ended December 31, 2014. Sony determined that the adjustment was not material to the consolidated financial statements for the three and nine months ended December 31, 2014 or any prior annual or interim periods.
Other Consolidated Financial Data
(Millions of yen, millions of U.S. dollars) Three months ended December 31 2013 2014 2014
Capital expenditures* ¥ 62,020 ¥ 56,937 $ 471 (Additions to property, plant and equipment) (34,648) (36,622) (303) (Additions to intangible assets) (27,372) (20,315) (168) Depreciation and amortization expenses** 88,796 84,333 697 (Depreciation expenses for property, plant and equipment) (45,715) (40,344) (333) (Amortization expenses for intangible assets) (43,081) (43,989) (364) Research and development expenses 115,970 118,295 978
(Millions of yen, millions of U.S. dollars) Nine months ended December 31 2013 2014 2014
Capital expenditures* ¥ 190,846 ¥ 169,558 $ 1,401 (Additions to property, plant and equipment) (124,143) (112,948) (933) (Additions to intangible assets) (66,703) (56,610) (468) Depreciation and amortization expenses** 277,752 251,080 2,075 (Depreciation expenses for property, plant and equipment) (143,414) (118,329) (978) (Amortization expenses for intangible assets) (134,338) (132,751) (1,097) Research and development expenses 344,581 340,301 2,812
* Excluding additions for tangible and intangible assets from business combinations. ** Including amortization expenses for intangible assets and for deferred insurance acquisition costs.
F-20
(Subsequent events) Sony Music Entertainment, a wholly owned subsidiary of Sony (“SME”), has entered into an agreement to increase its shareholding in an equity method investment, Orchard Media, Inc. (“The Orchard”), to 100% by acquiring shares from the current holder, Orchard Asset Holdings, LLC, for approximately 200 million U.S. dollars. Sony expects to record a non-cash gain related to the acquisition in connection with obtaining control of The Orchard, primarily due to the appreciation in value of SME’s current equity interest in The Orchard that SME owned prior to the acquisition. The amount of expected gain is under evaluation and subject to transaction costs and other adjustments. Sony expects this acquisition to close after March 31, 2015 subject to necessary regulatory approvals.
F-21