Atlanta Police Foundation Atlanta Crime Report 2013

Welcome message from author
This document is posted to help you gain knowledge. Please leave a comment to let me know what you think about it! Share it to your friends and learn new things together.
Transcript

Atlanta Police Foundation
Atlanta Crime Report2013
2013AtlantaCrimeReport
Crimestatisticsprovideahelpfulreflectionofthestateofpublicsafety.Whenusedcorrectly,thesestatisticscanhelpuspredicttrends,identifyissuesandpromotethewellbeingofourcommunity.Researchers,policymakers,mediaandpoliticiansusethesenumberstomakestatementsabouttheperceivedsafetyofcitizensandthejobelectedofficialsandlawenforcementaredoingtomakecommunitiessafer.
ThisreportincludescrimestatisticsfortheCityofAtlanta,compiledfromUCRdatasince2002.Thereportprovidescitizensandotherstakeholderswithanaccuratepictureofcrimetrendsinthecity.
CrimeStatisticsOverview In2013,therewere33,045majorcrimescommittedintheCityofAtlanta.Thefigure
representsadecreaseof3.6percentfromcalendaryear2012. Thelong‐termtrendindicatesadecreaseincrimeofmorethan33percentsince2002. TheUCRindicates5,517violentcrimesoccurredintheCityofAtlanta,adecreaseoffour
percentfrom2012. Whenconsidering5‐and10‐yeartrends,the2013violentcrimetotalwas25percentbelow
the2008leveland35percentbelowthe2003level. Therewereanestimated12violentcrimesper100,000inhabitantsin2013.Therate
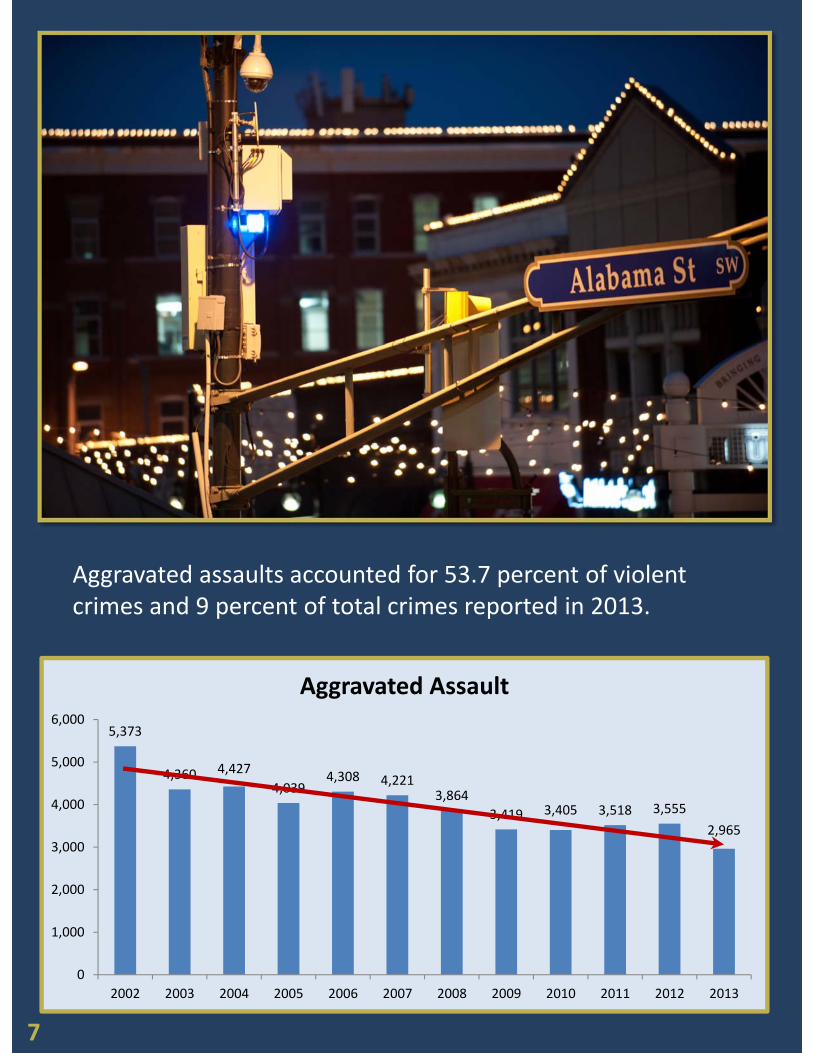
indicatesareductioninviolentcrimecomparedtotheestimatedratefor2012. Aggravatedassaultsaccountedfor53.7percentofviolentcrimesand9percentoftotal
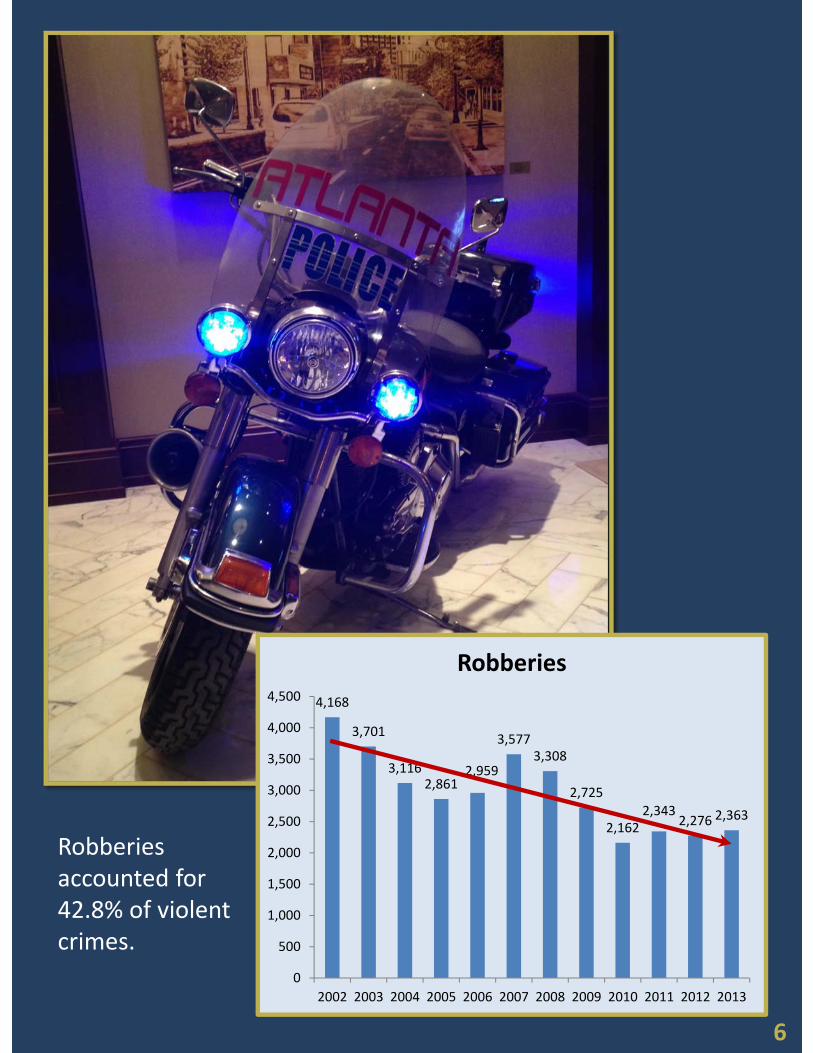
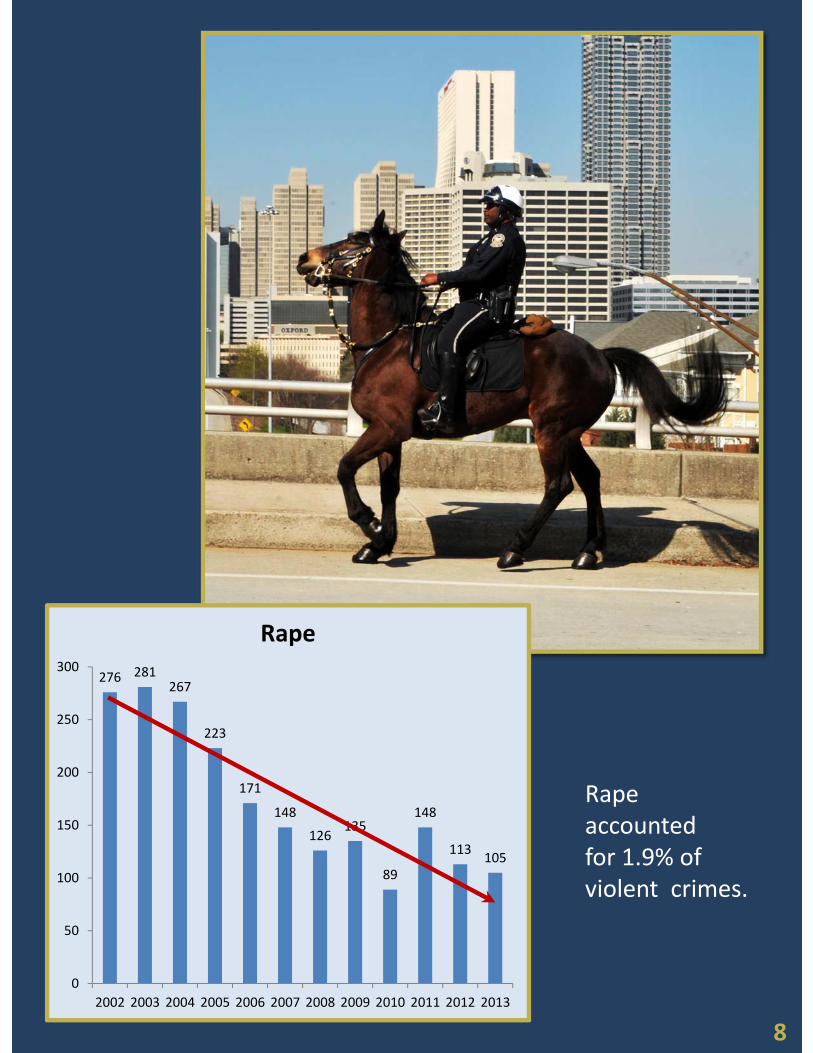
crimesreportedin2013. Robberyoffensesaccountedfor42.8percentofviolentcrimeoffenses;rapeaccountedfor
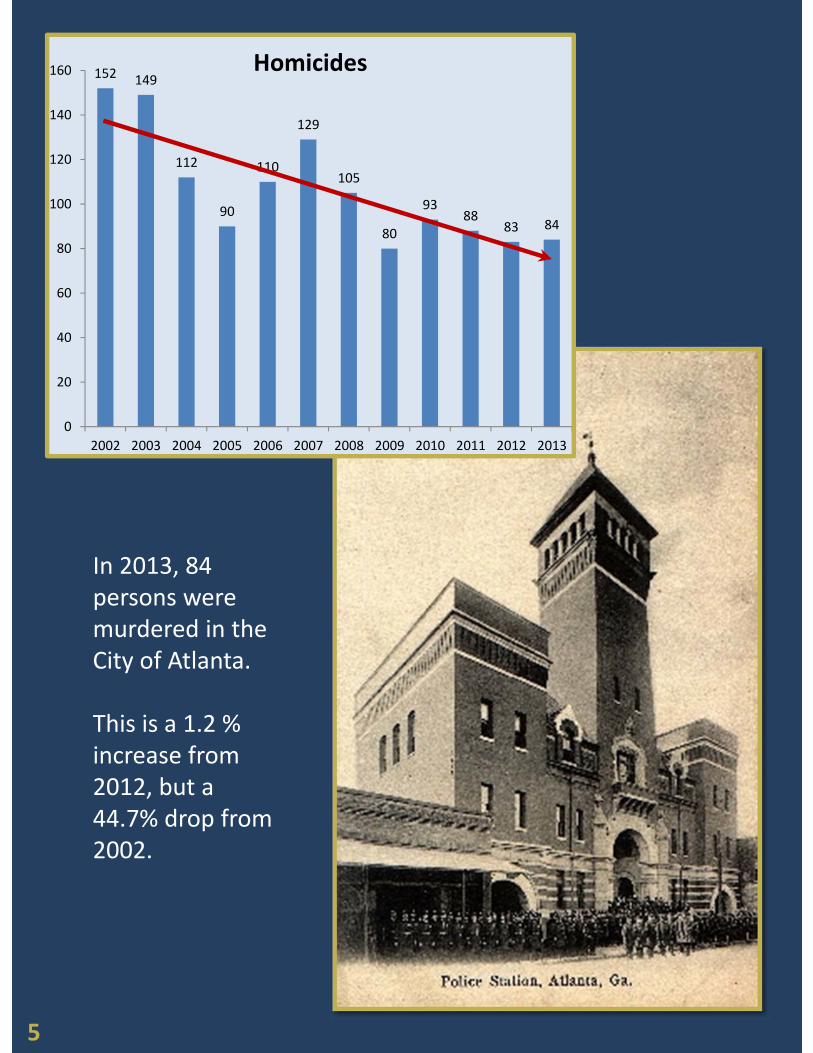
1.9percent;andmurderaccountedfor1.5percent. In2013,84personsweremurderedintheCityofAtlanta.Thisisa1.2percentincreasefrom
2012,buta44.7percentdropfrom2002numbersof152murders. Therewere27,528propertycrimeoffensesintheCityofAtlantain2013. The2‐yeartrendshowedthatpropertycrimedeclined3.6percentin2013whencompared
to2012.Thelong‐termtrendshowedthatpropertycrimeoffensesdeclined30.28percentin2013whencomparedto2002.
Therateofpropertycrimewasat62per100,000inhabitants,a3.6percentdecreasewhencomparedto2012.
TotalCrimedropped30percentinAtlantafrom2002‐2012comparedtoonly14percentnationally.
AbouttheUniformCrimeReportTheUniformCrimeReportingprogramwasestablishedin1929bytheInternationalAssociationofChiefsofPolicetocreatereliableanduniformcrimestatisticsforthenation.TheFBIistaskedwithcollecting,publishing,andarchivingstatisticsfromlawenforcementagenciesacrossthenation.TheFBIwarnsagainstrankingandcomparingcitiesusingcrimestatisticsgiventhateverycityfacesuniquefactorsandchallengesthatmaycontributetoitscrime,e.g.,population,socioeconomicmakeup,demographics,commuterpopulation,etc.Makingquickcomparisonsofcrimestatisticscancreatemisleadingperceptionsofcrimeandsafetyinagivenarea.
Foundation Atlanta Police
1
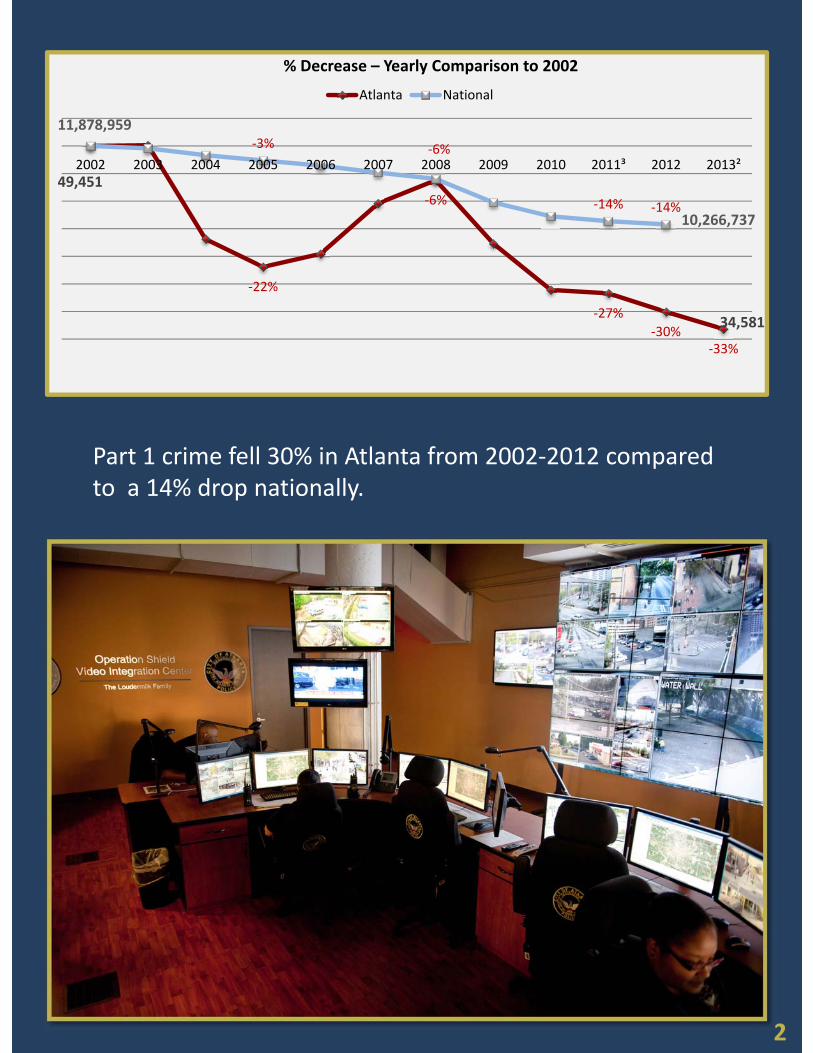
Part 1 crime fell 30% in Atlanta from 2002‐2012 compared to a 14% drop nationally.
‐22%
‐6%
‐27%
‐30%‐33%
‐3% ‐6%
‐14% ‐14%
2002 2003 2004 2005 2006 2007 2008 2009 2010 2011³ 2012 2013²
% Decrease – Yearly Comparison to 2002
Atlanta National
11,878,959
49,451
34,581
10,266,737
2
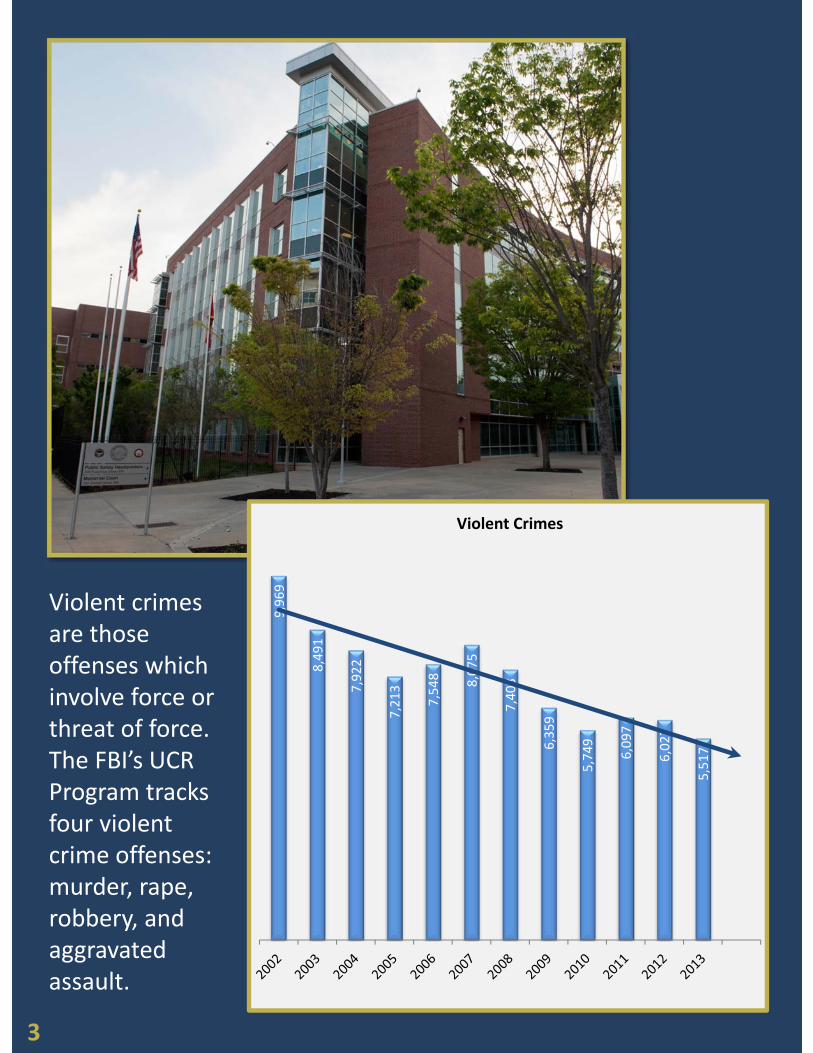
Violent crimes are those offenses which involve force or threat of force.The FBI’s UCR Program tracks four violent crime offenses: murder, rape, robbery, and aggravated assault.
3
9,969
8,491
7,922
7,213
7,548
8,075
7,403
6,359
5,749
6,097
6,027
5,517
Violent Crimes
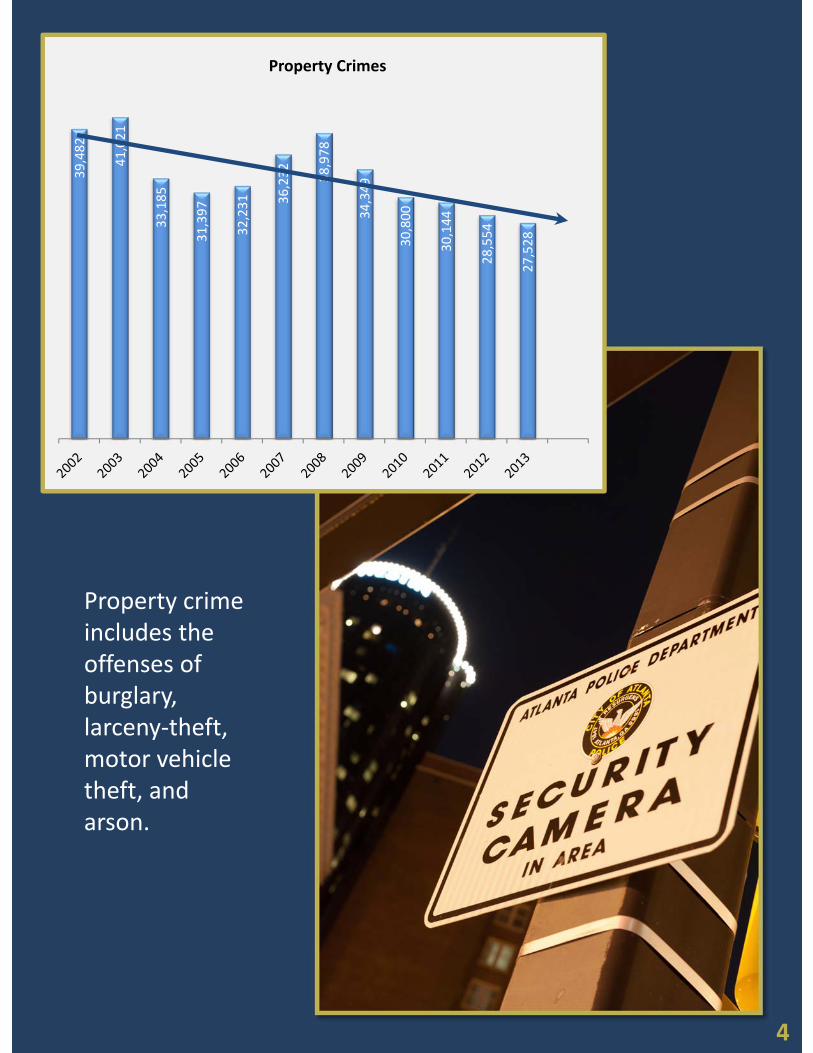
Property crime includes the offenses of burglary, larceny‐theft, motor vehicle theft, and arson.
4
39,482
41,021
33,185
31,397
32,231
36,232
38,978
34,349
30,800
30,144
28,554
27,528
Property Crimes
152 149
112
90
110
129
105
80
9388
83 84
0
20
40
60
80
100
120
140
160
2002 2003 2004 2005 2006 2007 2008 2009 2010 2011 2012 2013
Homicides
In 2013, 84 persons were murdered in the City of Atlanta.
This is a 1.2 % increase from 2012, but a 44.7% drop from 2002.
5
4,168
3,701
3,1162,861
2,959
3,5773,308
2,725
2,1622,343
2,276 2,363
0
500
1,000
1,500
2,000
2,500
3,000
3,500
4,000
4,500
2002 2003 2004 2005 2006 2007 2008 2009 2010 2011 2012 2013
Robberies
Robberies accounted for 42.8% of violent crimes.
6
5,373
4,360 4,427
4,0394,308 4,221
3,864
3,419 3,405 3,518 3,555
2,965
0
1,000
2,000
3,000
4,000
5,000
6,000
2002 2003 2004 2005 2006 2007 2008 2009 2010 2011 2012 2013
Aggravated Assault
Aggravated assaults accounted for 53.7 percent of violent crimes and 9 percent of total crimes reported in 2013.
7
276 281267
223
171
148
126135
89
148
113105
0
50
100
150
200
250
300
2002 2003 2004 2005 2006 2007 2008 2009 2010 2011 2012 2013
Rape
Rape accounted for 1.9% of violent crimes.
8
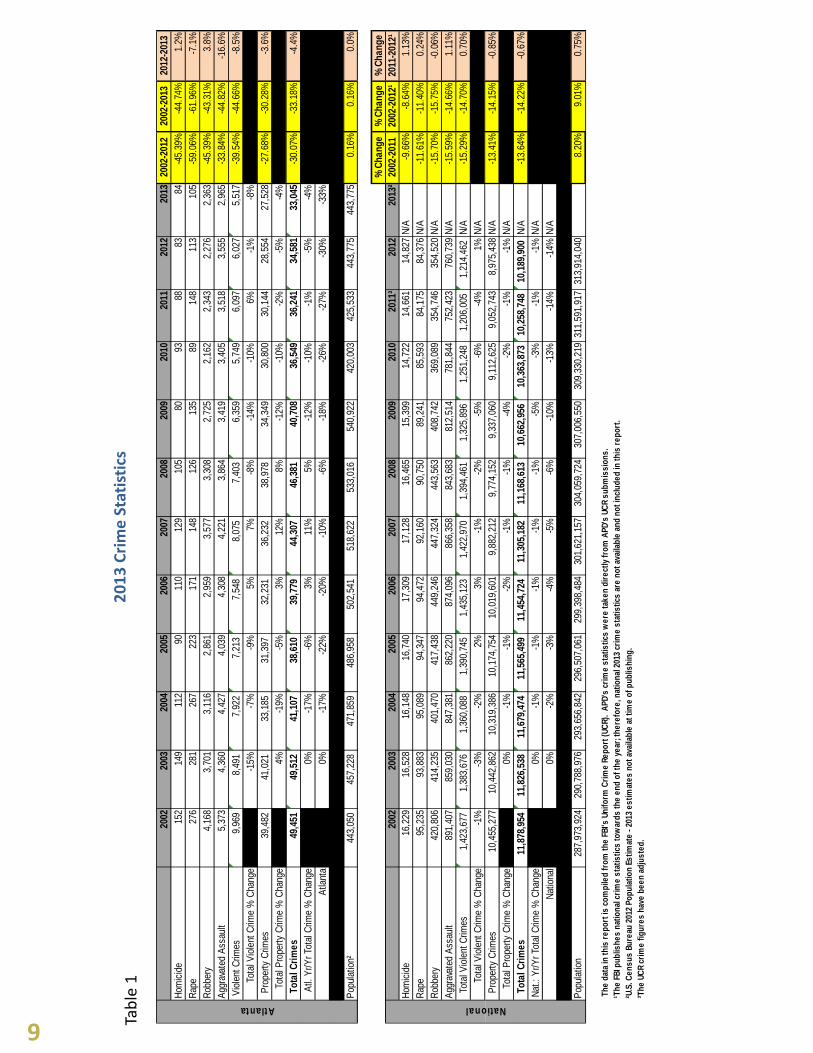
2013 Crime Statistics
Table 1
2002
2003
2004
2005
2006
2007
2008
2009
2010
2011
2012
2013
2002
-201
220
02-2
013
2012
-201
3H
omic
ide
152
149
112
9011
012
910
580
9388
8384
-45.
39%
-44.
74%
1.2%
Rap
e27
628
126
722
317
114
812
613
589
148
113
105
-59.
06%
-61.
96%
-7.1
%R
obbe
ry4,
168
3,70
13,
116
2,86
12,
959
3,57
73,
308
2,72
52,
162
2,34
32,
276
2,36
3-4
5.39
%-4
3.31
%3.
8%A
ggra
vate
d A
ssau
lt5,
373
4,36
04,
427
4,03
94,
308
4,22
13,
864
3,41
93,
405
3,51
83,
555
2,96
5-3
3.84
%-4
4.82
%-1
6.6%
Vio
lent
Crim
es9,
969
8,49
1
7,
922
7,21
3
7,
548
8,07
5
7,
403
6,35
95,
749
6,09
76,
027
5,51
7-3
9.54
%-4
4.66
%-8
.5%
Tota
l Vio
lent
Crim
e %
Cha
nge
-15%
-7%
-9%
5%7%
-8%
-14%
-10%
6%-1
%-8
% P
rope
rty C
rimes
39,4
82
41
,021
33,1
85
31
,397
32,2
31
36
,232
38,9
78
34
,349
30,8
0030
,144
28,5
5427
,528
-27.
68%
-30.
28%
-3.6
%To
tal P
rope
rty C
rime
% C
hang
e4%
-19%
-5%
3%12
%8%
-12%
-10%
-2%
-5%
-4%
Tot
al C
rim
es49
,451
49,5
12
41
,107
38,6
10
39
,779
44,3
07
46
,381
40,7
0836
,549
36,2
4134
,581
33,0
45-3
0.07
%-3
3.18
%-4
.4%
Atl.
Yr/Y
r Tot
al C
rime
% C
hang
e-5
%0%
-17%
-6%
3%11
%5%
-12%
-10%
-1%
-5%
-4%
Atla
nta
0%0%
-17%
-22%
-20%
-10%
-6%
-18%
-26%
-27%
-30%
-33%
Pop
ulat
ion²
443,
050
45
7,22
8
471,
859
48
6,95
8
502,
541
51
8,62
2
533,
016
54
0,92
242
0,00
342
5,53
344
3,77
544
3,77
50.
16%
0.16
%0.
0%
% C
hang
e%
Cha
nge
% C
hang
e20
0220
0320
0420
0520
0620
0720
0820
0920
1020
11³
2012
2013
²20
02-2
011
2002
-201
2¹20
11-2
012¹
Hom
icid
e16
,229
16,5
2816
,148
16,7
4017
,309
17,1
2816
,465
15,3
9914
,722
14,6
6114
,827
N/A
-9.6
6%-8
.64%
1.13
%R
ape
95,2
3593
,883
95,0
8994
,347
94,4
7292
,160
90,7
5089
,241
85,5
9384
,175
84,3
76N
/A-1
1.61
%-1
1.40
%0.
24%
Rob
bery
420,
806
414,
235
401,
470
417,
438
449,
246
447,
324
443,
563
408,
742
369,
089
354,
746
354,
520
N/A
-15.
70%
-15.
75%
-0.0
6%A
ggra
vate
d A
ssau
lt89
1,40
785
9,03
084
7,38
186
2,22
087
4,09
686
6,35
884
3,68
381
2,51
478
1,84
475
2,42
376
0,73
9N
/A-1
5.59
%-1
4.66
%1.
11%
Tot
al V
iole
nt C
rimes
1,42
3,67
7
1,
383,
676
1,36
0,08
8
1,
390,
745
1,43
5,12
3
1,
422,
970
1,39
4,46
1
1,
325,
896
1,25
1,24
8
1,
206,
005
1,
214,
462
N
/A-1
5.29
%-1
4.70
%0.
70%
Tota
l Vio
lent
Crim
e %
Cha
nge
-1%
-3%
-2%
2%3%
-1%
-2%
-5%
-6%
-4%
1%N
/A26
1.58
% P
rope
rty C
rimes
10,4
55,2
7710
,442
,862
10,3
19,3
8610
,174
,754
10,0
19,6
019,
882,
212
9,77
4,15
29,
337,
060
9,11
2,62
59,
052,
743
8,97
5,43
8N
/A-1
3.41
%-1
4.15
%-0
.85%
Tota
l Pro
perty
Crim
e %
Cha
nge
0%0%
-1%
-1%
-2%
-1%
-1%
-4%
-2%
-1%
-1%
N/A
Tot
al C
rim
es11
,878
,954
11,8
26,5
38
11
,679
,474
11,5
65,4
99
11
,454
,724
11,3
05,1
82
11
,168
,613
10,6
62,9
56
10
,363
,873
10,2
58,7
48
10,1
89,9
00
N/A
-13.
64%
-14.
22%
-0.6
7%N
at.:
Yr/Y
r Tot
al C
rime
% C
hang
e0%
0%-1
%-1
%-1
%-1
%-1
%-5
%-3
%-1
%-1
%N
/AN
atio
nal
0%0%
-2%
-3%
-4%
-5%
-6%
-10%
-13%
-14%
-14%
N/A
Pop
ulat
ion
287,
973,
924
290,
788,
976
293,
656,
842
296,
507,
061
299,
398,
484
301,
621,
157
304,
059,
724
307,
006,
550
309,
330,
219
311,
591,
917
313,
914,
040
8.20
%9.
01%
0.75
%
The
dat
a in
this
rep
ort i
s co
mpi
led
from
the
FBI's
Uni
form
Cri
me
Repo
rt (U
CR)
. A
PD's
cri
me
stat
istic
s w
ere
take
n di
rect
ly fr
om A
PD's
UC
R su
bmis
sion
s.
¹The
FBI
pub
lishe
s na
tiona
l cri
me
stat
istic
s to
war
ds th
e en
d of
the
year
; the
refo
re, n
atio
nal 2
013
crim
e st
atis
tics
are
not a
vaila
ble
and
not i
nclu
ded
in th
is r
epor
t.²U
.S. C
ensu
s Bu
reau
201
2 Po
pula
tion
Estim
ate
- 201
3 es
timat
es n
ot a
vaila
ble
at ti
me
of p
ublis
hing
.³T
he U
CR
crim
e fig
ures
hav
e be
en a
djus
ted.
Atlanta National
9
The Atlanta Police Foundation is a non‐profit public/private partnership focused on advancing public safety in Atlanta. In partnership with the City of Atlanta, the Atlanta Police Department and the business community, the APF provides research on policing best practices, strategic direction and resources to help the APD incubate innovation, keep pace with technology, and meet strategic time‐sensitive needs that help drive down crime and make Atlanta a safer city.
Our Vision The City of Atlanta – the Capital of the southeast – is a world‐class destination at the heart of a thriving metropolitan area. This fast‐growing city is a global transportation hub and has emerged as a vital banking center and world headquarters for many Fortune 500 companies.
For more than three decades, Atlanta was regarded as one of the nation’s most dangerous cities. In the past eleven years – thanks to the engagement of business, civic and philanthropic communities— the Atlanta Police Foundation and its stakeholders have been dedicated to enhancing Atlanta’s public safety agenda and improving the Atlanta Police Department to become a world‐class policing agency. Today, Atlanta is the safest it has been in more than 40 years.
ABOUT THE ATLANTA POLICE FOUNDATION
10
Invest in a Safer City
The Atlanta Police Foundation is a 501 c 3 tax exempt non‐
profit foundation. Your donations are tax deductible and
fund innovative policing initiatives to make Atlanta the safest
large city in the nation.
To make a donation or become a sponsor, visit our website:
www.AtlantaPoliceFoundation.org
THE ATLANTA POLICE FOUNDATION191 Peachtree Street NE
Suite 191Atlanta, GA 30303404.586.0180
Related Documents