1. Report No. FHWA/TX-97/1302-1 2. Government Accession No. Technical Report Documentation Page 3. Recipient's Catalog No. 4. Title and Subtitle BEHAVIOR OF REINFORCED CONCRETE PIER CAPS UNDER CONCENTRATED BEARING LOADS 7. Author(s) R. J. Denio, J. A. Yura, and M. E. Kreger 5. Report Date February 1995 6. Performing Organization Code 8. Performing Organization Report No. Research Report 1302-1 Interim 10. Work Unit No. ITRAIS) 14. Sponsoring Agency Code 9. Performing Organization Name and Address Center for Transportation Research The University of Texas at Austin 11. Contract or Grant No. 3208 Red River, Suite 200 Research Study 0-1302 Austin, Texas 78705-2650 1-----------.., .... - .... , .... ,...-----------------1 13. Type of Report and Period Covered 12. Sponsoring Agency Name and Address Texas Department of Transportation Research and Technology Transfer Office P. O. Box 5080 Austin, Texas 78763-5080 15. Supplementary Notes Study conducted in cooperation with the US. Department of Transportation, Federal Highway Administration Research Study Title: "Connections Between Steel Bent Caps and Concrete Piers" 16. Abstract At congested highway interchanges, the Texas Department of Transportation (TxDOT) uses narrow concrete piers and shallow depth steel cap girders. Research Project 0-1302 is concerned with the connection detail between these two elements. This report deals with the shear strength and reinforcement details at the top of the concrete pierin the vicinity of the bearings. Since no formal design procedure cUlTently exists for determining the required amount and distribution of reinforcing steel in a pier cap, this research also had the purpose of providing design guidelines for the pier cap. To investigate the behavior of the pier caps, six test specimens were constructed at a 30% scale. Five different reinforcing steel patterns were used in the six specimens to examine the contributions of different reinforcing types to the pier cap strength. Eleven static load tests were conducted to failure on the six pier caps. For all specimens, load on the pier cap was carried primarily by the action of a tied arch which transferred load from the base plates into the column. Overall, specimens that had a greater quantity of horizontal reinforcing steel and adequate development ofhorizontal reinforcing had a greater capacity. Three design methods were used to analyze the strength of the pier caps tested: (1) AASHTO (1992) Corbel Provisions; (2) ACI 318-89 Deep Beam Provisions; and (3) Strut-and-Tie Method. The corbel and deep beam provisions were vel}' conservative in predicting the capacity of the pier cap because they consider only concrete capacity in shear. On average, these two methods underestimated the pier strength by a factor of 3 to 4. Testing showed that the pier cap resisted loads through a tied arch, which is a much stronger load-carrying mechanism than concrete in shear. The strut-and-tie models used were much more accurate than conventional design methods in predicting the capacity of the pier caps because they model the compression arch action observed during testing. The strut-and-tie method is suggested for design because strut-and-tie analyses gave the best correlation with test results, modeled true behavior, and were still conservative. To detail the use of the strut-and-tie method, a design example using a proposed strut-and-tie model is presented. Also, recommendations are given for evaluating existing pier caps through field inspection. 17. Key Words concrete piers, steel cap girders, shear strength, strut-and-tie method, connection detail, reinforcement details, bearings, design procedure, reinforcing steel, behavior, capacity, conservative, corbel provisions, deep beam provisions, tied arch, base plates, column 18. Distribution Statement No restrictions. This document is available to the public through the National Technical Information Service, Springfield, Virginia 22161. 19. Security Classif. (of this report) 20. Security Classif. (of this page) Unclassified Unclassified 21 . No. of Pages 118 22. Price Form DOT F 1700.7 (8-72) Reproduction of completed page authorized

Welcome message from author
This document is posted to help you gain knowledge. Please leave a comment to let me know what you think about it! Share it to your friends and learn new things together.
Transcript

1. Report No.
FHWA/TX-97/1302-12. Government Accession No.
Technical Report Documentation Page
3. Recipient's Catalog No.
4. Title and Subtitle
BEHAVIOR OF REINFORCED CONCRETE PIER CAPSUNDER CONCENTRATED BEARING LOADS
7. Author(s)
R. J. Denio, J. A. Yura, and M. E. Kreger
5. Report Date
February 19956. Performing Organization Code
8. Performing Organization Report No.
Research Report 1302-1
Interim
10. Work Unit No. ITRAIS)
14. Sponsoring Agency Code
9. Performing Organization Name and Address
Center for Transportation ResearchThe University ofTexas at Austin 11. Contract or Grant No.
3208 Red River, Suite 200 Research Study 0-1302Austin, Texas 78705-2650
1-----------..,....-....,....,...-----------------1 13. Type of Report and Period Covered12. Sponsoring Agency Name and Address
Texas Department ofTransportationResearch and Technology Transfer OfficeP. O. Box 5080Austin, Texas 78763-508015. Supplementary Notes
Study conducted in cooperation with the US. Department of Transportation, Federal Highway AdministrationResearch Study Title: "Connections Between Steel Bent Caps and Concrete Piers"
16. Abstract
At congested highway interchanges, the Texas Department of Transportation (TxDOT) uses narrow concrete piers andshallow depth steel cap girders. Research Project 0-1302 is concerned with the connection detail between these twoelements. This report deals with the shear strength and reinforcement details at the top of the concrete pier in the vicinity ofthe bearings. Since no formal design procedure cUlTently exists for determining the required amount and distribution ofreinforcing steel in a pier cap, this research also had the purpose ofproviding design guidelines for the pier cap. Toinvestigate the behavior of the pier caps, six test specimens were constructed at a 30% scale. Five different reinforcing steelpatterns were used in the six specimens to examine the contributions ofdifferent reinforcing types to the pier cap strength.
Eleven static load tests were conducted to failure on the six pier caps. For all specimens, load on the pier cap wascarried primarily by the action ofa tied arch which transferred load from the base plates into the column. Overall,specimens that had a greater quantity ofhorizontal reinforcing steel and adequate development ofhorizontal reinforcing hada greater capacity.
Three design methods were used to analyze the strength of the pier caps tested: (1) AASHTO (1992) Corbel Provisions;(2) ACI318-89 Deep Beam Provisions; and (3) Strut-and-Tie Method. The corbel and deep beam provisions were vel}'conservative in predicting the capacity of the pier cap because they consider only concrete capacity in shear. On average,these two methods underestimated the pier strength by a factor of3 to 4. Testing showed that the pier cap resisted loadsthrough a tied arch, which is a much stronger load-carrying mechanism than concrete in shear. The strut-and-tie modelsused were much more accurate than conventional design methods in predicting the capacity of the pier caps because theymodel the compression arch action observed during testing. The strut-and-tie method is suggested for design becausestrut-and-tie analyses gave the best correlation with test results, modeled true behavior, and were still conservative.
To detail the use of the strut-and-tie method, a design example using a proposed strut-and-tie model is presented. Also,recommendations are given for evaluating existing pier caps through field inspection.
17. Key Words
concrete piers, steel cap girders, shear strength,strut-and-tie method, connection detail, reinforcementdetails, bearings, design procedure, reinforcing steel,behavior, capacity, conservative, corbel provisions, deepbeam provisions, tied arch, base plates, column
18. Distribution Statement
No restrictions. This document is available to the publicthrough the National Technical Information Service,Springfield, Virginia 22161.
19. Security Classif. (of this report) 20. Security Classif. (of this page)
Unclassified Unclassified
21 . No. of Pages
118
22. Price
Form DOT F 1700.7 (8-72) Reproduction of completed page authorized


BEHAVIOR OF REINFORCED CONCRETE PIER CAPS UNDERCONCENTRATED BEARING LOADS
by
R.J. DENIO, J.A. YURA AND M.E. KREGER
Research Report 1302-1
Research Project 0-1302Connections Between Steel Bent Caps and Concrete Piers
conducted for the
TEXAS DEPARTMENT OF TRANSPORTATION
in cooperation with the
U.S. DEPARTMENT OF TRANSPORTATIONFEDERAL HIGHWAY ADMINISTRATION
by the
CENTER FOR TRANSPORTATION RESEARCHBureau of Engineering Research
THE UNIVERSITY OF TEXAS AT AUSTIN
February 1995


IMPLEMENTATION
A design method is developed to determine the shear strength of the concrete pier.While the strut-and-tie method proposed is still conservative compared to the test results,the calculations at present are lengthy. The approach should probably be simplified beforeimplementation. The current methods in AASHTO do not model the actual behavior andgrossly underestimate the strength. It is recommended that the standard design anddetailing practice follow the procedures given in the report since the AASHTO provisionsare not really applicable to the concrete pier problem.
Prepared in cooperation with the Texas Department of Transportation and the U.S.Department of Transportation, Federal Highway Administration.
Tile contents of this report reflect the views of the authors, who are responsible forthe facts and the accuracy of the data presented herein. The contents do not necessarilyreflect the view of the Federal Highway Administration or the Texas Department ofTransportation. This report does not constitute a standard, specification, or regulation.
NOT INTENDED FOR CONSTRUCTION,
PERIVIIT, OR BIDDING PURPOSES
Joseph A. Yura, Texas P.E. #29859
Michael E. Kreger, Texas P.E. #65541
Research Supervisors
iii

ACKNOWLEDGEMENTS
Research Project 0-1302 was funded by the Texas Department of Transportation(TxDOT). The authors thank Mike Lynch and David McDonald of TxDOT for their valuablesuggestions and guidance.
Thanks are extended to the other students working on this project: Joe Ales, JasonOlson, and Ahmed Uddin Emad.
The experimental work was conducted at the Ferguson Structural EngineeringLaboratory at the University of Texas. The entire staff of the laboratory contributed to thesuccess of this project: P. Ball, S. Cunningham, W. Fontenot, L. Golding, R. Green, A.Jenkins, W. Little, R. Madonna, and B. Stasney,
iv

TABLE OF CONTENTS
Page
CHAPTERlINTRODUCTION 1
1.1. BACKGROUNDIPROBLEM STATEMENT 11.2. OBJECTIVES AND SCOPE 2
CHAPTER 2RESEAR.CH PROGRAM 5
2.1. TYPICAL TxDOT PIER CAP DESIGN 52.2. DESCRIPTION OF TEST SPECIMENS 7
2.2.1. Dimensions and Rebar Sizes for the Scale Specimens 72.2.2. Tested Reinforcing Patterns 8
2.3. DIFFERENCES BETWEEN THE TEST SPECIMENS AND FULL SIZE PIERS 112.4. MATERIALS 122.5. FABRICATION OF SPECIMENS 132.6. INSTRUMENTATION 142.7. TEST SET-UP 152.8. LOADING PROCEDURE 17
CHAPTER 3TEST RESULTS 19
3.1. NOMENCLATURE FOR SPECIMEN TESTS 193.2. TERMINOLOGY FOR DISCUSSING TEST RESULTS 193.3. SPECIMEN CAPACITY 203.4. LOAD-DEFLECTION BEHAVIOR. 223.5. CRACKING LOADS 283.6. FAILURE MODES 293.7. STRAlN GAGES 34
CHAPTER 4ANALYSIS OF RESULTS 39
4.1. INTRODUCTION 394.2. DISCUSSION OF TEST RESULTS 394.3. CORBEL ANALySIS 414.4. DEEP BEAM ANALYSIS 424.5. THE STRUT AND TIE DESIGN METHOD 42
4.5.1. Introduction 424.5.2. Major Assumptions ofthe Strut and Tie Method .434.5.3. Creation ofa Strut and Tie Model.. .444.5.4. Individual Elements ofthe Strut and Tie Model .46
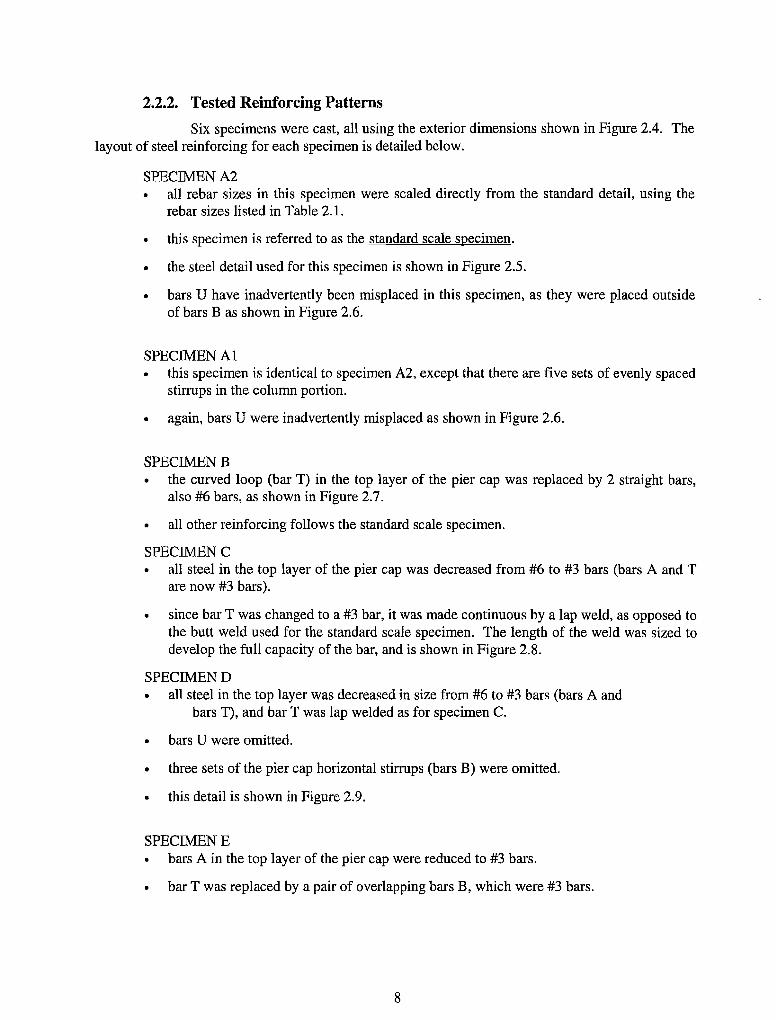
4.5.4.1. Ties 464.5.4.2. Struts 464.5.4.3. Nodes 48
4.6. STRUT AND TIE MODEL 1. 504.6.1. Geometry and Assumptions of Model 1 50
v

4.6.2. Analysis Results from Strut and Tie Modell 564.7. STRUT.ANI) TIE MODEL 2 584.8. SUMMARY OF STRUT AND TIE RESULTS 594.9. DESIGN EXAMPLE USING STRUT AND TIE MODEL 1 624.10. COMPARISON OF EXAMPLE PROBLEM REINFORCING STEEL TO A TYPICALTxDOT DETAIL 70
CHAPTERSSUMMARY.ANI) CONCLUSIONS 73
5.1. OBJECTIVES AND SCOPE 735.2. OBSERVED BEHAVIOR 735.3. COMPARISON OF DESIGN METHODS 745.4. AREAS FOR ADDITIONAL RESEARCH 74
APPENDIX ATENSILE TESTS OF REBAR 75
APPENDIXBLOAD - DISPLACEMENT GRAPHS 76
APPENDIXCPHOTOS OF THE FAILED SPECIMENS 85
APPENDIXDLOAD - STRAIN GRAPHS 97
BIBLIOGRAPHY 105
vi

Figure 1.1Figure 1.2Figure 1.3Figure 1.4Figure 2.1Figure 2.2Figure 2.3Figure 2.4Figure 2.5Figure 2.6Figure 2.7Figure 2.8Figure 2.9Figure 2.10Figure 2.11Figure 2.12Figure 2.13Figure 2.14Figure 2.15Figure 2.16Figure 2.17Figure 2.18Figure 3.1Figure 3.2Figure 3.3Figure 3.4Figure 3.5Figure 3.6Figure 3.7Figure 3.8Figure 3.9Figure 3.10Figure 3.11Figure 3.12Figure 3.13Figure 3.14Figure 3.15Figure 3.16Figure 3.17Figure 3.18Figure 3.19Figure 3.20Figure 3.21
LIST OF FIGURES
Page
A Typical TxDOT Bridge Support 1Application ofBridge Loads to the Pier Cap 1Arch Action When the SpanJDepth Ratio <1 2Test Set-Up for Scale Specimens 3Pier Cap Geometry and Terminology 5Typical Pier Geometry 5Typical Pier Steel Reinforcing Pattern 6Geometry of the Scale Test Specimens 7Steel Reinforcing Detail for the Standard Scale Specimen (Pier A2) 9hnproper Placement ofBars U in Specimen Al and A2 10Top Layer Pier Cap Reinforcing in Specimen B I0Lap Weld ofBar T 10Specimen D Reinforcing 11Relocation ofBars ZI in the Test Specimens 12Relocation of Bars B in the Test Specimens 12Steel Reinforcing Cage for Specimen A2 13Placement ofReinforcing Cages in forms 14Strain Gage Locations in Specimens C and D 14Reduction in Rebar Cross Section Due to Strain Gage Placement.. 15Location of Linear Pots 15Test Set-Up Geometry 16Placement of Test Specimens in the Test Machine 16Load Paths for the Pier Cap 19Patterns of Concrete Distress 20Load-Deflection Behavior for Pier AI-I 22Crack Distribution on the Face ofPier Al-l After Failure 23Crack Distribution at the Top ofPier Al-l After Failure 23Crushing of Pier Al-l After Failure 24Comparison of Resultant Load vs. Deflection at Linear Pot #1 25Comparison of Resultant Load vs. Deflection at Linear Pot #2 26Comparison of Resultant Load vs. Deflection at Linear Pot #3 27Specimens Al-l and C-l at Failure 29Redistribution of Internal Forces in the Pier Cap 30Development Lengths for Top Layer Reinforcing in Specimen B 30Splitting Cracks Due to Bond Distress in Specimen B 31Opening of Flexure/Shear for Pier B-2 - Spalled Cover Removed 31Punching ofthe Base Plate into Pier B2-2 32Crack Distribution on the Face ofPier D-l After Failure 32Force Distribution in Specimen D After Opening ofthe Flexural Crack 33Cracking and Punching Under the Base Plate for Pier C-2 33Strain Gage Locations in Specimens C and D 34Resultant Load vs. Strain on Gages 1 - 4 for Pier C-l.. 35Resultant Load vs. Strain on Gages 9 - 12 for Pier D-l 36
vii

Figure 3.22Figure 3.23Figure 4.1Figure 4.2Figure 4.3Figure 4.4Figure 4.5
Figure 4.6Figure 4.7Figure 4.8Figure 4.9Figure 4.10Figure 4.11Figure 4.12Figure 4.13Figure 4.14Figure 4.15Figure 4.16Figure 4.17Figure 4.18Figure 4.19Figure 4.20Figure 4.21Figure 4.22Figure 4.23Figure 4.24Figure 4.25Figure 4.26Figure 4.27Figure 4.28Figure 4.29FigureA.1Figure B.1Figure B.2Figure B.3Figure B.4Figure B.5Figure B.6Figure B.7Figure B.8Figure B.9Figure B.lOFigure B.llFigure B.12Figure C.1Figure C.2Figure C.3Figure C.4
Resultant Load vs. Strain in Gages 5 - 8 for Pier C-2 36Resultant Load vs. Strain in Gages 5 - 8 for Pier D-2 37Force Distribution Assumed in Corbel Code Provisions (Salmon 1985) .41Examples of Strut and Tie Models (from Schlaich 1987) 43Band D Regions (Shaded) of a Structure (from Schlaich 1987) 44Use of the Load Path Method to form a Strut and Tie Model (from Schlaich 1987) .. 45The Good Strut and Tie Model has Shorter Ties Than the Bad Model (from Schlaich1987) 45The Three Compression Struts (a) The Fan (b) The Bottle (c) The Prism .46Strut and Tie Model Considering Transverse Tensile Stresses 48CCC Node with Unequal Pressure (from Barton 1988) 48CCC Node Under Hydrostatic Stress (adapted from Anderson 1988) 49CCT Node With Multiple Layers ofReinforcing (from Bergmeister 1990) 49Mesh Used for the Finite Element Analysis 50Loading Applied to the Finite Element Model 50Contour of Principal Tensile Stresses 51Contour of Principal Compressive Stresses 51Failure Pattern for a Typical Specimen 52Shear Span Modelled in the Finite Element Analysis 52Configuration of Strut and Tie Modell 53Determination ofthe Compression Field Width 53Centroid Location for the Column Compression Strut.. 54Layout of Compression Steel at the Edge ofthe Column 55Configuration of Strut and Tie Model 2 58
Pier Cap Geometry for the Example Problem 62Strut and Tie Model for the Example Problem 63Cross Section of Strut C5 64Location ofNode 2 in the Strut and Tie Model 65Geometry ofthe CCC Node (Node 2 in the Strut and Tie Model) 66Steel Reinforcing Pattern from the Example Problem 67Geometry ofthe CCT Node (Node 1 in the Strut and Tie Model) 68Typical Steel Reinforcing Pattern Used by TxDot.. 70Typical Stress - Strain Curve for a Tensile Test ofRebar 75Location of Linear Pots 76Resultant Load vs. Deflection at Linear Pots 1 through 4 for Pier A1-1.. 78Resultant Load vs. Deflection at Linear Pots 1 through 4 for Pier A2-2 78Resultant Load vs. Deflection at Linear Pots 1 through 4 for Pier A2-3 79Resultant Load vs. Deflection at Linear Pots 1 through 4 for Pier B-l. 79Resultant Load vs. Deflection at Linear Pots 1 through 4 for Pier B-2 80Resultant Load vs. Deflection at Linear Pots 1 through 4 for Pier C-l.. 80Resultant Load vs. Deflection at Linear Pots 1 through 4 for Pier C-2 81Resultant Load vs. Deflection at Linear Pots 1 through 4 for Pier D-1 81Resultant Load vs. Deflection at Linear Pots 1 through 4 for Pier D-2 82Resultant Load vs. Deflection at Linear Pots 1 through 4 for Pier E-1 82Resultant Load vs. Deflection at Linear Pots 1 through 4 for Pier E-2 83Damage to Pier Al-l After Failure 89Damage to Pier A2-2 After Failure 90Damage to Pier A2-3 After Failure 91Damage to Pier B-1 After Failure 92
V111

Figure C.5Figure C.6Figure C.7Figure C.8Figure C.9Figure C.lOFigure C.lIFigure D.lFigure D.2Figure D.3Figure D.4Figure D.5Figure D.6Figure D.7Figure D.8Figure D.9Figure D.10Figure D.llFigure D.12Figure D.B
Damage to Pier B-2 After Failure.... 90Damage to Pier C-l After Failure 91Damage to Pier C-2 After Failure........................................................................... 92Damage to Pier D-l After Failure 93Damage to Pier D-2 After Failure 94Damage to Pier E-l After Failure 95Damage to Pier E-2 After Failure 96Location of Strain Gages ,.......................... 97Resultant Load vs. Strain in Gages 1 through 4 for Pier C-l.................................. 98Resultant Load vs. Strain in Gages 5 through 8 for Pier C-l.................................. 98Resultant Load vs. Strain in Gages 9 through 12 for Pier C-l 99Resultant Load vs. Strain in Gages 2 and 4 for Pier C-2 99Resultant Load vs. Strain in Gages 5 through 8 for Pier C-2 100Resultant Load vs. Strain in Gages 9 through 12 for Pier C-2 100Resultant Load vs. Strain in Gages 1 through 4 for Pier D-l 101Resultant Load vs. Strain in Gages 5 through 8 for Pier D-l 101Resultant Load vs. Strain in Gages 9 through 12 for Pier D-l 102Resultant Load vs. Strain in Gages 1 through 4 for Pier D-2 102Resultant Load vs. Strain in Gages 5 through 8 for Pier D-2 103Resultant Load vs. Strain in Gages 9 through 12 for Pier D-2 103
ix

Table 2.1Table 2.2Table 2.3Table 3.1Table 3.2Table 3.3Table 3.4Table 4.1Table 4.2
Table 4.3Table 4.4Table 4.5Table 4.6Table 4.7
Table 4.8
Table 4.9
LIST OF TABLES
Page
Rebar Sizes for Full Size and Standard Scale Piers (see Figure 2.3 for bar layout) 7Static Yield Strengths ofRebar 12Concrete Cylinder Compressive Strengths 13Summary of Specimen Reinforcement Patterns 21Specimen Capacities and Concrete Strengths 21Specimen Cracking Loads 28Comparison of Strain for the First and Second Tests on a Specimen 37Test Specimen Strengths 39Test Specimen Capacity Compared to the Strength Predicted by Conventional DesignMethods 42Specimen Capacity and Member Forces for Strut and Tie Modell 57Tested Capacities for Pier A and Pier C 57Limitations on the Components ofT2 Based on Reinforcing in the Test Specimens .. 57Specimen Capacity and Member Forces for Strut and Tie Model 2 59Predicted Specimen Capacities when a Vc Term is Added to Strengths from Strut andTie Modell 60Comparison ofAverage Ratio ofTheoryffest Capacity for Different Design Methods............................................................................................................................... 61Strut and Tie Capacity and Member Forces for a Typical TxDOT Steel Detail (Figure4.29) 71
x

SUMMARY
At congested highway interchanges, TxDOT uses narrow concrete piers andshallow depth steel cap girders. Research Project 1302 is concerned with the connectiondetail between these two elements. This report deals with the shear strength andreinforcement details at the top of the concrete pier in the vicinity of the bearings. Since noformal design procedure currently exists for determining the required amount anddistribution of reinforcing steel in a pier cap, this research also had the purpose ofproviding design guidelines for the pier cap. To investigate the behavior of the pier caps,six test specimens were constructed at a 30% scale. Five different reinforcing steelpatterns wee used in the six specimens to examine the contributions of different reinforcingtypes to the pier cap strength.
Eleven static load tests were conducted to failure on the six pier caps. For allspecimens, load on the pier cap was primarily carried by the action of a tied arch whichtransferred load from the base plates into the column. Overall, specimens that had agreater quantity of horizontal reinforcing steel and adequate development of horizontalreinforcing had a greater capacity. To investigate the necessity of the continuous steelloop around the perimeter of the pier cap, a specimen was constructed with only straightbars in the top layer of the pier cap. When the continuous loop was not included in the toplayer of the pier cap reinforcement, shear cracks on the face of the pier opened extremelywide because there was no reinforcement at the top of the pier to limit their growth. Bonddistress was also seen for the straight bars in the top layer of the pier cap because removalof the continuous loop left only straight bars with short development lengths. Without thecontinuous loop, concrete at the end of the pier cap was not confined and additionalpunching occurred. Bearing capacity of the pier cap was increased by the confinementprovided by the continuous loop around the end of the pier cap so such a detail is highlyrecommended.
Three design methods were used to analyze the strength of the pier caps tested:
1. AASHTO (1992) Corbel Provisions
2. ACI 318-89 Deep Beam Provisions
3. Strut-and-Tie Method
The corbel and deep beam provisions were very conservative in predicting the capacity ofthe pier cap because they only consider concrete capacity in shear. On average these twomethods underestimated the pier strength by a factor of 3 to 4. Testing showed that thepier cap resisted loads through a tied arch, which is a much stronger load-carryingmechanism than concrete in shear. The strut-and-tie models used were much moreaccurate than conventional design methods in predicting the capacity of the pier capsbecause they model the compression arch action observed during testing. The strut-and-
xi

tie method is suggested for design because strut-and-tie analyses gave the bestcorrelation with test results, modeled true behavior, and were still conservative.
To detail the use of the strut-and-tie method, a design example using a proposedstrut-and-tie model is presented. Also, recommendations for evaluating existing pier capsthrough field inspection are given.
xii

CHAPTER 1
INTRODUCTION
1.1. BACKGROUNDIPROBLEM STATEMENT
An increasing number of bridges are being constructed in urban areas where the bridgegeometry is controlled by space limitations from existing roads, bridges, or other obstacles. Whendesigning the bridge supports in these congested areas, lateral and vertical space constraints oftendictate the configuration used for the bridge piers and bents. A typical bridge support detail used bythe Texas Department of Transportation (TxDOT) when space is limited is shown in Figure 1.1. Inthis detail, longitudinal steel girders frame into a steel bent cap which is supported by a reinforcedconcrete pier cap. Compressive load is transferred from the steel bent to the pier cap through bearingplates whose reactions do not lie within the column as shown in Figure 1.2. Because the projectionof the bearing load does not lie within the column, the pier cap design must consider shear. Thecapacity of the pier cap to withstand the eccentric compressive loads from the steel bent cap is thefocus of this research.
STEEL CAP GIR~R
LONGITUDINALG IR D E R
----REINFORCED CONCRETE'--,-------,----' PIE RCA P
-'--~,---.......~ REIN FOR C E D CON C RET EPIE R COL U M N
Figure 1.1 A Typical TxDOT Bridge Support
---PIER CAP
p
t /BASEPLATE
PROJECTION OFBEARING -- COLUMNSURFACE
Figure 1.2 Application ofBridge Loads to the Pier Cap
1

Arch Action When the SpanlDepth Ratio <1
LOAD
tTENSION TIE
COMPRESSIONARCH
When examining the compressive load carrying capacity of the pier cap, the nature of thetransfer of load from the steel bent cap to the concrete pier cap is critical. The steel bent captypically is supported on disc bearings, pot bearings, or bearing plates which are subject to factoredloads on the order of 2,000 kips. All of these supports are relatively small compared to the area ontop of the pier cap, and place highly concentrated compressive loads on the top of the pier cap.There are two basic problems to solve with respect to these concentrated loads. First, the concreteunder the bearing plate must not crush. Second, the concentrated loads on the pier cap must betransferred to the column. The design for bearing capacity is clearly outlined in the AASHTO BridgeSpecifications (AASHTO 1992). The design of the pier cap region to allow transfer of load to thecolumn is much more difficult for the engineer, since it is an atypical section whose design is notexplicitly covered in design codes. With the bearings placed outside of the interior of the column,the load is slightly eccentric to the column as shown in Figure 1.2. For the piers studied, the shearspan is very small, with a span to depthratio below 0.1. For reinforced concretecantilevers with such small span to depthratios, loads will be transferred primarilyby the action of a tied arch as shown inFigure 1.3 (Salmon 1985). However,existing code provisions aimed at beamswith span to depth ratios less than 1 donot consider arching action as a primaryload carrying mechanism. Instead,existing code provisions for beams withspan/depth ratios less than one focus onthe capacity of concrete in shear. Thus, adesign based on existing code provisionswill be overly conservative becauseconcrete can carry much less load inshear than in direct compression. Figure 1.3
1.2. OBJECTIVES AND SCOPE
The behavior of the entire connection shown in Figure 1.1 is being studied under a projectfor the Texas Department of Transportation (TxDOT). The research considers the distribution offorces within the bridge system, the behavior of the anchor bolt system, and the behavior of theconcrete pier cap. This report focuses on the behavior and design of the reinforced concrete pier capused by TxDOT subject to compressive loads. The objectives of this research are a determination ofthe strength and behavior of the reinforced concrete pier cap under compression loads, and theformulation of design recommendations for the pier cap.
To assess the capacity of the pier cap to sustain extreme compression loads, six pier caps at a30 percent scale were tested in compression as shown in Figure 1.4. Steel reinforcement designs inthe pier cap were altered to examine extremes in capacity, and to examine the contributions ofdifferent types and quantities of reinforcing steel to the strength of the pier cap. Three techniquesthat could be used to analyze the pier cap are compared. The two conventional design solutions thatare applicable are a corbel analysis and deep beam analysis. As an alternative design method, a strutand tie model will be presented for comparison. Also, bearing stresses from testing will be comparedwith stresses allowed in the 1992 AASHTO provisions.
2

The test set-up is summarized in Chapter 2 of this report, which describes sizes of thespecimens, steel reinforcement patterns, and loading geometry. Results from the test program aresummarized in Chapter 3 and are discussed in Chapter 4. Also in Chapter 4, pier cap strengthspredicted by the different design techniques are compared, and a design example using the strut andtie method is presented. Full data from the tests and photos of the failed specimens are presented inthe appendices.
LOAD
-L--
,.u, ,-U-,
"""'"
SPREADERBEAM
TESTSPECIMEN
Figure 1.4 Test Set-Up for Scale Specimens
3

4

CHAPTER 2
RESEARCH PROGRAM
2.1. TYPICAL TxDOT PIER CAP DESIGN
The basic geometry of the pier cap and column studied and terminology used for the detail isshown in Figure 2.1. To study the behavior and strength of the pier cap, six one-third scalespecimens were built and tested to failure. With a known pier cap strength from experimentalresults, an improved design guideline to more accurately predict the strength of the detail can beproduced.
PIER CAPTHICKNESS
gCOLUMN
THICKNESS
Pier Cap Geometry and Terminology
I COLUMN II( )1COLUMN WIDTH
1PIERPIER CAP CAP
DEPTHL...--r------.---.....
:; PIER CAP LENGTH)
tL-jj
Figure 2.1
The steel reinforcing patternsused by TxDOT for slightly different piercap and column configurations are verysimilar, so the single pier cap geometryshown in Figure 2.2 was chosen as thefocus of study. This configuration has alarge extension of the pier cap beyond thecolumn, with the centerline of the loadingcoinciding with the edge of the column.This layout produces a load eccentricity,which requires an inclined load path totransfer load from the pier cap into thecolumn. The loading geometry shownrepresents the maximum eccentricitycurrently used by TxDOT for the piercap/column configuration studied, soresults can be applied to piers with asmaller load eccentricity.
4' - 0"1(...c===.)1
I II( )1
3' - 6"
LOAD
8' - 0"
12' - 0"
E ~ I E;;;~
I( )1
The pattern and sizes ofreinforcing that are usually used in thetypical pier cap and column are shown inFigure 2.3. The top layer of the pier cap is
4'·0" _..very heavily reinforced with a combination of -#11 straight bars and a #11 continuous loop (barT) to resist high tensile loads. Bar T is madecontinuous by a full penetration butt weld that is LOADlocated in the middle of the pier cap. The piercap has both horizontal (bars B) and verticalstirrups (bars S) evenly distributed over the Idepth and length of the pier cap, respectively. 4' - 0"The horizontal stirrups (bars B) have semi-circular ends to provide confinement all the wayaround the end of the pier.
Figure 2.2 Typical Pier Geometry
5

8'-0"
S
T
A
21/4
TOP REINFORCINGu
~ ': \~,
\
))~ I //
J t' "
7 Eq. Spa.
Z2 8 E~ S. =4' - 6"
COLUMN SECTION
B
BOTTOM REINFORCING
CAP DETAILS
T
. Joint
2' - 0" 8 E. S. =8' - 0" 2' - 0"~ ,,
1'="===== ./1S ==-~
E
B ~. i 'Const
1// b
u
V extend 3' - 6"min. into cap
Z1 -12" max. spa.
PIER ELEVATION
BAR SIZE
A #11B #6S #5T #11U #6V #6
Z1 #4Z2 #4
BARSUBARSS
, [= cU1~'_53/4" F~'~ '~fo]'I,I'=+ ...., ...., N
<tof structure 'J +. ' ::- ~I C') C').
Splice shall be madeby' Mfull penetration butt weld. BARS Z1 8"
8'- 0"
6' -61/2"
BARSB
BARST BARSZ2
Figure 2.3 Typical Pier Steel Reinforcing Pattern
6

2.2. DESCRIPTION OF TEST SPECIMENS
2.2.1. Dimensions and Rebar Sizes for the Scale Specimens
The geometry of the detail shown in Figure 2.2 was used as the reference for creationof test specimens. Since the estimated loads needed to fail a full size specimen exceeded the capacityof testing machines available in the laboratory, model specimens were constructed at a 30% scale.The thickness and depth of the pier cap, the column thickness, and base plate size for the testspecimens were obtained by direct proportioning from the standard detail presented in section 2.1.The width of the column was set at 36 inches (which also sets the length of the pier cap) forconvenience in application of the load. The final pier size used for all the scale specimens is shownin Figure 2.4. Note that the test specimens have a column width equal to the pier cap width. Thislarger column size will slightly increase the strength of the specimens by providing a greater areaover which to transfer load from the pier cap to the column.
36"
14-1/2"1<,+-'>\
I
BASE PLATES8-314" x 8-
50 - 1/2"
LOAD LOAD
~ ~
14-1/2'I
14 -1/2 r
I
1< )1
29'
Rebar sizes for the scalespecimens were obtained bychoosing the size rebar with an areaclosest to 30% of the full size of therebar. Table 2.1 shows the sizes ofthe rebar used in the standard scalespecimens, and the actual scale(based on area) of the rebar used.The hooped stirrups in the column(bars Z) are not at an appropriatescale because a minimum number ofrebar sizes was desired. Thisdiscrepancy in scale was acceptedsince the column stirrups will have anegligible effect on the strength ofthe pier cap.
Figure 2.4 Geometry of the Scale Test Specimens
Table 2.1 Rebar Sizes for Full Size and Standard Scale Piers (see Figure 2.3 for bar layout
Bar Full Size Scale Size Actual Scale
A #11 Ab=1.56 in" #6 Ab=0.44 in" 28.2%B #6 Ab=0.44 in" #3 Ab=0.11 in" 25.0%S #5 Ab=0.31 in" #3 Ab=0.11 in" 35.4 %T #11 Ab=1.56 in" #6 Ab=0.44 in" 28.2%U #6 Ab=0.44 in" #3 Ab=0.11 in" 25.0%V #11 Ab=1.56 in" #6 Ab=0.44 in" 28.2%Z #4 Ab=0.20 in" #3 Ab=0.11 in" 55.0%
7
2.2.2. Tested Reinforcing Patterns
Six specimens were cast, all using the exterior dimensions shown in Figure 2.4. Thelayout of steel reinforcing for each specimen is detailed below.
SPECIMEN A2• all rebar sizes in this specimen were scaled directly from the standard detail, using the
rebar sizes listed in Table 2.1.
• this specimen is referred to as the standard scale specimen.
• the steel detail used for this specimen is shown in Figure 2.5.
• bars U have inadvertently been misplaced in this specimen, as they were placed outsideof bars B as shown in Figure 2.6.
SPECIMEN Al• this specimen is identical to specimen A2, except that there are five sets of evenly spaced
stirrups in the column portion.
• again, bars U were inadvertently misplaced as shown in Figure 2.6.
SPECIMENB• the curved loop (bar T) in the top layer of the pier cap was replaced by 2 straight bars,
also #6 bars, as shown in Figure 2.7.
• all other reinforcing follows the standard scale specimen.
SPECIMENC• all steel in the top layer of the pier cap was decreased from #6 to #3 bars (bars A and T
are now #3 bars).
• since bar T was changed to a #3 bar, it was made continuous by a lap weld, as opposed tothe butt weld used for the standard scale specimen. The length of the weld was sized todevelop the full capacity of the bar, and is shown in Figure 2.8.
SPECIMEND• all steel in the top layer was decreased in size from #6 to #3 bars (bars A and
bars T), and bar T was lap welded as for specimen C.
• bars U were omitted.
• three sets of the pier cap horizontal stirrups (bars B) were omitted.
• this detail is shown in Figure 2.9.
SPECIMENE• bars A in the top layer of the pier cap were reduced to #3 bars.
• bar T was replaced by a pair of overlapping bars B, which were #3 bars.
8

The different specimens were designed to determine the strength and behavior of thestandard detail, and the contribution of different types of reinforcing to the overall strength of thepier. The A specimens were made to provide a direct test of the standard detail, and to compare thevariability between specimens. Specimen B examines the ability of the looped bar to provideconfinement for the end of the pier. Specimen C examines the effect of less top layer reinforcing onthe behavior and strength of the specimen. Specimen D is used to set a minimum bound for thestrength of the pier cap. Finally, specimen E considers the necessity of a welded bar in the top layerof the pier cap.
36"
1-3/4"
7 E. S. =21 - 112"
COLUMN SECTION
. 7 Eq. Spa.
A
GlB:sU
TOP REINFORCINC3
CAP DETAILS
BOTTOM REINFORCING
1t1JnD,314"~S. . .
. . .U
T
xtend 11-3/4"cap
7-1/4"7 E. S.=36"7-1/4"~ ~ ...'~ d'S ;.L,'
'.·- ··o.
B
~ p,-.Ve- into
,.----.
u
1-112"
3E.S.= 11-3/4"
1-114"Z1
PIER ELEVATION
BARSB
dr---'_3D"_} u~ ~ILBARSSBARS U
36"
BARSTBARS Z1
Figure 2.5 Steel Reinforcing Detailfor the Standard Scale Specimen (Pier A2)
9

bar T bar T
bars U
II I'1/
I'
------J
I' Ir ~
~bars
bars BS
bars U
J-~ I'
I'
~ '"bars B
~bars S
1M PROPER PLACEM ENT OFBARS U
CORRECT LOCA TIOI\l OFBARS U
Figure 2.6 Improper Placement ofBars U in Specimen AI and A2
bars A
bars S
replacement for bars T
,~
! 'IIl.; l.; l.;...... ...... ......
1'. ,,~
A-
Ibars U
Figure 2.7 Top Layer Pier Cap Reinforcing in Specimen B
Figure 2.8 Lap Weld ofBar T
10

bars A
bars S
bars TTOP REINFORCING
IN PIER CAP
t ~})~~
bars T
B
s V extend3/4" into
bars S4
I
I'f' bars
bar11 -
bars Z1
PIER ELEVATION
Figure 2.9 Specimen D Reinforcing
2.3. DIFFERENCES BETWEEN THE TEST SPECIMENS AND FULL SIZEPIERS
There were some differences between the construction of the scale specimens and actualpiers. For the test specimens, cover was only 3/4" for the pier cap, as opposed to 2 1/4" for the fullsize pier cap, a 33% scale. A smaller cover was used for the test specimens to maintain a constantproportion of concrete subject to spalling. For the column section, cover was 1 3/4" for the testspecimens. This larger cover was a result of the formwork used for the scale specimens. The columnsteel must be inset relative to the sides of the pier cap to avoid intersecting the reinforcing in the piercap. Since the column for the scale specimens was the same thickness as the pier cap, extra cover inthe column region was produced.
In the scale specimens, the amount of column steel in the rectangular portion of the columnwas reduced to relieve congestion of the reinforcing. The number of column bars (bars V) in thecenter portion of the column was decreased from nine on a side in the actual piers to eight on a sidein the scale specimens. Thus, there were 28 total bars V in the test specimens as opposed to 30 totalfor the full scale piers. Such a change should have no noticeable effect on the specimensperformance.
Additionally, location of reinforcement in the scale specimens was slightly modified fromthat of the field placement. For the scale specimens, bars Z2 were omitted to ease fabrication. Asshown in Figure 2.10, bars Z2 had been anchored at bar 1 near the column edge. To maintain thesame confining effect at the end of the column for the test specimens, bars Zl were made longer and
11

anchored at bar 1. Finally, bars B in the testspecimens were anchored farther in the scalespecimens than in full size piers by placing themaround column bar 1 as shown in Figure 2.11.Previously, bars B had been anchored around bar2 of Figure 2.11. The change was made tofacilitate test specimen fabrication. Thus, bars Band Zl in the scale specimen are physicallyanchored around the same column bar.
2.4. MATERIALS
All bars in the test specimens were either#3 or #6 in size. Specimens were constructed intwo· sets, so steel for each set of specimens wasordered from the same lot. Static yield strengthsobtained from tensile tests on the bars are listed inTable 2.2. For specimens B through E, the #3bars had a low yield strength of 47.4 ksi.Inspection of stamps on these bars showed that thebars were not grade 60, but a lower grade of steel.Testing of the rebar is described in Appendix A.
bar 1
COLUM N SECTION
-FULL SIZE PIER-
bar 1
COLUM N SECTION
-TEST SPECIM ENS-
Figure 2.10 Relocation ofBars 21 in theTest Specimens
The concrete design strength for the TxDOT pier caps is 3,600 psi at 28 days, so a 4,000 psimix was ordered from a local concrete supplier. The concrete had a maximum aggregate size of 3/4"to allow placement in the congested rebar cage, and to fit within the 314" cover. Two different pourswere made, with the first pour for specimens Al and A2, and the second for specimens B through E.The cylinder compressive strengths are shown in Table 2.3. The cylinders tested were 6 inches by 12inches, and were loaded using neoprene pads. The long term strength is taken as the average of allcylinders tested after 35 days, and represents 7 cylinders for specimens A and 18 cylinders forspecimens C-E. Cylinders were stored with the specimens.
PIER CA P SECTION
-FU LL SIZE PIER-
PIER CAP SECTION
·TEST SPECIM ENS·
Figure 2.11 Relocation ofBars B in the Test Specimens
12

Table 2.2 Static Yield Strengths ofRebar
Specimens fy for #3 bars fy for #6 bars
Al andA2 60.8 60.0
B throughE 47.4 60.0
Table 2.3 Concrete Cylinder Compressive Strengths
Specimens 7 day strength 28 day strength long term strength
Al and A2 2939 psi 3905 psi 4050 psi
B through E 2820 psi 3554 psi 4016 psi
2.5. FABRICATION OF SPECIMENS
All specimens were constructed at the Ferguson Lab. The reinforcing cage for specimen A2is shown in Figure 2.12. All of the bent bars were ordered from a local fabricator, and met areasonable tolerance - -3/8" - for the out to out dimensions. Spacers were placed on rebar parallel to the straightedges of the specimen to ensure equal cover on opposite sides of the specimen. Forms were made right side up, sothe effect of bleeding and segregation would be the same as for actual piers. The circular end of the column wasformed using sheet metal placed within a wood frame. The placement of the reinforcing in the forms is shown inFigure 2.13.
The specimens were poured monolithically, with no construction joint as used in the field.Concrete was placed using an overhead crane and bucket, and thoroughly consolidated using internalvibration. After pouring, the exposed concrete on the top of the forms was covered with plastic.After one week, the forms and cylinders were stripped and left to cure in air. Removal of the formsshowed that there were no defects such as honeycombing in the concrete.
2.6. INSTRUMENTATION
Strain gages were placed on reinforcing in the top layer of the pier cap of specimens C andD. The gage locations are shown in Figure 2.14. The strain gages were not located under the bearingplates, so strain gage readings represent a basically uniaxial state of stress. The strain gages had a 6rom gage length, with a 12 rom by 4 rom backing. The size of the gage backing mandated significantgrinding of the #3 bars to produce a flat surface for the strain gages. Since the gages were placed onthe top and bottom of a bar, the area of the bar at the gage location was reduced as shown in Figure2.15. To protect the gages from moisture and the casting process, the gages were covered by a waterproofing sealer and mastic. All gages were still active after concrete was placed. The initial straingage accuracy was approximately ± 10 microstrains.
13

Figure 2.12 Steel Reinforcing Cage for Specimen A2
Figure 2.13 Placement ofReinforcing Cages informs
14

2"15-1/2"
even # aaaes . on bottom of rebarodd # aaaes • on too of rebar
18"7-1/4"
2-7/8" 8-3/4" 3·7/8" 2" 7-3/4"1< >1< >1< >I~< >1
U It.of soeci men------1
I>1
Figure 2.14 Strain Gage Locations in Specimens C and D
Figure 2.15 Reduction in Rebar Cross Section Due to Strain Gage Placement
15

5
6
,I tiline of action! of load
9 9\3and4 I,
II, ,~ ~2
1
center of load head3 / !
1 and2-ij:31-------$5 and 6
4' I, I
Figure 2.16 Location ofLinear Pots
Six linear potentiometers (pots) were placed on the specimen to measure deflections asshown in Figure 2.16. The accuracy of the linear pots is ± 0.001 inches. The identificatiol1 of thepotentiometers was kept constant with respect to the point of load application, so pots 1 and 2 alwaysrefer to the pots at the tip of the tested end of the specimen. Thus, pots 3 and 4 are always at thecenter of the base plate, and pots 5 and 6 are always at the far end of the specimen. For the first teston a specimen, pots 1 and 2 were at the south side of the pier, while pots 5 and 6 were at the northend of the pier. For the second test on a specimen, pots 1 and 2 were at the north end of thespecimen, and pots 5 and 6 were at the south end of the specimen.
2.7. TEST SET-UP
The test set-up was designed to allow two tests on each specimen. The configuration forapplying load to the specimen is shown in Figure 2.17. The specimen and spreader beam wereplaced inside the frame of a 600 kip load machine as shown in Figure 2.18. The test machine wasfitted with a swivel head so rotation of the girder would not be restrained. A spreader beam was usedto place load from the test machine on each end of the pier cap to prevent overturning of thespecimen.
The loading head of the 600 kip machine was offset from the centerline of the spreader beamto place most of the load at one end of the pier. The end of the pier cap with the smaller portion ofload did not sustain any damage while the opposite end was tested, so test results for the two ends ofthe specimens are directly comparable. Once one end of the pier was tested, the specimen wasrepositioned on the floor of the test machine and the other end of the specimen was tested.
The 3 5/8 inch diameter rollers under the spreader beam place two distinct line loads on thebase plates. By idealizing load from the test machine as a line load on the spreader beam, the testset-up is statically determinant. Therefore, the net load on each end of the pier cap can be found as aproportion of the total load measured by the test machine.
16

8-3/4" x 8-3/4" x 2"base plates
hydrostone
SPREADERBEAM
3-5/8" diam. roller
ESTPECIMEN
Test Set-Up Geometry36"
Figure 2.17
10-1/2" wide plate
II
I --,I
I /;
/
.2-=:11 .c ~t. I .t ~
o.8slfS 30"O.17F
, .......
~TS
1< )1
30
29
Figure 2.18 Placement of Test Specimens in the Test Machine
17

To level the spreader beam and provide full contact between the top of the pier cap and thebase plates, a 5/16 inch layer of hydrostone was poured under the base plates. Also, for some of thepiers a thin film of hydrostone was poured under the semi-circular end of the column, at the end ofthe specimen being tested. This layer of hydrostone produced full contact between the floor andspecimen, preventing any rigid body rotations of the specimen due to a non planar surface on thebottom of the specimen.
2.8. LOADING PROCEDURE
Loading was applied in discrete increments, typically 20 to 30 kips on the linear portion ofthe load-deflection curve. After an increment in load was applied, about five minutes passed whilecracks were marked and inspected. At the end of this delay, load and deflection readings were takenelectronically, giving the static capacity. The next load step was then applied.
Loading was controlled while examining a plot of the total load versus deflection at linearpot #1. For the linear portion of the load-deflection plot, load control was used to determine the sizeof load increments before changing to deflection control near the peak capacity. The first test on aspecimen was stopped shortly after the peak load had been reached to avoid excessive damage to thespecimen which could affect the second test. For specimens B through E, the second test on thespecimen was run to large deflections to examine the specimen ductility.
18

CHAPTER 3
TEST RESULTS
3.1. NOMENCLATURE FOR SPECIMEN TESTS
Eleven tests were conducted to failure on the six specimens, with the most significant resultspresented in this chapter and detailed results for each test in Appendices B, C, and D. As discussedin Chapter 2, each end of a specimen was tested separately, allowing two possible tests to failure oneach pier. Specimens were named with a letter as presented in Chapter 2. A specific test on aspecimen is denoted by placing a number after the name of the specimen, with the number indicatingthe time of that test. For instance, Pier B-1 refers to the first test on specimen B, while Pier B-2refers to the second test on specimen B, at the opposite end of the specimen.
The only specimen tested three times was specimen A2. This pier was first tested with theload head centered on the spreader beam, placing nearly equal loads on each end of the pier (test PierA2-1). This first loading was large enough to originate cracking, but did not cause failure. Thus,Pier A2-2 was the first loading to failure on specimen A2, and Pier A2-3 was the second loading tofailure on specimen A2.
3.2. TERMINOLOGY FOR DISCUSSING TEST RESULTS
Load Paths. The load applied at the bearing plates was directly transmitted to the columnby a compression strut in the pier cap. To maintain equilibrium at the base plate, a tension tie mustform at the top of the pier cap as shown in Figure 3.1.
Cracking Patterns. During testing of thespecimens, four distinct types of concrete distresswere observed. Their location and shape aredefined below for clarity in examining test results.
• Flexural Cracks. Flexural cracks were seenextending across the top of the pier, andsometimes extended down the face of thepier as shown as failure "A" in Figure 3.2.These cracks are what one would observeon the tension side of a reinforced concretebeam tested in bending. Figure 3.1
LOAD
COMPRESSION STRUT
Load Paths for the Pier Cap
• Flexure/Shear Cracks. These cracks wereobserved on the top and faces of the pier cap, shown as failure "B" in Figure 3.2. Theflexural component typically originated between the edges of a base plate, and thecomponent on the top of the pier cap only extended from the base plate to the edge of thepier. The cracks formed a small flexural component on the face of the pier (up to about 3inches long) before the crack sloped in towards the center of the pier. These cracks typicallygrew to extend across the depth of the pier cap.
19

A
B PLAN VIEW B TYPES OF CONCRETE DISTRESS:
C
ELEVATION VIEW
A • FLEXURAL CRACKSB· FLEXURE/SHEAR CRACKSC - SHEA R CRA CKD • CRUSHING
Figure 3.2 Patterns of Concrete Distress
• Shear Cracks. These inclined cracks formed on the faces of the pier cap as shown as failure"C" in Figure 3.2. The shear cracks were distinguished from flexure/shear cracks as they hadno flexural component when they initially formed. A crack that began as a pure shear crackwould often extend across the depth of the pier cap so that it eventually resembled aflexure/shear crack.
• Crushing. Crushing of concrete was located at the interface between the pier cap andcolumn, and is shown as failure "D" in Figure 3.2. The crushing was easily observed, withflaking of the concrete the first indication of failure followed by further spalling of theconcrete with additional loading.
3.3. SPECIMEN CAPACITY
A summary of steel reinforcing patterns used in the specimens is given in Table 3.1. Thespecimens static ultimate strengths and concrete cylinder strengths on the day of testing are listed inTable 3.2. The specimen strength refers to the resultant load on the end of the pier being tested, notthe total load applied to the spreader beam. Cylinder compressive strengths are the average of threecylinders unless noted. Also shown in Table 3.2 are the average capacities for the specimens, and the"effective concrete strength" for the specimens (effective fe). To calculate an average strength forthe A series specimens, test results for specimens Al and A2 are combined since pier cap reinforcingwas identical for the two specimens. The effective concrete strength presented in Table 3.2represents an average strength for a concrete pour, and is presented to remove the small variability inconcrete strength after prolonged curing. For tests run on specimens more than 35 days old, theeffective fe' is the average compressive strength of all cylinders tested after 35 days (the long termaverage strength from Chapter 2). Only specimen E was tested at less than 35 days, so the effectivefe' for specimen E was taken as the average of Pier E-l and Pier E-2 cylinders. All specimens exceptfor specimen E had essentially the same concrete strength, so only results for specimen E need to benormalized.
20

This smaller concrete strength at the time of testing specimen E was reflected in thecapacities for both tests on specimen E. It was expected that Specimen E would have a strength verysimilar to Specimen C since the two piers are almost identical. Reinforcement patterns for the twopiers differ only in that specimen C has a continuous loop in the top layer of the pier cap, whilespecimen E uses lapped hoops in the top layer as presented in Chapter 2. If the strength of specimenE is normalized to the effective concrete strength of specimen C by direct proportioning, its strengthis 296 kips (multiply 269 kips by 4016 psi/3651 psi). The normalized strength for specimen Ematches very well with the tested strength for specimens C, 299 kips.
Table 3.1 Summary ofSpecimen Reinforcement Patterns
Specimen Description
Al directly scaled from the standard detailI
A2 directly scaled from the standard detail
B straight #6 bars in the top layer of the pier cap
C all #3 bars in the top layer of the pier cap,continuous loop provides confinement
D minimal reinforcing, horizontal stirrups omitted
E all #3 bars in the top layer of the pier cap,lapped hoops provide confinement
Table 3.2 Specimen Capacities and Concrete Strengths
Test Static Cylinder Average Effective Age ofCapacity Strength Capacity fo' Concrete
(kips) (psi) (kips) (psi) (days)
Al-l 387 3961* 395 4050 83A2-2 368 3916 395 4050 51
I
I A2-3 430 4211* 395 4050 69
B-1 304 3930 323 4016 39
B-2 341 3869 323 4016 45C-l 299 4141 299 4016 85C-2 298 4100 299 4016 87D-l 203 4032 209 4016 53D-2 214 4021 209 4016 74E-l 258 3554 269 3651 23
E-2 279 3747 269 3651 30
*-only two cylznders tested
21

3.4. LOAD-DEFLECTION BEHAVIOR
The loading curve in Figure 3.3 was initially linear until cracking occurred, then gradualnonlinear behavior began with plastic behavior seen near the peak load. Cracking loads are shownon the graph, as well as sketches of cracking patterns on the east side of the pier with increasingloads. At point "B", cracking had just begun and consisted of small flexural, flexure/shear, and shearcracks. With cracking initiated, existing cracks continued to widen and lengthen, additional cracksformed, and crushing began as shown at point "C". At point "C", the compression strut was definedby the two inclined cracks, but crack widths were still less than 1/32 inch. Additional loads mainlyopened the inclined cracks defining the compression strut further, and caused additional crushing atthe pier cap/column interface. The failed specimen is shown in Figures 3.4 and 3.5 which show awell defined compression strut and evenly distributed flexural cracking on the top of the pier,respectively. At the peak load, the largest inclined crack was 3/16 inches wide, while flexural cracksbetween the two base plates remained minute. There was also extensive crushing at the cap/columninterface as shown in Figure 3.6. Loads marked on the specimen are the total load on the specimen,not the resultant load on the tested end of the pier.
..-- ---.l
V4- '-C. CR SHINGB GINS
l/
/ E-B. A STFLEXLRAlCRA KSEEN
I~ A. FIRST fLExURE! HEARA~P
I50
oo 0.05 0.1 0.15 0.2 0.25 0.3 0.35 0.4
DEFLECTION AT LINEAR POT 111 (INCHES)
450
400
~ 350
g 300
~ 250
!Z 200
~:J 150
~ 100
CRACK DIAGRAMS ARE DRAWN TO SCALE
LPMl ?
CRACKING ON THE EAST FACEOF SPECIMEN Al·l •
CRACKING ON THE EAST FACEOF SPECIMEN Al·l
POINT'B'RESULTANT LOAD =186 kips
POINT'C'RESULTANT LOAD =269 kips
Figure 3.3 Load-deflection behaviorfor Pier Al-l
22

Figure 3.4 Crack Distribution on the Face ofPier Al-l After Failure
Figure 3.5 Crack Distribution at the Top ofPier Al-l After Failure
23

Figure 3.6 Crushing ofPier Al-l After Failure
Plots of resultant load against the deflection at linear pot #1 for all specimens are shown inFigure 3.7. To reduce clutter, deflections for Pier A2-2 and A2-3 were omitted. Tip deflections inthe elastic region were very similar, showing minimal effect from the different reinforcing patternsused in the pier cap. This similarity was expected, as the initial stiffness of the overhang largely isproduced by the small span to depth ratio. Somewhat less stiff than the other piers were specimens D and E. Sincespecimen E had a smaller effective concrete strength, this reduced stiffness was expected. Specimen D was the leaststiff, reflecting the specimens minimal reinforcement, and the different behavior of Specimen D. Specimen Dshowed more of a flexural failure, with the bending action allowing more deformation than the compression strutsformed in the other specimens. The deflections at linear pot #2 on the underside of the overhang were essentiallythe same as linear pot #1 as shown in Figure 3.8.
Plots of resultant load against the deflection at linear pot #3, the "column line" deflection, areshown in Figure 3.9. Again, elastic behavior for the specimens was very similar because deflectiondepends on shearing of the end of the cap relative to the pier, or compression of the entire specimen.Deflections at linear pot #4 were consistent with those at linear pot #3, and are left in the appendix.
For all specimens, plots of resultant load against deflection for linear pots I through 4 areshown in appendix B. Deflections at the far tip of the pier were negligible, and are not presented.
24

PIER A1 1
~-"" -
/ PIER\B1&~ ••
~:::---
~.' ...-- It-PIER C1
~"[- -
fi-------
./ ...-...\---- ----
f.~ ....... ····r· PIER E1~~.... ' .....•....•
l····i/ PIER D1....,I PH1
1//-; ~~
.:.'r( I I I
l I r!
450
400
-en 350a.52....... 300Q«0 250...JI-Z 200~...J 150:::>enw
100c:
50
oo 0.05 0.1 0.15 0.2 0.25. 0.3 0.35
DEFLECTION AT LINEAR POT #1 (INCHES)
0.4
450
400
fj) 350a.~....... 300Q«0 250...JI-Z 200«~ 150:::>enw
100a:
50
PIER AH
~/ -
,0'·p ..............
••••• ••h ......... .................:;; PIER B2•...
~_..~ ...::::..-- ...- /'
vPIER E2....- ---~ / ;c'
........--- --....- ....."....... .......................
" \ .....
/h•... j I
.............l .' .,I-
...................... PIERC2•... PIER D2 ..........
1/ "••i ,'" 9LP #1'j .....
~~ L, I
~I,I ; I
oo 0.05 0.1 0.15 0.2 0.25 0.3 0.35
DEFLECTION AT LINEAR POT #1 (INCHES)
0.4
Figure 3.7 Comparison ofResultant Load vs. Deflection at Linear Pot #1
25

/PIER A-1
~/ -..r
/ PIER 81..~
~::::.--
FIER~•
." --._..~~~/~ 1-\--11--------
--==1. PIER E1 ------/I
II ........... r······t····PIER 01
--.........•..•
It.../~.: .~"JI . ~
161 hI
~ILP#21 I II
450
400........Cf) 3500..:::.:::::- 3000«0 250-JI-Z 200~-J 150~Cf)w
100a:
50
oa 0.05 0.1 0.15 0.2 0.25 0.3 0.35
DEFLECTION AT LINEAR POT #2 (INCHES)
0.4
Figure 3.8 Comparison ofResultant Load vs. Deflection at Linear Pot #2
26

450
400
-en 350n..~--- 3000
9 250I-z 200~:....J 150::Jenw 100II:
50
PIERA1-1
r 1-.PIER 81 J" .. /PIER C
(j~...-Iff: - -..- ",PIER E1-----U· '. LP#3/ ......~
.Jl.
ir PIER 01 U J'"~ I I
oo 0.05 0.1 0.15 0.2 0.25 0.3 0.35
DEFLECTION AT LINEAR POT #3 (INCHES)0.4
450
400
-en 3500-~--- 300Cl«0 250...JI-Z 200~:....J 150::Jenw
100II:
50
PIER 82 r zPIERA11
",~)t.·;'
t?1~ ~-~ ---... - ,PIER E2---.... -r1l. ........._.\::: PIER C2 --If----- ----- ..
!If-'. '-. ......
r"..............•.
............
}l 'PIER 02 .._-•..•.............. ... ~#3
I j I I, l I roo
Figure 3.9
0.05 0.1 0.15 0.2 0.25 0.3 0.35DEFLECTION AT LINEAR POT #3 (INCHES)
Comparison ofResultant Load vs. Deflection at Linear Pot #3
27
0.4

3.5. CRACKING LOADS
In general, cracking loads are subjective due to the variability in concrete tensile strength,and because cracks may not immediately be seen when they originate due to their minute size. Also,the load listed as the cracking load represents the range of load covered in the previous load step - 20to 30 kips. Since load steps were not uniform for all specimens, there is additional variability.
The loads at which different crack types were first observed are listed in Table 3.3. Thetable has been split into two groups to reflect the loading process. The first group in the table listscracking loads from the virgin test on the pier, while the second group gives cracking loads for thesecond tests on specimens. For the virgin test on the pier, the true cracking loads are obtained. Forthe second test on the opposite end of the specimen, the flexural cracking loads could have beenaffected by previously formed cracks. During the first test on a specimen, flexural cracks sometimespropagated to the opposite end of the pier. Thus, for the second test of the specimen, the existingflexural cracks could absorb deformations, delaying the onset of additional flexural cracking.Although the rate of formation of flexural cracks may have been effected, specimen failure modeswere not altered. Cracking loads for Pier A2-2 and Pier A2-3 are grouped with the virgin test resultssince their cracking loads were obtained by examining results from Pier A2-1, which equally loadedthe two ends of the pier cap.
Typically, flexural and flexure/shear cracks formed at about the same time, followed by theformation of shear cracks before crushing began. Specimens Al and A2 with #6 bars in the top layerhad the highest flexural cracking loads, indicating the larger bars could absorb tensile force with lessstrain than the #3 bars, reducing strain in the concrete. Specimen D allowed the earliest formation offlexural cracks, and also had the smallest stiffness as shown by the loading curves. Specimens C andD were identical except that Specimen D had no intermediate layers of horizontal stirrups. Thus, thelayers of horizontal stirrups (bars B) in Specimen C help to reduce deflections, limiting the formationof flexural cracks. For specimens other than specimen D, flexure shear cracks formed at almost thesame load, about 150 kips. This was expected, as all these specimens had the same distribution ofhorizontal stirrups (bars B). Crushing loads for specimens other than specimen D were reasonablyclose, indicating that the distribution of forces within the specimens was similar up until that point.After crushing began, specimens that could redistribute internal forces and put more tension in thetop layer of steel could add load, while those that could not redistribute loads failed with the onset ofcrushing.
Table 3.3 Specimen Cracking Loads
Crackinq Loads (kips)I Test Capacity Flexure Flexure Shear Crushing
ShearA1-1 387 186 154 154 269A2-2 368 167 145 205 297A2-3 430 174 150 112 205B-1 304 166 166 276 291C-1 299 99 153 168 2570-1 203 67 none 152 203E-1 258 118 152 224 258B-2 341 127 166 147 341C-2 298 124 124 105 2830-2 214 87 212 214 214E-2 279 159 140 125 261
28

There was considerable variability in cracking loads for a given specimen, but the largestvariability came in the comparison of shear cracking loads for a given specimen. For specimen B-1,the first shear crack was seen at 276 kips, while for specimen B-2 the first shear crack was seen at147 kips, a difference of 129 kips. This scatter in shear cracking loads is related to the definitionsused for classifying cracks. Since flexure/shear cracks often developed first and then added shearcomponents, it sometimes took much more load to develop an independent shear crack.
3.6. FAILURE MODES
The test specimens showed three basic failure modes. The most common failure, seen inspecimens A, C, and E, was caused by crushing of concrete in the compression strut and at thecap/column interface. Photos of Piers AI-I and C-l after failure are shown in Figure 3.10. Photos ofall the failed specimens are shown in Appendix C. For specimens A, C, and E, flexure/shear andshear cracks propagated across the depth of the pier cap and began to open with increasing load,limiting the size of the compression strut. Eventually, the force in the strut caused crushing at theinterface. With additional load, inclined cracks opened further and there was additional crushing atthe interface and in the strut.Eventually, crushing in the strut and atthe cap/column interface resulted infailure. For specimens Al and A2,there was considerable strength gainbetween the onset of crushing at theinterface and the ultimate load. Thisindicates that the strut rotated intowards the pier cap once crushingbegan. This new geometry requires alarger force in the tension steel in thetop layer of the pier to maintainequilibrium as shown in Figure 3.11.For specimens C and E, formation ofcracks was very similar to the Aspecimens. However, there was amuch smaller lag between firstcrushing at the interface and theultimate load. Since specimens C andE had much less reinforcing in the toplayer than specimens A, redistributionof the strut after crushing began waslimited.
Figure 3.10
29
Specimens Al-l and C-l at Failure

<tof roller
2-1/2"
straig"'"'-k._*- -+_+-...:bars
Figure 3.11 Development Lengthsfor Top LayerReinforcing in Specimen B
Specimen B showed a second failure mode. Specimen B initially performed like specimensAl and A2, developing inclined cracks on the face of the pier cap. These cracks continued to growacross the depth of the pier and widen as for the A series specimens. However, soon after the onsetof crushing the failure load was reached, indicating as for specimens C and E that additional tensileforce in the top layer of the pier cap could not be developed. The inability to develop additionaltension in the top layer of reinforcing was the root cause of the failure. Without the continuous loop(bar T) around the end of the pier, the specimen had to develop tension solely through the straightbars which had very small development lengths as shown in Figure 3.12. The lack of developmentlength became evident during testing, with bond distress in the top layer shown by the formation ofsplitting cracks on the top of the pier as shown in Figure 3.13. Aside from reducing the ability todevelop tension in the top layer, removal of the continuous loop around the top layer caused twomajor problems. First, a flexure/shear crack opened very wide at the face of the pier without anyreinforcement to limit its growth as shown in Figure 3.14. Second, when large deflections of the piercap were forced on test B-2, the base plate began to punch into the cap, pushing out the unconfinedconcrete around the circumference of the cap as shown in Figure 3.15.
IIII;
p
T1~1C1
T1<T2
T2
1. INITIAL FORCE DISTRIBUTION 2. COMPRESSION STRUT MOVESFURTHER INTO COLUMN
Figure 3.12 Redistribution ofInternal Forces in the Pier Cap
30

Figure 3.13 Splitting Cracks Due to Bond Distress in Specimen B
Figure 3.14 Opening ofFlexure/Shear for Pier B-2 - SpalledCover Removed
31

Figure 3.15 Punching ofthe Base Plate into Pier B2-2
Specimen D, with its minimal reinforcing behaved quite differently than the other specimenswith a cracking pattern shown in Figure 3.16. Flexural cracks formed initially, with long componentson the faces of the pier. In particular, a flexural crack formed at the interior edge of the base plate.For other specimens, inclined cracks formed near the point of load application, forming a definedcompression strut. For specimen D, however, the cracks in this region were almost verticalindicating minimal compression strut formation. With increasing loads, the flexural crack at theinterior edge of the base plate grew across the depth of the pier. This eliminated the area availablefor direct transfer of shear, but left a bearing surface at the top of the column to handle strut forces asshown in Figure 3.17. Therefore, in both tests on specimen D failure corresponded to the beginningof ,crushing at the cap/column interface since there was no possible redistribution of loads.Essentially, the specimen failed because flexural cracks opened so much that shear could not bedirectly transferred to the interior of the pier.
Figure 3.16 Crack Distribution on the Face ofPier D-l After Failure
32

SECTION A-A
COMPRESSIONSTRUT
'----~~A
Force Distribution in Specimen DAfterOpening of the Flexural Crack
FLEXURALCRACK
Inspection of specimens aftertesting showed two significant behaviorpatterns of concrete directly under thebase plates. First, there was onlyextremely minor cracking under the baseplates due to the confinement provided bythe base plate. Flexural cracks thatformed on the edge of the pier did notcontinue under the base plate, but stoppedat the edge of the base plate as shown inFigure 3.18. Second, punching of thebase plates into the top of the pier cap wasseen to some extent for all specimens, Figure 3.17with punching on Pier C-2 shown inFigure 3.18. The punching was magnifiedon the second tests on specimens, which were run to large deformations. Punching was greatest forspecimen B, followed by specimens E, C, A, and D. While specimens Al and A2 reached muchgreater loads than specimens B, E, and C, excellent confinement in the top layer for A seriesspecimens was provided by the #6 continuous loop (bar T) which minimized punching. Thepunching seen in specimens B, E, and C was certainly enlarged due to the presence of a large flexuralcrack at the interior edge of the base plate. Formation of this crack eliminated the confinementavailable from the underlying concrete along this edge. While the beginning of punching was seen,punching did not contribute to the failure of specimens and became most notable only when damageto the specimens was forced.
Figure 3.18 Cracking and Punching Under the Base Platefor Pier C-2
33

3.7. STRAIN GAGES
Strain gages were placed on the top layer reinforcing steel of specimens C and D aspresented in Chapter 2 and shown in Figure 3.19. Since gages were not under the base plates, thestrain readings describe a state of pure tension on the top of the pier cap. Because gages were placedat only one end of the pier cap, the end of the pier with the strain gages was loaded first. For thesecond test on the specimen, the strain gages were at the far end of the pier which saw minimal load.All strain gages were operable at the beginning of testing and up to the yield strain of the rebar.Mter yielding, some of the gages failed so readings for the failed gages are omitted. For the secondtest on a specimen, the accuracy of strain gage readings may have been reduced since gages hadundergone very large strains in the first test of the pier.
Pier C-l Strains. A plot of the resultant load (the load at the tested end of the cap) againstthe strain on gages 1 through 4 for Pier C-l is shown in Figure 3.20. The yield strain, 1,630microstrains, was obtained by dividing the experimentally obtained yield stress of 47.4 ksi by themodulus of elasticity, 29,000 ksi. The load-strain curve was linear up to the yield point, after whichpoint a plateau was essentially reached. Analysis of data showed that bars 2 and 3 began yielding ata resultant load of 186 kips and that all bars had completely yielded by a resultant load of 234 kips,much less than the specimen capacity of 299 kips. During yielding of the bars, there was no changein specimen load-deflection behavior and no significant change in crack formation. Crack formationduring yielding of the bars consisted of:
1. A 13 inch long shear crack on the east face of the cap.
2. Shear cracks with a combined length of 7 inches on the west face of the cap.
3. A flexural crack extending across the full width of the cap, about 6 inches south of the pierscenterline.
Crushing at the pier cap and column interface did not occur until a load of 257 kips, after the toplayer reinforcing had already yielded. Other strain gage data for Pier C-l is given in Appendix D.
2 -7 ~8 "8 -3/4 "3 ·7 'f~" 7·3/4 "I( I( )ll( ( )\
«of specim en]
1 8 " 15-1/2" 2"
even # QaQes - on bottomof rebarodd # Q a Q e 5 - 0 n to p 0 fre bar
Figure 3.19 Strain Gage Locations in Specimens C and D
34

300002500010000 15000 20000MICROSTRAINS (in/in)
5000
...~--r ~ 1"; __J 1-- ~ ~
l '" ......i ........--_.....
~::::.::::::;.=.=.;;:.-;;;t-..~+..~.:-.-- --a-:-L/" "GAGE 1
~fA ;
IIi'f. /. I,
:. i~:
,
GAGE3-!ii ,
:~' GAGE4-f ;~l ; j ~
Il j
II
L,!
! • I! !-GAGE2 I
i II f :
JI ! Ij :
~i-YIELD I1
jSTRAI~ r . , .
l : ~GAGES 1-4f
I :I
+i
i,. ...
j j ; I
oo
50
300
8:;g, 200Cl
C5~ 150z~5100ffia::
250
Figure 3.20 Resultant Load vs. Strain on Gages 1 - 4 for Pier C-l
Pier D-l Strains. A plot of resultant load versus the strain in gages 9 through 12 for Pier D1 is shown in Figure 3.21. Strain gages for Pier D-1 had a behavior similar to Pier C-1, with theload-strain curve linear up to yielding before reaching a plateau. There was a jump in strain betweenloads of 48 and 67 kips, corresponding to the formation of the first flexural crack across the top ofthe cap which ran between the sets of gages. Bar 1 yielded at a load of 129 kips, bar 3 yielded at 152kips, and bar 2 yielded between 152 and 173 kips. Again, yield loads were significantly lower thanthe pier capacity of 203 kips. For Pier D-1, there was a good correlation between yield in the barsand crack formation. Cracking forming during yield of the bars is described below.
1. The flexural crack at the interior edge of the base plate grew to extend across the depth of thepier cap on both faces of the specimen. Prior to yielding, the flexural component on the westface of the pier was 1 and 1/4 inches long, and there was no flexural component on the eastface of the pier.
2. A flexural crack extending across the width of the pier formed at the center of the pier cap.
3. The first shear crack formed and extended across the full depth of the west face of the piercap.
While significant cracking occurred during yielding of the bars, there was no change in loaddeflection behavior as bars yielded. Crushing occurred after the bars had yielded, and correspondedto the specimen capacity of 203 kips. Other strain gage data for Pier D-1 is given in appendix D.
Pier C-2 and Pier D-2 Strains. Plots of resultant load versus strain on gages 5 through 8 forPier C-2 and Pier D-2 are shown in Figure 3.22 and Figure 3.23, respectively. Strain gage readingsfor both tests were comparatively low, reaching a maximum of about one half the yield strain. Lowstrains were expected on the second test of a specimen since the resultant load nearest the straingages was low, about 50 kips. However, at these small loads strains in the rebar were significantly
35

300 -r---+-!---r---------r-----,-----~---__r----..,
250 f----t-------1------+-----t------+-----+-------t
3000025000
~ !
L,I
III
---~GAGES9·12.-
10000 15000 20000MICROSTRAINS (in/in)
5000
en GAG 100. \ /GAGE 11;g, 200 -.~""~.-4-.~.--l---_F~=9i----_l!150 ~p:~,·c:::::---···-·····:··-------7 ~ ;tl~ ! I GAGE 9 J. i I~ • I I,:5 100 : ,ill I 11 YIELD 1 • I ja: II i- STRAI~ ;! /- GAGE 12
50 I f.~~~
i j / I /Ol--+-----L.- ____L_---A-~___..%.J.......:.. __L._ ____L ____J
o
Figure 3.21 Resultant Load vs. Strain on Gages 9 - 12 for Pier D-1
!r-h I
I IL- I
G1GE6
GfGE5 I GAGE 7.. -- +- GAGES 5-6
i 1- -.l it ....' I .."fi " ........
\Jt. __ Jl
f.....•..,.. ,........ rl/i .. ........ STRAIN• j.' ~ :'~
ii /- -'~~.•../..·,;:GAGE 8'i ,.
;,! .~,/. .' /V.i / / .•...
.'. :t) /. ........
,t / .......~/"~
....,~ .......
•......
180016001400600 800 1000 1200MICROSTRAINS (in/in)
Resultant Load vs. Strain in Gages 5 - 8for Pier C-2
400
Figure 3.22
200oa
100
90
- 80en0.J2 70-0« 609
50!z~ 40:...J:J
30enwa:
20
10
36

!I~ !
I I1 i
I GAGES5-B
/GA<: E5 .t::! (;IE'"
"j j~ VII=I n-GAGES ...••.'\1' .--1
\ •...~>~~.•.-/ STRAIN......----.;t:. ............!I'e;.~\ '). V•.~z.... .......... ...- .............
lP :';'~~"",:,.
....- . \
/ ~ \GAGE7.~
k'';;:':.~~''''..".... ;
180016001400600 800 1000 1200MICROSTRAINS (in/in)
Resultant Load vs. Strain in Gages 5 - Bfor Pier D-2
400200
Figure 3.23
oo
100
90
'Cii' 80Co::z 70-CI< 609
50I-Z
~ 40:.-I::J 30enwa:
20
10
higher than in the first test on a specimen as shown in Table 3.4 which compares the average strainon all gages at a given load for the two tests on a specimen. For the first test on a specimen, theuncracked concrete carried tension at these small loads. However, for the second test on a specimenthe concrete at the strain gage location was already cracked so the steel had to absorb all the tension,resulting in the larger strains at a given load. Again, complete strain gage data for Pier C-2 and PierD-2 is given in appendix D.
Table 3.4 Comparison ofStrain for the First and Second Tests on a Specimen
Specimen Load Average(kips) Microstrain
C-l 58.8 155
C-2 58.0 408
D-l 47.5 81
D-2 43.1 801
37

38

CHAPTER 4
ANALYSIS OF RESULTS
4.1. INTRODUCTION
In this chapter, test results are summarized and the specimen capacities predicted by differentdesign methods are compared with test results. First, conventional design methods from the 1992AASHfO provisions and ACI 318-89 (ACI 1989) code are examined. The two design methods mostsuited to the problem geometry are the corbel and deep beam provisions from AASHfO Section8.16.6.8 and ACI 318-89 Chapter 11, respectively. Next, the strut and tie method is used to predict thepier cap strength using two strut and tie models. To demonstrate the use of the strut and tie method, asample design of a full size pier cap using this method is presented. The strut and tie method is alsoused to predict the strength of a typical pier cap design. Finally, criteria for judging constructed piercaps through field inspection are given. It should be noted that the above approaches for sizing a piercap and its reinforcing are all design methods. Thus, the use of these methods as analysis toolsrequires making some judgements to predict the specimen strength based on the actual reinforcementused. The analyses focused on specimens A and C because those two specimens are mostrepresentative of reinforcing that has been and would be used in the pier cap.
4.2. DISCUSSION OF TEST RESULTS
Specimen Average StaticCapacity (kips)
A 395B 323
C 299D 209
E 269
The ultimate strengths of the test specimens are shown in Table 4.1. Specimen capacity isdirectly related to the amount of horizontal reinforcing, which is needed to develop the action of a tiedarch. The effect of the amount of steel in the top layer of the pier cap is shown by a comparison ofspecimens A and C. Specimen A, with #6 bars in the top layer had a capacity Pu = 395 kips, whilespecimen C with #3 bars in the top layer had a capacityof Pu = 299 kips. The only difference in reinforcing forspecimens A and C is the size of the bars in the top layer. Table 4.1 Test Specimen Strengths
The ability to develop the strength of the bars in the toplayer ofthe cap is also critical. Specimen B is identical tospecimens A, except that in the top layer of the pier caponly straight #6 bars are used, resulting in very smallanchorage lengths. The small anchorage lengths providedfor the top bars of Pier B are inadequate to develop therequired bar force, as bond distress was observed duringtesting. The capacity of specimen B was 323 kips, muchless than specimen A capacity.
The quantity and anchorage of steel in the toplayer of the pier has a large influence on specimen strength, and the importance of the steel can beexplained considering specimen failure modes. As load was increased on a specimen, crushing at thepier cap/column interface eventually occurred. To carry more load, the compression strut has to movefurther into the column, requiring a larger tie force to maintain equilibrium. In specimens B, C, D, andE, the capacity ofthe bars in the top layer of the pier cap was limited, so failure was reached soon aftercrushing at the pier cap/column interface began.
39

The placement of the intennediate hoops (bars B) also has a considerable effect on specimenstrength as shown by a comparison of piers C and D. Piers C and D are identical except that bars B(and bars U) are removed from specimen D. Without the intennediate hoops, specimen D capacity wasonly 209 kips, as compared to 299 kips for specimen C. The mechanism by which bars B contribute tothe specimen capacity is not as clear as for the bars in the top layer of the pier cap. The intennediatehoops closest to the top of the pier see the largest force, so those bars act mainly as tension ties. Theintennediate hoops also can resist loads by dowel action.
Examination of the specimens shows that bearing failure did not limit the capacity of any ofthe specimens, although punching of the base plates was seen on all specimens. The conclusion thatbearing strength did not limit pier cap strength comes from a comparison of the concrete damage seenin the first and second tests on a specimen. For the first test on a specimen very limited punchingoccurred, while for the second test of a specimen in which large deformations were forced, moresignificant punching occurred. Thus, most of the punching occurs after a specimens capacity hasalready been reached. For specimens A, which had the greatest capacity, the average bearing stresssustained was 5.16 ksi, or 1.27 fe' (£,' = 4,050 psi). The bearing strength on top of the pier cap ishelped by the continuou~ rebar (bar T) around the perimeter of the cap, which provides confinement.The bearing stress, fh, sustained can be compared to the load factor design provisions for bearing ofAASHTO section 8.16 with the d> factor removed.
FromAASHTO (1992):
where
f, 0.85 f<, ~~ ~ ultimate bearing stress
f e• = 4,050 psi
Ai = base plate area = 76.56 in2
A2 surrounding concrete area = 187.7 as a maximum
so
f b = 1.33 f e•
(4.1)
When the <I> factor is not applied to code provisions, the code specified ultimate bearing stress andlargest tested bearing stress agree, 1.33 fe' and 1.27 fe', respectively. Since the applied bearing stresswas slightly less than the code value, and bearing failure did not occur, no conclusions can be reachedregarding the maximum permissible bearing stress. Further testing needs to be conducted to determinethe bearing strength at the top ofthe pier caps.
40

4.3. CORBEL ANALYSIS
The pier cap geometry studied looksquite similar to a corbel, so the corbelprovisions were the first application ofconventional analysis to predict specimencapacity. The action of a corbel as used inthe 1992 AASHTO code is shown in Figure4.1. The corbel design technique is intendedfor span to depth ratios less than one, whereordinary flexural theory is not applicable(Salmon 1985, ACI 1989). In the AASHTO(1992) corbel code provisions, the shearstrength comes entirely from shear friction.
d
Forces contributed byhorizontal stirrups orties are neglected.
Force Distribution Assumed in CorbelCode Provisions (Salmon 1985)
The AASHTO (1992) code procedure Figure 4.1gives an area of steel in the top layer of thecorbel based on two checks. The first checkconsiders shear, while the second checkconsiders moment. The intennediate stirrups are sized based on the amount of steel in the top layer ofthe corbel. For the pier cap geometry chosen, the check based on shear controls because the moment isextremely small. Using the AASHTO (1992) code as an analysis method gives:
(4.2)1.5 Av f y u, the nominal shear strength ::;:; 0.2 f c,bd and [800 psi}bd
where
Av the area ofsteel in the top layer ofthe corbel
[bars A and T in the specimen]
J1 = coefficient offriction for normal weight concrete cast monolitically 1.4
b = the corbel width
d = depth ofreinforcing shown in Figure 4.1
The multiplier of 1.5 reflects the benefit of the additional layers of stirrups. A comparison of corbeldesign strengths and the test results for specimens A and C is shown in Table 4.2. For specimen A, thelimiting shear strength controlled the corbel design strength. As the results show, the corbel provisionsare inadequate to predict pier cap strength because they only consider shear friction to resist appliedloads and ignore the inclination of the compression block.
41

Table 4.2 Test Specimen Capacity Compared to the Strength Predicted by Conventional DesignMethods
CorbelSpecimen Average Test Corbel Design Deep Beam Parameters
Capacity Strength Strength (kips)(kips) (kips) Ay fy
(in2) (ksi)
A 395 151 95 2.2 60
C 299 55 95 0.55 47.4
4.4. DEEP BEAM ANALYSIS
The deep beam provisions in the ACI 318-89 code also appear applicable to the pier capdesign. These provisions reflect the different behavior and capacity of beams with span to depth ratiosless than five (Salmon 1985, ACI 1989). The deep beam provisions follow the same basic approachused to find the shear strength of a regular beam, with the concrete and stirrups both contributing to theshear resistance as shown in Equation 4.3.
Vn = Vc + Vs ~ 8~fc,bwd
where
V c = shear strength from concrete
V s = shear strength from steel stirrups
(4.3)
For the deep beam provisions, the Vctenn includes the effect of the ratio MuNuat the critical section.Also, the Vs tenn considers the contribution of horizontal stirrups to the shear resistance. Using thedeep beam provisions for specimens A and C, the upper limit on shear strength controlled. The designcapacity for both specimens was 95 kips, much less than the test capacity given in Table 4.2. Thus,the deep beam provisions are also inadequate for the design of the pier cap region.
4.5. THE STRUT AND TIE DESIGN METHOD
4.5.1. Introduction
Obviously, traditional design procedures for shear in the 1992 AASHTO and ACI 318-89codes are inadequate to realistically predict the strength of the pier caps tested. The load carryingcapacity of the pier cap comes from direct compression of an inclined strut, and this action is notexplicitly covered in the 1992 AASHTO provisions or the ACI 318-89 code. The inadequacy ofnonnal design codes is not limited to the pier cap studied, but also to other abnormal regions ofstructures where plane strain conditions do not exist (Bergmeister et. al. 1990, ScWaich et. al. 1987).In contrast, the strut and tie method is well suited to the design of abnormal geometries because themethod simplifies the behavior of an indeterminate region into discrete load carrying members(ScWaich 1987). Essentially, the strut and tie method is a more general application of the classicaltruss analogy used for beams. The method is also similar to the tension field concept for the shear
42

strength of steel plate girders. The strut and tie method is used to break a structure into a static forcesystem composed ofthree elements (Bergmeister 1990):
1. compression struts
2. tension ties
3. nodes
Some examples of strut and tie models are shown in Figure 4.2. The strut and tie model essentiallyforms a truss to resist loads applied to the structure. As in a truss, forces are uniaxial and changedirection only at the nodes. One of the benefits of using a strut and tie model is a better understandingof the distribution of forces within the structure, allowing the engineer to more successfully detailreinforcing.
a MOMENT OPENING CORNER
d. DEEP BEAM
c. CORBEL
~
Figure 4.2 Examples ofStrut and Tie Models (from Schlaich 1987)
A detailed discussion of the theory behind the strut and tie method is beyond the scope of thisresearch. However, the most important concepts relevant to the pier cap design are covered. Anexcellent summary of the strut and tie method in general is given by Anderson (1988), and a thoroughbackground of the design concept is given by Schlaich (1987). Finally, a summary of the state of theart of the strut and tie method and tests on strut and tie elements is given by Bergmeister et. al. (1990)from which stress limits for the concrete are chosen.
4.5.2. Major Assumptions of the Strut and Tie Method
Perhaps the most important consideration in examining the use of a strut and tie model fordesign is its adherence to the lower bound theorem. The lower bound theorem states that a loadcarrying system based on a statically allowable stress field which does not go beyond the yielded stateis a lower bound to the limit load (Bergmeister 1990, Yura 1992). As a condition of this theorem, the
43

statically allowable stress field must satisfy equilibrium and boundary conditions (Bergmeister 1990,Yura 1992). The use of a lower bound method is well suited to concrete, as concrete has little abilityto undergo plastic deformations. Thus, the strut and tie model should be chosen so that thedeformation capacity of the concrete is not exceeded before the structure reaches its assumed state(Schlaich 1987). To meet this condition, Schlaich (1987) suggests the strut and tie model should beoriented based on elastic stress fields. Therefore, a strut and tie model based on elastic stress fieldsrepresents a lower bound solution, and will give conservative results so long as sudden failures due toinstability or localized crushing are prevented (Bergmeister 1990).
In applying the strut and tie model, five major assumptions are made (Bergmeister 1990,Anderson 1988):
1. Failure coincides with the formation of a mechanism caused by yielding of one or more of theties.
2. Concrete does not crush prior to yielding of the ties. The crushing is prevented by limitingstress in the concrete.
3. Forces in the struts and ties are uniaxial.
4. All external loads are applied to nodes of the strut and tie model. When distributed loads exist,the model must realistically fit the applied loading.
5. Reinforcement is detailed so bond and anchorage failures are prevented.
4.5.3. Creation of a Strut and Tie Model
To apply the strut and tie model to a structure, Schlaich (1987) proposed breaking a structureup into "B" and "D" regions as shown in Figure 4.3. The B regions adhere to Bernoulli's assumption ofplane strain, so internal forces for these regions are known. The D regions consider discontinuities inthe structure where the distribution of strain is extremely non-linear (Schlaich 1987) such as the piercap studied. The design of B regions is very well documented, so the use of the strut and tie model istypically applied to D region design.
a. GEOMETRIC DISCONTINUITIES
b. STATIC AND/OR GEOMETRIC DISCONTINUmES
Figure 4.3 Band D Regions (Shaded) ofa Structure (from Schlaich 1987)
44

Once the B and D regions are identified, the strut and tie models for the D regions can beformulated. Schlaich (1987) gives two main techniques for finding the layout of struts and ties in amodel. In the first method, a finite element analysis of the D region can be made to detennine thedistribution and orientation of principal stresses in the region. The struts and ties can then be alignedwith the axes of the corresponding principal stress fields (Schlaich 1987). The second method, the"load path method", can be used to determine the strut and tie model if an elastic analysis is notpossible, or if the internal distribution of forces is evident. For the load path method, all sectionalforces, loads, and reactions acting on the boundaries of the D region are found. Using the stresses onthe cross section as boundary conditions, stress distributions on one side of the D region are connectedwith their corresponding boundary conditions on the other side of the D region as shown in Figure 4.4.The struts and ties should be oriented at the centroids of the respective stress diagrams. With the mainload paths arranged, additional struts and ties are added to allow equilibrium at the nodes (ScWaich1987).
LOADPATH
t
I II I
II1
~II
./ \\i
/,\
~- •t
Figure 4.4 Use ofthe Load Path Method to form a Strut and Tie Model (from Schlaich 1987)
a. GOOD MODEL
(J
Finally, the quality of thestrut and tie model can be judgedrealizing that loads in a structurefollow the path of least resistance.As ScWaich notes (1987), the tiesare much more deformable thanthe struts, so the model with theleast ties is best by an energycriterion. An example of thisconcept is shown in Figure 4.5.
// \
b. BAD MODEL
C1
Figure 4.5
45
The Good Strut and Tie Model has ShorterTies Than the BadModel (from Schlaich 1987)

4.5.4. Individual Elements of the Strut and Tie Model
4.5.4.1. Ties.Ties are tension carrying elements and in the pier cap can consist of reinforcing steel or
concrete carrying tension. In this research, only reinforcing steel was considered. The strengthavailable to a tie is taken as the yield capacity ofthe bars:
T = Asfy
where
As = the area ofsteel in the tension tie
f y = the yield stress ofthe steel
(4.4)
The strength check for the tension ties is very straightforward, but there are several other concerns.First, following the major assumptions of the strut and tie method, the main reinforcement should yieldat the ultimate load. To allow a ductile failure, the bars must be able to undergo plastic deformationsbefore crushing of the concrete begins (Bergmeister 1990). Second, the bars must be able to developthe required strength at the node location. This condition means that the bars must have adequateanchorage behind the node. Also, tension steel should be evenly distributed over the full width of thetension tie. Finally, consideration should be given to crack control under service loads.
4.5.4.2. Struts.Struts are compression carrying elements and consist of concrete and compression steel that
does not buckle. Three basic concrete compression struts are available as shown in Figure 4.6(Schlaich 1987). The models proposed for the pier cap use only the prismatic compression strut(Figure 4.6.c).
c. PRISM
-!-~-!--!--!-
tttttO'~ fed
Figure 4.6 The Three Compression Struts (a) The Fan (b) The Bottle (c) The Prism(from Schlaich 1987)
46

vfe'
The allowable load in the strut is the sum ofthe contributions from the steel and concrete:
C = Cs + Ce
where
Ce = Aefed = compression in the concrete
Cs = Asfs = compression in the steel
where
Ac = area ofthe strut
fed = design stress in concrete
v = concrete efficiencyfactor
f s = stress in steel
(4.5)
(4.6)
The concrete efficiency factor accounts for the different strength of concrete in the structure ascompared to the strength measured by cylinder compression tests. As presented by Bergmeister(1990), the efficiency factor accounts for conditions in the structure such as:
• a multiaxial state of stress
• cracking
• disturbances caused by reinforcing steel
• aggregate interlock
The efficiency factors are different for different types of struts. For undisturbed struts a largerefficiency factor is used, while ifcracks interrupt the strut, a smaller efficiency factor is used (Schlaich1987). Essentially, all struts in the proposed model are not interrupted by skew cracking. Thus, forthe prismatic compression fields used, Bergmeister (1990) suggests using the following concreteefficiency factors:
v = 0.8for f e. ~ 4,000 psi
v = 0.9 - 0.25 fe' for4,000 < fe' < 10,000psi10,000
v = 0.65 for f e. ~ 10,000 psiSince concrete strength was 4,000 psi for specimens A and C, u is taken as 0.8 for the strut and tiemodels considered.
It is important to consider compatibility when examining concrete struts. Large compressivestresses in concrete struts give rise to transverse tensile stresses which can cause cracking and loss ofcapacity. Thus, it may be necessary to refine a model so transverse tensile forces are considered asshown in Figure 4.7 (Schlaich 1987).
47
t
. ../ \ei ,
) T Ie! l\ /
\ ..
STRUT AND TIE MODEL
Strut and Tie Model ConsideringTransverse Tensile Stresses (fromSchlaich 1987)
STRESS FIELDS
Figure 4.7
1. The lines of action at the centroid ofthe ties, struts, and extemalloads must coincide.
2. The widths and relative angles of the struts and ties limit the dimensions of the sides of thenodes.
4.5.4.3. Nodes.Nodes are the points in a strut and tie
model where truss forces change direction.Nodes combine three truss elements, so theyare classified as either CCC, CCT, CIT, orTIT nodes based on the forces in the trussmembers they connect (Schlaich 1987). Forexample, a CCT node is the intersection oftwo compression struts and a tension tie.Nodes can be further classified as singular orsmeared (Schlaich 1987). The modelspresented consider singular nodes, where theintersection of forces occurs in a small areaaround the theoretical node location (Schlaich1987). Bergmeister (1990) gives twoconsiderations for dimensioning the nodes:
Obviously, the dimensions chosen for the nodes will affect the strength check for the nodes. Since thestrength checks for nodes are not well defined, adherence to the above two recommendations todimension nodes is probably adequate. The two node types used in the proposed strut and tie modelsare CCC and CCT nodes.
CCC Node with Unequal Pressure(from Barton 1988)
Figure 4.8
CCC Nodes. An example of a CCC node is shown in Figure 4.8. The ideal condition for aCCC node is a "hydrostatic" state of stress (Schlaich 1987). In a CCC node, a hydrostatic stress stateis achieved when all stresses on the faces of the node are equal, and when node faces are perpendicularto their corresponding stress fields(Bergmeister 1990). An example of a CCCnode in a hydrostatic state of stress is shownin Figure 4.9. In a hydrostatic stress state,both principal stresses in the node are equal tothe boundary stress (Bergmeister 1990).Thus, since all boundary stresses must bewithin allowable limits, the stresses in thenode are also within allowed limits. If ahydrostatic stress state at the node does notexist, Schlaich (1987) suggests two conditionsthat should be met for the node strength to beconsidered satisfactory. First, nodes that havea ratio of stress on adjacent sides not less than0.5 are probably satisfactory. Second,boundary stresses on the faces of a nodeshould all be within their respective limits.
48

base plate/
CCC Node Under HydrostaticStress (adapted from Anderson1988)
--interior edge ofbase platet
P
wP
w
wT - n db+ (n-1) sn - # of reinforcing bar layerss - clear bar spacing
we =wP sin' + wT cos •
CCT Node With Multiple Layers ofReinforcing (from Bergmeister1990)
w
Figure 4.9
Figure 4.10
CCT Nodes. The geometry ofa CCTnode which will be used in the proposed strutand tie models (sections 4.6 and 4.7) is shownin Figure 4.10. For the CCT node shown inFigure 4.10, the geometric constraints of thebase plate width and the tension tie widthdefine the strut width. For this CCT nodemodel, the tie width (wT) is taken as the out toout dimensions ofthe rebar as shown in Figure4.10. When there is only one layer of tensionsteel, the tie width is taken as the bar diameter.A summary of other techniques to find thewidth of the tie based on stress fields ispresented by Anderson (1988). At this node,bearing stress, stress in the strut, andanchorage are checked independently using thegeometry of Figure 4.10. Bearing andanchorage can both be checked using the 1992AASHTO provisions. For the CCT node,anchorage of the bars is essential and mayrequire hooks or loop anchorage. Bergmeister(1990) states that anchorage begins where thecompression struts meet the bar as shown inFigure 4.10. Conservatively, developmentlength can be taken as beginning at the interioredge of the base plate. For the compressionstrut at the CCT node, Bergmeister (1990)suggests using a concrete efficiency factorbased on tests of CCT nodes by Bouadi(1989). For the strut at the CCT node shownin Figure 4.10, the recommended efficiencyfactor is the same as that presented earlier forprismatic compression struts (u=0.8). As afinal note, Bouadi's tests on CCT nodesshowed that the use of vertical hooks crossingthe compression strut may decrease the overallcapacity of the strut by about five percent.This possible loss of strength is very smallcompared to the overall uncertainty of the nodeand model design (Bergmeister 1990, Bouadi1989).
4.6. STRUT AND TIE MODEL 1
4.6.1. Geometry and Assumptions of Model 1
The layout of the first strut and tie model for the piers was determined using the results of a
plane stress finite element analysis and the cracking patterns observed during testing. The finite
49

element program used was ANSYS. The finite element mesh is shown in Figure 4.11. Eight node
elements were used for the pier cap and column, while four node elements were used for the base plate.
To simulate loads from the roller, a pressure loading of 10 ksi was applied on two of the base plate
elements (total width = 1.46") as shown in Figure 4.12. Contour plots of principal tensile and
compressive stresses in the pier from the finite element analysis are shown in Figures 4.13 and 4.14,
respectively. The contour plots show that load is carried by a compression field that is nearly vertical,
with a tension field concentrated at the top ofthe pier to maintain equilibrium at the loading point. The
stress fields of the finite element analysis agreed with the general patterns of concrete distress observed
on the piers as shown in Figure 4.15.
PRESSURE LOADING
IIlllI I I II I I I I
ELEMENTS
- PIER CAP
SEPLATE
MN
4NODEELEME /BA
-8NODE
COLU
Figure 4.11 Mesh Usedfor the Finite ElementAnalysis
Figure 4.12 LoadingApplied to the FiniteElement Model
50

Figure 4.13
OHSiS 4,401I~! 11 199321:11:58PLOT 1«), 1POST! STRESSSTEP:!llEll:ISIGl (OUG)DIlX :B.01893SHlIlJ=-1.895SMJ( =1.18St1J(]}=1. 9G
ZU :!D[S1=17 ,05Xl' :11.89!F =15,5
G9,1971449,395488G,593232G,1909168,980121.1861.3041.502U8
I.:.p~i_nc....:iJ 'al_t.n_s_io_n '~
Contour ofPrincipal Tensile Stresses
ntiSYS 4,401lillY 11199321:18:24PLOT 110, 2POST! STRESSSTEP=!ITEll:ISIG3 (OUG)DMI( :B.01893SMN :-5,163SMlIlJ:-1.349SI1XB:8,341454
ZU :1DIST:11,B5Xl' :11.B9YF :15,5• -5,163• -5,122Ii!!ijjl -4.482I'lE] -3,042[IZl -3,291I'lE] -2,561I'lE] -1.921
[ili!ili] :ij:mmIllillilG
Figure 4.14
principal conpl'ession
ContourofPrincipalCompres~veStresses
51

Figure 4.15 Failure Pattern for a Typical Specimen
Inspection ofthe contour plots shows that the load on the finite element model was applied at asmall eccentricity relative to the edge of the column. This eccentricity of the load is not apparent whenexamining a profile view ofthe pier cap. However, by taking a slice through the piers longitudinal axisthe shear span can be observed as shown in Figure 4.16. Slice "A" represents the largest shear spanfor the applied loading, so this shear span was used for the finite element analysis to examine thegreatest inclination ofthe load path.
7-1/4"
<t OF ROLLER -+--+--+----1--1-1
7-1/4"
6-3/4
PlAN VIEW OF TOP OF PIERCAP
load applied at the middleof the base plate
shear spana -1.47"
PROFILE AT SECTION A-A
Figure 4.16 Shear Span Modelled in the Finite Element Analysis
52

The layout ofmembers and nodes of strut and tie Model 1 is shown in Figure 4.17. The heavycompression strut is modelled with a "bottle" strut which provides an indication of transverse tensileforces. The net compression load carried by the bottle strut is Cl, and the angle of inclination of thisstrut is e. At nodes 1 and 2 struts C2 are separated by an angle 2*4>, with the angle 4> termed the"diffusion" angle for the strut. The strut diffusion angle defines the slope at which compression forcesspread from under the base plate (Bergmeister 1990). Bergmeister (1990) suggests that the diffusionangle can be found using Equation 4.7. The compression field width in Equation 4.7 is not the same asa strut width, but represents an outer boundary to the compressive stress field under the base plate.The value for 'hI is determined considering the physical boundaries of the structure as shown in Figure4.18. The limit on the distance 'n' in Figure 4.18 is found where a 45° line starting at the centerline ofthe base plate intersects the edge ofthe structure. The value of'h' is the smaller ofm and 2*n. For thepier studied, the compression field width, h, is the depth of the pier cap (14.5") as shown in Figure4.17.
diffusion angle ¢ 123
Jf(4.7)
where
w bearing plate width
h compression field width
m
p
tI
reaction
base plate .......-----i-----.
-STRUT-TIE
TOTAL COMPRESSIONLOAD IN STRUT IS C1
~= 90-6
C1 =2* C3
BOTILENECK DETAIL
h
Figure 4.17 Configuration of Strut and TieModell
Figure 4.18 Determination oftheCompression Field Width
53

P
t
Several analyses of Specimens A and C were made using Model 1 (reinforcing is described insection 2.2.2). The steps for conducting the analyses are given below.
1. Beginning at node 1, the force in the main tension tie (1'1) was assumed.
2. The angle of inclination, e, ofthe main compression strut (CI) was assumed.
3. Using the force 1'1 and angle of inclination from steps 1 and 2, all forces in the strut and tieThe centroid of compression strut C5 was then found, considering that the maximum concretestrain is located at the edge ofthe column. The centroid location is shown in Figure 4.19.
4. The centroid location computed in step 4 was then compared to the centroid location predictedby the angle of inclination assumed in step 2. If the two locations agreed, the system was inequilibrium. If the centroids did notmatch, the procedure returned to step 2,and further iterations were made asneeded.
When choosing the force in 1'1 in step I above, thetie forces were always assumed less than or equalto the yield capacity of the existing steel. For 1'1,the corresponding rebar in the specimen is bars Aand 1'. For Piers A the tie capacity was 132 kips,while for Pier C the tie capacity was only 26.1.Both tie capacities are based on using the full yieldstrength ofthe bar as determined by tensile tests.
To find the centroid of compression strutC5 in step 4 above, compression carried by thecolumn steel was considered. The inclusion ofcompression steel to the force in C5 meant that atransformed area approach had to be used to findthe centroid of strut C5. Since column steelcompression strains were not measured duringtests, three compression forces from the steel, C5 ,
were considered:
1. Cs = o.
A STRUTC{ A
)1 x '<PROFILE OF PIER CAP
I /CENTROID LOCATION
AREA OF COMPRESSIONSTRUTI-------i'n
xSECTION A-A
Figure 4.19 Centroid Location for the ColumnCompression Strut
2. Cs = 58 kips. This force was determined using compatibility between the steel and concrete.The concrete deforms under load, so the compression steel is subjected to the same strains asthe concrete. Knowing the maximum stress allowed in the concrete, the steel stress wascomputed as shown below:
54

given
o-emax = V fe" allowable concrete stress = 3.2 ksi
Ee = 57~fe' [ksi] byACI 318-89, conrete modulus
(4.8)
Ec 0-emax , strain in concreteEe
Ee, strain in steel
so f s = E So = 25 ksi = stress in steel
Only the column steel around the periphery of the circular end of the column as shown inFigure 4.20, was considered to contribute to the strength of strut C5. All six bars in Figure4.20 were used to find the force in the compression steel, as the bars fell within the main stressfield for strut C5. Thus, the force in the compression steel is:
(4.9)
bar 3
bar4
Figure 4.20 Layout ojCompression Steel at the Edge ojthe Column
3. Cs = 119 kips. This force was determined considering the design of columns under pure axialload. Under pure axial load, the full yield capacity of the compression steel is used to find thecolumn capacity (Salmon 1985, ACI 1989). Considering that the main compression field ofthe finite element analysis is concentrated close to the edge of the column, only bars 2 through5 of Figure 4.20 were assumed to yield. Bars 1 and 6 were assumed to have a compatibilityforce as assumed in part 2 above. Thus, the total compression is:
55
119 kips (4.10)

Both of the compression forces used above are arbitrary, but allow a reasonable approach to accountfor the column compression steel.
When examining results from the strut and tie analyses, the force in strut C1 was checked toinsure the validity of the model. The force allowed in C1 was calculated in accordance with the CCTnode geometry of Figure 4.10, with the concrete efficiency factor as presented earlier. Thus, the limiton C1 is shown in Equation 4.11. Since concrete strength was very close for specimens A and C, avalue of 4,000 psi was used for fe'.
C = AcFc
where
j c allowable stress = 0.8 j c'
Ac = bw
b = thickness ojpier cap, 14.5"
w = strut width based on Figure 4.10
(4.11)
4.6.2. Analysis Results from Strut and Tie Modell
The analysis results using Modell with several different combinations ofT1 and Cs are shownin Table 4.3. Only the analyses satisfying allowable stresses for C1 and T1 are presented. Forspecimen C, the model with Cs=1l9 kips is not listed as the column bars that were assumed to haveyielded did not fit within the calculated compression field. The results from tests on Specimens A andC are summarized in Table 4.4. Physically, the analysis models agree with the test results as the anglesof strut C1 inclination for the strut and tie models are close to the observed cracking patterns. For PierA, the loads predicted by the strut and tie analyses agreed very well with test results. For Pier C,however, the strut and tie model was extremely conservative, predicting less than half the testedcapacity. The strut and tie results for Pier C showed better correlation to the load at which reinforcingin the top layer yielded during testing, about 200 to 217 kips. It is reasonable that the strut and tiemodel is more accurate in predicting the specimen yield load, because the strut and tie method assumesfailure occurs with yielding in the ties as discussed in section 4.5.2. The discrepancy between Modellstrength predictions and the tested specimen capacities can be accounted for by load carryingcomponents other than the tie/arch action accounted for in the strut and tie model. Additional strengthmay come from dowel action, aggregate interlock, and shear transfer in the uncracked concrete(Salmon 1985).
The compression steel force assumed in strut C5 had a significant impact on results ofthe strutand tie analyses. There was a direct correlation between Cs and the predicted pier capacity, with thepier capacity rising with larger Cs values. This trend can be explained by looking at the inclination ofstrut C1. As the force in the compression steel rises, the centroid of C5 moves closer to the edge of thecolumn, increasing the angle of inclination of strut C1. For a larger angle of inclination, the verticalcomponent of the main strut increases, enlarging the predicted specimen capacity. The extent of thisincrease in capacity is limited by the allowable compression stress in the main compression strut, andthe capacity ofthe tension tie T1.
56

Table 43 Specimen Capacity and Member Forces for Strut and Tie Modell
Pier A Pier C
Analvsis 1-1 1-2 1-3 1-4 1-5Capacity, P 311 344 373 132 159
ratio oftheorv/test 0.79 0.87 0.94 0.44 0.53
Inclination, e1 67.0 69.0 70.5 78.8 80.7
Compression in Steel 0 58 119 0 58T1 132 132 132 26.1 26.1
T2, horizontal 44.3 49.0 53.1 18.8 22.7
T2,vertical 18.8 18.8 18.8 3.7 3.7
Forces C1 338 368 395 134 162
(kips) C2 176 191 206 69.9 84.0
C3 169 184 198 67.2 80.8
C4 132 132 132 26.1 26.1
C5 311 344 373 132 159
Centroid 4.68 4.35 4.09 2.52 2.11
Table 4.4Tested Capacitiesfor Pier A and Pier C
Pier A Pier C
Average Capacity 395 299Average Inclination ofMain Strut Cracks 66° 75°
Test 1 Capacity (kips) 368 298Test 2 Capacity (kips) 387 299Test 3 Capacity (kips) 430 -
Limitations on the ComponentsofT2 Based on Reinforcing inh 1'< St e est )peClmens
Pier A Pier C
Maximum T2 19.8 kips 15.6 kipsHorizontal
Maximum T2 6.6 kips 5.2 kipsVertical
The difficulty of using a strut and tie model as an analysis tool can be seen by considering tieT2. The horizontal and vertical components of T2 are listed in Table 4.3 because those componentsmatch the orientation of stirrups (bars B and S) in the pier cap. Considering the layout of reinforcingin the test specimens, the limits for the components ofT2 are given in Table 4.5. For both Piers A andC, the strut and tie analysis predicts larger forcesthan the stirrups can handle. However, the Table 4.5magnitude of T2 depends greatly on the diffusionangle, which is only generally known. Also, tensionin the concrete has not been considered. Because ofthe uncertainty of the magnitude of transversetensile forces, the inadequacy of stirrups aspredicted by the strut and tie model was ignoredbecause all the analysis results were conservative.When examining member forces from an assumedmodel, the allowed stresses on T1 and C1 were
57

used to judge the validity of the analysis as Tl and Cl are the most critical load carrying componentsof the model.
4.7. STRUT AND TIE MODEL 2
The second strut and tie model was created to increase the predicted capacity for Pier C, and isshown in Figure 4.21. Model 2 follows the main stress fields of the finite element analysis, butconsiders the restraint ofthe horizontal stirrups individually. For Pier C, the forces in the intermediatestirrups (T2-T4) were chosen as the yield capacity of the bars to give the maximum benefit of each tie.While this assumption gave the best results for the model, it is not certain that all of the ties across thepier cap depth yielded. The assumption that all the intermediate stirrups yielded is consistent with alinear distribution of strain across the depth of the pier cap. At the ultimate load for specimen C, themaximum crack size at the top of the pier was approximately 1/16", and the average strain in the toplayer reinforcing steel was about 12,000 microstrains. Since cracking extended across the full depth ofthe pier at the peak load and strain at the top layer was very large, it is probable that at least two layersof the intermediate stirrups yielded in specimen C. For Pier A, the force was found by assuming alinear distribution of strain across the pier cap height, with the maximum strain found in the top layerof reinforcing.
Figure 4.21
I Inode 1
T1 C1 is...e1
T2 .-node2C2!
.1__ node3T3 C3!
I_node 4T4 l
C4l~B4-----------------------f
< C5 /I~node 5 p
C6
Ay
Configuration ofStrut and Tie Model 2
-----·STRUT-TIE
~ =90 -64
The capacities and member forces for Specimens A and C as predicted by Model 2 are givenin Table 4.6. The second model did predict a greater capacity for Pier C, but the analysis results werestill much less than the tested capacity. Model 2 predicts a greater load than Model 1 for an assumedTl and Cs . This increased strength occurs because the second model has a larger angle of inclination atnode 1, increasing the vertical component of strut C1. In Model 2, the centroid of the compressionstrut was located further in the column than for Model 1 because the compression strut changesinclination at each horizontal stirrup.
58

Table 4 6 Specimen Capacity andlvfember Forces for Strut and Tie Model 2
Pier A Pier C
Analysis 2-1 2-2 2-3 2-4 2-5
Capacity, P 319 353 171 198 236
ratio oftheory/test 0.81 0.89 0.57 0.66 0.79
Theta 1 67.5 69.5 81.3 82.5 83.7Compression in Steel 0 58 0 58 119
T1 132 132 26.1 26.1 26.1
T2 10.2 10.2 10.4 10.4 10.4
T3 7.3 7.3 10.4 10.4 10.4
T4 4.3 4.3 10.4 10.4 10.4
Forces Cl 345 377 173 200 238
(kips) C2 349 381 174 202 239
C3 352 383 177 204 241
C4 354 385 180 206 243
C5 154 154 57.3 57.3 57.3
C6 319 353 171 198 236
Centroid 4.81 4.50 3.01 2.66 2.28
4.8. SUMMARY OF STRUT AND TIE RESULTS
While both strut and tie models did not accurately predict Pier C capacity, strength predictionsfrom the models agreed quite well with Specimen A test results. The poor results for specimen C canbe partially explained considering the assumption of the strut and tie model that load is carried onlythrough the action of a tied arch. If the size of T 1 is reduced to zero kips, the strut and tie modelpredicts that the specimen capacity is zero. However, the specimen will have as a minimum capacitythe concrete strength in shear.
Specimen C could not reach the available capacity of the inclined compression strut becausethe restraining tie at the top of the pier cap was too small. Since the compression strut for pier C isnot fully used, the contribution of shear carrying mechanisms such as aggregate interlock make up alarger proportion of the total load in specimen C. Because the strut and tie model only considers thecapacity provided by direct strut action, there will be less accuracy for Pier C as the compression strutcapacity was not reached. For specimen A, the other shear carrying mechanisms carry a smallerportion of the load, so the strut and tie model had more accuracy.
To account for the load carried by shear in the concrete, a concrete shear strength term, Ve, canbe added to the strut and tie strength. Using the upper limit on Ve from the ACI 318-89 deep beamprovisions, the shear contribution is:
59

Ve = 6 Jj"; bw d = 72 kips
where
f e• = 4,000 psi
bw = 14.5 inches
d = 13.0 inches
(4.12)
The specimen capacities resulting when the concrete shear strength tenn is added to the strength ofstrut and tie Modell are shown in Table 4.7. The addition of the Ve tenn to the strength from strutand tie Modell greatly improves results for specimen C. For Piers A, the addition ofthe Ve tenn givesresults that are slightly unconservative when the effect of compression steel is considered. However,compression steel is not typically used in strut and tie designs, so the inclusion of the Ve tenn for PiersA would be acceptable. Further consideration of a concrete shear strength tenn, Ve, in addition to thestrut and tie strength should be developed in·future reports.
Table 4.7 Predicted Specimen Capacities when a V e Term is Added to Strengths from Strut andTie Model 1
Pier A Pier C
Analysis 1-1 1-2 1-3 1-4 1-5
Capacity from Strut and Tie 311 344 373 132 159Modell (kips)
Old Ratio ofTheoryfTest 0.79 0.87 0.94 0.44 0.53
Ve Term (kips) 72 72 72 72 72
Strength from Model 1 and 383 416 445 204 231V e Tenn (kips)
New Ratio of TheoryfTest 0.97 1.05 1.13 0.68 0.77
For the strut and tie analyses, the force in Tl was assumed. This assumption is critical,because the tie capacity used in the strut and tie analysis limits the specimen capacity by equilibrium atnode 1. For specimen C, strain gages on the bars showed that all bars in the top layer of the pier hadyielded before the peak load was reached, so the yield capacity ofthe bars was used for the strut and tiemodel. Since bars in the top layer of specimen A did not have strain gages, the force in the bars had tobe assumed. For specimen A, the force for T 1 was assumed as the full yield capacity of the bars in thetop layer, 132 kips. This assumption gave strut and tie strength predictions that agreed well with testedresults. However, it is very unlikely that the full yield strength of all bars in the top layer of pier A wasreached. For specimen C, the #3 bars in the top layer of the pier yielded at a load of around 200 kips.Since the area of a #3 bar is 1/4 that of a #6 bar, the force in the #6 top layer bars of specimen A wasprobably 1/4 the yield capacity of the #6 bars at a load of 200 kips. Extrapolating to the capacity ofspecimen A, the #6 bars would probably see a load of about 1/2 their yield capacity at a load of 400kips.
The anchorage of the bars can also be considered in predicting the actual force in tie T1. Forspecimen A, inspection of the failed specimen showed no signs of bond distress. However, for the
60

straight bars in specimen A, the available development length for the bars was very small andinadequate to develop the yield strength of the bar. If the straight bars in specimen A had to develop alarge portion of their capacity, bond distress would have been observed as for specimen B. Thisdiscrepancy between the assumed force and observed behavior can partially be explained byconsidering tension in the concrete. Also, the strut and tie model only considers the action of the tiedarch to carry loads. However, other shear carrying mechanisms carry load, so the strut and tie modelwill overestimate the required steel in the top layer.
For strut and tie Models 1 and 2, the analyses considered the effect of compression in thecolumn steel. The inclusion of the steel increased the angle of strut inclination, enlarging the predictedcapacity of the pier. Since no strain gages were located on the column steel, the magnitude of Cs
assumed was very arbitrary. Still, the inclusion of compression steel in the strut and tie model reflectsthe behavior of the specimen and increased the strut and tie model accuracy. However, the effect ofcompression steel has not been considered in the general strut and tie theory at this point. One of theproblems of using compression steel is an inability to check the stress at a CCC node. Because thestrut and tie theory has not yet developed procedures for considering compression steel, the effect ofcompression steel was ignored in the design example.
While the strut and tie model results give conservative estimates of the specimen strength,either model predicted strength much more accurately than a conventional analysis. To increase thestrength predicted by a strut and tie model, a concrete shear strength term may be added to the strut andtie capacity. The average ratios of the theoretical load to tested specimen capacity for all designmethods are summarized in Table 4.8. Additionally, all strengths predicted by the strut and tie modelsthat met limit stresses in the main strut and tie were conservative. The author feels that Model 1 is abetter model for design than Model 2. Model 2 ends up assuming forces in the horizontal stirrups thatwere not verified by strain gages. Additionally, Model 2 does not consider transverse tensile strains inthe main compression struts. Thus, Modell is used in the design example.
Table 4.8 Comparison ofAverage Ratio ofTheorylTest Capacity for Different Design Methods
Average Ratio of Theoretical Capacity Pier A Pier C
to Tested Strength
Strut and Tie Modell Plus a Vc Term 1.05 0.73
Strut and Tie Model 1 0.87 0.49
Strut and Tie Model 2 0.85 0.67
Corbel Analysis 0.38 0.18
Deep Beam Analysis 0.24 0.32
61

4.9. DESIGN EXAMPLE USING STRUT AND TIE MODEL 1
A design example using the strut and tie method for a typical pier cap geometry is presented.Strut and tie Model 1 is used, with the calculations presented identical to those used to analyze thescale specimens. For the design example, the benefit of compression steel in the column was notconsidered as explained previously. The example is based on ultimate strength design, which is theaccepted procedure for use with the strut and tie method. For ultimate strength design, the criteria forspecimen nominal strength is shown in Equation 4.13.
PROBLEM STATEMENT
¢Pn = PuP u = factored load
P n = nominal strength
¢ = strength reduction factor
(4.13)
Determine the base plate size and pier cap reinforcing for the pier cap geometry shown inFigure 4.22 using the strut and tie model shown in Figure 4.23.
LOAD, DIMENSIONS, AND MATERIALSL1 = 12' - 0"
P = 1,200 kips, a service load
Ll = 121-0"
L2 = 12'-0"
L3 = 8'-6"
Bl = 4'-0"
B2 = 3'-6"
h=4'-0"
fe' = 3,600 psi
fy = 60 ksi
cover = 2 1/4"
The given load is a service load, so this must betransfonned to a factored load. A load factor of1.6 was used since individual load componentswere not known.
Pu = (load factor)P = 1.6*1,200
PII = 1,920 kips
PLAN VIEW OF PIER CAP
p
L2=12'-0"
PROFILE VIEW OF PIER CAP
L3=8'-6"
SECTION A-A
}. 4'-0"
Figure 4.22 Pier Cap Geometry for the ExampleProblem
62

h
cs]I
·-STRUT-TIE
TOTAL COMPRESSIONLOAD IN STRUT IS C1
b= 90G!
~/~""""F'\Cjw... \\ W
T :
ct
Figure 4.23
C1 = 2" C3
BOTTLENECK DETAIL
Strut and Tie Model for the Example Problem
SIZE THE BASE PLATES
Base plates are sized using the 1992 AASHTO provisions, section 8.16.7.
Pu = 1,920 kips
<I> = 0.7 for bearing
Pn = nominal bearing strength
Pn required =Pj<I> = 2,743 kips
Pn=0.85 fe' A\(A2/A\)0.5
where
A\ = base plate area
A2 = surrounding area of concrete, taken as the area ofa circle with a 4'-0" diameter = 1,810 in2
Try a base plate with w = 25"
so Pn = 0.85*3.6*625*(1810/625)°·5 =Pn = 3,250 kips> Pn required
Obviously, a smaller base plate could be used. However, too small a plate will not adequatelydistribute load across the full pier cap width. For tested specimens, the ratio of base plate size to strutwidth (w/B) was 0.6 (8.75"/14.5"). Using a 25 inch base plate gives a ratio of plate width to strutwidth w/B = 0.6 (25"/42") to conform with the tested specimens. The strut width is chosen as thecolumn width, 42", which is smaller than the pier cap width, 48". The column width is used for thew/B ratio as the smaller width will control strut widths.
63

SIZE C5 AND FIND THE LOCATION OF ITS RESULTANT
To:find forces in the struts and ties, the angle of inclination, e, is needed. Since C5 = Po, thecentroid ofC5 can be found knowing the applied load. The inclination angle, e, can then be detenninedbased on the location of the centroid of C5. To:find the required Po for the pier cap, a <I> factor isneeded. One <I> factor is used for the entire pier cap design, instead of different <I> factors for thedifferent elements of the strut and tie model. Since the strut and tie method is conservative, and itsstrength predictions for the tested piers were conservative, <I> was chosen as 0.9.
Pu = 1,920 kips
<I> = 0.9
Pn= Pu/<I> = 2,130 kips = required pier cap strength
Knowing Po, the centroid ofC5 can be found because C5 =Po.
fed = concrete design strength = ufe' for all struts in the model
where u =0.8 from section 4.4.4.2
fed = ufe' = 2.88 ksi
AC5 = area of strut C5 = C5/fed = 740 in2
Consider the total area of strut C5 as two pieces, Al and A2, as shown in Figure 4.24
AC5 =Al +A2
Al = 693 in2 so strut C5 must extend into the rectangular section ofthe column
A2 =AC5 - AC1 = 47 in2
z = A2/B2 = 1.1 in
wC5 = z + B2/2 = 22.1" = the width of strut C5.
The centroid ofAC5 is then found,
Xeg = 12.7"
B2 = 3' - 6"
Figure 4.24
COLUMN CROSS SECTION
Cross Section ofStrut C5
64

FIND THE INCLINATION ANGLE OF THE BOTTLE STRUT, 9
The location of node 2 is the intersection of struts C1, C4, and C5, and is defined by x"g and 9,the angle of inclination, as shown in Figure 4.25. The inclination angle, 9, can be found knowing thecentroid of strut C5, x.,g, and the depth of reinforcing, d.
d = h - cover - dIl2
Assuming a #11 bar in the top layer, db = 1.41"
so d = 48 - 2.25 - 1.41/2 =45.0"
9 = 0.5 asin [2Xeg!d] = 72.80
T1
node2~
e'-----""i-------'
d
Xcg
Figure 4.25 Location o/Node 2 in the Strut and Tie Model
KNOWING 9, CHECK Tl AND ASSUMED d
T1 = PJtan 9 = 2,130/tan 72.8 = 659 kips
AT1 = area of steel for Tl = T1/fy = 11.0 in2
use 8 #11 bars, with As = 12.48 in2
:::? this implies that 2 layers of steel will be needed
RECALCULATE 9 USING TWO LAYERS OF STEEL FOR Tl
for 2 layers of steel, use clear spacing of 2db= 2.82" for a #11 bar
d =h - cover - db - clear spacing/2 = 42.9"
so new 9 = 0.5 asin [2Xeg!d] = 71.8
Check Tl using the new 9
Tl =PJtan 9 =2,130/tan 71.8 = 700 kips
ATI = Tl/fy = 11.7 in2 < 12.48 in2 provided, OK
65

FIND ALL MEMBER FORCES
Compute the diffusion angle:
cI> = 12 + 3/[(w/h)O.5] = 16.20
Po = 2,130 kips
T1 = 700 kips
a = 71.80
C1 = po/sina = 2,242 kips
C2 = 0.5 ClIcos cI> = 1,167 kips
C3 = C1/2 = 1,121 kips
C4 = T1 = 700 kips
C5 = Po = 2,130 kips
T2 = 0.5 C1 tan cI> = 326 kips
T2horiz = T2 sin a = 310 kips = horizontal component of T2
T2vert = T2 cos a = 101 kips = vertical component of T2
CHECK STRESS AT THE CCC NODE, NODE 2
AC
Xeg
£q=70 o '8
C1
j
wC5
C iI
The layout of the CCC node is shown in Figure 4.26. AC1 is the area of compression strut C1 at thisnode. Since AC5 is a combination of a circular and a rectangular section, AC 1 is found by projectingfrom AC5.
AC1 = AC5/sina = 740/sin 71.8 = 779 in2
wC4 = the width of strut C4
0.5 wC4 = c/tan a = 3.09"
wC4 =6.18"
The column width is used to find AC4 as thecolumn width limits the strut width.
AC4 = B2 wC4 = 260 in2
crC5 = the stress on strut C5 = C5/AC5
crC5 = 2.88 ksi = fed OK
crC1 = ClIAC1 = 2.88 ksi = fed OK
crC4 = C4/AC4 = 2.67 ksi < fed OK
All strut stresses at the node are lessthan or equal to the limiting concrete designstress, but a hydrostatic state of stress does notexist as all three stresses are not equal. Sincethe stress at the node is not hydrostatic, thechecks suggested by Schlaich (1987) are used:
Figure 4.26 Geometry ofthe CCC Node (Node 2in the Strut and Tie Model)
66

CLEAR SPACING =2.8"
1. All strut stresses at the node are within design limits.2. The smallest stress ratio between faces ofthe node is greater than 0.5.
Check: 2.67/2.88 = 0.93 >0.5 OK.Since both checks are met, this node is satisfactory.
DESIGN STEEL FOR Tl AND THE COMPONENTS OF T2
T1 = 700 kips
AT1 = T1/fy = 11.67 in2 = area of steel required for T1
For T1, use 5 #11 bars and 4 #10 bars, As = 12.88 in2
The layout ofT1 steel at the top of the cap is shown in Figure 4.27.
BASE PLATES/25"X2S" I
LAYER 1 ~ ,---,
LAYER211~1;lll t EQUAL SPACES
ba;:r;;- 2@; 1ars E#9 #7
k rL2 =12' - 0"
Figure 4.27
PROFILE VIEW OF PIER CAP
BARS A1 AND A2~ I BAR B '.114· COVER
~ J J)} EQUAL SPACES
aA-RSE
BARS A1 AND A2 MADE CONTINUOUS BY A WELDED SPLICE
LAYER 1 - BARS A1, A2 AND B #11
gBARS C1 AND C2 '.1I4.COVER
C :§]~~~~~I~G IDENTICAl
BARS C1 AND C2 MADE CONTINUOUS BY A WELDED SPLICE
LAYER 2 - BARS C1 AND C2 #10
Steel Reinforcing Pattern from the Example Problem
67

For the components of T2, horizontal and vertical stirrups are used. Since there are two tiesT2 in the bottle strut, steel must be provided to resist 2*T2. Since steel will be distributed on each faceofthe pier, the steel required for T2 is provided on each face ofthe pier cap.
T2horiz = 310 kips
AT2horiz = T2horiJfy = 5.17 in2 on one face of the cap
for T2horiz use 6 #9 bars, As = 6.0 in2
The horizontal stirrups for T2 are evenly spaced across the depth of the pier cap as shown in Figure4.27.
T2vert = 101 kips
AT2vert =T2vdfy = 1.68 in2 on one face ofthe cap
for T2vert use 3 #7 bars, As = 1.8 in2
The vertical stirrups for T2 are spaced across the width of the compression strut as shown in Figure4.27.
CHECK STRESSES AT THE CCT NODE
The geometry of the CCT node, node 1, is shown in Figure 4.28. Since the bearing stress iswithin its limit and T1 can be provided, only the stress in C1 needs to be checked.
To compute the area of C1 at this node the column width, B2, is used as the strut width insteadof the pier cap width, B1. The smaller width is used because loads from the base plate can only bedistributed over a limited concrete area.
e=70.8°
w=25"t< )1
P =2,130 k
t#11 bars
wT1 = db#11 + ~#10 + S = 1.41 + 1.27 + 2.82 = 5.5"
wC1 =w sin e+ wT1 cos e=25.5"
C1 = 2,242 kips
AC1 = B2 wC1 = 1,071 in2
crCl = ClIACl = 2.09 ksi <~ OK
~T1
Figure 4.28 Geometry ofthe CCT Node (Node 1 in the Strut and Tie Model)
68

CHECK STRESSES IN C2, C3, AND NODE 3
Since the stress in C1 has been checked at both nodes 1 and 2 and is satisfactory there, bothcrC2 and crC3 will meet allowable stresses. The stresses at the nodes are most critical, because thearea at the nodes is smallest. For struts C2 and C3 the load can distribute over a larger area, reducingstress. Using a similar argument, nodes 3 do not need to be checked. Also, node 3 does not need to bechecked as T2 is spread over several stirrups.
CHECK ANCHORAGE REQUIREMENTS FOR Tl TIE
At the CCT node, the strut and tie method requires the full tensile strength of the bars to be
provided. The development length is calculated using the 1992 AASHTO provisions, section 8.25.ld = {A B ...} ldb = the development length of a bar
A, B are multipliers based on rebar placement
ldb = 0.04 Abf/(fo,)0.5 = 62.4"
A = 1.4 = multiplier for top bars
B = 0.8 = multiplier for large lateral spacing
ld = A B ldb = 70"
Since the development length is extremely large, straight bars can not be used to provide thefull strength of T 1. Therefore, continuous loops are used to provide anchorage as shown in Figure4.27. The AASHTO provisions do not specify a development length for a full U, so the 1992AASHTO provisions for a standard 1800 hook, section 8.28, are examined.
ldb = {A B ...} lhb = development length ofthe hook
I = 1 200 d 1(£1)0.5 = 282"hb , bI 0 •
A = 0.7 =multiplier for cover
ldb = A lhb = 20.0"
This length can be provided under the base plate, so the development of the U hoops is consideredadequate.
The area of steel that can be developed at the CCT node is thus the full strength of the Ushaped hoops, and the developed strength of the straight bar. As suggested by Bergmeister (1990), thedevelopment length begins at the edge ofthe base plate.
AT1 = 4 A#11 + 4 A#10 + A#11 (ld provideild available)
ldprovided = 20" based on the bar layout shown in Figure 4.27.
ATI = 4(1.56) + 4(1.27) + 1.56(20/70) = 11.77 in2 > 11.67 in2 reqd.
Thus, tie Tl can provide the full capacity needed at the CCT node.
SUMMARY OF THE EXAMPLE PROBLEM
The reinforcing design for the example problem pier cap is shown in Figure 4.27. Using thestrut and tie method, steel reinforcing for the pier cap can readily be designed. The main considerations
69

in the strut and tie analysis shown were checks of the nodes, selection of reinforcement, and anchorageof reinforcing. Since the colwnn width is less than the pier cap width, the colwnn width was used tolimit strut widths. Also, the base plate width is kept larger than required to allow distribution of loadsacross the pier. The tested specimens had a ratio of base plate width to strut width of 0.60, so thisratio was used for the full size pier. The calculations in the design example are lengthy, so a simplifiedprocedure to predict the pier cap strength will be developed in future research.
4.10. COMPARISON OF EXAMPLE PROBLEM REINFORCING STEEL TO ATYPICAL TxDOT DETAIL
The amount of reinforcing required for the strut and tie design example is much greater thanthat typically used by TxDOT. For the given geometry, a pattern of reinforcing often used by TxDOTis shown in Figure 4.29. The TxDOT steel detail has only one layer of #11 bars in the top of the piercap for the main tension tie, T 1, as opposed to two layers in the strut and tie design -#11 and #10 bars.Also, the TxDOT detail uses 3 layers of #6 bars for the horizontal stirrups as opposed to 6 layers of #9bars for the strut and tie design.
rs F#6
~IA4 EQUAL SPACES
IT4 EQUAL SPACES
R
bars B #11
12 @ l' - 0" = 12' - 0"t<
PROFILE VIEW OF PIER CAP
bar A#11
1 2~/4" COVE
'/ 1\ 'l' ,-"
~~1\ ~
).... //
"
r-- ,--,
i"II'
- r--
"'bars E,-----rI
rs D#6 #5 ba
bars EBAR A1 MADE CONTINUOUS BY A WELDED SPLICE
ba
SECTION A-A - BARS A AND B #11
Figure 4.29 Typical Steel Reinforcing Pattern Used by TxDot
To judge whether the difference in the two steel reinforcing details represents an understrengthofthe TxDOT design or the conservatism of the strut and tie method, a strut and tie analysis was madeof the typical TxDOT design shown in Figure 4.29. The analysis used no compression steel, the fullyield capacity of the ofthe bars in the top layer ofthe pier cap, and the colwnn width as the strut width(the same parameters used for analysis 1-1 of Table 4.3). Using these parameters the strut and tieanalysis predicts a capacity ofthe TxDOT design as Pu =1,747 kips which was less thanthe Pn = 2,130 kips used in the Afrstrut and tie design. Memberforces and the inclination anglefrom the strut and tie analysisare shown in Table 4.9.However, for the strut and tieanalysis ofthe tested specimensusing the same assumptions (noCs and full fy), the averagetested specimen capacity was27% greater than the strengthfrom the strut and tie analysis(395/311 = 1.27). Thus, thetrue average capacity of thefull size detail is probablycloser to 1.27* 1,747 = 2,220kips. If the minimum testedstrength for test specimen A isused, the tested pier capacity isonly 18% larger than thatpredicted by the strut and tieanalysis (365/311). Thus, theleast capacity of the full size
70

pier is likely 1.18*1,747 = 2,070 kips which is slightly less than the required design strength Po = 2,130kips. This indicates that existing piers may have a factor of safety less than expected for bearing loads.
Table 4.9 Strut and Tie Capacity andMember Forces for a Typical TxDOT Steel Detail (Figure 4.29)
Strut and tie analysis of existing TxDOT detail
Capacity, P 1,747
81 75.0Compression in Steel 0
T1 468
T2 horizontal 249
T2 vertical 66.7
Forces C1 1,808
(kips) C2 940
C3 904
C4 468
C5 1,747
Centroid 11.1"
The above strut and tie analysis of a full size pier, and extrapolation of analysis results basedon tested scale specimen capacity may be slightly inaccurate because there are several differencesbetween the test specimens and full size piers. For the tested specimens, fe' = 4,000 psi as compared to3,600 psi for the full size piers. The different concrete strength will change the concrete tensilestrength, which may result in a different strut inclination. A different strut inclination will change thecontribution to the pier cap strength of other shear carrying mechanisms such as aggregate interlock.The different concrete strength will also affect the development length of the reinforcing. For a largerconcrete strength, the required anchorage length is smaller. Finally, for the scale specimens, thecolumn width was the same as the pier cap width. For the full size pier caps, the column width is lessthan the pier cap width. This reduced column size will increase the concentration of stress on the endofthe column, resulting in earlier spalling.
A detennination of the adequacy of existing full size pier caps is difficult, and can only bemade on a case by case basis considering both the load and geometry. As a further consideration of theadequacy of current designs, the performance of existing piers can be considered. To the authorsknowledge, details as shown in Figure 4.28 have performed adequately. However, it is difficult toquantify the loads that existing piers have actually sustained. The calculated bearing loads aretypically conservative, so the smaller magnitude of true bearing loads must be considered if theperformance of existing pier caps is to be projected to new designs. hnproved analysis techniques tomore accurately calculate bearing loads are currently being developed in a related study concerning thebehavior ofthe steel bent to pier cap connection.
To give criteria for evaluating the adequacy of pier caps from field inspections, crackingpatterns on test specimens A at a service level are considered. For the A series specimens, the averageservice load is 395 kips/1.6 = 245 kips. At this service load, flexure/shear cracks extended about halfway across the depth of the pier cap. Under a service load, cracks on full size piers should have a
71

maximum size of 0.016" based on crack sizes observed on the scale specimens. Signs of concretedistress on the pier cap that would indicate overloads on the bridge or pier cap inadequacy are:
1. Significant crushing at the pier/cap column interface. If spalling of the concrete occurs,the pier cap has seen severe loadings.
2. Splitting cracks on the top ofthe pier indicating bond failure for the straight bars in the toplayer ofthe pier cap.
3. Maximum crack openings on the pier significantly larger than 1/16".4. Cracks extending across the full depth of the pier cap that have a significant width for the
full length.If any of the patterns of concrete distress listed above are observed, rehabilitation of the pier cap maybe desirable.
Because there is some uncertainty as to the adequacy of the current steel reinforcing pattern,the strut and tie method is suggested for future designs. The strut and tie method is superior toconventional design techniques that could be used for the pier cap. The strut and tie method allows alogical design of reinforcing, and is a conservative design technique. To improve the efficiency of thestrut and tie method, further research should be conducted into the addition of a concrete shear strengthterm to the strut and tie capacity.
72

CHAPTER 5
SUMMARY AND CONCLUSIONS
5.1. OBJECTIVES AND SCOPE
The objective of this research was to detennine the strength and behavior of typical TxDOTbridge pier caps under compression loads. The pier caps typically used by TxDOT have a geometrywhose design and behavior is not explicitly covered in current code procedures. Since no formal designprocedure currently exists for determining the required amount and distribution of reinforcing steel in apier cap, this research also had the purpose of providing design guidelines for the pier cap. Toinvestigate the behavior of the pier caps, six test specimens were constructed at a 30% scale. Fivedifferent reinforcing steel patterns were used in the six specimens to examine the contributions ofdifferent reinforcing types to the pier cap strength.
5.2. OBSERVED REBAVIOR
Eleven static load tests were conducted to failure on the six pier caps. For all specimens, loadon the pier cap was primarily carried by the action of a tied arch which transferred load from the baseplates into the column. Concrete distress associated with the arch action included flexural/shear andshear cracks on the faces of the pier cap which limited the size of the compression arch. Additionally,flexural cracks were seen on the top of the pier cap indicating a state of pure tension there. As loadwas applied to a specimen, flexure, flexure/shear, and shear cracks formed. As loading continued,crushing was eventually observed at the pier cap/column interface. The crushing at the interfacelimited the area at the base ofthe arch, so the compression arch had to rotate further into the interior ofthe pier for the specimen to carry additional load. The new orientation of the arch required additionaltension in the reinforcement at the top layer of the pier cap to maintain equilibrium. Thus, if aspecimen had sufficient reinforcement in the top layer of the pier cap, additional load could be carried.However, if the development of tension force was limited, failure of the pier cap coincided with theinitiation of crushing at the cap/column juncture. Overall, specimens that had a greater quantity ofhorizontal reinforcing steel and adequate development ofhorizontal reinforcing had a greater capacity.
To investigate the necessity of the continuous steel loop around the perimeter of the pier cap(bar T) a specimen was constructed with only straight bars in the top layer of the pier cap. Threeproblems arose when the continuous loop was not included in the top layer the pier cap reinforcement:
1. Shear cracks on the face of the pier opened extremely wide because there was noreinforcement at the top ofthe pier to limit their growth.
2. Bond distress was seen for the straight bars in the top layer of the pier cap. The removalof the continuous loop left only straight bar anchorage as a means of developing therequired force in the steel. Since development lengths for the straight bars were extremelyshort, the tension force at the top ofthe pier was limited, reducing the pier cap strength.
3. The base plate punched further into the top of the pier. Without the continuous loop,concrete at the end ofthe pier cap was not confined and additional punching could occur.
Punching of the base plates into the top of the pier cap was seen to some extent for allspecimens. However, punching of the base plates was not the cause of failure because most of thepunching occurred after the failure load had been reached. The bearing capacity of the pier cap was
73

reduced by the formation of a flexural crack at the interior edge of the base plate. The formation of theflexural crack removed the confinement provided by the concrete in the interior of the pier. Bearingcapacity of the pier cap was increased by the confinement provided by the continuous loop around theend of the pier cap.
5.3. COMPARISON OF DESIGN METHODS
Three design methods were used to analyze the strength ofthe pier caps tested:
1. AASHTO (1992) Corbel Provisions.2. ACI 318-89 Deep Beam Provisions.3. Strut and Tie Method.
The corbel and deep beam provisions were entirely inadequate to predict the capacity of the pier capbecause they only consider concrete capacity in shear. Testing showed that the pier cap resisted loadsthrough a tied arch, which is a much stronger load carrying mechanism than concrete in shear. Thestrut and tie models used were much more accurate than conventional design methods in predicting thecapacity ofthe pier caps because they model the compression arch action observed during testing. Thestrut and tie method is suggested for design because strut and tie analyses gave the best correlation withtest results, modelled true behavior, and were conservative. The strut and tie method allows a logicaldesign of reinforcing steel for a given load and specimen geometry, and is a conservative designmethod. To detail the use of the strut and tie method, a design example using a proposed strut and tiemodel was presented. Since the design calculations are lengthy, a simplified procedure to predict thepier cap strength should be developed. Also, recommendations for evaluating existing pier capsthrough field inspection are given.
5.4. AREAS FOR ADDITIONAL RESEARCH
Several possible areas of further research were identified during this study. The strut and tiemodels presented predicted strengths that were 20 to 50 percent less than the tested specimencapacities. Closer correlation to the tested pier cap strength was achieved by adding a concrete shearstrength term to the strength predicted by the strut and tie model. Additional research should beconducted to refine the strut and tie model by adding a concrete shear strength term. Second,development of the strut and tie theory to allow consideration of compression steel is desirable.Consideration of compression steel would more accurately model specimen behavior, and wouldimprove the accuracy and efficiency of strut and tie designs. Third, the development length requiredfor U shaped, continuous stirrups is not detailed in any code provisions. The U shape allows muchshorter anchorage lengths than straight bars. The continuous U stirrup will behave differently than astandard 1800 hook as both ends of the continuous stirrup are being loaded. Finally, the bearingcapacity of the concrete has been identified as another area where research is needed because bearingcapacity is limiting the design of the connection between the pier cap and steel bent. Because there issubstantial reinforcement in the top layer of the pier cap, increased bearing capacity of the concrete isexpected.
74

APPENDIX A
TENSILE TESTS OF REBAR
The tensile tests on the bars were perfonned using a loading controlled test machine. Loadwas controlled using a plot of load against strain, with the strain measured using a Satec SystemsModel T-6M Extensometer with an eight inch gage length. An example graph of the rebar loadingprocess is shown in Figure A. I. Bars were loaded at a constant rate up to the yield point of the bars.The initial rate of load application was approximately 2,000 pounds per minute for the #3 bars, andabout 10,000 pounds per minute for the #6 bars. After the bars yielded, a plastic defonnation ofapproximately twice the yield strain was applied. The test machine was then turned off, allowing therebar to unload. After five minutes, the stress in the bar was recorded as the static yield stress, fyl .The bars were loaded two more times, applying a plastic strain of approximately twice the yield strainwith each load step. The average static yield strain for the bar was the average ofthe three static yieldpoints, fyI, fy2, and fy3 . For each lot ofbars, two different tensile tests were run.
1<,--------, ~----------.,--------.
fy2
Strain
FigureA.l Typical Stress - Strain Curve for a Tensile Test ofRebar
75

1
1
1
1
1
1
1
1
1
1
1
1
1
1
1
1
1
1
1

APPENDIX B
LOAD - DISPLACEMENT GRAPHS
This appendix contains plots of load versus displacement on linear pots I through 4 for alltests. The layout ofthe linear pots is shown in Figure B.I. Load is the resultant load at the tested endof the pier cap, and is a static load reading. Deflections have been shifted as explained in Chapter 3 toremove the scatter in deflections under small loads (loads less than 50 kips). The unloading curve forthe specimens is not included.
center of load head
5 and 6
5
6
line of action41
ij
!.
of load;
~ It j;
~'I" !
I\3 and 4~ij;;
6 62
1
Figure B.] Location o/Linear Pots
77

450
400
- 350(/)a.~- 3000«0 250..J
I-Z 200«~ 150::::>CI)w
100a:::
50
/'., -------- ~........~ ........... ~ ................ ...................• ............u .......... ..................
.,,:Ii".;
1I ~~I..Ai
.;.--
LI-'1t4'j4 ..~ LP #2"...'/LP#3xt·· .Aj(
~ .J.':/' 'LP #1
jJ~0'/
IIiff5
foo 0.05 0.1 0.15 0.2 0.25 0.3 0.35
DEFLECTION AT LINEAR POTS #1-4 (inches)
0.4
Figure B.2 Resultant Load vs. Deflection at Linear Pots 1 through 4 for Pier Al-l
0.40.05 0.1 0.15 0.2 0.25 0.3 0.35
DEFLECTION AT LINEAR POTS #1-4 (inches)
! "LP#3 /--1':>-::............... /LP#2
LP#4- -r ~.........~t!................. --:-~. .LP#1/ ~.........! !. .' ....
f v~If III
/.1'1/·....f·····
300
450
400
250
200
150
100
50
oo
Ii) 350a.~-
Figure B.3 Resultant Load vs. Deflection at Linear Pots 1 through 4 for Pier A2-2
78

0.40.05 0.1 0.15 0.2 0.25 0.3 0.35
DEFLECTION AT LINEAR POTS #1-4 (inches)
...~ -P ....7...' ......
LP#3 ,<1/' I
LP#2.'
LP#4 ..... ".i~/.j 1~/"! /
'II- f-LP #1: :; :
fji~ .j l
! :
/f,If
oo
450
400
- 350C/)0.
:.s2- 3000«0 250...J
I-Z 200~...J 150~CJ)w
100c:::
50
Figure B.4 Resultant Load vs, Deflection at Linear Pots 1 through 4 for Pier A2-3
0.40.05 0.1 0.15 0.2 0.25 0.3 0.35
DEFLECTION AT LINEAR POTS #1-4 (inches)
LP#3\ .. /LP #4_&
~y /uoo....... -... ..............
(/• LP#1
1/,1#'
til; LP#2
ilIf,
oo
450
400
- 350C/)0.
:.s2- 3000«a 250...J
I-Z 200~...J 150~CJ)w
100c:::
50
Figure B.5 Resultant Load vs. Deflection at Linear Pots 1 through 4 for Pier B-1
79

0.40.05 0.1 0,15 0.2 0.25 0.3 0.35
DEFLECTION AT LINEAR POTS #1-4 (inches)
LP#~ I IILtJ #/..................... ...•~l=r /LP#2
u ........
j. / LP#1
1/1./.'
liPIf
300
200
150
100
en 3500.~-Cl
g 250IZ«~::J
fB0:::
50
oo
450
400
Figure B.6 Resultant Load vs. Deflection at Linear Pots 1 through 4 for Pier B-2
0.40.05 0.1 0.15 0.2 0.25 0.3 0.35
DEFLECTION AT LINEAR POTS #1-4 (inches)
/LP#3LP #4---~d":;:;~- ~
,........LP#2r .......-
II .-;....•
f4'"jf'
f/".
300
250
200
150
100
50
oo
en 3500.~-
450
400
ClgIZ;::JC/)W0:::
Figure B.7 Resultant Load vs. Deflection at Linear Pots 1 through 4 for Pier C-l
80

450
400
/LP#2
ifD1<: ~~:~#1.'I '"
/1/ \. ....•........... ~f-==......·'···"·"r"·"'·' "h·_e_······· __•••__ ......._--.. -T....
Ii./ LP#31 LP#4
Ii~
300
250
200
150
100
50
~IZ
~::::>enLUc:::
en 350a.~-
oo 0.05 0.1 0.15 0.2 0.25 0.3 0.35
DEFLECTION AT LINEAR POTS #1-4 (inches)
0.4
Figure B.8 Resultant Load vs. Deflection at Linear Pots 1 through 4 for Pier C-2
0.40.05 0.1 0.15 0.2 0.25 0.3 0.35
DEFLECTION AT LINEAR POTS #1-4 (inches)
/LP#4LP#2.-.'
/.~~~~~.: ............ ". ' ..//.. LP'#3
: .....LP#1
1/1
~
300
250
200
150
100
50
oo
en 350a.g
450
400
o<t:o...JIZ
~...J::::>enLUc:::
FigureB.9 Resultant Load vs. Deflection at Linear Pots 1 through 4 for Pier D-l
81

450
400
- 350(/Jc.:i2- 3000«0 250...Jf-Z 200
~ 150:::>C/')w
100a:::
50
.,.I~-"" ........-..... .......u ....r/ Ia"~ ........ --t:--..~
~~~:...~:~~..'--- LP#1
1/ ·7······ --....._-....• r----.;-r-.LP'4 LP#3
f'
oo 0.05 0.1 0.15 0.2 0.25 0.3 0.35
DEFLECTION AT LINEAR POTS #1-4 (inches)
0.4
Figure B.l0 Resultant Load vs. Deflection at Linear Pots 1 through 4 for Pier D-2
0.40.05 0.1 0.15 0.2 0.25 0.3 0.35
DEFLECTION AT LINEAR POTS #1-4 (inches)
LP#3, ~.. ---...- LP#2
LP#4+~/"'--~
.. ..... .............~l ....-~.
~../.........=F==::.....~
J/II LP'1
fir1/
300
450
400
250
200
150
100
50
oo
en 350c.:i2-
Figure B.ll Resultant Load vs. Deflection at Linear Pots 1 through 4 for Pier E-l
82
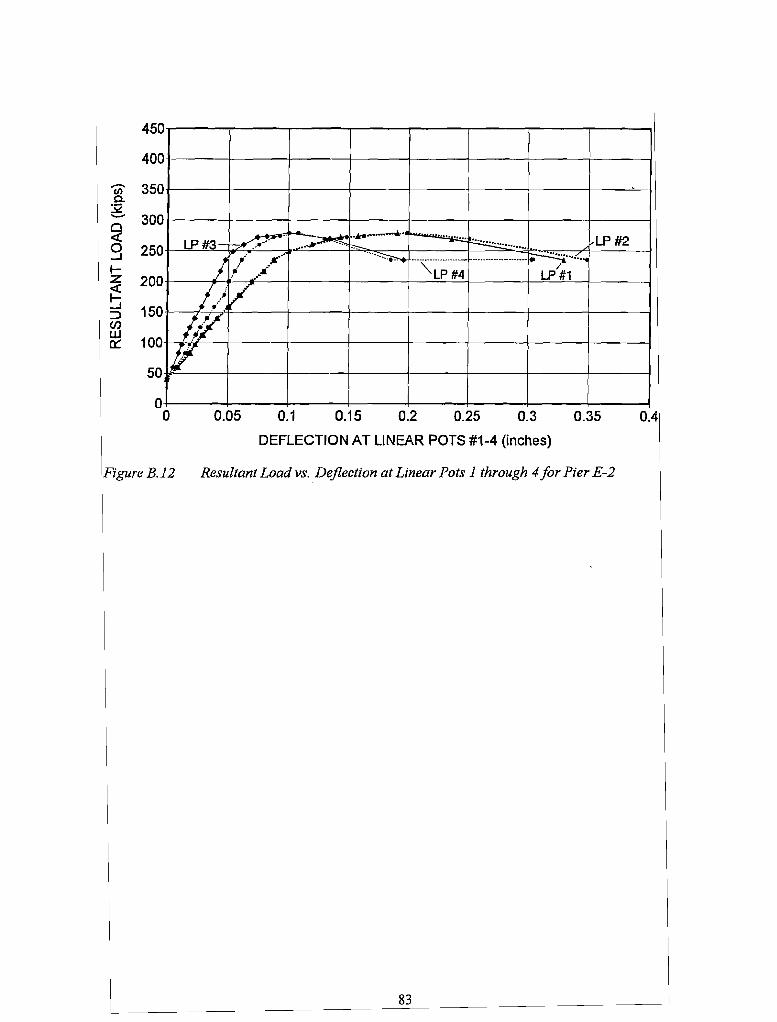
450
400
........ 350 .en0-
:52- 300Cl ~ ...._ • ..--,l.. I-...-..,.~« ~~... ...~~. f=.::.::.•••.••••• LP#20 250 LP#3- ..•. ~
-' J.,l ~•.. .....~
"·,,'L~";~---...------.---------~;.2.:.- " ~ I
Z 200,~ ...... LP#1
«I,.···'V!:J 150::::> /'(fC/) ,;w
100,.
0::::
III50
I0
0 0.05 0.1 0.15 0.2 0.25 0.3 0.35 0.4
DEFLECTION AT LINEAR POTS #1-4 (inches)
Figure B.l2 Resultant Load vs. Deflection at Linear Pots 1 through 4for Pier E-2
83


APPENDIX C
PHOTOS OF THE FAILED SPECIMENS
This appendix contains photos of the specimens after failure. Photos show the distribution ofcracking on both faces of a specimen, crushing at the cap/column interface, and punching of the baseplates. Numbers marked on the specimen are the total load in kips applied to the spreader beaIll, andnot the resultant load at the tested end of the pier cap. The load marked on the specimen is placed atthe point where a crack had propagated at that point. Loads marked on the specimens are slightlylarger than the static load, as the static load was not reached until crack mapping had been completed.Thus, the loads marked on the specimen are approximately 5 to 10 kips larger than the total static loadapplied to the spreader beam.
85

PIER A1~1"" ~-rJ!'""
Figure C.l Damage to Pier Al-l After Failure
86

Figure C.2 Damage to Pier A2-2 After Failure
87

Figure C.3 Damage to Pier A2-3 After Failure
88

Figure C.5 Damage to Pier B-2 After Failure
90

Figure C.6 Damage to Pier C-l After Failure
91

Figure C.7 Damage to Pier C-2 After Failure
92

Figure C.8 Damage to Pier D-l After Failure
93

Figure C.9 Damage to Pier D-2 After Failure
94

Figure C.lO Damage to Pier E-l After Failure
95

Figure C.ll Damage to Pier E-2 After Failure
96

APPENDIX D
LOAD - STRAIN GRAPHS
This appendix contains plots of resultant load versus strain for tests on Specimens C and D.The strain gages are located in the top layer of the pier cap on #3 bars as shown in Figure D1. Fortests Pier Cl and Dl, the strain gages are at the tested end of the specimen, while for tests Pier C2 andD2 the gages are on the end of the specimen subject the smaller load. The unloading curve for thestrain gages is included to show the final strain in the bars. For both specimens, the yield strain, 1630microstrains, is calculated as the experimentally obtained yield stress divided by the modulus ofelasticity (47.4 ksi/29,OOO ksi).
2-7/8" 8-3/4" 3-7/8" 2" 7-3/4"r );0( )Io()rf )1
18"
Figure D.l
Icr.. of specimen-4,
III
)~
Location ofStrain Gages
97
even # gages - on bottom of rebarodd # gages - on top of rebar

3000025000
;i
10000 15000 20000MICROSTRAINS (innn)
5000
350r---t------,.------,-------.----.....,....----.,....-------.III
300 t----t.----t-.::::r ::::...",,···.,...·="'-=1--.-::••:-•• t-I ----:_"..=~==«i:::+---,~~."":..--t-----,,)-:tr===-=;--ir='=~.,.---j-I ~J--4' i ..:::- _---II.~"".... .=.=.....=~.==.;;;-.;;;;;:;;;;r:·""~· ....f~ - ----'GAGE 1
:~~ / I200+----iil------+----++-----I-t--+------t-----+------~
~I t! .:'tftl GAGE 4- /150 t--!!if:""1'+!----t--=::.==-.,,--+t-+-G=A7"G=E=-=-3----+J-+------f:t-G-A-G-E-2-+------I--------j
100 t I /
1 I-YIELD f Ii I STRAIN :
50 I !
I ( I T0t----l---.....J...-_..I...-_l.-_-+-_.....I-ti--__---l. ...L- ---l
o
'[;g 250o
9I-Z
~...J:::::lenw0:::
Figure D.2 Resultant Load vs. Strain in Gages 1 through 4for Pier C-l
350,....----;---.....,..----...,........------,.----....,.....----.-------,
300002500010000 15000 20000MICROSTRAINS (inlin)
GAGES
5000
II
I / /GAGE7300111;:-r'-::::""'"=.~.~•.::=I=I==P:::'::===1==)-,,;r~~'t-::::-'-~-==-:-::-I----I
'[ Ifr- ..'I......L·~:::::~:.:::~: ·.::.~:::~:.:::.::.:";::.:::.:.~~~ .... , ..f~1--~----~:::::. ...~ 250 ~V:. j I / I<{ 51 /j /9 200 i'! f ~ .. !•. ;. I
!z ;/d-YIELD! I-GAGE 6 GAGE 5 1--/~ 150 #I STRAIN,/ t Ien 100t-__f+---t+---+-__+- ~I----l---I---_I__----_1__---~
~ f I ! J50ft---;----i'--l---+---+-------!-i--1----I-----+-----I
I I (i
O.---I--~---J_ __+-----L.----""*--+----..L...-------J-------Jo
Figure D.3 Resultant Load vs. Strain in Gages 5 through 8 for Pier C-l
98

3000025000
I
10000 15000 20000MICROSTRAINS (inlin)
.,. I:n- GAGE 10Ii ;
H JJ j-GAGE1
, ~
pAGE 9-1 !!Iii
5000
III
...
f I_YIELDSTRAIN
III~
GA 3E 12 -..! I j {tH
O~~:+---'-I....--------l....+-----~-------L...-__
o
350
300-If)a.32 250-0«0 200..J
I-Z
~150
:::l(J) 100UJa::
50
Figure D.4 Resultant Load vs. Strain in Gages 9 through 12for Pier C-l
1800
i
1400 16001200600 800 1000MICROSTRAINS (inlin)
400
o
9IZ
~:::l(J)UJa::
100 r---...,.------,-----,------,----.,..---...,.-----,-----,-;--!----,
90t----I---+---+-----I------j------I-----+---+-+-------l
en 80t----t------t---t----+----+----I----+-------t--i----Ia.;g. 70-/------+------+---t----_+__-----+-----I---+---.=c=---+-+----I
YIELD -I-i
60 t-__-::t-__---t l--::-:-_+-__-+__--I +S::..cT'-'--R=--A::..cIN"'-----t-+__---l.1 .•.•~ -GAGE 2 ,.::'•
50-t----i1.'--t-----+-------,,.,.,f-----+---t-----t------+-------+-+----jG If'40t-----,..~---_+__::"....,.::··'--···-·..=.;.r-.---+---t-----t------t----t-+-----lif ,. ..... /~ GAGE 430t------:lol'-.i:---j---+.-+-~."---.·-/------f-----j------j----+-----+--i----Il/ .20t--!"~·+!-~----:,._"_t_---+__--_+_--__+_---t-----_+__-----+-+--------l
.j.- .../10 1./ ..w·· .••••••••
':...••......•.o(:.....a 200
Figure D.5 Resultant Load vs. Strain in Gages 2 and 4 for Pier C-2
99

!
:
~AGE6 GAGES I,GAGE7YIELD-
/ STRAIN
/' - / / .,, •.,.
xc_-l>t- t v-t,.::: ~~ ..,..~ ,.,.,j. •.....
ii /~ /-- / ~''''''/ .'
"i •... .'.or Ai. w·... /v ...::::..~ j GAGE 8..-~+..' /. ........~ / .....'
~"~/0"
1 .....,.........
100
90
'iii' 80Co
g 70o
9IZ
~::>C/)wc::::
60
50
40
30
20
10
oo 200 400 600 BOO 1000 1200
MICROSTRAINS (inlin)1400 1600 1800
Figure D.6 Resultant Load vs. Strain in Gages 5 through 8 for Pier C-2
T
GAGES 9and 10/
I If-GAGE 1: V -YIELU -I-
.,. STRAIN
~.-·..·f· ~~.' ~ ¥ 1-..0.
i" .., .' V /.If ~. I--GAGE 11
IITt ...... F ./V
. Ii ."
~,~}'.. /.~ ~.I?' ...-rJ(:..•. V... -
100
90
'iii' 80Co
g 70o
9IZ
~....I::>ffJc::::
60
50
40
30
20
10
oo 200 400 600 BOO 1000 1200
MICROSTRAINS (inlin)1400 1600 1800
Figure D.7 Resultant Load vs. Strain in Gages 9 through 12 for Pier C-2
100

300002500010000 15000 20000MICROSTRAINS (inJin)
5000
:III
II-YIELD
STRAIN
GAGE 3.... .-_........... ..,...-\ '.
.~~-~~......--~..... !" t
1...}5:'-; ,i --- :._--_.......
#.Y _..-..,.- !l1/- I ! II !f-GAGE 1 : Tf-GAGE4
I!: J jI I GAGE 2 !
/ : II f f ~ II !I :
iI :oo
50
350
Ii)0.;g 250
~9 200f-Z~ 150..J::>(J) 100w0:::
300
FigureD.8 Resultant Load vs. Strain in Gages 1 through 4 for Pier D-l
350..--r----r------r-------,----.,..----....,.------,
3000025000
Ii
i
300+---+-----+------+------1-----1------1-------1_ I-YIELD~ I STRAIN;g 250t----i:----t-------+------+------+-----t------l~! GAGE 7 \ ;GAGE 6
9 200t----tI----t-------t-==-~~~i-"!'j'---__l&'--+-----+-----__j!z b.?=.....:_:::~:: _.._....:::::::=.=-~ ::::::::::::::::T'" .. -r··..·........-;<t: 150t-...,"'-=-----1------f-------j:.......,L.f--f-----f---+----+------/f- ~:~ GAGE 5-1 I ! !:5 : I , LGAG 8(J) !
~ 100 Ii / II50 ;jJ I •
il J! i• iO.----I--_----L ---L..--"---"'--.L.-....l.-----L .l....- ----L ---'
o 5000 10000 15000 20000MICROSTRAINS (inJin)
FigureD.9 Resultant Load vs. Strain in Gages 5 through 8 for Pier D-l
101

IIII
I-YIELDI STRAINII
I/GAGE 1I GAGE 10
I1\I
I ....•..••_...............-+- ~ .I .-.r .............................:..; t",I ..,..:c. _...... I~.~.... J i
~7 GAGE9-l t 1/I/! /. ; II-GAGE
12I :I !
I /l ht ~I /I "j jI :
350
300-(/)c.:.i2 250-0«0 200...J
I-Z
~ 150...J:::::>(J) 100w0:::
50
oo 5000 10000 15000 20000
MICROSTRAINS (inlin)25000 30000
Figure D.10 Resultant Loadvs. Strain in Gages 9 through 12for Pier D-1
II
III
III
III
GAGEb STRAIN ;~AGt:l
.~vGAGE 4 ..-: \'A J--t..,,' /V"~
~..-- .......~ V'.: .. .....Z- ,./ t".... .....
" v~:yJ.--A.J ....~-~.'•... y"-;: ...~~.. /" .....)0" .-A......... fF"' .........
~ GAGE 3.e';;I':::..~- .ee:..:;;;.-::........ ........... .....
~•... ¥~~......... ..~ .-
......
100
90
'iil 80c.g 70o~...J
IZ
~...J:::::>U)w0:::
60
50
40
30
20
10
oo 200 400 600 800 1000 1200
MICROSTRAINS (inlin)1400 1600 1800
Figure D.ll Resultant Load vs. Strain in Gages 1 through 4 for Pier D-2
102

!
STRAIN
GAGES ,GAGE 6
~AGE8 \ .) ..1....".~ ,.•.<~~~7',/•,'1/:;('
t......
~~~~ ..: 'li. ....~.,.;;;.~ ~...-. " .......
.~~....~r .~ \GAGE7
...- ..;;:::::..;::::;:::-
~........~V-..", ....k.;:::..•••
100
90
- 80/I)
0.g 700« 600...J
I- 50z«40~
::>30(J)
w0:: 20
10
oo 200 400 600 800 1000 1200
MICROSTRAINS (inlin)1400 1600 1800
Figure D.12 Resultant Loadvs. Strain in Gages 5 through 8for Pier D-2
!
(AGE 12 ,GAGE 0 STRAIN
.. ~ ..J.n.GAGE 9 ~I
~ ·7/¥~ •.:'..... "!..,..l~~ .....\ ..~ • "GAGE 11
/~ "h V,,---. " ..~ [".>"'
~.........
/: ~ I..... /.........
100
90
8: 80;g 70Cl
9IZ
~...J::>(J)wa::
60
50
40
30
20
10
oo 200 400 600 800 1000 1200
MICROSTRAINS (inlin)1400 1600 1800
Figure D.13 Resultant Loadvs. Strain in Gages 9 through 12for Pier D-2
103


BIBLIOGRAPHY
American Association of State Highway and Transportation Officials, Standard Specifications forHighway Bridges, Fifteenth Edition, Washington D.C., 1992.
American Concrete Institute, Building Code Requirements for Reinforced Concrete (ACI 318-89) andCommentary - 3l8R-89, Detroit, 1989.
Anderson, R. Bo, "Behavior of CCT-Nodes in Reinforced Concrete Strut-and-Tie Models", Master'sThesis, University of Texas at Austin, December 1988.
Barton, Do L., "Detailing of Structural Concrete Dapped End Beams", Master's Thesis, UniversityofTexas at Austin, December 1988.
Barton, D. L., Anderson, R. B., Bouadi, A, Jirsa, J. 0., and Breen, J. Eo, "An Investigation ofStrut-and-Tie Models for Dapped Beam Details", Research Report 1127-1, Center for TransportationResearch, The University of Texas at Austin, May 1991.
Bergrneister, K, Breen, J. Eo, Jirsa, J. 0., and Kreger, Mo Eo, "Detailing for Structural Concrete Draft Report", Research Report 1127-3F, Center for Transportation Research, The University ofTexas at Austin, October 19900
Bouadi, A, "Behavior of CCT Nodes in Structural Concrete Strut-and-Tie Models", Master's Thesis,The University of Texas at Austin, December 1989.
Park, R., and Paulay, T., Reinforced Concrete Structures, John Wiley & Sons, New York, 1975.
Powers, A Co, "Shear Strength of Pretensioned Concrete Girders in Negative Moment Regions",Master's Thesis, The University of Texas at Austin, May 19890
Salmon, C. Go, and Wang, Co K, Reinforced Concrete Design, Fourth Edition, Harper & Row,New York, 19850
Schlaich, J., Schafer, K, and Jennewein, Mo, "Towards a Consistent Design of Structural Concrete",PCI Journal, May-June 1987, pp. 75-150.
Yura, J. A, Plastic Design in Metals Class Notes, The University of Texas at Austin, Spring 19920
105
Related Documents