Olive Garden wants to know. So do Barnes and Noble, PepsiCo, and L.L.Bean. Even your local car dealer and transit authority are curious. They all want to know how well they are doing and how they score against the measures they strive to meet. The balanced scorecard can help them answer this question by evaluating key performance measures. Many companies have successfully used the balanced scorecard approach. Infosys Technologies, one of India’s leading information technology companies, is one of them. Balanced Scorecard Helps Infosys Transform into a Leading Consultancy 1 In the early 2000s, Infosys Technologies was a company in transition. The Bangalore-based company was a market leader in information technology outsourcing, but needed to expand to meet increased client demand. Infosys invested in many new areas including business process outsourcing, project management, and management consulting. This put Infosys in direct competition with established consulting firms, such as IBM and Accenture. Led by CEO Kris Gopalakrishnan, the company developed an integrated management structure that would help align these new, diverse initiatives. Infosys turned to the balanced scorecard to provide a framework the company could use to formulate and monitor its strategy. The balanced scorecard measures corporate performance along four dimensions—financial, customer, internal business process, and learning and growth. The balanced scorecard immediately played a role in the transformation of Infosys. The executive team used the scorecard to guide discussion during its meetings. The continual process of adaptation, execution, and management that the scorecard fostered helped the team respond to, and even anticipate, its clients’ evolving needs. Eventually, use of the scorecard for performance measurement spread to the rest of the organization, with monetary incentives linked to the company’s performance along the different dimensions. Over time, the balanced scorecard became part of the Infosys culture. In recent years, Infosys has begun using the balanced Learning Objectives 1. Recognize which of two generic strategies a company is using 2. Understand what comprises reengineering 3. Understand the four perspectives of the balanced scorecard 4. Analyze changes in operating income to evaluate strategy 5. Identify unused capacity and how to manage it 13 Strategy, Balanced Scorecard, and Strategic Profitability Analysis 1 Source: Asis Martinez-Jerez, F., Robert S. Kaplan, and Katherine Miller. 2011. Infosys’s relationship scorecard: Measuring transformational partnerships. Harvard Business School Case No. 9-109-006. Boston: Harvard Business School Publishing. 466

Welcome message from author
This document is posted to help you gain knowledge. Please leave a comment to let me know what you think about it! Share it to your friends and learn new things together.
Transcript
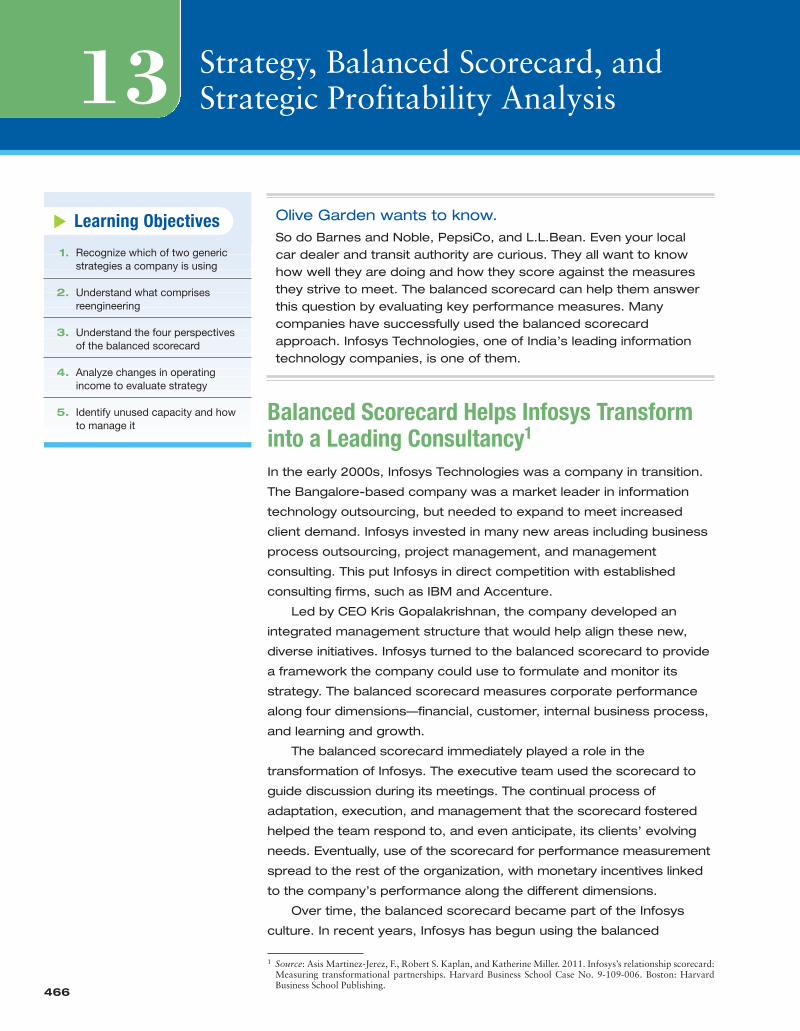
Olive Garden wants to know. So do Barnes and Noble, PepsiCo, and L.L.Bean. Even your localcar dealer and transit authority are curious. They all want to knowhow well they are doing and how they score against the measuresthey strive to meet. The balanced scorecard can help them answerthis question by evaluating key performance measures. Manycompanies have successfully used the balanced scorecardapproach. Infosys Technologies, one of India’s leading informationtechnology companies, is one of them.
Balanced Scorecard Helps Infosys Transforminto a Leading Consultancy1
In the early 2000s, Infosys Technologies was a company in transition.
The Bangalore-based company was a market leader in information
technology outsourcing, but needed to expand to meet increased
client demand. Infosys invested in many new areas including business
process outsourcing, project management, and management
consulting. This put Infosys in direct competition with established
consulting firms, such as IBM and Accenture.
Led by CEO Kris Gopalakrishnan, the company developed an
integrated management structure that would help align these new,
diverse initiatives. Infosys turned to the balanced scorecard to provide
a framework the company could use to formulate and monitor its
strategy. The balanced scorecard measures corporate performance
along four dimensions—financial, customer, internal business process,
and learning and growth.
The balanced scorecard immediately played a role in the
transformation of Infosys. The executive team used the scorecard to
guide discussion during its meetings. The continual process of
adaptation, execution, and management that the scorecard fostered
helped the team respond to, and even anticipate, its clients’ evolving
needs. Eventually, use of the scorecard for performance measurement
spread to the rest of the organization, with monetary incentives linked
to the company’s performance along the different dimensions.
Over time, the balanced scorecard became part of the Infosys
culture. In recent years, Infosys has begun using the balanced
Learning Objectives
1. Recognize which of two genericstrategies a company is using
2. Understand what comprisesreengineering
3. Understand the four perspectivesof the balanced scorecard
4. Analyze changes in operatingincome to evaluate strategy
5. Identify unused capacity and howto manage it
�
13 Strategy, Balanced Scorecard, andStrategic Profitability Analysis
1 Source: Asis Martinez-Jerez, F., Robert S. Kaplan, and Katherine Miller. 2011. Infosys’s relationship scorecard:Measuring transformational partnerships. Harvard Business School Case No. 9-109-006. Boston: HarvardBusiness School Publishing.
466

scorecard concept to create “relationship scorecards” for many
of its largest clients. Using the scorecard framework, Infosys
began measuring its performance for key clients not only on
project management and client satisfaction, but also on repeat
business and anticipating clients’ future strategic needs.
The balanced scorecard helped successfully steer the
transformation of Infosys from a technology outsourcer to a
leading business consultancy. From 1999 to 2007, the company
had a compound annual growth rate of 50%, with sales growing
from $120 million in 1999 to more than $3 billion in 2007. Infosys
was recognized for its achievements by making the Wired 40,
BusinessWeek IT 100, and BusinessWeek Most Innovative
Companies lists.
This chapter focuses on how management accounting
information helps companies such as Infosys, Merck, Verizon,
and Volkswagen implement and evaluate their strategies.
Strategy drives the operations of a company and guides
managers’ short-run and long-run decisions. We describe the
balanced scorecard approach to implementing strategy and
methods to analyze operating income to evaluate the success
of a strategy. We also show how management accounting
information helps strategic initiatives, such as productivity
improvement, reengineering, and downsizing.
What Is Strategy?Strategy specifies how an organization matches its own capabilities with the opportuni-ties in the marketplace to accomplish its objectives. In other words, strategy describeshow an organization can create value for its customers while differentiating itself fromits competitors. For example, Wal-Mart, the retail giant, creates value for its customersby locating stores in suburban and rural areas, and by offering low prices, a wide rangeof product categories, and few choices within each product category. Consistent with itsstrategy, Wal-Mart has developed the capability to keep costs down by aggressivelynegotiating low prices with its suppliers in exchange for high volumes and by maintain-ing a no-frills, cost-conscious environment.
In formulating its strategy, an organization must first thoroughly understand itsindustry. Industry analysis focuses on five forces: (1) competitors, (2) potential entrantsinto the market, (3) equivalent products, (4) bargaining power of customers, and (5) bar-gaining power of input suppliers.2 The collective effect of these forces shapes an organiza-tion’s profit potential. In general, profit potential decreases with greater competition,stronger potential entrants, products that are similar, and more-demanding customers andsuppliers. We illustrate these five forces for Chipset, Inc., maker of linear integrated circuit
2 M. Porter, Competitive Strategy (New York: Free Press, 1980); M. Porter, Competitive Advantage (New York: Free Press,1985); and M. Porter, “What Is Strategy?” Harvard Business Review (November–December 1996): 61–78.
LearningObjective 1
Recognize which of twogeneric strategies acompany is using
. . . productdifferentiation orcost leadership

468 � CHAPTER 13 STRATEGY, BALANCED SCORECARD, AND STRATEGIC PROFITABILITY ANALYSIS
devices (LICDs) used in modems and communication networks. Chipset produces a singlespecialized product, CX1, a standard, high-performance microchip, which can be used inmultiple applications. Chipset designed CX1 with extensive input from customers.
1. Competitors. The CX1 model faces severe competition with respect to price, timelydelivery, and quality. Companies in the industry have high fixed costs, and persistentpressures to reduce selling prices and utilize capacity fully. Price reductions spurgrowth because it makes LICDs a cost-effective option in new applications such asdigital subscriber lines (DSLs).
2. Potential entrants into the market. The small profit margins and high capital costsdiscourage new entrants. Moreover, incumbent companies such as Chipset are furtherdown the learning curve with respect to lowering costs and building close relation-ships with customers and suppliers.
3. Equivalent products. Chipset tailors CX1 to customer needs and lowers prices bycontinuously improving CX1’s design and processes to reduce production costs. Thisreduces the risk of equivalent products or new technologies replacing CX1.
4. Bargaining power of customers. Customers, such as EarthLink and Verizon, negotiateaggressively with Chipset and its competitors to keep prices down because they buylarge quantities of product.
5. Bargaining power of input suppliers. To produce CX1, Chipset requires high-qualitymaterials (such as silicon wafers, pins for connectivity, and plastic or ceramic packag-ing) and skilled engineers, technicians, and manufacturing labor. The skill-sets suppliersand employees bring gives them bargaining power to demand higher prices and wages.
In summary, strong competition and the bargaining powers of customers and suppliers putsignificant pressure on Chipset’s selling prices. To respond to these challenges, Chipset mustchoose one of two basic strategies: differentiating its product or achieving cost leadership.
Product differentiation is an organization’s ability to offer products or services per-ceived by its customers to be superior and unique relative to the products or services of itscompetitors. Apple Inc. has successfully differentiated its products in the consumer elec-tronics industry, as have Johnson & Johnson in the pharmaceutical industry and Coca-Cola in the soft drink industry. These companies have achieved differentiation throughinnovative product R&D, careful development and promotion of their brands, and therapid push of products to market. Differentiation increases brand loyalty and the willing-ness of customers to pay higher prices.
Cost leadership is an organization’s ability to achieve lower costs relative to competi-tors through productivity and efficiency improvements, elimination of waste, and tightcost control. Cost leaders in their respective industries include Wal-Mart (consumer retail-ing), Home Depot and Lowe’s (building products), Texas Instruments (consumer electron-ics), and Emerson Electric (electric motors). These companies provide products andservices that are similar to—not differentiated from—their competitors, but at a lowercost to the customer. Lower selling prices, rather than unique products or services, pro-vide a competitive advantage for these cost leaders.
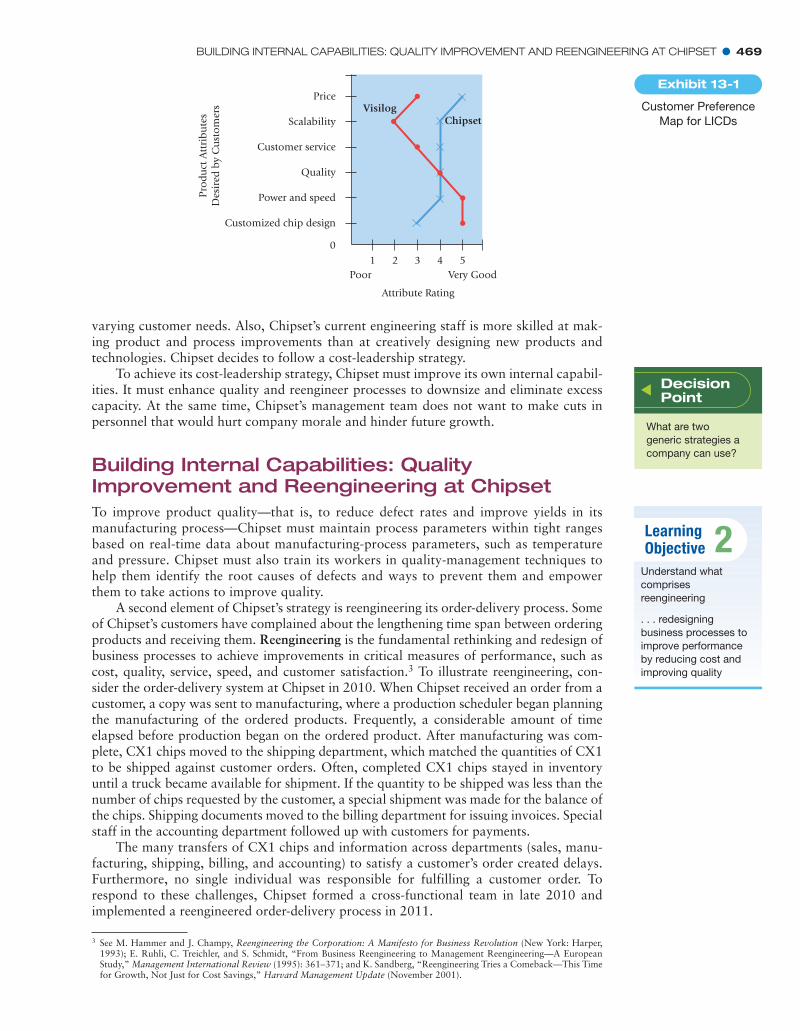
What strategy should Chipset follow? To help it decide, Chipset develops the cus-tomer preference map shown in Exhibit 13-1. The y-axis describes various attributes ofthe product desired by customers. The x-axis describes how well Chipset and Visilog, acompetitor of Chipset that follows a product-differentiation strategy, do along the variousattributes desired by customers from 1 (poor) to 5 (very good). The map highlights thetrade-offs in any strategy. It shows the advantages CX1 enjoys in terms of price, scalabil-ity (the CX1 technology allows Chispet’s customer to achieve different performance levelsby simply altering the number of CX1 units in their product), and customer service.Visilog’s chips, however, are faster and more powerful, and are customized for variousapplications such as different types of modems and communication networks.
CX1 is somewhat differentiated from competing products. Differentiating CX1 fur-ther would be costly, but Chipset may be able to charge a higher price. Conversely, reduc-ing the cost of manufacturing CX1 would allow Chipset to lower price, spur growth, andincrease market share. The scalability of CX1 makes it an effective solution for meeting
BUILDING INTERNAL CAPABILITIES: QUALITY IMPROVEMENT AND REENGINEERING AT CHIPSET � 469
Poor Very Good
Attribute Rating
VisilogPrice
Scalability
Customer service
Customized chip design
Power and speed
Quality
01 4 52 3
Chipset
Pro
du
ct A
ttri
bu
tes
Des
ired
by
Cu
sto
mer
s
varying customer needs. Also, Chipset’s current engineering staff is more skilled at mak-ing product and process improvements than at creatively designing new products andtechnologies. Chipset decides to follow a cost-leadership strategy.
To achieve its cost-leadership strategy, Chipset must improve its own internal capabil-ities. It must enhance quality and reengineer processes to downsize and eliminate excesscapacity. At the same time, Chipset’s management team does not want to make cuts inpersonnel that would hurt company morale and hinder future growth.
Building Internal Capabilities: QualityImprovement and Reengineering at ChipsetTo improve product quality—that is, to reduce defect rates and improve yields in itsmanufacturing process—Chipset must maintain process parameters within tight rangesbased on real-time data about manufacturing-process parameters, such as temperatureand pressure. Chipset must also train its workers in quality-management techniques tohelp them identify the root causes of defects and ways to prevent them and empowerthem to take actions to improve quality.
A second element of Chipset’s strategy is reengineering its order-delivery process. Someof Chipset’s customers have complained about the lengthening time span between orderingproducts and receiving them. Reengineering is the fundamental rethinking and redesign ofbusiness processes to achieve improvements in critical measures of performance, such ascost, quality, service, speed, and customer satisfaction.3 To illustrate reengineering, con-sider the order-delivery system at Chipset in 2010. When Chipset received an order from acustomer, a copy was sent to manufacturing, where a production scheduler began planningthe manufacturing of the ordered products. Frequently, a considerable amount of timeelapsed before production began on the ordered product. After manufacturing was com-plete, CX1 chips moved to the shipping department, which matched the quantities of CX1to be shipped against customer orders. Often, completed CX1 chips stayed in inventoryuntil a truck became available for shipment. If the quantity to be shipped was less than thenumber of chips requested by the customer, a special shipment was made for the balance ofthe chips. Shipping documents moved to the billing department for issuing invoices. Specialstaff in the accounting department followed up with customers for payments.
The many transfers of CX1 chips and information across departments (sales, manu-facturing, shipping, billing, and accounting) to satisfy a customer’s order created delays.Furthermore, no single individual was responsible for fulfilling a customer order. Torespond to these challenges, Chipset formed a cross-functional team in late 2010 andimplemented a reengineered order-delivery process in 2011.
3 See M. Hammer and J. Champy, Reengineering the Corporation: A Manifesto for Business Revolution (New York: Harper,1993); E. Ruhli, C. Treichler, and S. Schmidt, “From Business Reengineering to Management Reengineering—A EuropeanStudy,” Management International Review (1995): 361–371; and K. Sandberg, “Reengineering Tries a Comeback—This Timefor Growth, Not Just for Cost Savings,” Harvard Management Update (November 2001).
Customer PreferenceMap for LICDs
Exhibit 13-1
DecisionPoint
What are twogeneric strategies acompany can use?
LearningObjective 2
Understand whatcomprisesreengineering
. . . redesigningbusiness processes toimprove performanceby reducing cost andimproving quality

470 � CHAPTER 13 STRATEGY, BALANCED SCORECARD, AND STRATEGIC PROFITABILITY ANALYSIS
Under the new system, a customer-relationship manager is responsible for each customerand negotiates long-term contracts specifying quantities and prices. The customer-relationshipmanager works closely with the customer and with manufacturing to specify delivery sched-ules for CX1 one month in advance of shipment. The schedule of customer orders and deliv-ery dates is sent electronically to manufacturing. Completed chips are shipped directly fromthe manufacturing plant to customer sites. Each shipment automatically triggers an elec-tronic invoice and customers electronically transfer funds to Chipset’s bank.
Companies, such as AT&T, Banca di America e di Italia, Cigna Insurance, Cisco,PepsiCo, and Siemens Nixdorf, have realized significant benefits by reengineering theirprocesses across design, production, and marketing (just as in the Chipset example).Reengineering has only limited benefits when reengineering efforts focus on only a singleactivity such as shipping or invoicing rather than the entire order-delivery process. To besuccessful, reengineering efforts must focus on changing roles and responsibilities, elimi-nating unnecessary activities and tasks, using information technology, and developingemployee skills.
Take another look at Exhibit 13-1 and note the interrelatedness and consistency inChipset’s strategy. To help meet customer preferences for price, quality, and customerservice, Chipset decides on a cost-leadership strategy. And to achieve cost leadership,Chipset builds internal capabilities by reengineering its processes. Chipset’s next challengeis to effectively implement its strategy
Strategy Implementation and the BalancedScorecardMany organizations, such as Allstate Insurance, Bank of Montreal, BP, and DowChemical, have introduced a balanced scorecard approach to track progress and managethe implementation of their strategies.
The Balanced ScorecardThe balanced scorecard translates an organization’s mission and strategy into a set ofperformance measures that provides the framework for implementing its strategy.4 Thebalanced scorecard does not focus solely on achieving short-run financial objectives. Italso highlights the nonfinancial objectives that an organization must achieve to meet andsustain its financial objectives. The scorecard measures an organization’s performancefrom four perspectives: (1) financial, the profits and value created for shareholders;(2) customer, the success of the company in its target market; (3) internal businessprocesses, the internal operations that create value for customers; and (4) learning andgrowth, the people and system capabilities that support operations. A company’s strat-egy influences the measures it uses to track performance in each of these perspectives.
Why is this tool called a balanced scorecard? Because it balances the use of financialand nonfinancial performance measures to evaluate short-run and long-run performancein a single report. The balanced scorecard reduces managers’ emphasis on short-runfinancial performance, such as quarterly earnings, because the key strategic nonfinancialand operational indicators, such as product quality and customer satisfaction, measurechanges that a company is making for the long run. The financial benefits of these long-run changes may not show up immediately in short-run earnings; however, strongimprovement in nonfinancial measures usually indicates the creation of future economicvalue. For example, an increase in customer satisfaction, as measured by customer surveysand repeat purchases, signals a strong likelihood of higher sales and income in the future.By balancing the mix of financial and nonfinancial measures, the balanced scorecard
4 See R. S. Kaplan and D. P. Norton, The Balanced Scorecard (Boston: Harvard Business School Press, 1996); R. S. Kaplan andD. P. Norton, The Strategy-Focused Organization: How Balanced Scorecard Companies Thrive in the New BusinessEnvironment (Boston: Harvard Business School Press, 2001); R. S. Kaplan and D. P. Norton, Strategy Maps: ConvertingIntangible Assets into Tangible Outcomes (Boston: Harvard Business School Press, 2004); and R. S. Kaplan and D. P. Norton,Alignment: Using the Balanced Scorecard to Create Corporate Synergies (Boston: Harvard Business School Press, 2006).
For simplicity, this chapter, and much of the literature, emphasizes long-run financial objectives as the primary goal offor-profit companies. For-profit companies interested in long-run financial, environmental, and social objectives adapt the bal-anced scorecard to implement all three objectives.
LearningObjective 3
Understand the fourperspectives of thebalanced scorecard
. . . financial, customer,internal businessprocess, and learningand growth
DecisionPoint
What isreengineering?

STRATEGY IMPLEMENTATION AND THE BALANCED SCORECARD � 471
broadens management’s attention to short-run and long-run performance. Never losesight of the key point. In for-profit companies, the primary goal of the balanced scorecardis to sustain long-run financial performance. Nonfinancial measures simply serve asleading indicators for the hard-to-measure long-run financial performance.
Strategy Maps and the Balanced ScorecardWe use the Chipset example to develop strategy maps and the four perspectives of thebalanced scorecard. The objectives and measures Chipset’s managers choose for eachperspective relates to the action plans for furthering Chipset’s cost leadership strategy:improving quality and reengineering processes.
Strategy Maps
A useful first step in designing a balanced scorecard is a strategy map. A strategy map is adiagram that describes how an organization creates value by connecting strategic objec-tives in explicit cause-and-effect relationships with each other in the financial, customer,internal business process, and learning and growth perspectives. Exhibit 13-2 presentsChipset’s strategy map. Follow the arrows to see how a strategic objective affects otherstrategic objectives. For example, empowering the workforce helps align employee andorganization goals and improves processes. Employee and organizational alignment alsohelps improve processes that improve manufacturing quality and productivity, reduce cus-tomer delivery time, meet specified delivery dates, and improve post-sales service, all ofwhich increase customer satisfaction. Improving manufacturing quality and productivity
Grow operatingincome
Increaseshareholder
value
FINANCIALPERSPECTIVE
CUSTOMERPERSPECTIVE
INTERNAL-BUSINESS-PROCESSPERSPECTIVE
LEARNINGAND GROWTHPERSPECTIVE
Developprocess
skill
Enhanceinformation system
capabilities
Increasecustomer-
satisfaction
Increasemarketshare
Improvemanufacturing
capability
Reduce deliverytime to customers
Meet specifieddelivery dates
Improvepost-sales service
Improvemanufacturing
quality andproductivity
Improveprocesses
Align employeeand organization
goals
Empowerworkforce
Exhibit 13-2 Strategy Map for Chipset, Inc., for 2011
472 � CHAPTER 13 STRATEGY, BALANCED SCORECARD, AND STRATEGIC PROFITABILITY ANALYSIS
grows operating income and increases customer satisfaction that, in turn, increases mar-ket share, operating income, and shareholder value.
Chipset operates in a knowledge-intensive business. To compete successfully, Chipsetinvests in its employees, implements new technology and process controls, improves quality,and reengineers processes. Doing these activities well enables Chipset to build capabilitiesand intangible assets, which are not recorded as assets in its financial books. The strategymap helps Chipset evaluate whether these intangible assets are generating financial returns.
Chipset could include many other cause-and-effect relationships in the strategy mapin Exhibit 13-2. But, Chipset, like other companies implementing the balanced scorecard,focuses on only those relationships that it believes to be the most significant.
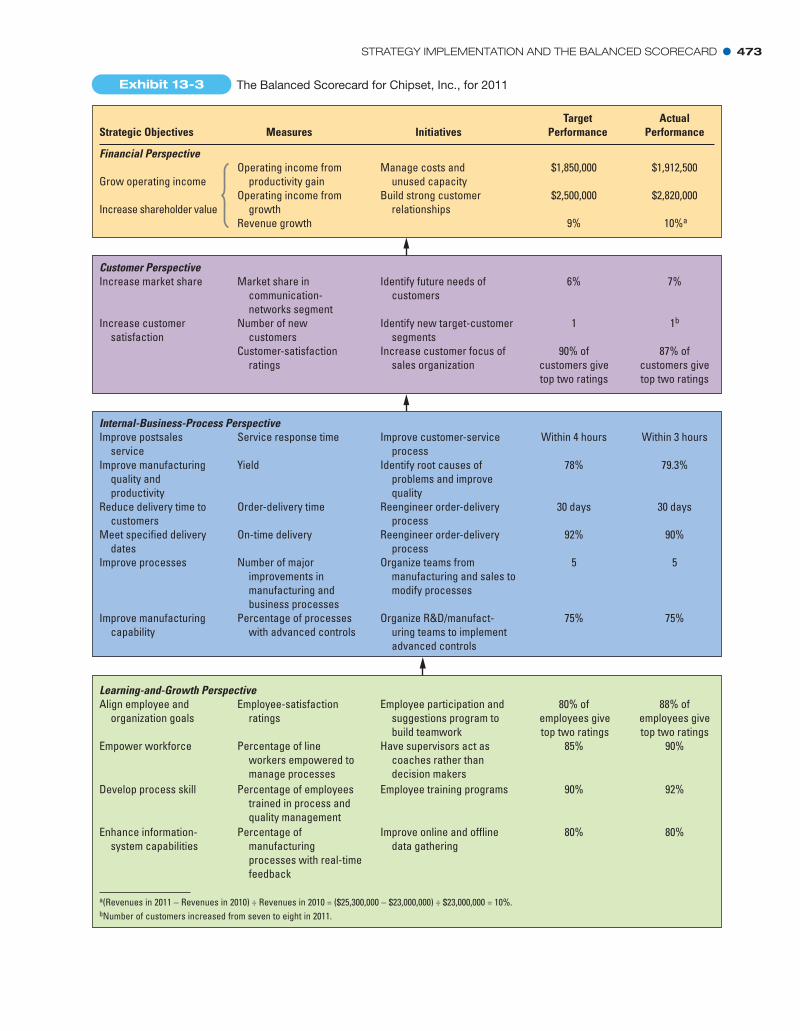
Chipset uses the strategy map from Exhibit 13-2 to build the balanced scorecard pre-sented in Exhibit 13-3. The scorecard highlights the four perspectives of performance:financial, customer, internal business process, and learning and growth. The first columnpresents the strategic objectives from the strategy map in Exhibit 13-2. At the beginningof 2011, the company’s managers specify the strategic objectives, measures, initiatives (theactions necessary to achieve the objectives), and target performance (the first fourcolumns of Exhibit 13-3).
Chipset wants to use the balanced scorecard targets to drive the organization tohigher levels of performance. Managers therefore set targets at a level of performance thatis achievable, yet distinctly better than competitors. Chipset’s managers complete the fifthcolumn, reporting actual performance at the end of 2011. This column comparesChipset’s performance relative to target.
Four Perspectives of the Balanced Scorecard
We next describe the perspectives in general terms and illustrate each perspective usingthe measures chosen by Chipset in the context of its strategy.
1. Financial perspective. This perspective evaluates the profitability of the strategy and thecreation of shareholder value. Because Chipset’s key strategic initiatives are cost reduc-tion relative to competitors’ costs and sales growth, the financial perspective focuses onhow much operating income results from reducing costs and selling more units of CX1.
2. Customer perspective. This perspective identifies targeted customer and market seg-ments and measures the company’s success in these segments. To monitor its customerobjectives, Chipset uses measures such as market share in the communication-networkssegment, number of new customers, and customer-satisfaction ratings.
3. Internal-business-process perspective. This perspective focuses on internal operationsthat create value for customers that, in turn, help achieve financial performance. Chipsetdetermines internal-business-process improvement targets after benchmarking against itsmain competitors using information from published financial statements, prevailingprices, customers, suppliers, former employees, industry experts, and financial analysts.The internal-business-process perspective comprises three subprocesses:� Innovation process: Creating products, services, and processes that will meet the
needs of customers. This is a very important process for companies that follow aproduct-differentiation strategy and must constantly design and develop innovativenew products to remain competitive in the marketplace. Chipset’s innovation focuseson improving its manufacturing capability and process controls to lower costs andimprove quality. Chipset measures innovation by the number of improvements inmanufacturing processes and percentage of processes with advanced controls.
� Operations process: Producing and delivering existing products and services that willmeet the needs of customers. Chipset’s strategic initiatives are (a) improving manu-facturing quality, (b) reducing delivery time to customers, and (c) meeting specifieddelivery dates so it measures yield, order-delivery time, and on-time deliveries.
� Postsales-service process: Providing service and support to the customer after thesale of a product or service. Chipset monitors how quickly and accurately it isresponding to customer-service requests.
STRATEGY IMPLEMENTATION AND THE BALANCED SCORECARD � 473
Target ActualStrategic Objectives Measures Initiatives Performance Performance
Financial PerspectiveOperating income from Manage costs and $1,850,000 $1,912,500
productivity gain unused capacityGrow operating incomeOperating income from Build strong customer $2,500,000 $2,820,000
Increase shareholder value growth relationshipsRevenue growth 9% 10%a
Customer PerspectiveIncrease market share Market share in Identify future needs of 6% 7%
communication- customersnetworks segment
Increase customer Number of new Identify new target-customer 1 1b
satisfaction customers segmentsCustomer-satisfaction Increase customer focus of 90% of 87% of
ratings sales organization customers give customers givetop two ratings top two ratings
Internal-Business-Process Perspective
Improve manufacturing Yield Identify root causes of 78% 79.3%quality and problems and improveproductivity quality
Reduce delivery time to Order-delivery time Reengineer order-delivery 30 days 30 dayscustomers process
Meet specified delivery On-time delivery Reengineer order-delivery 92% 90%dates process
Improve postsales Service response time Improve customer-service Within 4 hours Within 3 hoursservice process
Improve processes Number of major Organize teams from 5 5improvements in manufacturing and sales tomanufacturing and modify processesbusiness processes
Improve manufacturing Percentage of processes Organize R&D/manufact- 75% 75%capability with advanced controls uring teams to implement
advanced controls
Learning-and-Growth PerspectiveAlign employee and Employee-satisfaction Employee participation and 80% of 88% of
organization goals ratings suggestions program to employees give employees givebuild teamwork top two ratings top two ratings
Develop process skill Percentage of employees Employee training programs 90% 92%trained in process and quality management
Empower workforce Percentage of line Have supervisors act as 85% 90%workers empowered to coaches rather thanmanage processes decision makers
Enhance information- Percentage of Improve online and offline 80% 80%system capabilities manufacturing data gathering
processes with real-time feedback
a(Revenues in 2011 − Revenues in 2010) ÷ Revenues in 2010 = ($25,300,000 − $23,000,000) ÷ $23,000,000 = 10%.bNumber of customers increased from seven to eight in 2011.
Exhibit 13-3 The Balanced Scorecard for Chipset, Inc., for 2011

474 � CHAPTER 13 STRATEGY, BALANCED SCORECARD, AND STRATEGIC PROFITABILITY ANALYSIS
4. Learning-and-growth perspective. This perspective identifies the capabilities the organ-ization must excel at to achieve superior internal processes that in turn create value forcustomers and shareholders. Chipset’s learning and growth perspective emphasizesthree capabilities: (1) information-system capabilities, measured by the percentage ofmanufacturing processes with real-time feedback; (2) employee capabilities, measuredby the percentage of employees trained in process and quality management; and(3) motivation, measured by employee satisfaction and the percentage of manufactur-ing and sales employees (line employees) empowered to manage processes.
The arrows in Exhibit 13-3 indicate the broad cause-and-effect linkages: how gains in thelearning-and-growth perspective lead to improvements in internal business processes, whichlead to higher customer satisfaction and market share, and finally lead to superior financialperformance. Note how the scorecard describes elements of Chipset’s strategy implementa-tion. Worker training and empowerment improve employee satisfaction and lead to manu-facturing and business-process improvements that improve quality and reduce deliverytime. The result is increased customer satisfaction and higher market share. These initiativeshave been successful from a financial perspective. Chipset has earned significant operatingincome from its cost leadership strategy, and that strategy has also led to growth.
A major benefit of the balanced scorecard is that it promotes causal thinking. Thinkof the balanced scorecard as a linked scorecard or a causal scorecard. Managers mustsearch for empirical evidence (rather than rely on faith alone) to test the validity andstrength of the various connections. A causal scorecard enables a company to focus on thekey drivers that steer the implementation of the strategy. Without convincing links, thescorecard loses much of its value.
Implementing a Balanced ScorecardTo successfully implement a balanced scorecard requires commitment and leadershipfrom top management. At Chipset, the team building the balanced scorecard (headed bythe vice president of strategic planning) conducted interviews with senior managers,probed executives about customers, competitors, and technological developments, andsought proposals for balanced scorecard objectives across the four perspectives. Theteam then met to discuss the responses and to build a prioritized list of objectives.
In a meeting with all senior managers, the team sought to achieve consensus on thescorecard objectives. Senior management was then divided into four groups, with eachgroup responsible for one of the perspectives. In addition, each group broadened the baseof inputs by including representatives from the next-lower levels of management and keyfunctional managers. The groups identified measures for each objective and the sources ofinformation for each measure. The groups then met to finalize scorecard objectives, meas-ures, targets, and the initiatives to achieve the targets. Management accountants playedan important role in the design and implementation of the balanced scorecard, particu-larly in determining measures to represent the realities of the business. This required man-agement accountants to understand the economic environment of the industry, Chipset’scustomers and competitors, and internal business issues such as human resources, opera-tions, and distribution.
Managers made sure that employees understood the scorecard and the scorecardprocess. The final balanced scorecard was communicated to all employees. Sharing thescorecard allowed engineers and operating personnel, for example, to understand the rea-sons for customer satisfaction and dissatisfaction and to make suggestions for improvinginternal processes directly aimed at satisfying customers and implementing Chipset’s strat-egy. Too often, scorecards are seen by only a select group of managers. By limiting thescorecard’s exposure, an organization loses the opportunity for widespread organizationengagement and alignment.
Chipset (like Cigna Property, Casualty Insurance, and Wells Fargo) also encourageseach department to develop its own scorecard that ties into Chipset’s main scorecarddescribed in Exhibit 13-3. For example, the quality control department’s scorecard hasmeasures that its department managers use to improve yield—number of quality circles,statistical process control charts, Pareto diagrams, and root-cause analyses (see

STRATEGY IMPLEMENTATION AND THE BALANCED SCORECARD � 475
Chapter 19, pp. 675–677 for more details). Department scorecards help align the actionsof each department to implement Chipset’s strategy.
Companies frequently use balanced scorecards to evaluate and reward managerial per-formance and to influence managerial behavior. Using the balanced scorecard for perform-ance evaluation widens the performance management lens and motivates managers to givegreater attention to nonfinancial drivers of performance. Surveys indicate, however, thatcompanies continue to assign more weight to the financial perspective (55%) than to theother perspectives—customer (19%), internal business process (12%), and learning andgrowth (14%). Companies cite several reasons for the relatively smaller weight on non-financial measures: difficulty evaluating the relative importance of nonfinancial measures;challenges in measuring and quantifying qualitative, nonfinancial data; and difficulty incompensating managers despite poor financial performance (see Chapter 23 for a moredetailed discussion of performance evaluation). Many companies, however, are givinggreater weight to nonfinancial measures in promotion decisions because they believe thatnonfinancial measures (such as customer satisfaction, process improvements, and employeemotivation) better assess a manager’s potential to succeed at senior levels of management.For the balanced scorecard to be effective, managers must view it as fairly assessing andrewarding all important aspects of a manager’s performance and promotion prospects.
Aligning the Balanced Scorecard to StrategyDifferent strategies call for different scorecards. Recall Chipset’s competitor Visilog,which follows a product-differentiation strategy by designing custom chips for modemsand communication networks. Visilog designs its balanced scorecard to fit its strategy.For example, in the financial perspective, Visilog evaluates how much of its operatingincome comes from charging premium prices for its products. In the customer perspec-tive, Visilog measures the percentage of its revenues from new products and new cus-tomers. In the internal-business-process perspective, Visilog measures the number of newproducts introduced and new product development time. In the learning-and-growthperspective, Visilog measures the development of advanced manufacturing capabilities toproduce custom chips. Visilog also uses some of the measures described in Chipset’s bal-anced scorecard in Exhibit 13-3. For example, revenue growth, customer satisfactionratings, order-delivery time, on-time delivery, percentage of frontline workers empow-ered to manage processes, and employee-satisfaction ratings are also important measuresunder the product-differentiation strategy. The goal is to align the balanced scorecardwith company strategy.5 Exhibit 13-4 presents some common measures found on com-pany scorecards in the service, retail, and manufacturing sectors.
Features of a Good Balanced ScorecardA well-designed balanced scorecard has several features:
1. It tells the story of a company’s strategy, articulating a sequence of cause-and-effectrelationships—the links among the various perspectives that align implementation ofthe strategy. In for-profit companies, each measure in the scorecard is part of a cause-and-effect chain leading to financial outcomes. Not-for-profit organizations designthe cause-and-effect chain to achieve their strategic service objectives—for example,number of people no longer in poverty, or number of children still in school.
2. The balanced scorecard helps to communicate the strategy to all members of theorganization by translating the strategy into a coherent and linked set of understand-able and measurable operational targets. Guided by the scorecard, managers andemployees take actions and make decisions to achieve the company’s strategy.Companies that have distinct strategic business units (SBUs)—such as consumer
5 For simplicity, we have presented the balanced scorecard in the context of companies that have followed either a cost-leadershipor a product-differentiation strategy. Of course, a company may have some products for which cost leadership is critical andother products for which product differentiation is important. The company will then develop separate scorecards to implementthe different product strategies. In still other contexts, product differentiation may be of primary importance, but some cost lead-ership must also be achieved. The balanced scorecard measures would then be linked in a cause-and-effect way to this strategy.

476 � CHAPTER 13 STRATEGY, BALANCED SCORECARD, AND STRATEGIC PROFITABILITY ANALYSIS
Financial Perspective
Income and investment measures: Economic value added a(EVA®), return on investmentRevenue and cost measures: Revenue growth, revenues from new products, cost reductions in key areasIncome measures: Operating income, gross margin percentage
Customer PerspectiveMarket share, customer satisfaction, customer-retention percentage, time taken to fulfill customers’requests, number of customer complaintsInternal-Business-Process PerspectiveInnovation Process: Operating capabilities, number of new products or services, new-productdevelopment times, and number of new patentsOperations Process: Yield, defect rates, time taken to deliver product to customers, percentage of on-timedeliveries, average time taken to respond to orders, setup time, manufacturing downtimePostsales Service Process: Time taken to replace or repair defective products, hours of customer trainingfor using the productLearning-and-Growth PerspectiveEmployee measures: Employee education and skill levels, employee-satisfaction ratings, employeeturnover rates, percentage of employee suggestions implemented, percentage of compensation based onindividual and team incentivesTechnology measures: Information system availability, percentage of processes with advanced controls
aThis measure is described in Chapter 23.
products and pharmaceuticals at Johnson & Johnson—develop their balanced score-cards at the SBU level. Each SBU has its own unique strategy and implementationgoals; building separate scorecards allows each SBU to choose measures that helpimplement its distinctive strategy.
3. In for-profit companies, the balanced scorecard must motivate managers to takeactions that eventually result in improvements in financial performance. Managerssometimes tend to focus too much on innovation, quality, and customer satisfaction asends in themselves. For example, Xerox spent heavily to increase customer satisfactionwithout a resulting financial payoff because higher levels of satisfaction did notincrease customer loyalty. Some companies use statistical methods, such as regressionanalysis, to test the anticipated cause-and-effect relationships among nonfinancialmeasures and financial performance. The data for this analysis can come from eithertime series data (collected over time) or cross-sectional data (collected, for example,across multiple stores of a retail chain). In the Chipset example, improvements in non-financial factors have, in fact, already led to improvements in financial factors.
4. The balanced scorecard limits the number of measures, identifying only the most crit-ical ones. Chipset’s scorecard, for example, has 16 measures, between 3 and 6 meas-ures for each perspective. Limiting the number of measures focuses managers’attention on those that most affect strategy implementation. Using too many meas-ures makes it difficult for managers to process relevant information.
5. The balanced scorecard highlights less-than-optimal trade-offs that managers maymake when they fail to consider operational and financial measures together. Forexample, a company whose strategy is innovation and product differentiation couldachieve superior short-run financial performance by reducing spending on R&D. Agood balanced scorecard would signal that the short-run financial performance mighthave been achieved by taking actions that hurt future financial performance because aleading indicator of that performance, R&D spending and R&D output, has declined.
Pitfalls in Implementing a Balanced ScorecardPitfalls to avoid in implementing a balanced scorecard include the following:
1. Managers should not assume the cause-and-effect linkages are precise. They are merelyhypotheses. Over time, a company must gather evidence of the strength and timingof the linkages among the nonfinancial and financial measures. With experience,
Frequently CitedBalanced Scorecard
Measures
Exhibit 13-4

STRATEGY IMPLEMENTATION AND THE BALANCED SCORECARD � 477
organizations should alter their scorecards to include those nonfinancial strategicobjectives and measures that are the best leading indicators (the causes) of financial per-formance (a lagging indicator or the effect). Understanding that the scorecard evolvesover time helps managers avoid unproductively spending time and money trying todesign the “perfect” scorecard at the outset. Furthermore, as the business environmentand strategy change over time, the measures in the scorecard also need to change.
2. Managers should not seek improvements across all of the measures all of the time.For example, strive for quality and on-time performance but not beyond the point atwhich further improvement in these objectives is so costly that it is inconsistent withlong-run profit maximization. Cost-benefit considerations should always be centralwhen designing a balanced scorecard.
3. Managers should not use only objective measures in the balanced scorecard. Chipset’sbalanced scorecard includes both objective measures (such as operating income fromcost leadership, market share, and manufacturing yield) and subjective measures (suchas customer- and employee-satisfaction ratings). When using subjective measures,though, managers must be careful that the benefits of this potentially rich informationare not lost by using measures that are inaccurate or that can be easily manipulated.
4. Despite challenges of measurement, top management should not ignore nonfinancialmeasures when evaluating managers and other employees. Managers tend to focus onthe measures used to reward their performance. Excluding nonfinancial measureswhen evaluating performance will reduce the significance and importance that man-agers give to nonfinancial measures.
Evaluating the Success of Strategy and ImplementationTo evaluate how successful Chipset’s strategy and its implementation have been, its man-agement compares the target- and actual-performance columns in the balanced scorecard(Exhibit 13-3). Chipset met most targets set on the basis of competitor benchmarks in2011 itself. That’s because, in the Chipset context, improvements in the learning andgrowth perspective quickly ripple through to the financial perspective. Chipset will con-tinue to seek improvements on the targets it did not achieve, but meeting most targetssuggests that the strategic initiatives that Chipset identified and measured for learningand growth resulted in improvements in internal business processes, customer measures,and financial performance.
How would Chipset know if it had problems in strategy implementation? If it did notmeet its targets on the two perspectives that are more internally focused: learning andgrowth and internal business processes.
What if Chipset performed well on learning and growth and internal businessprocesses, but customer measures and financial performance in this year and the next didnot improve? Chipset’s managers would then conclude that Chipset did a good job ofimplementation (the various internal nonfinancial measures it targeted improved) but thatits strategy was faulty (there was no effect on customers or on long-run financial perform-ance and value creation). Management failed to identify the correct causal links. It imple-mented the wrong strategy well! Management would then reevaluate the strategy and thefactors that drive it.
Now what if Chipset performed well on its various nonfinancial measures, andoperating income over this year and the next also increased? Chipset’s managers mightbe tempted to declare the strategy a success because operating income increased.Unfortunately, management still cannot conclude with any confidence that Chipsetsuccessfully formulated and implemented its strategy. Why? Because operating incomecan increase simply because entire markets are expanding, not because a company’sstrategy has been successful. Also, changes in operating income might occur because offactors outside the strategy. For example, a company such as Chipset that has chosen acost-leadership strategy may find that its operating-income increase actually resultedfrom, say, some degree of product differentiation. To evaluate the success of a strategy,managers and management accountants need to link strategy to the sources of operating-income increases.
DecisionPoint
How can anorganization translateits strategy into a setof performancemeasures?
478 � CHAPTER 13 STRATEGY, BALANCED SCORECARD, AND STRATEGIC PROFITABILITY ANALYSIS
For Chipset to conclude that it was successful in implementing its strategy, it mustdemonstrate that improvements in its financial performance and operating income overtime resulted from achieving targeted cost savings and growth in market share.Fortunately, the top two rows of Chipset’s balanced scorecard in Exhibit 13-3 show thatoperating-income gains from productivity ($1,912,500) and growth ($2,820,000)exceeded targets. The next section of this chapter describes how these numbers were cal-culated. Because its strategy has been successful, Chipset’s management can be more con-fident that the gains will be sustained in subsequent years.
Chipset’s management accountants subdivide changes in operating income into com-ponents that can be identified with product differentiation, cost leadership, and growth.Why growth? Because successful product differentiation or cost leadership generallyincreases market share and helps a company to grow. Subdividing the change in operatingincome to evaluate the success of a strategy is conceptually similar to the variance analy-sis discussed in Chapters 7 and 8. One difference, however, is that management account-ants compare actual operating performance over two different periods, not actual tobudgeted numbers in the same time period as in variance analysis.6
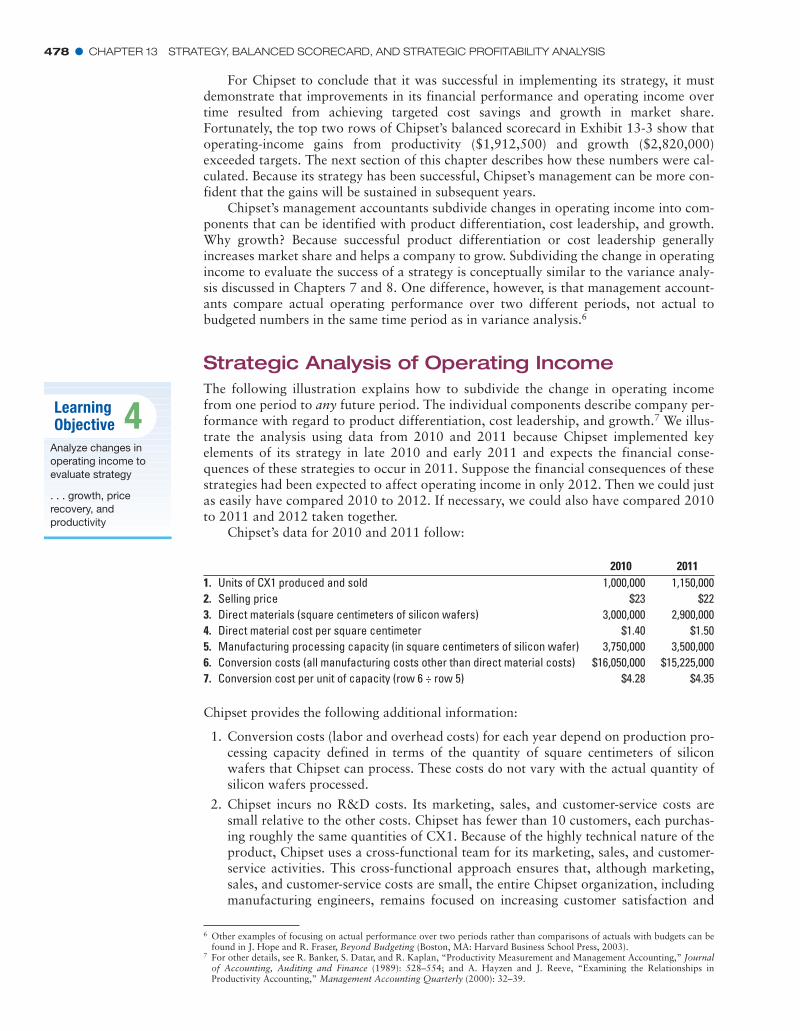
Strategic Analysis of Operating IncomeThe following illustration explains how to subdivide the change in operating incomefrom one period to any future period. The individual components describe company per-formance with regard to product differentiation, cost leadership, and growth.7 We illus-trate the analysis using data from 2010 and 2011 because Chipset implemented keyelements of its strategy in late 2010 and early 2011 and expects the financial conse-quences of these strategies to occur in 2011. Suppose the financial consequences of thesestrategies had been expected to affect operating income in only 2012. Then we could justas easily have compared 2010 to 2012. If necessary, we could also have compared 2010to 2011 and 2012 taken together.
Chipset’s data for 2010 and 2011 follow:
6 Other examples of focusing on actual performance over two periods rather than comparisons of actuals with budgets can befound in J. Hope and R. Fraser, Beyond Budgeting (Boston, MA: Harvard Business School Press, 2003).
7 For other details, see R. Banker, S. Datar, and R. Kaplan, “Productivity Measurement and Management Accounting,” Journalof Accounting, Auditing and Finance (1989): 528–554; and A. Hayzen and J. Reeve, “Examining the Relationships inProductivity Accounting,” Management Accounting Quarterly (2000): 32–39.
2010 20111. Units of CX1 produced and sold 1,000,000 1,150,0002. Selling price $23 $223. Direct materials (square centimeters of silicon wafers) 3,000,000 2,900,0004. Direct material cost per square centimeter $1.40 $1.505. Manufacturing processing capacity (in square centimeters of silicon wafer) 3,750,000 3,500,0006. Conversion costs (all manufacturing costs other than direct material costs) $16,050,000 $15,225,0007. Conversion cost per unit of capacity (row 6 ÷ row 5) $4.28 $4.35
LearningObjective 4
Analyze changes inoperating income toevaluate strategy
. . . growth, pricerecovery, andproductivity
Chipset provides the following additional information:
1. Conversion costs (labor and overhead costs) for each year depend on production pro-cessing capacity defined in terms of the quantity of square centimeters of siliconwafers that Chipset can process. These costs do not vary with the actual quantity ofsilicon wafers processed.
2. Chipset incurs no R&D costs. Its marketing, sales, and customer-service costs aresmall relative to the other costs. Chipset has fewer than 10 customers, each purchas-ing roughly the same quantities of CX1. Because of the highly technical nature of theproduct, Chipset uses a cross-functional team for its marketing, sales, and customer-service activities. This cross-functional approach ensures that, although marketing,sales, and customer-service costs are small, the entire Chipset organization, includingmanufacturing engineers, remains focused on increasing customer satisfaction and
Related Documents