(1) Indirect taxes 26. Specific (fixed amount) taxes and as valorem (percentage) taxes and their impact on markets Section 1: Microeconomics Syllabus item: 26 Weight: 4 1.3 Government intervention -3 types IB Question • Explain why governments impose indirect (excise) taxes. • Distinguish between specific and ad valorem taxes. Key terms: • Indirect taxes A tax imposed upon expenditure, etc. VAT, sales tax or merversteuer. Reasons as to why government impose indirect (excise) taxes a) To raise revenue: Government select products which have inelastic demand (necessities or goods that have few substitutes) to raise revenue. b) To discourage consumption: Government might use taxes to discourage consumption of certain demerit goods such as cigarettes. c) To alter the pattern of consumption: Government might use direct taxes in order to alter the consumption patter of its population. Certain goods can be made more price attractive through lower taxes while goods which have high marginal social cost can be made expensive through taxation.

Welcome message from author
This document is posted to help you gain knowledge. Please leave a comment to let me know what you think about it! Share it to your friends and learn new things together.
Transcript

(1) Indirect taxes 26. Specific (fixed amount) taxes and as valorem (percentage) taxes and their impact on markets
Section 1: Microeconomics Syllabus item: 26 Weight: 4
1.3 Government intervention -3 types
IB Question
• Explain why governments impose
indirect (excise) taxes.
• Distinguish between specific and ad
valorem taxes.
Key terms: • Indirect taxes A tax imposed upon expenditure, etc. VAT, sales tax or merversteuer.
Reasons as to why government impose indirect (excise) taxes a) To raise revenue: Government select products which have inelastic demand
(necessities or goods that have few substitutes) to raise revenue.
b) To discourage consumption: Government might use taxes to discourage consumption of certain demerit goods such as cigarettes.
c) To alter the pattern of consumption: Government might use direct taxes in order to alter the consumption patter of its population. Certain goods can be made more price attractive through lower taxes while goods which have high marginal social cost can be made expensive through taxation.
Indirect tax
! When either specific taxes or valorem taxes are imposed, the market will shrink in size (decrease in quantity), thus possibly lower the level of employment in the market, since firms might employ fewer people. (Curve shifts up because it increases costs of production.)
1. Specific tax
" A specific, or fixed, amount of tax that is
imposed upon a product.
" It has an effect to shift the supply curve
vertically upwards by the amount of tax
as it raises the firm’s cost.
2. Ad valorem tax (Percentage tax)
" This is where the tax is a percentage of the
selling price and so the supply curve will
shift upwards.
" HOWEVER, the gap between the supply
curves widen because it is a percentage
tax.
IB Question
• Draw diagrams to show specific and ad valorem taxes, and analyze their impacts on market
outcomes.
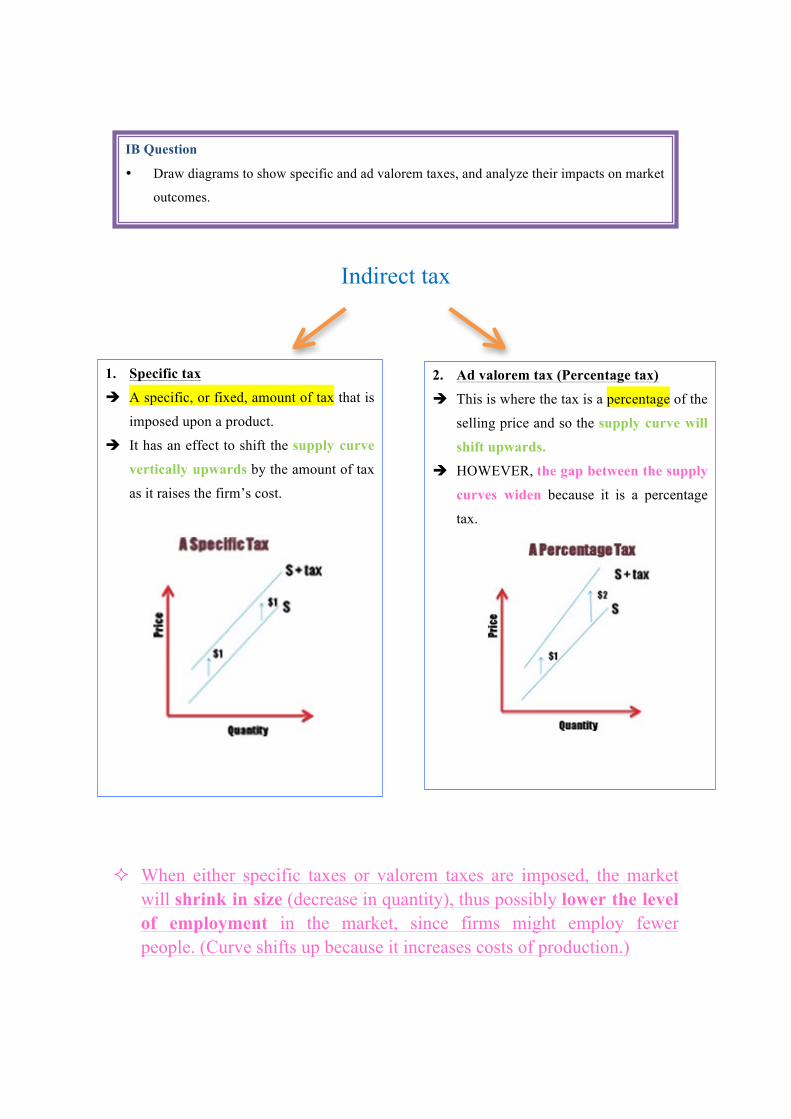
Consequences of imposing an indirect tax
1. Producer: revenue falls (from P1xQ1 to P2xQ2)
2. Consumer: price of the product rises (from P1 to P3)
3. Government: receives tax revenue [(P2-P3)xQ2]
IB Question
• Discuss the consequences of imposing an indirect tax on the
stakeholders in a market, including
consumers, producers and the
government.
Key terms:
• Stakeholders " A party that has an interest in an
enterprise or project.
Etc. investors, employees,
customers and suppliers. Recently
it is the community, government
and trade associations.
P3
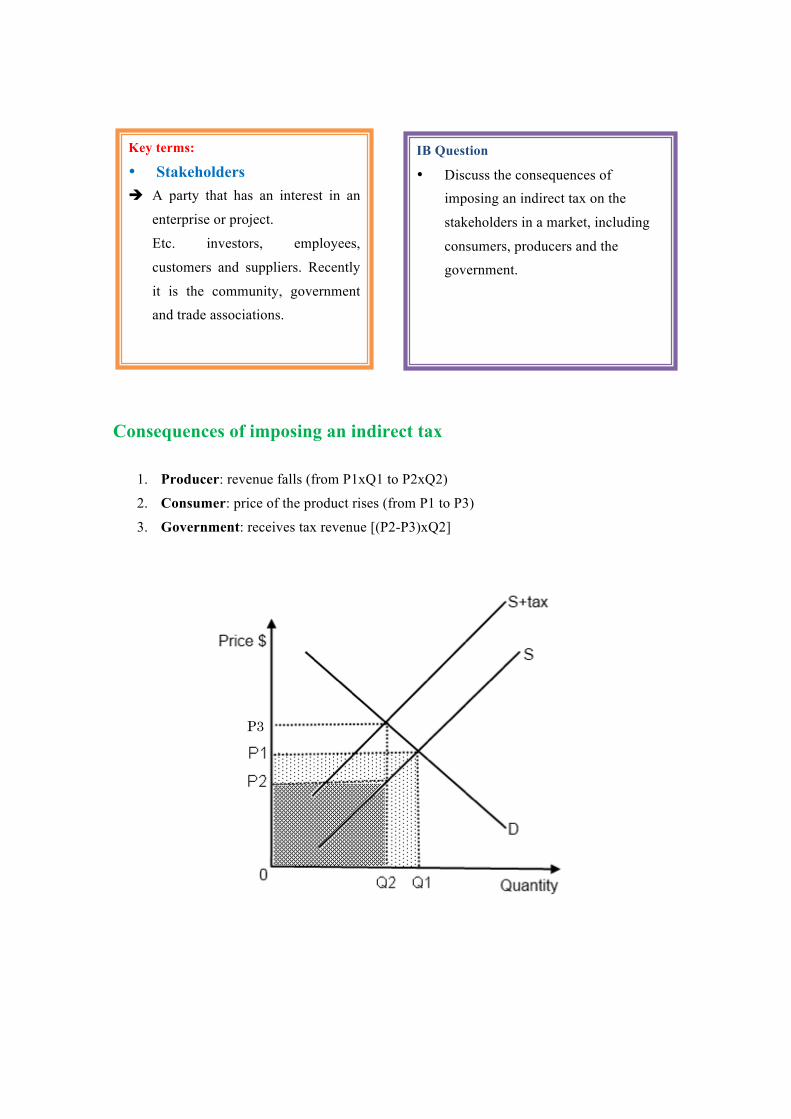
27. Tax incidence and price elasticity of demand and supply
! The amount of indirect tax producers and consumers pay will depend upon the elasticity of demand
1. If PED = PES # the burden of the any tax will be shared equally between c. and p. of the product
2. If PED > PES # The burden of any tax will be greater on the p. of the product than on c.
IB Question
• Explain, using diagrams, how the incidence of indirect taxes
on consumers and firms
differs, depending on the price
elasticity of demand and on the
price elasticity of supply.
Key terms:
• Incidence of tax " It refers to a group who bear the burden of tax.
The amount of the tax increase will depend on the
elasticity of demand.
• Tax burden " The amount of tax paid by a person, company, or
country in a specified period considered as a
proportion of total income in that period.
Syllabus item: 27 Weight: 3

3. IF PED < PES # The burden of any tax will be greater on the c. of the product than on c.
! This is why governments tend to place indirect taxes on products that have relatively inelastic demand, such as alcohol and cigarettes.
! By doing this, the government will gain high revenue and yet not cause a large
fall in employment, because demand changes by a proportionately smaller amount than the change in price.

Example Qd =2000-200P
Qs =-400+400P
Indirect tax: $1.50
IB Question
• Plot demand and supply curves for a product from linear functions and then illustrate
and/or calculate the effects of the imposition of a specific tax on the market (on price,
quantity, consumer expenditure, producer revenue, government revenue, consumer surplus
+ producer surplus).

Analysis
1. Equilibrium price and quantity bought and sold " $4 and 1200 units 2. The new supply curve, showing the effect of the indirect tax of $1.50, is drawn
and labeled 3. The new equilibrium price and quantity bought and sold " $5 and 1000 units " Total consumer expenditure increases from $4 ×1200= $4800 to $5 ×1000=
$5000 4. Government revenue from this tax " $1.50 ×1000= $1500 5. The amount of tax paid by the consumers " $1 ×1000= $1000 6. The amount of tax paid by the producers " $0.50 ×1000= $500 7. The loss of consumer and producer surplus is shown on the diagram by the
shaded area 8. Consumers would bear more of the burden of tax than producers because the
demand for the product is inelastic at that price, which may be seen from the diagram, and so producers are able to pass on more burden of tax to consumers, since their quantity demanded will fall by relatively less than the price increases

(2) Subsidies 28. Subsidies: Impact on markets
Specific subsidies
! When subsidies are provided, the market will expand in size (increase in quantity), thus possibly raise the level of employment in the market, since firms might employ more people.
IB Question • Explain why governments provide
subsidies, and describe examples of subsidies.
• Draw a diagram to show a subsidy, and analyze the impacts of a subsidy on market outcomes.
Key terms: • Subsidy " An amount of money paid by
the government to a firm, per unit of output
• Specific subsidy
Reasons as to why government impose subsidy a) To lower the price of essential goods, such as milk, to consumers, so consumption of the
product will be increased, encouraged by the lower price
b) To guarantee the supply of products that the government think are necessary for the
economy, such as a basic food supply
c) To enable producers to compete with overseas trade, thus protecting the home industry.
" A specific amount of money that is
given for each unit of the product
" E.g.) A subsidy of $2 per unit " Have the effect of shifting the
supply curve vertically
downwards by the amount of
subsidy
Syllabus item: 28 Weight: 4

Consequences of providing a subsidy:
IB Question • Discuss the consequences of
providing a subsidy on the stakeholders in a market, including consumers, producers+ government
1. Producer: revenue increases
2. Consumer: price of the product decreases
• Total consumer expenditure may increase or fall, depending on relative saving and extra
expenditure
3. Government: expenditure increases (take
money away from other areas of expenditure or
raise taxes)
29. Subsidies: impact on markets
Example
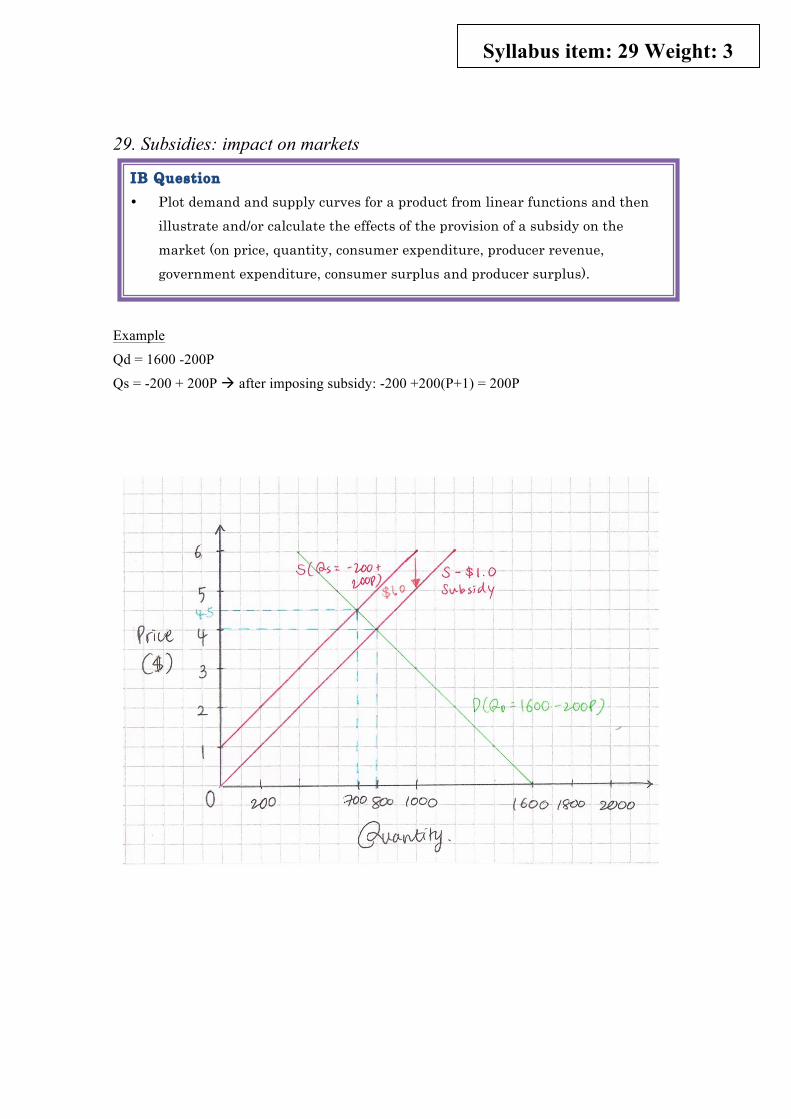
Qd = 1600 -200P
Qs = -200 + 200P # after imposing subsidy: -200 +200(P+1) = 200P
IB Question • Plot demand and supply curves for a product from linear functions and then
illustrate and/or calculate the effects of the provision of a subsidy on the market (on price, quantity, consumer expenditure, producer revenue, government expenditure, consumer surplus and producer surplus).
Syllabus item: 29 Weight: 3
1. Equilibrium price and quantity bought and sold
" $4.5, 700
2. New equilibrium price and quantity bought and sold
" 200P (Qs2) =1600-200P (Qd)
400P=1600
P=$4
" 200P= 200(4)=800
3. Increase in producer revenue
" 800 ×$5 - 700 ×$4.5= $850 increase
4. Total expenditure by the government
" Total cost of the subsidy to the government is,
800 ×$1 = $800
5. Both consumers and producers benefit from the granting of the subsidy because
producers increase their revenue as well as the consumers can purchase at a lower price
($4) the original quantity 700.
6. Possible loser from the granting of the subsidy is the government as they made an
opportunity cost thus they must either take money away from other areas of expenditure,
such as building infrastructure or providing public amenities, or it must raise taxes.

30. Price ceilings (maximum prices): rationale, consequences and examples
IB Question • Explain why governments impose price
ceilings, and describe examples of price ceilings, including food price controls and rent controls.
• Draw a diagram to show a price ceiling, and analyse the impacts of a price ceiling on market outcomes.
• Examine the possible consequences of a price ceiling, including shortages, inefficient resource allocation, welfare impacts, underground parallel markets and non-price rationing mechanisms.
• Discuss the consequences of imposing a price ceiling on the stakeholders in a market, including consumers, producers and the government.
Key terms: • Price ceiling " A maximum price set by the
government below the equilibrium price, designed to benefit consumers.
" Excess demand (shortage). Thus some form of rationing will have to be applied.
" Black market (illegal market) may develop in the good or service.
.
Syllabus item: 30 Weight: 5
Aim • Set to protect consumers • Usually in markets of necessity or merit goods (good that would be underprovided if
the market were allowed to operate freely) Example
• I.e. Maximum food price controls during food shortage? To ensure low-cost food for the poor.
• I.e. Maximum rent controls? To ensure affordable accommodation for those on low incomes.

Consequences of maximum price:
1. Shortages: leads to forming of black market/underground parallel market (where
product is sold at a higher price, somewhere between Pe and Pmax.)
2. Non-price rationing mechanisms: Long queues or reservations → may decide which
consumers would be served.
3. Welfare impacts: Producer surplus decreases, consumer surplus increase
4. Inefficient resource allocation: allocatively inefficient
Impacts on stakeholders:
1. Consumers: lower prices, but have to go through non-price rationing mechanisms
2. Producers: lower selling price → revenue decreases
3. Government: increase spending on solving the consequences → subsidize or direct
provision to shift the supply curve to right → reduce government expenditure in
other areas → opportunity cost

31. Price ceilings (maximum prices): rationale, consequences and examples
Example
IB Question • Calculate possible effects from the price ceiling diagram, including the
resulting shortage and the change in consumer expenditure (which is equal to the change in firm revenue).
Syllabus item: 31 Weight: 3

1. The equilibrium price and quantity
" $1.50 and 1 million liters of cooking oil 2. Ceiling price
" $1 3. At the maximum price of $1, 1,5 million liters of cooking oil would be
demanded but only 0.5 million liters will be supplied
" Excess demand for cooking oil of 1 million liters
4. Consumer expenditure before the maximum price
" 1 million ×$1.5 =$1.5 million
5. Consumer expenditure after the maximum price
" 0.5 million ×$1.00 =$0.5 million
" Therefore, consumer expenditure has fallen by $1 million
6. If the government wants to achieve its aim of giving less expensive cooking oil to more
people, this might be done by:
a) Direct provision of cooking oil by the government, i.e. the setting up of the government
owned cooking oil manufactures
b) Granting subsidies to cooking oil producers in order to encourage greater supply
32. Price floors (minimum prices): rationale, consequences and examples
Key terms: • Price floor " A minimum price set by the
government above the equilibrium price, designed to benefit producers
" Excess supply (surplus) " I.e. Minimum wage? To ensure
a wage level below which employers are not allowed to pay.
IB Question • Explain why governments impose price
floors, and describe examples of price floors, including price support for agricultural products and minimum wages.
• Draw a diagram of a price floor, and analyse the impacts of a price floor on market outcomes.
• Examine the possible consequences of a price floor, including surpluses and government measures to dispose of the surpluses, inefficient resource allocation and welfare impacts.
• Discuss the consequences of imposing a price floor on the stakeholders in a market, including consumers, producers and the government.
Syllabus item: 32 Weight: 5
Aim
• Set to protect producers of goods & services that government thinks are important. i.e. agricultural products
• To protect workers by setting minimum wage → ensuring workers earn enough to lead a
reasonable existence
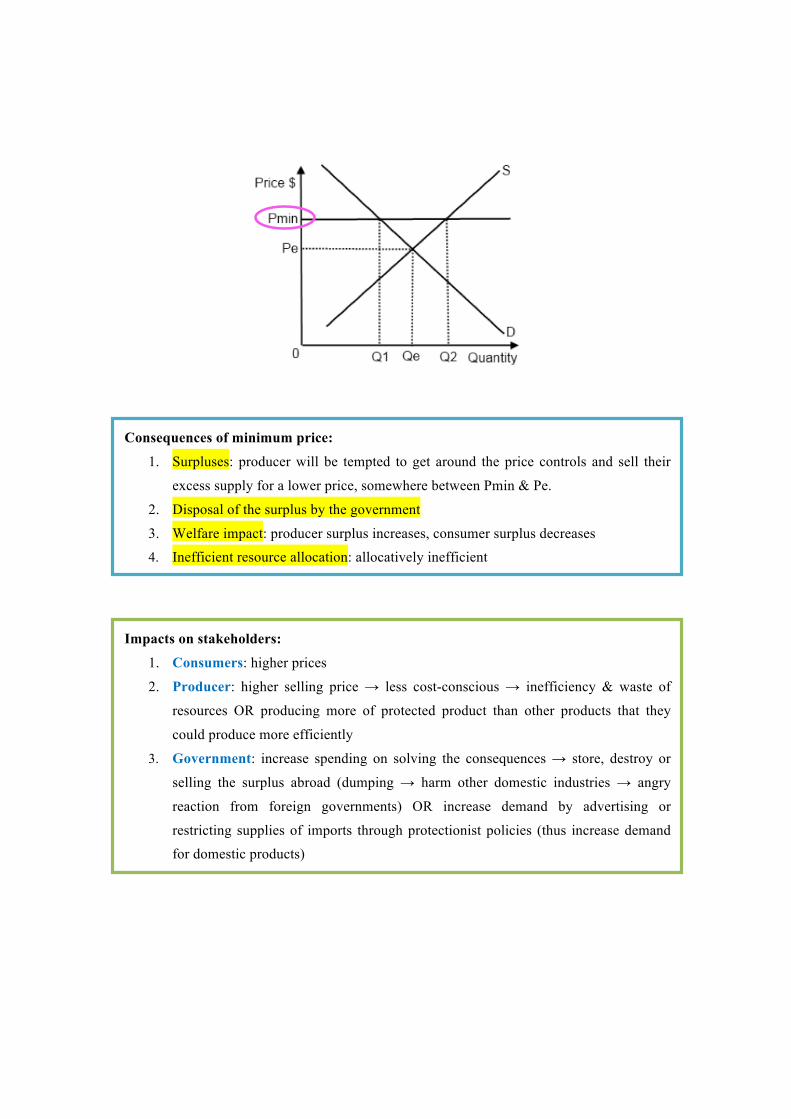
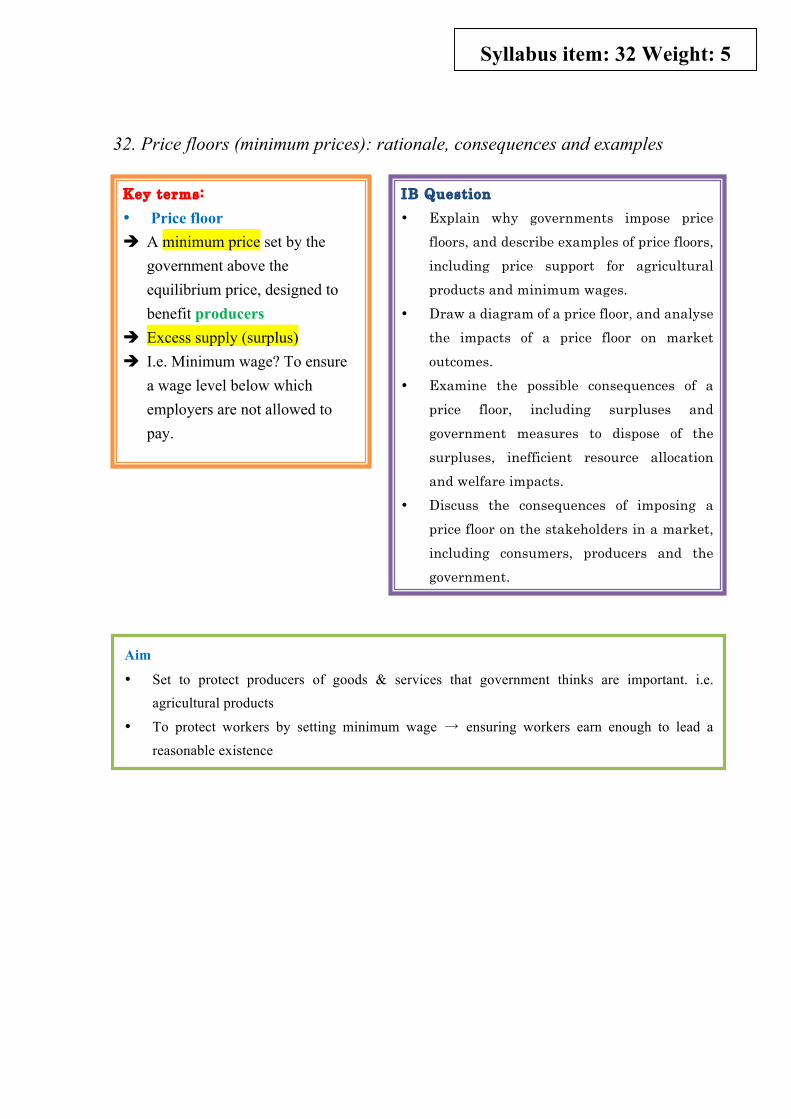
Consequences of minimum price:
1. Surpluses: producer will be tempted to get around the price controls and sell their
excess supply for a lower price, somewhere between Pmin & Pe.
2. Disposal of the surplus by the government
3. Welfare impact: producer surplus increases, consumer surplus decreases
4. Inefficient resource allocation: allocatively inefficient
Impacts on stakeholders:
1. Consumers: higher prices
2. Producer: higher selling price → less cost-conscious → inefficiency & waste of
resources OR producing more of protected product than other products that they
could produce more efficiently
3. Government: increase spending on solving the consequences → store, destroy or
selling the surplus abroad (dumping → harm other domestic industries → angry
reaction from foreign governments) OR increase demand by advertising or
restricting supplies of imports through protectionist policies (thus increase demand
for domestic products)
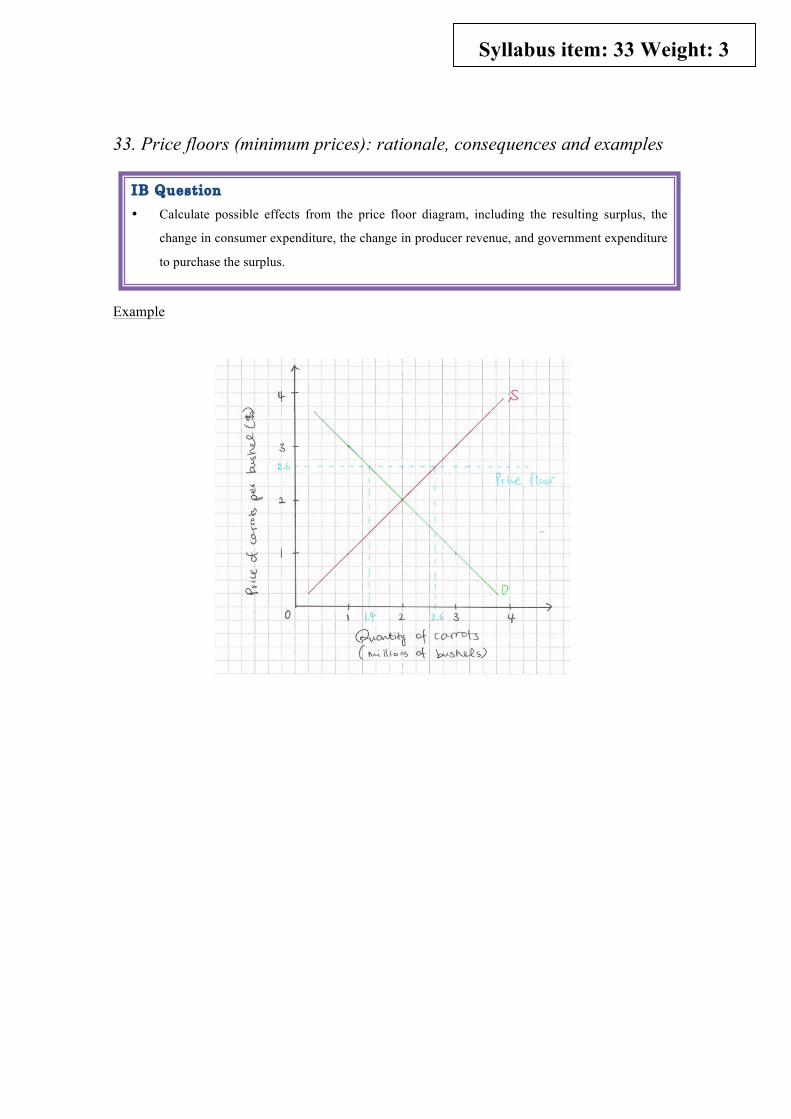
33. Price floors (minimum prices): rationale, consequences and examples
Example
IB Question • Calculate possible effects from the price floor diagram, including the resulting surplus, the
change in consumer expenditure, the change in producer revenue, and government expenditure
to purchase the surplus.
Syllabus item: 33 Weight: 3

1. Original equilibrium price and quantity
" $2, 2 million carrots 2. Price ceiling at $2.60 is indicated on the graph
3. 1.4 million carrots will be demanded and 2.6 million carrots will be supplied
" Excess Supply
4. Change in producer revenue
"
5. Two measures that the government may take to achieve their aim of giving more
revenue to the carrot farmers
a) …
b) …..
Related Documents