Welcome message from author
This document is posted to help you gain knowledge. Please leave a comment to let me know what you think about it! Share it to your friends and learn new things together.
Transcript

Ministry for Education and EmploymentDirectorate for Quality and Standards in Education
Research and Development Department
2013
PIRLS 2011Malta ReportProgress in International Reading Literacy Study

PIRLS 2011
Progress in International Reading Literacy Study
Malta Report
Ministry for Education and Employment Directorate for Quality and Standards in Education
Research and Development Department 2013
PIRLS 2011
iii
Contents Contents iii
Executive Summary vi
Chapter 1: Background to PIRLS 2011 1
1.1 Introduction 1
1.2 Selection criteria and test design and administration 3
1.3 The PIRLS reading assessment items 5
1.4 International benchmarks of reading attainment 6
1.5 Report structure 12
Chapter 2: Reading Attainment in PIRLS 2011 15
2.1 Introduction 15
2.2 Overall reading achievement in PIRLS 2011 15
2.3 Gender differences in overall reading attainment 21
2.4 Reading attainment for different purposes 23
Chapter 3: The Context of Foreign Language Teaching 35
3.1 Introduction 35
3.2 Home reading resources 35
3.3 Spoken language at home before starting school 39
3.4 Reading by parents at home 40
3.5 Parents’ educational expectation for their children 42
3.6 Early literacy activities before starting Primary school 44
3.7 Pre-Primary education 45
3.8 Early Literacy tasks accomplished 47
Chapter 4: The School Environment 49
4.1 Introduction 49
4.2 School location 49
4.3 School composition by student economic background 51
4.4 Schools with students having English/Maltese as their native language 52

PIRLS 2011
iv
4.5 Primary schools where pupils enter with early literacy skills 54
4.6 Effects of reading resource shortages on instruction 55
4.7 Teacher working conditions 57
4.8 Size of school library 59
4.9 Schools with computers available for instruction 60
Chapter 5: The School Objectives 63
5.1 Introduction 63
5.2 Heads’ of School perspective regarding emphasis on academic success 63
5.3 Teachers’ perspective regarding emphasis on academic success 65
5.4 Time spent by Heads’ of School on leadership activities 66
5.5 Emphasis in early grades on reading skills and strategies 68
5.6 Safe and orderly schools 69
5.7 School discipline and safety 71
5.8 Bullying at school 73
Chapter 6: Information about the teachers 75
6.1 Introduction 75
6.2 Teachers’ formal education 75
6.3 Emphasis on language/reading areas in teachers’ formal education 76
6.4 Teachers’ years of experience 78
6.5 Time spent by teachers on professional reading development 79
6.6 Teachers’ career satisfaction 81
Chapter 7: Children and their Reading 85
7.1 Introduction 85
7.2 Reading Enjoyment 85
7.3 Pupils’ motivation to read 87
7.4 Pupils’ confidence in reading 89
7.5 Instructional time spent on language and reading 90
7.6 Collaboration between teachers to improve teaching methods 92
7.7 Instruction to engage pupils in learning 94

PIRLS 2011
v
7.8 Pupils’ engagement in reading lessons 95
7.9 Teachers’ impact to develop pupils’ comprehension skills 97
7.10 Effect on learning due to pupils’ lack of prerequisites knowledge 98
7.11 Effect on learning due to pupils’ lack of sleep and nutrition 99
7.12 Effect on learning by disruptive and uninterested students 100
7.13 Computer activities during reading lessons 101
7.14 Classroom libraries 102
7.15 Resources teachers use for teaching reading 103
Appendix 105
A Maltese Students’ responses 106
B Maltese Teachers’ responses 109
C Maltese Heads’ of School responses 118
D Maltese Parents’ responses 123
PIRLS 2011
vi
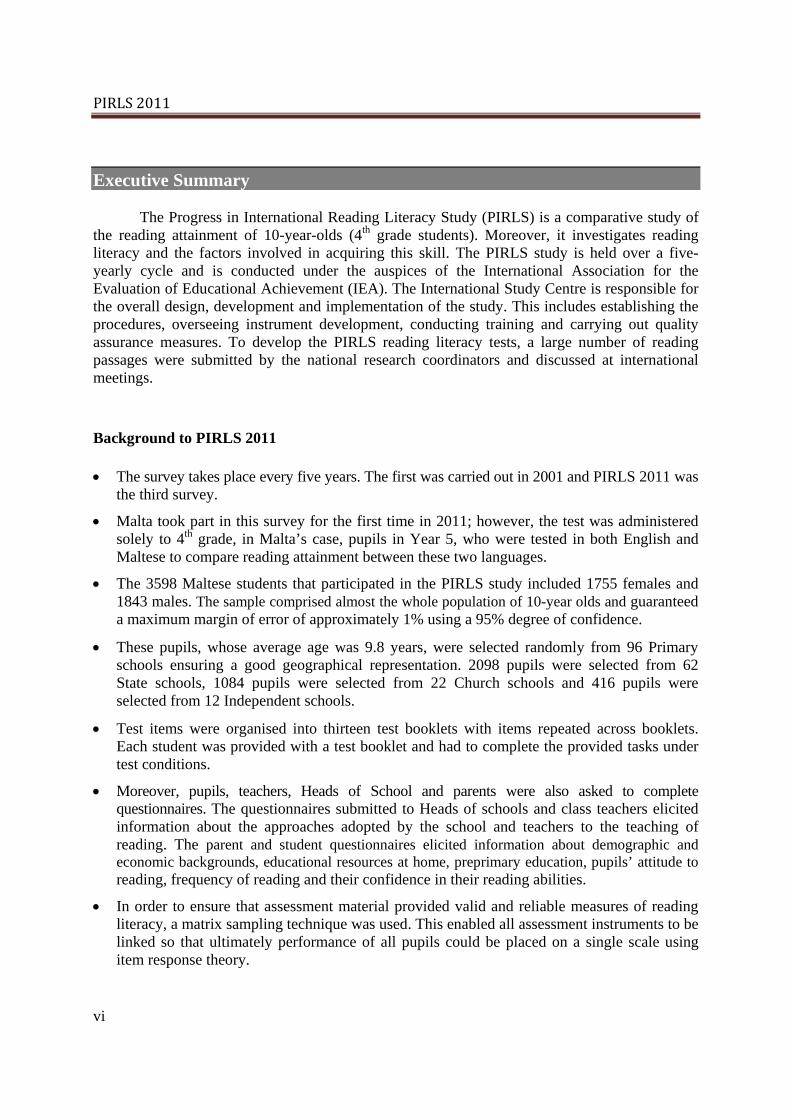
Executive Summary
The Progress in International Reading Literacy Study (PIRLS) is a comparative study of the reading attainment of 10-year-olds (4th grade students). Moreover, it investigates reading literacy and the factors involved in acquiring this skill. The PIRLS study is held over a five-yearly cycle and is conducted under the auspices of the International Association for the Evaluation of Educational Achievement (IEA). The International Study Centre is responsible for the overall design, development and implementation of the study. This includes establishing the procedures, overseeing instrument development, conducting training and carrying out quality assurance measures. To develop the PIRLS reading literacy tests, a large number of reading passages were submitted by the national research coordinators and discussed at international meetings.
Background to PIRLS 2011
The survey takes place every five years. The first was carried out in 2001 and PIRLS 2011 was the third survey.
Malta took part in this survey for the first time in 2011; however, the test was administered solely to 4th grade, in Malta’s case, pupils in Year 5, who were tested in both English and Maltese to compare reading attainment between these two languages.
The 3598 Maltese students that participated in the PIRLS study included 1755 females and 1843 males. The sample comprised almost the whole population of 10-year olds and guaranteed a maximum margin of error of approximately 1% using a 95% degree of confidence.
These pupils, whose average age was 9.8 years, were selected randomly from 96 Primary schools ensuring a good geographical representation. 2098 pupils were selected from 62 State schools, 1084 pupils were selected from 22 Church schools and 416 pupils were selected from 12 Independent schools.
Test items were organised into thirteen test booklets with items repeated across booklets. Each student was provided with a test booklet and had to complete the provided tasks under test conditions.
Moreover, pupils, teachers, Heads of School and parents were also asked to complete questionnaires. The questionnaires submitted to Heads of schools and class teachers elicited information about the approaches adopted by the school and teachers to the teaching of reading. The parent and student questionnaires elicited information about demographic and economic backgrounds, educational resources at home, preprimary education, pupils’ attitude to reading, frequency of reading and their confidence in their reading abilities.
In order to ensure that assessment material provided valid and reliable measures of reading literacy, a matrix sampling technique was used. This enabled all assessment instruments to be linked so that ultimately performance of all pupils could be placed on a single scale using item response theory.

PIRLS 2011
vii
PIRLS identifies two purposes for reading, which include literary experience, and acquiring and using information. It also identifies four comprehension processes, which include focus on and the retrieval of explicitly stated information and ideas, the making of straightforward inferences, interpreting and integration of ideas and information, the examination and evaluation of content, language and textual elements.
A total reading score is generated to measure reading literacy skills of pupils. The PIRLS reading achievement scale score is a rescaled version of the total reading score, which has a mean of 500 and a standard deviation of 100. This makes it possible to compare reading scale scores at different cycles.
PIRLS 2011 identifies four benchmarks of reading achievement. The low, intermediate, high and advanced benchmarks are set at 400, 475, 550 and 625 respectively.
Reading Attainment in PIRLS 2011
Malta’s mean reading score (477) was significantly lower than the international average and was ranked 35th of 45 participating countries.
Reading attainment of Maltese pupils was comparable to pupils from Trinidad and Tobago but was significant higher than nine countries including Azerbaijan, Iran, Colombia, United Arab Emirates, Saudi Arabia, Indonesia, Qatar, Omar and Morocco.
The bottom 25% of Maltese students scored less than 412 and the top 25% scored more than 546 in the Reading Achievement scale.
The proportion of Maltese pupils scoring more than 550 scale points in reading (24%) was significantly lower than the international average (44%). Moreover, the proportion of Maltese pupils scoring less than 475 scale points in reading (45%) was significantly higher than the international average (20%).
The mean reading score of Maltese students in the Maltese test (457) was significantly lower than the corresponding mean reading score in the English test (477).
In all countries, with the exception of Colombia, girls scored higher than boys in reading. In Malta, girls scored 18 scale points more than boys in the English test and 25 scale points more than boys in the Maltese test.
On average, Independent school pupils scored significantly higher in reading than Church school pupils who in turn scored significantly higher than State school pupils. Mean reading scores of girls exceed those of boys by 14.2 scale points in State schools, 11.5 scale points in Church schools and 19.8 scale points in Independent schools.
In the English test, Maltese pupils scored significantly higher in informational reading than literary reading; however, in the Maltese test, the mean scores for the two reading purposes were comparable. Both boys and girls scored higher in informational reading.

PIRLS 2011
viii
In both Maltese and English tests, Maltese pupils scored higher in tasks that required retrieving information and making straightforward inferences rather than in tasks that required interpreting, integrating and evaluating the information.
In all school types, Maltese female students scored significantly higher than males in both reading purposes and comprehension processes.
The Home Reading Environment
Malta has a significantly higher proportions of pupils having an internet connection and an own room (67%) and more than 25 children books at home (87%) compared to international averages (55% and 59%) respectively. Moreover, Malta has a significantly lower proportion of students having at least one parent with a professional occupation (18%) compared to the international average (31%).
The scale score that measures home reading resources ranges from 11.5 (Norway, Australia) to 7.2 (Morocco). Malta’s mean scale score (10.3) is above the international mean. Reading attainment is positively and significantly related to home resources for reading.
88% of Maltese pupils spoke Maltese and 45% spoke English before they started attending school. On average, pupils who were speaking their home language before they started school, scored significantly higher in reading than their counterparts who did not.
The proportion of Maltese parents who like to read (46%) is significantly higher than the international average (32%). The proportions of Maltese parents who somewhat like to read (45%) or do not like to read (8%) are significantly lower than the international averages (57% and 11%) respectively. Reading attainment is positively and significantly related to how much parents like to read.
Maltese parents hold low educational expectations for their children. 13% of Maltese parents expect their children to complete a postgraduate degree; 25% expect their children to complete university; 29% expect their children to complete post-secondary education, but not university while 33% expect their children to complete post-secondary education or less. The corresponding international average proportions are (31%, 34%, 16% and 19%). Reading attainment is positively and significantly related to the parents’ educational expectations for their children.
The proportion of Maltese parents who often carried out early literacy activities with their children (45%) is significantly higher than the international average (37%).
The scale score that measures parents’ frequency of doing early literacy activities with their children ranges from 11.2 (Northern Ireland) to 8.4 (Morocco). Malta’s mean scale score (10.4) is higher than the international average. Reading attainment is positively and significantly related to early literacy activities before children start school.
The vast majority of Maltese pupils (86%) attend kindergarten for a duration of between 1 to 3 years; 11% attended pre-primary education for three years or more and 3% never attended or attended Kindergarten for less than 1 year.

PIRLS 2011
ix
The proportion of Maltese pupils who could perform early literacy tasks very well (28%) or moderately well (50%) is significantly higher than the corresponding international averages (26% and 42%).
The scale score that measures performance in early literacy tasks by pupils when they began Primary school ranges from 11.3 (Trinidad and Tobago) to 8.5 (Slovak Republic). Malta’s mean scale score (10.3) is above the international average.
The School Environment
The proportion of Maltese pupils coming from economically affluent homes (47%) is significantly higher than the international average (35%). On the other hand, the proportion of Maltese pupils coming from economically disadvantaged homes (10%) is significantly lower than the international average (30%). Reading attainment is positively and significantly related to the pupil’s economic background.
6% of Maltese schools have more than 90% English-speaking pupils; 12% of the schools have between 51% and 90% and 82% of the schools have less than 50% English-speaking pupils.
The proportion of Maltese schools having more than 75% of pupils with early literacy skills (21%) exceeds marginally the international average (20%). Reading attainment is weakly positively related to the proportion of pupils within a school possessing early literacy skills.
The proportion of Maltese schools that are not affected by reading resource shortages (26%) exceeds the international average (24%); whereas the proportion of schools that are affected considerably by reading resource shortages (5%) is equal to the international average.
The scale score that measures how much instruction was continuous and uninterrupted by a lack of reading resources ranges from 11.6 (Slovenia) to 7.4 (Colombia). Malta’s middling scale score (10.3) is similar to Finland, Croatia and Lithuania.
22% of Maltese teachers indicated almost no problems with poor working conditions (repairs required in the school, crowded classrooms, inadequate instructional material and huge teaching workload). 51% of Maltese teachers indicated minor problems and the remaining 26% of teachers indicated moderate problems. These proportions were similar to international averages.
The scale score that measures good working conditions ranges from 11.1 (Poland) to 7.8 (Morocco). Malta’s middling scale score (9.8) is similar to Denmark, Netherlands, Russian Federation, Georgia and France. Reading attainment of pupils is weakly related to teachers’ working conditions.
The proportion of Maltese school libraries having more than 500 book titles (69%) exceeds marginally the international average (68%). Moreover, 14% of Maltese Primary schools do not have a library, which is equal to the international average. Reading attainment of pupils is positively related to the size of school libraries.

PIRLS 2011
x
The proportion of Maltese schools having one computer available for instruction for at most 5 pupils (82%) is significantly higher than the international average (69%). All Maltese schools have computers available for instruction. There is no evidence of any relationship between the reading attainment of pupils and the number of computers available within schools.
The School Objectives
The proportion of Maltese schools which apportion very high emphasis to academic success (13%) is well above the international average (9%) and comparable to Canada and Israel. This perspective is shared by both teachers and Heads of School.
The scale score that measures school emphasis on academic success ranges from 11.9 (Northern Ireland) to 7.9 (Morocco). Malta’s mean scale score (11.0) is significantly higher than the international average indicating that Maltese schools tend to allocate high emphasis to academic attainment compared to other countries.
The proportion of Maltese Heads of School spending a lot of time addressing bad behaviour by pupils and disruption (39%) is lower than the international average (44%).
The proportion of Maltese Heads of School spending a lot of time advising teachers when they encounter queries and problems with their teaching (39%) is higher than the international average (35%).
The proportion of Maltese Heads of School report that they spend a lot of time initiating educational projects or improvements (44%) is higher than the international average (41%).
Participation in professional development activities for Principals is given less importance by Maltese Heads of School (26%) compared to the international average (38%).
The proportion of Maltese Heads of School reporting that they emphasise early reading skills and strategies at or before 2nd grade (13%) is significantly lower than the international average (28%).
The scale score that measures the onset when reading skills and strategies are emphasized ranges from 12.6 (England and Australia) to 6.8 (Morocco). Malta’s scale score (10.4) is below the international average. There is a significant positive relationship between reading attainment and onset when reading skills and strategies are emphasized.
The proportion of Maltese teachers indicating that they attend safe and orderly schools (50%) is less than the international average (55%); however, the proportion of Maltese teachers indicating that they attend unsafe schools (2%) is less than the international average (4%).
The scale score that measures safety and order in school ranges from 11.4 (Ireland) to 8.4 (Trinidad and Tobago). Malta’s mean scale score (9.9) is lower than the international average. Reading attainment is positively related to the degree of safety and order within the school.
The proportion of Maltese Heads of School reporting negligible disciplinary problems (64%) is significantly higher than the international average (58%). Moreover, the proportion of Heads

PIRLS 2011
xi
of School reporting moderate disciplinary problems (6%) is significantly lower than the international average (11%).
The scale score that measures school discipline and safety ranges from 11.4 (Chinese Taipei, Hong Kong) to 6.2 (Indonesia). Malta’s mean scale score (10.2) is higher than the international average. Achievement in reading is positively related to the degree of safety and discipline within the school.
The proportion of Maltese students who hardly ever experienced bullying (42%) is lower than the international average (47%). On the other hand, the proportion of Maltese pupils who are bullied on a weekly basis (22%) is marginally higher than the international average (20%).
The scale score that measures lack of bullying at school ranges from 11.4 (Azerbaijan) to 9.1 (Qatar, Trinidad and Tobago). Malta’s mean scale score (9.8) is lower than the international average. Reading attainment is negatively related to the amount of bullying experienced by the child at school.
Information about the Teacher
The proportion of Maltese teachers who completed a Bachelor’s degree (69%) is significantly higher than the international average (53%); however, the proportion of teachers who completed a Master’s degree or a PhD (10%) is significantly lower than the international average (26%).
The proportion of Maltese teachers who emphasized language in their formal education or training (65%) is significantly lower than the international average (72%). The proportion of teachers who emphasized pedagogy and teaching reading in their formal education or training is equal to the international average (62%). The percentage of Maltese teachers who emphasized reading theory in their formal education or training (16%) is significantly lower than the international average (33%). There is no relationship between pupils’ reading attainment and the language/reading areas emphasized by teachers in formal education.
The proportion of Maltese teachers with less than 10 years teaching experience (44%) is significantly higher than the international average proportion (28%). The proportion of Maltese teachers with 20 years or more teaching experience (18%) is significantly lower than the international average (41%).
The average years of experience of Maltese teachers (12 years) is significantly less than the international average (17 years) indicating that Malta has a very young teaching workforce.
The proportion of Maltese teachers who spent between 6 to 15 hours, during the last two years, on professional reading development (58%) is significantly higher than the international average (50%). Conversely, the proportions of Maltese teachers who never engaged in any professional reading development (23%) or who spent more than 16 hours on professional reading (19%) are lower than international means (25%, 24%).
The proportion of Maltese teachers who are satisfied by their job (66%) is significantly higher than the international average proportion (54%). On the other hand, the proportions of
PIRLS 2011
xii
Maltese teachers who are moderately satisfied (30%) or less than satisfied (4%) are lower than international averages (40% and 5%) respectively.
The scale score that measures teachers’ career satisfaction ranges from 11.6 (Colombia) to 8.6 (France). Malta’s scale score (10.7) is significantly higher than the international average. Reading attainment is weakly positively related to the teachers’ career satisfaction.
Children and their Reading
The proportion of Maltese pupils who like reading (34%) is significantly higher than the international average proportion (28%); however, the proportion of Maltese pupils who dislike reading (16%) is marginally higher than the international average (15%).
The scale score that measures pupils’ enjoyment for reading ranges from 10.9 (Portugal) to 9.3 (Croatia). Malta’s scale score (10.2) is significantly higher than the international average. Reading attainment is positively and significantly related to enjoyment for reading.
The proportion of Maltese pupils who are motivated to read (82%) is significantly higher than the international average proportion (74%); whereas the proportion of pupils who are not motivated to read (4%) is marginally lower than the international average (5%).
The scale score that measures pupils’ motivation to read ranges from 11.2 (Georgia) to 8.9 (Hong Kong). Malta’s scale score (10.4) is significantly higher than the international average. Reading attainment is positively and significantly related to motivation to read.
The proportion of Maltese pupils who are confident in reading (39%) is significantly higher than the international average (36%). However, 13% of Maltese pupils indicated that they are not confident in reading. This exceeds the international average (11%).
The scale score that measures confidence in reading ranges from 10.6 (Austria, Israel) to 9.1 (Morocco). Malta’s middling scale score (10.1) is similar to Denmark, England and Australia. Reading attainment is positively and significantly related to confidence in reading.
The total instructional time throughout a whole year in Malta (891 hours), reported by Heads of School, is 14 hours less than the international average (905 hours).
The language instructional time throughout a whole year in Malta (181 hours), reported by teachers is 51 hours less than the international average (232 hours).
The time spent reading as part of language instruction throughout a whole year in Malta (37 hours) is the lowest of all the countries taking part and is 34 hours less than the international average (71 hours).
The time spent reading across the curriculum, including time spent on reading instruction throughout a whole year in Malta (104 hours) is 42 hours less than the international average (146 hours).
The proportion of very collaborative Maltese teachers who interact frequently with other teachers (84%) is one of the highest proportions and exceeds the international average by almost 20%.

PIRLS 2011
xiii
The scale score that measures collaboration between teachers for teaching development ranges from 11.8 (Morocco) to 8.2 (Slovenia). Malta’s scale score (11.5) is the second largest score and is significantly higher than the international average. There exists no relationship between reading attainment and the degree of collaboration between teachers.
The proportion of Maltese teachers who engage pupils in learning during most lessons (81%) is significantly higher than the international average (71%). The remaining 19% of teachers reported that they engage pupils in learning in about half the lessons.
The scale score that measures how much teachers engage pupils in learning ranges from 11.4 (Romania) to 7.7 (Denmark). Malta’s scale score (10.3) is significantly higher than the international average. Reading attainment is weakly positively related to how much teachers engage pupils in learning.
The proportion of Maltese pupils who reported that they are engaged in reading lessons (55%) is significantly higher than the international average (42%). The proportion of Maltese who are not engaged in reading lessons (7%) is marginally lower than the international mean.
The scale score that measures how much pupils are involved in reading lessons ranges from 11.3 (Indonesia) to 8.7 (Finland). Malta’s scale score (10.6) is significantly higher than the international average. There is a positive relationship between attainment in reading and how much pupils are engaged in reading lessons.
The contribution of Maltese teachers to their pupils in developing comprehension skills and strategies is above the international average. The comprehension skills in which the contribution of Maltese teachers is lower than the international average are: making generalisations and drawing inferences based on what pupils read; describing the style or structure of the text they have read; determining the author’s perspective or intention.
The proportion of Maltese teachers reporting excessive instruction limitation due to pupils lacking prerequisite knowledge/skills (17%) is significantly higher than the international average (11.%). The proportion of teachers reporting no instruction hindrance caused by pupils lacking prerequisite knowledge/skills (19%) is significantly lower than the international average. There is a strong negative relationship between reading attainment and the lack of prerequisite knowledge and skills.
The proportion of Maltese pupils who have adequate basic nutrition (88%) and adequate sleep (73%), as reported by the teachers, exceeds the corresponding international average proportions (73% and 51%) by a large margin. There is evidence that lack of basic nutrition and lack of sleep is associated with a poorer reading attainment.
The proportion of Maltese disruptive pupils who hamper instruction in class (16%) exceeds the international average proportion (12%); however, the proportion of uninterested Maltese pupils in class is identical to the international average (10%). There is very strong evidence that attainment in reading tends to deteriorate in the presence of disruptive and uninterested pupils.
The proportion of Maltese teachers reporting that computers are available for reading lessons (73%) is significantly higher than the international average (45%). Moreover, Maltese teachers make frequent use of these computers during reading lessons. The availability or otherwise of

PIRLS 2011
xiv
computers during reading lessons does not seem to result in any significant rise in pupils’ reading attainment scores.
90% of pupils in Malta have the availability of a classroom library or a reading corner, which is significantly higher than the international average (72%). There is evidence of a positively weak relationship between reading attainment and the availability of a classroom library.
The proportion of Maltese teachers reporting that their classroom library has at least 50 books, and has at least three magazine titles are (49% and 35%) respectively, which are well above the international averages (32% and 31%).
The proportions of Maltese teachers who give time to pupils to use the classroom library at least once a week; allow pupils borrow books from the classroom library and take pupils to other libraries within and outside the school at least once a month are (82%, 76% and 75%) respectively. These exceed by large margins the corresponding international average proportions (60%, 56% and 68%).
Maltese teachers make more use of a variety of children’s books as a supplement (72%) rather than as a basis for instruction (24%). These proportions are similar to international averages (69% and 27%) respectively.
86% of Maltese teachers use textbooks as a basis for instruction rather than as a supplement, which is significantly higher than the international average (72%).
Maltese teachers make more use of reading series as a basis for instruction (59%) rather than as a supplement (34%). This is in contrast with international trends where foreign teachers make more use of reading series as a supplement (59%) rather than a basis for instruction (27%).
Computer software for reading instruction has widespread use as a supplement. 16% of Maltese teachers use computer software as a basis for instruction; whereas, 55% use it as a supplement. These proportions exceed international averages (8% and 48%) by large margins.
Maltese teachers use workbooks and worksheets more as a supplement (50%) rather than as a basis for instruction (45%), which is similar to the international trend (56% and 40%) respectively.

PIRLS 2011
1
1.1 Introduction
The Progress in International Reading Literacy Study (PIRLS) is a comparative study of the reading attainment of ten-year-olds (5th grade). Moreover, it investigates reading literacy and the factors involved in acquiring this skill. PIRLS is conducted under the auspices of the International Association for the Evaluation of Educational Achievement (IEA). The International Study Centre is responsible for the overall design, development and implementation of the study. This includes establishing the procedures, overseeing instrument development, conducting training and carrying out quality assurance measures. To develop the PIRLS reading literacy tests, a large number of reading passages were submitted by the national research coordinators and discussed at international meetings. At these meetings, workshops were convened and the research coordinators wrote questions on those passages that were accepted by the group. The process was iterative and the material was reviewed by both research coordinators and the reading development group.
The Special Surveys Methods Statistics group was responsible for all sampling activities
in PIRLS, including developing the sampling procedures and documentation, and assisting participants in adapting the PIRLS sampling design to local conditions. After administering the reading test to a number of pupils selected randomly from various schools the scripts were corrected and marked. The data collected from each country was processed and verified and used to construct the international database.
The PIRLS study is conducted on a five-yearly cycle and this is the third time it was
carried out. The first PIRLS study was held in 2001 with the participation of 26 countries. The target population included all students enrolled in the upper of the two adjacent grades that contain the largest proportion of 9-year olds at the time of testing. The survey was repeated in 2006 in which 40 countries participated in the study. The target population for this study was redefined to include all students who completed four years of schooling from the first year of ISCED level 1. This age group was targeted because at this age children would have learned to read and are now starting to read to learn. Malta took part in this study for the first time in 2011 together with 47 other participating countries. Figure 1.1 displays the countries participating in PIRLS 2001, 2006 and 2011. Participants from Honduras, Morocco, Kuwait and Botswana were 6th grade students. To investigate the effect of language on reading attainment Malta took part as
1

PIRLS 2011
2
a benchmark participant in which a number of 5th grade students received instructions in Maltese rather than English. Other benchmark participants included Florida in the United States, Ontario, Quebec and Alberta in Canada, Andalusia in Spain, Dubai and Abu Dhabi in the United Arab Emirates and the Republic of South Africa. These benchmark participants did not contribute to the estimation on national and international mean reading scores.
Figure 1.1: Countries participating in PIRLS 2011 and preceding studies

PIRLS 2011
3
1.2 Selection criteria and test design and administration
In most of the participating countries the PIRLS sample was drawn from the population of pupils aged 10 years who attended Primary educational institutions. For convenience this population is referred to as 10-year-olds or 5th grade. Figure 1.2 displays the number of sampled schools, the sample size and the average age of the pupils participating in the study within each country. The pupils with the lowest average age were those in Italy and Norway (9.7 years) and the pupils in Denmark and Romania (10.9 years) were on average the oldest.
Figure 1.2: Number of sampled schools and average age of pupils

PIRLS 2011
4
In Malta, the main study was administered in April 2011 and all the selected 3598 pupils attended state and non-state primary schools. A large proportion (93.4%) of these pupils was born in 2001 and the sample average age (9.8 years) was marginally lower compared to other participating countries. The Maltese sample comprised 1755 (48.8%) females and 1843 (51.2%) males and guaranteed a maximum margin of error of approximately 1% assuming a 95% degree of confidence. These pupils were selected randomly from 96 schools ensuring a good geographical representation. 2098 (58.3%) pupils were selected from 62 state schools, 1084 (30.1%) pupils were selected from 22 church schools and 416 (11.6%) pupils were selected from 12 independent schools. These sample proportions are comparable to the population proportions of pupils attending these school types ensuring a representative sample. Table 1.1 displays the number of male and female Maltese pupils categorized by school type.
Table 1.1 Maltese participants categorized by gender and school type
School Type State Church Independent
Male 1155 (32.0%) 441 (12.3%) 247 (6.9%) Gender
Female 943 (26.2%) 643 (17.9%) 169 (4.7%) Test items were organised into thirteen test booklets with items repeated across booklets.
Each student was provided with a test booklet and had to complete the provided tasks under test conditions. In order to ensure that assessment material provided valid and reliable measures of reading literacy, a matrix sampling technique was used. This enabled all assessment instruments to be linked so that ultimately performance of all pupils could be placed on a single scale using item response theory methods although each participating pupil took just a part of the whole assessment. The material was divided into assessment ‘blocks’ where each block consisted of a passage of up to 1000 words and its associated items. There were five blocks containing literary texts and five containing information texts and which are described in section 1.3. The blocks were combined into 13 different test booklets with two blocks in each booklet. One booklet was a colour ‘reader’; this was a separate stimulus booklet containing two reading passages and with the test items in an accompanying response booklet. Test administrators were appointed and followed the procedure described in the Test Administrator manual. The marking of the constructed response questions in the tests was carried out by trained markers
In addition, pupils, teachers and heads of schools were also asked to complete
questionnaires. The questionnaires submitted to heads of schools and class teachers elicited information about the approach to the teaching of reading adopted in the school and in the classrooms. Moreover, they collected background information about the teachers and the schools of the pupils taking part in the survey. These questionnaires were sent in advance and were collected on the day of testing by the test administrator. The survey required two timetabled sessions in the participating schools, both on the same day. The first was for the administration of the reading tests and the second was for the completion of the pupil questionnaire. The student questionnaire elicited information on pupils’ demographic background including gender and age, about items owned by the family and about educational resources in the home. The questionnaire also provides information about the pupils’ attitude to reading, what they choose to read when not in school, how often they read and their confidence in their reading abilities.

PIRLS 2011
5
1.3 The PIRLS reading assessment items Reading literacy is defined by PIRLS as the ability to understand and use those written
language forms required by society and valued by the individual. Young readers can construct meaning from a variety of texts. They read to learn, to participate in communities of readers in school and everyday life, and for enjoyment. Besides being a constructive and interactive process, reading is intended to embrace multi-modal forms of reading, as well as traditional print forms.
PIRLS identifies two purposes for reading and four comprehension processes. Each
assessment block (or test) is attributed to one of the two purposes (literary experience, acquiring and using information). There are a total of ten blocks altogether, with five texts being literary pieces while another five are informational. Within each assessment block, a question is attributed to one of the four processes (focus on and retrieve explicitly stated information and ideas, make straightforward inferences, interpret and integrate ideas and information, examine and evaluate content, language and textual elements). The texts selected for use in PIRLS 2011 were submitted by representatives of the participating countries and scrutinized by the group of reading experts and the national research coordinators at various meetings. Once a shortlist of texts had been selected, several items were produced by the national research coordinators and other representatives of the participating countries at item writing workshops. These items were subsequently reviewed by the reading expert group. Following the analysis of the field test data, three literary and three informational passages were selected for the main survey. These were combined with the four blocks retained from the 2006 survey, which served as a means of linking the two surveys. Table 1.2 shows the proportion of different types of items (multiple-choice and constructed response) in the assessment blocks and the total number of marks allocated to the two reading purposes. Moreover, it also provides a breakdown of the different item types and mark allocation by the four reading processes.
Table 1.2: Distribution of PIRLS 2011 items by Reading Purpose and Reading Process

PIRLS 2011
6
1.4 International Benchmarks of Reading Attainment To enable comparison between participating countries in reading skills, four scores were
generated for each student. Two scores are provided for reading purposes – reading for literary purposes, and reading for informational purposes. Two other scores are provided for reading processes – retrieving and straightforward inferencing, and interpreting, integrating and evaluating. Moreover, an overall reading score was generated to measure reading literacy skills of pupils. This PIRLS reading achievement scale has a mean of 500 and a standard deviation of 100 and was designed to remain constant between assessments at different cycles.
Table 1.3: International Benchmarks of Reading Achievement

PIRLS 2011
7
In order to aid interpretation of the survey results, these reading achievement scores are categorized by four international benchmarks. The Advanced International Benchmark is set at a scale score of 625, the High International Benchmark is 550, the Intermediate International Benchmark is 475 and the Low International Benchmark is 400. Figure 1.3 provides a detailed description of each benchmark for both literary and informational purposes.
Figure 1.3: Item at a Low International Benchmark (Literary experience)
A multiple-choice item is anchored at the Low International Benchmark if at least 65% of pupils scoring at 400 answered the item correctly. Figure 1.2 shows the percentage of correct replies for a multiple-choice item anchored at the Low International Benchmark.

PIRLS 2011
8
Figure 1.4: Item at Intermediate International Benchmark (Acquire and Use information)
A multiple-choice item is anchored at the Intermediate International Benchmark if at least 65% of pupils scoring at 475 answered the item correctly and less than 50% of the pupils scoring at the Low International Benchmark (400) answered correctly. Figure 1.4 shows the percentage of correct replies for a multiple-choice item anchored at the Intermediate International Benchmark.

PIRLS 2011
9
Figure 1.5: Item at High International Benchmark (Literary Experience)
A multiple-choice item is anchored at the High International Benchmark if at least 65% of pupils scoring at 550 answered the item correctly and less than 50% of the pupils scoring at the Intermediate International Benchmark (475) answered correctly. Figure 1.5 shows the percentage of correct replies for a multiple-choice item anchored at the High International Benchmark.

PIRLS 2011
10
Figure 1.6: Item at Advanced International Benchmark (Acquire and Use Information)
Similarly, a multiple-choice item is anchored at the Advanced International Benchmark if at least 65% of pupils scoring at 625 answered the item correctly and less than 50% of the pupils scoring at the High International Benchmark (550) answered correctly. About 50% of the items are in a multiple-choice format and the rest require a constructed response. Sometimes this may be in the form of a table that has to be completed or events to be sequenced. More typically, pupils must write a short phrase or several sentences. Since constructed-response questions

PIRLS 2011
11
nearly eliminate guessing, the criterion for the constructed-response items is simply 50% at the particular benchmark, and for multi-mark items, the analysis differentiated between partial-credit and full-credit responses. Figures 1.6 and 1.7 display the percentage of pupils getting partial or full credit for these constructed-response, multi-marks item anchored respectively at the High and Advanced International Benchmark. Pupils reaching a particular benchmark demonstrated the comprehension skills and strategies characterizing that benchmark as well as competencies of pupils at any lower benchmarks.
Figure 1.7: Item at Advanced International Benchmark (Literary Experience)

PIRLS 2011
12
1.5 Report Structure Chapter 2 presents the reading attainment results of 5th grade pupils for each of the 45
participating countries in PIRLS 2011. The three countries - Botswana, Honduras and Kuwait which participated with 6th grade pupils are excluded from this analysis. Performance in reading attainment is first compared between countries and then compared between boys and girls for each country separately. Reading attainment is also compared between countries in two different purposes – literary purposes and informational purposes. This is followed by the results in two processes of reading comprehension – retrieving and straightforward inferencing and interpreting integrating and evaluating. This chapter also contrasts overall reading achievement between Maltese pupils attending different school types.
Chapter 3 describes the relationship between children’s home circumstances and their
performance on the PIRLS reading assessment. In PIRLS, there are two sources of evidence concerning children’s literacy development before they attended primary schools and the literacy practices in the home. Most of the information for these two sources is elicited from the Parent and the Pupil questionnaires, which are respectively completed by parents/carers and pupils, and provide rich information about home resource for learning, parents attitude towards reading, early literacy skills of pupils before onset of primary schooling, early literacy activities at home and parents’ educational expectation for their children.
Chapter 4 provides information about the school environment mostly supplied by the
Heads of schools and partly by teachers. This chapter analyzes the school location, the school composition by student economic background, teacher working conditions, size of school library, and availability of computers for instruction at school and how this instruction is affected by reading resource shortage. Moreover, the Heads of schools provide information about the pupils’ early literacy skills when they enter Primary schools.
Chapter 5 describes the views Heads of Schools and teachers regarding a number of
school related issues. It highlights the Heads’ and teachers’ perspectives regarding the school emphasis on academic success; the amount of time Heads spend on leadership activities and the emphasis they give to reading skills and strategies. Moreover, this chapter addresses other issues related to school discipline and safety; bullying at school, student behaviour and attitude towards their teachers.
Chapter 6 provides information about teaching and reading approaches adopted by teachers
in the school classrooms. Moreover, it describes the background information about the teachers' formal education, teachers’ emphasis on language and reading areas in their formal education and training, teachers’ years of experience, teachers’ career satisfaction and the time spent by teachers on professional development related to reading in the recent past.
Chapter 7 focuses on children’s attitudes and habits to reading and their confidence in
their abilities. This chapter describes how much pupils find reading enjoyable; their motivation and confidence to read; the instructional time spent on language and learning; collaboration with other teachers to improve teaching methods; how much students are engaged during lessons to

PIRLS 2011
13
enhance reading and learning and strategies employed by teachers to develop students’ reading comprehension skills. Other issues that will be reviewed include the instruction limitations caused by students’ lack of prerequisite knowledge/skills, lack of nutrition and sleep; disruptive and uninterested students; resources used by teachers for teaching reading; computer activities during reading lessons and availability of classroom libraries.

PIRLS 2011
14

PIRLS 2011
15
2.1 Introduction
This chapter presents the reading attainment results of 5th grade pupils for each of the 45 participating countries in PIRLS 2011. The three countries - Botswana, Honduras and Kuwait which participated with 6th grade pupils are excluded from this analysis. Performance in reading attainment is first compared between countries and then compared between boys and girls for each country separately. Reading attainment is also compared between countries in two different purposes – literary purposes and informational purposes. This is followed by the results in two processes of reading comprehension – retrieving and straightforward inferencing and interpreting integrating and evaluating. These purposes and processes were described comprehensively in Chapter 1. This chapter also contrasts overall reading achievement between Maltese pupils attending different school types.
2.2 Overall Reading Achievement in PIRLS 2011
Hong Kong (571), the Russian Federation (568), Finland (568) and Singapore (568) attained the highest mean reading scores of the 45 participating countries in PIRLS 2011 for 5th grade pupils. The mean reading scores of these four countries were comparable but were significantly higher than those of all other participating countries. Malta’s mean reading score (477) was significantly lower than the international PIRLS mean reading score (500) implying that reading attainment of 5th grade Maltese pupils is significantly lower than the average reading attainment of the participating countries. Reading attainment of Maltese pupils was comparable to pupils from Trinidad and Tobago but was significant higher to 10 countries including Azerbaijan, Iran, Colombia, United Arab Emirates, Saudi Arabia, Indonesia, Qatar, Omar and Morocco. The 34 countries that scored significantly higher than Malta in reading included Hong Kong, the Russian Federation, Finland and Singapore Northern Ireland, the United States, Denmark, Croatia, Chinese Taipei, Ireland, England, Canada, Netherlands, Czech Republic, Sweden, Italy, Germany, Israel, Portugal, Hungary, Slovak Republic, Bulgaria, New Zealand, Slovenia, Austria, Lithuania, Australia, Poland, France, Spain, Norway, Romania, Georgia and Belgium (French).
2

PIRLS 2011
16
Figure 2.1: Distribution of Reading Achievement
Figure 2.1 displays the mean reading scores on the PIRLS achievement scale listed together with the standard errors for each country. The PIRLS reading achievement scale was established in PIRLS 2001 to have a mean of 500 and a standard deviation of 100 and was designed to remain constant between assessments. The standard error refers to uncertainty in estimates resulting

PIRLS 2011
17
from random fluctuations in samples. The smaller the standard error, the better the sample’s score is as an estimate of the population’s score. The 95% confidence intervals, which are shown graphically as the darkened areas on the achievement distribution, provide a range of values for the actual mean reading score if the whole population of students had to be included in the study. Mean reading scores of two countries differ significantly when their corresponding confidence interval are disjoint (do not overlap).
Figure 2.2: Percentiles of Reading Achievement

PIRLS 2011
18
Figure 2.2 also shows the ranges in reading achievement for the middle group of pupils (25th to 75th percentiles) and for the lowest and highest attainers (5th and 95th percentiles). For high performing countries the difference between the 5th and 95th percentile was slightly above 200 points; while, for low performing countries the difference between the 5th and 95th percentile was slightly above 300 points. This indicates that in low performing countries reading scores are more dispersed than high performing countries. In Malta, the difference between the 25th and 75th percentile is 134 scale points, the difference between the 10th and 90th percentile is 254 and the difference between the 5th and 95th percentile is 317 scale points. These percentile scores are essential to display the proportion of pupils in different countries below or above a specified threshold scale score. For instance, the 5th percentile for Lithuania is equal to the 25th percentile for Malta indicating that the weakest 25% of pupils in Malta has the same level of reading attainment as the weakest 5% in Lithuania. On the other hand the 75th percentile for Croatia is equal to the 90th percentile for Malta indicating that the top 10% of pupils in Malta has the same level of reading attainment as the top 25% in Croatia.
Figure 2.3: Multiple Comparisons of Average Reading Achievement

PIRLS 2011
19
Figure 2.3 depicts whether or not the differences in average achievement between pairs of countries are statistically significant. Selecting a country of interest and reading across the table, an arrow pointing up indicates better performance and an arrow pointing down indicates poorer performance than the comparison country. The absence of an arrow indicates no significant difference in performance.
Figure 2.4: Percentage of Pupils Reaching International Benchmarks
Figure 2.4 shows the proportion of pupils within the International Benchmarks, described in Chapter 1, for countries participating in PIRLS 2011. The international average shows that 8% of the pupils have a reading attainment score above 625, 36% have a reading attainment score between 550 and 625, 36% have a reading attainment score between 475 and 550, 15% have a reading attainment score between 400 and 475 and the remaining 5% have a reading

PIRLS 2011
20
attainment score below 400. The proportions for Malta are respectively 4%, 20%, 31%, 23% and 22%. Malta has lower proportions of pupils in the advanced and high benchmark categories and a higher proportion of pupils in the low benchmark category. Reading attainment of pupils in Morocco was very poor where 79% of the students scored less than 400.
Figure 2.5: Distribution of Reading Achievement (Benchmarking participants)
Malta participated in a benchmarking exercise in which the reading literacy test was administered in two languages (English and Maltese) allowing sufficient time between the two tests. To prevent repeating the same test twice, each pupil was provided with a different booklet. Florida (state in USA), Ontario, Alberta, Quebec (provinces in Canada), Andalusia, Dubai, Abu Dhabi and Republic of South Africa also participated in this benchmarking exercise. Figure 2.5 displays the mean reading scores and standard errors, 95% confidence intervals and percentiles on the PIRLS achievement for benchmarking participants. The mean score of Maltese pupils in reading when the test was administered in Maltese is significantly lower than the corresponding mean reading score when the test was administered in English. Figure 2.6 shows that for the Maltese test, only 1% of the pupils have a reading attainment score above 625, 13% have a reading attainment score between 550 and 625, 31% have a reading attainment score between 475 and 550, 29% have a reading attainment score between 400 and 475 and the remaining 26% have a reading attainment score below 400.
Figure 2.6: Percentage of students reaching International Benchmarks (Benchmarking participants)

PIRLS 2011
21
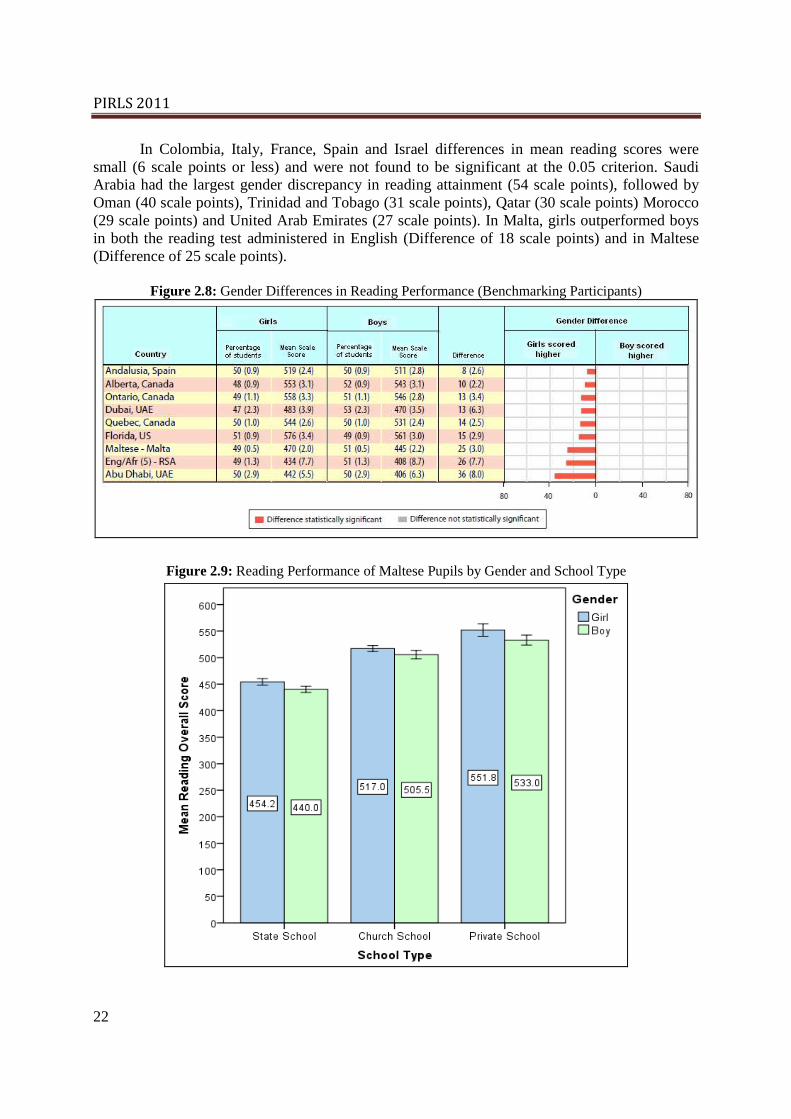
2.3 Gender Differences in Overall Reading Attainment
Figure 2.7 shows that, with the exception of Colombia, in all countries participating in PIRLS 2011, girls outperformed boys in their reading attainment.
Figure 2.7: Gender Differences in Reading Performance
PIRLS 2011
22
In Colombia, Italy, France, Spain and Israel differences in mean reading scores were small (6 scale points or less) and were not found to be significant at the 0.05 criterion. Saudi Arabia had the largest gender discrepancy in reading attainment (54 scale points), followed by Oman (40 scale points), Trinidad and Tobago (31 scale points), Qatar (30 scale points) Morocco (29 scale points) and United Arab Emirates (27 scale points). In Malta, girls outperformed boys in both the reading test administered in English (Difference of 18 scale points) and in Maltese (Difference of 25 scale points).
Figure 2.8: Gender Differences in Reading Performance (Benchmarking Participants)
Figure 2.9: Reading Performance of Maltese Pupils by Gender and School Type

PIRLS 2011
23
Figure 2.8 shows that the difference between boys’ and girls’ reading performance was at 25 scale points when the test was administered in Maltese. Both differences were greater than the PIRLS international average (16 points). Figure 2.9 exhibits the same pattern when Maltese pupils are categorized by school type. Mean reading attainment scores for girls exceed those for boys by 14.2 scale points in State schools, 11.5 scale points in Church schools and 19.8 scale points in Private schools.
2.4 Reading Attainment for different purposes
One of the central features and strengths, of IEA surveys is the explicit definition of the constructs being assessed. PIRLS 2011, reading literacy is defined as the ability to understand and use those written language forms required by society and /or valued by the individual. Young readers can construct meaning from a variety of texts. They read to learn, to participate in communities of readers in school and everyday life, and for enjoyment. (Mullis et al, 2006). This definition, in which reading is seen as a constructive and interactive process, is intended to embrace multi-modal forms of reading, as well as traditional print forms.
PIRLS identifies two purposes for reading – reading for literary experience and reading to
acquire and use information, which are described in Chapter 1. Figures 2.10 and 2.11 present the average achievement of the participating countries in these two purposes for reading. It should be noted, however that the two numerical scale scores representing the reading purposes are not comparable since they represent different constructs and the degree of difficulty may vary between the two assessments. To allow comparison of the relative performance of each country the international average for each purpose was scaled to be 500, similar to the overall international average. This makes it possible to examine relative strengths and weaknesses of countries by comparing the relative positions of the participants on the two scales. The red bars show the difference between mean scores for overall reading and reading for literary experience and the grey bars show the difference between mean scores overall reading and reading to acquire and use information.
Figure 2.10: Performance between Reading Purposes (Benchmarking participants)

PIRLS 2011
24
Figure 2.11: Performance between Reading Purposes
The performance of pupils in Malta differed significantly between the two purposes for reading. This is in keeping with the majority of the countries since only in 15 of the participating countries did the pupils not differ significantly between the two purposes for reading. The score of Malta for the English test on the scale of reading for literary purposes was 470 and the score on the scale of reading for informational purposes was substantially higher at 485. In the case of

PIRLS 2011
25
the Maltese Benchmark the score for literacy was 458 while that for informational purposes was slightly less at 455. The difference in scores was mainly evident in the least performing countries (United Arab Emirates, Saudi Arabia, Indonesia, Qatar, Oman and Morocco) though it was also found in Chinese Taipei and Hong Kong, two high performing countries. In all these countries the score for informational reading was significant higher than the score for literary reading.
Figure 2.12: Performance between Reading Comprehension Processes

PIRLS 2011
26
PIRLS identifies four reading processes that were described in Chapter 1. These include: focus on and retrieve explicitly stated information, make straightforward inferences, interpret and integrate ideas and information and examine and evaluate content, language and textual elements. The two text-based processes (retrieval and straightforward inferencing) were grouped to form a single scale, and the other two processes more concerned with reasoning (interpreting and integrating, and examining and evaluating) were combined to form another. Participating countries’ performance on these two scales, the retrieving and straightforward inferencing scale and the interpreting, integrating and evaluating scale, is reported separately. Figures 2.12 and 2.13 show the difference in performance between the two reading scales for each country.
There was a difference of 4 scale points between the performance of pupils in Malta in the English test favouring the retrieving and straightforward inferencing scale. In the case of the Maltese Benchmark the difference was of 10 scale points. Most of the high performing countries performed better in the reasoning process (interpreting, integrating and evaluating) than in the text-based processes (the retrieving and straightforward inferencing). On the other hand most of the low performing countries performed better in the text-based processes than the reasoning processes.
Figure 2.13: Performance between Reading Comprehension Processes (Benchmarking Participants)
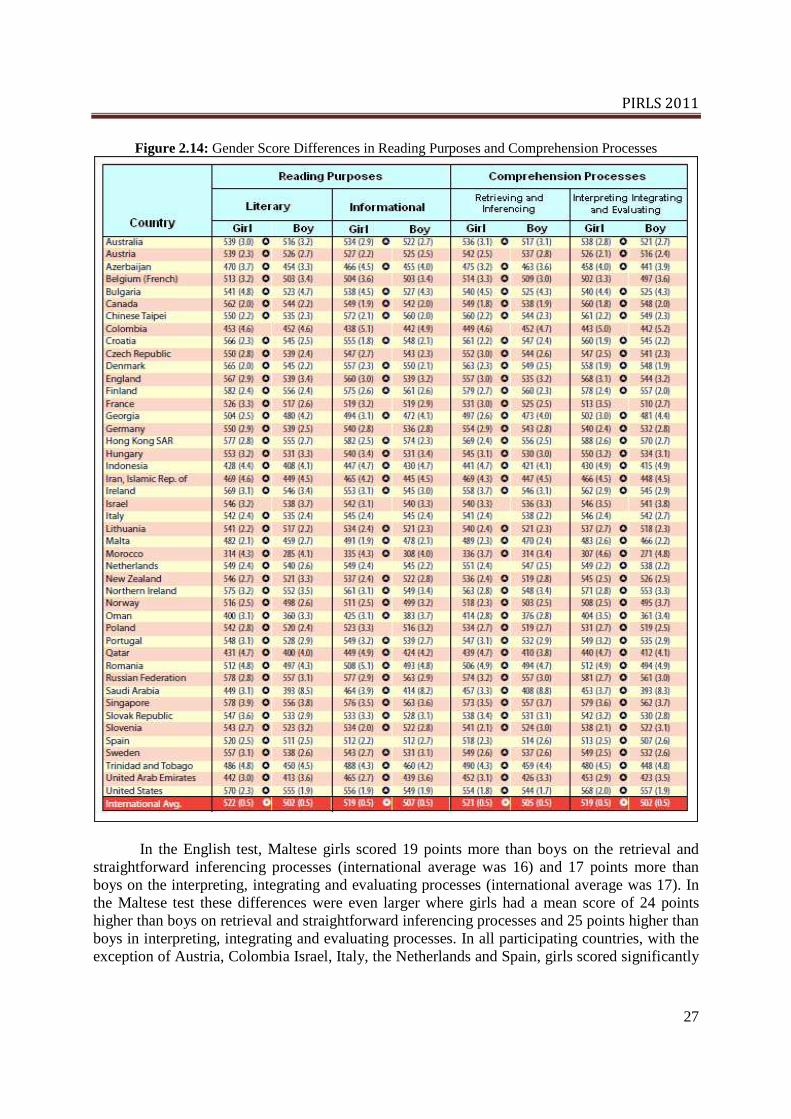
Figure 2.14 shows that girls consistently outperform boys both in the two reading purposes and the two reading processes. In the English test, Maltese girls scored 23 scale points higher than boys in reading for literary purposes (international average was 20) and 13 scale points higher in reading for information (international average was 12). Figure 2.15 shows that in the Maltese test these differences were even higher where girls had a mean scale score of 30 points higher than boys on literary reading and 17 points higher than boys in informational reading. In all participating countries, with the exception of Colombia and Israel, girls scored significantly better than boys on literary reading. Gender differences in informational reading are less conspicuous compared to literary reading. There is no statistical difference between the scores of boys and girls in eleven countries (Austria, Belgium (French), Colombia, France, Israel, Poland, Italy, Czech Republic, Germany, Netherlands, and Spain). Colombia was the only country where boys fared marginally better than girls. In the remaining countries girls performed significantly better than boys.
PIRLS 2011
27
Figure 2.14: Gender Score Differences in Reading Purposes and Comprehension Processes
In the English test, Maltese girls scored 19 points more than boys on the retrieval and straightforward inferencing processes (international average was 16) and 17 points more than boys on the interpreting, integrating and evaluating processes (international average was 17). In the Maltese test these differences were even larger where girls had a mean score of 24 points higher than boys on retrieval and straightforward inferencing processes and 25 points higher than boys in interpreting, integrating and evaluating processes. In all participating countries, with the exception of Austria, Colombia Israel, Italy, the Netherlands and Spain, girls scored significantly

PIRLS 2011
28
better than boys in retrieving and straightforward inferencing processes. Colombia was the only country where boys fared marginally better than girls. In all participating countries, with the exception of Belgium (French), Colombia, France, Israel and Italy, girls performed significantly better than boys in the interpreting, integrating, and evaluating processes. Figure 2.15: Gender Score Differences in Reading Purposes and Processes (Benchmarking Participants)
Figure 2.16: Percentage Correct Replies in Reading Purposes and Processes
Figures 2.16 and 2.17 display the percentage of correct replies in comprehension processes, reading purposes and overall reading. The percentage of correct replies obtained by Maltese pupils in overall reading when the test was administered in English (46%) was significantly higher than when the test was administered in Maltese (40%). Both percentages are significantly lower than the international average (55%). In both the English and Maltese versions of the test, Maltese pupils fared significantly better in literary reading (48% and 45%) than in informational reading (43% and 36%). This is in line with other participating countries where the international average percentage of correct replies in literary reading (59%) exceeds the corresponding mean percentage in informational reading (50%) by almost 10%. Similarly in both the English and Maltese versions of the test, Maltese pupils fared significantly better in retrieving and straight-forward inferencing processes (56% and 52%) than in interpreting, integrating and evaluating

PIRLS 2011
29
processes (35% and 29%). This is in line with other countries where the international average percentage of correct replies in retrieving and straightforward inferencing (64%) exceeds the corresponding mean percentage in interpreting, integrating and evaluating (45%) by almost 20%.
Figure 2.17: Percentage Correct Replies in Reading Purposes and Processes (Benchmark Participants)

PIRLS 2011
30
Figure 2.18: Literary Reading Performance of Maltese Pupils by Gender and School Type
Figure 2.19: Informational Reading Performance of Maltese Pupils by Gender and School Type

PIRLS 2011
31
Figure 2.20: Retreiving and Inferencing Reading Performance of Maltese Pupils by Gender and School type
Figure 2.21: Interpret, Integrate, Evaluate Reading Attainment of Maltese Pupils by Gender and School Type

PIRLS 2011
32
Figure 2.22: Reading Scale Benchmarks of Maltese Pupils by Gender
Figure 2.23: Reading Scale Benchmarks of Maltese Pupils by School Type

PIRLS 2011
33
Figures 2.18 to 2.21 display that in all school types female pupils score significantly higher than male pupils in both reading purposes and comprehension processes since most of the 95% confidence intervals (error bars) are either disjoint or overlap slightly. Moreover, students attending Private schools on average score significantly higher than pupils attending Church and State Schools. Figures 2.2 and 2.23 display significantly higher proportions of females and pupils attending Private schools in the upper reading scale benchmarks and significantly higher proportions of males and pupils attending State schools in the lower reading scale benchmarks.

PIRLS 2011
34

PIRLS 2011
35
3.1 Introduction
This chapter considers the relationship between children’s home circumstances and their performance on the PIRLS reading assessment. In PIRLS, there are two sources of evidence concerning children’s literacy development before they attended primary schools and the literacy practices in the home. Most of the information for these two sources is elicited from the Parent and the Pupil questionnaires, which are respectively completed by parents/carers and pupils, and provide rich information about home resource for learning, parents attitude towards reading, early literacy skills of pupils before onset of primary schooling, early literacy activities at home and parents’ educational expectation for their children.
3.2 Home Reading Resources A scale score for home reading resources was generated by considering five components
– highest education levels and employment status of either parent, the number of books at home as suggested by pupils and by parents, the availability of an internet connection and whether child has an own room. Tables 3.1 to 3.5 display the responses of the Maltese sample for each of the five items.
Table 3.1: Number of books at home as suggested by Maltese pupils
How many books are there in your home? Frequency Percentage 0-10 books 297 8.3% 11-25 books 995 27.8% 26-100 books 1411 39.5% 101-200 books 526 14.7% More than 200 books 345 9.7%
Table 3.2: Items found at home as suggested by Maltese pupils
Do you have any of these things at home? Yes No Your own room 70.8% 29.2% Internet connection 94.1% 5.9%
3
PIRLS 2011
36
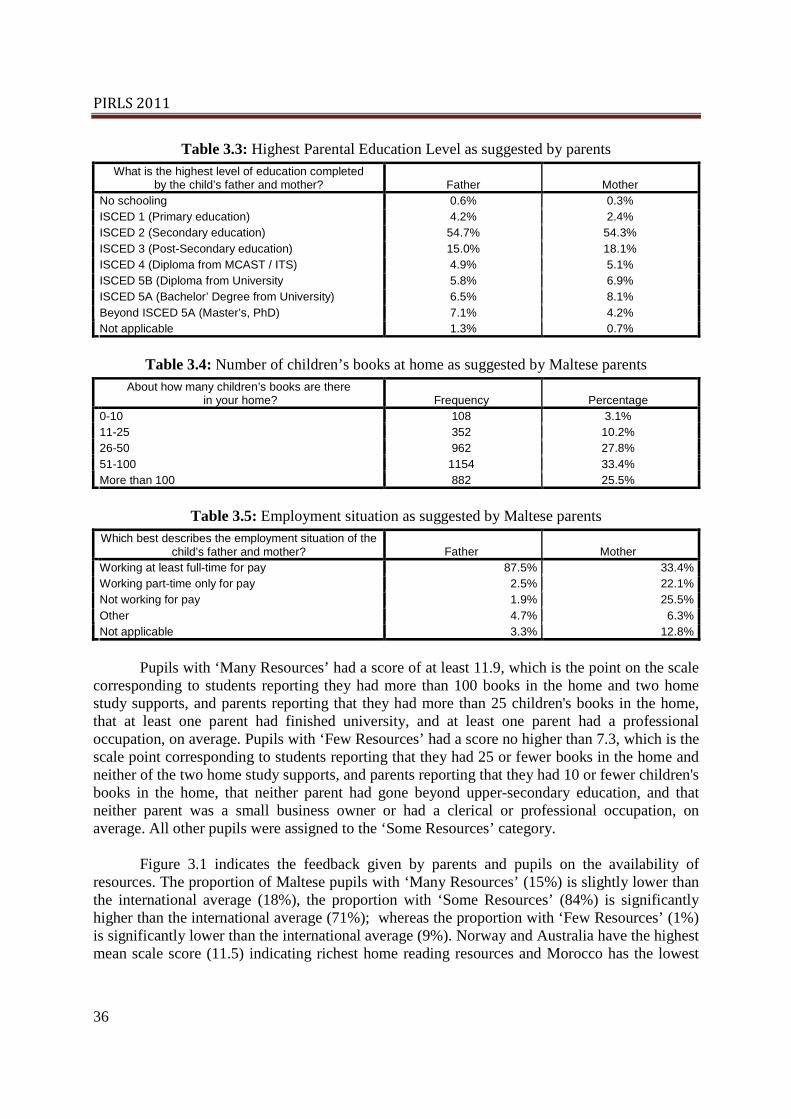
Table 3.3: Highest Parental Education Level as suggested by parents What is the highest level of education completed
by the child’s father and mother? Father Mother No schooling 0.6% 0.3% ISCED 1 (Primary education) 4.2% 2.4% ISCED 2 (Secondary education) 54.7% 54.3% ISCED 3 (Post-Secondary education) 15.0% 18.1% ISCED 4 (Diploma from MCAST / ITS) 4.9% 5.1% ISCED 5B (Diploma from University 5.8% 6.9% ISCED 5A (Bachelor’ Degree from University) 6.5% 8.1% Beyond ISCED 5A (Master’s, PhD) 7.1% 4.2% Not applicable 1.3% 0.7%
Table 3.4: Number of children’s books at home as suggested by Maltese parents
About how many children’s books are there in your home? Frequency Percentage
0-10 108 3.1% 11-25 352 10.2% 26-50 962 27.8% 51-100 1154 33.4% More than 100 882 25.5%
Table 3.5: Employment situation as suggested by Maltese parents
Which best describes the employment situation of the child’s father and mother? Father Mother
Working at least full-time for pay 87.5% 33.4% Working part-time only for pay 2.5% 22.1% Not working for pay 1.9% 25.5% Other 4.7% 6.3% Not applicable 3.3% 12.8%
Pupils with ‘Many Resources’ had a score of at least 11.9, which is the point on the scale
corresponding to students reporting they had more than 100 books in the home and two home study supports, and parents reporting that they had more than 25 children's books in the home, that at least one parent had finished university, and at least one parent had a professional occupation, on average. Pupils with ‘Few Resources’ had a score no higher than 7.3, which is the scale point corresponding to students reporting that they had 25 or fewer books in the home and neither of the two home study supports, and parents reporting that they had 10 or fewer children's books in the home, that neither parent had gone beyond upper-secondary education, and that neither parent was a small business owner or had a clerical or professional occupation, on average. All other pupils were assigned to the ‘Some Resources’ category.
Figure 3.1 indicates the feedback given by parents and pupils on the availability of resources. The proportion of Maltese pupils with ‘Many Resources’ (15%) is slightly lower than the international average (18%), the proportion with ‘Some Resources’ (84%) is significantly higher than the international average (71%); whereas the proportion with ‘Few Resources’ (1%) is significantly lower than the international average (9%). Norway and Australia have the highest mean scale score (11.5) indicating richest home reading resources and Morocco has the lowest

PIRLS 2011
37
mean scale score (7.2). Malta’s mean scale score (10.3) is above the international average. The most striking relationship that emerges is that reading attainment is significantly positively related to home resources for reading. The mean attainment reading scores of pupils with ‘Many’, ‘Some’ and ‘Few’ resources are (571, 510 and 448) respectively and this pattern applies to all participating countries. The mean attainment reading scores of Maltese pupils with ‘Many’ and ‘Some’ resources are (553 and 476) respectively. The mean reading scores of Maltese pupils with ‘Few’ resources could not be computed because of insufficient data.
Figure 3.1: Home Resources for Reading

PIRLS 2011
38
Figure 3.2: Components of Home Resources for Reading Scale
Figure 3.2 displays a significantly higher proportion of Maltese pupils having an internet
connection, an own room and more than 25 children books at home compared to international average proportions. However, Malta has a significantly lower proportion of families with a least one parent having a university degree or higher. Malta’s proportions for the other 3 components are marginally lower international average proportions.

PIRLS 2011
39
3.3 Spoken language at home before starting school Figure 3.3 displays the percentage of pupils who spoke the test language before starting
school as reported by parents. 45% of Maltese parents reported that their children spoke English before starting school. Although this percentage is well below the International Average (92%) this is attributed to the fact that the native language of Maltese pupils is Maltese.
Figure 3.3: Language speaking before starting school
PIRLS 2011
40
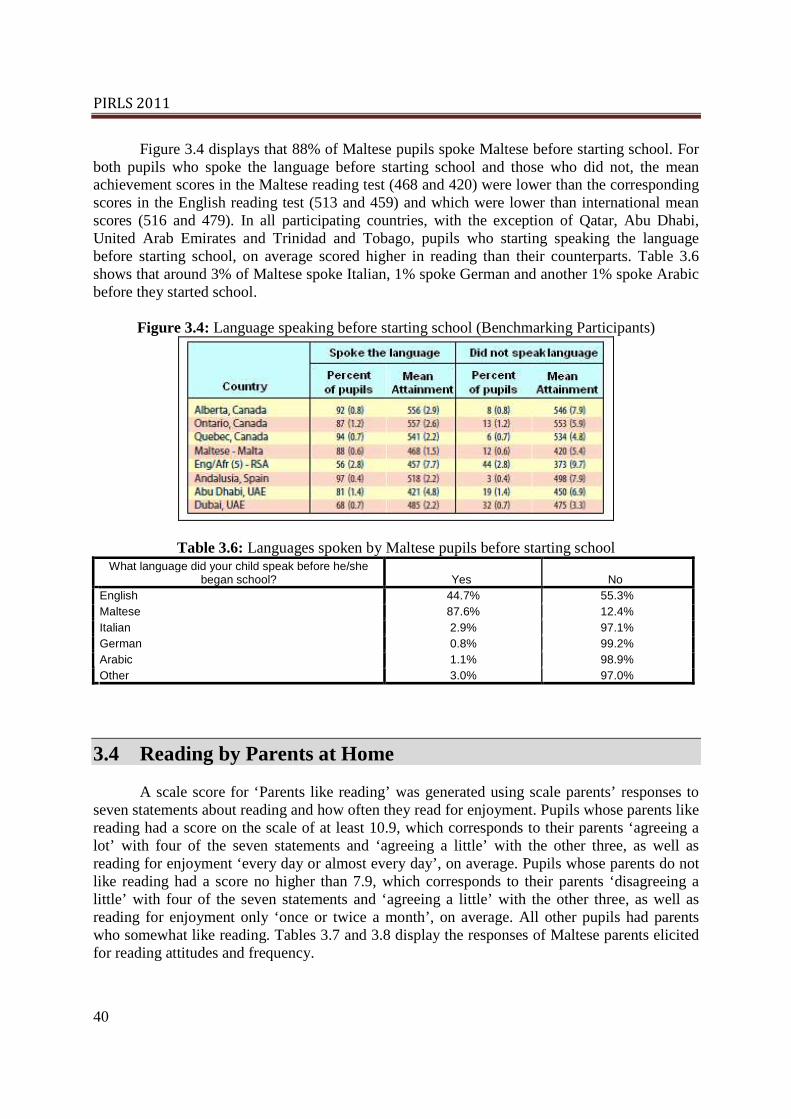
Figure 3.4 displays that 88% of Maltese pupils spoke Maltese before starting school. For both pupils who spoke the language before starting school and those who did not, the mean achievement scores in the Maltese reading test (468 and 420) were lower than the corresponding scores in the English reading test (513 and 459) and which were lower than international mean scores (516 and 479). In all participating countries, with the exception of Qatar, Abu Dhabi, United Arab Emirates and Trinidad and Tobago, pupils who starting speaking the language before starting school, on average scored higher in reading than their counterparts. Table 3.6 shows that around 3% of Maltese spoke Italian, 1% spoke German and another 1% spoke Arabic before they started school.
Figure 3.4: Language speaking before starting school (Benchmarking Participants)
Table 3.6: Languages spoken by Maltese pupils before starting school What language did your child speak before he/she
began school? Yes No English 44.7% 55.3% Maltese 87.6% 12.4% Italian 2.9% 97.1% German 0.8% 99.2% Arabic 1.1% 98.9% Other 3.0% 97.0%
3.4 Reading by Parents at Home
A scale score for ‘Parents like reading’ was generated using scale parents’ responses to seven statements about reading and how often they read for enjoyment. Pupils whose parents like reading had a score on the scale of at least 10.9, which corresponds to their parents ‘agreeing a lot’ with four of the seven statements and ‘agreeing a little’ with the other three, as well as reading for enjoyment ‘every day or almost every day’, on average. Pupils whose parents do not like reading had a score no higher than 7.9, which corresponds to their parents ‘disagreeing a little’ with four of the seven statements and ‘agreeing a little’ with the other three, as well as reading for enjoyment only ‘once or twice a month’, on average. All other pupils had parents who somewhat like reading. Tables 3.7 and 3.8 display the responses of Maltese parents elicited for reading attitudes and frequency.

PIRLS 2011
41
Figure 3.5: Parents like Reading
Table 3.7: Reading attitudes of Maltese parents Indicate how much you agree with the following
statements about reading? Agree a lot
Agree a little
Disagree a little
Disagree a lot
I read only if I have to 8.4% 15.4% 18.1% 58.2% I like talking about what I read with other people 48.7% 34.1% 10.5% 6.7% I like to spend my spare time reading 61.8% 24.5% 8.8% 4.9% I read only if I need information 12.7% 18.7% 22.2% 46.3% Reading is an important activity in my home 61.5% 27.0% 8.8% 2.8% I would like to have more time for reading 79.2% 14.0% 3.9% 2.9% I enjoy reading 78.1% 15.9% 3.1% 2.9%

PIRLS 2011
42
Table 3.8: Reading frequency by Maltese parents When you are at home, how often do you read
for your own enjoyment? Frequency Percentage Every day or almost every day 1427 41.2% Once or twice a week 1285 37.1% Once or twice a month 369 10.7% Never or almost never 382 11.0%
Figure 3.5 displays a significantly higher proportion of Maltese parents (46%) who like to
read compared to the international average proportion (32%). On the other hand, the proportions of Maltese parents who somewhat like to read (45%) or do not like to read (8%) are significantly lower than the international average proportions (57% and 11%) respectively. Sweden has the highest mean scale score (10.9) indicating frequent reading and a very positive attitude towards reading. Morocco and Hong Kong has the lowest mean scale score (9.3). Malta mean scale score (10.7) is well above the international average and is similar to those of Ireland, Australia, Denmark, New Zealand, Northern Ireland and Sweden. The most striking relationship that emerges is that reading attainment is significantly positively related to how much parents like to read. The mean attainment reading scores of pupils whose parents ‘Like’, ‘Somewhat like’ and ‘Do not like’ to read are (535, 507 and 487) respectively and this pattern applies to all participating countries. The mean attainment reading scores of Maltese pupils with ‘Many’ and ‘Some’ resources are (499, 470 and 460) respectively.
3.5 Parents’ Educational Expectation for their Children Table 3.9 displays the educational level that parents expect their children to reach,
ranging from ISCED level 2 to beyond ISCED level 5A. Around 15% of the parents expect their children to complete Secondary education; about 19% expect that they complete Post-Secondary education; around 9% get a diploma from MCAST or ITS; about 21% get a diploma from university or a degree from MCAST; about 25% get a degree from university and only 13% engage in Post-graduate studies (MSc or PhD).
Table 3.9: Educational expectation of Maltese Parents for their Children
How far in his / her education do you expect your child to go? Frequency Percentage
ISCED 2 (Secondary education) 480 14.6% ISCED 3 (Post-Secondary education) 618 18.8% ISCED 4 (Diploma from MCAST / ITS) 281 8.6% ISCED 5B (Diploma from University 673 20.5% ISCED 5A (Bachelor’ Degree from University) 803 24.5% Beyond ISCED 5A (Master’s, PhD) 429 13.1%
Figure 3.6 provides information for each country about parents’ educational expectations
for their children. Maltese parents hold low expectations for their children since only 13% expect their children to complete a postgraduate degree compared to the international average (31%). Similarly 25% of Maltese parents expect their children to complete university as opposed to the International Average (34%). Contrastingly 29% of Maltese parents expect their children to
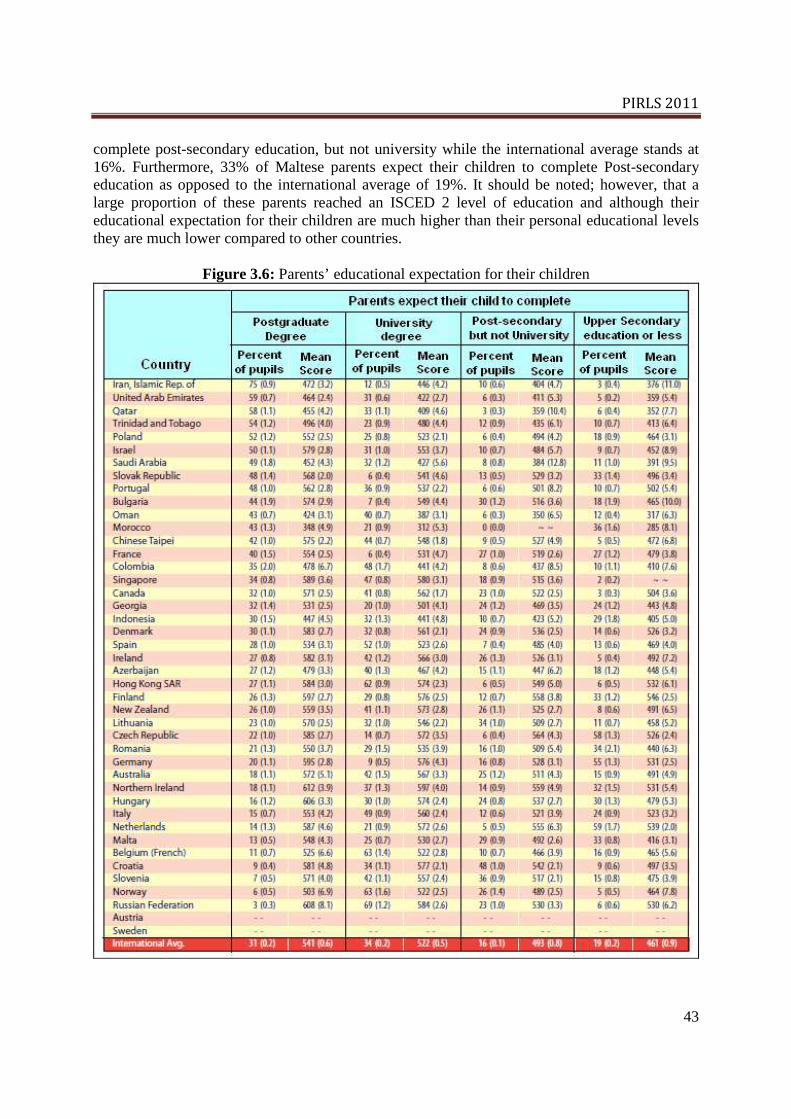
PIRLS 2011
43
complete post-secondary education, but not university while the international average stands at 16%. Furthermore, 33% of Maltese parents expect their children to complete Post-secondary education as opposed to the international average of 19%. It should be noted; however, that a large proportion of these parents reached an ISCED 2 level of education and although their educational expectation for their children are much higher than their personal educational levels they are much lower compared to other countries.
Figure 3.6: Parents’ educational expectation for their children

PIRLS 2011
44
3.6 Early Literacy Activities before starting Primary School
A scale score for ‘Parents’ frequency of doing Early Literacy Activities’ was generated using the nine items displayed in Table 3.10. Pupils often engaged in early literacy activities had a score on the scale of at least 10.7 which corresponds to their parents ‘often’ doing five of the nine activities with them and ‘sometimes’ doing the other four, on average. Pupils never or almost never engaged in such activities had a score no higher than 6.2 which corresponds to parents ‘never or almost never’ doing five of the nine activities with them and ‘sometimes’ doing the other four, on average. All other pupils had parents who sometimes engaged them in early literacy activities.
Figure 3.7: Early literacy activities carried out with child by parents

PIRLS 2011
45
Table 3.10: Early literacy activities carried out with child by Maltese parents Before your child began primary school, how often did
you or someone else in your home do the following activities with him or her?
Often
Sometimes Never or
almost never Read books 52.6% 44.5% 2.9% Tell stories 53.5% 42.2% 4.3% Sing songs 53.4% 36.0% 10.6% Play with alphabet toys 57.1% 34.9% 8.0% Talk about things you had done 63.9% 32.7% 3.4% Talk about things you had read 35.5% 54.0% 10.4% Play word games 44.0% 45.8% 10.3% Write letters or words 50.3% 41.2% 8.5% Read aloud signs and labels 38.4% 44.4% 17.2%
Table 3.10 shows that more than 50% of Maltese parents often read books, tell stories,
play with alphabet toys, sing songs, talk about things they have done and write letter or words with their children. Play word games, talk about things they have done and read aloud signs and labels are less frequent activities of Maltese parents with their children.
Northern Ireland (11.2), Russian Federation (11.1) and New Zealand (11.0) have the
highest mean scale score indicating highest frequency of early literacy activities of parents with their children. Morocco (8.4), Hong Kong (8.7), Chinese Taipei (8.7) and Iran (8.9) have the lowest mean scale scores. Malta’s mean scale score (10.4) is above the international average and is similar to those of Spain, Poland, Czech Republic and Hungary. The most striking relationship that emerges is that reading attainment is significantly positively related to how much parents participate in early literacy activities with their children. The mean attainment reading scores of pupils whose parents ‘Often’, ‘Sometimes’ and ‘Almost never’ engage in early literacy activities are (529, 506 and 430) respectively and this pattern applies to all participating countries. The corresponding mean attainment reading scores of Maltese pupils whose parents ‘Often’ and ‘Sometimes’ participate in early literacy activities with their child are (507 and 463) respectively.
3.7 Pre-Primary Education
Table 3.11 shows the percentage of Maltese pupils who attended pre-primary education for various durations. Figure 3.8 shows that the vast majority of Maltese pupils (86%) attend kindergarten for duration between 1 to 3 years which is significantly higher than the international average proportion (36%). However, the proportion of Maltese pupils who attended pre-primary education for three years or more (11%) is considerably lower compared to the international average proportion (42%). Possibly this can be explained as a result of the fact that our system has only recently started to distinguish between Early Years and Primary Education with the Early Years now including Childcare, Kindergarten 1 and 2 and Years 1 and 2. The proportions of Maltese pupils (3%) who attended Kindergarten for less than 1 year or who never attended (less than 1%) are significantly lower than the international average proportions (11% and 11% respectively). In fact the percentage of Maltese pupils who did not attend pre-primary education was one of the lowest amongst the participating countries.

PIRLS 2011
46
Table 3.11: Duration of Maltese pupils in Kindergarten How long were he / she in Kindergarten? Frequency Percentage
3 years or more 379 11.0% Between 2 and 3 years 595 17.3% 2 years 2148 62.5% Between 1 and 2 years 219 6.4% 1 year or less 94 2.7%
Figure 3.8: Pupils attended Pre-primary Education

PIRLS 2011
47
3.8 Early Literacy Tasks Accomplished
A scale score was generated using parents’ responses to assess how well their children could do the five tasks on the Early Literacy Tasks, which are displayed in Table 3.12. Pupils who could do literacy tasks very well had a score on the scale of at least 11.5 which corresponds to their parents reporting that the pupils could do three literacy tasks very well and the other two moderately well, on average. Pupils doing the tasks not well had a score no higher than 8.9, which corresponds to parents reporting that pupils could do three tasks not very well and the other two moderately well, on average. All other pupils could do the literacy tasks moderately well when they began primary school.
Figure 3.9: Early Literacy Tasks performed by pupils when they began Primary School

PIRLS 2011
48
Table 3.12: Early Literacy Tasks performed by Maltese pupils when they began Primary School How well could your child do the following in English
when he / she began primary school? Very well
Moderately well
Not very well Not at all
Recognise most of the letters of the alphabet 48.6% 39.1% 9.4% 2.9% Read some words 29.6% 46.0% 17.7% 6.6% Read sentences 16.1% 39.0% 29.3% 15.6% Write letters of the alphabet 43.5% 41.6% 10.9% 3.9% Write some words 24.5% 43.6% 21.4% 10.5%
Figure 3.9 shows that the proportion of Maltese pupils who performed early literacy tasks
very well (28%) or moderately well (50%) are considerably higher than the international average proportions (26% and 42% respectively). The proportion of Maltese pupils underperforming in early literacy tasks (22%) is around 10% lower than the international average proportion (32%). Trinidad and Tobago (11.3), Singapore (11.1), Colombia (11.0). Qatar (11.0) and Hong Kong (11.0) have the highest mean scale score indicating highest performance in early literacy tasks by pupils when they began Primary school; whereas, Slovak Republic (8.5) has the lowest mean scale score. Malta’s mean scale score (10.3) is above the international average and is similar to that of Denmark, France, Finland and Sweden. The most striking relationship that emerges is that reading attainment is significantly positively related to performance in early literacy tasks. The mean attainment reading scores of pupils who performed ‘Very well’, ‘Moderately well’ and ‘Not very well’ are (537, 511 and 489) respectively and this pattern applies to all participating countries. The corresponding mean attainment reading scores of Maltese pupils are (515, 480 and 448) respectively.

PIRLS 2011
49
4.1 Introduction
This chapter provides information about the school environment mostly supplied by the Heads of School and partly by teachers. This chapter analyzes the school location, the school composition by student economic background, teacher working conditions, size of school library, and availability of computers for instruction at school and how this instruction is affected by reading resource shortage. Moreover, the Heads of School provide information about the pupils’ early literacy skills when they enter Primary schools.
4.2 School Location Table 4.1 shows that 44% of the schools in Malta are situated in small towns and villages,
31 % are situated in densely populated areas and 15% are located in medium size cities or large towns. The remaining schools are situated in either suburban areas or remote rural areas.
Table 4.1: Description of the locality where the school is situated Which best describes the immediate area in
which your school is located? Frequency Percentage Urban – Densely populated 29 31.2% Suburban – Outskirts of urban area 6 6.5% Medium size city or large town 14 15.1% Small town or village 41 44.1% Remote rural 3 3.2%
Figure 4.1 shows that Malta is the only country where no school is located in an area
where there are more than 100,000 inhabitants. On the other hand, the international average indicates that 31% of pupils attend schools which are located in areas where the population exceeds 100,000. Heads of School indicated that 13% of Maltese pupils are living in a locality where there are between 15,001 and 100,000 inhabitants, while 87% of Maltese pupils are living in a locality where there are 15,000 or less inhabitants. Reading attainment is weakly related to population size of the school locality. The mean reading attainment scores of pupils attending schools in ‘Very large cities’, ‘Moderately large cities’ and ‘Small towns and villages’ are 525,
4

PIRLS 2011
50
512 and 500 respectively. However, this pattern does not apply to all countries. In Malta, the mean reading attainment score of students attending schools located in ‘Small towns and villages’ (481) exceeds by 29 scale points the mean reading scores of pupils attending schools in larger cities (452). This trend is also observed in England and Austria
Figure 4.1: School Location

PIRLS 2011
51
4.3 School Composition by Student Economic Background
Schools where more than 25% of students come from economically affluent homes and not more than 25% of pupils come from economically disadvantaged homes are labelled as ‘More Affluent’. School where more than 25% of pupils come from economically disadvantaged homes and not more than 25% of pupils come from economically affluent homes are labelled as ‘More Disadvantaged’. All other possible response combinations are ‘Neither more affluent nor more disadvantaged’.
Figure 4.2: School Composition by Student Economic Background
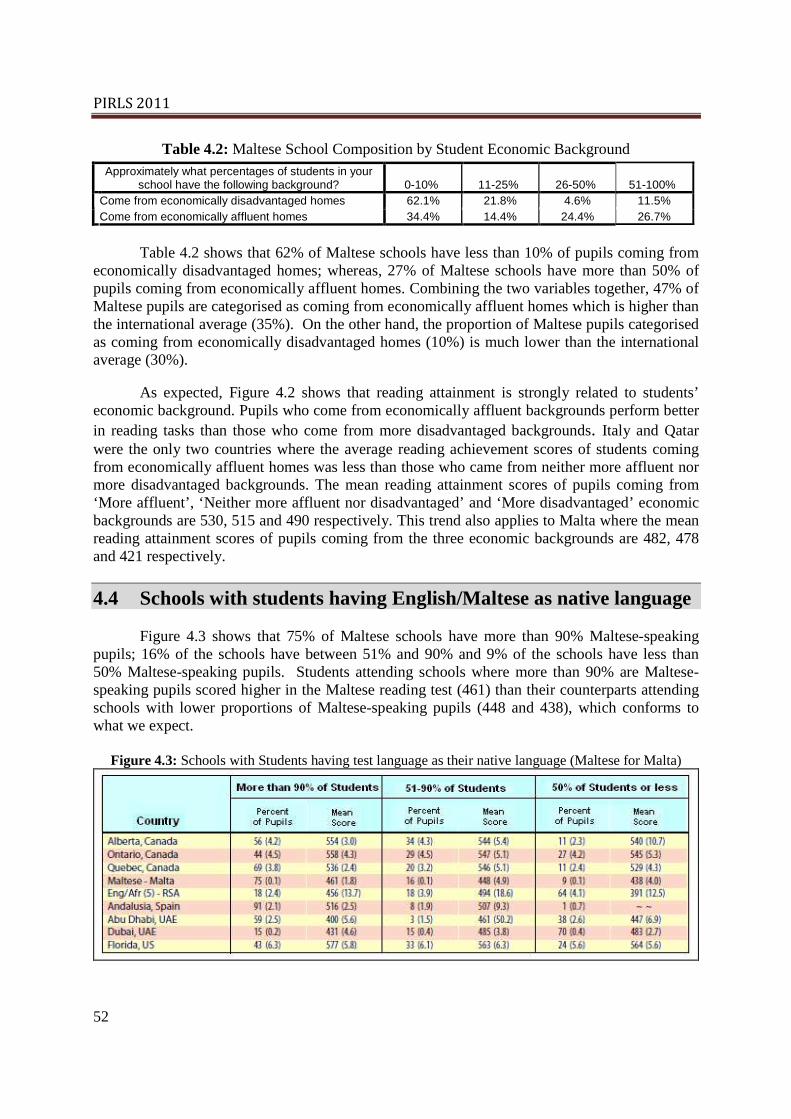
PIRLS 2011
52
Table 4.2: Maltese School Composition by Student Economic Background Approximately what percentages of students in your
school have the following background? 0-10%
11-25%
26-50% 51-100% Come from economically disadvantaged homes 62.1% 21.8% 4.6% 11.5% Come from economically affluent homes 34.4% 14.4% 24.4% 26.7%
Table 4.2 shows that 62% of Maltese schools have less than 10% of pupils coming from
economically disadvantaged homes; whereas, 27% of Maltese schools have more than 50% of pupils coming from economically affluent homes. Combining the two variables together, 47% of Maltese pupils are categorised as coming from economically affluent homes which is higher than the international average (35%). On the other hand, the proportion of Maltese pupils categorised as coming from economically disadvantaged homes (10%) is much lower than the international average (30%).
As expected, Figure 4.2 shows that reading attainment is strongly related to students’ economic background. Pupils who come from economically affluent backgrounds perform better in reading tasks than those who come from more disadvantaged backgrounds. Italy and Qatar were the only two countries where the average reading achievement scores of students coming from economically affluent homes was less than those who came from neither more affluent nor more disadvantaged backgrounds. The mean reading attainment scores of pupils coming from ‘More affluent’, ‘Neither more affluent nor disadvantaged’ and ‘More disadvantaged’ economic backgrounds are 530, 515 and 490 respectively. This trend also applies to Malta where the mean reading attainment scores of pupils coming from the three economic backgrounds are 482, 478 and 421 respectively.
4.4 Schools with students having English/Maltese as native language
Figure 4.3 shows that 75% of Maltese schools have more than 90% Maltese-speaking pupils; 16% of the schools have between 51% and 90% and 9% of the schools have less than 50% Maltese-speaking pupils. Students attending schools where more than 90% are Maltese-speaking pupils scored higher in the Maltese reading test (461) than their counterparts attending schools with lower proportions of Maltese-speaking pupils (448 and 438), which conforms to what we expect.
Figure 4.3: Schools with Students having test language as their native language (Maltese for Malta)

PIRLS 2011
53
Figure 4.4: Schools with Students having test language as their native language (English for Malta)
Figure 4.4 shows that 6% of Maltese schools have more than 90% English-speaking pupils; 12%
of the schools have between 51% and 90% and 82% of the schools have less than 50% English-speaking pupils. Students attending schools where more than 90% are English-speaking pupils scored higher in the English reading test (524) than their counterparts attending schools with lower proportions of English-speaking pupils (521 and 470), which conforms to what we expect. Students from Singapore, Indonesia and Austria were in a similar situation to Malta.

PIRLS 2011
54
4.5 Primary Schools where pupils enter with early literacy skills
Principal responses across the five items, displayed in Table 4.3 were averaged and their students were assigned to categories where 1 corresponds to less than 25%, 2 corresponds to 25-50%, 3 corresponds to 51-75% and 4 corresponds to more than 75%.
Figure 4.5: Schools where students enter the Primary grades with early literacy skills

PIRLS 2011
55
Table 4.3: Maltese schools where students enter the Primary grades with early literacy skills About how many of the students in your school can do
the following when they begin primary school? More
than 75%
51-75%
25-50% Less
than 25% Recognise most of the letters of the alphabet 36.0% 16.9% 13.5% 33.7% Read some words 20.2% 14.6% 16.9% 48.3% Read sentences 6.7% 10.1% 14.6% 68.5% Write letters of the alphabet 28.9% 12.2% 17.8% 41.1% Write some words 14.4% 8.9% 20.0% 56.7%
Figure 4.5 shows that 21% of Maltese schools have more than 75% of pupils with early
literacy skills; 13% of schools have 51-75% of students; 22% of the schools have 25-50% of pupils and 44% of Maltese schools have less than 25% of students in possession of early literacy skills. These proportions are comparable to the international average proportions which are 21%, 18%, 22% and 40% respectively. Singapore has the highest proportion (80%) of schools with more than 75% of pupils in possession of early literacy skills. This is followed by Spain (73%), England (60%), Hong Kong (51%), Qatar (46%), Chinese Taipei (46%), United Arab Emirates (43%) and Sweden (38%). Hungary has the highest proportion (91%) of schools with less than 25% of pupils in possession of early literacy skills. This is followed by Austria (82%), Northern Ireland (81%), Slovak Republic (81%), Czech Republic (76%), Germany (72%) and Portugal (70%).
Figure 4.5 shows that reading attainment is weakly positive related to the proportion of
students within a school possessing early literacy skills. The mean reading attainment scores of pupils attending schools accommodating ‘More than 75%’, ’51-75%’, ’25-50%’ and ‘Less than 25%’ of pupils in possession of early literacy skills are (516, 511, 512 and 500) respectively. This weak relationship also applies to Malta were the mean reading attainment scores of pupils attending these four school categories are (501, 517, 490 and 455) respectively.
4.6 Effects of reading resource shortages on instruction
A scale score for Reading Resource Shortages was generated by considering Heads’ of School responses concerning eleven school and classroom resources that are displayed in Tables 4.4 and 4.5.
Table 4.4: General Resources in Maltese schools How much is your school’s capacity to provide
instruction affected by a shortage or inadequacy of general school resources?
Not at all
A little
Some A lot Instructional material (textbooks) 66.3% 17.4% 6.5% 9.8% Supplies (paper, pencils) 80.2% 6.6% 6.6% 6.6% School building and grounds 41.3% 33.7% 13.0% 12.0% Heating / cooling and lighting systems 40.7% 34.1% 17.6% 7.7% Instructional space (classrooms) 40.2% 29.3% 20.7% 9.8% Technologically competent staff 23.1% 42.9% 28.6% 5.5% Computers for instruction 21.3% 47.2% 24.7% 6.7%

PIRLS 2011
56
Table 4.5: Resources for Reading Instruction in Maltese schools How much is your school’s capacity to provide
instruction affected by a shortage or inadequacy of resources for reading instruction?
Not at all
A little
Some A lot Teachers with a specialisation in reading 21.3% 47.2% 24.7% 6.7% Computer software for reading instruction 21.6% 44.3% 30.7% 3.4% Library books 53.4% 23.9% 13.6% 9.1% Audio-visual resources for reading instruction 18.0% 57.3% 21.3% 3.4%
Figure 4.6: Instruction affected by Reading Resource Shortages

PIRLS 2011
57
The generated scale for Reading Resource Shortages was devised such that students in schools where instruction was Not Affected by resource shortages had a score on the scale of at least 11.2. This corresponds to their Heads’ reporting that shortages affected instruction ‘not at all’ for six of the eleven resources and ‘a little’ for the other five, on average. Pupils in schools where instruction was Affected a Lot had a score no higher than 6.7, which corresponds to their Heads’, reporting that shortages affected instruction ‘A lot’ for six of the eleven resources and some for the other five, on average. All other pupils attended schools where instruction was Somewhat Affected by resource shortages. Slovenia has the largest scale score (11.6) indicating that instruction in this country was affected least by resource shortages. This is followed by New Zealand (11.2), Australia (11.2) and United States (11.1). Colombia (7.4), Hong Kong (8.0), Azerbaijan (8.3), Oman (8.4) and Islamic Republic of Iran (8.4) had the lowest scale scores indicating that instruction in these countries was affected most by resource shortages. Malta has a middling scale score (10.3) which is similar to Finland, Croatia and Lithuania.
Figure 4.6 shows that 26% of Maltese Heads of School reported that instruction was not affected by reading resource shortages; 71% stated that instruction was somewhat affected and only 5% stipulated that instruction was affected considerably resource shortages. These proportions are comparable to international averages (24%, 71% and 5%). Reading attainment is negatively related to the amount instruction was affected by resource shortages. The mean reading attainment scores of pupils attending schools where shortages in reading resources ‘Did not affect instruction’, ‘Somewhat affected’ and ‘Affected a lot instruction’ are (523, 511, and 478) respectively. This negative relationship is not very evident for Malta were the mean reading attainment scores of pupils in these three reading resource shortage categories are (485, 474 and 484) respectively.
4.7 Teacher Working Conditions
A scale score for Teacher Working Conditions was generated by considering teachers’ responses concerning five potential problem areas, described in Table 4.6. Pupils whose teachers had hardly any problems with their working conditions had a score on the scale of at least 11.2 which corresponds to their teachers reporting ‘Not a problem’ for three of five areas and ‘minor problem’ for the other two, on average. Pupils whose teachers had moderate problems had a score no higher than 8.6 which corresponds to their teachers reporting ‘Moderate problem’ for three of five conditions and ‘minor problem’ for the other two, on average. All other pupils had teachers that reported ‘Minor Problems’ with their working conditions.
Table 4.6: Maltese teacher working conditions
In your current school, how severe is each problem? Not a problem
Minor problem
Moderate problem
Serious Problem
The school building needs significant repair 35.5% 35.5% 22.7% 6.2% Classrooms are crowded 37.4% 28.4% 22.3% 11.8% Teachers have too many teaching hours 42.6% 33.5% 17.7% 6.2% Teachers do not have adequate workspace 27.8% 31.1% 27.3% 13.9% Teachers do not have adequate instructional material 32.2% 41.8% 22.6% 3.4%
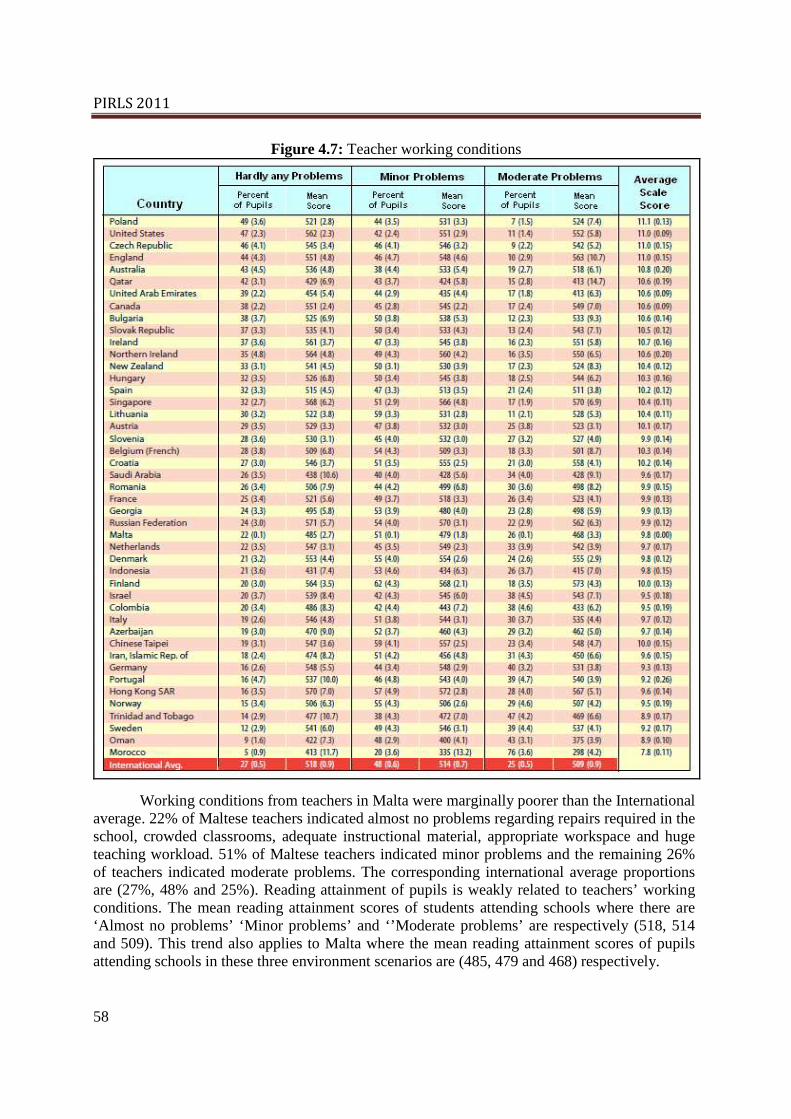
PIRLS 2011
58
Figure 4.7: Teacher working conditions
Working conditions from teachers in Malta were marginally poorer than the International average. 22% of Maltese teachers indicated almost no problems regarding repairs required in the school, crowded classrooms, adequate instructional material, appropriate workspace and huge teaching workload. 51% of Maltese teachers indicated minor problems and the remaining 26% of teachers indicated moderate problems. The corresponding international average proportions are (27%, 48% and 25%). Reading attainment of pupils is weakly related to teachers’ working conditions. The mean reading attainment scores of students attending schools where there are ‘Almost no problems’ ‘Minor problems’ and ‘’Moderate problems’ are respectively (518, 514 and 509). This trend also applies to Malta where the mean reading attainment scores of pupils attending schools in these three environment scenarios are (485, 479 and 468) respectively.

PIRLS 2011
59
4.8 Size of School Library
Figure 4.8 shows the role played by school libraries in achievement. The International Average indicates that the average achievement of pupils is generally higher in schools which have larger libraries. This international average falls from 525 in schools where there are more than 5000 book titles to 513 in those which have between 501 to 5000 book titles and 500 in those schools which have 500 book titles or less and goes down to 498 in those which do not have a school library.
Figure 4.8: Size of School Library

PIRLS 2011
60
According to Heads, 11% of Maltese schools have more than 5000 book titles, 58% have between 500 to 5000 and 17% have less than 500 book titles. The corresponding international average proportions are (28%, 40% and 18%) respectively. Moreover, 14% of Maltese Primary schools have no library, which is comparable to the international average (14%).
4.9 Schools with Computers available for Instruction
Figure 4.9: Schools with computers available for instruction

PIRLS 2011
61
Figure 4.9 shows the number of computers that are available in schools for instruction purposes. Heads of Maltese schools report that 15% of pupils have a computer available for 1 to 2 pupils, which is substantially below the international average (41%). England (88%) tops the list, followed by Slovak Republic (81%), Denmark (86%), Northern Ireland (76%) and Canada (74%). Malta ranks very high at 67% where schools have 1 computer for 3-5 pupils. It is followed by Germany (49%), France (47%) and Israel (46). 18% of Maltese pupils reportedly have 1 computer for 6 or more pupils. This is close to France (17%) and Finland (15%). There is no evidence of any relationship between the reading achievement scores of pupils and the number of computers available within the schools.

PIRLS 2011
62
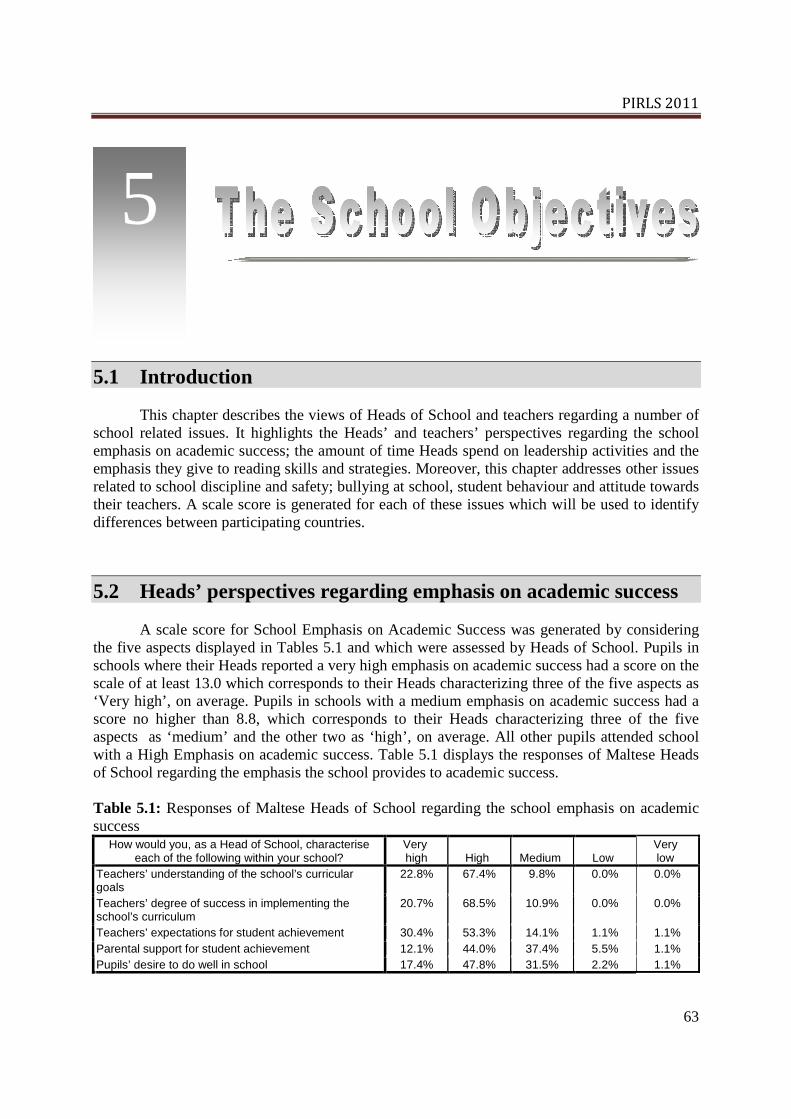
PIRLS 2011
63
5.1 Introduction
This chapter describes the views of Heads of School and teachers regarding a number of school related issues. It highlights the Heads’ and teachers’ perspectives regarding the school emphasis on academic success; the amount of time Heads spend on leadership activities and the emphasis they give to reading skills and strategies. Moreover, this chapter addresses other issues related to school discipline and safety; bullying at school, student behaviour and attitude towards their teachers. A scale score is generated for each of these issues which will be used to identify differences between participating countries.
5.2 Heads’ perspectives regarding emphasis on academic success
A scale score for School Emphasis on Academic Success was generated by considering the five aspects displayed in Tables 5.1 and which were assessed by Heads of School. Pupils in schools where their Heads reported a very high emphasis on academic success had a score on the scale of at least 13.0 which corresponds to their Heads characterizing three of the five aspects as ‘Very high’, on average. Pupils in schools with a medium emphasis on academic success had a score no higher than 8.8, which corresponds to their Heads characterizing three of the five aspects as ‘medium’ and the other two as ‘high’, on average. All other pupils attended school with a High Emphasis on academic success. Table 5.1 displays the responses of Maltese Heads of School regarding the emphasis the school provides to academic success. Table 5.1: Responses of Maltese Heads of School regarding the school emphasis on academic success
How would you, as a Head of School, characterise each of the following within your school?
Very high
High
Medium
Low
Very low
Teachers’ understanding of the school’s curricular goals
22.8% 67.4% 9.8% 0.0% 0.0%
Teachers’ degree of success in implementing the school’s curriculum
20.7% 68.5% 10.9% 0.0% 0.0%
Teachers’ expectations for student achievement 30.4% 53.3% 14.1% 1.1% 1.1% Parental support for student achievement 12.1% 44.0% 37.4% 5.5% 1.1% Pupils’ desire to do well in school 17.4% 47.8% 31.5% 2.2% 1.1%
5

PIRLS 2011
64
Figure 5.1: Responses of Maltese Heads of School regarding the school emphasis on academic success
Figure 5.1 shows that 13% of Maltese pupils attend schools which apportion very high
emphasis to academic success. This is well above the international average (9%) and comparable to Canada (12%) and Israel (15%). The percentage of Maltese pupils attending schools which assign high emphasis on academic success (69%) is considerably higher than the international average (59%). 18% of Maltese pupils attend schools which allot medium emphasis on academic success and is comparable to England (16%) and Austria (17%). Findings indicate that the greater the emphasis on academic success the higher the achievement. The mean reading scores of pupils attending schools that allocate ‘Very high emphasis’, ‘High emphasis’ and ‘Medium

PIRLS 2011
65
emphasis’ are (527, 517 and 497) respectively. The corresponding mean reading achievement scores of Maltese pupils are (488, 488 and 431) respectively. The scale score that measures the school emphasis on academic success according to Heads of School ranges from 11.9 (Northern Ireland) to 7.9 (Morocco). Malta’s mean scale score (11.0) is significantly above the international average.
5.3 Teachers’ perspectives regarding emphasis on academic success
Figure 5.2: Responses of teachers of schools regarding the school emphasis on academic success
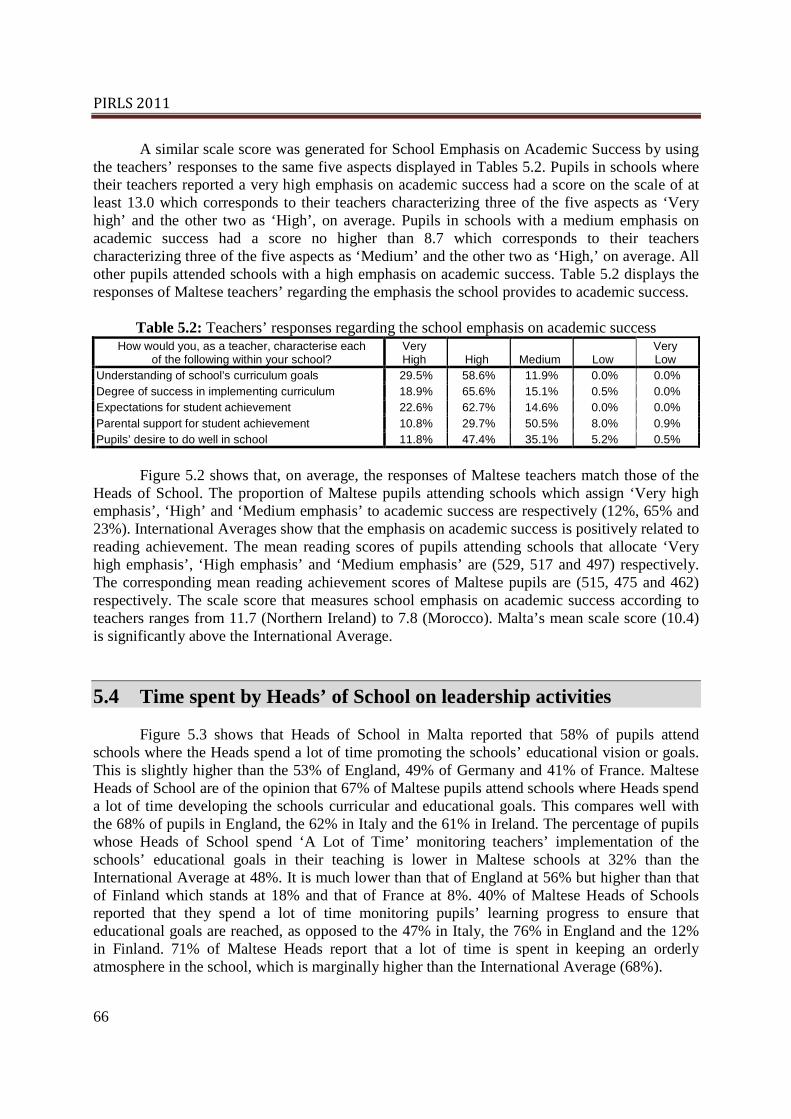
PIRLS 2011
66
A similar scale score was generated for School Emphasis on Academic Success by using the teachers’ responses to the same five aspects displayed in Tables 5.2. Pupils in schools where their teachers reported a very high emphasis on academic success had a score on the scale of at least 13.0 which corresponds to their teachers characterizing three of the five aspects as ‘Very high’ and the other two as ‘High’, on average. Pupils in schools with a medium emphasis on academic success had a score no higher than 8.7 which corresponds to their teachers characterizing three of the five aspects as ‘Medium’ and the other two as ‘High,’ on average. All other pupils attended schools with a high emphasis on academic success. Table 5.2 displays the responses of Maltese teachers’ regarding the emphasis the school provides to academic success.
Table 5.2: Teachers’ responses regarding the school emphasis on academic success How would you, as a teacher, characterise each
of the following within your school? Very High
High
Medium
Low
Very Low
Understanding of school’s curriculum goals 29.5% 58.6% 11.9% 0.0% 0.0% Degree of success in implementing curriculum 18.9% 65.6% 15.1% 0.5% 0.0% Expectations for student achievement 22.6% 62.7% 14.6% 0.0% 0.0% Parental support for student achievement 10.8% 29.7% 50.5% 8.0% 0.9% Pupils’ desire to do well in school 11.8% 47.4% 35.1% 5.2% 0.5%
Figure 5.2 shows that, on average, the responses of Maltese teachers match those of the Heads of School. The proportion of Maltese pupils attending schools which assign ‘Very high emphasis’, ‘High’ and ‘Medium emphasis’ to academic success are respectively (12%, 65% and 23%). International Averages show that the emphasis on academic success is positively related to reading achievement. The mean reading scores of pupils attending schools that allocate ‘Very high emphasis’, ‘High emphasis’ and ‘Medium emphasis’ are (529, 517 and 497) respectively. The corresponding mean reading achievement scores of Maltese pupils are (515, 475 and 462) respectively. The scale score that measures school emphasis on academic success according to teachers ranges from 11.7 (Northern Ireland) to 7.8 (Morocco). Malta’s mean scale score (10.4) is significantly above the International Average.
5.4 Time spent by Heads’ of School on leadership activities
Figure 5.3 shows that Heads of School in Malta reported that 58% of pupils attend schools where the Heads spend a lot of time promoting the schools’ educational vision or goals. This is slightly higher than the 53% of England, 49% of Germany and 41% of France. Maltese Heads of School are of the opinion that 67% of Maltese pupils attend schools where Heads spend a lot of time developing the schools curricular and educational goals. This compares well with the 68% of pupils in England, the 62% in Italy and the 61% in Ireland. The percentage of pupils whose Heads of School spend ‘A Lot of Time’ monitoring teachers’ implementation of the schools’ educational goals in their teaching is lower in Maltese schools at 32% than the International Average at 48%. It is much lower than that of England at 56% but higher than that of Finland which stands at 18% and that of France at 8%. 40% of Maltese Heads of Schools reported that they spend a lot of time monitoring pupils’ learning progress to ensure that educational goals are reached, as opposed to the 47% in Italy, the 76% in England and the 12% in Finland. 71% of Maltese Heads report that a lot of time is spent in keeping an orderly atmosphere in the school, which is marginally higher than the International Average (68%).

PIRLS 2011
67
Figure 5.3: Proportion of Heads of School who spend a lot of time on leadership activities
Figure 5.3 shows that 39% of Maltese Heads of School spend a lot of time addressing bad behaviour by pupils and disruption; however, this is lower than the international average (44%). 39% of Maltese Heads of School devote a lot of time advising teachers when they encounter queries and problems with their teaching, which is higher than the international average (35%) and higher than the 17% of England and the 16% of Finland but lower than the 48% of Italy. 44% of Maltese Heads of School report that they spend a lot of time initiating educational

PIRLS 2011
68
projects or improvements, which is higher than the international average (41%), England (34%) and Finland (28%) but is lower than Italy (61%) and Singapore (58%). Participation in professional development activities for Heads of School is given less importance by Maltese Heads of School (26%) compared to the international average (38%); however, Malta’s proportion is higher than Germany (17%), England (13%), Portugal (6%) and France (5%).
5.5 Emphasis in early grades on reading skills and strategies
A scale score that measures the onset when reading skills and strategies are emphasized is generated using the responses of Heads of School on eleven reading related items displayed in Table 5.3. Pupils in schools where their Heads of School reported reading skills and strategies were emphasized at or before second grade (Year 3) had a score on the scale of at least 11.1, which corresponds to all eleven skills and strategies being emphasized at second grade, on average. Pupils in schools where their Heads of School reported reading skills and strategies were emphasized at fourth grade (Year 5) or later had a score no higher than 6.5, which corresponds to all eleven skills and strategies being emphasized at fourth grade, on average. All other pupils attended schools where reading skills and strategies were emphasized at third grade (Year 4).
Table 5.3: Grades when reading skills and strategies are emphasized in Maltese schools In which Year group do the following reading skills
and strategies first receive a major emphasis in the instruction of English in your school?
Year 2 or
earlier
Year 3
Year 4
Year 5
Not in these
grades Reading isolated sentences 93.3% 6.7% 0.0% 0.0% 0.0% Reading connected text 67.8% 31.1% 1.1% 0.0% 0.0% Locating information within the text 24.7% 59.7% 14.6% 1.1% 0.0% Identifying the main idea of a text 20.0% 48.9% 27.8% 3.3% 0.0% Explaining of supporting understanding of a text 15.7% 40.4% 31.5% 12.4% 0.0% Comparing a text with personal experience 12.5% 25.0% 33.0% 29.5% 0.0% Comparing different texts 4.5% 16.9% 27.0% 37.1% 14.6% Make predictions about what will happen next in a text 15.6% 14.4% 33.3% 32.2% 4.4% Make generalisations and drawing inferences on text 7.9% 16.9% 12.4% 34.8% 28.1% Describing the style or structure of a text 2.2% 7.8% 16.7% 25.6% 47.8% Determine the author’s perspective or intention 3.4% 5.6% 9.0% 30.3% 51.7%
Figure 5.4 shows that 13% of Maltese Heads of School stated that reading skills and
strategies are emphasised at or before Year 3 (second grade) and the remaining 87% of Heads declared that emphasis on reading skills commence at Year 4 (third grade). International averages show that achievement in reading is positively related to an early onset with the emphasis on reading skills and strategies. The average reading attainment scores of pupils attending schools where reading skills were emphasized at or before Year 3, at Year 4, at Year 5 or later are (522, 511 and 450) respectively; however, this relationship is not evident for Malta. The scale score that measures the onset when reading skills and strategies were emphasized ranges from 12.6 (England and Australia) to 6.8 (Morocco). Malta’s mean scale score (9.4) is significantly below the international average and is comparable to Finland (9.2), Norway (9.3), Italy (9.4) and Chinese Taipei (9.4).

PIRLS 2011
69
Figure 5.4: Emphasis on Early Grades on Reading Skills and Strategies
5.6 Safe and orderly schools
A scale score that measures safety and order in school was generated using the teachers’ responses on five statements that are displayed in Table 5.4. Pupils in safe and orderly schools had a score on the scale of at least 10.1 which corresponds to their teachers ‘agreeing a lot’ with three of the five qualities of a safe and orderly school and ‘agreeing a little’ with the other two,

PIRLS 2011
70
on average. Pupils in Not Safe and Orderly schools had a score no higher than 6.2 which corresponds to their teachers ‘disagreeing a little’ with three of the five qualities and ‘agreeing a little’ with the other two, on average. All other pupils attended Somewhat Safe and Orderly schools.
Figure 5.5: Safe and Orderly schools
Figure 5.5 shows that 50% of Maltese teachers indicated that they attend safe and orderly schools; 49% attend somewhat safe / orderly schools and 2% attend unsafe schools. International Averages stand at (55%, 41% and 4%) respectively. Achievement in reading is positively related

PIRLS 2011
71
to the degree of safety and order within the school. The average reading attainment scores of pupils attending ‘Safe and orderly’, ‘Somewhat safe and orderly’, ‘Not safe and order’ schools are (518, 505 and 486) respectively. This pattern applies to Malta where pupils attending safe and orderly schools (488) scored significantly higher than their counterparts attending somewhat safe and orderly schools (470). The mean reading score for Maltese pupils attending unsafe schools was not computed due to insufficient data. The scale score that measures safety and order within schools ranges from 11.9 (Indonesia) to 8.4 (Trinidad and Tobago). Malta’s mean scale score (9.9) is below the international average and is comparable to Austria (10.0), Poland (9.9), Hong Kong (9.9), Poland (9.9), Bulgaria (9.9), Russian Federation (9.7), Germany (9.6), Hungary (9.6) and Lithuania (9.6).
Table 5.4: Safety and order in Maltese schools Thinking about your current school, indicate the extent
to which you agree or disagree with each of the following statements?
Agree a lot
Agree a little
Disagree
a little Disagree
a lot This school is located in safe neighbourhood 75.3% 19.6% 5.1% 0.0% I feel safe at school 80.7% 16.6% 2.7% 0.0% The school’s security policies are sufficient 60.6% 30.0% 7.3% 2.1% The pupils behave in an orderly manner 41.1% 39.3% 15.4% 4.2%
The pupils are respectful of the teachers 43.5% 37.2% 14.2% 5.1%
5.7 School discipline and safety
A scale score that measures school discipline and safety was generated using responses of Heads of School on ten items related to school problems, which are displayed in Table 5.5. Pupils in schools with hardly any problems had a score on the scale of at least 9.9 which corresponds to their Heads reporting ‘Not a problem’ for five of the ten discipline and safety issues and ‘minor problem’ for the other five, on average. Pupils in schools with moderate problems had a score no higher than 7.7 which corresponds to their Heads reporting ‘Moderate problem’ for five of the ten issues and ‘Minor problem’ for the other five on average. All other pupils attended schools with minor problems.
Table 5.5: School discipline and safety in Maltese schools To what degree is each of the following problems
among Year 5 students in your school? Not a
problem Minor
problem Moderate problem
Serious problem
Arriving late at school 42.9% 46.2% 7.7% 3.3% Absenteeism 64.8% 26.4% 6.6% 2.2% Classroom disturbance 40.2% 44.6% 14.1% 1.1% Cheating 68.5% 26.1% 3.3% 2.2% Swearing 71.7% 18.5% 7.6% 2.2% Vandalism 79.1% 14.3% 4.4% 2.2% Theft 81.3% 14.3% 2.2% 2.2% Intimidation or verbal abuse among students 41.1% 43.3% 11.1% 4.4% Physical fights among students 42.9% 45.1% 9.9% 2.2% Intimidation or verbal abuse of teachers or staff 87.0% 7.6% 4.3% 1.1%

PIRLS 2011
72
Figure 5.6: School Discipline and Safety
Figure 5.6 shows that Maltese Heads of School exhibit a more realistic picture of the local situation than what was portrayed in the preceding section. 64% of Heads of School reported that their school disciplinary problems were trivial. 30% stipulated that they encountered minor problems and 6% stated that disciplinary problems were moderate. Not surprisingly, pupils who attended schools where disciplinary problems were trivial achieved significantly higher reading scores (519) compared to students attending schools with minor problems (504) and moderate disciplinary problems (476). This trend applies to Malta where students attending safe schools with insignificant disciplinary problems (492) scored

PIRLS 2011
73
significantly higher than their counterparts attending schools with minor problems (454) and moderate disciplinary problems (448). The scale score that measures safety and school discipline ranges from 11.4 (Hong Kong and Chinese Taipei) to 6.2 (Indonesia). Malta’s mean scale score (10.2) is above the international average and comparable to Finland (10.3), United States (10.3), Canada (10.3) and Russian Federation (9.7).
5.8 Bullying at School
Figure 5.7: Pupils bullied at school

PIRLS 2011
74
A scale score that measures bullying at school was generated using pupils’ responses to six bullying behaviours, which are displayed in Table 5.6. Pupils who were never bullied had a score on the scale of at least 10.1 which corresponds to ‘Never’ experiencing three of the six bullying behaviours and each of the other three behaviours ‘a few times a year’ on average. Pupils bullied about once weekly had a score no higher than 8.3 which corresponds to their experiencing each of three of the six behaviours ‘once or twice a month’ and each of the other three ‘a few times a year’ on average. All other pupils were bullied about once monthly.
Table 5.6: Bullying in Maltese schools During this year, how often have any of the following
things happened to you at school? Never or
almost never Once or twice
a year Once or twice
a month At least once
a week I was made fun of or called names 44.6% 23.9% 11.1% 20.4% I was left out of games/activities by other pupils 52.2% 19.5% 13.5% 14.7% Someone spread lies about me 46.9% 24.7% 12.9% 15.6% Something was stolen from me 62.9% 20.8% 8.3% 8.0% I was hit or hurt by other pupil(s) 38.8% 30.2% 14.6% 16.4% I was made to do things I didn’t want to do to others 66.0% 15.8% 8.5% 9.7%
Figure 5.7 shows that 42% of Maltese pupils indicated that they hardly ever experience
bullying, which is lower than the international average (47%). 36% of Maltese pupils indicated that they were bullied on a monthly basis, at par with Canada but slightly higher than England (35%) and Italy (33%). Similarly the proportion of Maltese pupils being bullied on a weekly basis (22%) was marginally higher than the international average (20%). The scale score that measures bullying at school ranges from 11.4 (Azerbaijan) to 9.1 (Trinidad and Tobago and Qatar). Malta’s mean scale score (9.8) is marginally below the international average and is comparable to Spain (9.8), Canada (9.8) and England (9.9) and Islamic Republic of Iran (9.9).

PIRLS 2011
75
6.1 Introduction
This chapter provides information about teaching and reading approaches adopted by teachers in classrooms. This chapter also describes background information about the teachers' formal education, teachers’ emphasis on language and reading areas in their formal education and training, teachers’ years of experience, the time spent by teachers on professional development related to reading in the recent past and teachers’ career satisfaction.
6.2 Teachers’ formal education Table 6.1 shows that around 70% of Maltese Year 5 teachers completed a Bachelor’s
degree, approximately 10% completed a Master’s degree or a PhD and the remaining 20% either completed a Diploma at University or MCAST, but not a Bachelor’s degree, or completed Upper Secondary education. Figure 6.1 displays the proportions of teachers within each education level. The international average proportion of teacher who completed a Master’s degree or a PhD (26%) is significantly higher than Malta’s (10%). Slovak Republic (99%) tops the list, followed by Poland (96%), Czech Republic (93%), Finland (82%), Russian Federation (79%), France (75%) and Georgia (75%). On the other hand, Malta has a significantly higher proportion of teachers with a Bachelor’s degree compared to the international average proportion (53%) and is comparable to Denmark (75%), Chinese Taipei (72%), England (71%), New Zealand (69%), Saudi Arabia (69%), Qatar (70%) and United Arab Emirates (67%). The proportion of Maltese teachers who completed a Diploma or reached a level beyond post-secondary education is comparable to international average proportions (21%).
Table 6.1: Formal education of Maltese teachers
What is the highest level of formal education you have completed? Frequency Percentage
Did not complete ISCED level 3 2 1.0% Completed ISCED level 3 17 8.2% Completed ISCED level 4 1 0.5% Completed ISCED level 5B 20 9.8% Completed Bachelor’s Degree 145 69.9% Completed Master’s, PhD 22 10.6%
6

PIRLS 2011
76
Figure 6.1: Teachers’ Formal Education
6.3 Emphasis on language/reading areas in teachers’ formal education
Table 6.2 shows the proportion of teachers who during their formal education or training emphasised various aspects of language and reading areas. Figure 6.2 shows that the proportion of teachers who emphasized language in their formal training ranges from 97% (Bulgaria) to 0% (French-speaking Belgian community). The percentage of Maltese teachers who did emphasize language in their formal education or training (65%) is significantly lower than the international average (72%). Other countries scored higher than the international average: Bulgaria is

PIRLS 2011
77
followed by the Russian Federation (95%), the Slovak Republic (93%), Georgia (92%), Romania (90%), Croatia (90%) and the United Arab Emirates.
Table 6.2: Emphasis on language and reading areas by Maltese teachers in formal education/training
As part of your formal education and / or training, to what extent did you study the following areas? Not at all
Overview or introduction to topic
It was an area of emphasis
Language test English / Maltese) 3.9% 30.9% 65.2% Pedagogy/ teaching reading 7.3% 30.6% 62.1% Reading theory 22.9% 61.0% 16.1%
Figure 6.2: Emphasis on language and reading areas by teachers in formal education/training

PIRLS 2011
78
The proportion of teachers who emphasized pedagogy and teaching reading in their formal education or training ranges from 97% (Bulgaria) to 28% (Finland). The percentage of Maltese teachers who did emphasize pedagogy and teaching reading in their formal education or training is comparable to the international average (62%). Bulgaria is followed by the Russian Federation (95%), Georgia (88%), Hungary (88%), Croatia (87%), the Slovak Republic (84%) and Romania (83%). The proportion of teachers who emphasized reading theory in their formal education or training ranges from 76% (Russian Federation) to 8% (Finland). The percentage of Maltese teachers who did emphasize reading theory in their formal education or training (16%) is significantly lower than the international average (33%). The Russian Federation is followed by Azerbaijan (58%), Indonesia (57%), Trinidad and Tobago (55%), Georgia (53%) and Bulgaria (50%). It is evident that pupils’ reading achievement scores are not related to the proportion of teachers who made emphasis on language and reading areas in their formal education and training.
6.4 Teachers’ years of experience
Table 6.3 displays the age distribution of Maltese teachers teaching Year 5 pupils. Around 43% of teachers have ages ranging 30 to 39 years, about 26% are aged less than 30 years and approximately 31% are aged at least 40 years.
Table 6.3: Age Distribution of Maltese teachers teaching Year 5 students How old are you? Frequency Percentage
Under 25 19 9.0% 25-29 35 16.5% 30-39 92 43.4% 40-49 32 15.1% 50-59 27 12.7% 60 or more 7 3.3%
Figure 6.3 clearly displays a significantly higher proportion of Maltese teachers (44%)
with less than 10 years teaching experience compared to the international average proportion (28%). Moreover, the proportion of Maltese teachers (18%) with 20 years or more teaching experience is significantly lower than the international average (41%). In fact, the average years of experience of Maltese teachers (12 years) is significantly less than the international average (17 years) indicating that Malta has one of the youngest teaching workforces of all participating countries. Malta is preceded by England and the United Arab Emirates (10 years teaching experience), New Zealand, Oman Singapore and Qatar (11 years teaching experience) and equalled by Ireland (12 years teaching experience). On the other hand, Bulgaria, Hungary, Italy, Lithuania and the Russian Federation have the oldest teaching workforce (24 years teaching experience) followed by Azerbaijan, Poland and Romania (23 years teaching experience). There seems to be a positive relationship between the pupils’ reading attainment scores and the years of teaching experience. The mean reading attainment scores of pupils taught by teachers with ’20 years of teaching experience’, ‘between 10 and 20 years’, ‘between 5 and 10 years’ and ‘less than 5 years’ are (517, 511, 510 and 507) respectively. The corresponding mean reading achievement scores of Maltese pupils are (491, 475, 472 and 477) respectively.

PIRLS 2011
79
Figure 6.3: Teachers’ years of experience
6.5 Time spent by teachers on professional reading development
Table 6.4 displays the time distribution spent by teachers in in-service workshops or seminars that dealt directly with reading or teaching reading. Around 23% of Maltese teachers never engaged in any professional reading development. This proportion is marginally lower than the international average proportion (25%). On the other hand, the proportion of Maltese teachers who spent more than 16 hours on professional reading development (19%) is significantly lower than the international average (24%); however, Malta has a significantly higher proportion (58%) compared to the international average proportion (50%) of teachers spending between 6 to 15 hours on professional reading development.

PIRLS 2011
80
Table 6.4: Amount of time spent by Maltese teachers on professional reading development In the past two years, how many hours in total have you spent in in-service workshops or seminars that dealt directly with reading or teaching reading? Frequency Percentage
None 48 23.3% Less than 6 hours 58 28.2% 6-15 hours 62 30.1% 16-35 hours 24 11.7% More than 35 hours 14 6.8%
Figure 6.4: Time spent by teachers on professional reading development

PIRLS 2011
81
Figure 6.4 displays that Israel has the highest proportion (72%) of Primary school teachers engaging in professional reading development during the last two years, followed by Romania (51%), Islamic Republic of Iran (47%), Portugal (45%), Georgia (42%), United States (41%) and Azerbaijan (40%). France has the lowest proportion (2%) of Year 5 school teachers spending at least 16 hours in professional reading development, followed by Morocco (4%), Germany (4%), Finland (4%), England (7%), Bulgaria (8%), the French speaking Belgian community (9%) and the Czech Republic (9%). The professional reading training received by teachers does not appear to be related to the achievement of pupils in reading. The mean reading attainment scores of pupils taught by teachers who spent ‘At least 16 hours’, ‘Less than 16 hours’ and ‘No time’ are (512, 513 and 513) respectively. The corresponding mean reading achievement scores of Maltese pupils are (478, 471 and 493) respectively indicating no visible trend that conforms to what is expected.
Table 6.5: Frequency of reading children’s books by Maltese teachers For your professional development, about how
often do you read children’s books? Frequency Percentage At least once a week 58 29.1% Once or twice a month 92 46.2% Once or twice a year 34 17.1% Never or almost never 15 7.5%
Table 6.5 shows the frequency distribution of Maltese reading children’s books. Around
73% of Maltese Year 5 school teachers read children’s books at least once monthly, which is comparable to the international average proportion (73%). Azerbaijan leads the list with 99% of the teachers reading children’s books regularly, followed by Colombia (96%), Indonesia (95%), Russian Federation (95%), Romania (93%), Georgia (93%), Portugal (93%) and Croatia (92%).
6.6 Teachers’ career satisfaction
Table 6.6 presents a positive picture regarding teachers’ job satisfaction. Around 90% of Maltese teachers agree fully that they do important work as teachers; more than 75% agree entirely that they are happy with their profession and satisfied with being teachers at their present schools. Approximately 70% of teachers disagreed completely that they are frustrated and about 63% were almost certain that they will proceed with their career as teachers and more than 65% of the teachers disagreed that they had more enthusiasm when they began teaching.
Table 6.6: Career satisfaction of Maltese school teachers How much do you agree with the following
statements? Agree a lot
Agree a little
Disagree a little
Disagree a lot
I am content with my profession as a teacher 76.3% 19.9% 3.8% 0.0% I am satisfied with being a teacher at this school 79.1% 17.5% 3.3% 0.0% I had more enthusiasm when I began teaching 12.8% 21.3% 24.2% 41.7% I do important work as a teacher 92.4% 7.6% 0.0% 0.0% I plan to continue as a teacher for as long as I can 63.5% 27.0% 8.5% 0.9% I am frustrated as a teacher 0.5% 14.3% 15.7% 69.5%

PIRLS 2011
82
Figure 6.5: Teachers’ Career Satisfaction
A scale score was generated to assess teachers’ career satisfaction. Pupils whose teachers are satisfied with their job had a score on the scale of at least 10.0, which corresponds to their teachers ‘agreeing a lot’ with three of the six statements and ‘agreeing a little’ with the other three, on average. Pupils whose teachers are less than satisfied had a score no higher than 6.5, which corresponds to their teachers ‘disagreeing a little’ with three of the six statements and ‘agreeing a little’ with the other three, on average. All other pupils had ‘somewhat satisfied’ teachers.

PIRLS 2011
83
The proportion of Maltese teachers who are satisfied with their job (66%) is significantly higher than the international average proportion (54%). However, the proportions of Maltese teachers who are moderately satisfied (30%) or less than satisfied (4%) are considerably lower than international average proportions (40% and 5%) respectively.
Colombia has the highest proportion (90%) of Primary school teachers who are satisfied
with their career, followed by Indonesia (89%), Croatia (83%), Georgia (79%), Spain (69%), Ireland (69%), Denmark (69%), Israel (67%) and Malta (66%). France has the lowest proportion (25%) of Primary school teachers who are satisfied with their job, followed by Sweden (29%), Chinese Taipei (31%), Morocco (35%) and Singapore (35%). The teachers’ career satisfaction is weakly positively related to the achievement of pupils in reading. The mean reading attainment scores of pupils whose teachers are ‘Satisfied’, ‘Somewhat satisfied’ and ‘Less than satisfied’ are (516, 509 and 511) respectively. The corresponding mean reading achievement scores of Maltese pupils are (485, 463 and 467) respectively. The scale score that measures Primary teachers’ job satisfaction ranges from 11.6 (Colombia) to 8.6 (France). Malta’s scale score (10.7) is well above the international average.

PIRLS 2011
84

PIRLS 2011
85
7.1 Introduction
This chapter focuses on children’s attitudes and habits to reading and their confidence in their abilities. This chapter describes how much pupils find reading enjoyable; their motivation and confidence to read; the instructional time spent on language and learning; collaboration with other teachers to improve teaching methods; how much students are engaged during lessons to enhance reading and learning and strategies employed by teachers to develop pupils’ reading comprehension skills. Other issues that will be reviewed include the instruction limitations caused by pupils’ lack of prerequisite knowledge/skills, lack of nutrition and sleep; disruptive and uninterested pupils; resources used by teachers for teaching reading; computer activities during reading lessons and availability of classroom libraries.
7.2 Reading Enjoyment
Pupils who find reading enjoyable are likely to read more than others who do not derive any enjoyment from reading. In terms of developing skills, children with a positive attitude are more likely to practise the reading skills they are learning at school. To assess pupils’ enjoyment for reading a scale score was generated according to their degree of agreement with six statements related to reading and how often they did two reading activities outside of school, which are displayed in Tables 7.1 and 7.2. Pupils who like reading had a score on the scale of at least 11.0, which corresponds to their ‘agreeing a lot’ with three of the six statements and ‘agreeing a little’ with the other three, as well as doing both reading activities every day outside of school, on average. Pupils who do not like reading had a score no higher than 8.2, which corresponds to their ‘disagreeing a little’ with three of the six statements and ‘agreeing a little’ with the other three, as well as doing both reading activities only once or twice a month, on average. All other pupils somewhat like reading.
The proportion of Maltese pupils who like reading (34%) is significantly higher than the international average proportion (28%); however, the proportion of Maltese pupils who dislike reading (16%) is marginally higher than the international average (15%). The scale score that measures pupils’ enjoyment of reading ranges from 10.9 (Portugal) to 9.3 (Croatia). Malta’s scale (10.2) is significantly higher than the international average indicating that enjoyment of reading in Malta is above average.
7

PIRLS 2011
86
Figure 7.1: Enjoyment of reading
Table 7.1: Responses of Maltese pupils regarding reading behaviour What do you think about reading? Indicate how much
you agree with each of these statements Agree a lot
Agree a little
Disagree a little
Disagree A lot
I read only if I have to 26.4% 16.3% 16.4% 40.8% I like talking about what I read with other people 46.7% 27.3% 11.6% 14.4% I am happy if someone gives me a book as a present 58.5% 20.6% 9.6% 11.3% I think reading is boring 13.1% 11.6% 15.1% 60.2% I would like to have more time for reading 50.1% 23.4% 12.7% 13.8% I enjoy reading 61.7% 19.3% 8.5% 10.5%
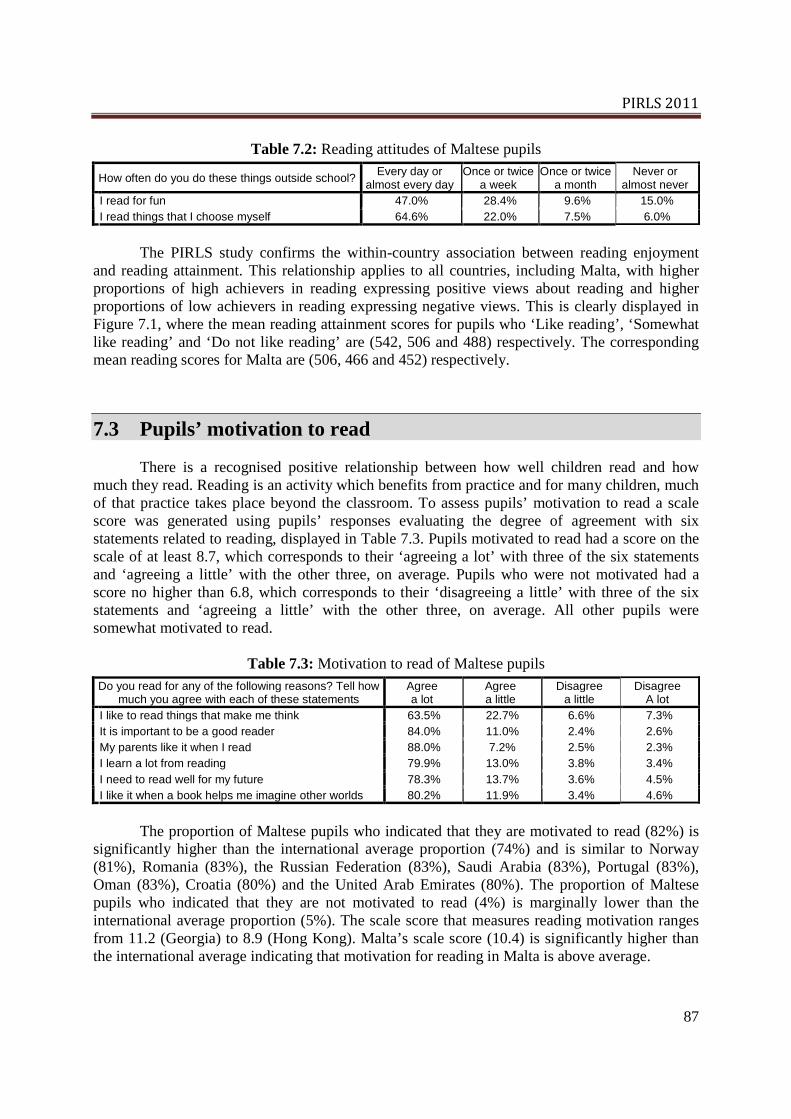
PIRLS 2011
87
Table 7.2: Reading attitudes of Maltese pupils
How often do you do these things outside school? Every day or almost every day
Once or twice a week
Once or twice a month
Never or almost never
I read for fun 47.0% 28.4% 9.6% 15.0% I read things that I choose myself 64.6% 22.0% 7.5% 6.0%
The PIRLS study confirms the within-country association between reading enjoyment
and reading attainment. This relationship applies to all countries, including Malta, with higher proportions of high achievers in reading expressing positive views about reading and higher proportions of low achievers in reading expressing negative views. This is clearly displayed in Figure 7.1, where the mean reading attainment scores for pupils who ‘Like reading’, ‘Somewhat like reading’ and ‘Do not like reading’ are (542, 506 and 488) respectively. The corresponding mean reading scores for Malta are (506, 466 and 452) respectively.
7.3 Pupils’ motivation to read
There is a recognised positive relationship between how well children read and how much they read. Reading is an activity which benefits from practice and for many children, much of that practice takes place beyond the classroom. To assess pupils’ motivation to read a scale score was generated using pupils’ responses evaluating the degree of agreement with six statements related to reading, displayed in Table 7.3. Pupils motivated to read had a score on the scale of at least 8.7, which corresponds to their ‘agreeing a lot’ with three of the six statements and ‘agreeing a little’ with the other three, on average. Pupils who were not motivated had a score no higher than 6.8, which corresponds to their ‘disagreeing a little’ with three of the six statements and ‘agreeing a little’ with the other three, on average. All other pupils were somewhat motivated to read.
Table 7.3: Motivation to read of Maltese pupils Do you read for any of the following reasons? Tell how
much you agree with each of these statements Agree a lot
Agree a little
Disagree a little
Disagree A lot
I like to read things that make me think 63.5% 22.7% 6.6% 7.3% It is important to be a good reader 84.0% 11.0% 2.4% 2.6% My parents like it when I read 88.0% 7.2% 2.5% 2.3% I learn a lot from reading 79.9% 13.0% 3.8% 3.4% I need to read well for my future 78.3% 13.7% 3.6% 4.5% I like it when a book helps me imagine other worlds 80.2% 11.9% 3.4% 4.6%
The proportion of Maltese pupils who indicated that they are motivated to read (82%) is
significantly higher than the international average proportion (74%) and is similar to Norway (81%), Romania (83%), the Russian Federation (83%), Saudi Arabia (83%), Portugal (83%), Oman (83%), Croatia (80%) and the United Arab Emirates (80%). The proportion of Maltese pupils who indicated that they are not motivated to read (4%) is marginally lower than the international average proportion (5%). The scale score that measures reading motivation ranges from 11.2 (Georgia) to 8.9 (Hong Kong). Malta’s scale score (10.4) is significantly higher than the international average indicating that motivation for reading in Malta is above average.

PIRLS 2011
88
Figure 7.2 shows that some high achieving countries including Hong Kong, Finland, Singapore and England, on average reported lower levels of motivation compared to some low achieving countries Georgia, Indonesia, Colombia, Trinidad and Tobago, and the Islamic Republic of Iran. However, there exists a strong positive relationship between motivation to read and reading attainment. The mean reading attainment score of pupils who are ‘Motivated’, ‘Somewhat motivated’ and ‘Not motivated’ are (518, 503 and 474) respectively. This positive relationship applies to most of the countries participating in PIRLS 2011, including Malta whose corresponding mean reading scores are (486, 453 and 407) respectively.
Figure 7.2: Motivation to read

PIRLS 2011
89
7.4 Pupils’ confidence in reading
With a positive attitude to reading, a child who approaches reading confidently is more likely to seek out opportunities to read more frequently and more widely. To assess pupils’ confidence in reading a scale score was generated using pupils’ responses evaluating the degree of agreement with seven statements on pupils’ confidence in reading, displayed in Table 7.4.
Figure 7.3: Confidence in reading
Pupils who are confident in reading had a score on the scale of at least 10.6, which corresponds to their ‘agreeing a lot’ with four of the seven statements and ‘agreeing a little’ with the other three, on average. Pupils who are not confident in reading had a score no higher than

PIRLS 2011
90
7.9, which corresponds to their ‘disagreeing a little’ with four of the seven statements and ‘agreeing a little’ with the other three, on average. All other pupils were somewhat confident in reading.
Table 7.4: Confidence of Maltese pupils in reading
How well do you read? Indicate how much you agree with each of these statements
Agree a lot
Agree a little
Disagree a little
Disagree A lot
I usually do well in reading 68.6% 24.0% 3.9% 3.6% Reading is easy for me 61.6% 26.7% 7.0% 4.7% Reading is harder for me than most of my classmates 13.4% 14.6% 17.4% 54.5% I don’t care how hard it is to read an interesting book 61.5% 18.6% 9.1% 10.9% I have trouble reading stories with difficult words 23.6% 28.5% 16.8% 31.1% My teacher tells me I am a good reader 50.8% 30.7% 10.4% 8.1% Reading is harder for me than any other subject 13.3% 13.1% 14.6% 59.1%
Figure 7.3 reveals that, on average, children in Malta expressed confidence about their
reading attainment in English. 39% of pupils in Malta indicated that they had confidence, which is higher than the 37% of pupils in England and the international average of 36%. 48% of pupils in Malta declared that they were somewhat confident which is significantly lower than the 53% of pupils in England and the international average (53%). 13% of Maltese pupils indicated that they are not confident in reading which exceeds the proportion in England (10%) and the international average (11%). The scale score that measures confidence in reading ranges from 10.6 (Israel and Austria) to 9.1 (Morocco). Malta has a middling scale score (10.1), which is similar to Denmark (10.1), Australia (10.1), Indonesia (10.1), Northern Ireland (10.0), Trinidad and Tobago (10.0), England 10.0) and the Slovak Republic (10.0).
Greater confidence is associated with higher achievement. This is reflected in the reading achievement scores obtained by the pupils both locally and internationally. The mean reading attainment score of pupils who are ‘Confident’, ‘Somewhat confident’ and ‘Not confident’ are (502, 453 and 456) respectively. This positive relationship applies to Malta whose corresponding mean reading scores are (525, 463 and 392) respectively.
7.5 Instructional time spent on language and reading
Total instructional hours per year was computed by multiplying the number of school days per year with the number of instructional hours per day. The language instructional hours per year were computed by multiplying the ratio of language instructional hours per week and schools days per week with school days per year, displayed in Tables 7.5 and 7.6.
Table 7.5: Distribution of total instructional time (in hours) per day in Malta What is the total instructional time, excluding breaks,
in a typical day? Frequency Percentage 3 hours 1 1.1% 4 hours 4 4.4% 5 hours 85 93.4% 6 hours 1 1.1%

PIRLS 2011
91
Table 7.6: Distribution of total language instructional time (in hours) per week in Malta In a typical week, how much time do you spend on
language instruction and/or activities with the pupils? Frequency Percentage 0-2 hours 7 3.6% 3 hours 23 11.9% 4 hours 57 29.4% 5 hours 41 21.1% 6 hours 30 15.5% 7-10 hours 22 11.3%
More than 10 hours 14 7.2%
Figure 7.4: Instructional time spent on language and reading

PIRLS 2011
92
The total instructional time throughout a whole year in Malta (891 hours), reported by Heads of School, is 14 hours less than the international average (905 hours). Indonesia has the highest total instructional time yearly (1297 hours), followed by Italy (1085), the Netherlands (1078) Israel (1075) and Qatar (1068). Lithuania (649), the Russian Federation, (660) Bulgaria (673) and Slovenia (684) have the lowest total instructional time annually.
The language instructional time throughout a whole year in Malta (181 hours), reported
by teachers is 51 hours less than the international average (232 hours). Australia has the highest language instructional time yearly (356 hours), followed by New Zealand (349). Georgia (162), Croatia (172), Oman (176), Ireland (176), Malta (181), Bulgaria (186) and Finland (188) have the lowest language instructional time annually.
The time spent reading as part of language instruction throughout a whole year in Malta
(37 hours) is the lowest of all the countries taking part and is 34 hours less than the international average (71 hours). The United States and New Zealand allocate the highest reading time annually as part of language instruction (131 hours), followed by Australia (119), Hungary (104) and Canada (101 hours).
The time spent reading across the curriculum, including time spent on reading instruction
throughout a whole year in Malta (104 hours) is 42 hours less than the international average (146 hours). The United States allocates the highest reading time across the curriculum yearly (246 hours), followed by Slovak Republic (239), Portugal (235), New Zealand (220) and Hungary (206). Chinese Taipei (65), Austria (97), Morocco (99) and Finland (99) have the lowest reading time across the curriculum annually.
7.6 Collaboration between teachers to improve teaching methods
To assess collaboration between teachers for teaching development, a scale score was generated by using teachers’ responses to how often they interact with other teachers in each of five teaching areas, displayed in Table 7.7. Pupils taught by very collaborative teachers had a score on the scale of at least 9.4, which corresponds to their teachers having interactions with other teachers at least ‘one to three times per week’ in each of three of the five areas and ‘two or three times per month’ in each of the other two, on average. Pupils taught by somewhat collaborative teachers had a score no higher than 6.6, which corresponds to their teachers ‘never or almost never’ interacting with other teachers in each of three of the five areas and ‘two or three times per month’ in each of the other two, on average. All other pupils had collaborative teachers.
Table 7.7: Collaboration between Maltese teachers to enhance their teaching methods How often do you have the following types of
interactions with other teachers? Never or
almost never 2-3 times per month
1-3 times Per week
Daily or almost daily
Discuss how to teach a particular topic 28.0% 40.3% 26.1% 5.7% Collaborate in planning and preparing material 31.4% 38.1% 22.4% 8.1% Share what you have learned about teaching experience
27.0% 39.8% 23.2% 10.0%
Visit another classroom to learn about teaching 91.5% 6.1% 1.4% 0.9% Work together to try out new ideas 40.0% 38.6% 15.2% 6.2%

PIRLS 2011
93
Figure 7.5: Collaboration between teachers to enhance teaching methods
84% of Maltese teachers reported that they are very collaborative and interact frequently with other teachers. Malta, the Czech Republic and Ireland reported the highest proportions (84%) which were higher than the international average proportion by 19%. Slovenia had the lowest proportion (26%) of teachers reporting frequent collaboration with other teachers. The scale score that measures collaboration ranges from 11.5 (Malta) to 8.2 (Slovenia) indicating that Maltese teachers interact well with other teachers by discussing teaching methods and sharing teaching experience and collaborate in planning and preparing teaching material. There exist no relationship between the reading attainment of pupils and the amount of collaboration between teachers. The mean reading scores of pupils whose teachers are ‘Very collaborative’, ‘Collaborative’ and ‘Somewhat collaborative’ are (512, 513 and 510) respectively.

PIRLS 2011
94
7.7 Instruction to engage pupils in learning
Figure 7.6: Engaging pupils in learning during lessons
To assess how much teachers engage pupils in learning, a scale score was generated by using teachers’ responses to how often they used each of six instructional practices displayed in Table 7.8. Pupils with teachers who used engagement practices in most lessons had a score on the scale of at least 9.1, which corresponds to their teachers using three of the six practices ‘every or almost every lesson’ and using the other three in ‘about half the lessons’, on average. Pupils with teachers who used engagement practices in some lessons had a score no higher than 5.9, which corresponds to their teachers using three of the six practices in ‘some lessons’ and using the other three in ‘about half the lessons’, on average. All other pupils had teachers who used engagement practices in about half the lessons.

PIRLS 2011
95
Table 7.8: Engaging Maltese pupils in learning during lessons
How often do you do the following in teaching this class?
Every or almost every
lesson
Almost half the lesson
Some
lessons Never Summarise what pupils should learn from lesson 72.2% 15.8% 11.5% 0.5% Relate the lesson to pupils’ daily lives 56.0% 30.6% 13.4% 0.0% Use questioning to elicit reasons and explanations 89.0% 9.6% 1.4% 0.0% Encourage all pupils to improve their performance 95.2% 4.3% 0.5% 0.0% Praise pupils for good effort 94.7% 4.3% 1.0% 0.0% Bring interesting materials to class 37.3% 38.8% 23.9% 0.0%
81% of Maltese teachers reported that they engage pupils in learning in most lessons,
which is 10% higher than the international average proportion (71%). Romania ranks first (94%) followed by Lithuania (93%), England (91%), Bulgaria (90%) and Hungary (90%). Denmark (23%), Finland (33%), Norway (38%) and Chinese Taipei (39%) have the lowest proportions of teachers who engage pupils in learning in almost all the lessons. The scale score that measures how much teachers engage pupils in learning during lessons ranges from 11.4 (Romania) to 7.7 (Denmark). Malta’s scale score (10.3) is significantly above the international average. Some high performing countries, including Chinese Taipei, Hong Kong, Singapore and Finland have lower percentages of teachers who engage pupils frequently during lessons. Moreover, the relationship between pupils reading attainment and the degree to which teachers engage pupils in learning is a weak one and not significant.
7.8 Pupils’ engagement in reading lessons
To assess how much teachers engage pupils in reading lessons a scale score was generated by using pupil responses to how much they agree with seven statements related to reading at school, which are displayed in Table 7.9. Pupils engaged in reading lessons have a score on the scale of at least 10.5, which corresponds to their ‘agreeing a lot’ with four of the seven statements and ‘agreeing a little’ with the other three, on average. Pupils who were not engaged had a score no higher than 7.4, which corresponds to their ‘disagreeing a little’ with four of the seven statements and ‘agreeing a little’ with the other three, on average. All other pupils were Somewhat Engaged in reading lessons.
Table 7.9: Engaging Maltese pupils in reading lessons
Think about reading at school. How much do you agree with the statements about your reading lessons?
Agree a lot
Agree a little
Disagree a little
Disagree A lot
I like what I read about in school 59.0% 29.0% 6.3% 5.6% My teacher gives me interesting things to read 64.2% 22.4% 7.6% 5.7% I know what my teacher expects me to do 68.8% 20.8% 5.6% 4.8% I think of things not related to the lesson 15.9% 20.9% 18.6% 44.5% My teacher is easy to understand 65.9% 22.2% 6.4% 5.5% I am interested in what my teacher says 70.4% 20.6% 5.5% 3.4% My teacher gives me interesting things to do 70.0% 18.1% 7.0% 4.9%
55% of Maltese pupils reported that they are engaged in reading lessons, which is 13%
higher than the international average proportion (42%). Indonesia tops the list (71%), followed

PIRLS 2011
96
by Georgia (68%) and Azerbaijan (67%). Finland (15%), Denmark (18%), the Netherlands (20%) and Hong Kong (24%) have the lowest proportions of pupils who reported that they are frequently engaged in reading lessons. The scale score that measures how much pupils are involved in reading lessons ranges from 11.3 (Indonesia) to 8.7 (Finland). Malta’s scale score (10.6) is significantly above the international average. Some high performing countries, including Chinese Taipei, Hong Kong, Singapore, and Finland have lower percentages of pupils who reported that they are engaged in reading lessons. There exists a positive relationship between pupils’ reading attainment and the degree to which teachers engage pupils in reading lessons. The mean attainment reading score of pupils who were ‘Engaged’, ‘Somewhat engaged and ‘Not engaged’ are (519, 510 and 494) respectively.
Figure 7.7: Engaging pupils in reading lessons

PIRLS 2011
97
7.9 Teachers’ impact to develop pupils’ comprehension skills
Figure 7.8 shows that for most of the tasks the contribution of Maltese teachers to pupils in developing their comprehension skills and strategies is above international averages. The three comprehension skills that need to be given more weight by Maltese teacher are - making generalisations and draw inferences based on what pupils read; describe the style or structure of the text they have read; determine the author’s perspective or intention.
Figure 7.8: Teachers’ contribution to develop pupils’ comprehension skills and strategies

PIRLS 2011
98
7.10 Effect on learning due to pupils’ lack of prerequisite knowledge
Figure 7.9 shows that the proportion of Maltese teachers reporting excessive instruction limitation caused by pupils who lack prerequisite knowledge/skills (17%) exceeds the international average (11.%). Conversely, the proportion of Maltese teachers reporting minimal instruction limitation (19%) is considerably lower than the international average (28%). There is a strong negative relationship between reading attainment and the lack of prerequisite knowledge/skills.
Figure 7.9: Effect on learning due to pupils’ lack of prerequisite knowledge and skills

PIRLS 2011
99
7.11 Effect on learning due to pupils’ lack of sleep and nutrition
Figure 7.10 shows that the incidence of students suffering from a lack of nutrition and a lack of sleep is quite uncommon in Malta. The proportion of Maltese pupils who have adequate basic nutrition (88%) and adequate sleep (73%), as reported by the teachers, exceeds the corresponding international average proportions (73% and 51%) by a large margin. There is evidence that lack of basic nutrition and lack of sleep is associated with a poorer reading attainment.
Figure 7.10: Effect on learning due to student’s lack of sleep and nutrition
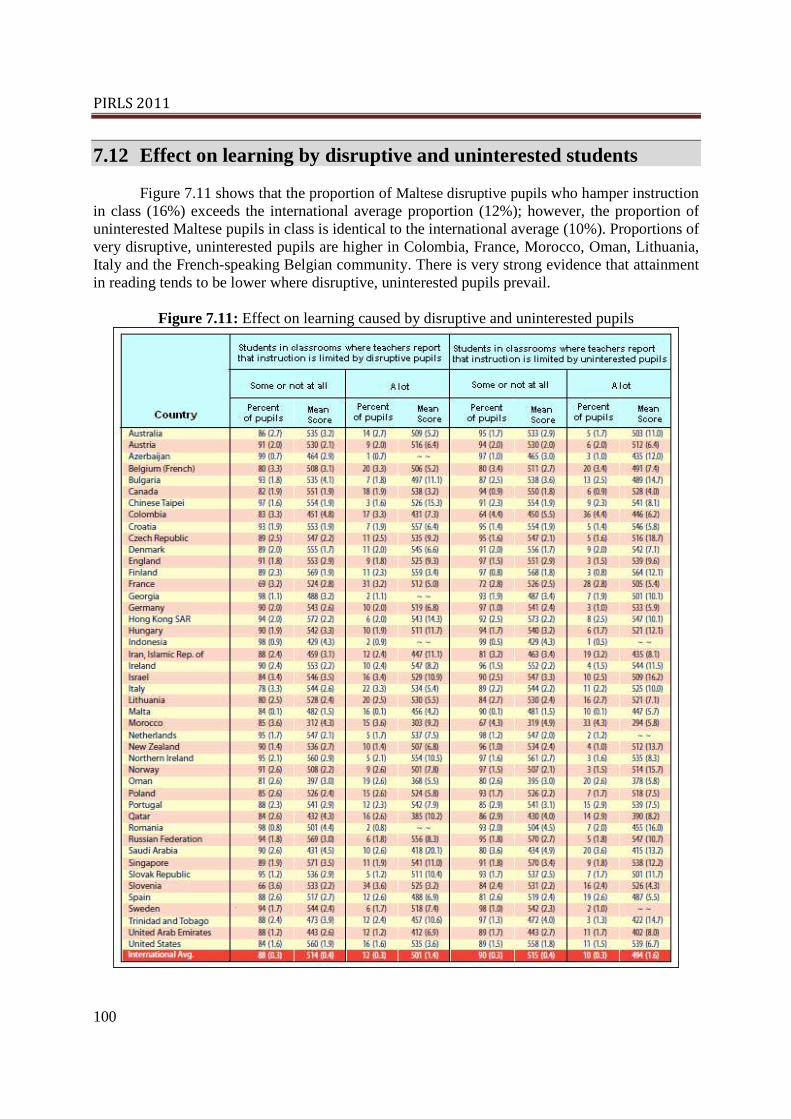
PIRLS 2011
100
7.12 Effect on learning by disruptive and uninterested students
Figure 7.11 shows that the proportion of Maltese disruptive pupils who hamper instruction in class (16%) exceeds the international average proportion (12%); however, the proportion of uninterested Maltese pupils in class is identical to the international average (10%). Proportions of very disruptive, uninterested pupils are higher in Colombia, France, Morocco, Oman, Lithuania, Italy and the French-speaking Belgian community. There is very strong evidence that attainment in reading tends to be lower where disruptive, uninterested pupils prevail.
Figure 7.11: Effect on learning caused by disruptive and uninterested pupils

PIRLS 2011
101
7.13 Computer activities during reading lessons
Figure 7.12 shows that 73% of Maltese teachers reported that computers are available for reading lessons, which is significantly higher than the international average (45%). Moreover, Maltese teachers make frequent use of these computers during reading lessons. The availability or otherwise of computers during reading lessons does not seem to result in any significant rise in the mean reading attainment scores of pupils. The international mean score of 513 is the same for those pupils who have computers available for reading lessons as well as those who do not.
Figure 7.12: Computer use during reading lessons

PIRLS 2011
102
7.14 Classroom libraries
Figure 7.13 shows that 90% of pupils in Malta have a library or reading corner available in the classroom, which is significantly higher than the international average (72%) but not as high as the proportions of United States (99%), New Zealand (99%) and Ireland (98%).
Figure 7.13: Classroom libraries

PIRLS 2011
103
Moreover, teachers were asked to specify the number of books and magazine titles that were available in the reading corner/library; the time pupils are allowed to use the library; who can borrow books and the frequency of visits to other libraries within and outside the school. The proportion of Maltese teachers reporting that their classroom library has at least 50 books, and has at least 3 magazine titles, are (49% and 35%) respectively. These are well above the international averages (32% and 31%). Moreover, the proportion of Maltese teachers who give time to students to use classroom library at least once a week, allow pupils to borrow books from the classroom library and take pupils to other libraries within and outside the school at least once a month are (82%, 76% and 75%) respectively. These exceed by large margins the corresponding international average proportions (60%, 56% and 68%).
The importance of school libraries was highlighted in Chapter 4 where it resulted that the
bigger the school library the higher the achievement of pupils. Figure 7.13 shows that there is a weak positive relationship between reading attainment and the availability of a classroom library. The mean reading score of students who have a class library facility (514) exceeds the mean reading score of pupils who do not have such facilities (507). However in some countries, including Malta and England, the mean reading scores are in the reverse order indicating that the availability of a classroom library is not a good predictor of reading attainment.
7.15 Resources teachers use for teaching reading
There are a range of methods for teaching reading which can be supported through the use of different teaching materials, such as textbooks, reading series and workbooks and teachers were asked to indicate how often they used each reading source. Figure 7.14 shows that Maltese teachers make more use of children’s books as a supplement (72%) rather than as a basis for instruction (24%). These proportions are similar to international averages (69%, 27%) respectively.
Teachers in Malta, on average, make heavy use of the textbooks as a basis for instruction rather than a supplement. 86% of Maltese teachers use textbooks as a basis for instruction, which is significantly higher than the international average (72%). Saudi Arabia makes the most use of textbooks for instruction (99%), followed by Bulgaria (98%), Georgia (98%), Hungary (97%), Lithuania (97%) and Hong Kong (96%). On the other hand, Northern Ireland makes more use of textbooks as a supplement (66%) followed by England (62%), French-speaking Belgian community (51%), Canada (50%) and Sweden (50%).
Maltese teachers make more use of reading series as a basis for instruction (59%) rather
than as a supplement (34%). This is in contrast to international trends where foreign teachers make more use of reading series as a supplement (59%) rather than as a basis for instruction (27%). A slightly higher proportion of Maltese teachers use workbooks and worksheets as a supplement (50%) rather than as a basis for instruction (45%), which is similar to international trends (56% and 40%) respectively. Computer software for reading instruction has widespread use as a supplement. 16% of Maltese teachers use computer software as a basis for instruction; whereas 55% use it as a supplement. These proportions exceed international averages (8% and 48%) by large margins indicating that Maltese teachers, on average, make more use of computer software for learning instruction than foreign teachers.

PIRLS 2011
104
Figure 7.14: Resources teachers use for teaching reading
Appendix
105

Appendix
106
A. Maltese Students’ Responses
Gender of student Frequency Percentage Female 1755 48.8% Male 1843 51.2%
Student’s year of birth Frequency Percentage
Before 2001 204 5.7% 2001 3343 92.9% After 2001 51 1.4%
How often do you speak English at home? Frequency Percentage
Always 620 17.3% Sometimes 2081 58.0% Never 890 24.7%
How many books are there in your home? Frequency Percentage
0-10 books 297 8.3% 11-25 books 995 27.8% 26-100 books 1411 39.5% 101-200 books 526 14.7% More than 200 books 345 9.7%
Do you have any of these things at home? Yes No
Computer 94.6% 5.4% Study desk / table for your use 82.7% 17.3% Books of your very own 91.4% 8.6% Your own room 70.8% 29.2% Internet connection 94.1% 5.9% Video game console 83.0% 17.0% Mobile phone 74.9% 25.1% Mp3 player / iPod 64.7% 35.3% Digital camera 78.3% 21.7% Laptop / Netbook / PDA 64.3% 35.7% DVD player 93.4% 6.6%
How often do you use a computer in each of these places?
Every day or almost every day
Once or twice
a week
Once or twice
a month Never or
almost never At home 63.0% 28.7% 4.4% 3.9% At school 14.9% 50.3% 15.1% 19.7% Some other place 14.7% 23.4% 21.8% 40.1%
How often do the following things happen at home? Every day or almost every day
Once or twice
a week
Once or twice
a month Never or
almost never My parents ask me what I am learning at school 68.1% 17.1% 6.6% 8.2% I talk about my schoolwork with my parents 53.9% 25.6% 7.2% 13.3% My parents make sure that I allow time for homework 79.6% 8.7% 3.2% 8.5% My parents check if I do my homework 69.5% 12.6% 5.2% 12.8%

Appendix
107
What do you think about your school? Tell how much
you agree with these statements Agree a lot
Agree a little
Disagree a little
Disagree a lot
I like being at school 50.8% 30.1% 8.7% 10.4% I feel safe when I am at school 58.9% 26.6% 7.9% 6.6% I feel like I belong at this school 59.4% 20.1% 9.3% 11.2%
How often do you experience these at school?
At least once a week
Once or twice
a month
A few times
a year Never or
almost never I was made fun of or called names 20.4% 11.1% 23.9% 44.6% I was left out of games/activities by other students 14.7% 13.5% 19.5% 52.2% Someone spread lies about me 15.6% 12.9% 24.7% 46.9% Something was stolen from me 8.0% 8.3% 20.8% 62.9% I was hit or hurt by other student(s) 16.4% 14.6% 30.2% 38.8% I was made to do things I didn’t want to do to others 9.7% 8.5% 15.8% 66.0%
How much time do you spend reading outside school on a normal school day? Yes No
Less than 30 minutes 1192 33.1% 30 minutes to 1 hour 1725 47.9% 1-2 hours 337 9.4% More than 2 hours 348 9.7%
How often do you do these things outside of school? Every day or almost every day
Once or twice
a week
Once or twice
a month Never or
almost never I read for fun 47.0% 28.4% 9.6% 15.0% I read things that I choose myself 64.6% 22.0% 7.5% 6.0% I read to find out about things I want to learn 54.8% 24.5% 12.5% 8.2%
How often do you read these things outside of school (in print or on the internet?
Every day or almost every day
Once or twice
a week
Once or twice
a month Never or
almost never I read stories or novels 38.7% 32.7% 13.7% 14.9% I read books that explain things 42.2% 31.6% 15.5% 10.6% I read magazines 19.2% 22.5% 20.7% 37.7% I read comic books 23.8% 18.9% 20.2% 37.1% I read game instructions 32.4% 19.0% 21.4% 27.2% I read posters and leaflets 25.8% 20.7% 22.8% 30.7%
How often do you borrow books from your school or local library? Frequency Percentage
At least once a week 2230 62.7% Once or twice a month 637 17.9% A few times a year 379 10.7% Never or almost never 310 8.7%

Appendix
108
Think about reading at school. How much do you agree with the statements about your reading lessons?
Agree a lot
Agree a little
Disagree a little
Disagree A lot
I like what I read about in school 59.0% 29.0% 6.3% 5.6% My teacher gives me interesting things to read 64.2% 22.4% 7.6% 5.7% I know what my teacher expects me to do 68.8% 20.8% 5.6% 4.8% I think of things not related to the lesson 15.9% 20.9% 18.6% 44.5% My teacher is easy to understand 65.9% 22.2% 6.4% 5.5% I am interested in what my teacher says 70.4% 20.6% 5.5% 3.4% My teacher gives me interesting things to do 70.0% 18.1% 7.0% 4.9%
In school, how often do these things happen in relation to reading?
Every day or almost every day
Once or twice
a week
Once or twice
a month Never or
almost never I read silently on my own 62.2% 25.5% 5.8% 6.5% I read books that I choose myself 62.3% 22.5% 6.7% 8.5%
What do you think about reading? Tell how much you
agree with each of these statements Agree a lot
Agree a little
Disagree a little
Disagree A lot
I read only if I have to 26.4% 16.3% 16.4% 40.8% I like talking about what I read with other people 46.7% 27.3% 11.6% 14.4% I am happy if someone gives me a book as a present 58.5% 20.6% 9.6% 11.3% I think reading is boring 13.1% 11.6% 15.1% 60.2% I would like to have more time for reading 50.1% 23.4% 12.7% 13.8% I enjoy reading 61.7% 19.3% 8.5% 10.5%
How well do you read? Tell how much you agree with
each of these statements Agree a lot
Agree a little
Disagree a little
Disagree A lot
I usually do well in reading 68.6% 24.0% 3.9% 3.6% Reading is easy for me 61.6% 26.7% 7.0% 4.7% Reading is harder for me than most of my classmates 13.4% 14.6% 17.4% 54.5% I don’t care how hard it is to read an interesting book 61.5% 18.6% 9.1% 10.9% I have trouble reading stories with difficult words 23.6% 28.5% 16.8% 31.1% My teacher tells me I am a good reader 50.8% 30.7% 10.4% 8.1% Reading is harder for me than any other subject 13.3% 13.1% 14.6% 59.1%
Do you read for any of the following reasons? Tell how
much you agree with each of these statements Agree a lot
Agree a little
Disagree a little
Disagree A lot
I like to read things that make me think 63.5% 22.7% 6.6% 7.3% It is important to be a good reader 84.0% 11.0% 2.4% 2.6% My parents like it when I read 88.0% 7.2% 2.5% 2.3% I learn a lot from reading 79.9% 13.0% 3.8% 3.4% I need to read well for my future 78.3% 13.7% 3.6% 4.5% I like it when a book helps me imagine other worlds 80.2% 11.9% 3.4% 4.6%
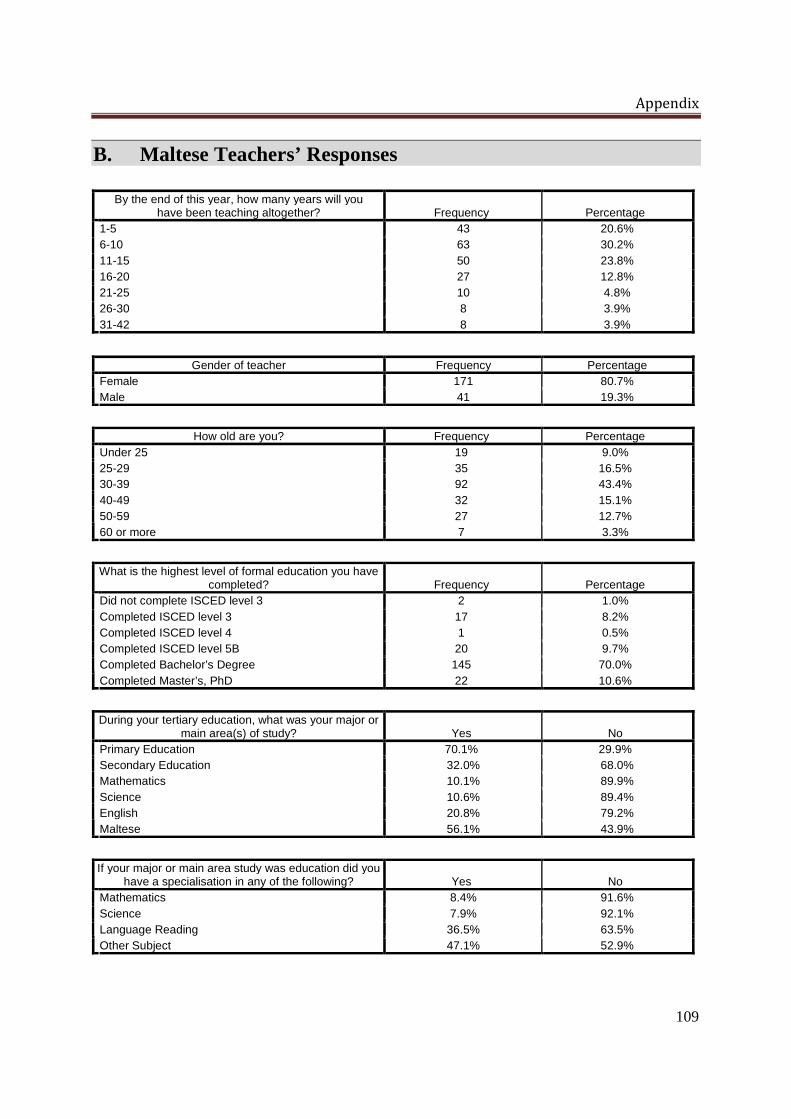
Appendix
109
B. Maltese Teachers’ Responses
By the end of this year, how many years will you have been teaching altogether? Frequency Percentage
1-5 43 20.6% 6-10 63 30.2% 11-15 50 23.8% 16-20 27 12.8% 21-25 10 4.8% 26-30 8 3.9%
31-42 8 3.9%
Gender of teacher Frequency Percentage
Female 171 80.7% Male 41 19.3%
How old are you? Frequency Percentage
Under 25 19 9.0% 25-29 35 16.5% 30-39 92 43.4% 40-49 32 15.1% 50-59 27 12.7%
60 or more 7 3.3%
What is the highest level of formal education you have
completed? Frequency Percentage Did not complete ISCED level 3 2 1.0% Completed ISCED level 3 17 8.2% Completed ISCED level 4 1 0.5% Completed ISCED level 5B 20 9.7% Completed Bachelor’s Degree 145 70.0%
Completed Master’s, PhD 22 10.6%
During your tertiary education, what was your major or
main area(s) of study? Yes No Primary Education 70.1% 29.9% Secondary Education 32.0% 68.0% Mathematics 10.1% 89.9% Science 10.6% 89.4% English 20.8% 79.2%
Maltese 56.1% 43.9% If your major or main area study was education did you
have a specialisation in any of the following? Yes No Mathematics 8.4% 91.6% Science 7.9% 92.1% Language Reading 36.5% 63.5%
Other Subject 47.1% 52.9%

Appendix
110
How would you characterise each of the following within your school?
Very High
High
Medium
Low
Very Low
Job satisfaction 25.2% 54.3% 19.0% 1.4% 0.0% Understanding of school’s curriculum goals 29.5% 58.6% 11.9% 0.0% 0.0% Degree of success in implementing curriculum 18.9% 65.6% 15.1% 0.5% 0.0% Expectations for student achievement 22.6% 62.7% 14.6% 0.0% 0.0% Parental support for student achievement 10.8% 29.7% 50.5% 8.0% 0.9% Parental involvement in school activities 6.1% 37.3% 44.3% 10.4% 1.9% Students’ regard for school property 4.3% 37.9% 51.2% 5.7% 0.9%
Students’ desire to do well in school 11.8% 47.4% 35.1% 5.2% 0.5%
Thinking about your current school, indicate the extent to which you agree or disagree with each of the
following statements? Agree a lot
Agree a little
Disagree
a little Disagree
a lot This school is located in a safe neighbourhood 73.5% 21.8% 4.7% 0.0% I feel safe at school 78.2% 20.4% 1.4% 0.0% The school’s security policies are sufficient 49.5% 38.6% 11.0% 1.0% The students behave in an orderly manner 35.1% 45.0% 17.1% 2.8%
The students are respectful of the teachers 35.5% 41.2% 16.1% 3.8%
In your current school, how severe is each problem? Not a problem
Minor problem
Moderate problem
Serious Problem
The school building needs significant repair 35.5% 35.5% 22.7% 6.2% Classrooms are crowded 37.4% 28.4% 22.3% 11.8% Teachers have too many teaching hours 42.6% 33.5% 17.7% 6.2% Teachers do not have adequate workspace 27.8% 31.1% 27.3% 13.9%
Teachers do not have adequate instructional material 32.2% 41.8% 22.6% 3.4%
Do you use computers in your teaching in any of the following ways? Yes No
For preparation 97.6% 2.4% For administration 78.3% 21.7%
In your classroom instruction 88.2% 11.8%
If you use computers for classroom instruction, how much do you agree with the following statements?
Agree a lot
Agree a little
Disagree a little
Disagree a lot
I feel comfortable using computers in my teaching 84.5% 13.4% 1.1% 1.1% When I have technical problems, I have ready access to computer support staff in my school
26.7% 34.2% 21.4% 17.6%
I receive adequate support for integrating computers in my teaching activities
34.9% 38.7% 18.3% 8.1%
How often do you have the following types of interactions with other teachers?
Never or almost never
2-3 times per month
1-3 times Per week
Daily or almost daily
Discuss how to teach a particular topic 28.0% 40.3% 26.1% 5.7% Collaborate in planning and preparing material 31.4% 38.1% 22.4% 8.1% Share what I have learned about teaching experience 27.0% 39.8% 23.2% 10.0% Visit another classroom to learn about teaching 91.5% 6.1% 1.4% 0.9%
Work together to try out new ideas 40.0% 38.6% 15.2% 6.2%
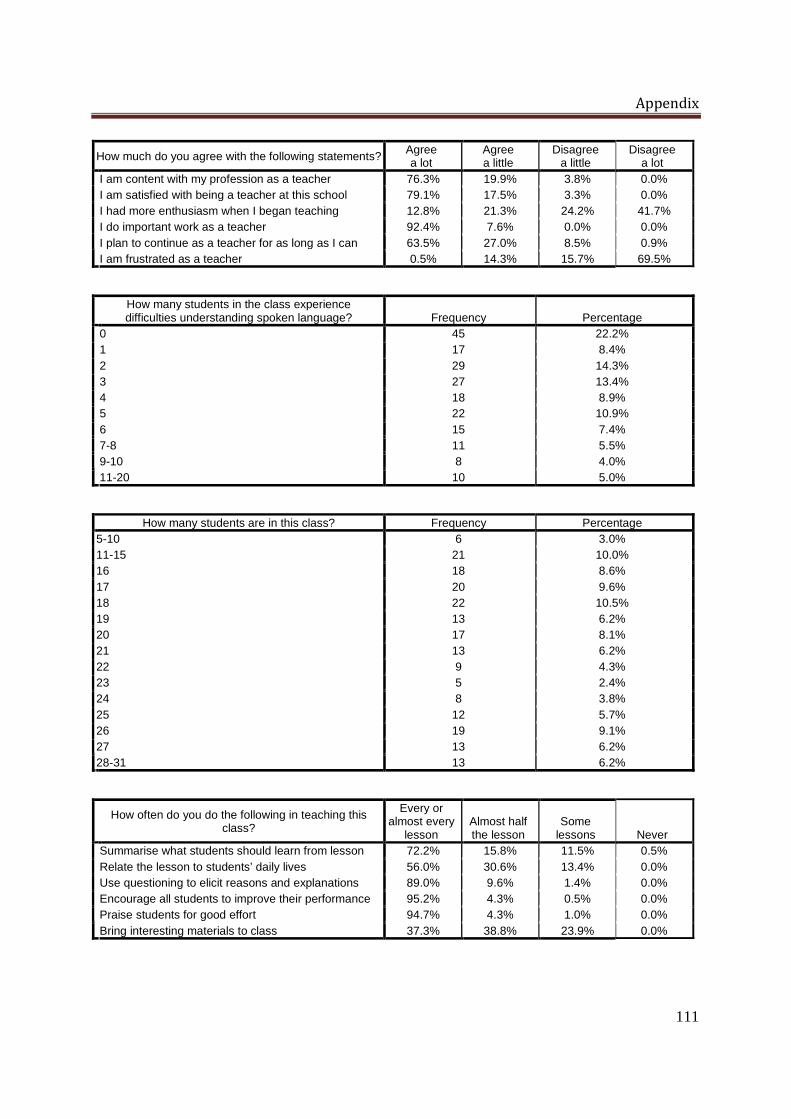
Appendix
111
How much do you agree with the following statements? Agree a lot
Agree a little
Disagree a little
Disagree a lot
I am content with my profession as a teacher 76.3% 19.9% 3.8% 0.0% I am satisfied with being a teacher at this school 79.1% 17.5% 3.3% 0.0% I had more enthusiasm when I began teaching 12.8% 21.3% 24.2% 41.7% I do important work as a teacher 92.4% 7.6% 0.0% 0.0% I plan to continue as a teacher for as long as I can 63.5% 27.0% 8.5% 0.9%
I am frustrated as a teacher 0.5% 14.3% 15.7% 69.5%
How many students in the class experience difficulties understanding spoken language? Frequency Percentage
0 45 22.2% 1 17 8.4% 2 29 14.3% 3 27 13.4% 4 18 8.9% 5 22 10.9% 6 15 7.4% 7-8 11 5.5% 9-10 8 4.0%
11-20 10 5.0%
How many students are in this class? Frequency Percentage 5-10 6 3.0% 11-15 21 10.0% 16 18 8.6% 17 20 9.6% 18 22 10.5% 19 13 6.2% 20 17 8.1% 21 13 6.2% 22 9 4.3% 23 5 2.4% 24 8 3.8% 25 12 5.7% 26 19 9.1% 27 13 6.2%
28-31 13 6.2%
How often do you do the following in teaching this class?
Every or almost every
lesson
Almost half the lesson
Some
lessons Never Summarise what students should learn from lesson 72.2% 15.8% 11.5% 0.5% Relate the lesson to students’ daily lives 56.0% 30.6% 13.4% 0.0% Use questioning to elicit reasons and explanations 89.0% 9.6% 1.4% 0.0% Encourage all students to improve their performance 95.2% 4.3% 0.5% 0.0% Praise students for good effort 94.7% 4.3% 1.0% 0.0%
Bring interesting materials to class 37.3% 38.8% 23.9% 0.0%

Appendix
112
Which of the following subjects do you teach to this class? Yes No
I teach the class English / Maltese reading 93.2% 6.8% I teach the class mathematics 86.4% 13.6%
I teach the class science 73.8% 26.2%
In your view, to what extent do the following limit how you teach this class?
Not applicable
Not at all
Some A lot
Students lacking prerequisite knowledge or skills 6.7% 15.2% 61.4% 16.7% Students suffering from lack of basic nutrition 66.0% 22.5% 9.6% 1.9% Students suffering from not enough sleep 42.8% 30.3% 24.5% 2.4% Students with special needs 26.8% 28.7% 42.6% 1.9% Disruptive students 9.5% 20.0% 54.3% 16.2%
Uninterested students 7.6% 27.1% 54.8% 10.5%
In a week, how much time do you spend on English language instruction and/or activities with the students? Frequency Percentage 0-2 7 3.6% 3 23 11.9% 4 57 29.4% 5 41 21.1% 6 30 15.5% 7-8 14 7.2% 9-10 8 4.1% 11-15 6 3.0%
17-21 7 4.0%
What proportion of the time spent on language instruction or activities is spent on the following skills? 0-20%
21-40%
41-60%
61-80%
Reading 71.5% 26.4% 0.0% 0.0% Grammar and spelling 25.4% 64.8% 0.5% 0.5% Writing composition 55.4% 43.6% 0.5% 0.5% Speaking and listening 60.1% 37.3% 0.5% 0.5%
Other 97.4% 1.6% 1.0% 0.0%
In a typical week, how much time do you spend on language instruction and/or activities with the students? Frequency Percentage 0 11 6.0% 1 68 37.2% 2 39 21.3% 3 17 9.3% 4 13 7.1% 5 9 4.9% 6 6 3.3% 7 5 2.7% 8-10 5 2.7%
11-15 10 5.4%

Appendix
113
For the typical student in this class, how often do you do these things?
At least once a week
Once or twice a month
4-6 times
a year
1-3 times
a year Never Meet or talk individually with the student’s parents to discuss his/her learning progress
1.9% 6.3% 11.5% 79.8% 0.5%
Send home a progress report on the student’s learning 2.4% 6.7% 16.7% 64.1% 10.0%
When you have reading instructions and/or do reading activities, how often do you organise students in the
following way?
Always or almost always
Often
Sometimes Never I teach reading as a whole-class activity 29.7% 43.6% 25.6% 1.0% I create same-ability groups 4.1% 16.4% 55.9% 23.6% I create mixed-ability groups 9.2% 29.7% 52.8% 8.2% I use individualized instruction for reading 4.1% 29.9% 53.1% 12.9% Students work individually on an assigned plan / goal 2.6% 10.8% 50.0% 36.6%
Students work independently on a goal they choose 6.2% 26.8% 54.1% 12.9%
How many students in class need remedial / complementary instruction in reading Frequency Percentage
0 15 7.7% 1 17 8.7% 2 28 14.4% 3 34 17.4% 4 30 15.4% 5 32 16.4% 6 17 8.7% 7 11 5.6%
8-23 11 5.6%
How many students in class receive remedial / complementary instruction in reading Frequency Percentage
0 68 35.2% 1 16 8.3% 2 30 15.5% 3 25 13.0% 4 24 12.4% 5 16 8.3%
6-8 14 7.2%
When you have reading instructions and / or do reading activities with the students, how do you use the
following resources? Basis for
instruction
Supplement Not used Textbooks 84.6% 13.3% 2.1% Reading series 59.6% 33.7% 6.7% Workbooks or worksheets 46.9% 48.5% 4.6% A variety of children’s books 25.8% 70.6% 3.6% Material from different curricular areas 19.1% 73.2% 7.7% Children’s newspapers and / or magazines 8.8% 57.7% 33.5% Computer software for reading instruction 16.4% 58.5% 25.1%
Reference material 13.8% 83.6% 2.6%

Appendix
114
Is there any provision for advanced readers to receive additional or more challenging reading instructions in
your school? Frequency Percentage Yes 83 42.1% No 114 57.9%
When you have reading instructions and/or do reading activities, how often do you have students read literary
reading materials?
Every day or almost every
day
Once or twice
a week
Once or twice
a month Never or
almost never Short stories 21.0% 63.6% 14.9% 0.5% Longer fiction books with chapters 7.2% 38.7% 33.5% 20.6% Plays 0.5% 6.7% 48.5% 44.3%
Others 11.3% 17.9% 43.5% 27.4%
When you have reading instructions and/or do reading activities, how often do you have students read
informational reading materials?
Every day or almost every
day
Once or twice
a week
Once or twice
a month Never or
almost never Nonfiction subject area books or textbooks 20.7% 40.4% 33.7% 5.2% Longer nonfiction books with chapters 5.2% 18.1% 47.7% 29.0%
Nonfiction articles that describes about people and things, people, events or how things work
5.2% 32.1% 54.4% 8.3%
When you have reading instructions and/or do reading activities with students, how often do you do the
following?
Every day or almost every
day
Once or twice
a week
Once or twice
a month Never or
almost never Read aloud to the class 70.9% 26.0% 2.0% 1.0% Ask student to read aloud 74.5% 24.0% 1.5% 0.0% Ask students to read silently on their own 44.4% 43.9% 9.7% 2.0% Give students time to read books of their own choice 37.8% 44.9% 16.8% 0.5% Teach students strategies for decoding sounds/words 28.4% 38.1% 25.8% 7.7% Teach students new vocabulary systematically 34.9% 53.3% 9.2% 2.6%
Teach or model skimming or scanning strategies 12.5% 34.4% 35.4% 17.7%
How often do you ask the students to do the following things to help develop reading comprehension skills
or strategies?
Every day or almost every
day
Once or twice
a week
Once or twice
a month Never or
almost never Locate information within the text 38.5% 60.5% 1.0% 0.0% Identify the main ideas of what they have read 41.5% 57.4% 1.0% 0.0% Explain or support their understanding of what they have read
50.3% 49.2% 0.5% 0.0%
Compare what they have read with experiences they have had
29.9% 51.5% 16.0% 2.6%
Compare what they have read with other things they have read
24.6% 46.7% 24.1% 4.6%
Make predictions about what happens next in the the text they are reading
26.8% 51.0% 19.1% 3.1%
Make generalisations and draw inferences based on what they have read
14.9% 54.9% 21.0% 9.2%
Describe the style or structure of the text they have read
12.8% 48.2% 31.3% 7.7%
Determine the author’s perspective or intention 10.3% 44.4% 31.3% 14.4%

Appendix
115
After students have read something, how often do you ask them to do the following?
Every day or almost every
day
Once or twice
a week
Once or twice
a month Never or
almost never Write something about or in response to what they have read
11.9% 54.1% 29.4% 4.6%
Answer oral questions about or orally summarise what they have read
50.5% 44.3% 5.2% 0.0%
Talk with each other about what they have read 22.2% 41.2% 28.4% 8.2%
Take a written quiz or test about what they have read 4.1% 27.8% 41.8% 26.3%
Do the students in this class have computers available to use during their reading lessons? Frequency Percentage
Yes 142 98.6% No 2 1.4%
How often do you have students do the following computer activities during their reading lessons?
Every day or almost every
day
Once or twice
a week
Once or twice
a month Never or
almost never Look up information 6.9% 37.5% 45.1% 10.4% Read stories or other texts on the computer 8.3% 29.9% 46.5% 15.3% Use instructional software to develop reading skills 4.2% 30.6% 34.7% 30.6%
Use the computer to write stories or other texts 4.2% 32.6% 45.8% 17.4%
Do you have a library or reading corner in your classroom? Frequency Percentage
Yes 189 91.3% No 18 8.7%
How many books are in your classroom library? Frequency Percentage 0-25 15 8.0% 26-50 68 36.4% 51-100 71 38.0%
More than 100 33 17.6%
How many magazines with different titles are in your classroom library? Frequency Percentage
0 59 31.9% 1-2 54 29.2% 3-5 41 22.2%
More than 5 31 16.8%
How often do you give students in your class time to use the classroom library or reading corner? Frequency Percentage
Every day or almost every day 87 46.8% Once or twice a week 84 45.2% Once or twice a month 12 6.5%
Never or almost never 3 1.6%

Appendix
116
Can the students borrow books from the classroom library or reading corner to take home? Frequency Percentage
Yes 156 83.9% No 30 16.1%
How often do you take or send students to the library other than your classroom library? Frequency Percentage
At least once or twice a week 120 58.5% Once or twice a month 32 15.6% A few times a year 24 11.7%
Never or almost never 29 14.1%
How often do you take or send students to the library other than your classroom library? Frequency Percentage
No reading homework assignment 9 4.7% Less than once a week 13 6.8% 1-2 a week 67 35.3% 3-4 a week 31 16.3%
Everyday 70 36.8%
In general how much time do you expect your students to spend on homework involving reading
for any subject each time you assign it? Frequency Percentage 15 minutes or less 23 12.6% 16-30 minutes 120 65.9% 31-60 minutes 39 21.4%
More than 60 minutes 0 0.0%
How often do you do the following with reading homework assignments for this class?
Always or almost always
Sometimes
Never or almost never
Correct assignments and give feedback to students 66.3% 25.4% 8.3% Discuss the homework in class 62.4% 28.7% 8.8%
Monitor whether or not the homework was completed 86.7% 11.1% 2.2%
Are the following resources available to you to work with students who have difficulty with reading? Always
Sometimes Never
A specialised professional 29.3% 47.8% 22.9% A learning support assistant 52.9% 21.6% 25.5%
An adult / parent volunteer 1.5% 3.9% 94.6%
What do you usually do if a student begins to fall behind in reading? Yes No
Have the student work with a specialised professional 67.0% 33.0% Wait to see if performance improves with maturation 50.7% 49.3% Spend more time working or reading individually with student
75.5% 24.5%
Ask the parents to help the student with reading 96.7% 3.3%

Appendix
117
How much emphasis do you place on the following sources to monitor students’ progress in reading? Major emphasis
Some emphasis
Little or no emphasis
Evaluation of students’ ongoing work 80.2% 18.8% 1.0% Classroom tests 41.5% 53.7% 4.9%
National achievement tests 35.0% 40.9% 24.1%
As part of your formal education and / or training, to what extent did you study the following areas? Not at all
Overview or introduction to topic
It was an area of emphasis
Language test English / Maltese) 3.9% 30.9% 65.2% Pedagogy/ teaching reading 7.3% 29.6% 63.1% Educational psychology 6.3% 29.1% 64.6% Remedial reading 26.8% 59.5% 13.7% Reading theory 22.9% 60.0% 17.1% Special education 20.1% 57.4% 22.5% Second language learning 21.1% 51.5% 27.5%
Assessment methods in reading 22.4% 60.0% 17.6%
In the past two years, how many hours in total have you spent in in-service workshops or seminars that dealt
directly with reading or teaching reading? Frequency Percentage None 48 23.3% Less than 6 hours 58 28.2% 6-15 hours 62 30.1% 16-35 hours 24 11.7%
More than 35 hours 14 6.8%
For your professional development, about how often do you read children’s books? Frequency Percentage
At least once a week 58 29.1% Once or twice a month 92 46.2% Once or twice a year 34 17.1%
Never or almost never 15 7.5%

Appendix
118
C. Maltese Heads’ of School Responses
Approximately what percentages of students in your school have the following background? 0-10%
11-25%
26-50% 51-100%
Come from economically disadvantaged homes 62.1% 21.8% 4.6% 11.5% Come from economically affluent homes 34.4% 14.4% 24.4% 26.7%
Approximately what percentages of students in your school have English as their native language? Frequency Percentage
More than 90% 6 6.7% 76-90% 6 6.7% 51-77% 4 4.5% 26-50% 5 5.6% 25% or less 68 76.4%
How many people live in the city, town or area where your school is located? Frequency Percentage
More than 50000 people 0 0.0% 15001-50000 people 9 9.8% 3001-15000 people 56 60.9% 3000 people or fewer 27 29.3%
Which best describes the immediate area in which your school is located? Frequency Percentage
Urban – Densely populated 29 31.2% Suburban – Outskirts of urban area 6 6.5% Medium size city or large town 14 15.1% Small town or village 41 44.1% Remote rural 3 3.2%
Which best characterizes the average income level of the school’s immediate area? Frequency Percentage
High 0 0.0% Medium 79 85.9% Low 13 14.1%
What is the total instructional time, excluding breaks, in a typical day? Frequency Percentage
3 hours 1 1.1% 4 hours 4 4.4% 5 hours 85 93.4% 6 hours 1 1.1%
Does your school have a science laboratory that can be
used by Year 5 students? Frequency Percentage Yes 15 16.3% No 77 83.7%
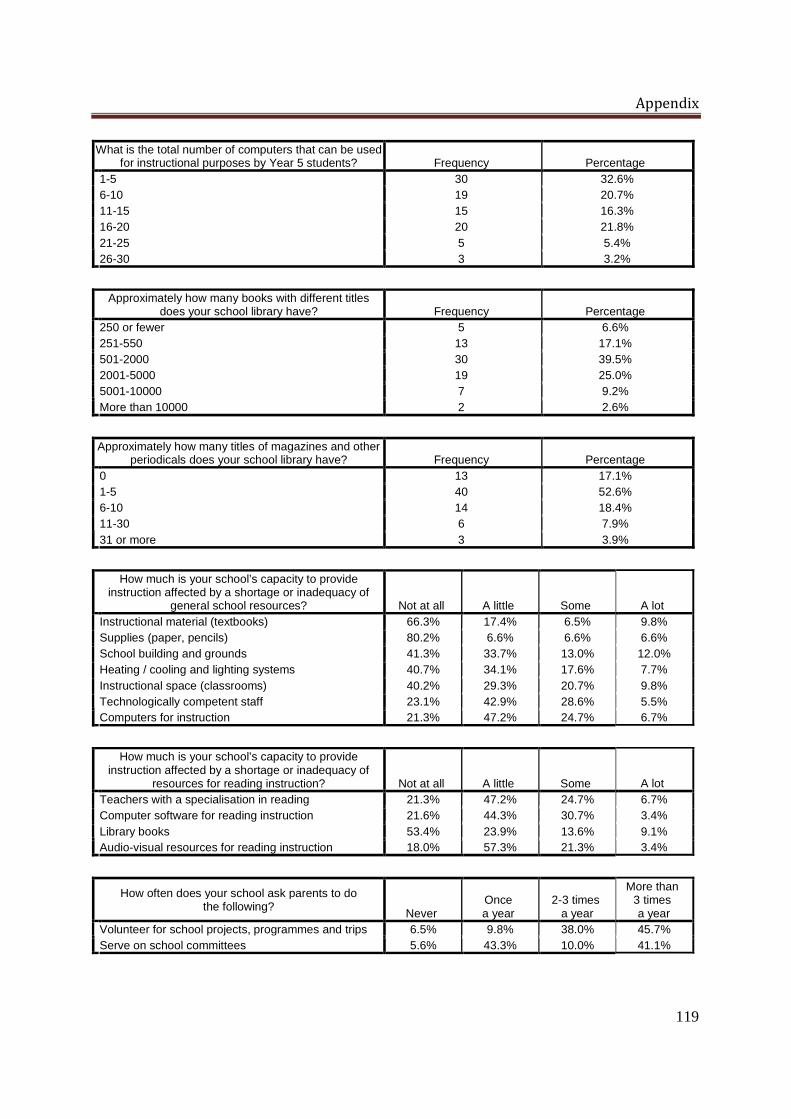
Appendix
119
What is the total number of computers that can be used for instructional purposes by Year 5 students? Frequency Percentage
1-5 30 32.6% 6-10 19 20.7% 11-15 15 16.3% 16-20 20 21.8% 21-25 5 5.4% 26-30 3 3.2%
Approximately how many books with different titles
does your school library have? Frequency Percentage 250 or fewer 5 6.6% 251-550 13 17.1% 501-2000 30 39.5% 2001-5000 19 25.0% 5001-10000 7 9.2% More than 10000 2 2.6%
Approximately how many titles of magazines and other
periodicals does your school library have? Frequency Percentage 0 13 17.1% 1-5 40 52.6% 6-10 14 18.4% 11-30 6 7.9% 31 or more 3 3.9%
How much is your school’s capacity to provide
instruction affected by a shortage or inadequacy of general school resources?
Not at all
A little
Some A lot Instructional material (textbooks) 66.3% 17.4% 6.5% 9.8% Supplies (paper, pencils) 80.2% 6.6% 6.6% 6.6% School building and grounds 41.3% 33.7% 13.0% 12.0% Heating / cooling and lighting systems 40.7% 34.1% 17.6% 7.7% Instructional space (classrooms) 40.2% 29.3% 20.7% 9.8% Technologically competent staff 23.1% 42.9% 28.6% 5.5% Computers for instruction 21.3% 47.2% 24.7% 6.7%
How much is your school’s capacity to provide
instruction affected by a shortage or inadequacy of resources for reading instruction?
Not at all
A little
Some A lot Teachers with a specialisation in reading 21.3% 47.2% 24.7% 6.7% Computer software for reading instruction 21.6% 44.3% 30.7% 3.4% Library books 53.4% 23.9% 13.6% 9.1% Audio-visual resources for reading instruction 18.0% 57.3% 21.3% 3.4%
How often does your school ask parents to do the following?
Never
Once a year
2-3 times a year
More than 3 times a year
Volunteer for school projects, programmes and trips 6.5% 9.8% 38.0% 45.7% Serve on school committees 5.6% 43.3% 10.0% 41.1%

Appendix
120
How much is your school’s capacity to provide instruction affected by a shortage or inadequacy of
resources for mathematics instruction?
Not at all
A little
Some A lot Teachers with a specialisation in mathematics 22.0% 47.3% 25.3% 5.5% Computer software for mathematics instruction 23.1% 41.8% 28.6% 6.6% Library material relevant to mathematics instruction 19.8% 41.8% 33.0% 5.5% Audio-visual resources for mathematics instruction 18.7% 49.5% 26.4% 5.5% Calculators for mathematics instruction 53.8% 17.6% 18.7% 9.9%
How much is your school’s capacity to provide instruction affected by a shortage or inadequacy of
resources for science instruction?
Not at all
A little
Some A lot Teachers with a specialisation in science 21.3% 33.7% 33.7% 11.2% Computer software for science instruction 21.3% 32.6% 32.6% 13.5% Library material relevant to science instruction 20.2% 40.4% 34.8% 4.5% Audio-visual resources for science instruction 18.0% 36.0% 34.8% 11.2% Science equipment and materials 22.7% 31.8% 33.0% 12.5%
How often does your school do the following for parents concerning individual students?
Never
Once a year
2-3 times a year
More than 3 times a year
Inform parents about their child’s learning progress 0.0% 1.1% 54.8% 44.1% Inform parents about the behaviour and well-being of their child at school
0.0% 1.1% 34.8% 64.1%
Discuss parents’ concern or wishes about their child’s learning
0.0% 3.3% 37.4% 59.3%
Support individual parents in helping their child with schoolwork
7.8% 7.8% 16.7% 67.8%
How would you characterise each of the following within your school?
Very high
High
Medium
Low
Very low
Teachers’ job satisfaction 15.2% 69.6% 15.2% 0.0% 0.0% Teachers’ understanding of school’s curricular goals 22.8% 67.4% 9.8% 0.0% 0.0% Teachers’ degree of success in implementing the school’s curriculum
20.7% 68.5% 10.9% 0.0% 0.0%
Teacher’s expectations for student achievement 30.4% 53.3% 14.1% 1.1% 1.1% Parental support for student achievement 12.1% 44.0% 37.4% 5.5% 1.1% Parental involvement in school activities 6.5% 41.3% 37.0% 12.0% 3.3% Students’ regard for school property 6.5% 54.3% 35.9% 3.3% 0.0% Students’ desire to do well in school 17.4% 47.8% 31.5% 2.2% 1.1%
In your school, are any of the following used to
evaluate the practice of Year 5 teachers? Yes No Observations by the Head of School or SMT 89.2% 10.8% Observations by EOs or others external to your school 55.4% 44.6% Student achievement 93.5% 6.5% Teacher peer review 19.4% 80.6%

Appendix
121
To what degree is each of the following problems among teachers in your school?
Not a problem
Minor problem
Moderate problem
Serious problem
Arriving late or leaving early 73.9% 22.8% 1.1% 2.2% Absenteeism 71.7% 23.9% 2.2% 2.2%
To what degree is each of the following problems among Year 5 students in your school?
Not a problem
Minor problem
Moderate problem
Serious problem
Arriving late at school 42.9% 46.2% 7.7% 3.3% Absenteeism 64.8% 26.4% 6.6% 2.2% Classroom disturbance 40.2% 44.6% 14.1% 1.1% Cheating 68.5% 26.1% 3.3% 2.2% Swearing 71.7% 18.5% 7.6% 2.2% Vandalism 79.1% 14.3% 4.4% 2.2% Theft 81.3% 14.3% 2.2% 2.2% Intimidation or verbal abuse among students 41.1% 43.3% 11.1% 4.4% Physical fights among students 42.9% 45.1% 9.9% 2.2% Intimidation or verbal abuse of teachers or staff 87.0% 7.6% 4.3% 1.1%
During the past year, approximately how much time have you spent on the following school leadership
activities in your role as a Head of School?
No time
Some time A lot of time Promoting the school’s educational vision or goals 0.0% 40.7% 59.3% Develop the school’s curricular and educational goals 0.0% 35.2% 64.8% Monitoring teachers’ implementation of the school’s educational goals in their teaching
2.2% 66.7% 31.1%
Monitoring students’ learning progress to ensure that the school’s educational goals are reached
0.0% 58.2% 41.8%
Keeping an orderly atmosphere in the school 1.1% 24.4% 74.4% Ensure that there are clear rules for student behaviour 1.1% 37.4% 61.5% Addressing disruptive student behaviour 4.4% 52.7% 42.9% Creating a climate of trust among teachers 0.0% 34.1% 65.9% Initiating a discussion to help teachers who have problems in the classroom
8.9% 58.9% 32.2%
Advising teachers who have questions or problems with their teaching
4.4% 60.0% 35.6%
Visiting other schools or attending educational conferences for new ideas
17.8% 72.2% 10.0%
Initiating educational projects or improvements 3.3% 56.0% 40.7% Participating in professional development activities specifically for Heads of School
6.6% 62.6% 30.8%
About how many of the students in your school can do the following when they begin primary school?
Less than 25%
25-50%
51-75%
More than 75%
Recognise most of the letters of the English alphabet 33.7% 13.5% 16.9% 36.0% Read some English words 48.3% 16.9% 14.6% 20.2% Read sentences in English 68.5% 14.6% 10.1% 6.7% Write letters of the English alphabet 41.1% 17.8% 12.2% 28.9% Write some English words 56.7% 20.0% 8.9% 14.4% Count up to 100 or higher 57.8% 18.9% 14.4% 8.9% Recognise all 10 written numbers for 1 to 10 11.1% 21.1% 22.2% 45.6% Write all ten numbers from 1 to 10 22.2% 22.2% 18.9% 36.7%

Appendix
122
In which Year group do the following reading skills and strategies first receive a major emphasis in the
instruction of English in your school?
Year 2 or
earlier
Year 3
Year 4
Year 5
Not in these grade
Knowing letters of the alphabet 97.8% 1.1% 0.0% 0.0% 1.1% Knowing letter-sound relationships 97.8% 1.1% 0.0% 0.0% 1.1% Reading words 96.7% 3.3% 0.0% 0.0% 0.0% Reading isolated sentences 93.3% 6.7% 0.0% 0.0% 0.0% Reading connected text 67.8% 31.1% 1.1% 0.0% 0.0% Locating information within the text 24.7% 59.7% 14.6% 1.1% 0.0% Identifying the main idea of a text 20.0% 48.9% 27.8% 3.3% 0.0% Explaining of supporting understanding of a text 15.7% 40.4% 31.5% 12.4% 0.0% Comparing a text with personal experience 12.5% 25.0% 33.0% 29.5% 0.0% Comparing different texts 4.5% 16.9% 27.0% 37.1% 14.6% Make predictions about what will happen next in a text 15.6% 14.4% 33.3% 32.2% 4.4% Make generalisations and drawing inferences on text 7.9% 16.9% 12.4% 34.8% 28.1% Describe the style or structure of a text 2.2% 7.8% 16.7% 25.6% 47.8% Determine the author’s perspective or intention 3.4% 5.6% 9.0% 30.3% 51.7%
Compared with other areas of the curriculum (mathematics and science), how much emphasis does
your school place on teaching the following English language and literary skills to students in Years 1 to 5?
More emphasis
Same emphasis
Less emphasis
Reading 68.1% 31.9% 0.0% Writing (not handwriting) 62.6% 37.4% 0.0% Speaking / listening (oral language) 46.2% 42.9% 11.0%
For Year 5 pupils and below, does your school make provisions for reading instruction in mother tongue for
students whose mother tongue is not English? Frequency Percentage Yes 63 70.8% No 26 29.2%

Appendix
123
D. Maltese Parents’ Responses
This survey was completed by: Frequency Percentage Mother 2979 75.6% Father 902 22.9% Other 61 1.5%
Before your child began primary school, how often did you or someone else in your home do the following
activities with him or her?
Often
Sometimes Never or
almost never Read books 52.6% 44.5% 2.9% Tell stories 53.5% 42.2% 4.3% Sing songs 53.4% 36.0% 10.6% Play with alphabet toys 57.1% 34.9% 8.0% Talk about things you had done 63.9% 32.7% 3.4% Talk about things you had read 35.5% 54.0% 10.4% Play word games 44.0% 45.8% 10.3% Write letters or words 50.3% 41.2% 8.5% Read aloud signs and labels 38.4% 44.4% 17.2% Say counting rhymes or sing counting songs 45.9% 36.6% 17.6% Play with number toys 51.7% 38.2% 10.1% Count different things 58.2% 34.9% 6.9% Play games involving shapes 61.2% 33.1% 5.8% Play with building blocks or construction toys 58.1% 31.4% 10.5% Play board games or card games 43.8% 46.1% 10.1%
What language did your child speak before he/she began school? Yes No
English 44.7% 55.3% Maltese 86.6% 13.4% Italian 2.9% 97.1% German 0.8% 99.2% Arabic 1.1% 98.9% Other 3.0% 97.0%
How long was he / she in Kindergarten? Frequency Percentage 3 years or more 379 11.0% Between 2 and 3 years 595 17.3% 2 years 2148 62.5% Between 1 and 2 years 219 6.4% 1 year or less 94 2.7%
How old was your child when he / she began primary school? Frequency Percentage
5 years old or younger 3122 91.1% 6 years old 278 8.1% 7 years old 16 0.5% 8 years old or older 12 0.4%
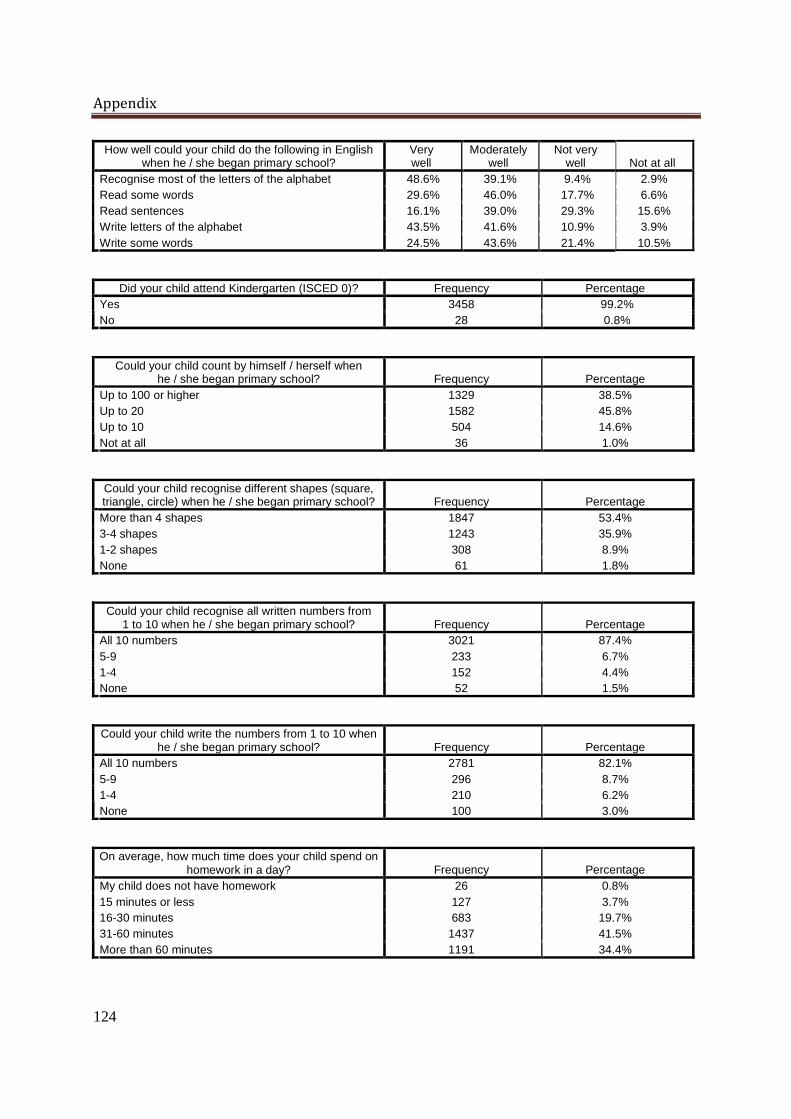
Appendix
124
How well could your child do the following in English when he / she began primary school?
Very well
Moderately well
Not very well Not at all
Recognise most of the letters of the alphabet 48.6% 39.1% 9.4% 2.9% Read some words 29.6% 46.0% 17.7% 6.6% Read sentences 16.1% 39.0% 29.3% 15.6% Write letters of the alphabet 43.5% 41.6% 10.9% 3.9% Write some words 24.5% 43.6% 21.4% 10.5%
Did your child attend Kindergarten (ISCED 0)? Frequency Percentage Yes 3458 99.2% No 28 0.8%
Could your child count by himself / herself when he / she began primary school? Frequency Percentage
Up to 100 or higher 1329 38.5% Up to 20 1582 45.8% Up to 10 504 14.6% Not at all 36 1.0%
Could your child recognise different shapes (square, triangle, circle) when he / she began primary school? Frequency Percentage More than 4 shapes 1847 53.4% 3-4 shapes 1243 35.9% 1-2 shapes 308 8.9% None 61 1.8%
Could your child recognise all written numbers from 1 to 10 when he / she began primary school? Frequency Percentage
All 10 numbers 3021 87.4% 5-9 233 6.7% 1-4 152 4.4% None 52 1.5%
Could your child write the numbers from 1 to 10 when he / she began primary school? Frequency Percentage
All 10 numbers 2781 82.1% 5-9 296 8.7% 1-4 210 6.2% None 100 3.0%
On average, how much time does your child spend on homework in a day? Frequency Percentage
My child does not have homework 26 0.8% 15 minutes or less 127 3.7% 16-30 minutes 683 19.7% 31-60 minutes 1437 41.5% More than 60 minutes 1191 34.4%

Appendix
125
Could your child do the following when he / she began primary school? Yes No
Do simple addition 74.2% 25.8% Do simple subtraction 63.9% 36.1%
How often do you or someone else in your home do the following things with your child?
Every day or almost every
day
Once or twice
a week
Once or twice
a month Never or
almost never Discuss my child’s schoolwork with him / her 73.7% 21.2% 2.9% 2.2% Help my child with his / her schoolwork 51.7% 28.4% 8.0% 11.9% Make sure my child sets aside time to do homework 88.1% 7.7% 1.4% 2.8% Ask my child what he / she learned in school 77.9% 18.8% 1.9% 1.4% Check if my child has done his / her homework 84.0% 9.9% 2.0% 4.1% Help my child practise his / her reading 44.7% 37.7% 7.1% 10.4% Talk with my child about what he / she is reading 48.8% 38.9% 8.6% 3.8%
What do you think of your child’s school? Agree a lot
Agree a little
Disagree a little
Disagree a lot
My child’s school includes me in my child’s education 72.6% 22.1% 4.0% 1.3% My child’s school should make a greater effort to include me in my child’s education
39.1% 28.4% 18.6% 14.0%
My child’s school provides a safe environment 76.3% 17.2% 4.7% 1.8% My child’s school cares about my child’s progress in school
82.8% 14.0% 2.6% 0.6%
My child’s school should do better at keeping me informed of his / her progress
45.9% 25.3% 14.0% 14.8%
My child’s school does a good job in helping him / her become better in reading
71.3% 21.3% 5.9% 1.5%
My child’s school does a good job in helping him / her become better in mathematics
72.8% 20.4% 5.5% 1.3%
My child’s school does a good job in helping him / her become better in science
58.4% 28.6% 9.6% 3.4%
In a typical week, how much time do you usually spend reading for yourself at home, including books,
magazines, newspapers and materials for work? Frequency Percentage Less than 1 hour a week 854 24.8% 1-5 hours a week 1595 46.3% 6-10 hours a week 577 16.7% More than 10 hours a week 422 12.2%
When you are at home, how often do you read for your own enjoyment? Frequency Percentage
Every day or almost every day 1427 41.2% Once or twice a week 1285 37.1% Once or twice a month 369 10.7% Never or almost never 382 11.0%

Appendix
126
Indicate how much you agree with the following statements about reading?
Agree a lot
Agree a little
Disagree a little
Disagree a lot
I read only if I have to 8.4% 15.4% 18.1% 58.2% I like talking about what I read with other people 48.7% 34.1% 10.5% 6.7% I like to spend my spare time reading 61.8% 24.5% 8.8% 4.9% I read only if I need information 12.7% 18.7% 22.2% 46.3% Reading is an important activity in my home 61.5% 27.0% 8.8% 2.8% I would like to have more time for reading 79.2% 14.0% 3.9% 2.9% I enjoy reading 78.1% 15.9% 3.1% 2.9%
About how many books are there in your home? Frequency Percentage 0-10 373 10.8% 11-25 591 17.1% 26-100 1190 34.4% 101-200 575 16.6% More than 200 729 21.1%
About how many children’s books are there in your home? Frequency Percentage
0-10 108 3.1% 11-25 352 10.2% 26-50 962 27.8% 51-100 1154 33.4% More than 100 882 25.5%
Are these books mainly in English? Frequency Percentage Yes 2747 85.9% No 451 14.1%
When talking at home with your child, what language does the child’s father and mother use most often? Father Mother
English 14.1% 15.9% Maltese 82.7% 81.9% Italian 0.8% 0.3% German 0.3% 0.3% Arabic 0.4% 0.1% Other 1.1% 1.2% Not applicable 0.6% 0.2%
How far in his / her education do you expect your child to go? Frequency Percentage
ISCED 2 (Secondary education) 480 14.6% ISCED 3 (Post-Secondary education) 618 18.8% ISCED 4 (Diploma from MCAST / ITS) 281 8.6% ISCED 5B (Diploma from university 673 20.5% ISCED 5A (Bachelor’ Degree from university) 803 24.5% Beyond ISCED 5A (Master’s, PhD) 429 13.1%

Appendix
127
What is the highest level of education completed by the child’s father and mother? Father Mother
No schooling 0.6% 0.3% ISCED 1 (Primary education) 4.2% 2.4% ISCED 2 (Secondary education) 54.7% 54.3% ISCED 3 (Post-Secondary education) 15.0% 18.1% ISCED 4 (Diploma from MCAST / ITS) 4.9% 5.1% ISCED 5B (Diploma from university 5.8% 6.9% ISCED 5A (Bachelor’ Degree from university) 6.5% 8.1% Beyond ISCED 5A (Master’s, PhD) 7.1% 4.2% Not applicable 1.3% 0.7%
Which best describes the employment situation of the child’s father and mother? Father Mother
Working at least full-time for pay 87.5% 33.4% Working part-time only for pay 2.5% 22.1% Not working for pay 1.9% 25.5% Other 4.7% 6.3% Not applicable 3.3% 12.8%
Related Documents