13-1 Jean Phillips & Stanley Gully Copyright © 2012 Pearson Education, Inc. publishing as Prentice Hall

13-1 Jean Phillips & Stanley Gully Copyright © 2012 Pearson Education, Inc. publishing as Prentice Hall.
Dec 22, 2015
Welcome message from author
This document is posted to help you gain knowledge. Please leave a comment to let me know what you think about it! Share it to your friends and learn new things together.
Transcript

13-1
Jean Phillips & Stanley Gully
Copyright © 2012 Pearson Education, Inc. publishing as Prentice Hall

13-2
Copyright © 2012 Pearson Education, Inc. publishing as Prentice Hall

13-3
Direct costs: charges incurred as an immediate result of some staffing activity (e.g., higher training costs, lower productivity)
Indirect costs: not directly attributable to staffing activities (e.g., lost business opportunities, lower morale)
Copyright © 2012 Pearson Education, Inc. publishing as Prentice Hall

13-4
Staffing evaluation: the analysis of a staffing system to determine its performance and effectiveness.
Evaluating a staffing system allows us to objectively identify which staffing activities are related to business strategy execution and company performance, assess how well different staffing initiatives are working, and improve the staffing system based on what is learned.
Competitive advantage can be created through staffing by identifying the staffing activities that drive business success and strategy execution, evaluating them, and improving them.
Measurement occurs at a single point in time, and isn’t as useful as is tracking and making comparisons over time.
Copyright © 2012 Pearson Education, Inc. publishing as Prentice Hall
13-5
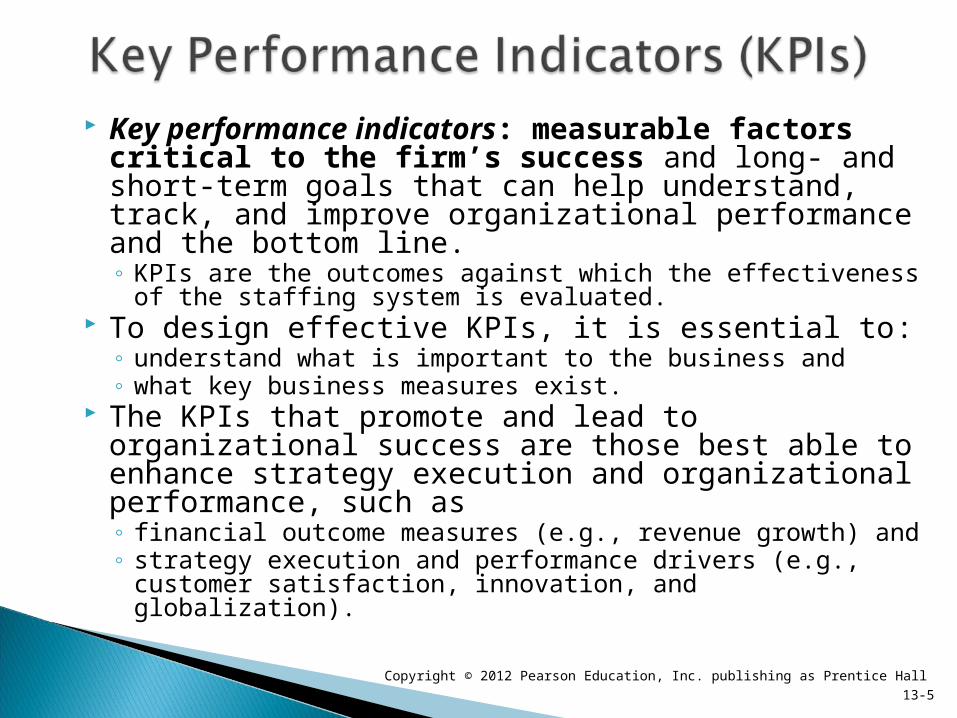
Key performance indicators: measurable factors critical to the firm’s success and long- and short-term goals that can help understand, track, and improve organizational performance and the bottom line.◦ KPIs are the outcomes against which the effectiveness of
the staffing system is evaluated. To design effective KPIs, it is essential to:
◦ understand what is important to the business and ◦ what key business measures exist.
The KPIs that promote and lead to organizational success are those best able to enhance strategy execution and organizational performance, such as◦ financial outcome measures (e.g., revenue growth) and ◦ strategy execution and performance drivers (e.g.,
customer satisfaction, innovation, and globalization).
Copyright © 2012 Pearson Education, Inc. publishing as Prentice Hall

13-6
Lagging indicator: information that is available only after staffing decisions have been made.
Leading indicator: information that precedes or predicts staffing outcomes.
Some indicators can be both leading and lagging indicators. ◦ For example, while the availability of talent is
generally thought of as a leading indicator of the quality of hire (the larger the talent pool, the more likely you are to hire more qualified people), it can also be a lagging indicator of a company’s employer image.
Copyright © 2012 Pearson Education, Inc. publishing as Prentice Hall

13-7
Copyright © 2012 Pearson Education, Inc. publishing as Prentice Hall

13-8
Short-term metrics help to evaluate the success of a staffing system in terms of recruiting and new hire outcomes and include:◦ Percentages of hires for each job or job family coming from each
recruiting source (e.g., college hiring, employee referrals, job fairs, newspaper advertisements, Internet advertisements, etc.)
◦ Number of high-quality new hires coming from each recruiting source and recruiter
◦ Number of diverse hires coming from each recruiting source and recruiter
◦ Average time-to-start (by position, source, and recruiter)◦ Average time-to-contribution (by position, source, and recruiter)
Long-term metrics help to evaluate the success of a staffing system in terms of outcomes that take place some time after hire and include:◦ Job success by recruiting source and by recruiter◦ Employee tenure by recruiting source and by recruiter◦ Promotion rates by recruiting source and by recruiter
Copyright © 2012 Pearson Education, Inc. publishing as Prentice Hall

13-9
Staffing efficiency: the amount of resources used in the staffing process. ◦ Hiring costs include sourcing, recruiting, screening,
and hiring costs including referral bonuses, travel expenses, advertisements, candidate assessments, meals, transportation, and testing including drug tests and background checks.
◦ Replacement costs include hiring costs as well as the productivity loss while the position is unfilled. Reducing time-to-fill and improving socialization and onboarding can reduce replacement costs.
Copyright © 2012 Pearson Education, Inc. publishing as Prentice Hall

=Total Staffing Cost / Total Compensation of
the new hires
Copyright © 2011 Pearson Education, Inc.
Publishing as Prentice Hall 1-10

13-11
Staffing effectiveness: how well the staffing process meets stakeholder needs and contributes to strategy execution and organizational performance.
Copyright © 2012 Pearson Education, Inc. publishing as Prentice Hall
13-12
Job success Quality of hire Retention rates Voluntary turnover rate of top performers Voluntary turnover rate of bottom
performers Value of top performers
Copyright © 2012 Pearson Education, Inc. publishing as Prentice Hall
13-13
When using metrics and evaluating staffing activities, it can be easy to focus on staffing efficiency and lose sight of staffing effectiveness.
A balance must be struck between staffing efficiency and staffing effectiveness.
ROI can be calculated for a firm’s investment in individual staffing activities, such as the ROI of different recruiting sources or assessment methods, or for the staffing system as a whole.
Copyright © 2012 Pearson Education, Inc. publishing as Prentice Hall

13-14
Six Sigma: a data-driven quality initiative and methodology that uses statistical analysis to measure and improve business processes and their outcomes to near perfection
Six Sigma can be used to improve a variety of staffing outcomes, such as:◦ Lowering turnover among high performers◦ Improving applicant quality◦ Improving new hire fit with corporate culture◦ Reducing time-to-fill◦ Increasing the return on the company’s staffing
investment
Copyright © 2012 Pearson Education, Inc. publishing as Prentice Hall
13-15
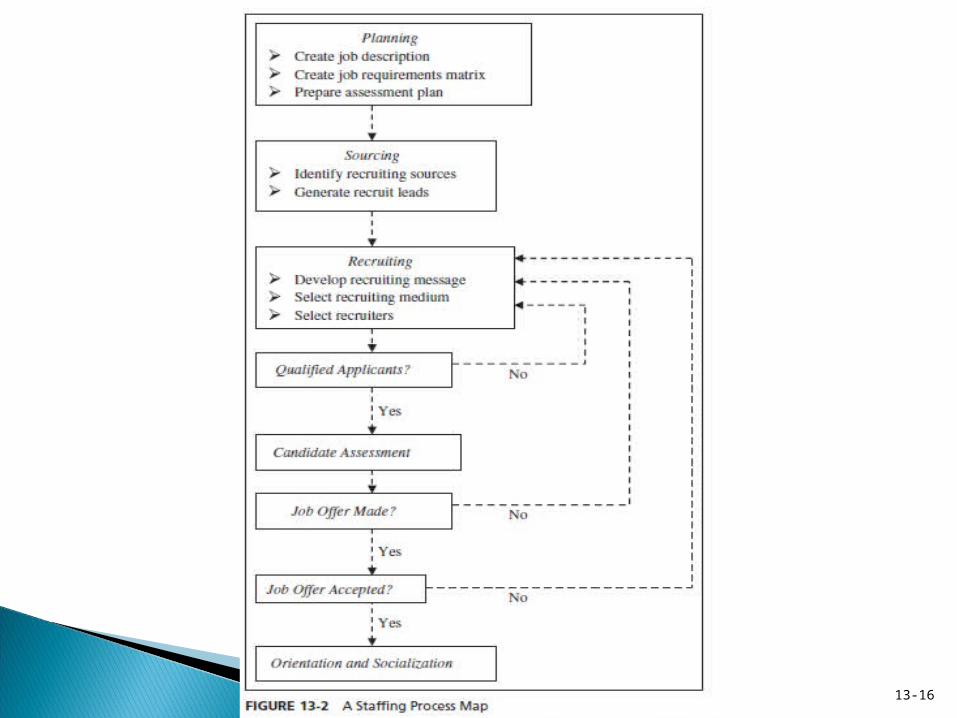
Six Sigma methodology begins with a process map that defines and graphically maps out the process to be improved.
The process map represents the entire process, and is helpful in identifying important metrics for analysis.
After identifying the source of any defects, an improvement program is created to remove the cause of the defects.
To improve the quality of a staffing process, each step of the process must maximize the probability that the selected candidate meets the hiring manager’s expectations by maximizing the chances that unqualified candidates are screened out at each step, and enhancing candidates’ interest in the job and in the organization as an employer.
Copyright © 2012 Pearson Education, Inc. publishing as Prentice Hall
13-16

13-17
For existing internal processes, use DMAIC (Define, Measure, Analyze, Improve, and Control) ◦ Define the problem: reduce unwanted turnover
among high performers.◦ Measure: identify key measurements underlying
turnover.◦ Analyze: understand key factors and trends that
create turnover.◦ Improve: identify and execute a plan to address
those factors. ◦ Control: implement controls to lower turnover
on an ongoing basis.
Copyright © 2012 Pearson Education, Inc. publishing as Prentice Hall

13-18
To create new processes, use DMADV (Define, Measure, Analyze, Design, and Verify) ◦ Define project goals and customer deliverables,
such as improved new-hire quality ◦ Measure: determine hiring manager needs◦ Analyze the process of sourcing, recruiting,
screening, and making job offers◦ Design the staffing process to screen out
undesirable candidates and maximize new-hire quality
◦ Verify the performance of the process and its ability to meet hiring manager needs
Copyright © 2012 Pearson Education, Inc. publishing as Prentice Hall

The balanced scorecard is a management system (not only a measurement system) that enables organizations to clarify their vision and strategy and translate them into action. It provides a clear prescription as to what companies should measure in order to 'balance' the financial perspective.
It views the organization from four perspectives, and to develop metrics, collect data and analyze it relative to each of these perspectives:
The Learning & Growth Perspective The Business Process Perspective The Customer Perspective The Financial Perspective
1-19

1-20

Strategic aims (objectives) Measures (for the objectives) Targets (for the measures) Initiatives (actions)
Copyright © 2011 Pearson Education, Inc. Publishing as Prentice Hall1-21
For every perspective…For every perspective…

13-22
Balanced scorecard: a tool for managing employees’ performance and for aligning all employees with key business objectives by assigning financial and non-financial goals and monitoring and assessing performance
Balanced scorecards help organizations to:◦ Compare performance within the organization◦ Track trend performance within the organization◦ Benchmark the organization against other
organizations, the firm’s own budget or the historical data
◦ Identify best performers in the company and its best practices
Copyright © 2012 Pearson Education, Inc. publishing as Prentice Hall
13-23
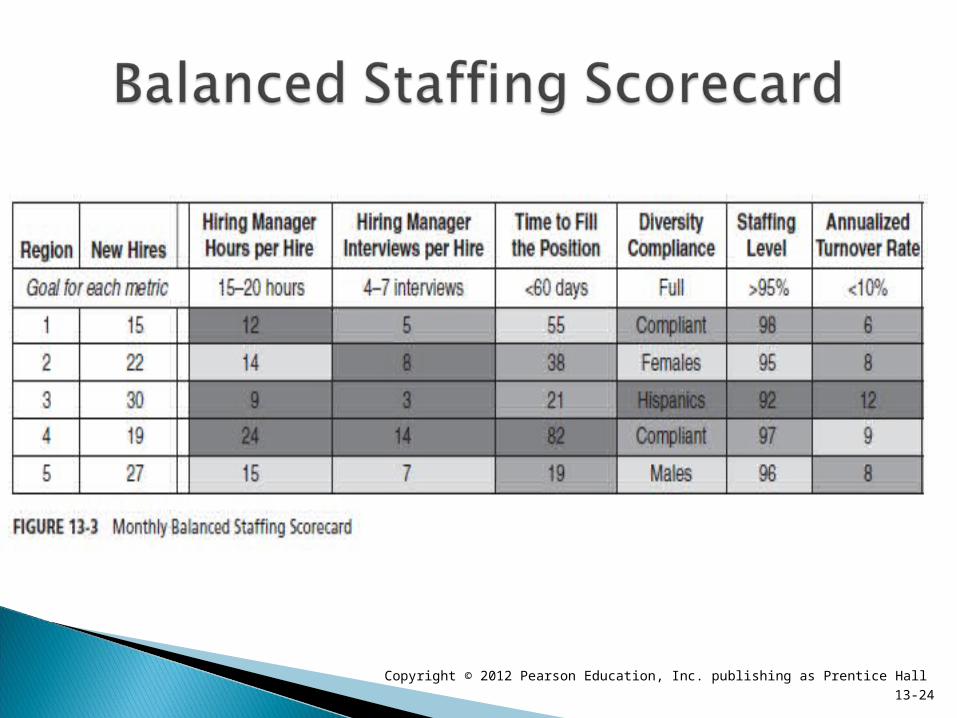
Balanced staffing scorecard: contains objectives, targets, and initiatives for each activity that adds value to the staffing process.
The company’s goals and strategies should guide scorecard development, with most measures focusing on value creation and staffing effectiveness and a smaller number addressing staffing efficiency and cost control.
The choice of scorecard criteria can be based on company strategy and goals, anticipated challenges such as a tightening labor market or changing workforce demographics, current problems such as difficulty staffing key leadership positions, and practical reasons such as ease of communication to hiring managers.
When choosing what to include on a staffing scorecard, be sure to consider the company’s talent philosophy, and HR strategy. Set clear and consistent goals, and carefully balance cost, time, quality, and customer satisfaction.
Copyright © 2012 Pearson Education, Inc. publishing as Prentice Hall
13-24
Copyright © 2012 Pearson Education, Inc. publishing as Prentice Hall

13-25
Identify a problem area and assess how to measure and improve it.
The metrics you use shouldn’t be too complex or numerous to understand or explain to others.
It is often a good idea to implement a staffing evaluation program incrementally, rather than taking on the entire staffing system at once. ◦ Evaluate one component of the system at a time by calculating
its impact on relevant KPIs such as a division’s productivity, tenure, performance, labor costs, and promotions. For example, a firm pursuing a cost-leadership strategy based on an operational excellence competitive advantage might be very concerned about labor costs.
Evaluating the impact of employee turnover and new hire quality on labor costs helps build the case that these factors are important. ◦ Involve other units like finance and operations to acquire
needed information and data. This process helps build your case that staffing activities influence
important organizational outcomes and can secure the buy-in needed to make staffing improvements and increase the scope of the evaluation program.
Copyright © 2012 Pearson Education, Inc. publishing as Prentice Hall

High quality and accuracy Keep personal information private The data should be used only on the ways it
was told to the employees Avoid unfair comparisons
Transparency?

13-27
All rights reserved. No part of this publication may be reproduced, stored in a retrieval system, or transmitted, in any form or by any means, electronic,
mechanical, photocopying, recording, or otherwise, without the prior written permission of the publisher. Printed in the United States of America.
Copyright © 2012 Pearson Education, Inc. publishing as Prentice Hall
Related Documents