Zitholele Consulting Reg. No. 2000/000392/07 PO Box 6002 Halfway House 1685, South Africa Building 1, Maxwell Office Park, Magwa Crescent West c/o Allandale Road & Maxwell Drive, Waterfall City, Midrand Tel + (27) 11 207 2060 Fax + (27) 86 674 6121 E-mail : [email protected] Directors: Dr. R.G.M. Heath, S. Pillay, N. Rajasakran FINAL ENVIRONMENTAL IMPACT REPORT FOR THE PROPOSED MEDUPI FLUE GAS DESULPHURISATION (FGD) RETROFIT PROJECT DEA REF: 14/12/16/3/3/2/1060 ZC Report No: 12949-46-Rep-004 Compiled on behalf of: Eskom Holdings SOC Limited P O Box 1091 Johannesburg 2000 Submitted to: The Department of Environmental Affairs 473 Steve Biko, Arcadia, Pretoria, 0083 DISTRIBUTION: 1 Copy - Eskom Holdings SOC Limited 2 Copies - Department of Environmental Affairs 23 May 2018 12949

Welcome message from author
This document is posted to help you gain knowledge. Please leave a comment to let me know what you think about it! Share it to your friends and learn new things together.
Transcript
Zitholele Consulting
Reg. No. 2000/000392/07 PO Box 6002 Halfway House 1685, South Africa Building 1, Maxwell Office Park, Magwa Crescent West c/o Allandale Road & Maxwell Drive, Waterfall City, Midrand Tel + (27) 11 207 2060 Fax + (27) 86 674 6121 E-mail : [email protected]
Directors: Dr. R.G.M. Heath, S. Pillay, N. Rajasakran
FINAL ENVIRONMENTAL IMPACT REPORT FOR
THE PROPOSED MEDUPI FLUE GAS DESULPHURISATION (FGD)
RETROFIT PROJECT
DEA REF: 14/12/16/3/3/2/1060
ZC Report No: 12949-46-Rep-004
Compiled on behalf of:
Eskom Holdings SOC Limited
P O Box 1091 Johannesburg
2000
Submitted to:
The Department of Environmental Affairs
473 Steve Biko, Arcadia, Pretoria,
0083
DISTRIBUTION:
1 Copy - Eskom Holdings SOC Limited
2 Copies - Department of Environmental Affairs
23 May 2018 12949

23 May 2018 ii 12949
ZITHOLELE CONSULTING
Please note: Changes from the Draft Environmental Impact Report (DEIR) to the Final Environmental Impact
Report (FEIR) are indicated in underlined text.
23 May 2018 iii 12949
ZITHOLELE CONSULTING
EXECUTIVE SUMMARY
Medupi Power Station (MPS) is a greenfield coal-fired power station that forms part of the Eskom
New Build Programme. Medupi Power Station has an installed generation capacity of 6 x 800 MW
units and utilises a supercritical boiler and turbine technology designed to operate at higher
temperatures and pressures, which allows for better efficiency of the power station. The result is an
improvement of approximately 2 percentage points on the plant efficiency, which equates to a
reduced coal consumption of approximately 1 million tons per annum.
In coal-fired power stations, electricity is generated through combustion of coal. Coal is composed,
primarily, of carbon along with variable quantities of other elements, chiefly hydrogen, sulphur,
oxygen, and nitrogen. When coal is burned, the sulphur combines with oxygen to form, amongst
others, sulphur dioxide (SO2) and sulphur trioxide (SO3). Due to the detrimental impact of high SO2
concentrations associated with coal fired-power stations stringent air quality regulations have been
implemented worldwide to combat the emissions of sulphur oxides (SOx).
Flue Gas Desulfurization (FGD) is a technology used to remove SO2 from flue gases of fossil-fuel
power plants, and from the emissions of other sulphur oxide emitting processes. MPS was designed
and constructed to be wet FGD ready, utilising limestone as a sorbent.
EIA PROCESS UNDERTAKEN
The Scoping Phase commenced in 2013 and was concluded in August 2015 with submission of a
Scoping Report to the Department of Environmental Affairs (DEA), which was subsequently
accepted with a Plan of Study approved. During the execution of the Impact Assessment phase that
followed, deviations on the development packaging were necessary to streamline the EIA application
process for the Medupi FGD project in order to fast track the application for authorisation and
licensing of the FGD retrofit. Two bridging documents were prepared and distributed to I&APs to
inform stakeholders of the proposed changes to EIA scope.
Subsequent to the aforementioned changes the EIA scope includes assessment of the construction
and operation of a railway yard/rail siding to receive Limestone and transport gypsum via rail, the
installation of diesel storage facilities within the FGD and railway yard footprint, the construction and
operation of the wet FGD system as well as associated infrastructure required for operation of the
FGD system, the handling, treatment and conveyance of gypsum and effluent, the construction and
operation of a Waste Water Treatment Plant (WWTP), and the management, handling, transport and
storage of salts and sludge generated through the waste water treatment process at a temporary
waste storage facility; and a complete water management system.
SPECIALIST STUDIES
Specialists were appointed to undertake relevant assessments to identify and assess impacts, and
propose appropriate mitigation and management measures for the identified impacts. The specialist
studies commissioned include an Air Quality Impact Assessment, Noise Impact Assessment,
Geology and Soils Assessment, Geotechnical Assessment, Geohydrology Impact Assessment,
Surface Water Assessment, Traffic Impact Assessment, Terrestrial Ecological (Fauna, Flora, incl.
Avifauna) and Wetland Impact Assessment, Social Impact Assessment, Heritage Impact
Assessment, and Waste Assessment. A number of studies were previously undertaken for the
23 May 2018 iv 12949
ZITHOLELE CONSULTING
Medupi Power Station footprint, and as a result some of the commissioned specialists were tasked
to assess these existing reports and data in order to provide a specialist opinion on the potential
significance of identified impacts.
ALTERNATIVES CONSIDERED
Possible feasible and reasonable alternatives associated with the FGD Retrofit project were
considered, however, no feasible alternatives were identified for location of the FGD system and
railway yard infrastructure, as this infrastructure had to be positioned at pre-determined footprints
due to alignment with existing station infrastructure. Furthermore, technology alternatives relating
to the use of dry FGD, Wet FGD and Wet FGD with gas cooling technology to reduce water
consumption by the FGD system were considered. It was concluded that due to unavailability of
adequate space for gas cooler maintenance purposes, high maintenance costs of the gas cooler,
specific characteristics of the ash, and potential prolonged unit standing times required to support
the gas cooler, the wet FGD system with gas cooler was not feasible at the Medupi Power Station in
the technology’s current form.
The No-Go Option is to continue the operation of the Power Station without the FGD retrofit.
However, this option would result in the MPS operating in contravention of the conditions of its
Atmospheric Emission License (AEL); and under these circumstances, to remain compliant to
legislation, the MPS would need to shut down its operations. Shutting the station down would have
a catastrophic impact on the South African economy and the stability of electricity supply to southern
Africa. Not implementing the FGD retrofit programme can, therefore, be considered that the No-Go
Option is fatally flawed for these reasons.
PUBLIC PARTICIPATION UNDERTAKEN DURING THE EIA PROCESS
Public participation was carried out in accordance with:
• the National Environmental Management Act (NEMA) (Act 107 of 1998, Chapter 1);
• the NEMA Section 24 (5), Regulation 54-57 of GNR 543;
• the Integrated Environmental Management Guideline Series (Guideline 7) – Public
Participation in the Environmental Impact Assessment Process, GN234, promulgated 10
October 2012); and
• the National Water Act (NWA) (Act 36 of 1998).
A summary of the public participation undertaken for the Project is provided in the Table below.
ACTIVITY DATE
Scoping Phase
Advertisements were placed in the Mogol Post,
the Lephalale Express and the Northern News
24 October 2014
Placement of Site Notices and distribution of
BIDs
June 2014
23 May 2018 v 12949
ZITHOLELE CONSULTING
Public Review of the Draft Scoping Report (for
40 Days)
24 October - 5 December 2014
Comments period extension granted to 09
January 2015
Public Meetings were held at the Marapong
Community Library and the Mogol Golf Club
05 and 06 November 2014
Bridging Reports
Bridging Reports (2 separate reports) informing
the public of the amendments of the project
scope of work and packaging were released for
public notification.
Bridging Report 1: 30 September 2016, and
Bridging Report 2: 17 November 2017
EIA Phase
Advertisements announcing the availability of
the Draft Environmental Impact Report (DEIR)
and the public meeting dates and venues were
placed in the Mogol Post newspaper.
09 March 2018
Distribution of Notification of the availability of
the DEIR and the public review date.
Commencement of public review period: 19
February 2018 to 05 April 2018
The DEIR was released for public review. The
reports were placed at the following venues:
Lephalale Public Library, Marapong Community
Hall, Lesedi Tshukudu Thusong Centre and the
Agric Lephalale/Farmers Association
19 February 2018 – 05 April 2018
Extension of review period- 06 April 2018 -19
April 2018
Public and key stakeholder meetings where
held at the following venues:
Lephalale Public Library, Marapong, Lesedi
Tshukudu Thusong Centre and the Mogol Golf
Club
12 - 13 March 2018
FEIR submission and available for public review
for a 21-day period.
23 May 2018
It should be noted that the DSR and the DEIR were available for download from Zitholele’s website
(www.zitholele.co.za/environmental/) as well as the Eskom website
(http://www.eskom.co.za/OurCompany/SustainableDevelopment/EnvironmentalImpactAssessment
s/Pages/Environment_Impact_Assessments.aspx) under the heading “Medupi FGD”).
IMPACT ASSESSMENT
The FGD system, railway yard and associated infrastructure will be situated within the authorised
development footprint of the Medupi Power Station as a whole. It was therefore noted that the FGD
retrofit construction activities within the MPS footprint (development area) (excluding the proposed
area where the railway yard and associated structures), will occur predominantly within areas already
impacted. This development area has already been rezoned for industrial and economic purposes
in light of the development of the MPS on this specific site.
As a result of the development of the MPS, existing pollution management measures, such as clean
and dirty water separation infrastructure, is already installed within the MPS footprint. This already
23 May 2018 vi 12949
ZITHOLELE CONSULTING
provides some assurance that possible impacts originating from the FGD system and associated
infrastructure will be managed within the existing pollution management system.
The specialist and impact assessments concluded that the potential impacts on geotechnical
aspects, noise levels, heritage, archaeology and palaeontology, and traffic was expected to be minor
and can successfully be mitigated to acceptable levels with proposed mitigation.
Assessment of the proposed air quality impacts has demonstrated what was anticipated, i.e. that
implementation of the FGD system would significantly reduce the SO2 emissions at the MPS to very
low levels. However, within the MPS operations the FGD system will be a major consumer of water.
This, however, is offset by a water allocation from Mokolo Crocodile Water Augmentation Project
(MCWAP) Phase 1 and 2.
The potential impact on local communities and social aspects is expected to have an overwhelmingly
positive impact. Reduction of SO2 levels once the FGD system is operational is the primary positive
impact that will result in better quality of life in the regions. Additionally, indirect positive impacts
resulting from growth in the local economy and greater employment opportunities will be significant.
Overall the impact of the installation of the FGD system, railway yard and associated infrastructure
will have a Moderate to High impact on the local biodiversity, and to a lesser degree, wetlands in
close proximity to the FGD. Although loss to intact vegetation types and habitat will be permanent
for the life of the power station, impacts on fauna can be mitigated more successfully to a greater
extent.
CUMULATIVE IMPACTS
Cumulative impacts were inherently included and assessed by all specialists during their
assessments. The most pertinent considerations in terms of cumulative impacts include the air
quality assessment and biodiversity and wetland assessment. In terms of the air quality assessment,
cumulative impacts was considered during the 2020 scenario model that was run by the air quality
specialist. The model considered impacts from the current Medupi Power Station as well as impacts
from the Matimba Power Station and took into account the ambient air quality which represent
impacts from all industries in the region.
With regard to the biodiversity and wetland assessment, the cumulative impact associated with the
existing impact of the Medupi Power Station and potential future operational power station was
considered. The proposed mitigation measures were specifically aimed at reduction of the
cumulative impact on the Sandloop NFEPA and implementation of a proposed wetland offset to
counter residual loss of wetland area.
The impact assessment methodology employed by Zitholele Consulting and provided to all
specialists for the assessment of the identified impacts furthermore implicitly include consideration
of cumulative impacts as described in section 11.1 of this FEIR.
CONCLUSION AND RECOMMENDATIONS
The negative impacts associated with impacts on biodiversity and wetlands can be successfully
mitigated to within acceptable levels, with the development contributing to the overwhelming positive
23 May 2018 vii 12949
ZITHOLELE CONSULTING
impacts associated with the reduction in SO2, significant benefits to the local economy and quality
of life for local residents. Therefore, taking all of the findings, conclusions and considerations
mentioned in this Final Environmental Impact Report (FEIR) into account it is the reasoned opinion
of the EAP that the proposed activities be authorised.
The EAP recommends the following general conditions to be included in the Environmental
Authorisation (EA):
• The EA will be subject to the implementation of mitigation measures and conditions stipulated
within the EMPr and this FEIR.
• Construction must commence within a period of 5 years of authorisation.
• EA will be valid for the life of the Medupi Power Station, subject to revisions and amendments
through legislated procedures as the need arises.
• Eskom must continue to investigate water saving measures for the Medupi Power Station.
• Eskom must continue to investigate mechanisms for waste reduction or minimisation, especially
relating to the re-use of ash and gypsum. This has the potential to unlock further economic
benefits for local communities living near power stations.
23 May 2018 viii 12949
ZITHOLELE CONSULTING
TABLE OF CONTENTS
SECTION PAGE
1 INTRODUCTION ............................................................................................................. 1
1.1 Environmental Impact Assessment Content Roadmap ................................................. 1
1.2 Project Background ...................................................................................................... 3
1.3 Existing authorisations, licences and approvals ............................................................ 6
1.4 Overview of Medupi FGD Retrofit Project ..................................................................... 8
1.5 Proponent ..................................................................................................................... 8
1.6 Details of Environmental Assessment Practitioner ........................................................ 8
2 NEED AND DESIRABILITY OF THE PROJECT ......................................................... 11
2.1 Environmental and Health Motivation .......................................................................... 11
2.2 Socio-Economic Motivation ......................................................................................... 11
2.3 Need and Desirability .................................................................................................. 12
3 PLAN OF STUDY (SCOPING PHASE) ........................................................................ 14
3.1 Introduction ................................................................................................................. 14
3.2 Proposed Plan of Study .............................................................................................. 14
3.3 Acceptance of Scoping Report and approval of Plan of Study .................................... 15
4 PROCESS FOLLOWED DURING EIA PROCESS ...................................................... 17
4.1 Public Participation ..................................................................................................... 17
4.2 Scoping Phase ........................................................................................................... 18
4.3 Environmental Impact Assessment Phase .................................................................. 19
4.4 Public participation during the EIR Phase ................................................................... 25
5 ENVIRONMENTAL LEGISLATIVE REQUIREMENTS ................................................ 35
5.1 The Constitution of the Republic of South Africa, 1996 (Act No. 108 Of 1996) ............ 35
5.2 National Environmental Management Act, 1998 (Act No. 107 of 1998) ....................... 35
5.3 Environmental Impact Assessment Regulations, 2010................................................ 36
5.4 National Environmental Management: Air Quality Act, 2004 (Act No. 39 of 2004) ....... 38
5.5 The National Environmental Management Waste Act, 2008 (Act No. 59 of 2008) ....... 40
5.6 The National Water Act, 1998 (Act No. 36 of 1998) .................................................... 42
5.7 Additional Legislative Requirements ........................................................................... 43
6 PROJECT DESCRIPTION ............................................................................................ 48
6.1 Introduction ................................................................................................................. 48
6.2 Study area defined ...................................................................................................... 50
6.3 Structured overview of proposed FGD system ............................................................ 54
6.4 FGD System component: Railway siding (Block 1) ..................................................... 57
6.5 FGD System component: Limestone handling and preparation (Block 2).................... 69
6.6 FGD System component: Input materials (Block 3) ..................................................... 71
6.7 FGD System component: Wet FGD system (Block 4) ................................................. 72
6.8 FGD System component: Treated Flue Gas (Block 5) and evaporation (Block 6) ....... 75
6.9 FGD System component: Gypsum handling, re-use and disposal (Block 7) ................ 75
6.10 FGD System component: Waste Water Treatment (Block 8) ...................................... 78
6.11 FGD System component: Management of WWTP by-products (Block 9) .................... 80
6.12 Resource Requirements ............................................................................................. 80
6.13 Water and Storm Water Management ......................................................................... 82
6.14 Timelines for the Medupi FGD retrofit ......................................................................... 96
7 ALTERNATIVES ASSESSMENT ................................................................................. 97
7.1 Introduction ................................................................................................................. 97
7.2 Location of activity ...................................................................................................... 97
7.3 Type of activity ............................................................................................................ 98
7.4 Design or layout of activity .......................................................................................... 98
7.5 Technology to be used................................................................................................ 98
7.6 Operational Aspects of activity .................................................................................. 103
7.7 No Go Option ............................................................................................................ 103
8 RECEIVING ENVIRONMENT ..................................................................................... 105
23 May 2018 ix 12949
ZITHOLELE CONSULTING
8.1 Climate ..................................................................................................................... 105
8.2 Geology .................................................................................................................... 110
8.3 Soils, Land Use and Land Capability ........................................................................ 114
8.4 Groundwater ............................................................................................................. 119
8.5 Surface Water ........................................................................................................... 123
8.6 Biodiversity (Terrestrial Ecology) and Wetlands ........................................................ 127
8.7 Air Quality ................................................................................................................. 139
8.8 Noise ........................................................................................................................ 142
8.9 Socio-economic ........................................................................................................ 145
8.10 Heritage, Archaeology and Palaeontology ................................................................ 153
8.11 Traffic Impact ............................................................................................................ 156
9 KNOWLEDGE GAPS, LIMITATIONS AND SCOPE CHANGES .............................. 160
9.1 Information and data limitations ................................................................................ 160
9.2 Specialist study limitations ........................................................................................ 160
9.3 Changes in project / process scope .......................................................................... 166
10 SUMMARY OF SPECIALIST STUDIES ..................................................................... 167
10.1 Geology .................................................................................................................... 167
10.2 Soils and Land Capability ......................................................................................... 168
10.3 Groundwater ............................................................................................................. 169
10.4 Surface water ........................................................................................................... 170
10.5 Biodiversity (Terrestrial Ecology) and Wetlands Assessment .................................... 172
10.6 Air Quality ................................................................................................................. 175
10.7 Noise ........................................................................................................................ 177
10.8 Social ........................................................................................................................ 178
10.9 Heritage, Archaeology and Palaeontology ................................................................ 182
10.10 Traffic ....................................................................................................................... 183
11 ENVIRONMENTAL IMPACT ASSESSMENT ............................................................ 185
11.1 Impact Assessment Methodology ............................................................................. 185
11.2 Geology and Geotechnical suitability ........................................................................ 189
11.3 Soils and Land Capability ......................................................................................... 191
11.4 Groundwater ............................................................................................................. 195
11.5 Surface water ........................................................................................................... 199
11.6 Biodiversity (Terrestrial Ecology) and Wetlands ........................................................ 202
11.7 Air Quality ................................................................................................................. 207
11.8 Noise ........................................................................................................................ 208
11.9 Social ........................................................................................................................ 210
11.10 Heritage, Archaeology and Palaeontology ................................................................ 214
11.11 Traffic ....................................................................................................................... 214
12 MONITORING AND MAINTENANCE ......................................................................... 217
12.1 Soils .......................................................................................................................... 217
12.2 Groundwater ............................................................................................................. 219
12.3 Surface water ........................................................................................................... 220
12.4 Biodiversity (Terrestrial Ecology) and Wetlands ........................................................ 222
12.5 Noise ........................................................................................................................ 223
12.6 Heritage, archaeology and palaeontology ................................................................. 224
13 ENVIRONMENTAL IMPACT STATEMENT ............................................................... 225
13.1 Key considerations ................................................................................................... 225
13.2 Key findings .............................................................................................................. 228
13.3 Summary of impacts and risks .................................................................................. 232
14 REASONED OPINION OF THE EAP ......................................................................... 233
15 REFERENCES ............................................................................................................ 236
23 May 2018 x 12949
ZITHOLELE CONSULTING
LIST OF FIGURES
Figure 1-1: Project Locality Map within Lephalale Municipal area ................................................... 4
Figure 6-1: Simple diagram of FGD process ................................................................................. 49
Figure 6-2: Development footprint for the FGD Retrofit project...................................................... 50
Figure 6-3: Proposed railway yard development area, including limestone and gypsum
handling and associated infrastructure (green outline) between the MPS and existing ADF ......... 52
Figure 6-4: Proposed FGD development area (blue outline) within the MPS footprint ................... 53
Figure 6-5: Conveyor alignment area linking the railway yard and FGD ........................................ 54
Figure 6-6: Basic Flow Diagram of Medupi FGD Process ............................................................. 56
Figure 6-7: Schematic drawing of proposed railway line and yard configuration ............................ 58
Figure 6-8: Proposed alignment and layout of the railyard infrastructure ....................................... 60
Figure 6-9: Proposed administration building and water booster pump station .............................. 61
Figure 6-10: Proposed diesel locomotive workshop and fuel storage area .................................... 62
Figure 6-11: Proposed security office and relocated security fence ............................................... 63
Figure 6-12: Conservancy tank sewerage systems located at the security office and
administration building .................................................................................................................. 64
Figure 6-13: Tippler, hopper and vault layout of the limestone offloading area .............................. 65
Figure 6-14: Inclined limestone conveyor from Tippler building below ground level ....................... 66
Figure 6-15: Elevated Limestone Truck Off-loading Facility and Hopper Arrangement .................. 66
Figure 6-16: Gypsum handling infrastructure and process ............................................................ 67
Figure 6-17: Proposed limestone handling infrastructure (Block 2) shaded in yellow.
Approximate locations of the two PCDs are indicated by the red star shapes. .............................. 69
Figure 6-18: Conveyor belt typical cross section ........................................................................... 70
Figure 6-19: Simplified process flow diagram for the FGD system ................................................ 74
Figure 6-20: Location of the WWTP and the Temporary Waste Handling Facility area (shown
in yellow) ....................................................................................................................................... 79
Figure 6-21: Layout and Extent of the clean water system ............................................................ 85
Figure 6-22: Layout and extent of the dirty water system .............................................................. 86
Figure 6-23: Delineated pre-development clean and dirty water catchments for the Main FGD
area .............................................................................................................................................. 87
Figure 6-24: Proposed catchments 1 and 5 for WWTP and associated waste storage area re-
designed as dirty water area (Alternative 1) .................................................................................. 88
Figure 6-25: Designated catchment remains a clean water catchment (Alternative 2) ................... 89
Figure 6-26: Clean and dirty water areas at Medupi FGD WWTP and WHSF. The WWTP is
located within the blue area while the WHSF will be located north of the WWTP. ......................... 91
23 May 2018 xi 12949
ZITHOLELE CONSULTING
Figure 6-27: Storm water management and PCD system for limestone and gypsum handling
area .............................................................................................................................................. 95
Figure 8-1: Photograph of the construction of the MPS ............................................................... 105
Figure 8-2: Monthly rainfall distribution for five rainfall stations in the Lephalale area .................. 106
Figure 8-3: Monthly mean, minimum, maximum evaporation for stations A4E003 and A4E007 .. 108
Figure 8-4: Period, day- and night-time wind roses for the period 2011-2013 (taken from von
Gruenewaldt, et al., 2018) ........................................................................................................... 109
Figure 8-5: Regional geology associated with the development area and surrounds .................. 112
Figure 8-6: Local Geology at the MPS ........................................................................................ 113
Figure 8-7: Dominant soils in the study area (excerpt from soils specialist study) ....................... 115
Figure 8-8: Regional soils profile in the area ............................................................................... 116
Figure 8-9: Land capability in the area ........................................................................................ 117
Figure 8-10: Land capability within the study area (excerpt from soils specialist study) ............... 119
Figure 8-11: Regional aquifer classification ................................................................................. 121
Figure 8-12: Hydrogeology Map .................................................................................................. 122
Figure 8-13: Quaternary catchments map ................................................................................... 125
Figure 8-14: Vegetation type within the study area ...................................................................... 128
Figure 8-15: Conservation status of the vegetation type within the study area ............................ 129
Figure 8-16: Vegetation Units for the study area (from Abell et. al. 2018) ................................... 132
Figure 8-17: Localities of Conservation Important Fauna surveyed in and around MPS (from
Abell et. al. 2018) ........................................................................................................................ 133
Figure 8-18: Locality map showing the study area for the wetland assessment .......................... 136
Figure 8-19: Extent of wetlands identified surrounding the MPS ................................................. 137
Figure 8-20: Location of identified NSRs surrounding the MPS ................................................... 143
Figure 8-21: Simulated equivalent continuous day-time rating level (LReq,d) for project activities
................................................................................................................................................... 144
Figure 8-22: Simulated equivalent continuous night-time rating level (LReq,n) for project activities
................................................................................................................................................... 144
Figure 8-23: Sensitive settlements and communities around the MPS ........................................ 146
Figure 8-24: Total Population of Lephalale LM 2001-2014 (adapted from Tomose, et al., 2018)
................................................................................................................................................... 148
Figure 8-25: Education levels within the Lephalale LM, Waterberg DM and Limpopo Province
(taken from Tomose, et al., 2018) ............................................................................................... 149
Figure 8-26: Diagnoses of those who went to seek medical assistance for Lephalale, Marapong
and Steenbokpan represented as average number per household (from Itzkin, 2015 as cited
by Tomose, et al., 2018) ............................................................................................................. 150
23 May 2018 xii 12949
ZITHOLELE CONSULTING
Figure 8-27: Sector Employment within Lephalale LM (taken from Tomose, et al., 2018) ........... 151
Figure 8-28: Aerial map of the area reflecting the location of a possible grave site between the
MPS and ADF ............................................................................................................................. 155
Figure 8-29: External road network to and from the MPS (taken from Venter, 2017) ................... 156
Figure 8-30: Access gates at the MPS ........................................................................................ 157
Figure 8-31: Internal road network at MPS .................................................................................. 157
Figure 8-32: PM peak hour traffic volumes – Nelson Mandela Drive/D1675 ................................ 158
Figure 12-1: Medupi Power Station study area with existing and proposed water quality
monitoring points......................................................................................................................... 221
Figure 13-1: Environmental Sensitivity Overlay Map ................................................................... 227
23 May 2018 xiii 12949
ZITHOLELE CONSULTING
LIST OF TABLES
Table 1-1: Environmental Impact Report Document Roadmap ........................................................ 1
Table 1-2: Existing authorisations, approvals and licences issued for the Medupi Power Station
....................................................................................................................................................... 7
Table 1-3: Details of the Environmental Assessment Practitioner ................................................... 9
Table 2-1: Assessment of the Need and Desirability of the Medupi FGD Retrofit Project .............. 12
Table 4-1 : Public places where the DEIR was available for public review .................................... 26
Table 4-2: Key comments raised and responses provided during the EIR Phase ......................... 27
Table 5-1: Description of Listed Activities ...................................................................................... 36
Table 5-2: National Ambient Air Quality Standards ....................................................................... 39
Table 5-3: Description of Water Uses ............................................................................................ 43
Table 5-4: List of additional applicable legislation.......................................................................... 43
Table 6-1: Description of the project development site .................................................................. 50
Table 6-2: Coordinates for the Medupi FGD Development Footprint within MPS .......................... 51
Table 8-1: Rainfall Stations in the Lephalale Area around the Medupi Power Station ................. 106
Table 8-2: Highest rainfall events measured at Stockport (POL) rainfall station .......................... 107
Table 8-3: 24 Hour Rainfall Depths for Different Recurrence Intervals (mm/day) ........................ 107
Table 8-4: Average monthly evaporation values for stations A4E003 and A4E007 ..................... 108
Table 8-5: RQOs and numerical limits for quaternary catchment A42J ....................................... 126
Table 8-6: Summary of faunal species richness in the study area as compared to a regional
scale (taken from Abell et. al. 2018) ............................................................................................ 130
Table 8-7: Wetland summary HGM Unit 2 (taken from Abell et. al. 2018) ................................... 138
Table 8-8: Summary of the data availability and compliance with NAAQS for the ambient data
measured at Lephalale (taken from von Gruenewaldt, et al., 2018) ............................................ 140
Table 8-9: Summary of the data availability and compliance with NAAQS for the ambient data
measured at Marapong (taken from von Gruenewaldt, et al., 2018) ............................................ 141
Table 8-10: Key population statistics in Lephalale LM (Lephalale LM, 2017)............................... 148
Table 8-11: Sanitation within the Lephalale LM (taken from Tomose, et al., 2018) ...................... 153
Table 8-12: possible grave site located between the MPS and ADF ........................................... 155
Table 10-1: Impacts identified by the soils and land capability specialist ..................................... 169
Table 10-2: Baseline Groundwater Quality .................................................................................. 169
Table 10-3: Impact identified by the groundwater specialist for the construction of FGD
infrastructure and railway yard .................................................................................................... 170
23 May 2018 xiv 12949
ZITHOLELE CONSULTING
Table 10-4: Summary of potential surface water impacts with respect to Medupi Power Station
................................................................................................................................................... 171
Table 10-5: Sensitivity rating of different habitats / floral communities in the study area (adapted
from Abell et. al. 2018) ................................................................................................................ 174
Table 10-6: Impact identified for the railway yard and FGD footprint area by biodiversity and
wetland specialists ...................................................................................................................... 175
Table 10-7: Impact identified for the MPS by air quality specialist ............................................... 177
Table 10-8: Impact identified for the MPS by the noise specialist ................................................ 178
Table 10-9: Impact identified for the railway yard and FGD footprint area by socio-economic
specialist ..................................................................................................................................... 181
Table 10-10: Impact identified for the railway yard and FGD footprint area by heritage,
archaeology and palaeontology specialists ................................................................................. 183
Table 10-11: Impact identified relating to traffic within the railway yard and FGD footprint .......... 184
Table 11-1: Criteria for the assessment of the extent of the impact. ............................................ 185
Table 11-2: Criteria for the rating of the duration of an impact ..................................................... 186
Table 11-3: Criteria for impact rating of potential intensity of a negative impact .......................... 186
Table 11-4: Criteria for the impact rating of potential intensity of a positive impact. ..................... 187
Table 11-5: Criteria for the rating of the likelihood of the impact occurring .................................. 187
Table 11-6: Significance rating formulas ..................................................................................... 188
Table 11-7: Example of Rating Scale ........................................................................ 188
Table 11-8: Impact assessment of FGD system on soil and land capacity .................................. 193
Table 11-9: Simplified Groundwater Risk Assessment to support specialist opinion ................... 196
Table 11-10: Impact assessment of FGD system on groundwater resources .............................. 196
Table 11-11: Impact assessment of railway yard and associated infrastructure on groundwater
resources .................................................................................................................................... 197
Table 11-12: Impact assessment of the FGD system, railway yard and associated
infrastructure on surface water resources ................................................................................... 199
Table 11-13: Impact assessment of the FGD system, railway yard and associated
infrastructure on biodiversity at the study site .............................................................................. 203
Table 11-14: Impact assessment of the FGD system, railway yard and associated
infrastructure on ambient air quality during operational phase .................................................... 207
Table 11-15: Impact assessment of the FGD system, railway yard and associated
infrastructure on ambient noise levels ......................................................................................... 208
Table 11-16: Impact assessment of the FGD system, railway yard and associated
infrastructure on socio-economic environment ............................................................................ 211
23 May 2018 xv 12949
ZITHOLELE CONSULTING
Table 11-17: Impact assessment of the FGD system, railway yard and associated
infrastructure on traffic to and from the MPS ............................................................................... 215
Table 12-1: Construction Phase – Soil Utilization Plan ................................................................ 217
Table 12-2: Operational Phase – Soil Conservation Plan ............................................................ 218
Table 12-3: Decommissioning Phase – Soil Conservation Plan .................................................. 218
Table 12-4: Existing surface water quality and quantity monitoring sites at Medupi ..................... 222
Table 12-5: Proposed surface water quality and quantity monitoring sites at Medupi .................. 222
23 May 2018 xvi 12949
ZITHOLELE CONSULTING
LIST OF APPENDICES
Appendix A: Amended EIA Application Form
Appendix B: EAP and Specialist CV’s and Declaration of Interest
Appendix C: Technical Design Reports
Appendix C-1: FGD Technology Study Report (2018)
Appendix C-2: FGD Basic Design Report
Appendix C-3: Rail Concept Design Report
Appendix C-4: Storm Water Management Conceptual Design Report
Appendix C-5: Medupi FGD WWTP Conceptual Report
Appendix D: Design Drawings and Maps
Appendix D-1: Relevant designs and layout drawings
Appendix D-2: Locality, Layout and Sensitivity Maps
Appendix D-3: Development Footprint Layout Maps
Appendix D-4: Environmental Sensitivity Overlay Map
Appendix E: Process Flow Diagrams for processes associated with FGD
Appendix F: Public Participation and Bridging Documents
Appendix F-1: Proof of Site Notice and Advert
Appendix F-2: Process Notification Letters
Appendix F-3: I&AP Database
Appendix F-4: Correspondence with I&AP’s
Appendix F-5: Comments Received
Appendix F-6: Presentations and minutes of the meeting
Appendix F-7: Comment and Responses Report
Appendix F-8: Bridging Document (Sep 2016)
Appendix F-9: Bridging Document (Nov 2017)
Appendix G: Specialist studies
Appendix G-1: Geotechnical Impact Assessment Report
Appendix G-2: Soils and Lang Capacity Assessment Report
Appendix G-3: Ground Water Impact Assessment Report
Appendix G-4: Surface Water Impact Assessment Report
Appendix G-5: Ecology and Wetland Assessment Report
Appendix G-6: Air Quality Impact Assessment Report
Appendix G-7: Noise Impact Assessment Report
Appendix G-8: Social Impact Assessment Report
Appendix G-9: Heritage Impact Assessment Report
Appendix G-10: Palaeontological Impact Assessment Report
Appendix G-11: Traffic Impact Assessment Report
Appendix G-12: Waste Assessment Report
Appendix H: Draft Environmental Management Programme
Appendix I: Relevant and Applicable Information
Appendix I-1: Letter from EnviroServ Waste Management (Pty) Ltd
23 May 2018 xvii 12949
ZITHOLELE CONSULTING
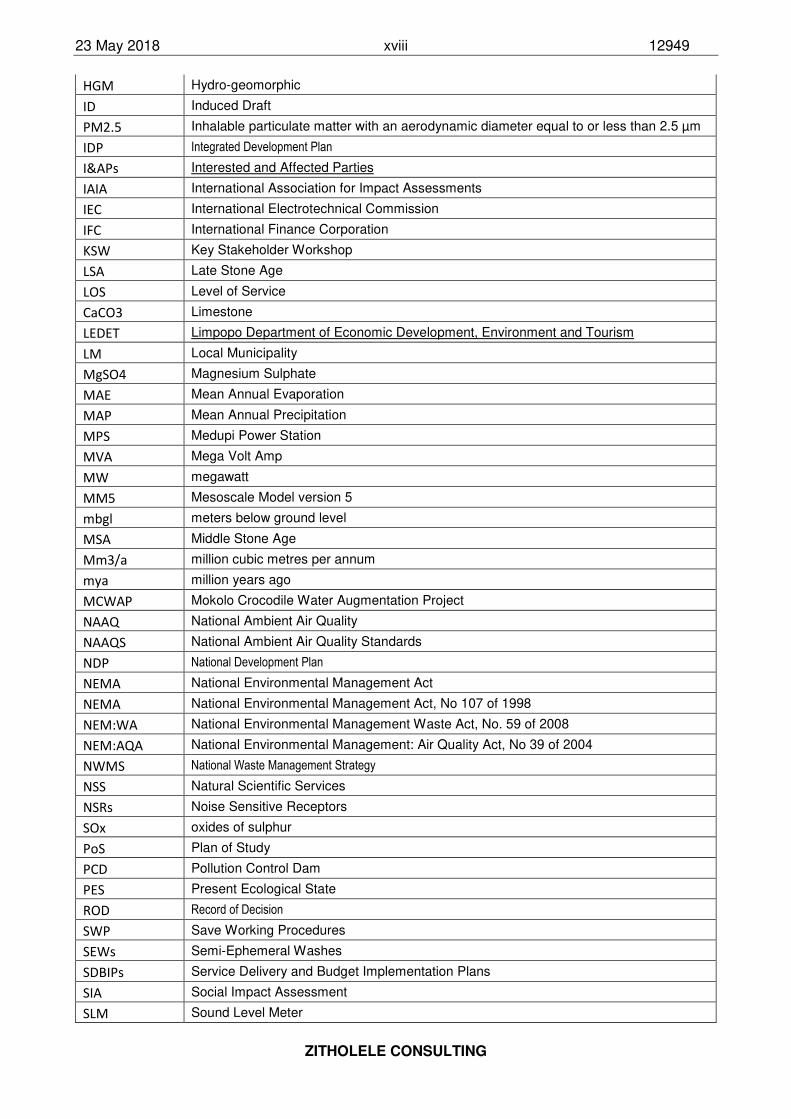
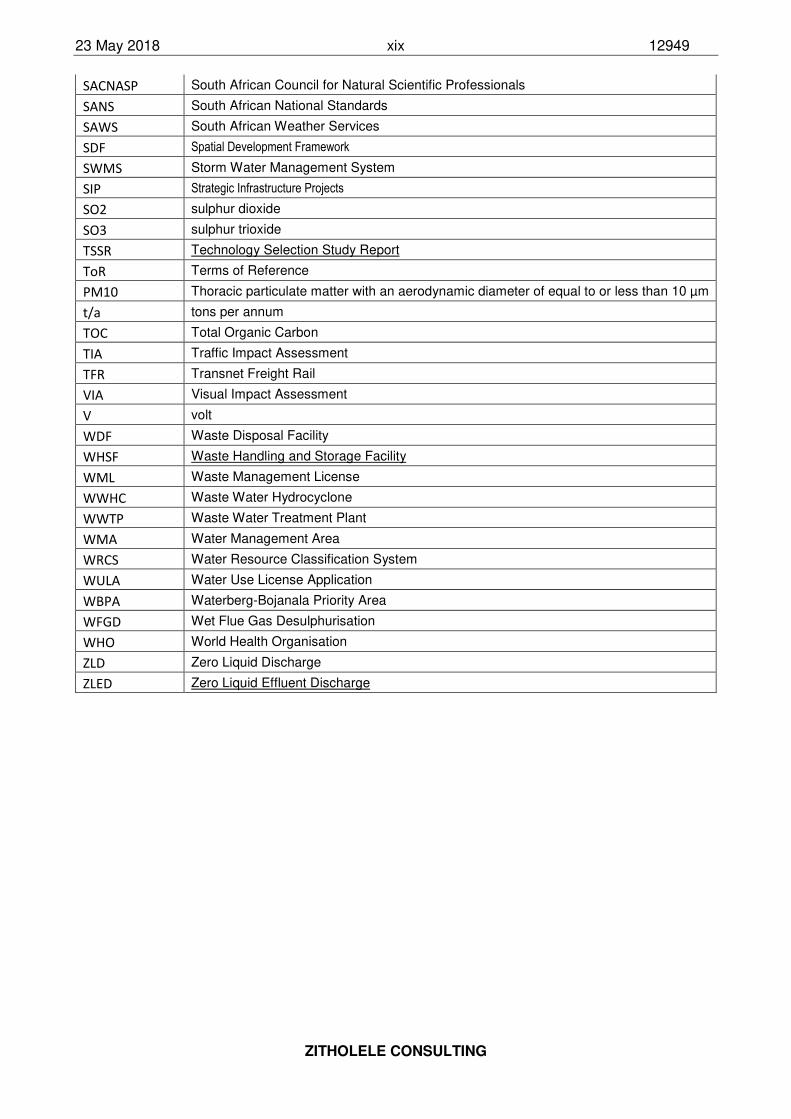
ABBREVIATIONS
ADF Ash Disposal Facility
AEL Atmospheric Emissions License
BCMR Boiler Maximum Continuous Rating
BMH Bulk Material Handling
CaCl2 Calcium Chloride
CaF2 Calcium Fluoride
CO carbon monoxide
CER Centre for Environmental Rights
CFB Circulating Fluidized Bed
CWD Clean Water Dam
CCCW Closed Cycle Cooling Water
CRR Comments and Responses Report
CA Competent Authority
CI Conservation Important
CBA Critical Biodiversity Area
dB decibels
DMS Degrees, Minutes and Seconds
DAFF Department of Agriculture, Forestry and Fisheries
DEA Department of Environmental Affairs
DWD Dirty Water Dam
DM District Municipality
DEIR Draft Environmental Impact Report
DEMPr Draft Environmental Management Programme
ESA Early Stone Age
EI Ecological Importance
ES Ecological Sensitivity
ESA Ecological Support Area
EAP Environmental Assessment Practitioner
EA Environmental Authorisation
EIA Environmental Impact Assessment
EIR Environmental Impact Report
EMC Environmental Monitoring Committee
EO Environmental Officer
FFP Fabric Filter Plant
FEIR Final Environmental Impact Report
FEIR Final Impact Assessment Report
FGC Flue Gas Cooler
FGC’s Flue Gas Cooler’s
FGD Flue Gas Desulfurization
FEPA Freshwater Ecosystem Priority Area
FSL Full Supply Level
Pty Golder Associates Africa
GN Government Notice
CaSO4•2H2O gypsum crystals
HIA Heritage Impact Assessment
23 May 2018 xviii 12949
ZITHOLELE CONSULTING
HGM Hydro-geomorphic
ID Induced Draft
PM2.5 Inhalable particulate matter with an aerodynamic diameter equal to or less than 2.5 µm
IDP Integrated Development Plan
I&APs Interested and Affected Parties
IAIA International Association for Impact Assessments
IEC International Electrotechnical Commission
IFC International Finance Corporation
KSW Key Stakeholder Workshop
LSA Late Stone Age
LOS Level of Service
CaCO3 Limestone
LEDET Limpopo Department of Economic Development, Environment and Tourism
LM Local Municipality
MgSO4 Magnesium Sulphate
MAE Mean Annual Evaporation
MAP Mean Annual Precipitation
MPS Medupi Power Station
MVA Mega Volt Amp
MW megawatt
MM5 Mesoscale Model version 5
mbgl meters below ground level
MSA Middle Stone Age
Mm3/a million cubic metres per annum
mya million years ago
MCWAP Mokolo Crocodile Water Augmentation Project
NAAQ National Ambient Air Quality
NAAQS National Ambient Air Quality Standards
NDP National Development Plan
NEMA National Environmental Management Act
NEMA National Environmental Management Act, No 107 of 1998
NEM:WA National Environmental Management Waste Act, No. 59 of 2008
NEM:AQA National Environmental Management: Air Quality Act, No 39 of 2004
NWMS National Waste Management Strategy
NSS Natural Scientific Services
NSRs Noise Sensitive Receptors
SOx oxides of sulphur
PoS Plan of Study
PCD Pollution Control Dam
PES Present Ecological State
ROD Record of Decision
SWP Save Working Procedures
SEWs Semi-Ephemeral Washes
SDBIPs Service Delivery and Budget Implementation Plans
SIA Social Impact Assessment
SLM Sound Level Meter
23 May 2018 xix 12949
ZITHOLELE CONSULTING
SACNASP South African Council for Natural Scientific Professionals
SANS South African National Standards
SAWS South African Weather Services
SDF Spatial Development Framework
SWMS Storm Water Management System
SIP Strategic Infrastructure Projects
SO2 sulphur dioxide
SO3 sulphur trioxide
TSSR Technology Selection Study Report
ToR Terms of Reference
PM10 Thoracic particulate matter with an aerodynamic diameter of equal to or less than 10 µm
t/a tons per annum
TOC Total Organic Carbon
TIA Traffic Impact Assessment
TFR Transnet Freight Rail
VIA Visual Impact Assessment
V volt
WDF Waste Disposal Facility
WHSF Waste Handling and Storage Facility
WML Waste Management License
WWHC Waste Water Hydrocyclone
WWTP Waste Water Treatment Plant
WMA Water Management Area
WRCS Water Resource Classification System
WULA Water Use License Application
WBPA Waterberg-Bojanala Priority Area
WFGD Wet Flue Gas Desulphurisation
WHO World Health Organisation
ZLD Zero Liquid Discharge
ZLED Zero Liquid Effluent Discharge
23 May 2018 1 12949
ZITHOLELE CONSULTING
1 INTRODUCTION
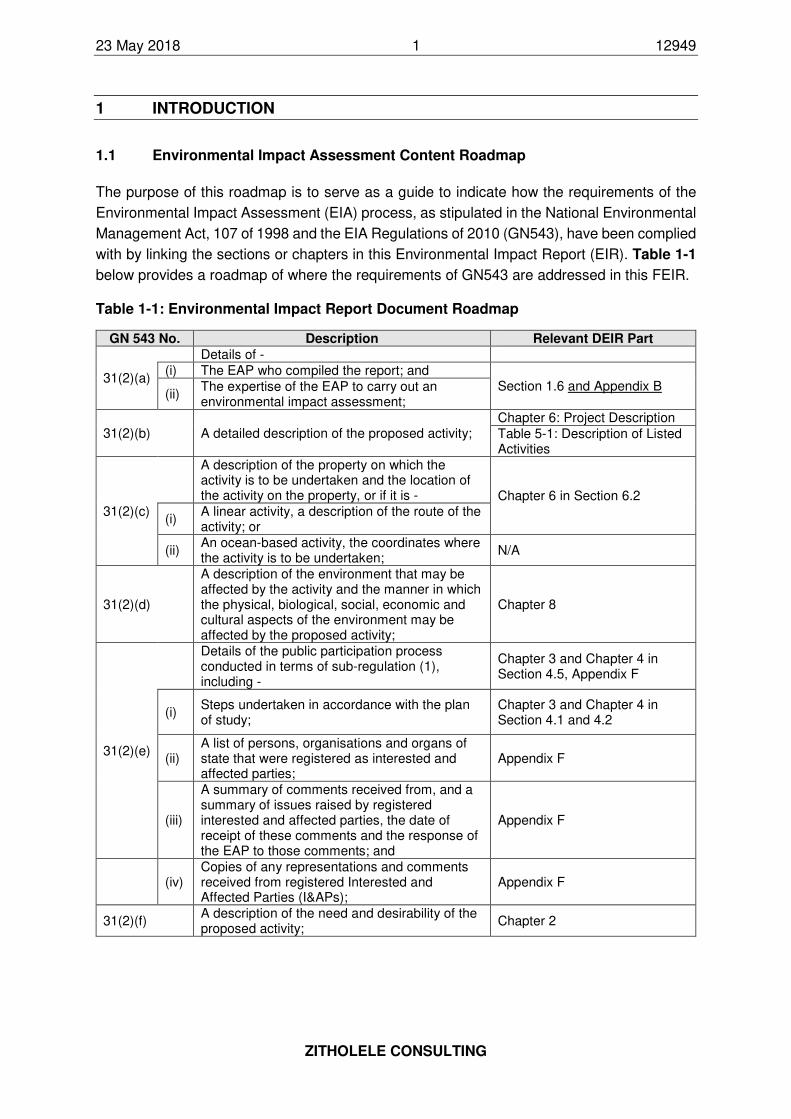
1.1 Environmental Impact Assessment Content Roadmap
The purpose of this roadmap is to serve as a guide to indicate how the requirements of the
Environmental Impact Assessment (EIA) process, as stipulated in the National Environmental
Management Act, 107 of 1998 and the EIA Regulations of 2010 (GN543), have been complied
with by linking the sections or chapters in this Environmental Impact Report (EIR). Table 1-1
below provides a roadmap of where the requirements of GN543 are addressed in this FEIR.
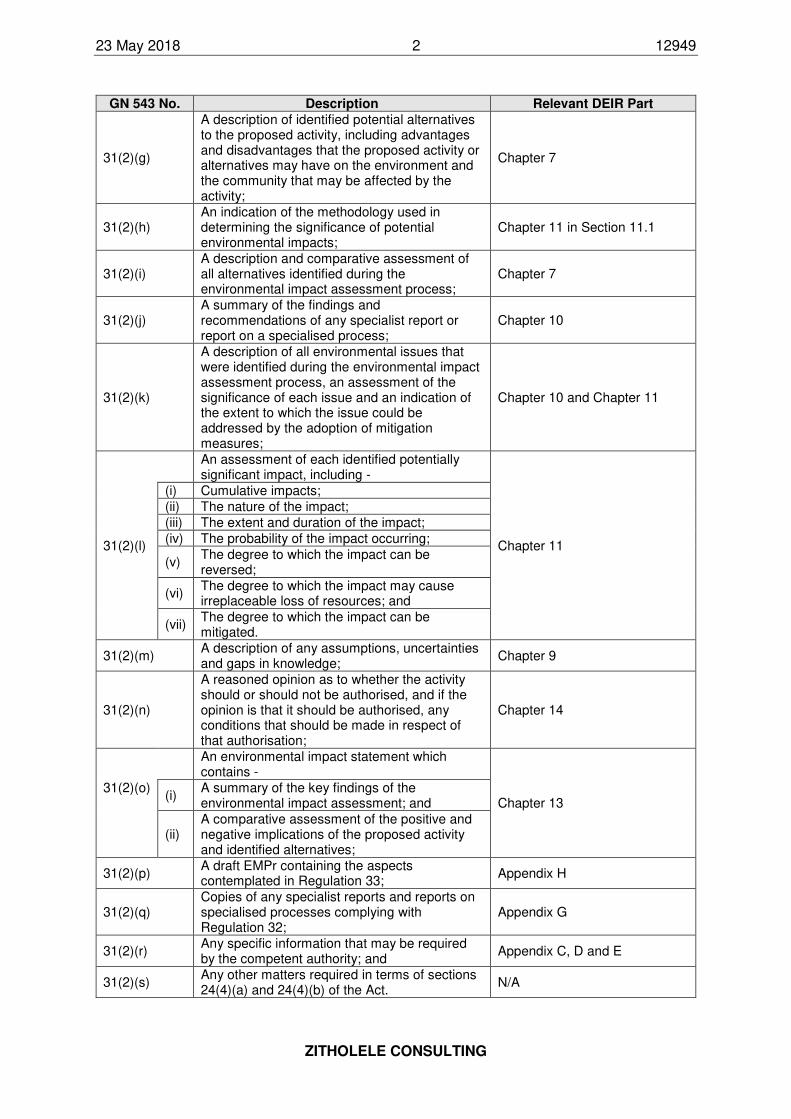
Table 1-1: Environmental Impact Report Document Roadmap
GN 543 No. Description Relevant DEIR Part
31(2)(a)
Details of - (i) The EAP who compiled the report; and
Section 1.6 and Appendix B (ii)
The expertise of the EAP to carry out an environmental impact assessment;
31(2)(b) A detailed description of the proposed activity; Chapter 6: Project Description Table 5-1: Description of Listed Activities
31(2)(c)
A description of the property on which the activity is to be undertaken and the location of the activity on the property, or if it is - Chapter 6 in Section 6.2
(i) A linear activity, a description of the route of the activity; or
(ii) An ocean-based activity, the coordinates where the activity is to be undertaken;
N/A
31(2)(d)
A description of the environment that may be affected by the activity and the manner in which the physical, biological, social, economic and cultural aspects of the environment may be affected by the proposed activity;
Chapter 8
31(2)(e)
Details of the public participation process conducted in terms of sub-regulation (1), including -
Chapter 3 and Chapter 4 in Section 4.5, Appendix F
(i) Steps undertaken in accordance with the plan of study;
Chapter 3 and Chapter 4 in Section 4.1 and 4.2
(ii) A list of persons, organisations and organs of state that were registered as interested and affected parties;
Appendix F
(iii)
A summary of comments received from, and a summary of issues raised by registered interested and affected parties, the date of receipt of these comments and the response of the EAP to those comments; and
Appendix F
(iv)
Copies of any representations and comments received from registered Interested and Affected Parties (I&APs);
Appendix F
31(2)(f) A description of the need and desirability of the proposed activity;
Chapter 2
23 May 2018 2 12949
ZITHOLELE CONSULTING
GN 543 No. Description Relevant DEIR Part
31(2)(g)
A description of identified potential alternatives to the proposed activity, including advantages and disadvantages that the proposed activity or alternatives may have on the environment and the community that may be affected by the activity;
Chapter 7
31(2)(h) An indication of the methodology used in determining the significance of potential environmental impacts;
Chapter 11 in Section 11.1
31(2)(i) A description and comparative assessment of all alternatives identified during the environmental impact assessment process;
Chapter 7
31(2)(j) A summary of the findings and recommendations of any specialist report or report on a specialised process;
Chapter 10
31(2)(k)
A description of all environmental issues that were identified during the environmental impact assessment process, an assessment of the significance of each issue and an indication of the extent to which the issue could be addressed by the adoption of mitigation measures;
Chapter 10 and Chapter 11
31(2)(l)
An assessment of each identified potentially significant impact, including -
Chapter 11
(i) Cumulative impacts; (ii) The nature of the impact; (iii) The extent and duration of the impact; (iv) The probability of the impact occurring;
(v) The degree to which the impact can be reversed;
(vi) The degree to which the impact may cause irreplaceable loss of resources; and
(vii) The degree to which the impact can be mitigated.
31(2)(m) A description of any assumptions, uncertainties and gaps in knowledge;
Chapter 9
31(2)(n)
A reasoned opinion as to whether the activity should or should not be authorised, and if the opinion is that it should be authorised, any conditions that should be made in respect of that authorisation;
Chapter 14
31(2)(o)
An environmental impact statement which contains -
Chapter 13 (i)
A summary of the key findings of the environmental impact assessment; and
(ii) A comparative assessment of the positive and negative implications of the proposed activity and identified alternatives;
31(2)(p) A draft EMPr containing the aspects contemplated in Regulation 33;
Appendix H
31(2)(q) Copies of any specialist reports and reports on specialised processes complying with Regulation 32;
Appendix G
31(2)(r) Any specific information that may be required by the competent authority; and
Appendix C, D and E
31(2)(s) Any other matters required in terms of sections 24(4)(a) and 24(4)(b) of the Act.
N/A
23 May 2018 3 12949
ZITHOLELE CONSULTING
1.2 Project Background
This project focuses on the environmental authorisation process for the Medupi Power Station
Flue Gas Desulphurisation (FGD) Retrofit project and associated infrastructure. In the sub-
sections below, background is provided about the Medupi Power Station (MPS), which is
currently under construction.
Medupi Power Station (MPS)
Medupi Power Station is a greenfield coal-fired power station that forms part of the Eskom
New Build Programme. Medupi Power Station is the fourth dry-cooled based-load power
station in South Africa, following Kendal, Majuba and Matimba Power Stations.
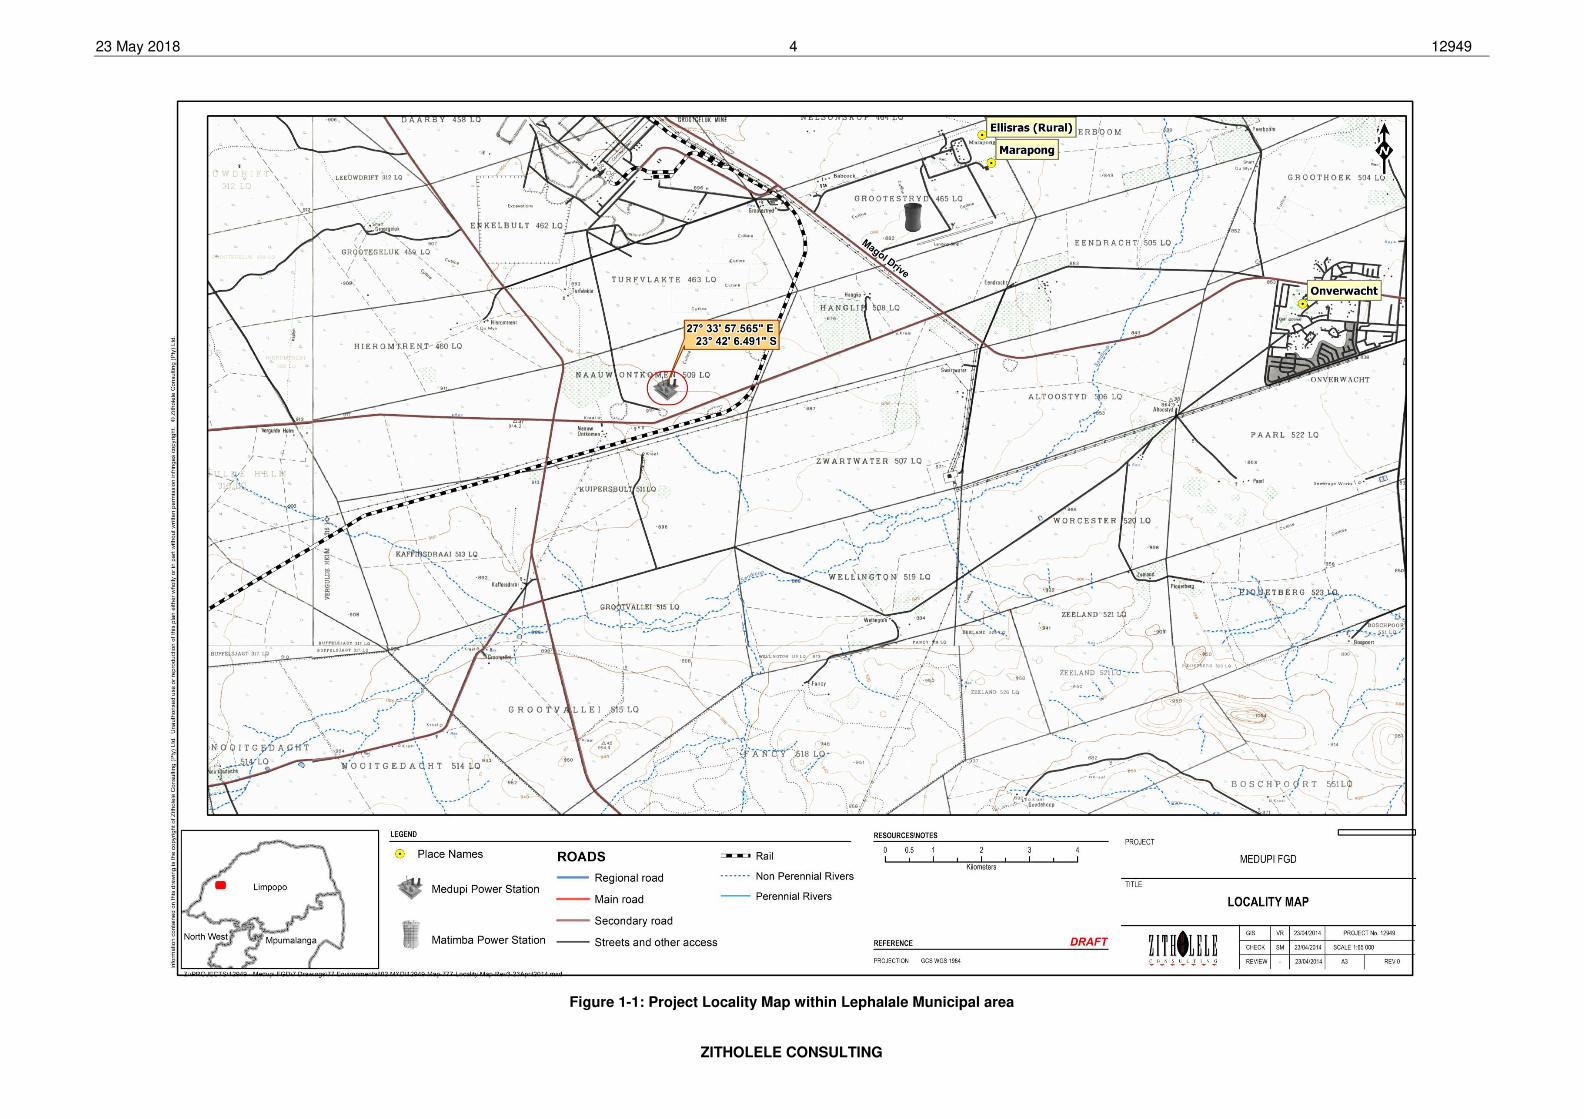
Medupi Power Station is located about 15km west of the town of Lephalale in the Limpopo
Province. Refer to Figure 1-1 for the locality map indicating the position of the Medupi Power
Station within the Lephalale Municipal area. The Power Station is situated on 883 hectares
that was historically operated as a game and livestock farm (Bohlweki Environmental, 2006).
Medupi Power Station has an installed generation capacity of 6 x 800 megawatt (MW) units
and utilises a supercritical boiler and turbine technology designed to operate at higher
temperatures and pressures, which allows for better efficiency of the power station. The result
is an improvement of approximately 2 percentage points on the plant efficiency which equates
to a reduced coal consumption of approximately 1 million tons per annum and resultant
reduction in relevant emissions.
Due to the low availability of water in the area, Eskom designed this station as a dry cooled
station, and is anticipated that it will use approximately 0.16 litres of water per kWh of electricity
produced. This water use is expected to increase by an additional 0.2 litres of water per kWh
when the wet Flue Gas Desulphurisation (FGD) plant is retrofitted. The MPS was furthermore
designed to be FGD ready, initially allowing space in its design to install the FGD infrastructure
once minimum emissions standards were promulgated.
During electricity generation, each generation unit produces gases that are channelled via
ducts, called flues, to one of 2 chimneys where these gases, also referred to as flue gases,
are released into the atmosphere. Each chimney receives flue gasses from three (3)
generating units, simultaneously.
The power station is currently under both construction and operational phase, with units 4, 5
and 6 already commissioned and operational while construction of units 1, 2 and 3 is on-going.
23 May 2018 4 12949
ZITHOLELE CONSULTING
Figure 1-1: Project Locality Map within Lephalale Municipal area
23 May 2018 5 12949
ZITHOLELE CONSULTING
Generation of SO2 at the coal-fired power station
In coal-fired power stations, electricity is generated through combustion of coal. Coal is
composed, primarily, of carbon along with variable quantities of other elements, chiefly
hydrogen, sulphur, oxygen, and nitrogen. When coal is burned, the sulphur combines with
oxygen to form oxides of sulphur (SOx), which include sulphur dioxide (SO2) and sulphur
trioxide (SO3) (Eskom Holdings SOC Limited, 2017).
SO2 contributes to the formation of acid rain, which damages forests, crops, buildings, fences
and acidifies lakes, streams, and rivers, making them unsuitable for aquatic plant and animal
life. In addition, inhalation of high concentrations of SO2 irritates the nose, throat, and airways
to cause coughing, wheezing, shortness of breath, or a tight feeling around the chest.
Stringent air quality regulations have been implemented worldwide to combat the emissions
of SOx. Since the major emission of SOx is by coal-fired power stations, removing sulphur from
the flue gas is a common technique for reducing these emissions (US EPA, 2016).
The six generating units at Medupi Power Station have been designed and constructed to
accommodate the installation of wet limestone Flue Gas Desulphurisation technology which
is a sulphur dioxide (SO2) abatement technology. Each of the six generating units of the Power
Station operates independently.
Flue Gas Desulphurisation
Flue Gas Desulfurization (FGD) is a technology used to remove SO2 from exhaust flue gases
of fossil-fuel (coal) power plants, and from the emissions of other sulphur oxide emitting
processes. Medupi Power Station was designed and constructed to be wet FGD / wet
scrubbing ready, utilising limestone as a sorbent.
In wet FGD systems, the flue gas normally passes first through a fly ash removal device, which
may be either an electrostatic precipitator or a wet scrubber, and then into the SO2-absorber
that removes SO2 from the flue gas through wet scrubbing. The sorbent that will be utilised
for Medupi FGD Retrofit Project is Limestone (CaCO3).
Wet scrubbing is a process where spray towers spray hydrated lime in the form of water
droplets into the scrubbing chamber, thereby allowing a reaction between the hydrated lime
and SO2 in order to react with the SO2 into gypsum, which is then collected and processed.
The remaining flue gas thereafter returns to the chimney stack and is released into the
atmosphere with more than 90% reduction of SO2 content expected.
An important design consideration associated with wet FGD systems is that the flue gas exiting
the absorber is saturated with water and still contains some SO2. These gases are highly
corrosive to any downstream equipment such as fans, ducts, and stacks. Since the SO2 is an
acid gas the typical sorbents or other materials used to remove the SO2 from the flue gases
are alkaline.
23 May 2018 6 12949
ZITHOLELE CONSULTING
Existing infrastructure at Medupi Power Station (MPS) associated with FGD
system
Medupi Power Station units were designed, and constructed, with provisions incorporated into
the space and equipment designed to accommodate the installation of the wet limestone FGD
system. Each of the six generating units of the Power Station operates independently, while
common facilities for all 6 generation units are provided for electricity, water, coal supply and
coal combustion waste disposal.
Each generating unit is constructed with fabric filters and Induced Draft (ID) fans. The fabric
filters remove most of the particulates from the coal combustion process and the ID fans
provide necessary draft to overcome system resistance. The ID fans were designed to
accommodate additional system resistance expected due to the installation of the FGD
equipment (Harris, 2014).
The ID fans currently discharge flue gas directly to the chimney from each of the three (3)
generating units linked to each chimney. The FGD system will include additional dampers and
ductwork to divert the flue gas to the FGD absorbers and then return it to the chimney. The
chimney flues are lined with corrosion-resistant liners to handle saturated flue gas expected
from the operation of the FGD systems.
The inside diameter of the existing flues is adequate to cater for the flue gas volumes, while
the existing chimneys will be reused with minor modification. The liner associated with the
chimneys has sufficient transitional velocity for condensation re-entrainment to withstand the
calculated worst-case design so that re-entrainment of moisture droplets will not occur.
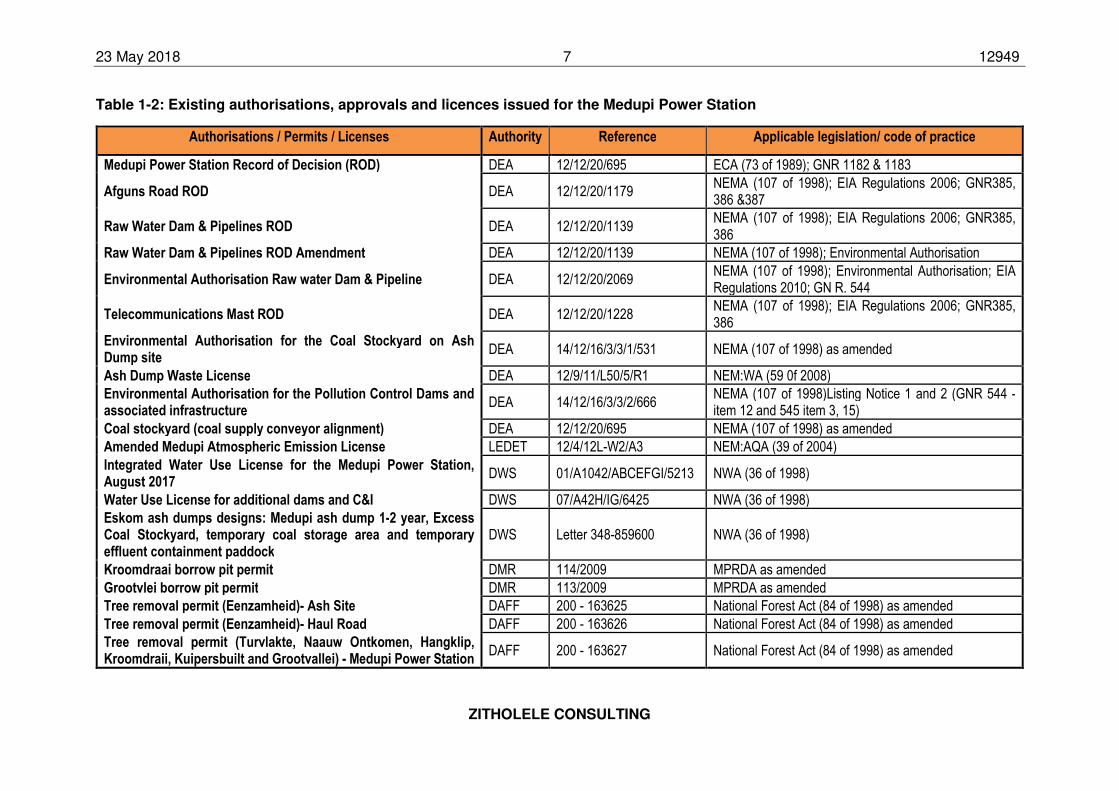
1.3 Existing authorisations, licences and approvals
Medupi Power Station received an environmental authorisation and other relevant licenses for
construction and operation. One of these licences, the Atmospheric Emission License (AEL),
which was received in 2012, had conditions which require that the SO2 emissions from the
Power Station be reduced by more than 90%. This is one of the key reasons for the installation
of the FGD retrofit.
All existing authorisations, approvals and licences received for the Medupi Power Station are
summarised in Table 1-2 below.
23 May 2018 7 12949
ZITHOLELE CONSULTING
Table 1-2: Existing authorisations, approvals and licences issued for the Medupi Power Station
Authorisations / Permits / Licenses Authority Reference Applicable legislation/ code of practice
Medupi Power Station Record of Decision (ROD) DEA 12/12/20/695 ECA (73 of 1989); GNR 1182 & 1183
Afguns Road ROD DEA 12/12/20/1179 NEMA (107 of 1998); EIA Regulations 2006; GNR385, 386 &387
Raw Water Dam & Pipelines ROD DEA 12/12/20/1139 NEMA (107 of 1998); EIA Regulations 2006; GNR385, 386
Raw Water Dam & Pipelines ROD Amendment DEA 12/12/20/1139 NEMA (107 of 1998); Environmental Authorisation
Environmental Authorisation Raw water Dam & Pipeline DEA 12/12/20/2069 NEMA (107 of 1998); Environmental Authorisation; EIA Regulations 2010; GN R. 544
Telecommunications Mast ROD DEA 12/12/20/1228 NEMA (107 of 1998); EIA Regulations 2006; GNR385, 386
Environmental Authorisation for the Coal Stockyard on Ash Dump site
DEA 14/12/16/3/3/1/531 NEMA (107 of 1998) as amended
Ash Dump Waste License DEA 12/9/11/L50/5/R1 NEM:WA (59 0f 2008)
Environmental Authorisation for the Pollution Control Dams and associated infrastructure
DEA 14/12/16/3/3/2/666 NEMA (107 of 1998)Listing Notice 1 and 2 (GNR 544 -item 12 and 545 item 3, 15)
Coal stockyard (coal supply conveyor alignment) DEA 12/12/20/695 NEMA (107 of 1998) as amended
Amended Medupi Atmospheric Emission License LEDET 12/4/12L-W2/A3 NEM:AQA (39 of 2004)
Integrated Water Use License for the Medupi Power Station, August 2017
DWS 01/A1042/ABCEFGI/5213 NWA (36 of 1998)
Water Use License for additional dams and C&I DWS 07/A42H/IG/6425 NWA (36 of 1998)
Eskom ash dumps designs: Medupi ash dump 1-2 year, Excess Coal Stockyard, temporary coal storage area and temporary effluent containment paddock
DWS Letter 348-859600 NWA (36 of 1998)
Kroomdraai borrow pit permit DMR 114/2009 MPRDA as amended
Grootvlei borrow pit permit DMR 113/2009 MPRDA as amended
Tree removal permit (Eenzamheid)- Ash Site DAFF 200 - 163625 National Forest Act (84 of 1998) as amended
Tree removal permit (Eenzamheid)- Haul Road DAFF 200 - 163626 National Forest Act (84 of 1998) as amended
Tree removal permit (Turvlakte, Naauw Ontkomen, Hangklip, Kroomdraii, Kuipersbuilt and Grootvallei) - Medupi Power Station
DAFF 200 - 163627 National Forest Act (84 of 1998) as amended
23 May 2018 8 12949
ZITHOLELE CONSULTING
1.4 Overview of Medupi FGD Retrofit Project
The current environmental authorisation process aims at describing the FGD retrofit process,
identifying potential impacts of this process and providing management and mitigation
recommendations. Throughout the Environmental Impact Assessment (EIA) under the
National Environmental Management Act (NEMA) (Act 107 of 1998 as amended), information
on the design, activities and impacts was investigated and documented to inform public
comment and authority decision making. The environmental authorisation process was
carried out in three phases:
1. The Project Inception;
2. Scoping Phase;
3. Impact Assessment Phase.
The process is currently in the Impact Assessment Phase, the objective of which is to assess
significance of impacts generated to the environment and propose mitigation. During this
phase specialist consultants undertake investigative work to rate the significance on an impact
and to identify an effective mitigation initiative, and ascertain the efficacy of the mitigation to
residual environmental impacts.
1.5 Proponent
Eskom Holdings SOC Limited (referred to hereafter as Eskom) is the largest South African
utility that generates, transmits and distributes electricity. Eskom supplies approximately 95%
of the country's electricity, as well as about 45% of the electricity used in Africa. The utility is
the largest producer of electricity in Africa, is among the top seven utilities in the world in terms
of generation capacity and among the top nine in terms of sales. Eskom plays a major role in
accelerating growth in the South African economy by providing a high-quality and reliable
supply of electricity.
To meet the growing demands for electricity in South Africa, Eskom has re-commissioned
three mothballed power stations, upgraded existing facilities and built new infrastructure,
including transmission lines and two renewable energy plants.
Additionally, Eskom initiated the building of additional power stations, including Medupi Power
Station, Kusile Power Station and the Ingula Pumped Storage Scheme, as part of the new
build programme to cater for the anticipated future electricity demands. The Eskom capacity
expansion budget was estimated at R385 billion up to 2013 and is expected to grow to more
than a trillion rand by 2026. Through the capacity expansion programme Eskom will double
its capacity to 80 000MW by 2026.
1.6 Details of Environmental Assessment Practitioner
Eskom appointed Zitholele Consulting (Pty) Ltd. to undertake the regulatory Environmental
Authorisation (EA), amendment of existing Waste Management License (WML) Application
23 May 2018 9 12949
ZITHOLELE CONSULTING
and Water Use License Application (WULA) processes for the proposed Medupi FGD Retrofit
Project. These processes are being undertaken independently as separate processes. This
document deals with the Environmental Impact Assessment process for the proposed Medupi
FGD Retrofit Project
Zitholele Consulting (Pty) Ltd. is an empowerment company formed to provide specialist
consulting services primarily to the public sector in the fields of Water Engineering, Integrated
Water Resource Management, Environmental and Waste Services, Communication (public
participation and awareness creation) and Livelihoods and Economic Development. Zitholele
Consulting (Pty) Ltd has no vested interest in the proposed project and hereby declares its
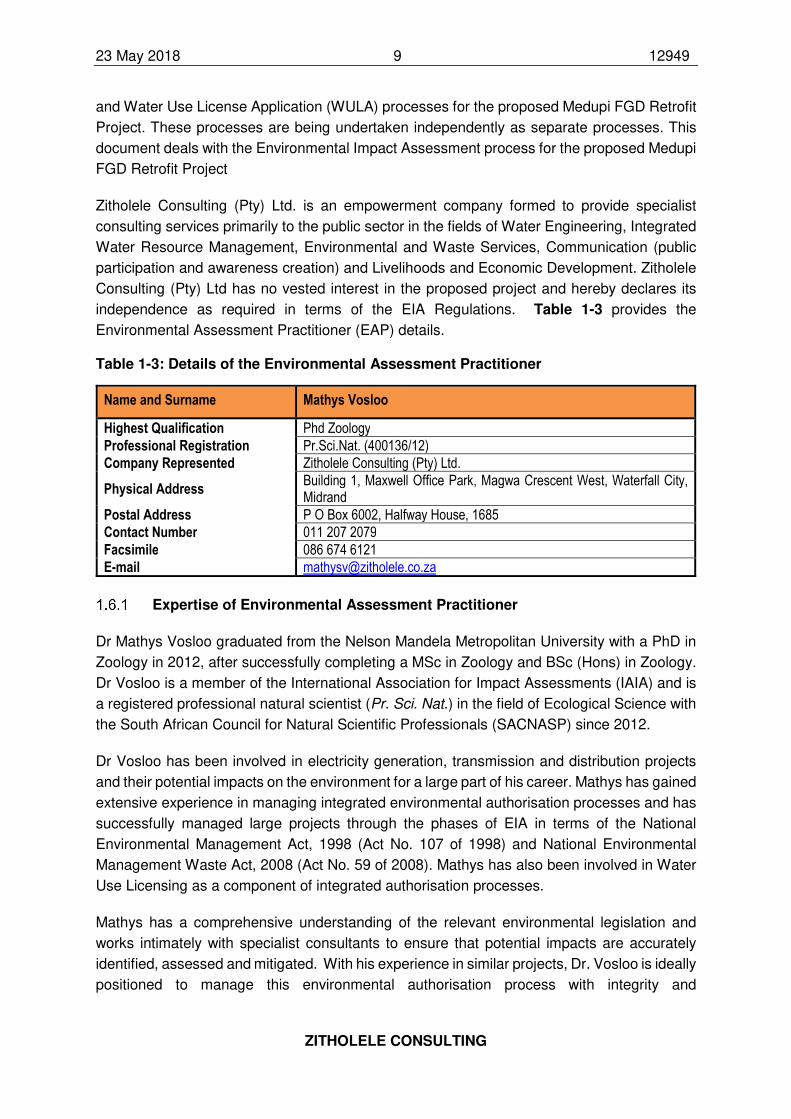
independence as required in terms of the EIA Regulations. Table 1-3 provides the
Environmental Assessment Practitioner (EAP) details.
Table 1-3: Details of the Environmental Assessment Practitioner
Name and Surname Mathys Vosloo
Highest Qualification Phd Zoology
Professional Registration Pr.Sci.Nat. (400136/12)
Company Represented Zitholele Consulting (Pty) Ltd.
Physical Address Building 1, Maxwell Office Park, Magwa Crescent West, Waterfall City, Midrand
Postal Address P O Box 6002, Halfway House, 1685
Contact Number 011 207 2079
Facsimile 086 674 6121
E-mail [email protected]
Expertise of Environmental Assessment Practitioner
Dr Mathys Vosloo graduated from the Nelson Mandela Metropolitan University with a PhD in
Zoology in 2012, after successfully completing a MSc in Zoology and BSc (Hons) in Zoology.
Dr Vosloo is a member of the International Association for Impact Assessments (IAIA) and is
a registered professional natural scientist (Pr. Sci. Nat.) in the field of Ecological Science with
the South African Council for Natural Scientific Professionals (SACNASP) since 2012.
Dr Vosloo has been involved in electricity generation, transmission and distribution projects
and their potential impacts on the environment for a large part of his career. Mathys has gained
extensive experience in managing integrated environmental authorisation processes and has
successfully managed large projects through the phases of EIA in terms of the National
Environmental Management Act, 1998 (Act No. 107 of 1998) and National Environmental
Management Waste Act, 2008 (Act No. 59 of 2008). Mathys has also been involved in Water
Use Licensing as a component of integrated authorisation processes.
Mathys has a comprehensive understanding of the relevant environmental legislation and
works intimately with specialist consultants to ensure that potential impacts are accurately
identified, assessed and mitigated. With his experience in similar projects, Dr. Vosloo is ideally
positioned to manage this environmental authorisation process with integrity and

23 May 2018 10 12949
ZITHOLELE CONSULTING
independence, while advising the client toward alternatives that have less potential for
environmental impact. Dr Vosloo’ CV is attached to this report as Appendix B.
23 May 2018 11 12949
ZITHOLELE CONSULTING
2 NEED AND DESIRABILITY OF THE PROJECT
2.1 Environmental and Health Motivation
One of the most significant air quality impacts of coal-fired electricity generation is the emission
of SO2 to the atmosphere. SO2 reacts with other compounds in the environment to form
particles that are a risk to human health. These small particles penetrate the tissue of the
lungs and can cause emphysema and bronchitis and can aggravate existing heart disease
(UN Environmental Protection Agency; 2014). Evidence has been documented of a
connection between short term SO2 exposure and adverse respiratory symptoms, including
bronchoconstriction and aggravated asthma.
At Medupi Power Station the uncontrolled SO2 emissions for the design coal will be about
3,405mg/Nm3, dry at 6% O2. The Air Quality Act currently stipulates that the SO2 emissions
limit for existing plants is 3,500mg/Nm3 at 10% O2 by 31st March 2015, and 500mg/Nm3 at
10% O2 by 1st April 2020.
The flue gas desulphurisation process proposed for retrofit at the power station will reduce the
SO2 emissions by more than 90%. This brings the emissions to below the environmental
protection threshold and reduces the impacts of the power station on the environment.
2.2 Socio-Economic Motivation
It must be noted that the Medupi Power Station is funded by the World Bank. In complying
with one of the conditions of the World Bank loan agreement, Medupi Power Station must
effectively reduce SO2 emissions. The Medupi Power Station is part of an integral building
plan to ensure that Eskom can meet the electricity demand projected for the future. Eskom
must double its capacity to 80 000MW by 2026 for this purpose (Eskom website; 2014).
Medupi Power Station will increase the current Eskom generation capacity by 4 800MW. This
is crucial to addressing the electricity demand in South Africa. This will significantly impact on
the provision of basic services to a large percentage of the South African population.
Electricity brown-outs and black-outs have considerable social effects, which are most
devastating on the low-income populations. These include compromise of health and safety
to vulnerable communities. Furthermore, the loss of consistent electricity supply has massive
repercussions on industry and economics of the country. Short and medium term unreliable
electricity supply may have devastating impacts to large and small businesses due to loss in
production and damage to equipment. This in turn will have a definite implication on our
country’s economy.
The reduction in SO2 emissions by the FGD plant will mitigate potentially significant health
impacts associated with SO2 emissions. This is an important motivation for FGD, in terms of
human health and welfare for the communities residing especially near the Medupi Power

23 May 2018 12 12949
ZITHOLELE CONSULTING
Station, and in line with Section 24 of the Constitution, greater Waterberg-Bojanala Priority
Area.
2.3 Need and Desirability
In accordance with the Regulation 31(2)(f) of the National Environmental Management Act,
1998 (Act No. 107 of 1998) Environmental Impact Assessment Regulations published in
Government Notice No. R.543, this part of the Environmental Impact Report provides a
detailed account of the Need and Desirability of the proposed Medupi FGD Retrofit project.
In considering the need and desirability of the proposed project, the strategic concept of the
project along with the broader societal needs and public interest has been taken into account.
In the Guideline on Need and Desirability (DEA, 2010) a number of questions formulated to
guide the identification of the Need and Desirability of a proposed development are provided.
The information provided in Table 2-1 affords answers specific to the project at hand for each
of the guiding questions contained in the Guideline on Need and Desirability (DEA, 2010).
Table 2-1: Assessment of the Need and Desirability of the Medupi FGD Retrofit Project
No. Question Description Answer
1.
Is the land use (associated with the activity being applied for) considered within the timeframe intended by the existing approved Spatial Development Framework (SDF) agreed to by the relevant authority?
Medupi Power Station received all necessary permitting for its current status and is currently in construction phase. Therefore, it is evident that industrial development to promote economic growth and improvement to human welfare, in terms of provision of electricity, is an acceptable land use to the authorities for the period that the Medupi Power Station will operate. The Flue Gas Desulphurisation retrofit project is a supplement to Medupi Power Station to mitigate SO2 emissions to an acceptable level.
Yes
2.
Should the development, or if applicable, expansion of the town / area concerned in terms of this land use (associated with the activity being applied for) occur here at this point in time.
Since the Flue Gas Desulphurisation Project is a supplement to the existing and approved Medupi Power Station in order to mitigate SO2 emissions from the operation of the power station, it is imperative that the Flue Gas Desulphurisation retrofit is implemented and operational at the power station 6 years after each power station unit becomes operational.
Yes
3.
Does the community / area need the activity and the associated land use concerned (is it a societal priority)?
The Flue Gas Desulphurisation retrofit is proposed to mitigate the potential health impacts of the Medupi Power Station SO2 emissions on the airshed and the local/affected communities. Therefore, the community does indeed need this project to go-ahead as a societal priority in order to protect human welfare.
Yes
4.
Are the necessary services with adequate capacity currently available or must additional capacity be created to cater for the development?
Electricity supply will be made available by Eskom itself to power the FGD system at the Medupi Power Station. Sewage and waste water treatment infrastructure will be constructed as part of the development to cater for these services. Potable water will furthermore be procured via the existing raw water treatment plant associated with Medupi Power
Yes
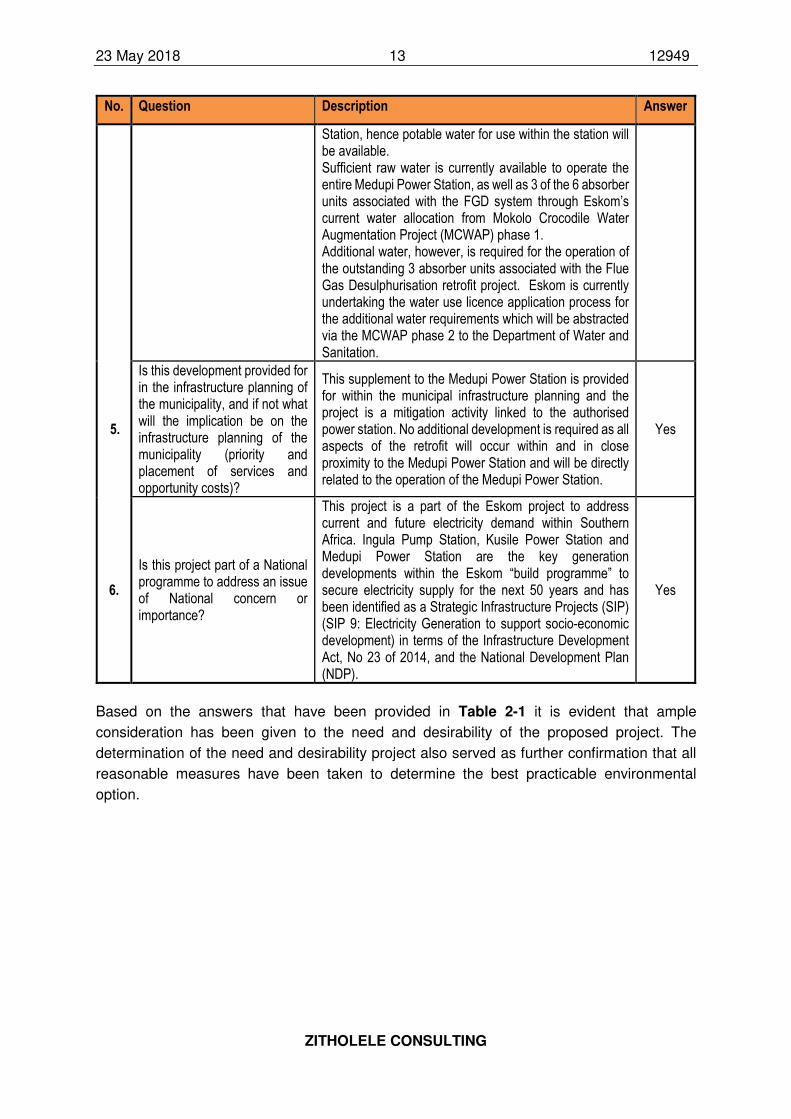
23 May 2018 13 12949
ZITHOLELE CONSULTING
No. Question Description Answer
Station, hence potable water for use within the station will be available. Sufficient raw water is currently available to operate the entire Medupi Power Station, as well as 3 of the 6 absorber units associated with the FGD system through Eskom’s current water allocation from Mokolo Crocodile Water Augmentation Project (MCWAP) phase 1. Additional water, however, is required for the operation of the outstanding 3 absorber units associated with the Flue Gas Desulphurisation retrofit project. Eskom is currently undertaking the water use licence application process for the additional water requirements which will be abstracted via the MCWAP phase 2 to the Department of Water and Sanitation.
5.
Is this development provided for in the infrastructure planning of the municipality, and if not what will the implication be on the infrastructure planning of the municipality (priority and placement of services and opportunity costs)?
This supplement to the Medupi Power Station is provided for within the municipal infrastructure planning and the project is a mitigation activity linked to the authorised power station. No additional development is required as all aspects of the retrofit will occur within and in close proximity to the Medupi Power Station and will be directly related to the operation of the Medupi Power Station.
Yes
6.
Is this project part of a National programme to address an issue of National concern or importance?
This project is a part of the Eskom project to address current and future electricity demand within Southern Africa. Ingula Pump Station, Kusile Power Station and Medupi Power Station are the key generation developments within the Eskom “build programme” to secure electricity supply for the next 50 years and has been identified as a Strategic Infrastructure Projects (SIP) (SIP 9: Electricity Generation to support socio-economic development) in terms of the Infrastructure Development Act, No 23 of 2014, and the National Development Plan (NDP).
Yes
Based on the answers that have been provided in Table 2-1 it is evident that ample
consideration has been given to the need and desirability of the proposed project. The
determination of the need and desirability project also served as further confirmation that all
reasonable measures have been taken to determine the best practicable environmental
option.
23 May 2018 14 12949
ZITHOLELE CONSULTING
3 PLAN OF STUDY (SCOPING PHASE)
3.1 Introduction
The Medupi Power Station received environmental authorisation in 2007. The Air Emissions
Licence (AEL) was received by the Power Station in 2012 and stipulated conditions requiring
the SO2 emissions from the Power Station to be reduced by more than 90%. This is one of
the key reasons for the initiation of the FGD retrofit.
Eskom appointed Zitholele Consulting in 2013 as an independent Environmental Assessment
Practitioner (EAP) to undertake the EIA for the retrofit of the Medupi FGD system. Zitholele
undertook a scoping phase during which a number of aspects related to the development of
the Medupi FGD were considered. The Scoping Phase concluded with the submission of a
Scoping Report to the Department of Environmental Affairs (DEA), which was subsequently
accepted with Plan of Study approved, thus setting the scene for the environmental impact
reporting phase to follow.
The approved Plan of Study is summarised in the following sections.
3.2 Proposed Plan of Study
The Plan of Study (PoS) for the EIR phase identified specialist studies that would be
undertaken, detailed terms of reference for each specialist study, the proposed impact
assessment methodology to be used, proposed public participation process that would be
followed during the EIR phase, as well as the steps that will be followed during the EIR phase
up to the submission of the Final Impact Assessment Report (FEIR) and announcement of the
Competent Authority’s decision.
A summary of the proposed actions relating to the proposed specialist studies as discussed
in the PoS are provided below.
Utilisation of existing specialist studies
Considering that existing studies were undertaken for environmental aspects within the MPS
footprint where the FGD infrastructure is earmarked to be constructed, the Plan of Study
proposed that original specialist studies be utilised for the purposes of the FGD EIA process.
These existing studies included:
• Soils, land capability and agricultural potential;
• Geology and Geotechnical investigations (Phase 1 geotechnical investigations);
• Surface water resources (aquatic) and wetlands (including wetlands delineation);
• Groundwater resources;
• Noise pollution;
• Visual impact;
23 May 2018 15 12949
ZITHOLELE CONSULTING
• Ecology (Terrestrial flora and fauna and Avifauna assessment);
• Heritage impact studies;
• Traffic impact studies; and
• Socio-economic investigations.
Only summaries of these studies could be obtained and no detailed studies received. As such
these studies could not be utilised. Furthermore, due to process delays these studies moved
out of the 5 year validity period and could therefore not be utilised.
Proposed specialist studies
Detailed terms of reference were provided in the PoS for the following specialist studies:
1. Waste Classification: The waste classification study would include the classification of ash,
FGD gypsum, FGD WWTP sludge, and FGD WWTP Crystalliser Solids.
2. Socio-economic Impact Assessment for the proposed Medupi Flue Gas Desulphurisation
Retrofit project. The focus of this SIA is on the impacts that the project is expected to have
on the local socio-economic environment.
3. Ecology Assessment for Railway yard and Limestone off-loading area: This would include
assessment of floristic and faunal species composition, assemblages, communities, red
data probabilities and general environmental attributes.
4. Air Quality Assessment for the assessment of the impact of the FGD system on the
surrounding air quality and sensitive receptors.
Specialist studies related to the proposed waste disposal facility
The proposed waste disposal alternatives would be investigated in the EIR Phase of the
project and as such the specialist studies that would be required would be site-specific and
could not be confirmed at the conclusion of the Scoping Report. The Scoping Report thus
concluded that additional specialist studies would be required specific to the location
alternatives for the new disposal facility/ies. All required specialist studies would be carried
out at the three alternative sites in order to inform the selection of the preferred site and the
impact assessment on the preferred site.
3.3 Acceptance of Scoping Report and approval of Plan of Study
The Department of Environmental Affairs (DEA) received the FSR on 12 June 2015 and
acknowledged receipt of the report on 26 June 2015. After assessment of the FSR and PoS,
the DEA accepted the FSR and approved the PoS on 28 July 2015. Specific conditions
associated with the acceptance included:
• All comments and proof of correspondence with relevant stakeholders must be submitted
together with the FEIR;
23 May 2018 16 12949
ZITHOLELE CONSULTING
• Should no comments be received, proof of attempts to obtain comments must be
submitted together with the FEIR;
• Application form must be amended to include applicable waste listed activities as per GN
R.921;
• FEIR to include one A3 regional map and locality maps that illustrate different proposed
alignments and above ground storage of fuel;
• An application for Environmental Authorisation must be subject to the provisions of the
National Heritage Resources Act, No 25 of 1999, and a letter from the pertinent heritage
authority will be required; and
• Two copies of the EIR and at least one electronic copy (CD/DVD) of the complete final
report must be submitted to the DEA.
23 May 2018 17 12949
ZITHOLELE CONSULTING
4 PROCESS FOLLOWED DURING EIA PROCESS
4.1 Public Participation
Public participation is an essential and legislative requirement for environmental authorisation.
The principles that demand communication with society at large are best embodied in the
principles of the National Environmental Management Act (Act 107 of 1998, Chapter 1), South
Africa’s overarching environmental law. In addition, Section 24 (5), Regulation 54-57 of GNR
543 under the National Environmental Management Act, guides the public participation
process (PPP) that is required for an Environmental Impact Assessment (EIA) process.
The public participation process for the proposed Medupi Power Station FGD Technology
Retrofit has been designed to satisfy the requirements laid down in the above legislation and
guidelines. This section of the report highlights the key elements of the PPP during the Scoping
and EIA Phases.
Objectives of public participation in an EIA
The objectives of public participation in an EIA are to provide sufficient and accessible
information to I&APs in an objective manner so as to:
• During Scoping:
- Understand the scope and elements of the proposed project
- Assist the I&APs with identification of issues of concern and providing suggestions for enhanced benefits and alternatives.
- Contribute their local knowledge and experience.
- Verify that their issues have been considered and to help define the scope of the technical studies to be undertaken during the Impact Assessment.
• During Impact Assessment:
- Verify that their issues have been considered either by the EIA Specialist Studies, or elsewhere.
- Comment on the findings of the EIA, including the measures that have been proposed to enhance positive impacts and reduce or avoid negative ones.
- Confirm the integrity and agree/understand findings of the EIA process
The key objective of public participation is to ensure transparency throughout the process and
to promote informed decision making.
Identification of interested and affected parties
The identification of stakeholders is on-going and is refined throughout the process. As the
on-the-ground understanding of affected stakeholders improves through interaction with
various stakeholders in the area the database is updated. The identification of key
23 May 2018 18 12949
ZITHOLELE CONSULTING
stakeholders and community representatives, land owners, persons in control of land and
occupiers for this project is important as their contributions are valued. The identification of
key stakeholders and interested and/or Affected Parties (I&APs) were done in collaboration
with Eskom (through the I&AP database for other EIAs conducted in the area), the Medupi
Environmental Monitoring Committee, the local municipalities, organs of state and other
organisations in the study area.
The I&APs’ details were captured on Maximiser, an electronic database management software
programme that automatically categorises every mailing to I&APs, thus providing an on-going
record of communications - an important requirement by the competent authority for public
participation.
According to the NEMA EIA Regulations under Section 24(5) of NEMA, a register of I&APs
(Regulation 55 of GNR 543) must be kept by the public participation practitioner. Such a
register has been compiled and is being kept updated with the details of involved I&APs
throughout the process (refer to Appendix F-3).
4.2 Scoping Phase
The opportunity to participate in the EIA was announced in June 2014 as follows:
• Site Notices (in English) were placed at Medupi Power Stations at the public entrance
road;
• Distribution of a letter of invitation to become involved, addressed to I&APs and
organisations, accompanied by a Background Information Document (BID) containing
details of the proposed project, and a registration sheet were done in June 2014 by e-mail,
fax & post;
• The BID was also distributed in the study area at residential houses, bus stops etc.
• The announcement of the EIA process was announced in the Mogol Post, the Lephalale
Express and the Northern News; and
• EIA process notices (A3 paper sized notices) were placed at conspicuous and prominently
public places, inviting stakeholders to participation in the EIA process. This activity was a
supplement to the NEMA regulated site notice.
The DSR was made available for a 40 days public review of the DSR (from 24 October to 5
December 2014) at the following venues:
• Lephalale Local Municipality;
• Marapong Community Library; and
• Agri Lephalale/Farmers Association.
It should be noted that the DSR and the DEIR have been, and continue to be, available for
download from Zitholele’s website (www.zitholele.co.za/environmental/) as well as the Eskom
website
23 May 2018 19 12949
ZITHOLELE CONSULTING
(http://www.eskom.co.za/OurCompany/SustainableDevelopment/EnvironmentalImpactAsses
sments/Pages/Environment_Impact_Assessments.aspx) under the heading “Medupi FGD”.
The comment period was extended on the 20th of November 2015 to Friday 09 January 2015,
which allowed I&APs an additional 14 days (excluding the period 15 December to 02 January
in terms of Regulation 54(8)). This extension was included due to the fact that very few
comments were obtained from the public and from key stakeholders, such as the local and
district municipalities, during the original commenting period.
In addition to the newspaper advertisement and site notices that announced the opportunity
to participate in the EIA, the opportunity for public review of the DSR has been announced as
follows:
• Advertisement in the Mogol Post.
• In a letter to all registered I&APs on the project database, which was e-mailed to those
with e-mail addresses, fax to those without e-mail addresses and post to those without an
e-mail address or fax number.
The DSR, including the CRR (Version 1), was distributed for review and comment as follows:
• Left in public venues such as libraries within the vicinity of the project area;
• Courier to identified / relevant Organs of State (Commenting Authorities);
• Electronic copies to key stakeholders; and
• Electronic copy to those I&APs who requested the DSR.
I&APs had the opportunity to comment on the DSR in various ways, such as completing the
comment sheet accompanying the DSR, submitting individual comments, in writing, by post
or e-mail.
The FSR was made available at the same public venues as the DSR.
4.3 Environmental Impact Assessment Phase
The Environmental Impact Reporting Phase commenced after acceptance of the Scoping
Report and approval of PoS. During the execution, deviations on the development packaging
were necessary to streamline the EIA application process for the Medupi FGD. These aspects
shaped the EIR phase of the project which is discussed in the following sections.
Streamlining of project packaging
Following the delay in the project schedule experienced during the compilation of the
Screening Report, the proponent reached a decision in July 2016 to review the scope of the
current EIA in order to fast track the application for authorisation and licensing of the FGD
23 May 2018 20 12949
ZITHOLELE CONSULTING
retrofit. The decision took the project schedule into account as well as commitments of the
power station to other authorisation and license conditions, most notably the condition for the
MPS to have the FGD infrastructure installed and operational 6 years after commissioning the
each of the generation units.
This section discusses the process of streamlining the EIA scope effected between July 2016,
subsequent to acceptance of the FSR and approval of the PoS, and after the release of the
Draft Environmental Impact Report (DEIR) in February 2018.
Bridging Document 1
Due to the addition of an additional site, for an additional ash disposal facility, to the screening
process and changes to the EIA scope, a Bridging Document (Bridging Document 1) was
prepared towards the end of 2016 and released to I&APs in November 2016 for information
and comment. The Bridging Document is attached as Appendix F-8 to this FEIR. The
purpose of this document was:
1. To update all I&APs on relevant activities that had taken place between the end of the
Scoping Phase (August 2015) and August 2016; and
2. To inform all registered I&APs of the changes in the scope of the EIA.
The Bridging Document highlighted the following changes in project scope:
• New Disposal Facility: During the development and planning phases of the Medupi
Power Station, available space for two ash disposal facilities were investigated, i.e. a
northern ash disposal facility to the property west of the MPS, and a southern ash disposal
facility proposed on the property to the south of the northern ash disposal facility. Only the
northern ash disposal facility was authorised and constructed. Specialist studies
undertaken later to assess the proposed southern ash disposal facility concluded that the
site was unsuitable as a result of several social and biodiversity sensitivities located at the
site. Since the existing ADF at the MPS could only accommodate disposal of waste for the
first 20 years of operational life, an additional facility was required to accommodate the
remaining 30 years of power station operation. A new disposal facility for the disposal of
gypsum, ash, FGD salts and FGD sludge for year 21 to year 50 post commissioning was
required and the scope added to the EIA scope. A site screening and alternatives
assessment was undertaken.
• Splitting of Integrated EIA: Due to the requirement of the MPS to comply with the
conditions of the AEL by April 2025, the installation of the appropriate FGD technology is
time critical, and the application for an integrated authorisation must be accelerated in
order for the power station to remain compliant to the AEL conditions. The inclusion of
future waste/ash disposal facility as part of this application was creating challenges with
respect to timeous project execution. Further, to allow the consideration of additional
alternatives and proposals, which would take time to investigate, a decision was therefore
made to split the EIA into two (2) separate environmental authorisation processes, namely
the future waste/ash disposal facility and the FGD-complex. The assessment of a new
23 May 2018 21 12949
ZITHOLELE CONSULTING
waste disposal facility for the disposal of gypsum, ash, FGD salts and FGD sludge were
resultantly removed from the EIA scope and would be undertaken as a separate process
under a new application and reference number. This process will follow Eskom’s
procurement processes to appoint an independent Environmental Assessment
Practitioner to undertake the process. The assessment of the FGD-complex would
continue under the current application.
• Removal of existing ADF from EIA scope: During the Scoping Phase, it was recognised
that the existing ADF already has a WML and thus the disposal of gypsum with ash at the
authorised ADF would require amendments to the current WML. Therefore, it was decided
to remove the existing authorised ADF from the scope of this EIA process, as it has already
been assessed and authorised for disposal of ash through an earlier independent
environmental impact assessment process. As a result, an amendment application will be
submitted to have the existing WML amended to accommodate the disposal of gypsum at
this facility.
• Water Use Licence Application for this EIA: A Water Use License Application (WULA)
Process for all water uses associated with this EIA scope and application is currently
underway. However, this WULA will not include the water use license for the abstraction
of water from MCWAP Phase 2 take-off point. The abstraction water use license will be
done separately as Eskom will be applying for the bulk water license that includes both
water requirements for Medupi and Matimba. Eskom plans to submit the bulk water use
license application with DWS in May 2018.
• Environmental authorisation for the water supply pipeline from MCWAP Phase 2
take-off to Medupi Power Station Water Reservoir: A separate environmental
authorisations (EIA and WULA) will be undertaken for the transportation of water from
MCWAP Phase 2 take-off point to Medupi Power Station raw water reservoirs. Zitholele
Consulting has not been appointed to undertake this process. Therefore, this is not part of
this application.
Bridging Document 1 concluded that the scope of this Integrated EIA process would not
include assessment of the impacts of a new off-site waste disposal facility nor assess impacts
associated with the disposal of gypsum together with ash on the existing authorised ADF. A
separate WML amendment process was undertaken by Zitholele to assess impacts
associated with the disposal of ash and gypsum together on the ADF that has not previously
been considered in the original application for a WML for the facility. Zitholele Consulting is
currently in the process of completing the WULA for water uses associated with the FGD
infrastructure, railway yard/railway siding and water uses triggered due to the disposal of
gypsum and ash together on the existing ADF.
Bridging Document 2
Towards mid-2017, some additional refinements to the EIA process were proposed. As a
result, it was decided to draft a second Bridging Document (Bridging Document 2) to update
all I&APs on the progression of the project since the first document in November 2016. A
second Bridging Document was prepared towards the end of 2017 and released to I&APs in
23 May 2018 22 12949
ZITHOLELE CONSULTING
November 2017 for information and comment. This Bridging Document is attached as
Appendix F-9 to this FEIR. This document had three key objectives:
1. To update all I&APs on relevant activities that have taken place between the first bridging
report and November 2017.
2. To update all registered IAPs of amendments to the Ash Disposal Facility Waste
Management Licence (ADF WML) and licencing processes and updated project scope to
complete the relevant applications.
3. To inform all registered IAPs on the way forward regarding the EA processes underway
and expected timelines to completion and submission of the Final Environmental Impact
Report (FEIR) and WULA to the authorities.
This Bridging Document highlighted the following changes in project scope:
• Updates to specialist studies for WML amendment process: The surface water and
wetland study identified the need to reduce the approved footprint of the existing ADF in
order to reduce potential impacts to the tributaries of the Sandloop River system, located
to the south of the current ADF; and raise the height of the facility to optimise the facility.
Resultantly, a flood line assessment was updated with fine-scale contour data, the ADF
design was revisited to reduce the footprint, undertake amendment of the wetland
specialist report and undertake a Visual Impact Assessment (VIA) to assess the impact of
raising the authorised ADF height to 72m, from 60m.
• Changes to the Integrated EIA application: The scope of the Integrated EIA included
assessment of the FGD infrastructure, temporary storage of WWTP solid waste (salts and
sludge), temporary trucking of the WWTP solid waste from the temporary storage facility
to an appropriately designed and authorised off-site waste disposal facility, facilities for
storage of limestone, construction of pollution control facilities and associated
infrastructure, and construction of the railway yard and siding with, amongst other
infrastructure, diesel storage facilities. In order to further streamline the EIA process for
the FGD system and in light of when detailed design information becomes available, a
decision was made to remove the WML component relating to the storage of salts and
sludge at a waste storage facility from the integrated EIA process. It is therefore proposed
that the storage of hazardous waste, WWTP salts and sludge, would be registered in terms
of Schedule C of GN 921 (list of waste management activities) of the NEM:WA.
Management of these wastes in terms of Schedule C would require compliance with the
relevant requirements and standards stipulated in the Norms and Standards for Storage
of Waste (GN 926 of 29 November 2013). This registration process would therefore be
undertaken independently of this EIA process, and therefore does not form part of this EIA
application going forward. The integrated EIA/WML application has therefore effectively
changed to a standard EIA application.
• Management of wastewater and effluent runoff from PCDs: Activities relating to the
storage of effluent, wastewater or sewage were removed from the NEM:WA and List of
waste management activities (GN 921) subsequent to the last amendments to the
regulations. Assessment and management of the Pollution Control Dams (PCDs) now fall
23 May 2018 23 12949
ZITHOLELE CONSULTING
under the ambit of the NWA, although general impacts associated with the disturbance of
the footprint and potential for pollution were still assessed in this EIA process. This process
will consider and assess the applicable NEMA activities in support of this registration
process. Management and operation of the PCD will therefore invoke a water use and will
be included in the current WULA being undertaken. The PCD will furthermore be designed
to comply with GN 704 of 4 June 1999: Regulations on use of water for mining and related
activities aimed at the protection of water resources.
The 2nd Bridging Document therefore concluded that the application for a WML for the
operation and management of hazardous waste storage facilities for salts and sludge was no
longer required and would be authorised through a registration process in terms of the Norms
and Standards for the Storage of Waste. In terms of the National Environmental Waste Act
(No 59 of 2008), as amended, the Norms and Standards specifically negate the need to apply
for a WML if the requirements and specifications stipulated in the Norms and Standards have
been complied with. Operation and management of the PCDs would be licenced in terms of
the WULA.
Confirmed scope of EIA application
Since submission of the FSR, a number of changes to the scope of the EIA became necessary.
These changes relating to the scope of the EIA application are summarised in the foregoing
sections. As a result the confirmed scope of work, this assessment in this FEIR includes
assessment of the following activities and infrastructure:
1. Construction and operation of a railway yard/rail siding to receive Limestone via rail from
source defined point at the existing rail network to the Medupi Power Station and proposed
railway yard / siding, including diesel storage facilities for locomotives, and associated
buildings and infrastructure. A second diesel storage facility will be constructed within the
FGD footprint for refuelling of FGD generators, while 3 third diesel tank will be located in
the FGD common pump building with a capacity significantly less than the two larger tanks;
2. Construction and operation of limestone storage area, preparation area, handling and
transport via truck and conveyor to the FGD system located near the generating units of
the Medupi Power Station;
3. The construction and operation of the wet FGD system that will reduce the SO2 content in
the flue gas emitted;
4. Construction and operation of associated infrastructure required for operation of the FGD
system and required services to ensure optimal functioning of the wet FGD system;
5. The handling, treatment and conveyance of gypsum and effluent from the gypsum
dewatering plant. Disposal of gypsum on the existing ADF is not included in this EIA and
will be addressed in the ADF WML variation application.
6. Pipeline for transportation of waste water from the gypsum dewatering plant and its
treatment at a WWTP that will be located close to the FGD infrastructure within the Medupi
Power Station;
7. Construction and operation of the WWTP;
23 May 2018 24 12949
ZITHOLELE CONSULTING
8. Management, handling, transport and storage of salts and sludge generated through the
waste water treatment process at a temporary waste storage facility. In terms of the EIA
process impacts related to the management of salts and sludge will be considered in the
EIR. However, licencing of the storage activity and requirements relating to the waste
storage facility will be assessed in the WML registration application process; and
9. The transportation of salts and sludge via trucks from the temporary waste storage facility
to a final Waste Disposal Facility (WDF) to be contracted by Eskom, for the first 5 years of
operation of the FGD system. Long term disposal of salts and sludge will be addressed
though a separate independent EIA process to be commissioned by Eskom in future. In
the first 5 years of operation, salts and sludge will be disposed of at a licenced landfill site,
e.g. Holfontein.
Specialist assessments
Specialists were appointed to undertake the relevant assessments to identify, assess impacts
and propose appropriate mitigation and management measures for the identified impacts. The
specialists were initially contracted to investigate impacts associated with the development of
a new waste disposal facility to receive ash, gypsum, and WWTP salts and sludge, however
after the screening phase for this proposed facility the scope was removed from the current
EIA process and specialists were tasked to assess impacts associated with the current scope
provided in section 4.3.4 above. Some specialists, subsequently, provided professional
opinions of the expected impacts with the already transformed footprint within the MPS, based
on previous studies undertaken in these areas. The specialist assessments, or in some cases
opinions, that were commissioned include:
• Air Quality Impact Assessment
• Noise Impact Assessment
• Geology and Soils Assessment
• Geotechnical Assessment
• Geohydrology Impact Assessment
• Surface Water Assessment
• Traffic Impact Assessment
• Terrestrial Ecological (Fauna, Flora, incl. Avifauna) and Wetland Impact Assessment
• Social Impact Assessment
• Heritage Impact Assessment
• Waste Assessment
Although a Visual Impact Assessment was undertaken for the WML Amendment application
due to the increased height of the ADF, this study did not take into account visual impacts
associated with construction of the FGD infrastructure within the MPS or construction of the
railway yard as potential visual impacts were deemed negligible because the existing visual
character of the Medupi Power Station infrastructure surrounding the proposed infrastructure
overshadows the FGD infrastructure.
23 May 2018 25 12949
ZITHOLELE CONSULTING
Refer to Appendix G of this report for the Specialist Reports.
Compilation of the DEIR and EMPr
The DEIR was compiled towards the end of 2017 and early 2018 as detailed information
relating to the proposed engineering designs and specialist assessment became available.
The Environmental Management Programme (EMPr) that is included in the DEIR as an
appendix represents a concise document of impacts identified, proposed mitigation and
management measures as well as monitoring requirements for the proposed development.
4.4 Public participation during the EIR Phase
This section deals with the Public Participation Process that was undertaken throughout the
EIA process. This section also contains a summary of key stakeholders and government
departments consulted, as well as a summary of the key issues raised during the
Environmental Impact Reporting Phase. Proof of correspondence with Interested and Affected
Parties (I&APs) and Comments and Responses Report (CRR) are included in Appendix F.
Purpose of the PPP during the EIA Phase
The purpose of the public participation process during the EIR Phase is to source comments
and input on the DEIR and Draft Environmental Management Programme (DEMPr) by the
public. I&APs are requested to comment on the findings of the EIA, including the measures
that have been proposed to enhance positive impacts and reduce or avoid negative ones.
The FEIR includes the latest version of the CRR (Appendix F-7), which lists every issue raised
with an indication of where the issue is dealt with in the technical evaluations, and the relevant
findings, and also provides responses to the comments submitted. Through the PPP,
stakeholders are notified of the availability of the DEIR and DEMPr for review and comments,
and afforded an opportunity to engage with the project team at the public meetings that were
held during the review period of the DEIR.
Availability of the DEIR and DEMPr
All I&APs registered on the proposed project’s database were notified of the availability of the
DEIR and DEMPr on the 19 February 2018 to the 05 April 2018, which was made available at
public places utilised during the Scoping Phase. The public review period was extended from
the 06 April 2018 to 19 April 2018 due to a request received from the Centre for Environmental
Rights (CER) Identified public places are provided in Table 4-1. The DEIR and DEMPr were
also freely available in electronic format on Eskom’s and Zitholele’s websites as indicated in
Table 4-1 below.

23 May 2018 26 12949
ZITHOLELE CONSULTING
Table 4-1 : Public places where the DEIR was available for public review
Venue Address Contact details
Printed Copies
Lephalale Public Library Civic Center Onverwacht, Cnr Joe Slovo and Douwater Road, Lephalale
Tel.: 014 762 1484, 014 762 1453 or 014 762 1518
Marapong Community Library
916 Phukubye Street, Marapong Tel.: 073 210 8954
Lesedi Tshukudu Thusong Centre
Lesedi Tshukudu Thusong Centre, Steenbokpan
Tel.: 082 927 2399
Agri SA /Farmers Association NTK Building, 1 Jan Louis Botha Avenue, Lephalale
Tel.: 014 763 1888
Electronic Copies
Zitholele Consulting Website http://www.zitholele.co.za/environmental/ under heading “EIA for Medupi FGD”
Eskom website http://www.eskom.co.za/OurCompany/SustainableDevelopment/EnvironmentalImpactAssessments/Pages/Environment_Impact_Assessments.aspx under the heading “Medupi FGD”
Mathys Vosloo / Lebo Petlane
[email protected] to request CD copy
Invitation to Meetings
A Key Stakeholder Workshop (KSW) were undertaken with all registered key stakeholders on
the project database, including Organs of State (i.e. Government Departments / District &
Local Municipalities), NGOs / NPOs Representatives, Representatives from the local
Chamber of Commerce and Landowners on the 13 March 2018.
Furthermore, three Public Meetings (PM) were undertaken. The PMs were held at the
following venues to make it as easy as possible for members of these communities that do
not have their own transport to be able to walk to the meeting venues:
• Marapong Community Library in Marapong – 12 March 2018;
• Lesedi Tshukudu Thusong Centre in Steenbokpan – 12 March 2018; and
• Mogol Golf Club in Lephalale – 13 March 2018.
The agendas, presentations, attendance registers and minutes for all meetings have been
included in this FEIR to serve as a record of these meeting taking place and discussions held
at these meetings (refer to Appendix F-6).
Authority Consultation
The DEA is the competent authority for all energy related projects (as per Government Notice
No. 779 of 1 July 2016). The project falls within the Limpopo Province, therefore the Limpopo
Department of Economic Development, Environment and Tourism (LEDET) will act as a
commenting authority for the project. The following key organs of state with jurisdiction over
the project were identified and consulted throughout the EIA:
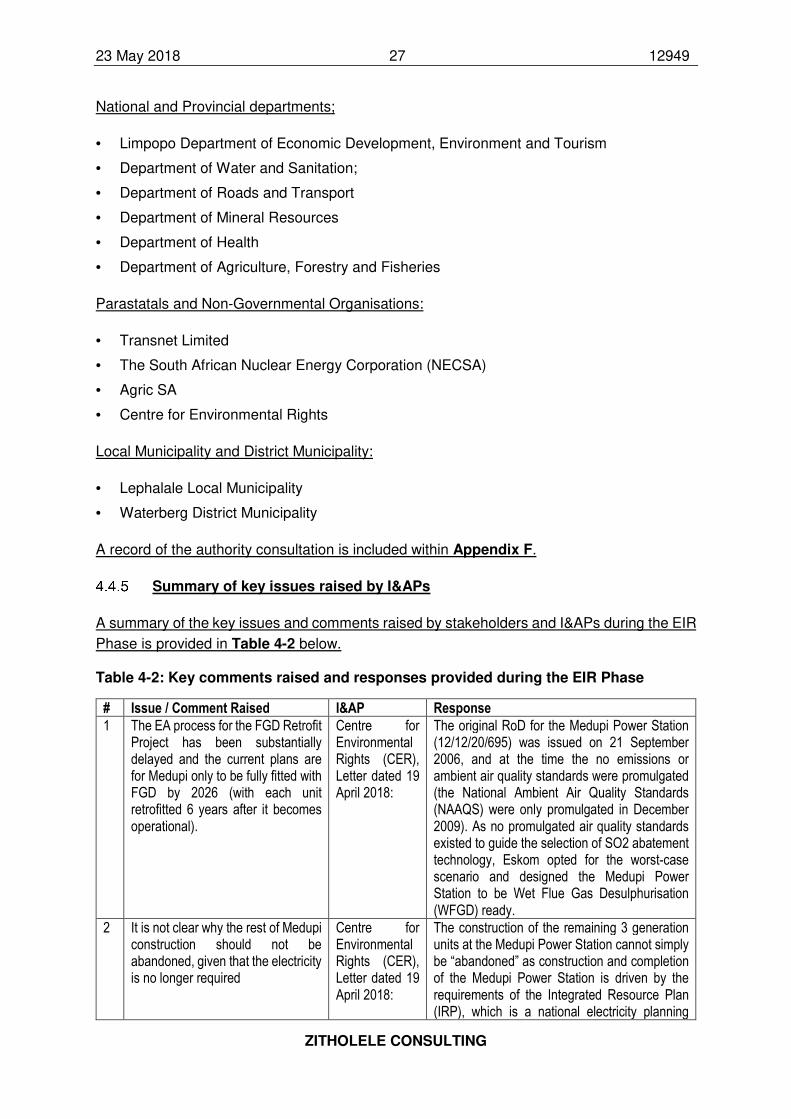
23 May 2018 27 12949
ZITHOLELE CONSULTING
National and Provincial departments;
• Limpopo Department of Economic Development, Environment and Tourism
• Department of Water and Sanitation;
• Department of Roads and Transport
• Department of Mineral Resources
• Department of Health
• Department of Agriculture, Forestry and Fisheries
Parastatals and Non-Governmental Organisations:
• Transnet Limited
• The South African Nuclear Energy Corporation (NECSA)
• Agric SA
• Centre for Environmental Rights
Local Municipality and District Municipality:
• Lephalale Local Municipality
• Waterberg District Municipality
A record of the authority consultation is included within Appendix F.
Summary of key issues raised by I&APs
A summary of the key issues and comments raised by stakeholders and I&APs during the EIR
Phase is provided in Table 4-2 below.
Table 4-2: Key comments raised and responses provided during the EIR Phase
# Issue / Comment Raised I&AP Response
1 The EA process for the FGD Retrofit Project has been substantially delayed and the current plans are for Medupi only to be fully fitted with FGD by 2026 (with each unit retrofitted 6 years after it becomes operational).
Centre for Environmental Rights (CER), Letter dated 19 April 2018:
The original RoD for the Medupi Power Station (12/12/20/695) was issued on 21 September 2006, and at the time the no emissions or ambient air quality standards were promulgated (the National Ambient Air Quality Standards (NAAQS) were only promulgated in December 2009). As no promulgated air quality standards existed to guide the selection of SO2 abatement technology, Eskom opted for the worst-case scenario and designed the Medupi Power Station to be Wet Flue Gas Desulphurisation (WFGD) ready.
2 It is not clear why the rest of Medupi construction should not be abandoned, given that the electricity is no longer required
Centre for Environmental Rights (CER), Letter dated 19 April 2018:
The construction of the remaining 3 generation units at the Medupi Power Station cannot simply be “abandoned” as construction and completion of the Medupi Power Station is driven by the requirements of the Integrated Resource Plan (IRP), which is a national electricity planning
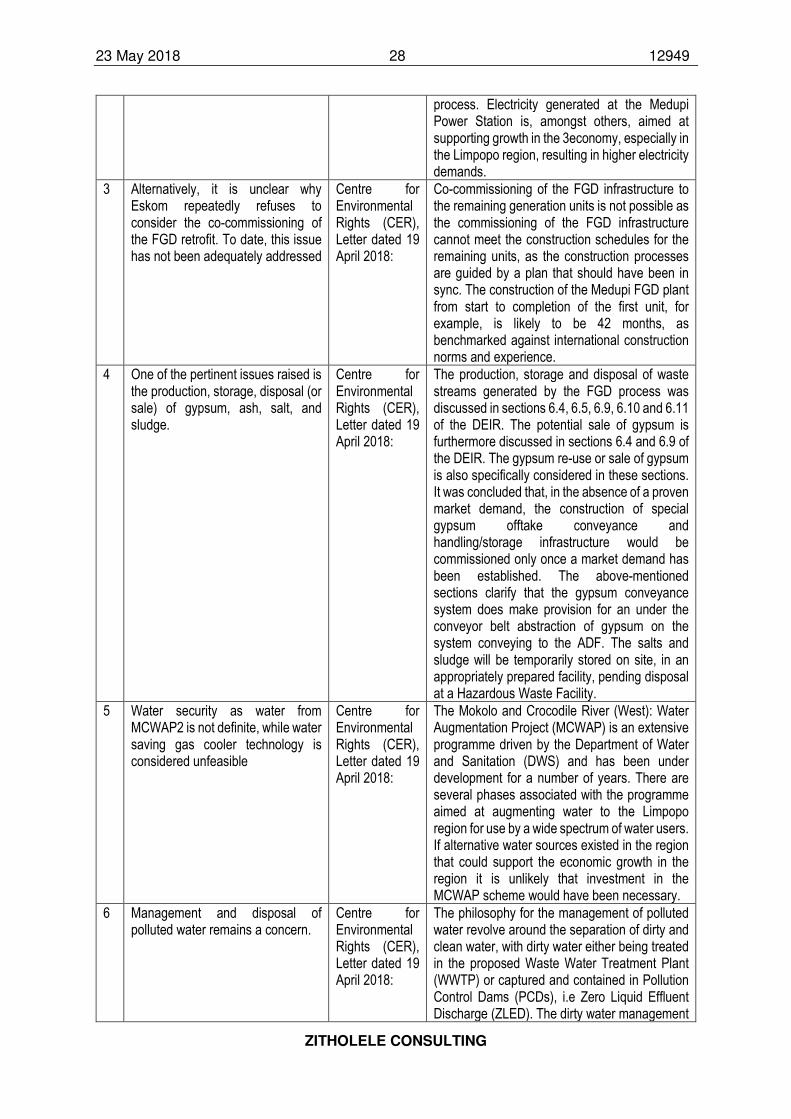
23 May 2018 28 12949
ZITHOLELE CONSULTING
process. Electricity generated at the Medupi Power Station is, amongst others, aimed at supporting growth in the 3economy, especially in the Limpopo region, resulting in higher electricity demands.
3 Alternatively, it is unclear why Eskom repeatedly refuses to consider the co-commissioning of the FGD retrofit. To date, this issue has not been adequately addressed
Centre for Environmental Rights (CER), Letter dated 19 April 2018:
Co-commissioning of the FGD infrastructure to the remaining generation units is not possible as the commissioning of the FGD infrastructure cannot meet the construction schedules for the remaining units, as the construction processes are guided by a plan that should have been in sync. The construction of the Medupi FGD plant from start to completion of the first unit, for example, is likely to be 42 months, as benchmarked against international construction norms and experience.
4 One of the pertinent issues raised is the production, storage, disposal (or sale) of gypsum, ash, salt, and sludge.
Centre for Environmental Rights (CER), Letter dated 19 April 2018:
The production, storage and disposal of waste streams generated by the FGD process was discussed in sections 6.4, 6.5, 6.9, 6.10 and 6.11 of the DEIR. The potential sale of gypsum is furthermore discussed in sections 6.4 and 6.9 of the DEIR. The gypsum re-use or sale of gypsum is also specifically considered in these sections. It was concluded that, in the absence of a proven market demand, the construction of special gypsum offtake conveyance and handling/storage infrastructure would be commissioned only once a market demand has been established. The above-mentioned sections clarify that the gypsum conveyance system does make provision for an under the conveyor belt abstraction of gypsum on the system conveying to the ADF. The salts and sludge will be temporarily stored on site, in an appropriately prepared facility, pending disposal at a Hazardous Waste Facility.
5 Water security as water from MCWAP2 is not definite, while water saving gas cooler technology is considered unfeasible
Centre for Environmental Rights (CER), Letter dated 19 April 2018:
The Mokolo and Crocodile River (West): Water Augmentation Project (MCWAP) is an extensive programme driven by the Department of Water and Sanitation (DWS) and has been under development for a number of years. There are several phases associated with the programme aimed at augmenting water to the Limpopo region for use by a wide spectrum of water users. If alternative water sources existed in the region that could support the economic growth in the region it is unlikely that investment in the MCWAP scheme would have been necessary.
6 Management and disposal of polluted water remains a concern.
Centre for Environmental Rights (CER), Letter dated 19 April 2018:
The philosophy for the management of polluted water revolve around the separation of dirty and clean water, with dirty water either being treated in the proposed Waste Water Treatment Plant (WWTP) or captured and contained in Pollution Control Dams (PCDs), i.e Zero Liquid Effluent Discharge (ZLED). The dirty water management
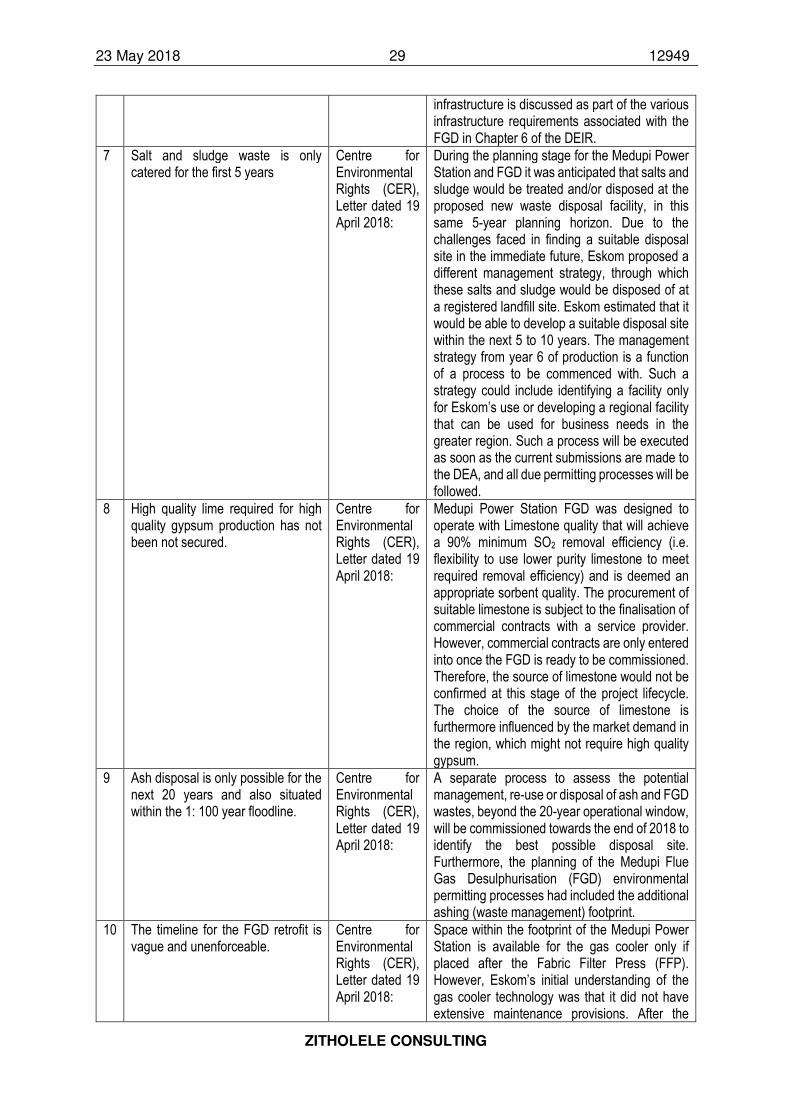
23 May 2018 29 12949
ZITHOLELE CONSULTING
infrastructure is discussed as part of the various infrastructure requirements associated with the FGD in Chapter 6 of the DEIR.
7 Salt and sludge waste is only catered for the first 5 years
Centre for Environmental Rights (CER), Letter dated 19 April 2018:
During the planning stage for the Medupi Power Station and FGD it was anticipated that salts and sludge would be treated and/or disposed at the proposed new waste disposal facility, in this same 5-year planning horizon. Due to the challenges faced in finding a suitable disposal site in the immediate future, Eskom proposed a different management strategy, through which these salts and sludge would be disposed of at a registered landfill site. Eskom estimated that it would be able to develop a suitable disposal site within the next 5 to 10 years. The management strategy from year 6 of production is a function of a process to be commenced with. Such a strategy could include identifying a facility only for Eskom’s use or developing a regional facility that can be used for business needs in the greater region. Such a process will be executed as soon as the current submissions are made to the DEA, and all due permitting processes will be followed.
8 High quality lime required for high quality gypsum production has not been not secured.
Centre for Environmental Rights (CER), Letter dated 19 April 2018:
Medupi Power Station FGD was designed to operate with Limestone quality that will achieve a 90% minimum SO2 removal efficiency (i.e. flexibility to use lower purity limestone to meet required removal efficiency) and is deemed an appropriate sorbent quality. The procurement of suitable limestone is subject to the finalisation of commercial contracts with a service provider. However, commercial contracts are only entered into once the FGD is ready to be commissioned. Therefore, the source of limestone would not be confirmed at this stage of the project lifecycle. The choice of the source of limestone is furthermore influenced by the market demand in the region, which might not require high quality gypsum.
9 Ash disposal is only possible for the next 20 years and also situated within the 1: 100 year floodline.
Centre for Environmental Rights (CER), Letter dated 19 April 2018:
A separate process to assess the potential management, re-use or disposal of ash and FGD wastes, beyond the 20-year operational window, will be commissioned towards the end of 2018 to identify the best possible disposal site. Furthermore, the planning of the Medupi Flue Gas Desulphurisation (FGD) environmental permitting processes had included the additional ashing (waste management) footprint.
10 The timeline for the FGD retrofit is vague and unenforceable.
Centre for Environmental Rights (CER), Letter dated 19 April 2018:
Space within the footprint of the Medupi Power Station is available for the gas cooler only if placed after the Fabric Filter Press (FFP). However, Eskom’s initial understanding of the gas cooler technology was that it did not have extensive maintenance provisions. After the
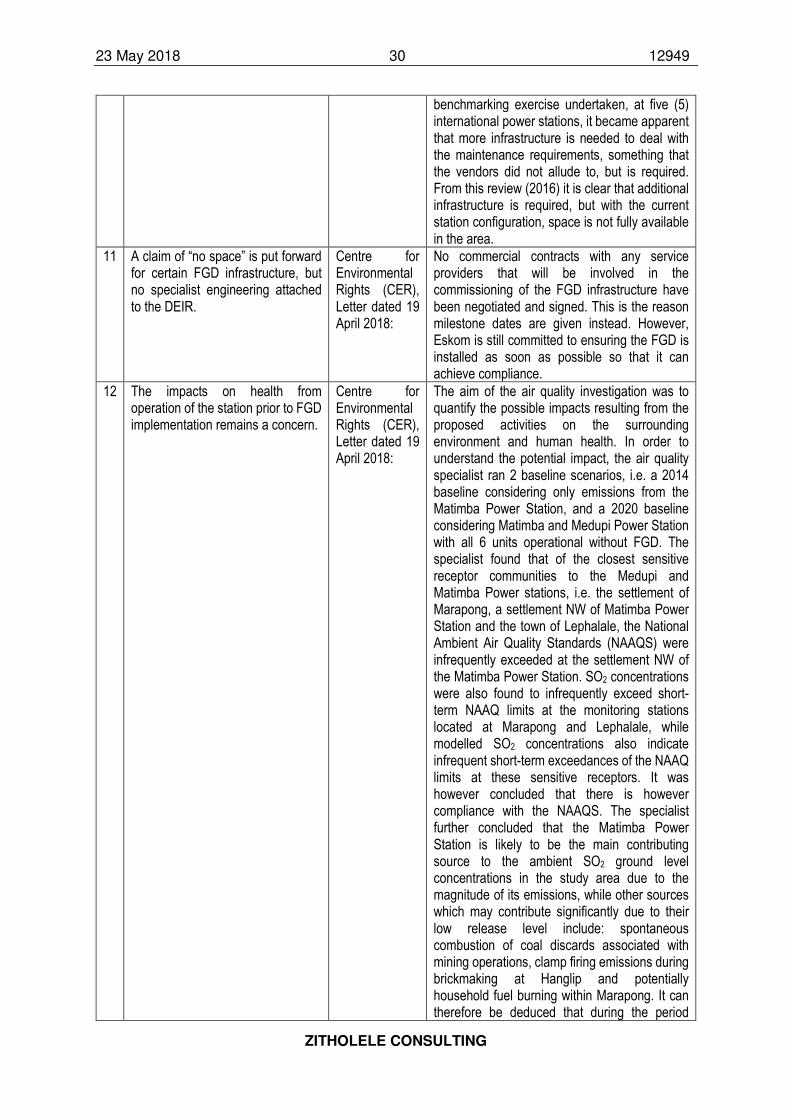
23 May 2018 30 12949
ZITHOLELE CONSULTING
benchmarking exercise undertaken, at five (5) international power stations, it became apparent that more infrastructure is needed to deal with the maintenance requirements, something that the vendors did not allude to, but is required. From this review (2016) it is clear that additional infrastructure is required, but with the current station configuration, space is not fully available in the area.
11 A claim of “no space” is put forward for certain FGD infrastructure, but no specialist engineering attached to the DEIR.
Centre for Environmental Rights (CER), Letter dated 19 April 2018:
No commercial contracts with any service providers that will be involved in the commissioning of the FGD infrastructure have been negotiated and signed. This is the reason milestone dates are given instead. However, Eskom is still committed to ensuring the FGD is installed as soon as possible so that it can achieve compliance.
12 The impacts on health from operation of the station prior to FGD implementation remains a concern.
Centre for Environmental Rights (CER), Letter dated 19 April 2018:
The aim of the air quality investigation was to quantify the possible impacts resulting from the proposed activities on the surrounding environment and human health. In order to understand the potential impact, the air quality specialist ran 2 baseline scenarios, i.e. a 2014 baseline considering only emissions from the Matimba Power Station, and a 2020 baseline considering Matimba and Medupi Power Station with all 6 units operational without FGD. The specialist found that of the closest sensitive receptor communities to the Medupi and Matimba Power stations, i.e. the settlement of Marapong, a settlement NW of Matimba Power Station and the town of Lephalale, the National Ambient Air Quality Standards (NAAQS) were infrequently exceeded at the settlement NW of the Matimba Power Station. SO2 concentrations were also found to infrequently exceed short-term NAAQ limits at the monitoring stations located at Marapong and Lephalale, while modelled SO2 concentrations also indicate infrequent short-term exceedances of the NAAQ limits at these sensitive receptors. It was however concluded that there is however compliance with the NAAQS. The specialist further concluded that the Matimba Power Station is likely to be the main contributing source to the ambient SO2 ground level concentrations in the study area due to the magnitude of its emissions, while other sources which may contribute significantly due to their low release level include: spontaneous combustion of coal discards associated with mining operations, clamp firing emissions during brickmaking at Hanglip and potentially household fuel burning within Marapong. It can therefore be deduced that during the period
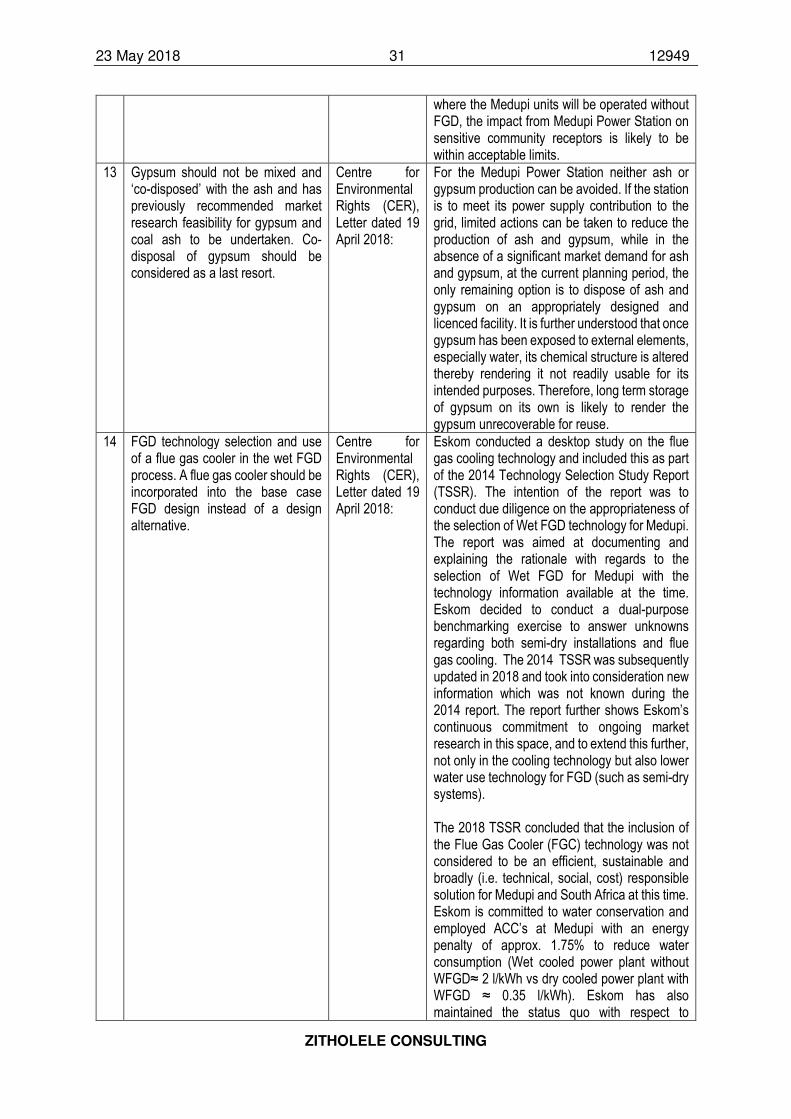
23 May 2018 31 12949
ZITHOLELE CONSULTING
where the Medupi units will be operated without FGD, the impact from Medupi Power Station on sensitive community receptors is likely to be within acceptable limits.
13 Gypsum should not be mixed and ‘co-disposed’ with the ash and has previously recommended market research feasibility for gypsum and coal ash to be undertaken. Co-disposal of gypsum should be considered as a last resort.
Centre for Environmental Rights (CER), Letter dated 19 April 2018:
For the Medupi Power Station neither ash or gypsum production can be avoided. If the station is to meet its power supply contribution to the grid, limited actions can be taken to reduce the production of ash and gypsum, while in the absence of a significant market demand for ash and gypsum, at the current planning period, the only remaining option is to dispose of ash and gypsum on an appropriately designed and licenced facility. It is further understood that once gypsum has been exposed to external elements, especially water, its chemical structure is altered thereby rendering it not readily usable for its intended purposes. Therefore, long term storage of gypsum on its own is likely to render the gypsum unrecoverable for reuse.
14 FGD technology selection and use of a flue gas cooler in the wet FGD process. A flue gas cooler should be incorporated into the base case FGD design instead of a design alternative.
Centre for Environmental Rights (CER), Letter dated 19 April 2018:
Eskom conducted a desktop study on the flue gas cooling technology and included this as part of the 2014 Technology Selection Study Report (TSSR). The intention of the report was to conduct due diligence on the appropriateness of the selection of Wet FGD technology for Medupi. The report was aimed at documenting and explaining the rationale with regards to the selection of Wet FGD for Medupi with the technology information available at the time. Eskom decided to conduct a dual-purpose benchmarking exercise to answer unknowns regarding both semi-dry installations and flue gas cooling. The 2014 TSSR was subsequently updated in 2018 and took into consideration new information which was not known during the 2014 report. The report further shows Eskom’s continuous commitment to ongoing market research in this space, and to extend this further, not only in the cooling technology but also lower water use technology for FGD (such as semi-dry systems). The 2018 TSSR concluded that the inclusion of the Flue Gas Cooler (FGC) technology was not considered to be an efficient, sustainable and broadly (i.e. technical, social, cost) responsible solution for Medupi and South Africa at this time. Eskom is committed to water conservation and employed ACC’s at Medupi with an energy penalty of approx. 1.75% to reduce water consumption (Wet cooled power plant without WFGD≈ 2 l/kWh vs dry cooled power plant with WFGD ≈ 0.35 l/kWh). Eskom has also maintained the status quo with respect to
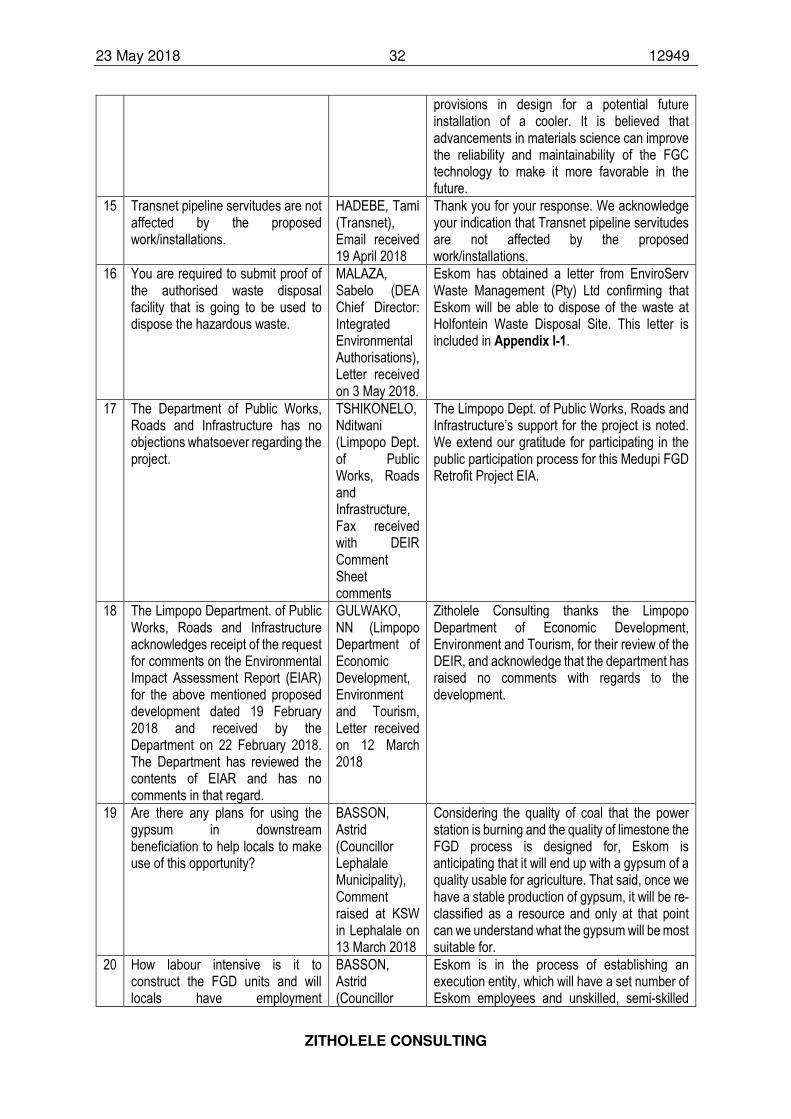
23 May 2018 32 12949
ZITHOLELE CONSULTING
provisions in design for a potential future installation of a cooler. It is believed that advancements in materials science can improve the reliability and maintainability of the FGC technology to make it more favorable in the future.
15 Transnet pipeline servitudes are not affected by the proposed work/installations.
HADEBE, Tami (Transnet), Email received 19 April 2018
Thank you for your response. We acknowledge your indication that Transnet pipeline servitudes are not affected by the proposed work/installations.
16 You are required to submit proof of the authorised waste disposal facility that is going to be used to dispose the hazardous waste.
MALAZA, Sabelo (DEA Chief Director: Integrated Environmental Authorisations), Letter received on 3 May 2018.
Eskom has obtained a letter from EnviroServ Waste Management (Pty) Ltd confirming that Eskom will be able to dispose of the waste at Holfontein Waste Disposal Site. This letter is included in Appendix I-1.
17 The Department of Public Works, Roads and Infrastructure has no objections whatsoever regarding the project.
TSHIKONELO, Nditwani (Limpopo Dept. of Public Works, Roads and Infrastructure, Fax received with DEIR Comment Sheet comments
The Limpopo Dept. of Public Works, Roads and Infrastructure’s support for the project is noted. We extend our gratitude for participating in the public participation process for this Medupi FGD Retrofit Project EIA.
18 The Limpopo Department. of Public Works, Roads and Infrastructure acknowledges receipt of the request for comments on the Environmental Impact Assessment Report (EIAR) for the above mentioned proposed development dated 19 February 2018 and received by the Department on 22 February 2018. The Department has reviewed the contents of EIAR and has no comments in that regard.
GULWAKO, NN (Limpopo Department of Economic Development, Environment and Tourism, Letter received on 12 March 2018
Zitholele Consulting thanks the Limpopo Department of Economic Development, Environment and Tourism, for their review of the DEIR, and acknowledge that the department has raised no comments with regards to the development.
19 Are there any plans for using the gypsum in downstream beneficiation to help locals to make use of this opportunity?
BASSON, Astrid (Councillor Lephalale Municipality), Comment raised at KSW in Lephalale on 13 March 2018
Considering the quality of coal that the power station is burning and the quality of limestone the FGD process is designed for, Eskom is anticipating that it will end up with a gypsum of a quality usable for agriculture. That said, once we have a stable production of gypsum, it will be re-classified as a resource and only at that point can we understand what the gypsum will be most suitable for.
20 How labour intensive is it to construct the FGD units and will locals have employment
BASSON, Astrid (Councillor
Eskom is in the process of establishing an execution entity, which will have a set number of Eskom employees and unskilled, semi-skilled
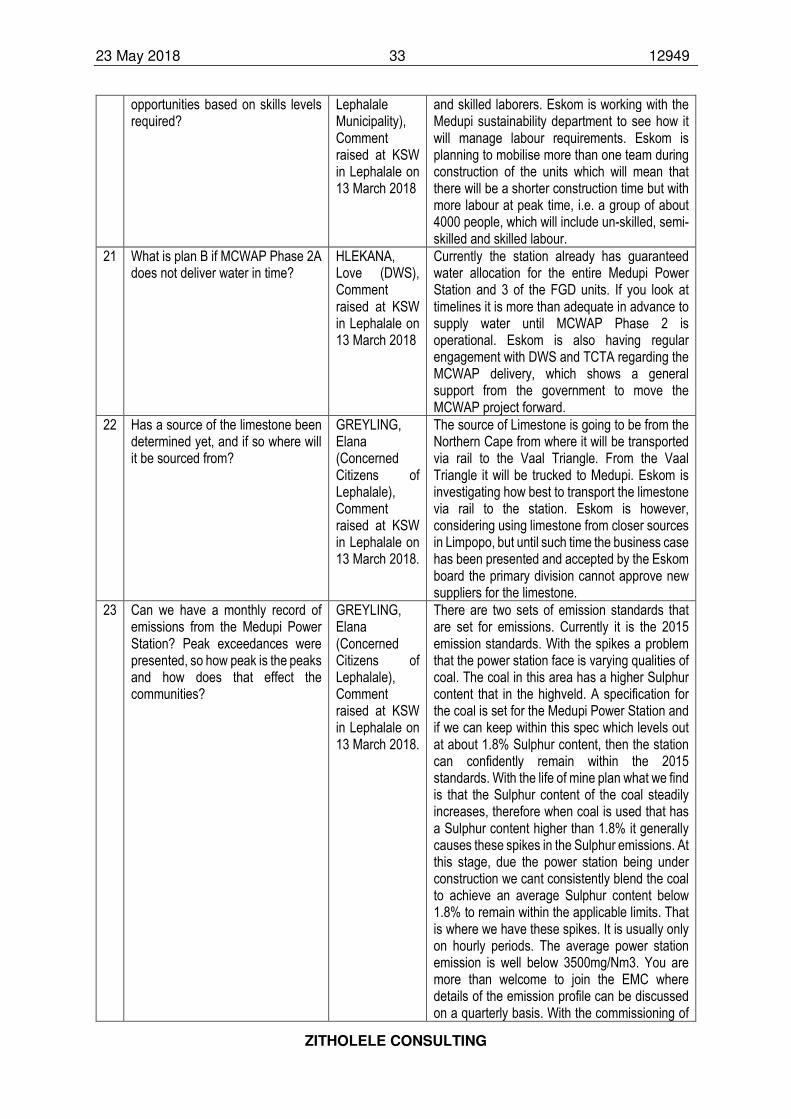
23 May 2018 33 12949
ZITHOLELE CONSULTING
opportunities based on skills levels required?
Lephalale Municipality), Comment raised at KSW in Lephalale on 13 March 2018
and skilled laborers. Eskom is working with the Medupi sustainability department to see how it will manage labour requirements. Eskom is planning to mobilise more than one team during construction of the units which will mean that there will be a shorter construction time but with more labour at peak time, i.e. a group of about 4000 people, which will include un-skilled, semi-skilled and skilled labour.
21 What is plan B if MCWAP Phase 2A does not deliver water in time?
HLEKANA, Love (DWS), Comment raised at KSW in Lephalale on 13 March 2018
Currently the station already has guaranteed water allocation for the entire Medupi Power Station and 3 of the FGD units. If you look at timelines it is more than adequate in advance to supply water until MCWAP Phase 2 is operational. Eskom is also having regular engagement with DWS and TCTA regarding the MCWAP delivery, which shows a general support from the government to move the MCWAP project forward.
22 Has a source of the limestone been determined yet, and if so where will it be sourced from?
GREYLING, Elana (Concerned Citizens of Lephalale), Comment raised at KSW in Lephalale on 13 March 2018.
The source of Limestone is going to be from the Northern Cape from where it will be transported via rail to the Vaal Triangle. From the Vaal Triangle it will be trucked to Medupi. Eskom is investigating how best to transport the limestone via rail to the station. Eskom is however, considering using limestone from closer sources in Limpopo, but until such time the business case has been presented and accepted by the Eskom board the primary division cannot approve new suppliers for the limestone.
23 Can we have a monthly record of emissions from the Medupi Power Station? Peak exceedances were presented, so how peak is the peaks and how does that effect the communities?
GREYLING, Elana (Concerned Citizens of Lephalale), Comment raised at KSW in Lephalale on 13 March 2018.
There are two sets of emission standards that are set for emissions. Currently it is the 2015 emission standards. With the spikes a problem that the power station face is varying qualities of coal. The coal in this area has a higher Sulphur content that in the highveld. A specification for the coal is set for the Medupi Power Station and if we can keep within this spec which levels out at about 1.8% Sulphur content, then the station can confidently remain within the 2015 standards. With the life of mine plan what we find is that the Sulphur content of the coal steadily increases, therefore when coal is used that has a Sulphur content higher than 1.8% it generally causes these spikes in the Sulphur emissions. At this stage, due the power station being under construction we cant consistently blend the coal to achieve an average Sulphur content below 1.8% to remain within the applicable limits. That is where we have these spikes. It is usually only on hourly periods. The average power station emission is well below 3500mg/Nm3. You are more than welcome to join the EMC where details of the emission profile can be discussed on a quarterly basis. With the commissioning of
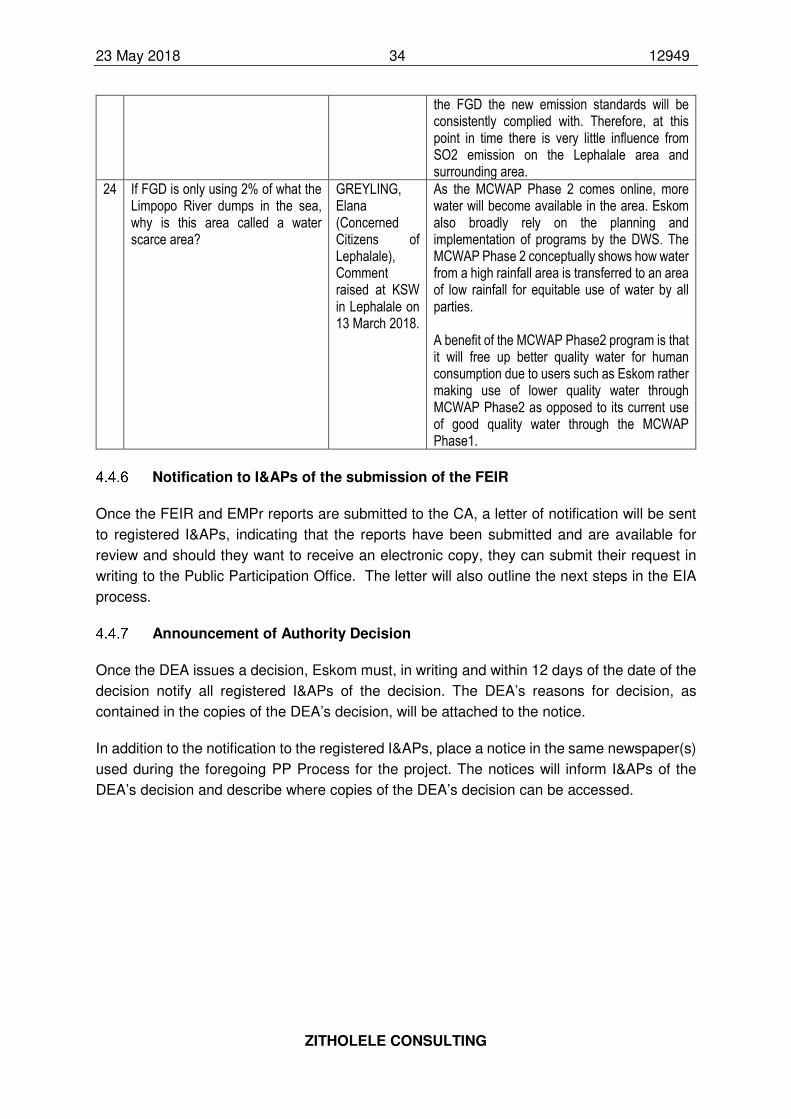
23 May 2018 34 12949
ZITHOLELE CONSULTING
the FGD the new emission standards will be consistently complied with. Therefore, at this point in time there is very little influence from SO2 emission on the Lephalale area and surrounding area.
24 If FGD is only using 2% of what the Limpopo River dumps in the sea, why is this area called a water scarce area?
GREYLING, Elana (Concerned Citizens of Lephalale), Comment raised at KSW in Lephalale on 13 March 2018.
As the MCWAP Phase 2 comes online, more water will become available in the area. Eskom also broadly rely on the planning and implementation of programs by the DWS. The MCWAP Phase 2 conceptually shows how water from a high rainfall area is transferred to an area of low rainfall for equitable use of water by all parties. A benefit of the MCWAP Phase2 program is that it will free up better quality water for human consumption due to users such as Eskom rather making use of lower quality water through MCWAP Phase2 as opposed to its current use of good quality water through the MCWAP Phase1.
Notification to I&APs of the submission of the FEIR
Once the FEIR and EMPr reports are submitted to the CA, a letter of notification will be sent
to registered I&APs, indicating that the reports have been submitted and are available for
review and should they want to receive an electronic copy, they can submit their request in
writing to the Public Participation Office. The letter will also outline the next steps in the EIA
process.
Announcement of Authority Decision
Once the DEA issues a decision, Eskom must, in writing and within 12 days of the date of the
decision notify all registered I&APs of the decision. The DEA’s reasons for decision, as
contained in the copies of the DEA’s decision, will be attached to the notice.
In addition to the notification to the registered I&APs, place a notice in the same newspaper(s)
used during the foregoing PP Process for the project. The notices will inform I&APs of the
DEA’s decision and describe where copies of the DEA’s decision can be accessed.
23 May 2018 35 12949
ZITHOLELE CONSULTING
5 ENVIRONMENTAL LEGISLATIVE REQUIREMENTS
This part of the EIR is intended to provide a detailed account of all environmental legislation
which may have bearing on the proposed project. Attention will be paid to the National
Environmental Management Act, No 107 of 1998 (NEMA). NEMA is regarded as South
Africa’s Environmental Management Framework Act. An overview of sector specific
environmental acts which govern specific elements or project activities and the relevance on
the proposed project will also be provided. To ensure that Environmental Management Best
Practice Principles are adhered to, all guidelines which are relevant to the proposed project
activities have also been taken into consideration during the preparation of this EIR.
Determining the applicability of all environmental management legislation is also fundamental
in ensuring that all required authorisations, licences and permits are applied for and facilitating
compliance with the applicable provisions of these Acts.
5.1 The Constitution of the Republic of South Africa, 1996 (Act No. 108 Of 1996)
The Constitution of the Republic of South Africa, 1996 (hereafter referred to as "the
Constitution") is the Supreme Law in South Africa. The Bill of Rights is included in Chapter 2
of the Constitution. The Environmental Right is set out in Section 24 of the Constitution and
states that –
Everyone has the right –
• to an environment that is not harmful to their health or well-being; and
• to have the environment protected, for the benefit of present and future generations,
through reasonable legislative and other measures that –
o prevent pollution and ecological degradation;
o promote conservation;
o secure ecologically sustainable development and use of natural resources, and
o while promoting justifiable economic and social development.
5.2 National Environmental Management Act, 1998 (Act No. 107 of 1998)
The National Environmental Management Act, No. 107 of 1998 (NEMA), as amended, is the
primary statute which gives effect to Section 24 of the Constitution. The Environmental Right
contained in Section 24 of the Constitution also places responsibility on the EAP, Applicant
and Competent Authority to ensure that this right is not infringed upon. The Sector Guidelines
for Environmental Impact Assessment (2010) (Government Notice 6541) describe several
1 Government Notice 654: National Environmental Management Act (Act 107 of 1998) Implementation Guidelines, Sector Guidelines for Environmental Impact Assessment Regulations, published in Government Gazette 33333, dated 29 June 2010.
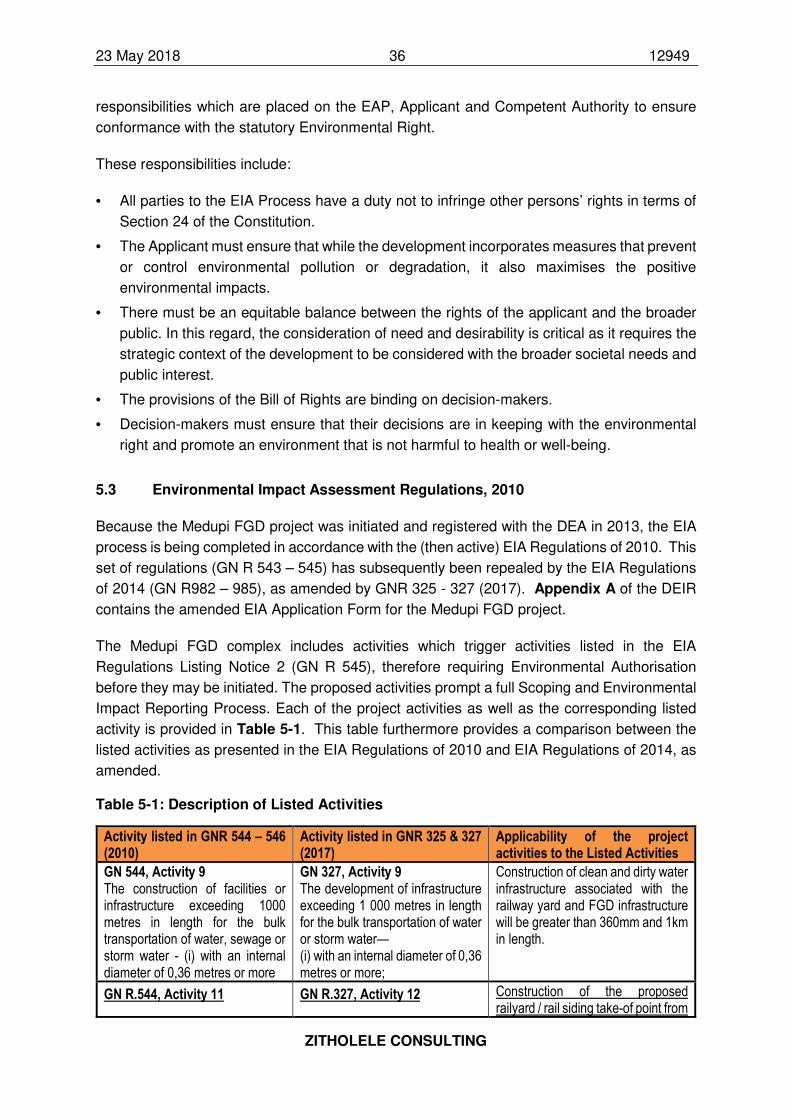
23 May 2018 36 12949
ZITHOLELE CONSULTING
responsibilities which are placed on the EAP, Applicant and Competent Authority to ensure
conformance with the statutory Environmental Right.
These responsibilities include:
• All parties to the EIA Process have a duty not to infringe other persons’ rights in terms of
Section 24 of the Constitution.
• The Applicant must ensure that while the development incorporates measures that prevent
or control environmental pollution or degradation, it also maximises the positive
environmental impacts.
• There must be an equitable balance between the rights of the applicant and the broader
public. In this regard, the consideration of need and desirability is critical as it requires the
strategic context of the development to be considered with the broader societal needs and
public interest.
• The provisions of the Bill of Rights are binding on decision-makers.
• Decision-makers must ensure that their decisions are in keeping with the environmental
right and promote an environment that is not harmful to health or well-being.
5.3 Environmental Impact Assessment Regulations, 2010
Because the Medupi FGD project was initiated and registered with the DEA in 2013, the EIA
process is being completed in accordance with the (then active) EIA Regulations of 2010. This
set of regulations (GN R 543 – 545) has subsequently been repealed by the EIA Regulations
of 2014 (GN R982 – 985), as amended by GNR 325 - 327 (2017). Appendix A of the DEIR
contains the amended EIA Application Form for the Medupi FGD project.
The Medupi FGD complex includes activities which trigger activities listed in the EIA
Regulations Listing Notice 2 (GN R 545), therefore requiring Environmental Authorisation
before they may be initiated. The proposed activities prompt a full Scoping and Environmental
Impact Reporting Process. Each of the project activities as well as the corresponding listed
activity is provided in Table 5-1. This table furthermore provides a comparison between the
listed activities as presented in the EIA Regulations of 2010 and EIA Regulations of 2014, as
amended.
Table 5-1: Description of Listed Activities
Activity listed in GNR 544 – 546 (2010)
Activity listed in GNR 325 & 327 (2017)
Applicability of the project activities to the Listed Activities
GN 544, Activity 9 The construction of facilities or infrastructure exceeding 1000 metres in length for the bulk transportation of water, sewage or storm water - (i) with an internal diameter of 0,36 metres or more
GN 327, Activity 9 The development of infrastructure exceeding 1 000 metres in length for the bulk transportation of water or storm water— (i) with an internal diameter of 0,36 metres or more;
Construction of clean and dirty water infrastructure associated with the railway yard and FGD infrastructure will be greater than 360mm and 1km in length.
GN R.544, Activity 11 GN R.327, Activity 12 Construction of the proposed railyard / rail siding take-of point from
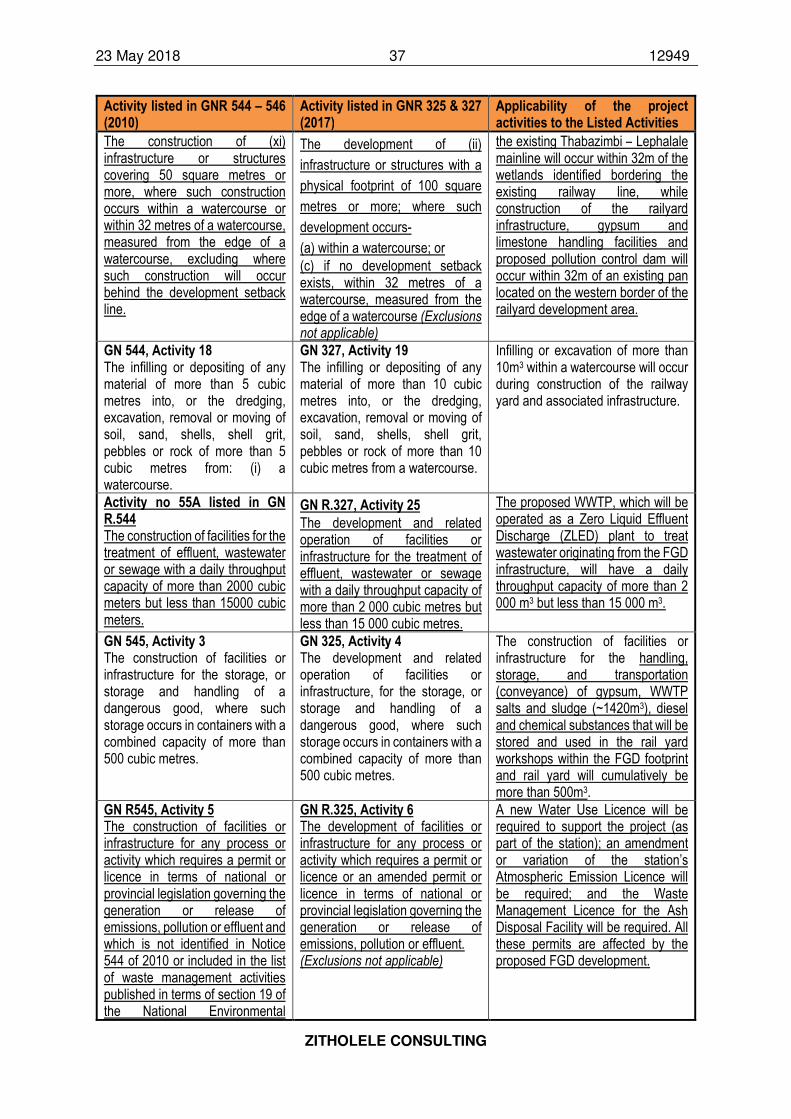
23 May 2018 37 12949
ZITHOLELE CONSULTING
Activity listed in GNR 544 – 546 (2010)
Activity listed in GNR 325 & 327 (2017)
Applicability of the project activities to the Listed Activities
The construction of (xi) infrastructure or structures covering 50 square metres or more, where such construction occurs within a watercourse or within 32 metres of a watercourse, measured from the edge of a watercourse, excluding where such construction will occur behind the development setback line.
The development of (ii)
infrastructure or structures with a
physical footprint of 100 square
metres or more; where such
development occurs-
(a) within a watercourse; or
(c) if no development setback exists, within 32 metres of a watercourse, measured from the edge of a watercourse (Exclusions not applicable)
the existing Thabazimbi – Lephalale mainline will occur within 32m of the wetlands identified bordering the existing railway line, while construction of the railyard infrastructure, gypsum and limestone handling facilities and proposed pollution control dam will occur within 32m of an existing pan located on the western border of the railyard development area.
GN 544, Activity 18 The infilling or depositing of any material of more than 5 cubic metres into, or the dredging, excavation, removal or moving of soil, sand, shells, shell grit, pebbles or rock of more than 5 cubic metres from: (i) a watercourse.
GN 327, Activity 19 The infilling or depositing of any material of more than 10 cubic metres into, or the dredging, excavation, removal or moving of soil, sand, shells, shell grit, pebbles or rock of more than 10 cubic metres from a watercourse.
Infilling or excavation of more than 10m3 within a watercourse will occur during construction of the railway yard and associated infrastructure.
Activity no 55A listed in GN R.544 The construction of facilities for the treatment of effluent, wastewater or sewage with a daily throughput capacity of more than 2000 cubic meters but less than 15000 cubic meters.
GN R.327, Activity 25
The development and related operation of facilities or infrastructure for the treatment of effluent, wastewater or sewage with a daily throughput capacity of more than 2 000 cubic metres but less than 15 000 cubic metres.
The proposed WWTP, which will be operated as a Zero Liquid Effluent Discharge (ZLED) plant to treat wastewater originating from the FGD infrastructure, will have a daily throughput capacity of more than 2 000 m3 but less than 15 000 m3.
GN 545, Activity 3 The construction of facilities or infrastructure for the storage, or storage and handling of a dangerous good, where such storage occurs in containers with a combined capacity of more than 500 cubic metres.
GN 325, Activity 4 The development and related operation of facilities or infrastructure, for the storage, or storage and handling of a dangerous good, where such storage occurs in containers with a combined capacity of more than 500 cubic metres.
The construction of facilities or infrastructure for the handling, storage, and transportation (conveyance) of gypsum, WWTP salts and sludge (~1420m3), diesel and chemical substances that will be stored and used in the rail yard workshops within the FGD footprint and rail yard will cumulatively be more than 500m3.
GN R545, Activity 5 The construction of facilities or infrastructure for any process or activity which requires a permit or licence in terms of national or provincial legislation governing the generation or release of emissions, pollution or effluent and which is not identified in Notice 544 of 2010 or included in the list of waste management activities published in terms of section 19 of the National Environmental
GN R.325, Activity 6 The development of facilities or infrastructure for any process or activity which requires a permit or licence or an amended permit or licence in terms of national or provincial legislation governing the generation or release of emissions, pollution or effluent. (Exclusions not applicable)
A new Water Use Licence will be required to support the project (as part of the station); an amendment or variation of the station’s Atmospheric Emission Licence will be required; and the Waste Management Licence for the Ash Disposal Facility will be required. All these permits are affected by the proposed FGD development.
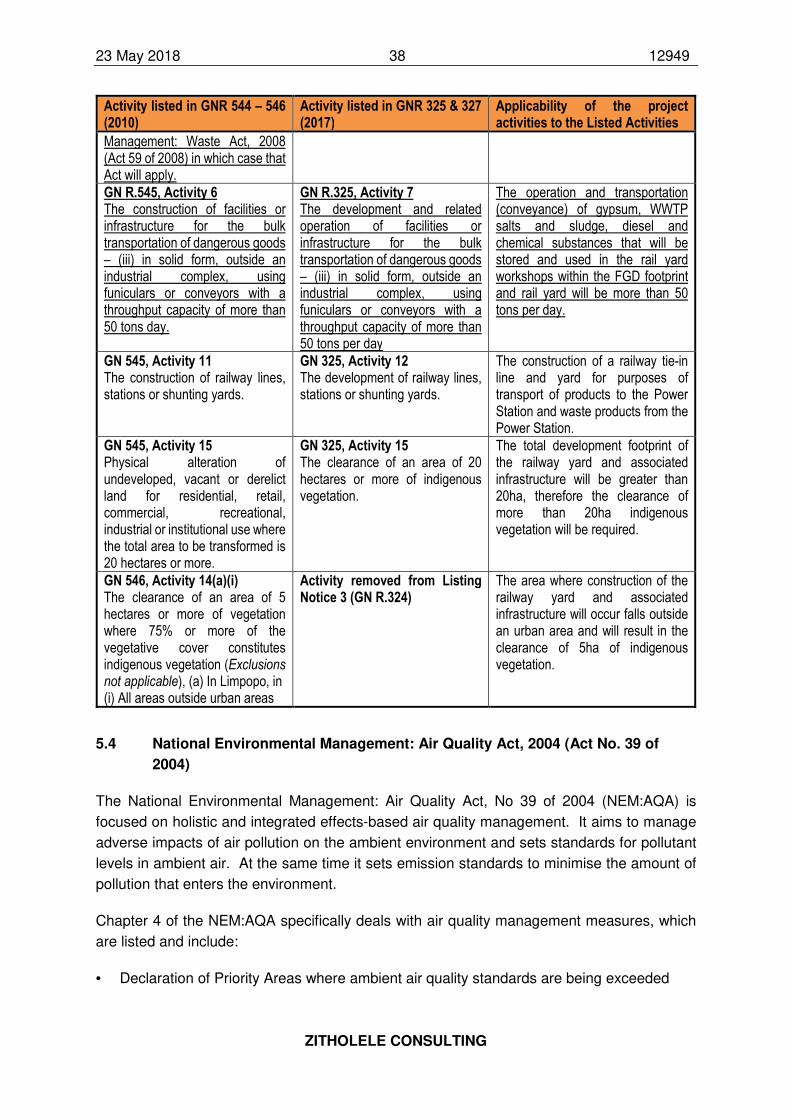
23 May 2018 38 12949
ZITHOLELE CONSULTING
Activity listed in GNR 544 – 546 (2010)
Activity listed in GNR 325 & 327 (2017)
Applicability of the project activities to the Listed Activities
Management: Waste Act, 2008 (Act 59 of 2008) in which case that Act will apply.
GN R.545, Activity 6 The construction of facilities or infrastructure for the bulk transportation of dangerous goods – (iii) in solid form, outside an industrial complex, using funiculars or conveyors with a throughput capacity of more than 50 tons day.
GN R.325, Activity 7 The development and related operation of facilities or infrastructure for the bulk transportation of dangerous goods – (iii) in solid form, outside an industrial complex, using funiculars or conveyors with a throughput capacity of more than 50 tons per day
The operation and transportation (conveyance) of gypsum, WWTP salts and sludge, diesel and chemical substances that will be stored and used in the rail yard workshops within the FGD footprint and rail yard will be more than 50 tons per day.
GN 545, Activity 11 The construction of railway lines, stations or shunting yards.
GN 325, Activity 12 The development of railway lines, stations or shunting yards.
The construction of a railway tie-in line and yard for purposes of transport of products to the Power Station and waste products from the Power Station.
GN 545, Activity 15 Physical alteration of undeveloped, vacant or derelict land for residential, retail, commercial, recreational, industrial or institutional use where the total area to be transformed is 20 hectares or more.
GN 325, Activity 15 The clearance of an area of 20 hectares or more of indigenous vegetation.
The total development footprint of the railway yard and associated infrastructure will be greater than 20ha, therefore the clearance of more than 20ha indigenous vegetation will be required.
GN 546, Activity 14(a)(i) The clearance of an area of 5 hectares or more of vegetation where 75% or more of the vegetative cover constitutes indigenous vegetation (Exclusions not applicable), (a) In Limpopo, in (i) All areas outside urban areas
Activity removed from Listing Notice 3 (GN R.324)
The area where construction of the railway yard and associated infrastructure will occur falls outside an urban area and will result in the clearance of 5ha of indigenous vegetation.
5.4 National Environmental Management: Air Quality Act, 2004 (Act No. 39 of
2004)
The National Environmental Management: Air Quality Act, No 39 of 2004 (NEM:AQA) is
focused on holistic and integrated effects-based air quality management. It aims to manage
adverse impacts of air pollution on the ambient environment and sets standards for pollutant
levels in ambient air. At the same time it sets emission standards to minimise the amount of
pollution that enters the environment.
Chapter 4 of the NEM:AQA specifically deals with air quality management measures, which
are listed and include:
• Declaration of Priority Areas where ambient air quality standards are being exceeded
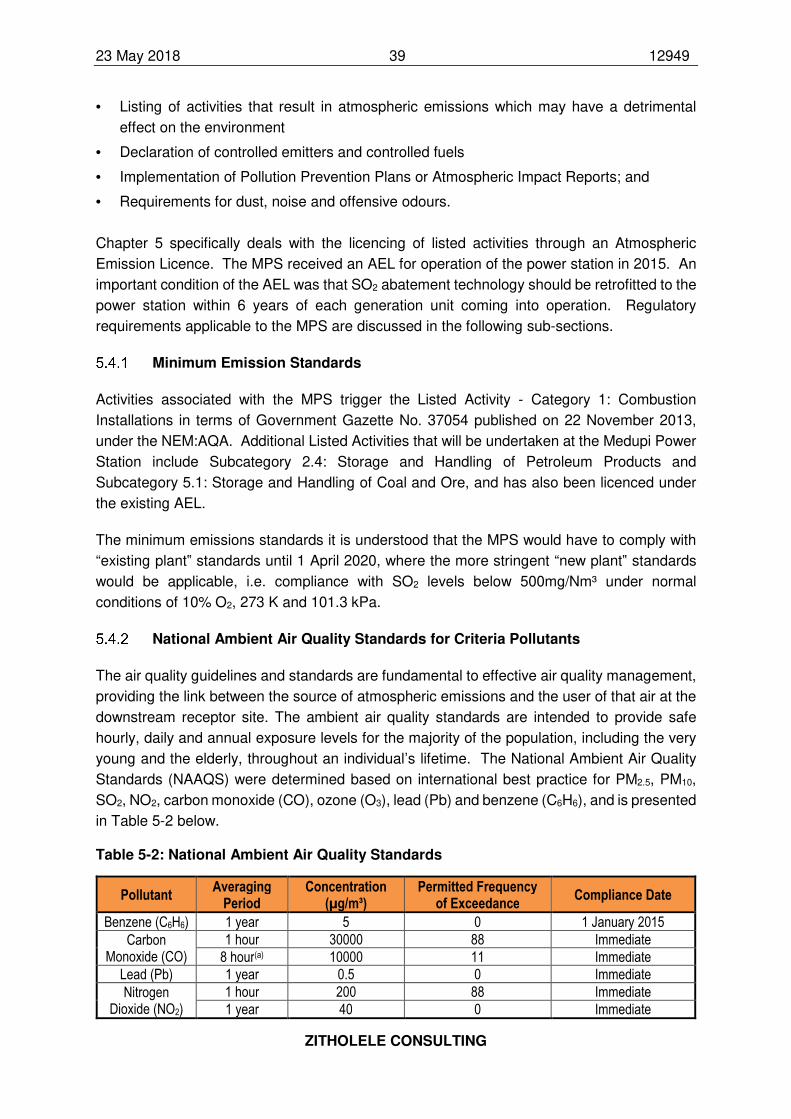
23 May 2018 39 12949
ZITHOLELE CONSULTING
• Listing of activities that result in atmospheric emissions which may have a detrimental
effect on the environment
• Declaration of controlled emitters and controlled fuels
• Implementation of Pollution Prevention Plans or Atmospheric Impact Reports; and
• Requirements for dust, noise and offensive odours.
Chapter 5 specifically deals with the licencing of listed activities through an Atmospheric
Emission Licence. The MPS received an AEL for operation of the power station in 2015. An
important condition of the AEL was that SO2 abatement technology should be retrofitted to the
power station within 6 years of each generation unit coming into operation. Regulatory
requirements applicable to the MPS are discussed in the following sub-sections.
Minimum Emission Standards
Activities associated with the MPS trigger the Listed Activity - Category 1: Combustion
Installations in terms of Government Gazette No. 37054 published on 22 November 2013,
under the NEM:AQA. Additional Listed Activities that will be undertaken at the Medupi Power
Station include Subcategory 2.4: Storage and Handling of Petroleum Products and
Subcategory 5.1: Storage and Handling of Coal and Ore, and has also been licenced under
the existing AEL.
The minimum emissions standards it is understood that the MPS would have to comply with
“existing plant‟ standards until 1 April 2020, where the more stringent “new plant‟ standards
would be applicable, i.e. compliance with SO2 levels below 500mg/Nm³ under normal
conditions of 10% O2, 273 K and 101.3 kPa.
National Ambient Air Quality Standards for Criteria Pollutants
The air quality guidelines and standards are fundamental to effective air quality management,
providing the link between the source of atmospheric emissions and the user of that air at the
downstream receptor site. The ambient air quality standards are intended to provide safe
hourly, daily and annual exposure levels for the majority of the population, including the very
young and the elderly, throughout an individual’s lifetime. The National Ambient Air Quality
Standards (NAAQS) were determined based on international best practice for PM2.5, PM10,
SO2, NO2, carbon monoxide (CO), ozone (O3), lead (Pb) and benzene (C6H6), and is presented
in Table 5-2 below.
Table 5-2: National Ambient Air Quality Standards
Pollutant Averaging
Period Concentration
(µg/m³) Permitted Frequency
of Exceedance Compliance Date
Benzene (C6H6) 1 year 5 0 1 January 2015
Carbon Monoxide (CO)
1 hour 30000 88 Immediate
8 hour(a) 10000 11 Immediate
Lead (Pb) 1 year 0.5 0 Immediate
Nitrogen Dioxide (NO2)
1 hour 200 88 Immediate
1 year 40 0 Immediate
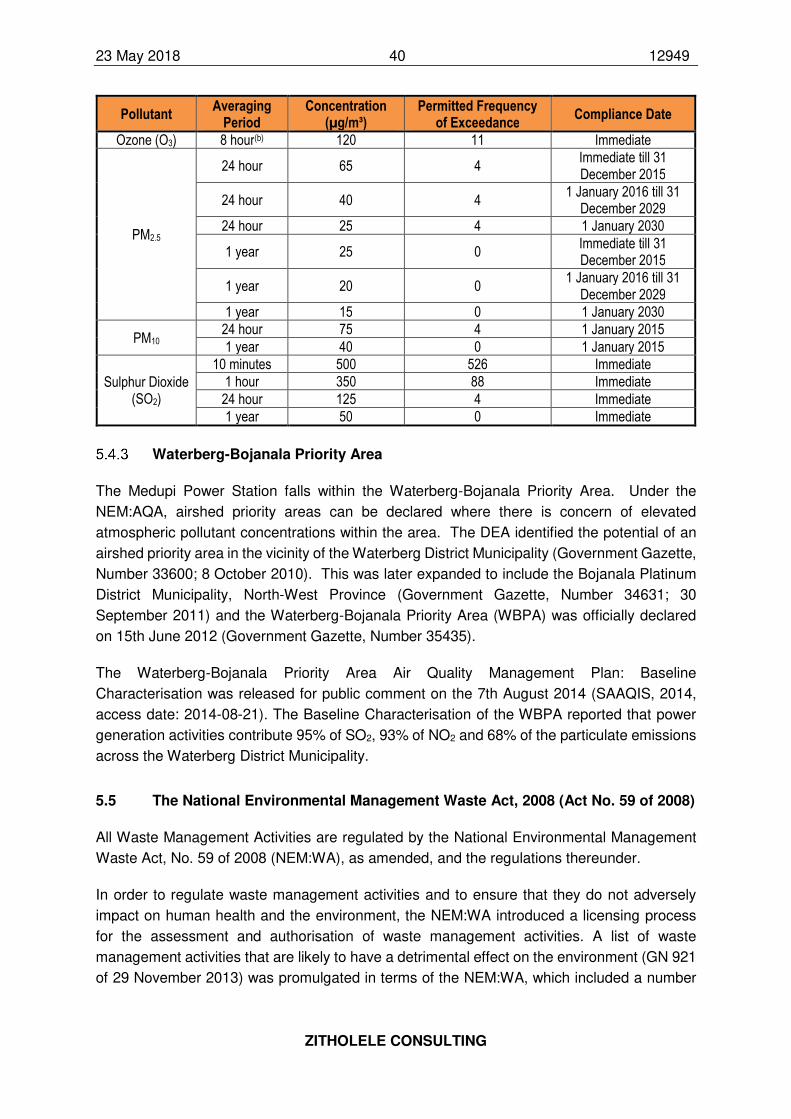
23 May 2018 40 12949
ZITHOLELE CONSULTING
Pollutant Averaging
Period Concentration
(µg/m³) Permitted Frequency
of Exceedance Compliance Date
Ozone (O3) 8 hour(b) 120 11 Immediate
PM2.5
24 hour 65 4 Immediate till 31 December 2015
24 hour 40 4 1 January 2016 till 31
December 2029
24 hour 25 4 1 January 2030
1 year 25 0 Immediate till 31 December 2015
1 year 20 0 1 January 2016 till 31
December 2029
1 year 15 0 1 January 2030
PM10 24 hour 75 4 1 January 2015
1 year 40 0 1 January 2015
Sulphur Dioxide (SO2)
10 minutes 500 526 Immediate
1 hour 350 88 Immediate
24 hour 125 4 Immediate
1 year 50 0 Immediate
Waterberg-Bojanala Priority Area
The Medupi Power Station falls within the Waterberg-Bojanala Priority Area. Under the
NEM:AQA, airshed priority areas can be declared where there is concern of elevated
atmospheric pollutant concentrations within the area. The DEA identified the potential of an
airshed priority area in the vicinity of the Waterberg District Municipality (Government Gazette,
Number 33600; 8 October 2010). This was later expanded to include the Bojanala Platinum
District Municipality, North-West Province (Government Gazette, Number 34631; 30
September 2011) and the Waterberg-Bojanala Priority Area (WBPA) was officially declared
on 15th June 2012 (Government Gazette, Number 35435).
The Waterberg-Bojanala Priority Area Air Quality Management Plan: Baseline
Characterisation was released for public comment on the 7th August 2014 (SAAQIS, 2014,
access date: 2014-08-21). The Baseline Characterisation of the WBPA reported that power
generation activities contribute 95% of SO2, 93% of NO2 and 68% of the particulate emissions
across the Waterberg District Municipality.
5.5 The National Environmental Management Waste Act, 2008 (Act No. 59 of 2008)
All Waste Management Activities are regulated by the National Environmental Management
Waste Act, No. 59 of 2008 (NEM:WA), as amended, and the regulations thereunder.
In order to regulate waste management activities and to ensure that they do not adversely
impact on human health and the environment, the NEM:WA introduced a licensing process
for the assessment and authorisation of waste management activities. A list of waste
management activities that are likely to have a detrimental effect on the environment (GN 921
of 29 November 2013) was promulgated in terms of the NEM:WA, which included a number
23 May 2018 41 12949
ZITHOLELE CONSULTING
of amendments to date with the latest amendment effected on 24 July 2015 through the
promulgation of GN R633.
List of waste management activities that have, or are likely to have, a
detrimental effect on the environment (GN 921 of 29 November 2013)
All waste management activities which are listed in Government Notice (GN) 921, as
amended, requires authorisation from the Competent Authority (CA) before these activities
may proceed. GN 921 furthermore group waste management activities in this list according to
the potential environmental harm that may result from the activity and as a result waste
management activities were divided between 3 schedules.
Schedule A contain waste management activities that require a Basic Assessment Process to
be undertaken in an integrated fashion with an application for a WML, while Schedule B
contain waste management activities that require an EIA and Scoping processes to be
undertaken together with an application for a WML. The third schedule, Schedule C, contain
waste management activities that is subject to the conditions and specifications of
promulgated Norms and Standards developed to prevent serious environmental harm from
known impacts associated with each waste management activity.
Conformance with the stipulated Norms and Standards in Schedule C therefore avoids the
need to apply for a WML with the CA. The proponent will however need to demonstrate
conformance with the stipulations of these Norms and Standards through a registration
process with the CA prior to constructing the waste facility.
Norms and standards for the classification, assessment and disposal of
waste to landfill
Norms and standards for the classification, assessment and disposal of waste to landfill were
promulgated in 2013 in 3 separate notices to manage the disposal of waste to landfill:
• GN R. 634: NEM:WA: Waste Classification and Management Regulations
• GN R. 635: NEM:WA: National norms and standards for the assessment of waste for
landfill disposal
• GN R. 636: NEM:WA: National norms and standards for disposal of waste to landfill.
Owing to the nature and composition of the gypsum, sludge and salts, these by-products of
the FGD process were classified in terms of the NEM:WA: Waste Classification and
Management Regulations (GN R634 of 23 August 2013).
Norms and standards for the storage of waste
National norms and standards for the storage of waste were also promulgated in 2013 in
GN R. 926 (29 November 2013), which provided norms and standards for the storage of
hazardous and general waste. In terms of GN R. 926 a WML would not be required for waste
storage facilities that conform to the stipulations and conditions in these norms and standards,
23 May 2018 42 12949
ZITHOLELE CONSULTING
however the waste activity and storage facility would need to be registered before
commencement of the proposed waste activities with the relevant authorities.
Applicability of the NEM:WA
During the course of the EIA process the site screening assessment to investigate feasible
alternative waste disposal sites for a new waste disposal facility indicated that most of the sites
had challenges that would require extensive interventions, which would compromise delivery
of this application. As a result the proponent reached the decision to remove the assessment
and authorisation of the new waste disposal facility from the scope of this EIA process.
Furthermore, the disposal of gypsum together with ash on the existing authorised waste
disposal facility west of the MPS would be licenced through an amendment application to the
existing WML.
Due to the decision to remove the assessment of a new waste disposal facility for ash,
gypsum, and WWTP salts and sludge from the scope of this EIA process, the management of
the storage facility for the storage of salt and sludge would be undertaken through a
registration process of the proposed waste storage facility in terms of GN R. 926, although
triggered NEMA listed activities will be addressed in this application.
The licencing of proposed waste disposal and storage activities and facilities is resultantly
removed from this EIA process although any activities associated with the waste facility will
still be considered and included in terms of the NEMA Listed Activities.
5.6 The National Water Act, 1998 (Act No. 36 of 1998)
The activities associated with the proposed Medupi FGD Retrofit project trigger a number
Water Uses that are defined in Section 21 of the National Water Act, 1998 (Act No. 36 of 1998)
(NWA) (refer to Table 5-3). Accordingly, these Water Uses may not be undertaken without
being granted a Water Use License from the DWS.
In accordance with Sections 40 and 41 of the NWA (1998), a Water Use License Application
Process will be carried out. The resultant documents from the WULA process will include
completed WULA forms as well as a Technical Report. These documents will be submitted to
DWS for review and decision making. Although a joint PPP is followed for the WULA within
the EIA Phase, these two processes constitute separate applications and submissions are
made to the respective Competent Authorities.
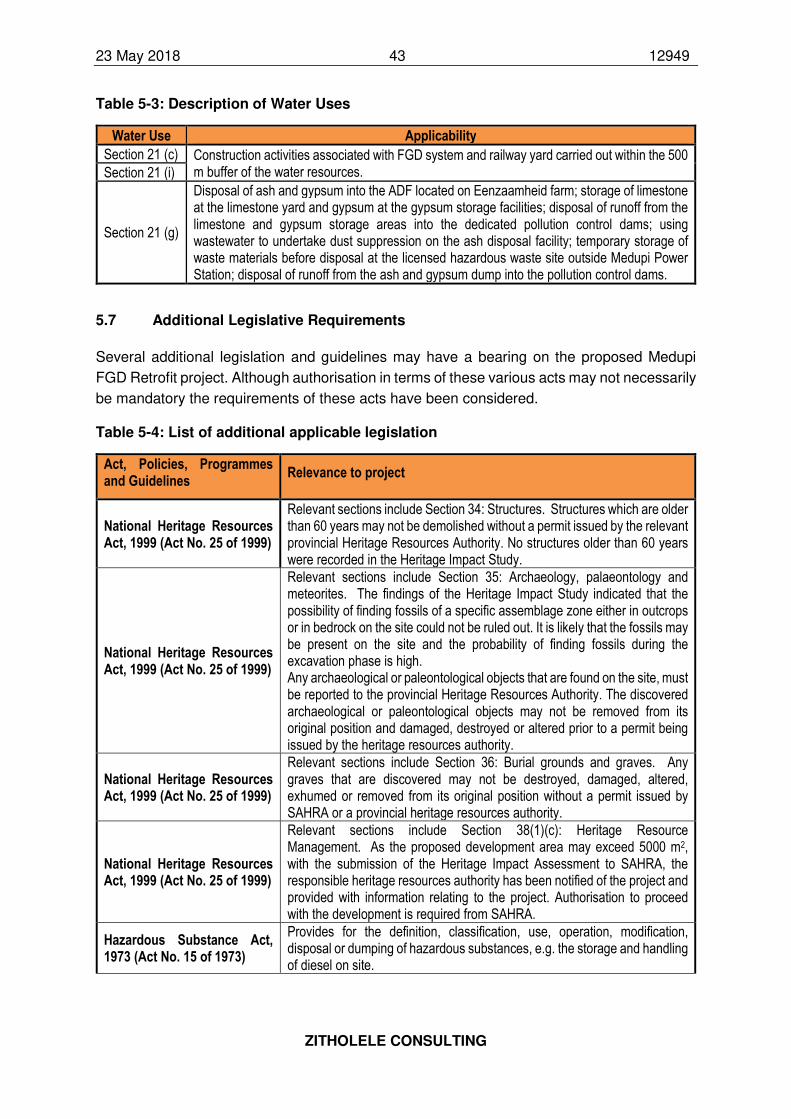
23 May 2018 43 12949
ZITHOLELE CONSULTING
Table 5-3: Description of Water Uses
Water Use Applicability
Section 21 (c) Construction activities associated with FGD system and railway yard carried out within the 500 m buffer of the water resources. Section 21 (i)
Section 21 (g)
Disposal of ash and gypsum into the ADF located on Eenzaamheid farm; storage of limestone at the limestone yard and gypsum at the gypsum storage facilities; disposal of runoff from the limestone and gypsum storage areas into the dedicated pollution control dams; using wastewater to undertake dust suppression on the ash disposal facility; temporary storage of waste materials before disposal at the licensed hazardous waste site outside Medupi Power Station; disposal of runoff from the ash and gypsum dump into the pollution control dams.
5.7 Additional Legislative Requirements
Several additional legislation and guidelines may have a bearing on the proposed Medupi
FGD Retrofit project. Although authorisation in terms of these various acts may not necessarily
be mandatory the requirements of these acts have been considered.
Table 5-4: List of additional applicable legislation
Act, Policies, Programmes and Guidelines
Relevance to project
National Heritage Resources Act, 1999 (Act No. 25 of 1999)
Relevant sections include Section 34: Structures. Structures which are older than 60 years may not be demolished without a permit issued by the relevant provincial Heritage Resources Authority. No structures older than 60 years were recorded in the Heritage Impact Study.
National Heritage Resources Act, 1999 (Act No. 25 of 1999)
Relevant sections include Section 35: Archaeology, palaeontology and meteorites. The findings of the Heritage Impact Study indicated that the possibility of finding fossils of a specific assemblage zone either in outcrops or in bedrock on the site could not be ruled out. It is likely that the fossils may be present on the site and the probability of finding fossils during the excavation phase is high. Any archaeological or paleontological objects that are found on the site, must be reported to the provincial Heritage Resources Authority. The discovered archaeological or paleontological objects may not be removed from its original position and damaged, destroyed or altered prior to a permit being issued by the heritage resources authority.
National Heritage Resources Act, 1999 (Act No. 25 of 1999)
Relevant sections include Section 36: Burial grounds and graves. Any graves that are discovered may not be destroyed, damaged, altered, exhumed or removed from its original position without a permit issued by SAHRA or a provincial heritage resources authority.
National Heritage Resources Act, 1999 (Act No. 25 of 1999)
Relevant sections include Section 38(1)(c): Heritage Resource Management. As the proposed development area may exceed 5000 m2, with the submission of the Heritage Impact Assessment to SAHRA, the responsible heritage resources authority has been notified of the project and provided with information relating to the project. Authorisation to proceed with the development is required from SAHRA.
Hazardous Substance Act, 1973 (Act No. 15 of 1973)
Provides for the definition, classification, use, operation, modification, disposal or dumping of hazardous substances, e.g. the storage and handling of diesel on site.
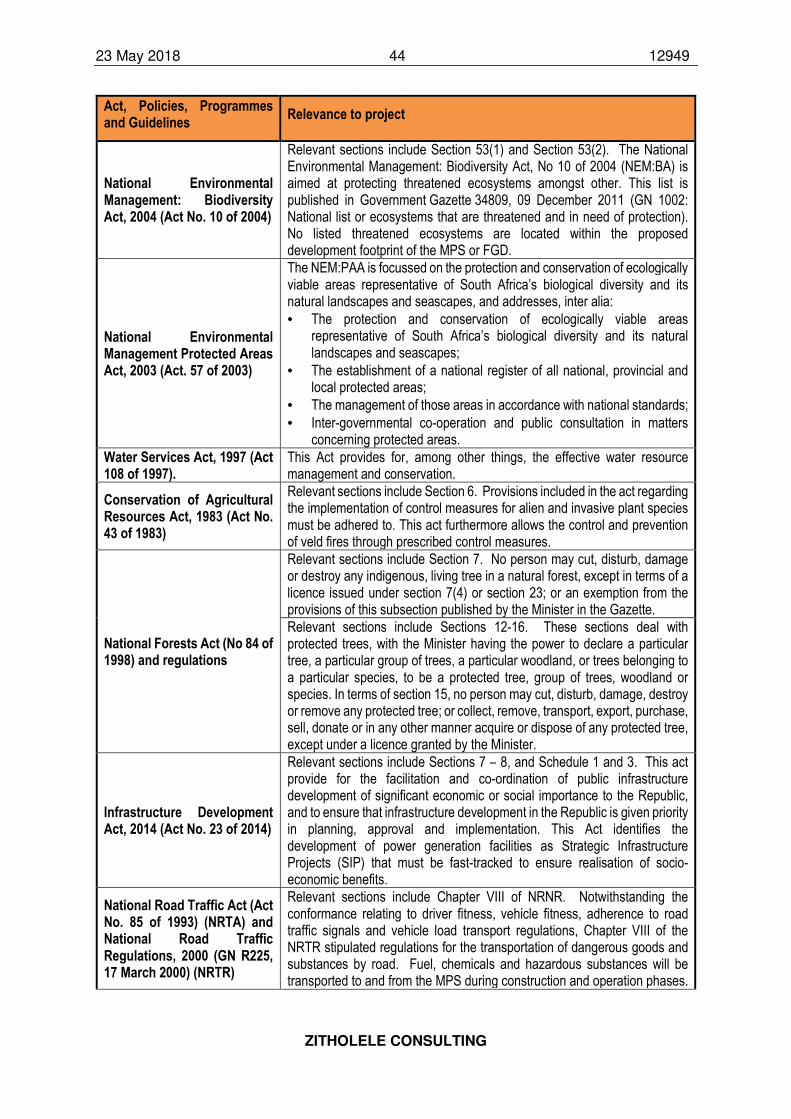
23 May 2018 44 12949
ZITHOLELE CONSULTING
Act, Policies, Programmes and Guidelines
Relevance to project
National Environmental Management: Biodiversity Act, 2004 (Act No. 10 of 2004)
Relevant sections include Section 53(1) and Section 53(2). The National Environmental Management: Biodiversity Act, No 10 of 2004 (NEM:BA) is aimed at protecting threatened ecosystems amongst other. This list is published in Government Gazette 34809, 09 December 2011 (GN 1002: National list or ecosystems that are threatened and in need of protection). No listed threatened ecosystems are located within the proposed development footprint of the MPS or FGD.
National Environmental Management Protected Areas Act, 2003 (Act. 57 of 2003)
The NEM:PAA is focussed on the protection and conservation of ecologically viable areas representative of South Africa’s biological diversity and its natural landscapes and seascapes, and addresses, inter alia:
• The protection and conservation of ecologically viable areas representative of South Africa’s biological diversity and its natural landscapes and seascapes;
• The establishment of a national register of all national, provincial and local protected areas;
• The management of those areas in accordance with national standards;
• Inter-governmental co-operation and public consultation in matters concerning protected areas.
Water Services Act, 1997 (Act 108 of 1997).
This Act provides for, among other things, the effective water resource management and conservation.
Conservation of Agricultural Resources Act, 1983 (Act No. 43 of 1983)
Relevant sections include Section 6. Provisions included in the act regarding the implementation of control measures for alien and invasive plant species must be adhered to. This act furthermore allows the control and prevention of veld fires through prescribed control measures.
National Forests Act (No 84 of 1998) and regulations
Relevant sections include Section 7. No person may cut, disturb, damage or destroy any indigenous, living tree in a natural forest, except in terms of a licence issued under section 7(4) or section 23; or an exemption from the provisions of this subsection published by the Minister in the Gazette.
Relevant sections include Sections 12-16. These sections deal with protected trees, with the Minister having the power to declare a particular tree, a particular group of trees, a particular woodland, or trees belonging to a particular species, to be a protected tree, group of trees, woodland or species. In terms of section 15, no person may cut, disturb, damage, destroy or remove any protected tree; or collect, remove, transport, export, purchase, sell, donate or in any other manner acquire or dispose of any protected tree, except under a licence granted by the Minister.
Infrastructure Development Act, 2014 (Act No. 23 of 2014)
Relevant sections include Sections 7 – 8, and Schedule 1 and 3. This act provide for the facilitation and co-ordination of public infrastructure development of significant economic or social importance to the Republic, and to ensure that infrastructure development in the Republic is given priority in planning, approval and implementation. This Act identifies the development of power generation facilities as Strategic Infrastructure Projects (SIP) that must be fast-tracked to ensure realisation of socio-economic benefits.
National Road Traffic Act (Act No. 85 of 1993) (NRTA) and National Road Traffic Regulations, 2000 (GN R225, 17 March 2000) (NRTR)
Relevant sections include Chapter VIII of NRNR. Notwithstanding the conformance relating to driver fitness, vehicle fitness, adherence to road traffic signals and vehicle load transport regulations, Chapter VIII of the NRTR stipulated regulations for the transportation of dangerous goods and substances by road. Fuel, chemicals and hazardous substances will be transported to and from the MPS during construction and operation phases.
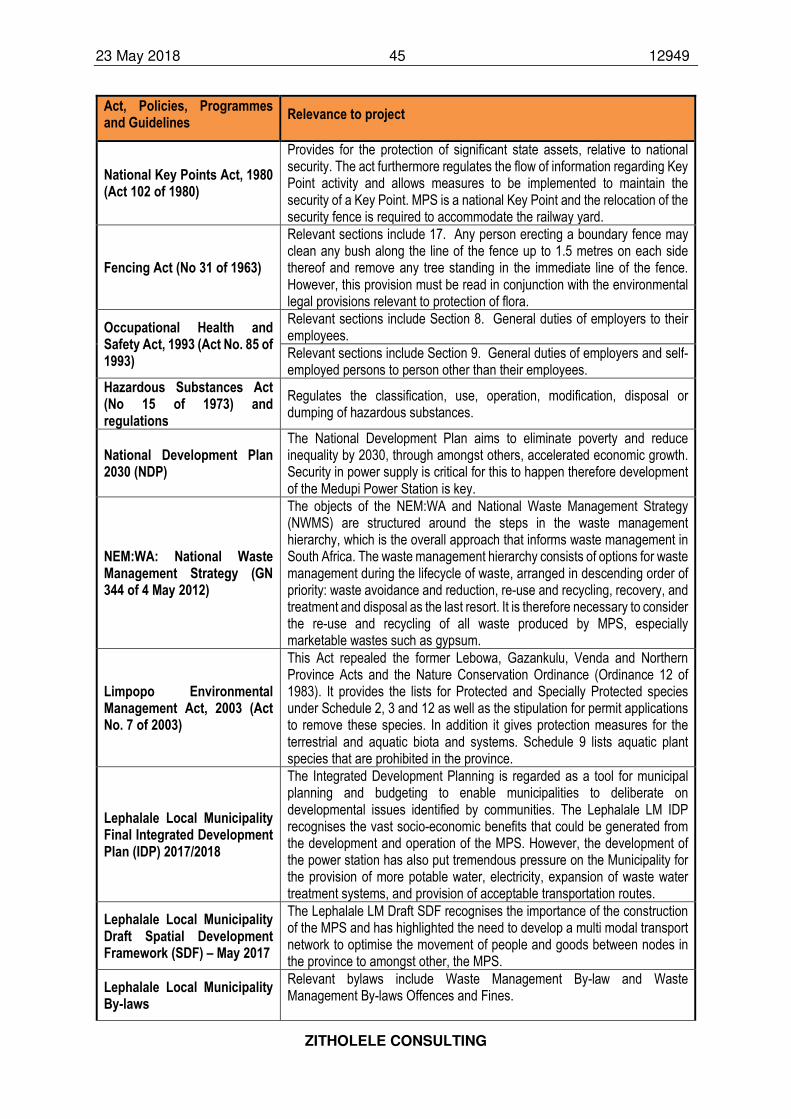
23 May 2018 45 12949
ZITHOLELE CONSULTING
Act, Policies, Programmes and Guidelines
Relevance to project
National Key Points Act, 1980 (Act 102 of 1980)
Provides for the protection of significant state assets, relative to national security. The act furthermore regulates the flow of information regarding Key Point activity and allows measures to be implemented to maintain the security of a Key Point. MPS is a national Key Point and the relocation of the security fence is required to accommodate the railway yard.
Fencing Act (No 31 of 1963)
Relevant sections include 17. Any person erecting a boundary fence may clean any bush along the line of the fence up to 1.5 metres on each side thereof and remove any tree standing in the immediate line of the fence. However, this provision must be read in conjunction with the environmental legal provisions relevant to protection of flora.
Occupational Health and Safety Act, 1993 (Act No. 85 of 1993)
Relevant sections include Section 8. General duties of employers to their employees.
Relevant sections include Section 9. General duties of employers and self-employed persons to person other than their employees.
Hazardous Substances Act (No 15 of 1973) and regulations
Regulates the classification, use, operation, modification, disposal or dumping of hazardous substances.
National Development Plan 2030 (NDP)
The National Development Plan aims to eliminate poverty and reduce inequality by 2030, through amongst others, accelerated economic growth. Security in power supply is critical for this to happen therefore development of the Medupi Power Station is key.
NEM:WA: National Waste Management Strategy (GN 344 of 4 May 2012)
The objects of the NEM:WA and National Waste Management Strategy (NWMS) are structured around the steps in the waste management hierarchy, which is the overall approach that informs waste management in South Africa. The waste management hierarchy consists of options for waste management during the lifecycle of waste, arranged in descending order of priority: waste avoidance and reduction, re-use and recycling, recovery, and treatment and disposal as the last resort. It is therefore necessary to consider the re-use and recycling of all waste produced by MPS, especially marketable wastes such as gypsum.
Limpopo Environmental Management Act, 2003 (Act No. 7 of 2003)
This Act repealed the former Lebowa, Gazankulu, Venda and Northern Province Acts and the Nature Conservation Ordinance (Ordinance 12 of 1983). It provides the lists for Protected and Specially Protected species under Schedule 2, 3 and 12 as well as the stipulation for permit applications to remove these species. In addition it gives protection measures for the terrestrial and aquatic biota and systems. Schedule 9 lists aquatic plant species that are prohibited in the province.
Lephalale Local Municipality Final Integrated Development Plan (IDP) 2017/2018
The Integrated Development Planning is regarded as a tool for municipal planning and budgeting to enable municipalities to deliberate on developmental issues identified by communities. The Lephalale LM IDP recognises the vast socio-economic benefits that could be generated from the development and operation of the MPS. However, the development of the power station has also put tremendous pressure on the Municipality for the provision of more potable water, electricity, expansion of waste water treatment systems, and provision of acceptable transportation routes.
Lephalale Local Municipality Draft Spatial Development Framework (SDF) – May 2017
The Lephalale LM Draft SDF recognises the importance of the construction of the MPS and has highlighted the need to develop a multi modal transport network to optimise the movement of people and goods between nodes in the province to amongst other, the MPS.
Lephalale Local Municipality By-laws
Relevant bylaws include Waste Management By-law and Waste Management By-laws Offences and Fines.
23 May 2018 46 12949
ZITHOLELE CONSULTING
Act, Policies, Programmes and Guidelines
Relevance to project
White Paper on Environmental Management Policy for South Africa (1998)
Through this Policy, Government undertakes to give effect to the many rights in the Constitution that relate to the environment.
National Biodiversity Strategy and Action Plan (NBSAP)
The development of the NBSAP is part of South Africa’s obligations as a signatory to the CBD, and was compiled by the Department of Environmental Affairs and Tourism (DEAT 2005). Through the NBSAP it is recognized that biodiversity cannot be conserved through protected area networks only. All stakeholders, from private landowners and communities to business and industry must get involved in biodiversity management. The NBSAP highlights, in particular, that South Africa’s rivers are poorly protected and that the present status of many of these freshwater ecosystems is disturbing. To ensure further protection and sustainability of South Africa’s wetlands, the DWS (DWAF at the time) initiated the National Aquatic Ecosystem Health Monitoring Programme (NAEHMP) and River Health Programme (RHP)
National Aquatic Ecosystem Health Monitoring Program (NAEHMP) & River Health Program (RHP)
The NAEHMP is a national programme managed by DWS’s Resource Quality Services with support from the Water Research Commission (WRC), the Council for Scientific and Industrial Research (CSIR) and various regional and provincial authorities. The overall purpose of the NAEHMP is to provide ecological information for South African rivers and the broader aquatic ecosystems required to support the rational management of these systems. The best-known component of the NAEHMP is the RHP.
National Freshwater Ecosystem Priority Areas (NFEPA)
The NFEPA project is a multi-partner project between CSIR, South African National Biodiversity Institute (SANBI), Water Research Commission (WRC), Department of Water Affairs (DWA), Department of Environmental Affairs (DEA), Worldwide Fund for Nature (WWF), South African Institute of Aquatic Biodiversity (SAIAB) and South African National Parks (SANParks). The NFEPA project aims to:
• Identify Freshwater Ecosystem Priority Areas (hereafter referred to as ‘FEPAs’) to meet national biodiversity goals for freshwater ecosystems (through systematic biodiversity planning); and
• Develop a basis for enabling effective implementation of measures to protect FEPAs, including free-flowing rivers.
National Water Resource Strategy (NWRS) 2
The NWRS2 (DWA 2013) builds on the first NWRS published in 2004. The purpose of the NWRS2 is to ensure that national water resources are protected, used, developed, conserved, managed and controlled in an efficient and sustainable manner towards achieving South Africa's development priorities in an equitable manner over the next five to 10 years.
Limpopo Conservation Plan version 2, 2013
This conservation plan is consistent with NEMA principles and the NEMBA. It is designed to support integrated development planning and sustainable development by identifying an efficient set of CBAs that are required to meet national and provincial biodiversity objectives, in a configuration that is least conflicting with other land uses and activities. Where alternatives are available, the CBAs are designed to avoid conflict with existing IDPs, EMFs and SDFs in the region by favouring the selection of sites that are least conflicting with other land-uses.
To ensure that a best practice approach was adopted for the EIA Process and to ensure that
the EIR provides sufficient information required by the DEA to reach a decision, the following
guidelines have been considered in the compilation of this Environmental Impact Report:
23 May 2018 47 12949
ZITHOLELE CONSULTING
• National Environmental Management Act, 1998 (Act 107 of 1998) Implementation
Guidelines Sector Guidelines for Environmental Impact Assessment Regulations
Government Notice 654 of 2010, published in Government Gazette 3333, dated 29 June
2010.
• National Environmental Management Act, 1998 (Act 107 of 1998) Publication of Need and
Desirability Guideline in terms of the Environmental Impact Assessment Regulations,
2010, Government Notice 792 of 2012, Government Gazette 35746, dated 05 October
2012.
• Department of Water Affairs & Forestry, 1998. Waste Management Series. Minimum
Requirements for the Handling, Classification and Disposal of Hazardous Waste.
• DEAT (2004) Cumulative Effects Assessment, Integrated Environmental Management,
Information Series 7, Department of Environmental Affairs and Tourism (DEAT), Pretoria
• Department of Environmental Affairs, 2011. A user-friendly guide to the National
Environmental Management: Waste Act, 2008. South Africa. Pretoria.
• DEAT (2004) Criteria for determining Alternatives in EIA, Integrated Environmental
Management, Information Series 11, Department of Environmental Affairs and Tourism
(DEAT), Pretoria.
23 May 2018 48 12949
ZITHOLELE CONSULTING
6 PROJECT DESCRIPTION
6.1 Introduction
Eskom’s Air Quality Strategy (Eskom Holdings SOC Limited, 2015) established a SO2
emissions target of 400mg/Nm3 at 6% O2 for power stations commissioned between 2002 and
2017. This target complies with the minimum emissions standards stipulated by the National
Environmental Management: Air Quality Act (Act 39 of 2004), which requires a concentration
of 500mg/Nm3 at 10% O2. The Air Quality Strategy further recommended that Medupi Power
Station be fitted with a flue gas desulphurisation technology in order to comply with the
emissions standards set.
Medupi Power Station units have been designed, and constructed, with provisions
incorporated into the space and equipment design to accommodate the installation of the wet
limestone FGD system.
The Medupi FGD retrofit is designed to accommodate varying coal qualities ranging from
design coal with low sulphur content (1.2 % sulphur, air dried basis) up to “worst” coal quality
with a higher sulphur content (1.8 % sulphur, air dried basis). The actual limestone
composition that will be utilised is not yet finalised as sourcing is still underway, but the process
caters for the worst-case limestone quality, i.e. with 85% CaCO3.
The development of the Medupi FGD system has been ongoing over a number of years, with
a number of engineering specialists and service providers designing different aspects of the
overall FGD system. As a result several documents have been compiled dealing with specific
aspects, structures or infrastructure associated with the FGD system as a whole. A list of the
relevant documents and reports relating to the design of infrastructure for and associated with
the FGD that that were considered in this report are provided below:
• Harris, 2014. Medupi FGD Retrofit Conceptual Design Report. Unique Identifier 200-
61771, Reference No.: 174330.40.1000. Eskom Holdings SOC Limited, 966pp
• Harris, 2014. Medupi FGD Retrofit Basic Design Report. Eskom Holdings SOC Limited,
105pp
• Black and Veatch, 2014. Medupi Power Station 6 x 800 MW (GROSS) Units Wet Flue Gas
Desulfurization (FGD) Retrofit: Project Design Manual, 129pp
• Bosch Holdings Consortium, 2015. Basic and Detailed Design of Medupi Railway yard and
Offloading Facility, Project No.: P1184-099-1. Eskom Holdings SOC Limited, 124pp
• Harris, 2014. Medupi FGD Retrofit Technology Selection Study Report, Unique Identifier
474-10175, Reference No.: 178771.41.0050. Eskom Holdings SOC Limited, 23pp
• Knight Piésold Consulting, 2017. Medupi Power Station: Conceptual design of stormwater
management, sewage infrastructure and access roads between boiler edge slab and road
no.3 (ring road west) and design of the new gypsum offtake infrastructure slab, associated
drainage, and access roads, KP Ref No.: 303-00828/01 and Eskom Ref No.: 200-605353.
Eskom Holdings SOC Limited, 130pp
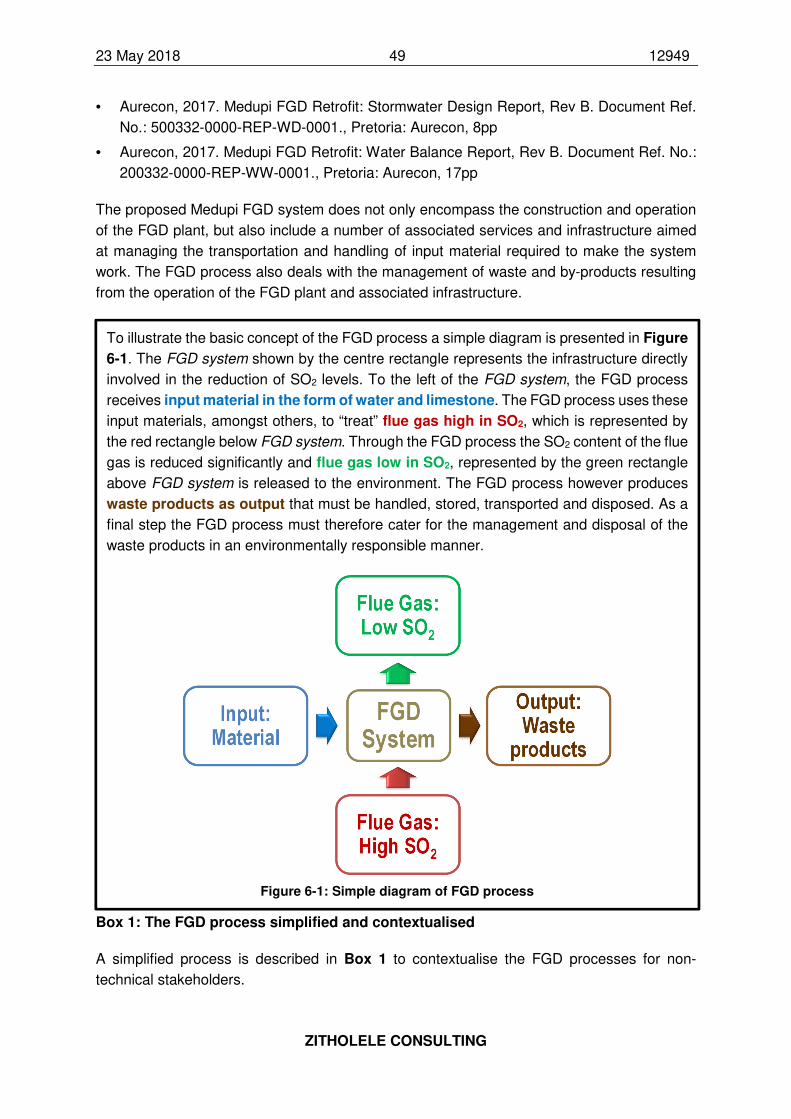
23 May 2018 49 12949
ZITHOLELE CONSULTING
• Aurecon, 2017. Medupi FGD Retrofit: Stormwater Design Report, Rev B. Document Ref.
No.: 500332-0000-REP-WD-0001., Pretoria: Aurecon, 8pp
• Aurecon, 2017. Medupi FGD Retrofit: Water Balance Report, Rev B. Document Ref. No.:
200332-0000-REP-WW-0001., Pretoria: Aurecon, 17pp
The proposed Medupi FGD system does not only encompass the construction and operation
of the FGD plant, but also include a number of associated services and infrastructure aimed
at managing the transportation and handling of input material required to make the system
work. The FGD process also deals with the management of waste and by-products resulting
from the operation of the FGD plant and associated infrastructure.
Box 1: The FGD process simplified and contextualised
A simplified process is described in Box 1 to contextualise the FGD processes for non-
technical stakeholders.
To illustrate the basic concept of the FGD process a simple diagram is presented in Figure
6-1. The FGD system shown by the centre rectangle represents the infrastructure directly
involved in the reduction of SO2 levels. To the left of the FGD system, the FGD process
receives input material in the form of water and limestone. The FGD process uses these
input materials, amongst others, to “treat” flue gas high in SO2, which is represented by
the red rectangle below FGD system. Through the FGD process the SO2 content of the flue
gas is reduced significantly and flue gas low in SO2, represented by the green rectangle
above FGD system is released to the environment. The FGD process however produces
waste products as output that must be handled, stored, transported and disposed. As a
final step the FGD process must therefore cater for the management and disposal of the
waste products in an environmentally responsible manner.
Figure 6-1: Simple diagram of FGD process
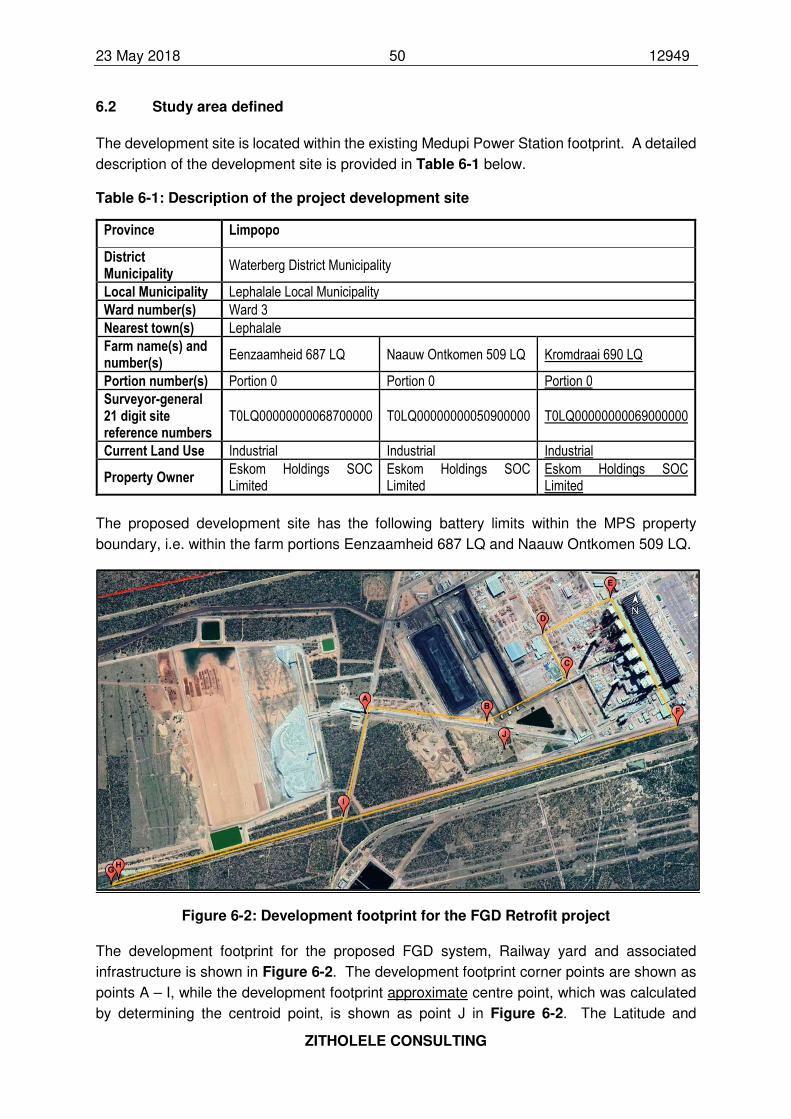
23 May 2018 50 12949
ZITHOLELE CONSULTING
6.2 Study area defined
The development site is located within the existing Medupi Power Station footprint. A detailed
description of the development site is provided in Table 6-1 below.
Table 6-1: Description of the project development site
Province Limpopo
District Municipality
Waterberg District Municipality
Local Municipality Lephalale Local Municipality
Ward number(s) Ward 3
Nearest town(s) Lephalale
Farm name(s) and number(s)
Eenzaamheid 687 LQ Naauw Ontkomen 509 LQ Kromdraai 690 LQ
Portion number(s) Portion 0 Portion 0 Portion 0
Surveyor-general 21 digit site reference numbers
T0LQ00000000068700000 T0LQ00000000050900000 T0LQ00000000069000000
Current Land Use Industrial Industrial Industrial
Property Owner Eskom Holdings SOC Limited
Eskom Holdings SOC Limited
Eskom Holdings SOC Limited
The proposed development site has the following battery limits within the MPS property
boundary, i.e. within the farm portions Eenzaamheid 687 LQ and Naauw Ontkomen 509 LQ.
Figure 6-2: Development footprint for the FGD Retrofit project
The development footprint for the proposed FGD system, Railway yard and associated
infrastructure is shown in Figure 6-2. The development footprint corner points are shown as
points A – I, while the development footprint approximate centre point, which was calculated
by determining the centroid point, is shown as point J in Figure 6-2. The Latitude and
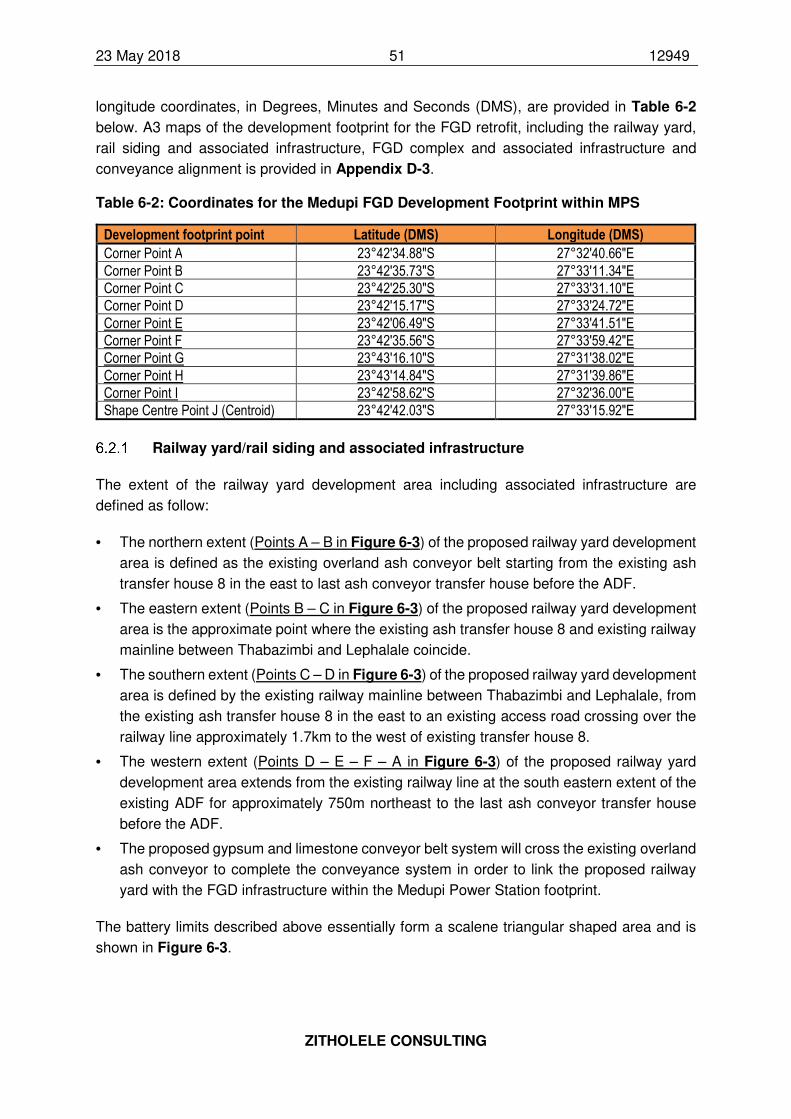
23 May 2018 51 12949
ZITHOLELE CONSULTING
longitude coordinates, in Degrees, Minutes and Seconds (DMS), are provided in Table 6-2
below. A3 maps of the development footprint for the FGD retrofit, including the railway yard,
rail siding and associated infrastructure, FGD complex and associated infrastructure and
conveyance alignment is provided in Appendix D-3.
Table 6-2: Coordinates for the Medupi FGD Development Footprint within MPS
Development footprint point Latitude (DMS) Longitude (DMS)
Corner Point A 23°42'34.88"S 27°32'40.66"E
Corner Point B 23°42'35.73"S 27°33'11.34"E
Corner Point C 23°42'25.30"S 27°33'31.10"E
Corner Point D 23°42'15.17"S 27°33'24.72"E
Corner Point E 23°42'06.49"S 27°33'41.51"E
Corner Point F 23°42'35.56"S 27°33'59.42"E
Corner Point G 23°43'16.10"S 27°31'38.02"E
Corner Point H 23°43'14.84"S 27°31'39.86"E
Corner Point I 23°42'58.62"S 27°32'36.00"E
Shape Centre Point J (Centroid) 23°42'42.03"S 27°33'15.92"E
Railway yard/rail siding and associated infrastructure
The extent of the railway yard development area including associated infrastructure are
defined as follow:
• The northern extent (Points A – B in Figure 6-3) of the proposed railway yard development
area is defined as the existing overland ash conveyor belt starting from the existing ash
transfer house 8 in the east to last ash conveyor transfer house before the ADF.
• The eastern extent (Points B – C in Figure 6-3) of the proposed railway yard development
area is the approximate point where the existing ash transfer house 8 and existing railway
mainline between Thabazimbi and Lephalale coincide.
• The southern extent (Points C – D in Figure 6-3) of the proposed railway yard development
area is defined by the existing railway mainline between Thabazimbi and Lephalale, from
the existing ash transfer house 8 in the east to an existing access road crossing over the
railway line approximately 1.7km to the west of existing transfer house 8.
• The western extent (Points D – E – F – A in Figure 6-3) of the proposed railway yard
development area extends from the existing railway line at the south eastern extent of the
existing ADF for approximately 750m northeast to the last ash conveyor transfer house
before the ADF.
• The proposed gypsum and limestone conveyor belt system will cross the existing overland
ash conveyor to complete the conveyance system in order to link the proposed railway
yard with the FGD infrastructure within the Medupi Power Station footprint.
The battery limits described above essentially form a scalene triangular shaped area and is
shown in Figure 6-3.
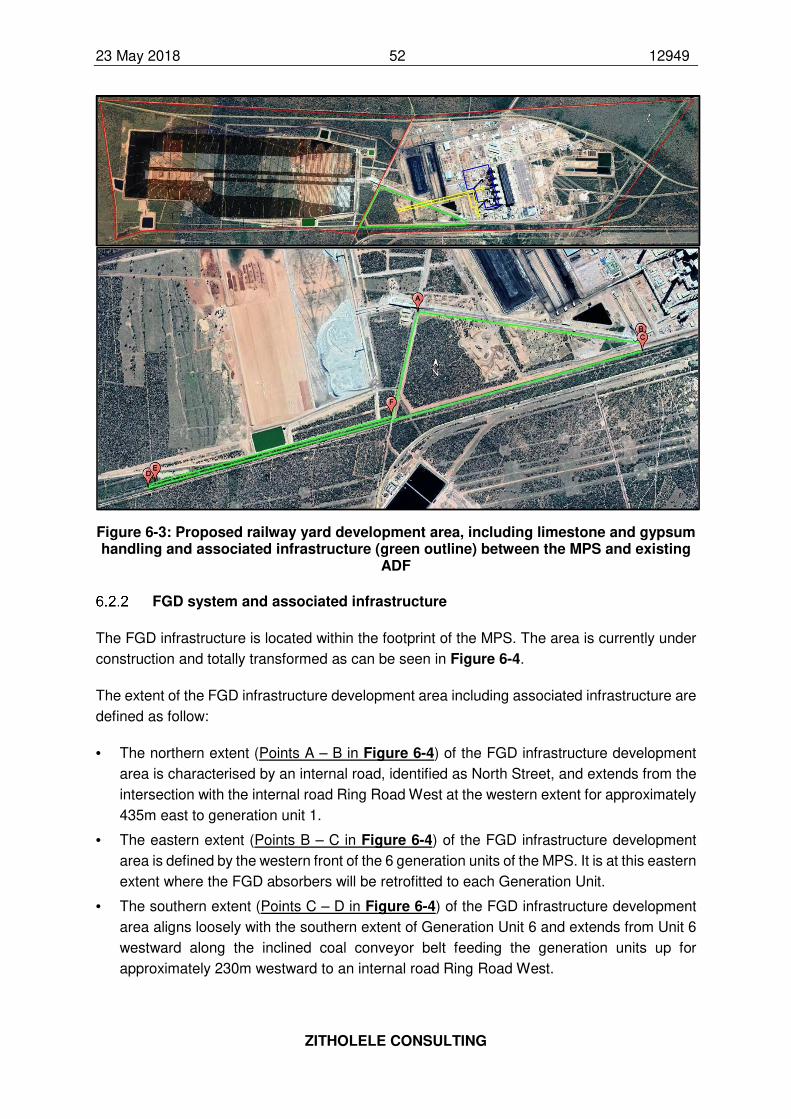
23 May 2018 52 12949
ZITHOLELE CONSULTING
Figure 6-3: Proposed railway yard development area, including limestone and gypsum handling and associated infrastructure (green outline) between the MPS and existing
ADF
FGD system and associated infrastructure
The FGD infrastructure is located within the footprint of the MPS. The area is currently under
construction and totally transformed as can be seen in Figure 6-4.
The extent of the FGD infrastructure development area including associated infrastructure are
defined as follow:
• The northern extent (Points A – B in Figure 6-4) of the FGD infrastructure development
area is characterised by an internal road, identified as North Street, and extends from the
intersection with the internal road Ring Road West at the western extent for approximately
435m east to generation unit 1.
• The eastern extent (Points B – C in Figure 6-4) of the FGD infrastructure development
area is defined by the western front of the 6 generation units of the MPS. It is at this eastern
extent where the FGD absorbers will be retrofitted to each Generation Unit.
• The southern extent (Points C – D in Figure 6-4) of the FGD infrastructure development
area aligns loosely with the southern extent of Generation Unit 6 and extends from Unit 6
westward along the inclined coal conveyor belt feeding the generation units up for
approximately 230m westward to an internal road Ring Road West.
23 May 2018 53 12949
ZITHOLELE CONSULTING
• The western extent (Points D – E – F – G – H – A in Figure 6-4) of the FGD infrastructure
development area follows Ring Road West a short distance northward after which it turns
to the west up to the coal conveyor belt. From here it runs northward along and cross the
northern coal conveyor belt where it turns to the left and extends to Ring Road West all
the way to North Street.
Figure 6-4: Proposed FGD development area (blue outline) within the MPS footprint
The approximate outline of the FGD infrastructure development area is spatially represented
in Figure 6-4, as shown by the blue outline.
Conveyor alignment area
The conveyor alignment area that links the proposed railway yard/rail siding infrastructure with
the FGD infrastructure is represented by the yellow outlined area in Figure 6-5. This
infrastructure follows the existing coal conveyor belt alignment from the railway yard in the
west to the FGD plant in the east to deliver limestone for use in the FGD process. The
proposed corner points for the area earmarked for this infrastructure is shown by points A – N
in Figure 6-5.
Dewatered gypsum from the gypsum dewatering building is transported via conveyor
southward to link with the overland ash conveyor system for disposal of gypsum on the existing
ADF. Alternatively, it can be loaded onto vehicles at the transfer station prior to conveyance
to the ADF.
In the event that a commercial offtaker for gypsum is secured, dewatered gypsum will be
conveyed northwards to follow the existing coal conveyor belt back to the railway yard for
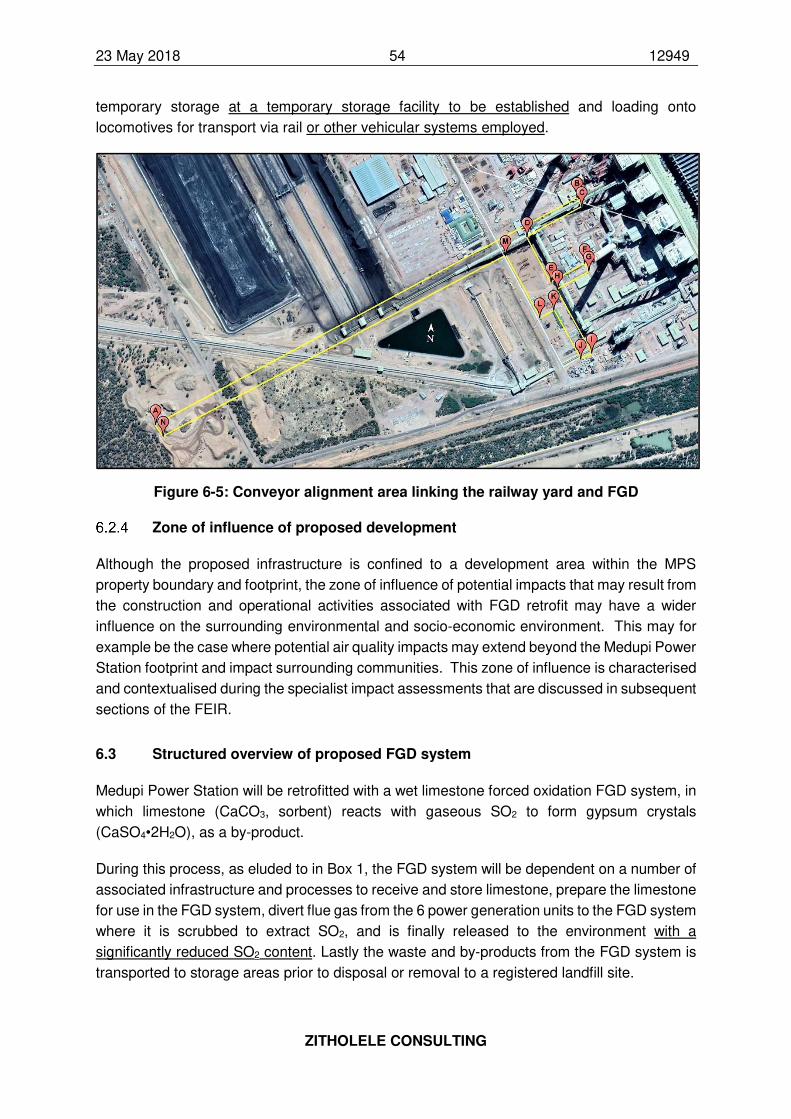
23 May 2018 54 12949
ZITHOLELE CONSULTING
temporary storage at a temporary storage facility to be established and loading onto
locomotives for transport via rail or other vehicular systems employed.
Figure 6-5: Conveyor alignment area linking the railway yard and FGD
Zone of influence of proposed development
Although the proposed infrastructure is confined to a development area within the MPS
property boundary and footprint, the zone of influence of potential impacts that may result from
the construction and operational activities associated with FGD retrofit may have a wider
influence on the surrounding environmental and socio-economic environment. This may for
example be the case where potential air quality impacts may extend beyond the Medupi Power
Station footprint and impact surrounding communities. This zone of influence is characterised
and contextualised during the specialist impact assessments that are discussed in subsequent
sections of the FEIR.
6.3 Structured overview of proposed FGD system
Medupi Power Station will be retrofitted with a wet limestone forced oxidation FGD system, in
which limestone (CaCO3, sorbent) reacts with gaseous SO2 to form gypsum crystals
(CaSO4•2H2O), as a by-product.
During this process, as eluded to in Box 1, the FGD system will be dependent on a number of
associated infrastructure and processes to receive and store limestone, prepare the limestone
for use in the FGD system, divert flue gas from the 6 power generation units to the FGD system
where it is scrubbed to extract SO2, and is finally released to the environment with a
significantly reduced SO2 content. Lastly the waste and by-products from the FGD system is
transported to storage areas prior to disposal or removal to a registered landfill site.
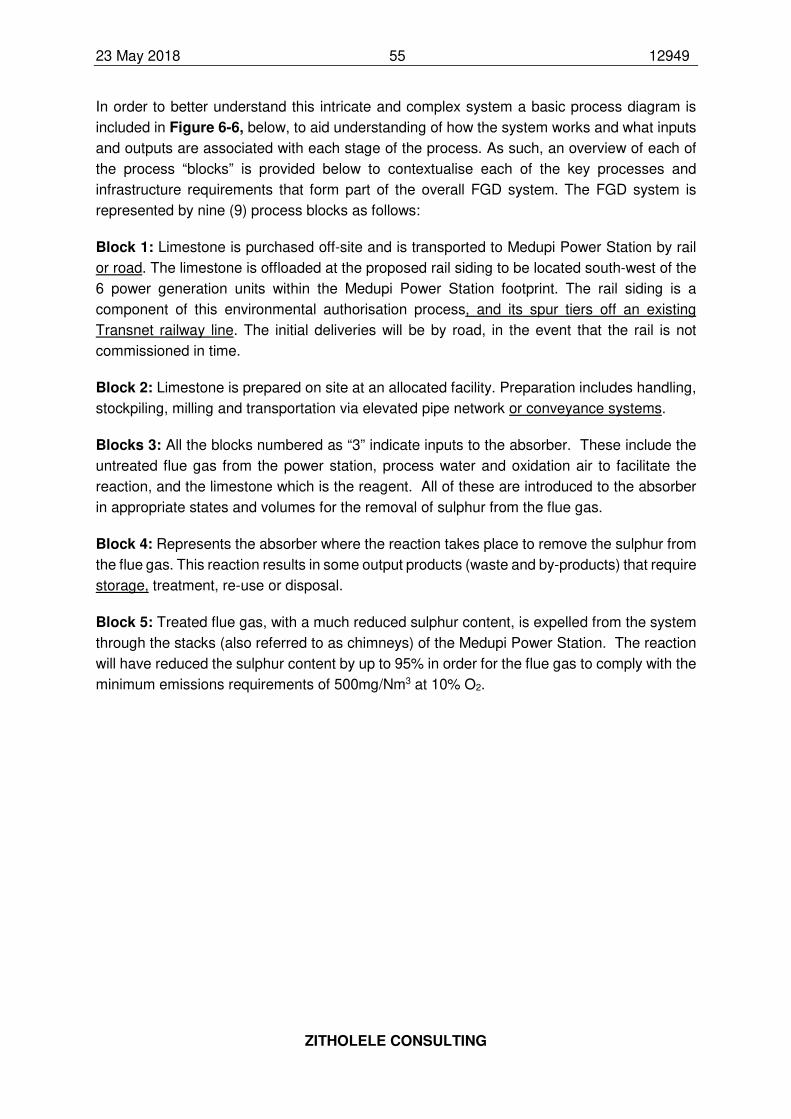
23 May 2018 55 12949
ZITHOLELE CONSULTING
In order to better understand this intricate and complex system a basic process diagram is
included in Figure 6-6, below, to aid understanding of how the system works and what inputs
and outputs are associated with each stage of the process. As such, an overview of each of
the process “blocks” is provided below to contextualise each of the key processes and
infrastructure requirements that form part of the overall FGD system. The FGD system is
represented by nine (9) process blocks as follows:
Block 1: Limestone is purchased off-site and is transported to Medupi Power Station by rail
or road. The limestone is offloaded at the proposed rail siding to be located south-west of the
6 power generation units within the Medupi Power Station footprint. The rail siding is a
component of this environmental authorisation process, and its spur tiers off an existing
Transnet railway line. The initial deliveries will be by road, in the event that the rail is not
commissioned in time.
Block 2: Limestone is prepared on site at an allocated facility. Preparation includes handling,
stockpiling, milling and transportation via elevated pipe network or conveyance systems.
Blocks 3: All the blocks numbered as “3” indicate inputs to the absorber. These include the
untreated flue gas from the power station, process water and oxidation air to facilitate the
reaction, and the limestone which is the reagent. All of these are introduced to the absorber
in appropriate states and volumes for the removal of sulphur from the flue gas.
Block 4: Represents the absorber where the reaction takes place to remove the sulphur from
the flue gas. This reaction results in some output products (waste and by-products) that require
storage, treatment, re-use or disposal.
Block 5: Treated flue gas, with a much reduced sulphur content, is expelled from the system
through the stacks (also referred to as chimneys) of the Medupi Power Station. The reaction
will have reduced the sulphur content by up to 95% in order for the flue gas to comply with the
minimum emissions requirements of 500mg/Nm3 at 10% O2.
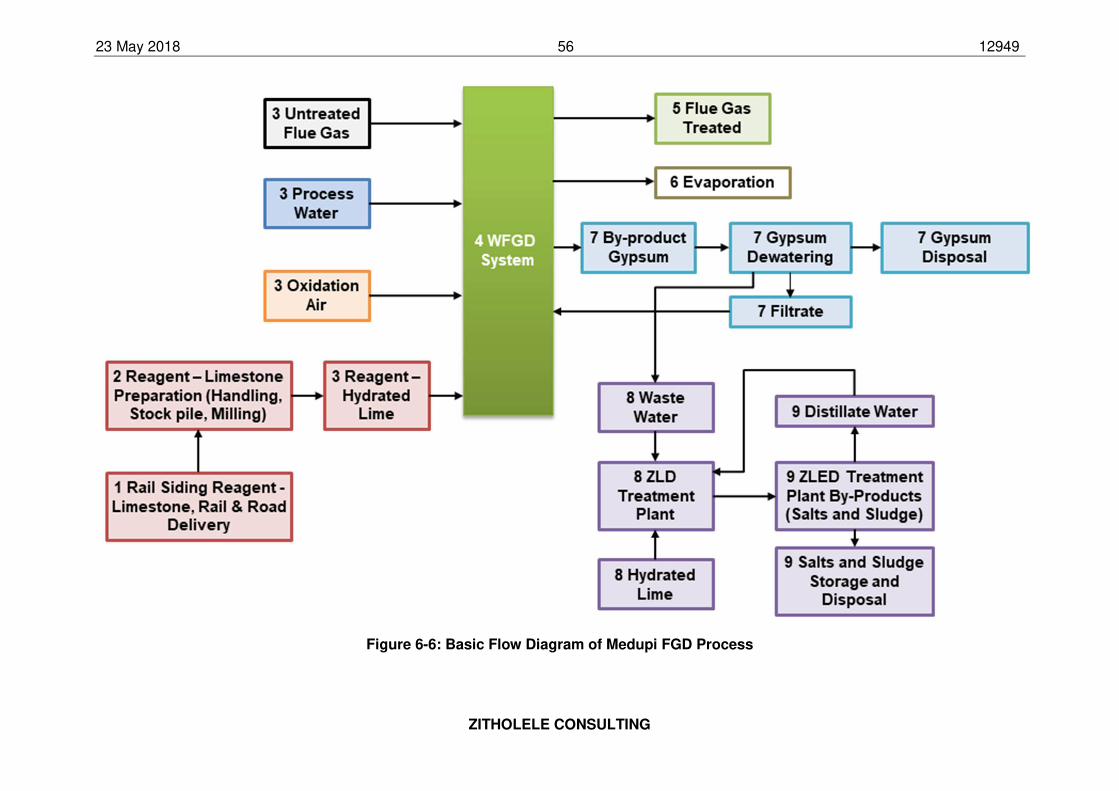
23 May 2018 56 12949
ZITHOLELE CONSULTING
Figure 6-6: Basic Flow Diagram of Medupi FGD Process
23 May 2018 57 12949
ZITHOLELE CONSULTING
Block 6: Some of the water utilised during the reaction is evaporated and lost by the system.
Blocks 7: Gypsum is formed as a by-product of the chemical reaction with the limestone. The
gypsum exists the absorber (Block 4) in the form of a slurry, which needs to be dewatered in
order to minimise loss of water from the system and to prepare the gypsum for re-use and/or
disposal. The water or filtrate that is separated from the gypsum is reused within the process
by returning it to the absorber as make-up water. The dewatered gypsum will be in a
crystallised state and will be temporarily stored for re-use or disposed of at an Ash Disposal
Facility (ADF) with a Class C barrier system, together with the ash from the power generation
process.
Blocks 8: Waste water is generated during the Gypsum dewatering process (Block 7) and is
transported to a Waste Water Treatment Plant (WWTP) where lime is added in order to treat
the waste water. Lime is produced through pulverisation and preparation from Limestone
received at the proposed rail yard/rail siding. This process produces waste products that will
be either re-used or disposed in an appropriately licenced waste disposal facility.
Blocks 9: Waste products of the WWTP include a distillate, which is reused within the FGD
process, and salts and sludge, which are Type 1 wastes and require disposal at an
appropriately licenced facility. The salts and sludge will be disposed of at an existing Class A
disposal facility (Holfontein, as an example) as a temporary measure, while a new Class A
disposal facility located close to MPS is investigated, designed, appropriately licenced and
constructed. Although potential appropriately licenced waste disposal facilities (such as
Holfontein Disposal Site) have been identified, Eskom’s commercial procurement process to
secure a commercial contract with such a suitable services provider only occur at a later stage
during the project life cycle and therefore a suitable licenced waste disposal facility could not
be confirmed at this stage.
A detailed description of each of the process blocks and associated infrastructure that forms
part of the FGD system is provided in the sections that follow.
6.4 FGD System component: Railway siding (Block 1)
Block 1 of the Medupi FGD basic process diagram represents the construction and operation
of a railway yard and siding west of the MPS between the power station and existing ADF.
The railway yard will primarily handle bulk limestone, which will be used as a sorbent in the
retrofitted FGD plant. The railway yard will provide a facility for the loading of bulk gypsum
from the adjacent temporary storage area, which will be despatched from the railway yard
depending on market demand (Bosch Holdings Consortium, 2015).
All information pertaining to the proposed railway siding was obtained from the Basic and
Detailed Design Report for the Medupi railway yard and offloading facility compiled by the
Bosch Holdings Consortium in 2015.
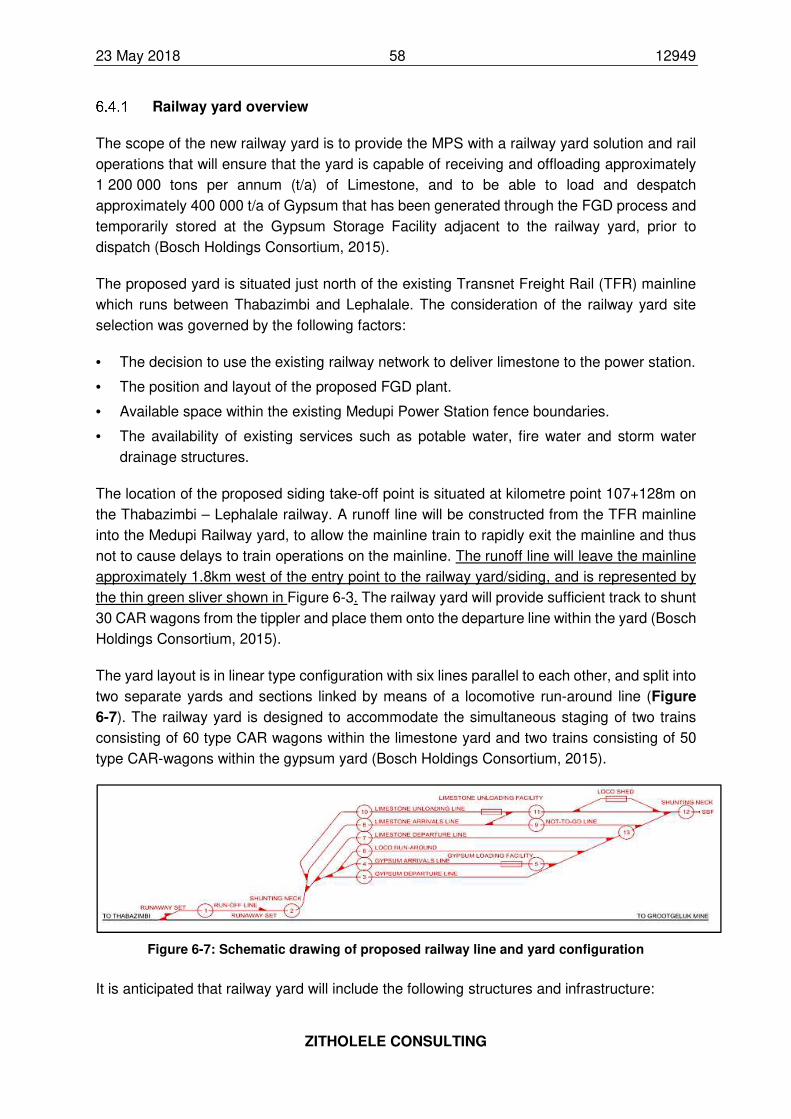
23 May 2018 58 12949
ZITHOLELE CONSULTING
Railway yard overview
The scope of the new railway yard is to provide the MPS with a railway yard solution and rail
operations that will ensure that the yard is capable of receiving and offloading approximately
1 200 000 tons per annum (t/a) of Limestone, and to be able to load and despatch
approximately 400 000 t/a of Gypsum that has been generated through the FGD process and
temporarily stored at the Gypsum Storage Facility adjacent to the railway yard, prior to
dispatch (Bosch Holdings Consortium, 2015).
The proposed yard is situated just north of the existing Transnet Freight Rail (TFR) mainline
which runs between Thabazimbi and Lephalale. The consideration of the railway yard site
selection was governed by the following factors:
• The decision to use the existing railway network to deliver limestone to the power station.
• The position and layout of the proposed FGD plant.
• Available space within the existing Medupi Power Station fence boundaries.
• The availability of existing services such as potable water, fire water and storm water
drainage structures.
The location of the proposed siding take-off point is situated at kilometre point 107+128m on
the Thabazimbi – Lephalale railway. A runoff line will be constructed from the TFR mainline
into the Medupi Railway yard, to allow the mainline train to rapidly exit the mainline and thus
not to cause delays to train operations on the mainline. The runoff line will leave the mainline
approximately 1.8km west of the entry point to the railway yard/siding, and is represented by
the thin green sliver shown in Figure 6-3. The railway yard will provide sufficient track to shunt
30 CAR wagons from the tippler and place them onto the departure line within the yard (Bosch
Holdings Consortium, 2015).
The yard layout is in linear type configuration with six lines parallel to each other, and split into
two separate yards and sections linked by means of a locomotive run-around line (Figure
6-7). The railway yard is designed to accommodate the simultaneous staging of two trains
consisting of 60 type CAR wagons within the limestone yard and two trains consisting of 50
type CAR-wagons within the gypsum yard (Bosch Holdings Consortium, 2015).
Figure 6-7: Schematic drawing of proposed railway line and yard configuration
It is anticipated that railway yard will include the following structures and infrastructure:
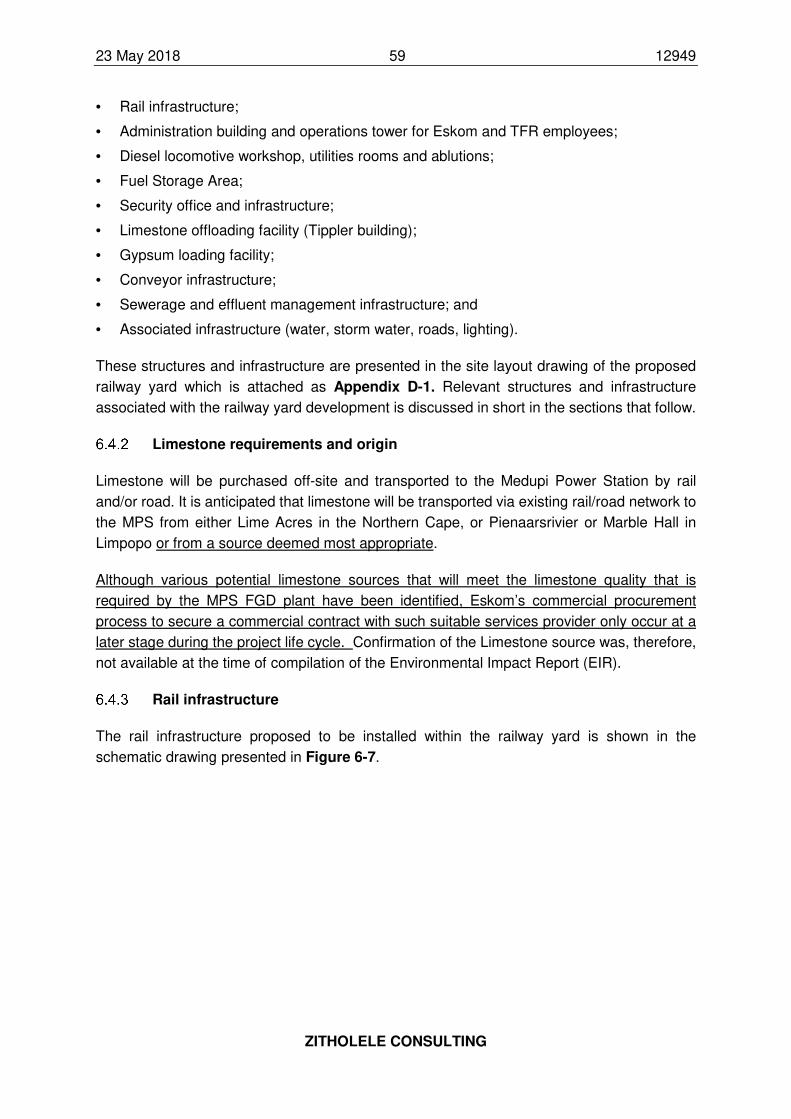
23 May 2018 59 12949
ZITHOLELE CONSULTING
• Rail infrastructure;
• Administration building and operations tower for Eskom and TFR employees;
• Diesel locomotive workshop, utilities rooms and ablutions;
• Fuel Storage Area;
• Security office and infrastructure;
• Limestone offloading facility (Tippler building);
• Gypsum loading facility;
• Conveyor infrastructure;
• Sewerage and effluent management infrastructure; and
• Associated infrastructure (water, storm water, roads, lighting).
These structures and infrastructure are presented in the site layout drawing of the proposed
railway yard which is attached as Appendix D-1. Relevant structures and infrastructure
associated with the railway yard development is discussed in short in the sections that follow.
Limestone requirements and origin
Limestone will be purchased off-site and transported to the Medupi Power Station by rail
and/or road. It is anticipated that limestone will be transported via existing rail/road network to
the MPS from either Lime Acres in the Northern Cape, or Pienaarsrivier or Marble Hall in
Limpopo or from a source deemed most appropriate.
Although various potential limestone sources that will meet the limestone quality that is
required by the MPS FGD plant have been identified, Eskom’s commercial procurement
process to secure a commercial contract with such suitable services provider only occur at a
later stage during the project life cycle. Confirmation of the Limestone source was, therefore,
not available at the time of compilation of the Environmental Impact Report (EIR).
Rail infrastructure
The rail infrastructure proposed to be installed within the railway yard is shown in the
schematic drawing presented in Figure 6-7.
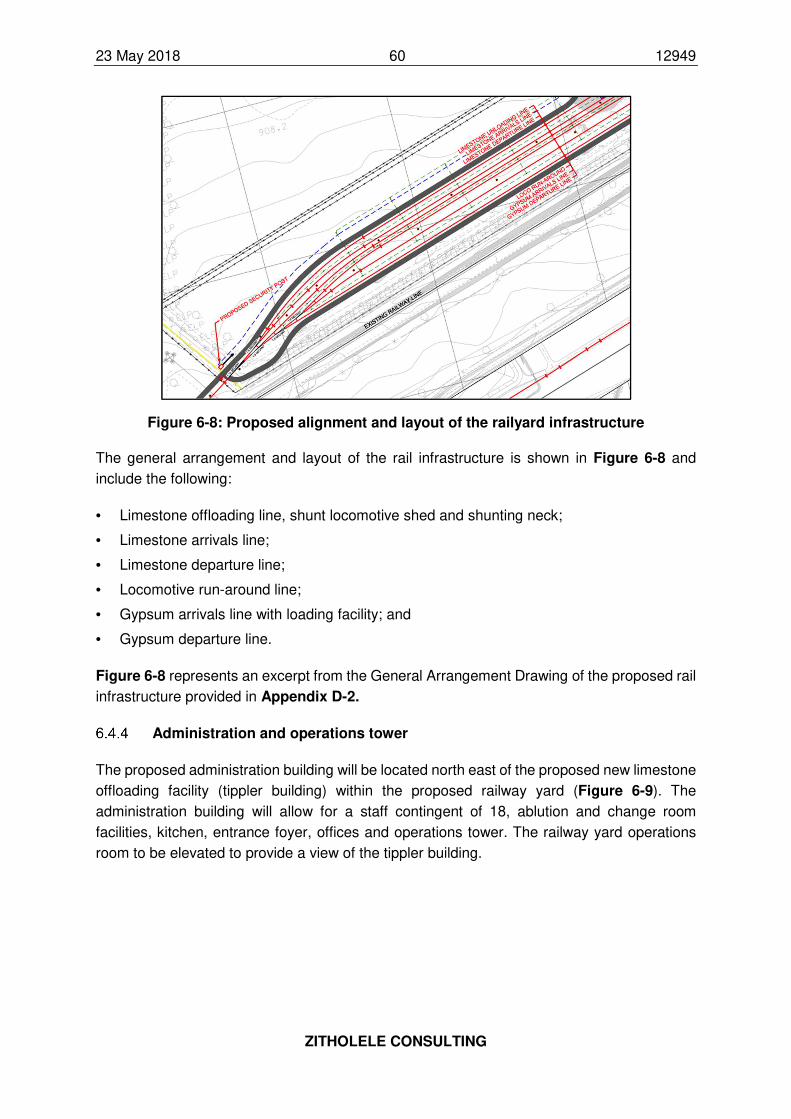
23 May 2018 60 12949
ZITHOLELE CONSULTING
Figure 6-8: Proposed alignment and layout of the railyard infrastructure
The general arrangement and layout of the rail infrastructure is shown in Figure 6-8 and
include the following:
• Limestone offloading line, shunt locomotive shed and shunting neck;
• Limestone arrivals line;
• Limestone departure line;
• Locomotive run-around line;
• Gypsum arrivals line with loading facility; and
• Gypsum departure line.
Figure 6-8 represents an excerpt from the General Arrangement Drawing of the proposed rail
infrastructure provided in Appendix D-2.
Administration and operations tower
The proposed administration building will be located north east of the proposed new limestone
offloading facility (tippler building) within the proposed railway yard (Figure 6-9). The
administration building will allow for a staff contingent of 18, ablution and change room
facilities, kitchen, entrance foyer, offices and operations tower. The railway yard operations
room to be elevated to provide a view of the tippler building.
23 May 2018 61 12949
ZITHOLELE CONSULTING
Figure 6-9: Proposed administration building and water booster pump station
Figure 6-9 represents an excerpt from the Site Layout Plan Drawing of the proposed rail
infrastructure provided in Appendix D-1.
Diesel locomotive workshop, utilities rooms and ablutions
A diesel locomotive workshop area, including utilities rooms and ablution facilities, will be
constructed toward the eastern extent of the railway yard (Figure 6-10). This area will be
located south of the proposed Pollution Control Dam (PCD) 210. This workshop area will have
approximately 600m² service area for the shunting locomotive and has various offices and
store rooms (180m²) attached to one end of the building.
Fluids that will be stored in small quantities within the workshop building will include Benzene
class 1 flammable liquid, trichloro-ethylene, carbon tetrachloride, engine oil, viscous oils,
hydraulic oil, grease, battery acid and radiator fluid. With the exception of Benzene these fluids
are all high flash point non-flammable products.
This building will typically fall under SANS classification D3 Low Risk Industrial therefore safety
considerations for the storage of these fluids include a local standalone foam deluge system
to provide fire protection to cover the benzene storage area.
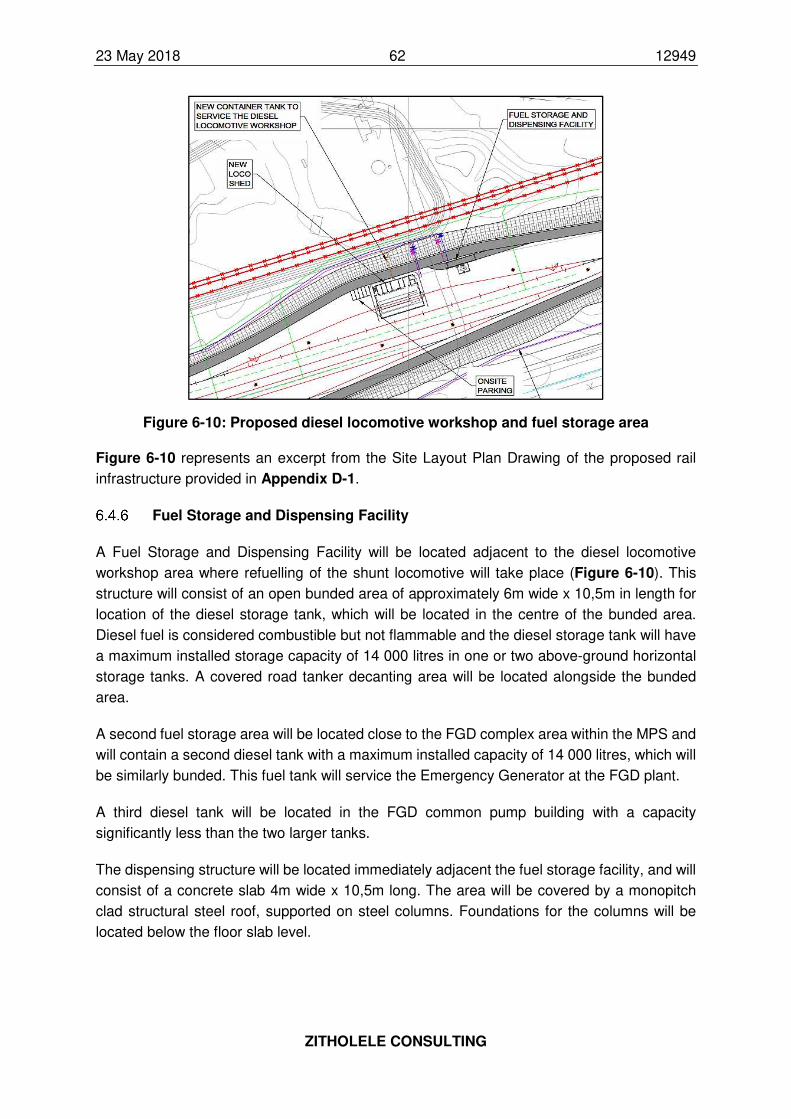
23 May 2018 62 12949
ZITHOLELE CONSULTING
Figure 6-10: Proposed diesel locomotive workshop and fuel storage area
Figure 6-10 represents an excerpt from the Site Layout Plan Drawing of the proposed rail
infrastructure provided in Appendix D-1.
Fuel Storage and Dispensing Facility
A Fuel Storage and Dispensing Facility will be located adjacent to the diesel locomotive
workshop area where refuelling of the shunt locomotive will take place (Figure 6-10). This
structure will consist of an open bunded area of approximately 6m wide x 10,5m in length for
location of the diesel storage tank, which will be located in the centre of the bunded area.
Diesel fuel is considered combustible but not flammable and the diesel storage tank will have
a maximum installed storage capacity of 14 000 litres in one or two above-ground horizontal
storage tanks. A covered road tanker decanting area will be located alongside the bunded
area.
A second fuel storage area will be located close to the FGD complex area within the MPS and
will contain a second diesel tank with a maximum installed capacity of 14 000 litres, which will
be similarly bunded. This fuel tank will service the Emergency Generator at the FGD plant.
A third diesel tank will be located in the FGD common pump building with a capacity
significantly less than the two larger tanks.
The dispensing structure will be located immediately adjacent the fuel storage facility, and will
consist of a concrete slab 4m wide x 10,5m long. The area will be covered by a monopitch
clad structural steel roof, supported on steel columns. Foundations for the columns will be
located below the floor slab level.
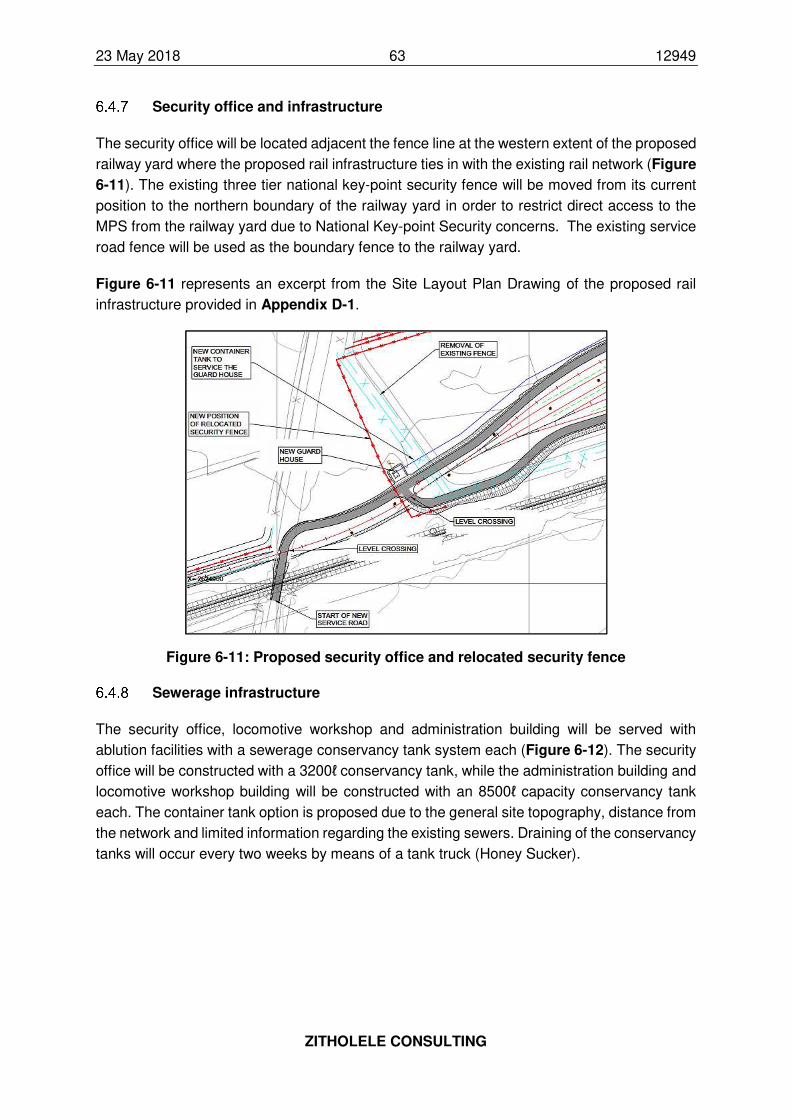
23 May 2018 63 12949
ZITHOLELE CONSULTING
Security office and infrastructure
The security office will be located adjacent the fence line at the western extent of the proposed
railway yard where the proposed rail infrastructure ties in with the existing rail network (Figure
6-11). The existing three tier national key-point security fence will be moved from its current
position to the northern boundary of the railway yard in order to restrict direct access to the
MPS from the railway yard due to National Key-point Security concerns. The existing service
road fence will be used as the boundary fence to the railway yard.
Figure 6-11 represents an excerpt from the Site Layout Plan Drawing of the proposed rail
infrastructure provided in Appendix D-1.
Figure 6-11: Proposed security office and relocated security fence
Sewerage infrastructure
The security office, locomotive workshop and administration building will be served with
ablution facilities with a sewerage conservancy tank system each (Figure 6-12). The security
office will be constructed with a 3200ℓ conservancy tank, while the administration building and
locomotive workshop building will be constructed with an 8500ℓ capacity conservancy tank
each. The container tank option is proposed due to the general site topography, distance from
the network and limited information regarding the existing sewers. Draining of the conservancy
tanks will occur every two weeks by means of a tank truck (Honey Sucker).
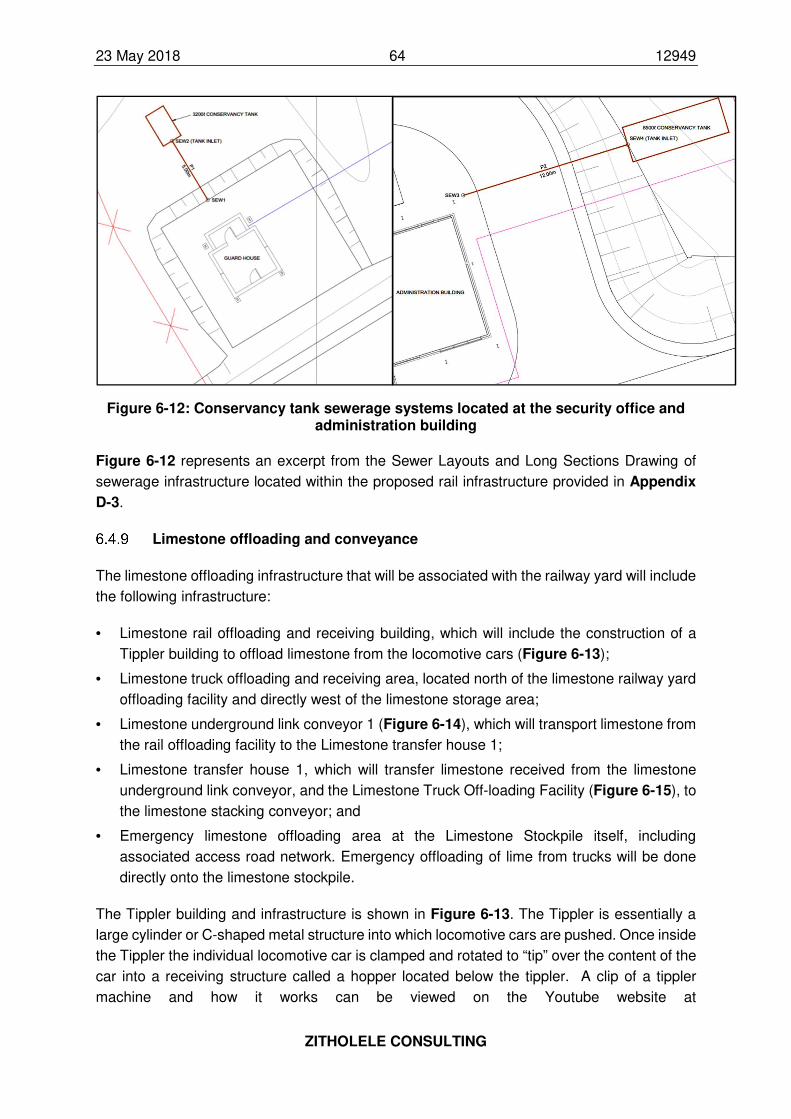
23 May 2018 64 12949
ZITHOLELE CONSULTING
Figure 6-12: Conservancy tank sewerage systems located at the security office and administration building
Figure 6-12 represents an excerpt from the Sewer Layouts and Long Sections Drawing of
sewerage infrastructure located within the proposed rail infrastructure provided in Appendix
D-3.
Limestone offloading and conveyance
The limestone offloading infrastructure that will be associated with the railway yard will include
the following infrastructure:
• Limestone rail offloading and receiving building, which will include the construction of a
Tippler building to offload limestone from the locomotive cars (Figure 6-13);
• Limestone truck offloading and receiving area, located north of the limestone railway yard
offloading facility and directly west of the limestone storage area;
• Limestone underground link conveyor 1 (Figure 6-14), which will transport limestone from
the rail offloading facility to the Limestone transfer house 1;
• Limestone transfer house 1, which will transfer limestone received from the limestone
underground link conveyor, and the Limestone Truck Off-loading Facility (Figure 6-15), to
the limestone stacking conveyor; and
• Emergency limestone offloading area at the Limestone Stockpile itself, including
associated access road network. Emergency offloading of lime from trucks will be done
directly onto the limestone stockpile.
The Tippler building and infrastructure is shown in Figure 6-13. The Tippler is essentially a
large cylinder or C-shaped metal structure into which locomotive cars are pushed. Once inside
the Tippler the individual locomotive car is clamped and rotated to “tip” over the content of the
car into a receiving structure called a hopper located below the tippler. A clip of a tippler
machine and how it works can be viewed on the Youtube website at
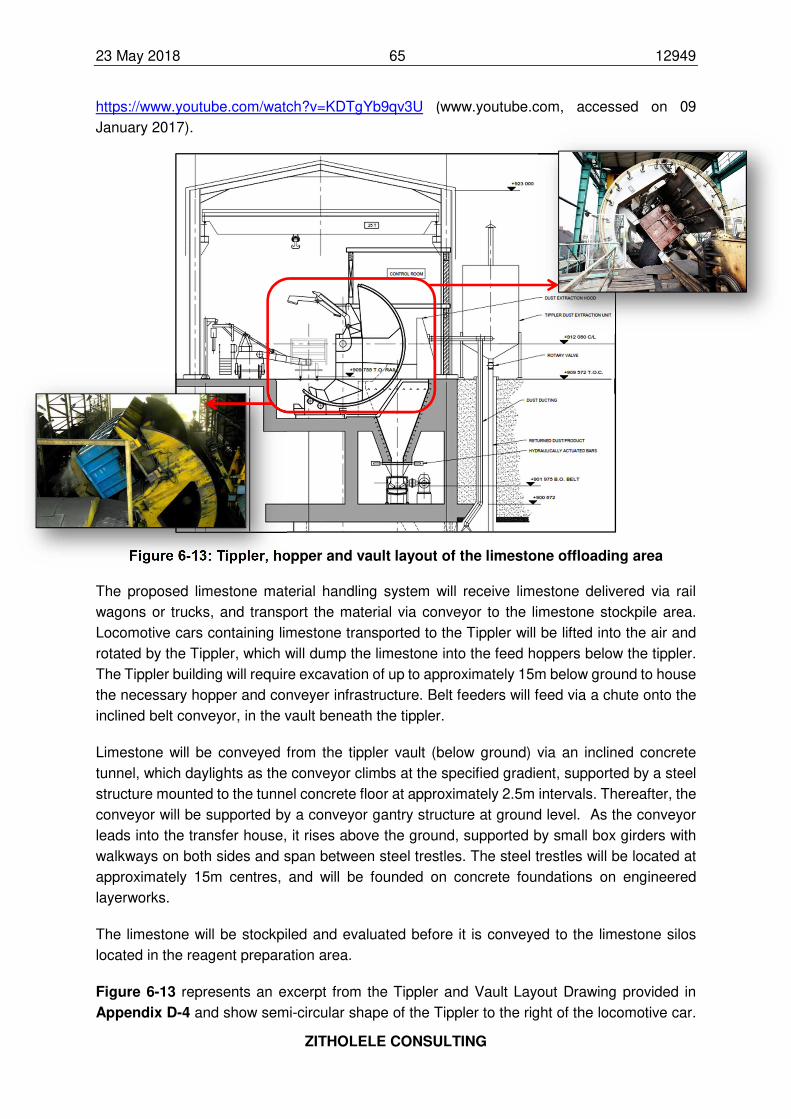
23 May 2018 65 12949
ZITHOLELE CONSULTING
https://www.youtube.com/watch?v=KDTgYb9qv3U (www.youtube.com, accessed on 09
January 2017).
Figure 6-13: Tippler, hopper and vault layout of the limestone offloading area
The proposed limestone material handling system will receive limestone delivered via rail
wagons or trucks, and transport the material via conveyor to the limestone stockpile area.
Locomotive cars containing limestone transported to the Tippler will be lifted into the air and
rotated by the Tippler, which will dump the limestone into the feed hoppers below the tippler.
The Tippler building will require excavation of up to approximately 15m below ground to house
the necessary hopper and conveyer infrastructure. Belt feeders will feed via a chute onto the
inclined belt conveyor, in the vault beneath the tippler.
Limestone will be conveyed from the tippler vault (below ground) via an inclined concrete
tunnel, which daylights as the conveyor climbs at the specified gradient, supported by a steel
structure mounted to the tunnel concrete floor at approximately 2.5m intervals. Thereafter, the
conveyor will be supported by a conveyor gantry structure at ground level. As the conveyor
leads into the transfer house, it rises above the ground, supported by small box girders with
walkways on both sides and span between steel trestles. The steel trestles will be located at
approximately 15m centres, and will be founded on concrete foundations on engineered
layerworks.
The limestone will be stockpiled and evaluated before it is conveyed to the limestone silos
located in the reagent preparation area.
Figure 6-13 represents an excerpt from the Tippler and Vault Layout Drawing provided in
Appendix D-4 and show semi-circular shape of the Tippler to the right of the locomotive car.
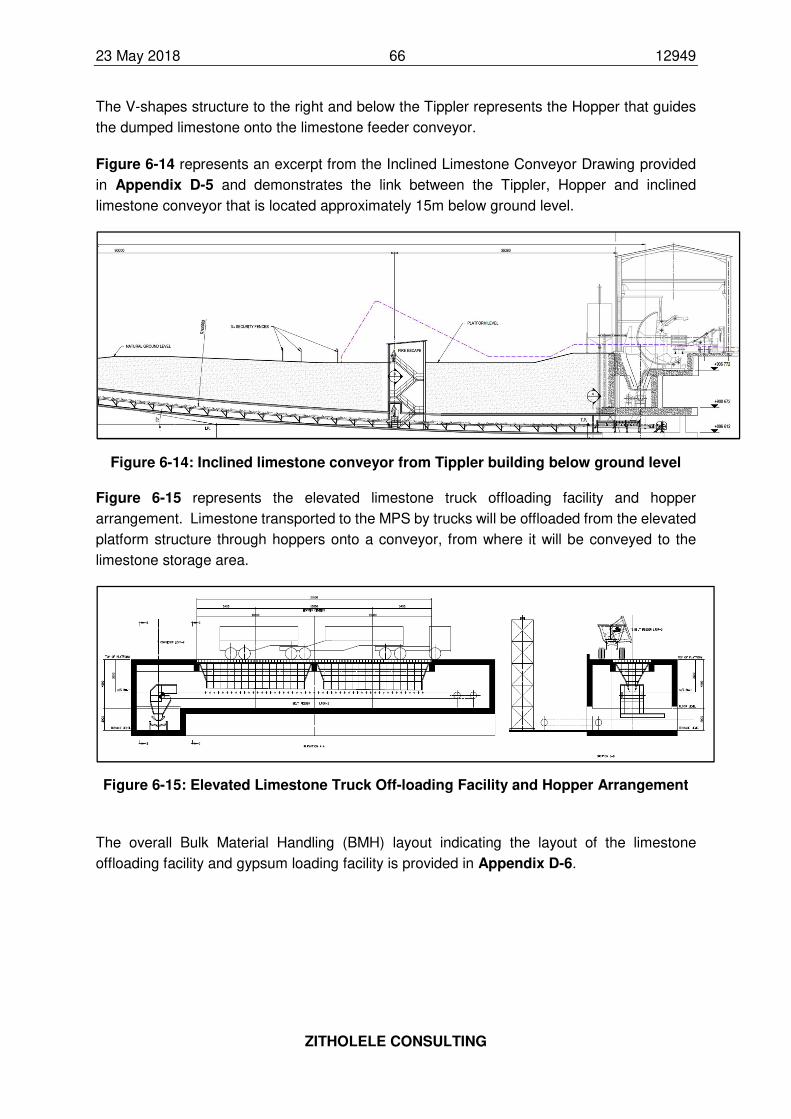
23 May 2018 66 12949
ZITHOLELE CONSULTING
The V-shapes structure to the right and below the Tippler represents the Hopper that guides
the dumped limestone onto the limestone feeder conveyor.
Figure 6-14 represents an excerpt from the Inclined Limestone Conveyor Drawing provided
in Appendix D-5 and demonstrates the link between the Tippler, Hopper and inclined
limestone conveyor that is located approximately 15m below ground level.
Figure 6-14: Inclined limestone conveyor from Tippler building below ground level
Figure 6-15 represents the elevated limestone truck offloading facility and hopper
arrangement. Limestone transported to the MPS by trucks will be offloaded from the elevated
platform structure through hoppers onto a conveyor, from where it will be conveyed to the
limestone storage area.
Figure 6-15: Elevated Limestone Truck Off-loading Facility and Hopper Arrangement
The overall Bulk Material Handling (BMH) layout indicating the layout of the limestone
offloading facility and gypsum loading facility is provided in Appendix D-6.
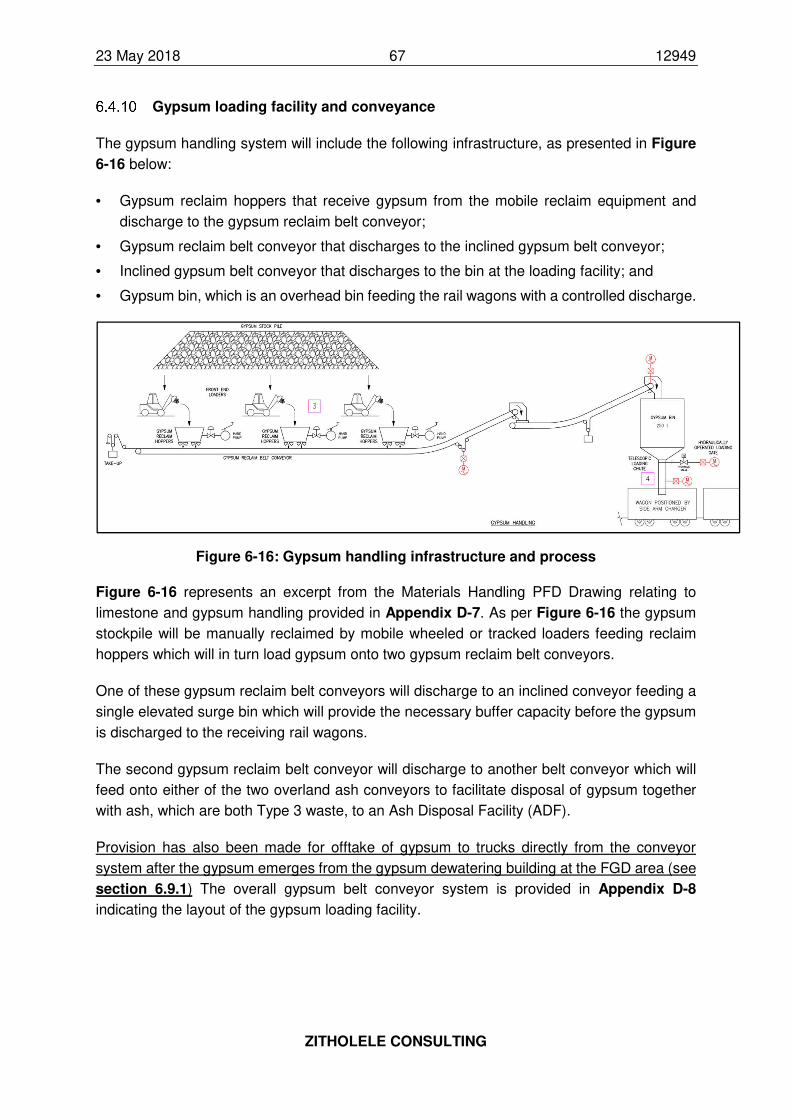
23 May 2018 67 12949
ZITHOLELE CONSULTING
Gypsum loading facility and conveyance
The gypsum handling system will include the following infrastructure, as presented in Figure
6-16 below:
• Gypsum reclaim hoppers that receive gypsum from the mobile reclaim equipment and
discharge to the gypsum reclaim belt conveyor;
• Gypsum reclaim belt conveyor that discharges to the inclined gypsum belt conveyor;
• Inclined gypsum belt conveyor that discharges to the bin at the loading facility; and
• Gypsum bin, which is an overhead bin feeding the rail wagons with a controlled discharge.
Figure 6-16: Gypsum handling infrastructure and process
Figure 6-16 represents an excerpt from the Materials Handling PFD Drawing relating to
limestone and gypsum handling provided in Appendix D-7. As per Figure 6-16 the gypsum
stockpile will be manually reclaimed by mobile wheeled or tracked loaders feeding reclaim
hoppers which will in turn load gypsum onto two gypsum reclaim belt conveyors.
One of these gypsum reclaim belt conveyors will discharge to an inclined conveyor feeding a
single elevated surge bin which will provide the necessary buffer capacity before the gypsum
is discharged to the receiving rail wagons.
The second gypsum reclaim belt conveyor will discharge to another belt conveyor which will
feed onto either of the two overland ash conveyors to facilitate disposal of gypsum together
with ash, which are both Type 3 waste, to an Ash Disposal Facility (ADF).
Provision has also been made for offtake of gypsum to trucks directly from the conveyor
system after the gypsum emerges from the gypsum dewatering building at the FGD area (see
section 6.9.1) The overall gypsum belt conveyor system is provided in Appendix D-8
indicating the layout of the gypsum loading facility.
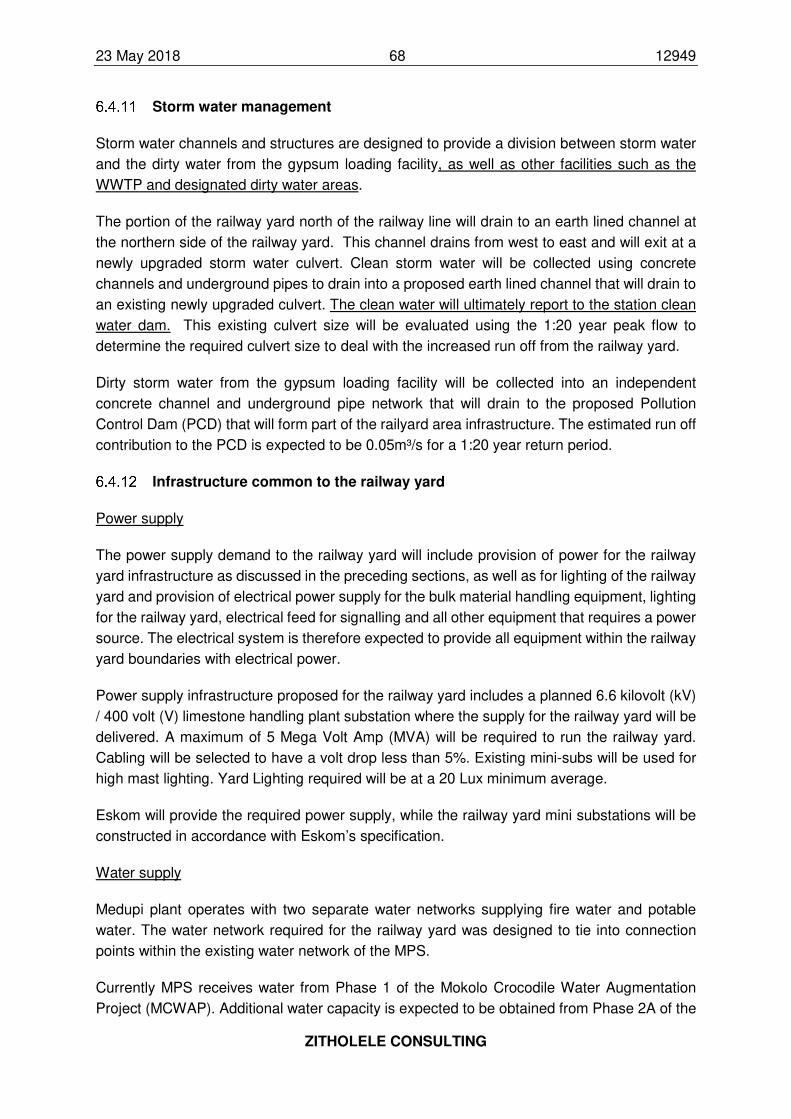
23 May 2018 68 12949
ZITHOLELE CONSULTING
Storm water management
Storm water channels and structures are designed to provide a division between storm water
and the dirty water from the gypsum loading facility, as well as other facilities such as the
WWTP and designated dirty water areas.
The portion of the railway yard north of the railway line will drain to an earth lined channel at
the northern side of the railway yard. This channel drains from west to east and will exit at a
newly upgraded storm water culvert. Clean storm water will be collected using concrete
channels and underground pipes to drain into a proposed earth lined channel that will drain to
an existing newly upgraded culvert. The clean water will ultimately report to the station clean
water dam. This existing culvert size will be evaluated using the 1:20 year peak flow to
determine the required culvert size to deal with the increased run off from the railway yard.
Dirty storm water from the gypsum loading facility will be collected into an independent
concrete channel and underground pipe network that will drain to the proposed Pollution
Control Dam (PCD) that will form part of the railyard area infrastructure. The estimated run off
contribution to the PCD is expected to be 0.05m³/s for a 1:20 year return period.
Infrastructure common to the railway yard
Power supply
The power supply demand to the railway yard will include provision of power for the railway
yard infrastructure as discussed in the preceding sections, as well as for lighting of the railway
yard and provision of electrical power supply for the bulk material handling equipment, lighting
for the railway yard, electrical feed for signalling and all other equipment that requires a power
source. The electrical system is therefore expected to provide all equipment within the railway
yard boundaries with electrical power.
Power supply infrastructure proposed for the railway yard includes a planned 6.6 kilovolt (kV)
/ 400 volt (V) limestone handling plant substation where the supply for the railway yard will be
delivered. A maximum of 5 Mega Volt Amp (MVA) will be required to run the railway yard.
Cabling will be selected to have a volt drop less than 5%. Existing mini-subs will be used for
high mast lighting. Yard Lighting required will be at a 20 Lux minimum average.
Eskom will provide the required power supply, while the railway yard mini substations will be
constructed in accordance with Eskom’s specification.
Water supply
Medupi plant operates with two separate water networks supplying fire water and potable
water. The water network required for the railway yard was designed to tie into connection
points within the existing water network of the MPS.
Currently MPS receives water from Phase 1 of the Mokolo Crocodile Water Augmentation
Project (MCWAP). Additional water capacity is expected to be obtained from Phase 2A of the
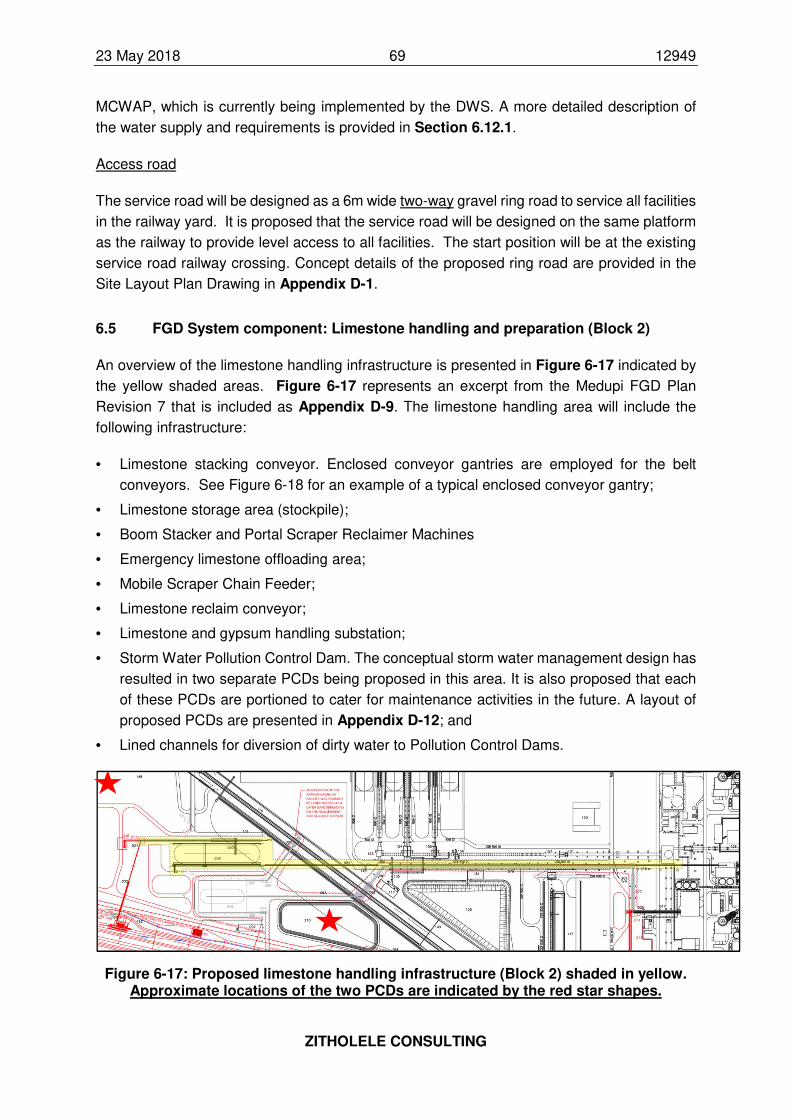
23 May 2018 69 12949
ZITHOLELE CONSULTING
MCWAP, which is currently being implemented by the DWS. A more detailed description of
the water supply and requirements is provided in Section 6.12.1.
Access road
The service road will be designed as a 6m wide two-way gravel ring road to service all facilities
in the railway yard. It is proposed that the service road will be designed on the same platform
as the railway to provide level access to all facilities. The start position will be at the existing
service road railway crossing. Concept details of the proposed ring road are provided in the
Site Layout Plan Drawing in Appendix D-1.
6.5 FGD System component: Limestone handling and preparation (Block 2)
An overview of the limestone handling infrastructure is presented in Figure 6-17 indicated by
the yellow shaded areas. Figure 6-17 represents an excerpt from the Medupi FGD Plan
Revision 7 that is included as Appendix D-9. The limestone handling area will include the
following infrastructure:
• Limestone stacking conveyor. Enclosed conveyor gantries are employed for the belt
conveyors. See Figure 6-18 for an example of a typical enclosed conveyor gantry;
• Limestone storage area (stockpile);
• Boom Stacker and Portal Scraper Reclaimer Machines
• Emergency limestone offloading area;
• Mobile Scraper Chain Feeder;
• Limestone reclaim conveyor;
• Limestone and gypsum handling substation;
• Storm Water Pollution Control Dam. The conceptual storm water management design has
resulted in two separate PCDs being proposed in this area. It is also proposed that each
of these PCDs are portioned to cater for maintenance activities in the future. A layout of
proposed PCDs are presented in Appendix D-12; and
• Lined channels for diversion of dirty water to Pollution Control Dams.
Figure 6-17: Proposed limestone handling infrastructure (Block 2) shaded in yellow. Approximate locations of the two PCDs are indicated by the red star shapes.
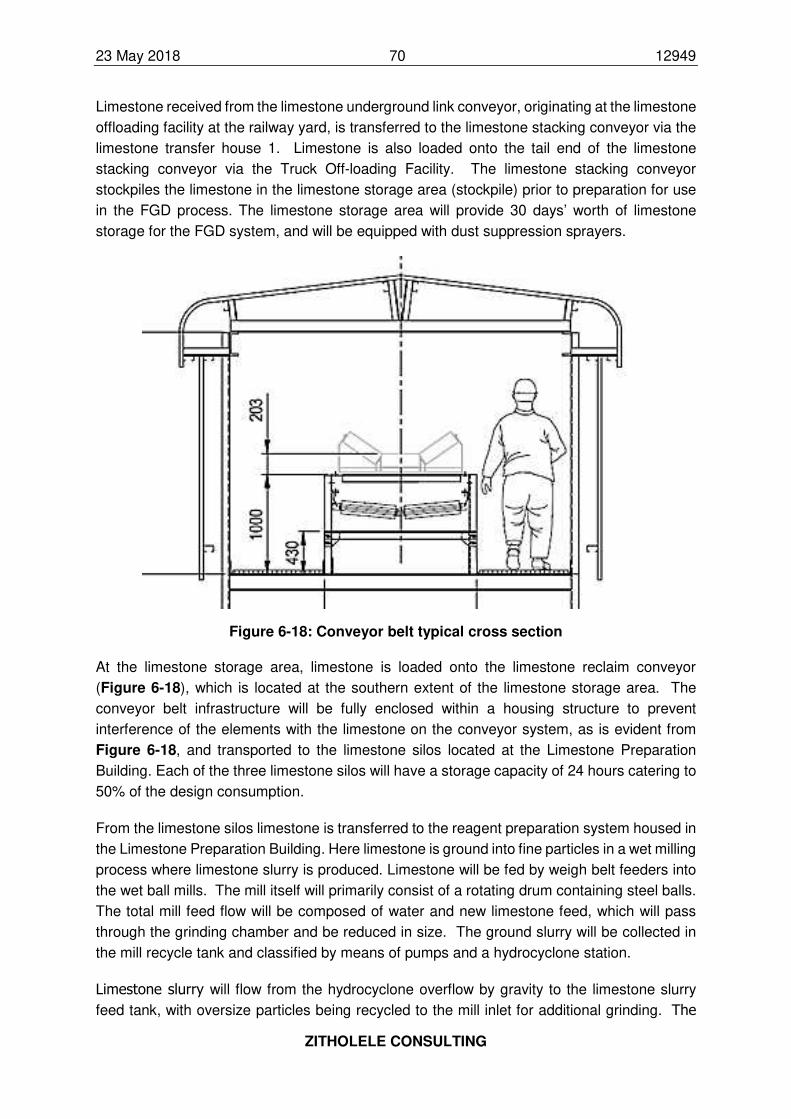
23 May 2018 70 12949
ZITHOLELE CONSULTING
Limestone received from the limestone underground link conveyor, originating at the limestone
offloading facility at the railway yard, is transferred to the limestone stacking conveyor via the
limestone transfer house 1. Limestone is also loaded onto the tail end of the limestone
stacking conveyor via the Truck Off-loading Facility. The limestone stacking conveyor
stockpiles the limestone in the limestone storage area (stockpile) prior to preparation for use
in the FGD process. The limestone storage area will provide 30 days’ worth of limestone
storage for the FGD system, and will be equipped with dust suppression sprayers.
Figure 6-18: Conveyor belt typical cross section
At the limestone storage area, limestone is loaded onto the limestone reclaim conveyor
(Figure 6-18), which is located at the southern extent of the limestone storage area. The
conveyor belt infrastructure will be fully enclosed within a housing structure to prevent
interference of the elements with the limestone on the conveyor system, as is evident from
Figure 6-18, and transported to the limestone silos located at the Limestone Preparation
Building. Each of the three limestone silos will have a storage capacity of 24 hours catering to
50% of the design consumption.
From the limestone silos limestone is transferred to the reagent preparation system housed in
the Limestone Preparation Building. Here limestone is ground into fine particles in a wet milling
process where limestone slurry is produced. Limestone will be fed by weigh belt feeders into
the wet ball mills. The mill itself will primarily consist of a rotating drum containing steel balls.
The total mill feed flow will be composed of water and new limestone feed, which will pass
through the grinding chamber and be reduced in size. The ground slurry will be collected in
the mill recycle tank and classified by means of pumps and a hydrocyclone station.
Limestone slurry will flow from the hydrocyclone overflow by gravity to the limestone slurry
feed tank, with oversize particles being recycled to the mill inlet for additional grinding. The
23 May 2018 71 12949
ZITHOLELE CONSULTING
limestone slurry will be pumped via piping on the elevated FGD utility rack to each absorber
for utilisation in the FGD system. The limestone slurry is fed into the wet FGD system absorber
(indicated as Flue Gas Cleaning), which is a large cylindrical tower where the flue gas comes
in contact with the limestone slurry to “scrub” the unwanted SO2 from the flue gas.
6.6 FGD System component: Input materials (Block 3)
Limestone
The limestone slurry is received from the limestone preparation process.
Process water
Raw water for the FGD system, including the MPS as a whole, will be supplied by the existing
raw water reservoir, which is in turn supplied by the MCWAP scheme. A back-washable
strainer pre-treatment system will filter the water to appropriate quality required by the FGD
equipment. Once strained the raw water is considered makeup water for use in the FGD
system.
Makeup water is also used in the FGD Closed Cycle Cooling Water System and the FGD
WWTP. The backwash from the back-washable strainers will be discharged into the existing
dirty water drains system. Other uses for the makeup water include the washing of the gypsum
and preparation of the fresh limestone suspension.
Water will be supplied by gravity feed or by two of the low pressure raw water pumps drawing
water from the reservoir. After pre-treatment the water is sent to the Process Water Tanks for
utilization in the FGD process.
Three Process Water Tanks (two operational and one backup for redundancy) will each have
a storage capacity of 8 hours of full load operation, supplying all FGD plant water demands.
Six process water pumps, each providing 100% redundancy, and one spare pump for each
tank, will secure the necessary backup water supply. Water will be supplied from the pumps
to all systems requiring clean process water.
Appendix E-2 provides a visual representation of the process followed for water handling
associated with the FGD process.
Untreated Flue Gas
Untreated flue gas leaving the existing ID fans will be diverted to the absorber inlet, via
additional dampers. Flue gas will enter the absorber and flow from the bottom to the top.
Existing ductwork will be used for the bypass. The inlet, outlet and bypass dampers will be
double louver dampers. Seal air blowers will operate between the dampers to minimize any
leakage of flue gas through the closed damper.
23 May 2018 72 12949
ZITHOLELE CONSULTING
Oxidation Air
Oxidation air will be added to the FGD absorbers to aid the formation of gypsum crystals in
the process.
6.7 FGD System component: Wet FGD system (Block 4)
FGD core infrastructure
The site arrangement of the FGD system for the Medupi Power Station is provided in
Appendix D-10. The FGD system includes infrastructure that is located within the previously
cleared and transformed footprint of the power station. Infrastructure includes:
• An absorber unit associated with each of the 6 x generation units;
• Each absorber unit will include a flue gas duct, absorber tower, absorber pump building
and absorber substation;
• Absorber drain and gypsum bleed tanks associated with each cluster of 3 absorber units,
i.e. absorber units 1 – 3 and absorber units 4 – 6; and
• FGD above-ground elevated utility racks containing piping to direct fluid from and to
relevant systems within the absorber area.
Appendix D-11 provides drawings of the absorbers for unit 1 and 4, with general geometric
dimensions, to be used for the FGD retrofit. Appendix D-11 also shows the open spray tower
diagram. These appendices serve to provide a visual representation of the infrastructure
associated with the FGD operation for SO2 reduction.
Also, included in Appendix D-10 is the site arrangement drawing, for a visual representation
of the additional infrastructure to be introduced to the existing Medupi Power Station footprint.
FGD associated infrastructure
6.7.2.1 FGD closed cycle cooling water
A new, independent Closed Cycle Cooling Water (CCCW) system will provide heat rejection
for the heat exchangers associated with the FGD equipment that requires water cooling. This
system will reduce heat emissions especially via the cooling towers for the MPS. The CCCW
system will provide cooling to:
• Limestone ball mill lubrication system;
• FGD system air compressors;
• Brine concentrator/crystalliser equipment in the WWTP area.
Cooling water for the CCCW system will be of condensate quality and will be supplied by the
existing plant to the CCCW expansion tank which is elevated to allow for gravity fill of the
system. The CCCW heat exchangers will transfer heat from the circulating cooling water to
the auxiliary cooling water. The open cycle cooling water pumps will pump the auxiliary
23 May 2018 73 12949
ZITHOLELE CONSULTING
cooling water through the CCCW heat exchangers and to the wet cooling tower. The wet
cooling tower will reject heat from the auxiliary cooling water to the atmosphere and will return
it to the system at a specified temperature.
6.7.2.2 Fire protection
The existing fire protection system will be extended to the FGD areas and the new railway
yard area. Existing firewater pumps will provide pressure for FGD fire protection. New fire
water booster pumps will be used to maintain fire water pressure at elevated points within the
system.
6.7.2.3 FGD blowdown system
The FGD blowdown system collects and conveys process waste fluids by means of drain
trenches, sumps and sump pumps. The sumps and trenches will be below grade
(underground), reinforced concrete structures. Process waste water and slurries will be
discharged into the trenches, which are sloped for gravity feed into the associated sumps.
Sumps that receive slurry will have agitators to maintain solids suspension. Each sump will
contain two sump pumps to transfer the contents to the WWTP. Sump level measurement
will start and stop the sump pumps in an alternating mode that automatically cycles between
pumps to ensure even run time. Sump pumps and pipelines that transfer slurry will be flushed
with process water upon pump shutdown.
6.7.2.4 Control system
The existing Medupi control and instrumentation system will be extended to include all
equipment required to allow the operation and monitoring of the FGD system and associated
activities. A DCS will provide control, display, alarming, reporting and archive capabilities for
the retrofit of the new FGD system. A bi-directional loop is provided for reliability so that a
break in a fibre will not affect the network. The FGD WWTP system will be provided with a
dedicated control room in the FGD WWTP building.
FGD process
The Wet Flue Gas Desulphurisation (WFGD) process system can be categorised into 3 main
plant areas as indicated in Figure 6-19. The limestone slurry is fed to the wet FGD system
absorber (indicated as Flue Gas Cleaning), which is a large cylindrical tower where the flue
gas comes in contact with the limestone slurry to “scrub” the unwanted SO2 from the flue gas.
The limestone slurry along with a mixture of reaction by-products and water is circulated from
the absorber reaction tank to spray headers in the upper part of the absorber by means of
recirculation pumps. The spray headers distribute the slurry formed and unreacted limestone
by atomizing the mixture to fine droplets with a network of sprays nozzles. As the atomized
falling droplets meet the counter current flue gas, the slurry droplets will absorb SO2, from the
flue gas. The water from the slurry will evaporate and saturate the flue gas.
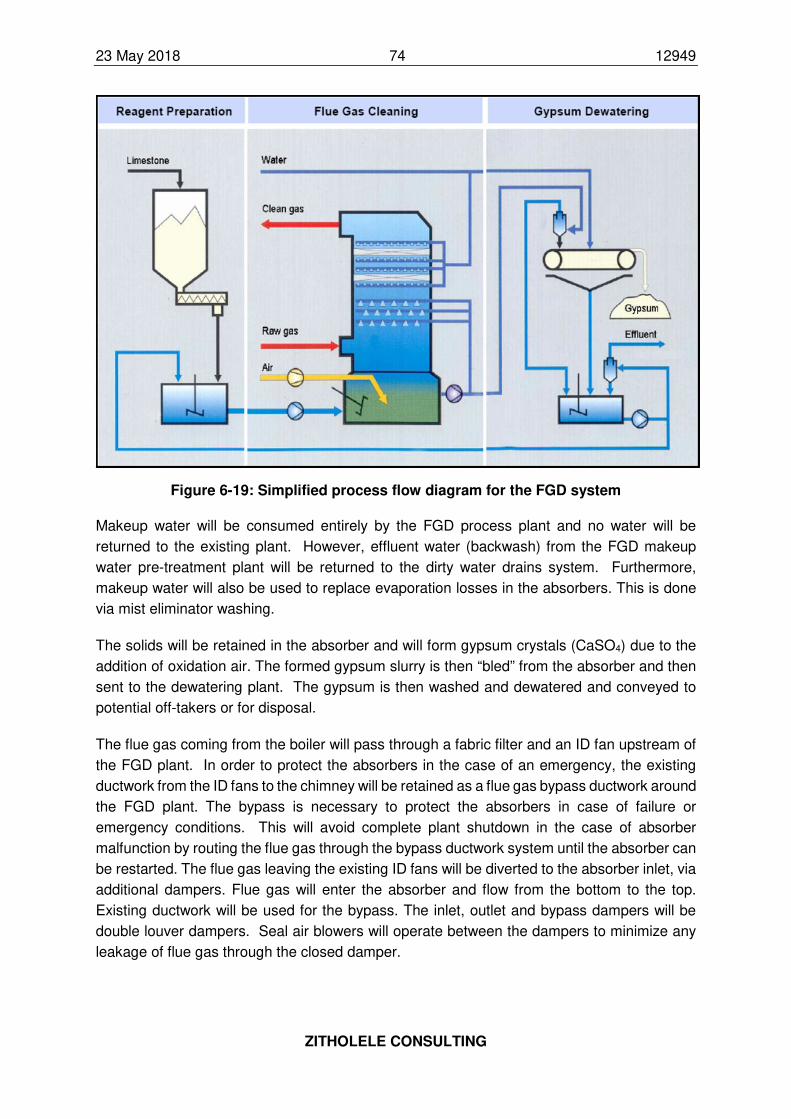
23 May 2018 74 12949
ZITHOLELE CONSULTING
Figure 6-19: Simplified process flow diagram for the FGD system
Makeup water will be consumed entirely by the FGD process plant and no water will be
returned to the existing plant. However, effluent water (backwash) from the FGD makeup
water pre-treatment plant will be returned to the dirty water drains system. Furthermore,
makeup water will also be used to replace evaporation losses in the absorbers. This is done
via mist eliminator washing.
The solids will be retained in the absorber and will form gypsum crystals (CaSO4) due to the
addition of oxidation air. The formed gypsum slurry is then “bled” from the absorber and then
sent to the dewatering plant. The gypsum is then washed and dewatered and conveyed to
potential off-takers or for disposal.
The flue gas coming from the boiler will pass through a fabric filter and an ID fan upstream of
the FGD plant. In order to protect the absorbers in the case of an emergency, the existing
ductwork from the ID fans to the chimney will be retained as a flue gas bypass ductwork around
the FGD plant. The bypass is necessary to protect the absorbers in case of failure or
emergency conditions. This will avoid complete plant shutdown in the case of absorber
malfunction by routing the flue gas through the bypass ductwork system until the absorber can
be restarted. The flue gas leaving the existing ID fans will be diverted to the absorber inlet, via
additional dampers. Flue gas will enter the absorber and flow from the bottom to the top.
Existing ductwork will be used for the bypass. The inlet, outlet and bypass dampers will be
double louver dampers. Seal air blowers will operate between the dampers to minimize any
leakage of flue gas through the closed damper.
23 May 2018 75 12949
ZITHOLELE CONSULTING
Interface with existing infrastructure
The Medupi Power Station units have been designed, and constructed, with provisions
incorporated into the space and equipment design to accommodate the installation of the wet
limestone FGD system. Each of the six generating units of the Power Station operates
independently, common facilities are provided for electricity, water, coal supply and coal
combustion waste disposal. Each unit is constructed with fabric filters and Induced Draft (ID)
fans in it. The fabric filters remove most of the particulates from the coal combustion process
and the ID fans provide necessary draft to overcome system resistance. The ID fans were
designed to accommodate additional system resistance expected due to the installation of the
FGD equipment.
The ID fans currently discharge flue directly to the chimney at each unit. The FGD system will
include additional dampers and ductwork to divert the flue gas to the FGD absorbers and then
return it to the chimney. The chimney flues are lined with corrosion-resistant liners to handle
saturated flue gas expected from the operation of the FGD systems. The existing ID fans
have been constructed with sufficient pressure capacity in their original design in order to
provide additional pressure increase required to overcome the system resistance of the FGD
retrofit.
Each of the two existing chimneys contains the flues from three boilers. The existing chimneys
will be reused with minor modification. The inside diameter of the existing flues is adequate
to cater for the flue gas volumes. The liner associated with the chimneys has sufficient
transitional velocity for condensation re-entrainment to withstand the calculated worst-case
design so that re-entrainment of moisture droplets will not occur.
The steel flue liner material for Medupi Power Station is borosilicate identical to that used for
Kusile Power Station and has to be modified in certain areas to cater for the high chloride
levels associated with the wet stacks. Furthermore, modifications to the chimney drain piping
and the chimney drain system are necessary to return collected condensation to the gypsum
bleed tanks.
6.8 FGD System component: Treated Flue Gas (Block 5) and evaporation (Block
6)
Treated flue gas is redirected from the absorbers via the flue gas ducts back to the chimneys
for release with much reduced SO2 content. During the process evaporation losses are
incurred.
6.9 FGD System component: Gypsum handling, re-use and disposal (Block 7)
Gypsum dewatering and conveyance
Gypsum slurry will be produced from the FGD process as a by-product of the wet scrubbing
process. The slurry exiting the FGD process will comprise gypsum, a mixture of salts
23 May 2018 76 12949
ZITHOLELE CONSULTING
(Magnesium Sulphate (MgSO4) and Calcium Chloride (CaCl2)), limestone, Calcium Fluoride
(CaF2), effluent and dust particles.
Effluent generated in the process is directed to the Waste Water Treatment Plant (WWTP),
while the overflow of the gypsum dewatering hydro cyclones goes to the Waste Water Hydro
Cyclone (WWHC) feed tanks. The WWHC feed tanks are located in the gypsum dewatering
building. From the WWHC feed tanks, the water goes through the WWHC where the underflow
is directed to the reclaim tanks and the overflow to the Zero Liquid Discharge (ZLD) holding
tanks. The ZLD holding tanks feed the WWTP.
The gypsum discharged from the dewatering infrastructure will be dropped onto a collecting
conveyor by means of bifurcated chutes. An online monitoring system installed within the
gypsum production process will be utilised to assess gypsum quality. The collecting conveyor
will take the gypsum to the transfer house where the gypsum will be transferred to one of two
link conveyors feeding a series of gypsum conveyors or can be loaded directly onto trucks for
small-scale offtake of gypsum by commercial offtakers.
The site arrangement of the FGD system for the Medupi Power Station is provided in
Appendix D-10 and shows the infrastructure associated with the gypsum dewatering and
conveyance. Infrastructure associated with the gypsum dewatering and conveyance includes:
• Gypsum bleed tanks and forwarding pumps;
• Piping and elevated FGD utility rack;
• Gypsum dewatering building containing gypsum hydrocyclones and waste water
hydrocyclones;
• Belt filter and reclaim tank;
• Gypsum conveyer belt system, including the transfer link;
• Gypsum truck loading facility; and
• Gypsum storage building and offtake via rail.
Gypsum re-use and commercialisation
In terms of the waste management hierarchy, the first priority of waste management is
avoidance, followed by reduction in the quantities of waste, re-use and recycling, treatment of
waste and lastly disposal of waste to landfill. For the Medupi Power Station neither ash or
gypsum production can be avoided. Limited actions can be taken to reduce the production of
ash and gypsum, while in the absence of a significant market demand for ash and gypsum,
the only remaining option is to dispose of ash and gypsum on an appropriately designed and
licenced facility.
Eskom has developed an updated Gypsum Commercialisation Strategy in 2017 in order to
guide the commercial strategy it should pursue for its gypsum production. One of the key
challenges the commercialisation of gypsum faces is that commercialisation of gypsum is the
product of many moving parts and can only take place when these parts align. Due to this,
there will be a degree of uncertainty in commercialising gypsum. Eskom’s strategy concluded
23 May 2018 77 12949
ZITHOLELE CONSULTING
that building and commencement of a declassification strategy for gypsum must be
undertaken, as well as preparing and releasing a Request for Information (RFI) for possible
off-takers. The strategy further acknowledges that due to the timing of the commissioning of
Kusile and Medupi’s units and the time and capital required to build the required infrastructure,
there are limited actions that can be taken at present. Eskom cannot, however, drive
commercialisation (i.e. beneficiation of waste) alone and require commercial stakeholders to
come on-board. In order to spark interest with stakeholders Eskom has scheduled a workshop
with key industry stakeholders in the first half of 2018 to discuss beneficiation of its waste.
Dewatered gypsum generated during the dewatering process can be sold commercially given
the right quality and demand. In order to produce commercial-grade gypsum, it is necessary
to keep the chloride content under a certain limit. For this reason, during the dewatering
process, the filter cake will be washed with FGD makeup water to decrease the chloride
content, which can bring the quality to an acceptable level for saleable gypsum. A refinement
process is carried out to separate and dewater the gypsum.
Gypsum exits the Gypsum Dewatering Building via gypsum collecting conveyor in an eastward
direction. At the gypsum transfer house 1, gypsum is either transferred onto gypsum link
conveyors that will transport gypsum to the gypsum storage building, or onto a gypsum link
conveyor that will link the gypsum stream to the overland ash conveyor that transports ash to
the existing ADF. A direct gypsum offtake area will be constructed at the gypsum transfer
house 1 for small scale off-take of gypsum by offtakers. This will consist of a road leading off
an internal road and loading bay area where gypsum will be loaded on to vehicles. At this
point, the ground will be prepared for management of any gypsum that is not contained and
the trucks will be washed before leaving this area. The washing is a means to ensure
containment of gypsum within designated dirty areas.
Given demand and off-take potential from commercial off-takers, infrastructure to convey
gypsum from the gypsum transfer house 1 to the gypsum storage building and railway yard
for transport of large volumes of gypsum via rail will be constructed at a future date when the
commercial market has been established and demand is sufficient to justify construction of
the already designed and catered for infrastructure. At the gypsum storage facility commercial
grade gypsum will be fed onto an elevated mobile tripper car. Material from the car will be
stacked into three indoor day storage stockpiles. The separate storage piles will allow for one
pile to be stacked while another is being reclaimed and a third is quality tested.
The gypsum storage facility will accommodate 100% of the total gypsum production for three
days and will be used in conjunction with the rail siding only. The gypsum storage building is
a future use facility that will be built when the market demand for gypsum has grown large
enough to support large-scale offtake of gypsum at the Medupi Power Station. There will be
no facilities for the loading of gypsum onto trucks at the gypsum storage building in the railway
yard. Smaller-scale offtake of gypsum via trucks have however been designed just west of the
gypsum dewatering facility where the conveyor transporting gypsum reach the first transfer
house. Use of gypsum will be subjected to quality assessments, which will be done at the
storage facility. If the quality is not usable, the gypsum will be taken for disposal.
23 May 2018 78 12949
ZITHOLELE CONSULTING
Gypsum disposal
In the event that no large-scale commercial offtake of gypsum is secured, gypsum from
transfer house 1 will be conveyed to the existing overland ash conveyor. In this conveyor
system, the gypsum will be mixed with ash on the conveyor at the transfer house and will be
disposed together on the footprint of the authorised ADF. The conveyor route and transfer
houses for gypsum onto the overland ash conveyor are shown in Appendix D-9. It should be
noted that gypsum disposal at the ADF will be carried out from the 6th year of the FGD
infrastructure operation, at which point the ash facility will have a Class C liner, which is
appropriate to receive the gypsum and ash waste types (Type 3).
In terms of the previous ash classification processes, i.e. the Minimum Requirements
Documents Series, ash was considered to be hazardous and thus the 0 to 2 year area was
designed and authorised according to the Department of Water and Sanitation (DWS)
Minimum Requirements, resulting in a H:h liner system being installed at the ADF. However,
regulations were promulgated by the DEA in terms of NEM:WA on the 23 August 2013. In
terms of the NEMWA regulations, ash and gypsum now classify as Type 3 wastes, and require
to be disposed of on a Class C barrier system. This barrier will be implemented at the existing
ADF from year 4 to the area required for the life of the existing ADF.
A separate application to amend the existing ADF Waste Management Licence is being
undertaken for disposal of gypsum and ash together on the existing footprint of the authorised
ADF.
Appendix E-3 provides a flow diagram of the activities involved in gypsum handling.
6.10 FGD System component: Waste Water Treatment (Block 8)
The Medupi FGD Waste Water Treatment Plant is located directly west opposite generation
units 1 to 3 at the Medupi Power Station (Figure 6-20). FGD chloride bleed stream, from the
washing of the gypsum, and FGD auxiliary cooling tower blowdown stream are diverted to the
ZLD holding tanks. The Total Organic Carbon (TOC) scavenger regeneration waste water
from the filter press system / existing water treatment plant (WTP) will also be directed to FGD
WWTP located next to the gypsum dewatering plant.
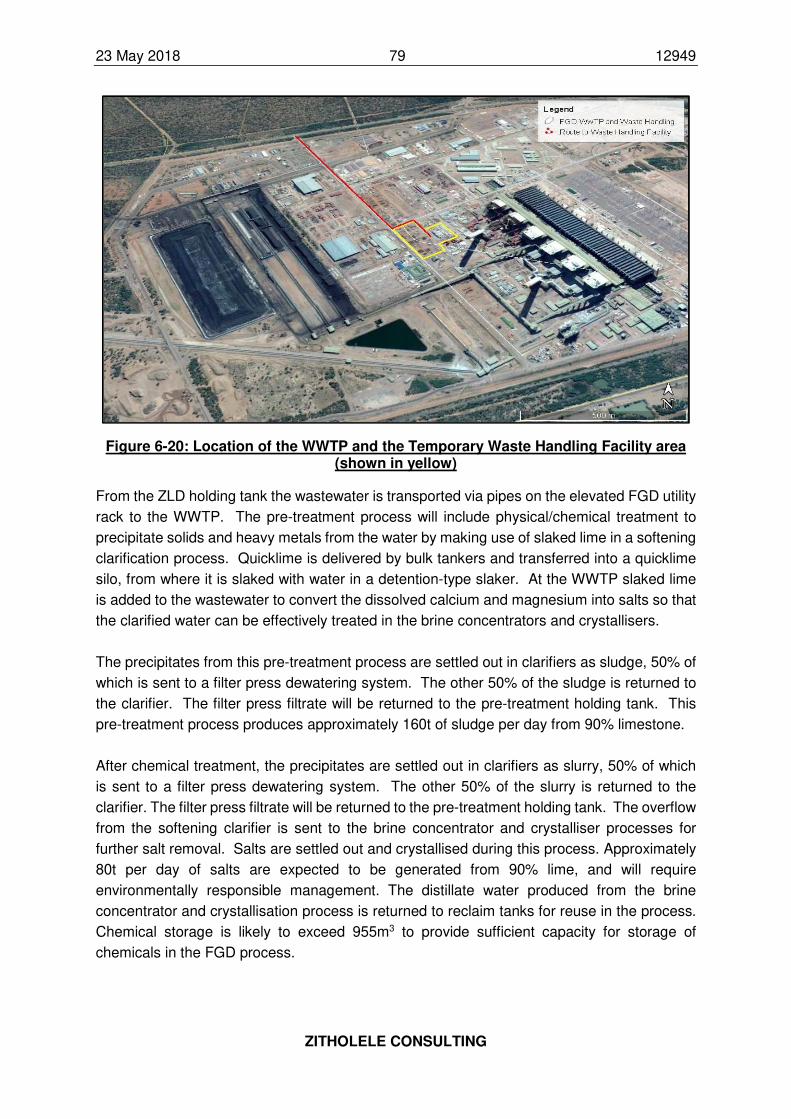
23 May 2018 79 12949
ZITHOLELE CONSULTING
Figure 6-20: Location of the WWTP and the Temporary Waste Handling Facility area (shown in yellow)
From the ZLD holding tank the wastewater is transported via pipes on the elevated FGD utility
rack to the WWTP. The pre-treatment process will include physical/chemical treatment to
precipitate solids and heavy metals from the water by making use of slaked lime in a softening
clarification process. Quicklime is delivered by bulk tankers and transferred into a quicklime
silo, from where it is slaked with water in a detention-type slaker. At the WWTP slaked lime
is added to the wastewater to convert the dissolved calcium and magnesium into salts so that
the clarified water can be effectively treated in the brine concentrators and crystallisers.
The precipitates from this pre-treatment process are settled out in clarifiers as sludge, 50% of
which is sent to a filter press dewatering system. The other 50% of the sludge is returned to
the clarifier. The filter press filtrate will be returned to the pre-treatment holding tank. This
pre-treatment process produces approximately 160t of sludge per day from 90% limestone.
After chemical treatment, the precipitates are settled out in clarifiers as slurry, 50% of which
is sent to a filter press dewatering system. The other 50% of the slurry is returned to the
clarifier. The filter press filtrate will be returned to the pre-treatment holding tank. The overflow
from the softening clarifier is sent to the brine concentrator and crystalliser processes for
further salt removal. Salts are settled out and crystallised during this process. Approximately
80t per day of salts are expected to be generated from 90% lime, and will require
environmentally responsible management. The distillate water produced from the brine
concentrator and crystallisation process is returned to reclaim tanks for reuse in the process.
Chemical storage is likely to exceed 955m3 to provide sufficient capacity for storage of
chemicals in the FGD process.
23 May 2018 80 12949
ZITHOLELE CONSULTING
The distillate emanating from the process will be diverted back to the FGD system for re-use
in the FGD process, while dirty water run-off will be utilised in the FGD process to improve
water usage.
Appendix E-4 provides a visual interpretation of the activities carried out during the
wastewater handling.
6.11 FGD System component: Management of WWTP by-products (Block 9)
Sludge and salts will be temporarily stored in appropriately designed storage facilities next to
the WWTP. The storage facilities will each have a 7-day storage capacity. Two storage areas
will be provided for, with Salts and Sludge Storage Area 1 and 2 sized to approximately 4
800m2 and 16 000m2 in size, respectively. The storage areas will conform to the Norms and
Standards for the Storage of Waste (GN926 of 29 November 2013) and will be registered as
a waste storage facility in terms of these Norms and Standards. This registration process will
be undertaken separately to this authorisation as it does not require a waste management
licence process to be undertaken.
Salts and Sludge will after storage be transported (trucked) and disposed of at a registered
waste disposal facility for the first 5 years of operation. The waste disposal service provider
has not been confirmed yet, although disposal at Holfontein has been considered as a suitable
waste disposal service provider, among other suitable service providers. For transportation of
this waste to a disposal site, Eskom will utilise the services of a service provider who has all
required authorisations and systems in place to manage the waste stream from storage to the
disposal facility.
6.12 Resource Requirements
Raw water supply and MPS Water balance
Medupi Power Station requires a total volume of 15.4 million cubic metres per annum (Mm3/a)
of raw water to operate the power station including the FGD units which will be retrofitted later
as per the water balance in Appendix E-1. Currently the power station has a total water
allocation of 10.9 Mm3/a, which is sourced from Mokolo Dam via Phase 1 of the MCWAP. This
allocation of 10.9 Mm3/a will be enough to operate the MPS as well as 3 (three) x FGD units.
The water shortfall of 4.5 million m3/a will be sourced via Phase 2A of the MCWAP once
implemented by DWS, and will cater for, amongst other requirements, the remaining 3 (three)
x FGD units. Water supply agreements are to be concluded and signed with the DWS by the
middle of 2018 for the supply of water to both Medupi and Matimba power stations which will
be aligned to WUL (section 21(a)). Medupi Power Station must be able to treat up to 100% of
its water requirements from Phase 2A of the MCWAP should the need arise to ensure water
security to the FGD system.
23 May 2018 81 12949
ZITHOLELE CONSULTING
Potable water
The existing potable water system at the MPS will be extended to ensure supply to the potable
water requirements of the FGD area. Two 100% potable water booster pumps will ensure
adequate pressure to meet system demands. Backflow preventers will prevent contamination
into the potable water system and backpressure regulators will isolate the non-essential water
users in the event of low system pressure.
Compressed Air
The compressed air system will supply dry air for all the service and instrument air uses of the
FGD and railway yard. Two FGD air compressors and two filter/air dryers will provide
compressed, oil-free air at the required capacity and pressure to meet the FGD requirements.
Auxiliary power supply
A new 132kV power supply is under investigation for installation at the 132kV switchyard to
provide backup power to the FGD system. This backup power is required to maintain 100%
redundancy in the FGD power system.
New auxiliary transformers will transform 11kV three-phase power supplied from the existing
11kV system, to 6.9kV three-phase power as required by the FGD system and the railway
yard. The transformers will supply 6.9kV to the FGD plant board switchgear buses through
main breakers. The switchgear buses for similar service will be connected through a
tiebreaker. The main breakers and the tiebreaker will make it possible for a switchgear bus to
be fed from two separate sources.
A new emergency diesel generator (EDG) with a dedicated day tank will be required to provide
emergency shutdown power at 6.6kV upon loss of normal 6.6kV AC power supply. The
existing 2500kVA Medupi EDG’s do not have this additional capacity to support the FGD
loads. The EDG will be connected to a 6.6kV AC essential switchgear and provide a backup
power feed to the essential 6.6kV process water pumps. The essential power will then be
distributed to step-down transformers which will supply 400V AC essential boards in each of
the FGD clusters. From there the power will be distributed to loads such as the valves that
must operate on the loss of power to the FGD system, etc.
New 230V AC uninterruptible power supply (UPS) systems will be provided for all FGD
buildings containing LV 400V boards. These UPS systems will provide essential power for
board control as well as functioning as “dip-proof” power supplies to maintain contactor
position.
New 220V DC Nickel Cadmium (NiCad) batteries with dedicated chargers will be provided to
supply essential power for control of MV boards and will be located within each substation.
23 May 2018 82 12949
ZITHOLELE CONSULTING
6.13 Water and Storm Water Management
Water Conservation and Demand Management
Medupi Power Station is situated in the water deficit catchment, which implies that all efforts
must be put in place to use water in the efficient and sustainability manner. Eskom took this
into consideration in the design of Medupi Power Station. The power station makes use of a
dry cooled technology and will use approximately 0.14 litres of water per kWh of electricity
produced compared to 2 litres of water per kWh of electricity produced from a wet cooled
power station. The volume of water used at Medupi Power Station to produce electricity is
expected to increase by approximately 0.35 litres of water per kWh with the operation of the
wet FGD plant units. Additional measures to manage water use effectively and reduce water
consumption by the MPS are discussed below.
6.13.1.1 Zero Liquid Effluent Discharge Philosophy
Medupi Power Station is designed to operate under Zero Liquid Effluent Discharge (ZLED)
Philosophy, which implies that the power station will not discharge impacted or dirty water into
the environment under normal operating condition (see the overall power station Water
Balance, Appendix E), including the operation of the wet FGD. The power station recycles
and reuses water on-site. Currently, as the power station is still under construction, while
commissioning and operational activities are on-going, to manage effluent water on-site, with
the permission from DWS, the power station temporary pumps from the clean and dirty water
dams into the raw water reservoirs and pumped back to the water treatment plant for treatment
and use to produce filtered and demineralised water for electricity generation purposes.
6.13.1.2 Water Accounting Framework
Medupi Power Station, like the other Eskom power stations, must comply with Eskom Water
Accounting Directive which is aimed at installing meters at key streams to allow for proper
water accounting management to be done. In the event that high water consumption is
detected than usual at the metered streams, the directive requires that the discrepancy be
investigated, and proper solution be implemented. The implementation of some major streams
at the power station has been completed and forms part of the station current water accounting
programme and the project to install meters at the remaining streams is underway.
6.13.1.3 Water Management Awareness Programme
Medupi Power Station conducts water management awareness to its contractors and staff
regularly. Some of the actions required to be undertaken by the contractors and Medupi Power
Station Staff include:
• Contractors must ensure that water supply facilities, network and connections at the water
drinking points are inspected and maintained on a regular basis to minimise/prevent water
losses.
23 May 2018 83 12949
ZITHOLELE CONSULTING
• Any irregularities picked-up must be repaired within a short period of time. Where feasible,
records of storm water used on-site should be kept and submitted to DWS on quarterly
basis.
• The contractors must, prior to performing excavation activities, submit excavation permits
forms to Eskom for approval as per Excavation Permit Application Procedure (200-16817).
This will assist to avoid breakage/damage of the water supply lines during excavations.
• Eskom must ensure that the updated version of the water supply network is available and
is provided to contractors upon request or during the application for excavation permit.
• Contractors must report any damage to water services and manholes and K-eye lines to
Eskom’s Health and Safety Department and the Environmental Department as per the
approved incident management procedures (200-10506) and Eskom Construction Site
Support Service Department.
• Eskom and contractors must, on regular basis test the quality of the potable and surface
(storm) water to ensure it is within legal limits.
Eskom management commits for the implementation of the water conservation measures
where feasible. Eskom and Contractors must continue to identify, implement and maintain
measures to conserve the scare resource and prevent any inefficient use where feasible.
Storm Water Management
Storm water management assessment has been undertaken for the proposed railway siding,
gypsum and limestone handling and storage areas, FGD plant areas at the generating units,
temporary waste disposal areas at the WWTP, and all associated infrastructure to support this
infrastructure.
6.13.2.1 Storm Water Management Philosophy
Government Notice 704 (GN 704) Regulations on use of mining and related activities aimed
at the protection of water resources relates to mining and not directly to coal fired power
stations or industries in general. However, due to a lack of storm water management
legislation relating directly to coal fired power stations, GN 704 is used in terms of Best
Practice. Stipulations from Government Notice 704 (GN 704) and Government Notice 926 (GN
926) National Norms and Standards for the Storage of Waste are applicable to the storm water
management philosophy for the Medupi FGD Retrofit Project and its associated infrastructure.
The storm water management philosophy for the Medupi FGD Retrofit Project is therefore
focused on complete separation of clean and dirty water containment systems and the
prevention of pollution of the clean water system as a result of spillages from the dirty water
containment system.
The storm water management system for Medupi Power Station, including the proposed
retrofitting of the FGD Infrastructure, railway siding and associated infrastructure has been
somewhat compartmentalised in that some of the storm water management areas within the
Medupi Power Station footprint for new infrastructure relating to the FGD Retrofit has been
23 May 2018 84 12949
ZITHOLELE CONSULTING
designed to conform to ZLED and will employ evaporative technologies to avoid discharge of
dirty water to the power station’s existing dirty storm water containment infrastructure.
As a result, the storm water management system for the Medupi Power Station and proposed
FGD related infrastructure will be discussed in a compartmentalised manner in the following
sections.
6.13.2.2 Existing Storm Water Management system within the Medupi Power Station
The conceptual design of the storm water management infrastructure associated with the FGD
system within the Medupi Power Station footprint was undertaken by Knight Piesold (Knight
Piesold, 2017). The following existing dams were assessed as part of the GoldSim water
balance model, with new dams proposed as the footprint of the ADF develops:
• Existing Dam D1 (to the east of the ADF).
• Existing Dam D2 (to the south of the ADF).
• Existing Dam D2B (to the north of the ADF).
• Proposed Dam D3 (to the south of the ADF). This PCD has been authorised but not yet
constructed.
• Proposed Dam D3B (to the north of the ADF). This PCD has been authorised but not yet
constructed.
• The Excess Coal Stockyard Dams, namely the existing dams PCD D4 and D5 and
• The proposed PCDs D6, D7 and D8. These PCDs has been authorised but not yet
constructed.
The clean and dirty water drains within the Medupi Power Station terrace area were designed
to convey the peak runoff rate from a 1:50 year recurrence interval storm (24 hour duration).
The underground drains were designed to be pre-cast concrete culverts of various sizes. The
layout and extent of the clean water system is shown in Figure 6-21 and the system drains to
the Medupi Power Station Clean Water Dam (CWD). The clean water drainage system will
drain areas that has been declared as clean catchments until such time that these areas are
categorised as dirty areas. At this point the drainage infrastructure will be diverted to report
the dirty runoff water to the dirty water system.
The layout and extent of the dirty water system is shown in Figure 6-22. This system drains
into the Dirty Water Dam (DWD). The main FGD area was originally designed using the clean-
dirty water catchment designation shown in Figure 6-23, which represent the area available
where the FGD infrastructure, WWTP and associated infrastructure will be constructed. The
system was designed based on future anticipated land use, i.e. the percentage of impervious
area per catchment was based on future development of catchments. This level of
development will be classified as the predevelopment scenario.
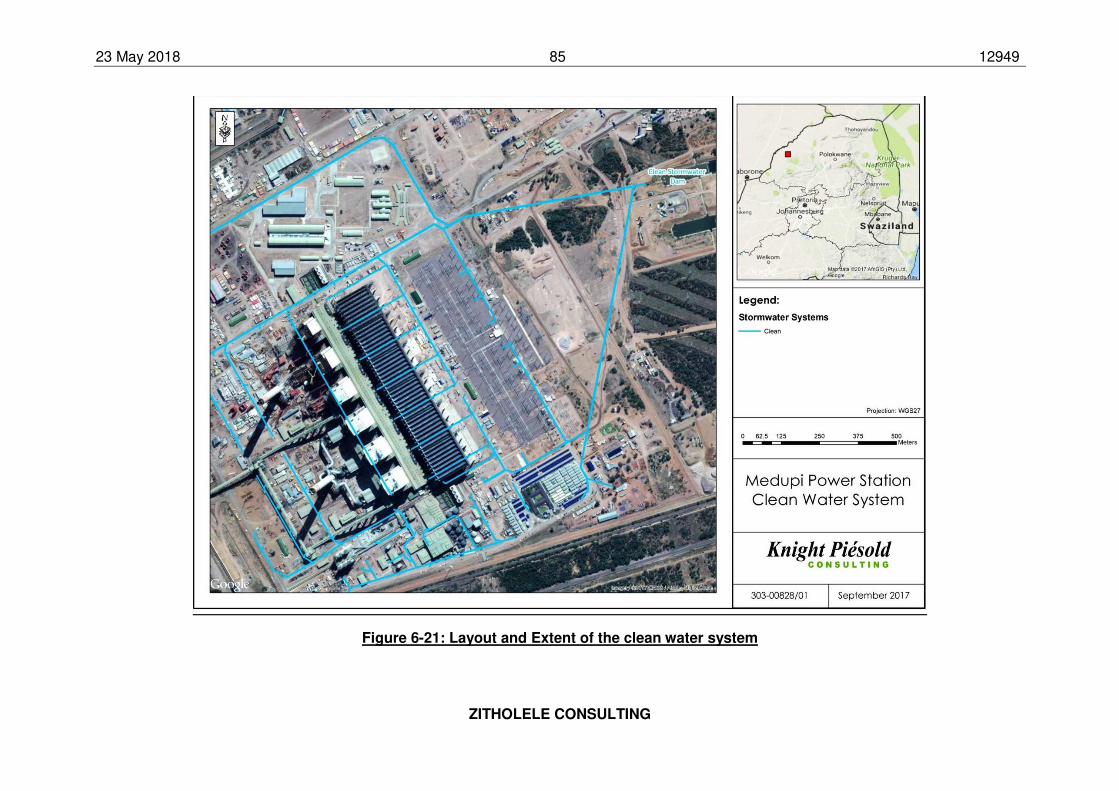
23 May 2018 85 12949
ZITHOLELE CONSULTING
Figure 6-21: Layout and Extent of the clean water system
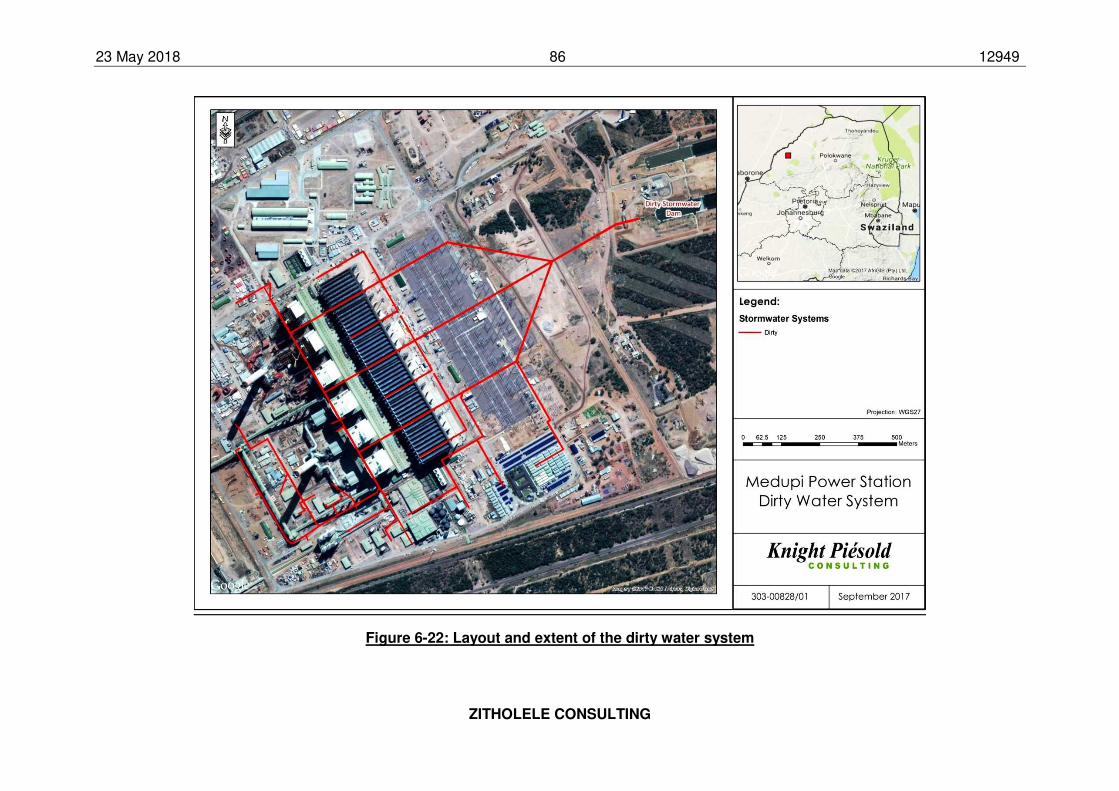
23 May 2018 86 12949
ZITHOLELE CONSULTING
Figure 6-22: Layout and extent of the dirty water system
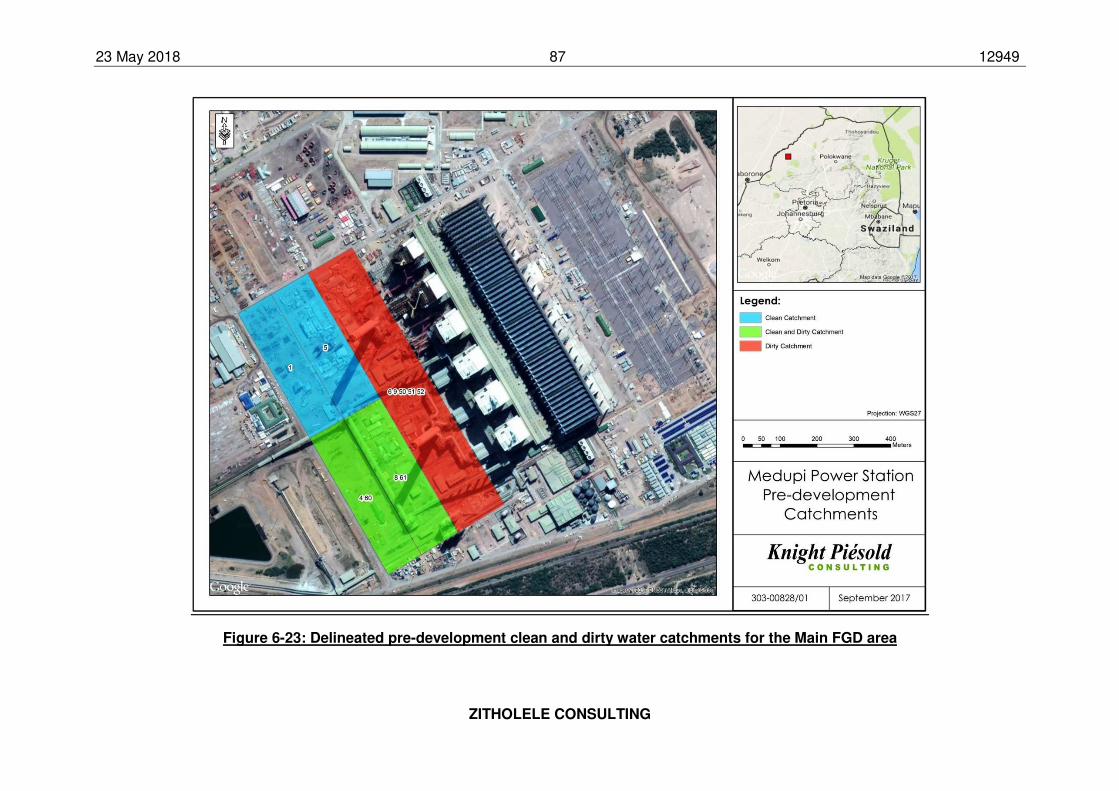
23 May 2018 87 12949
ZITHOLELE CONSULTING
Figure 6-23: Delineated pre-development clean and dirty water catchments for the Main FGD area
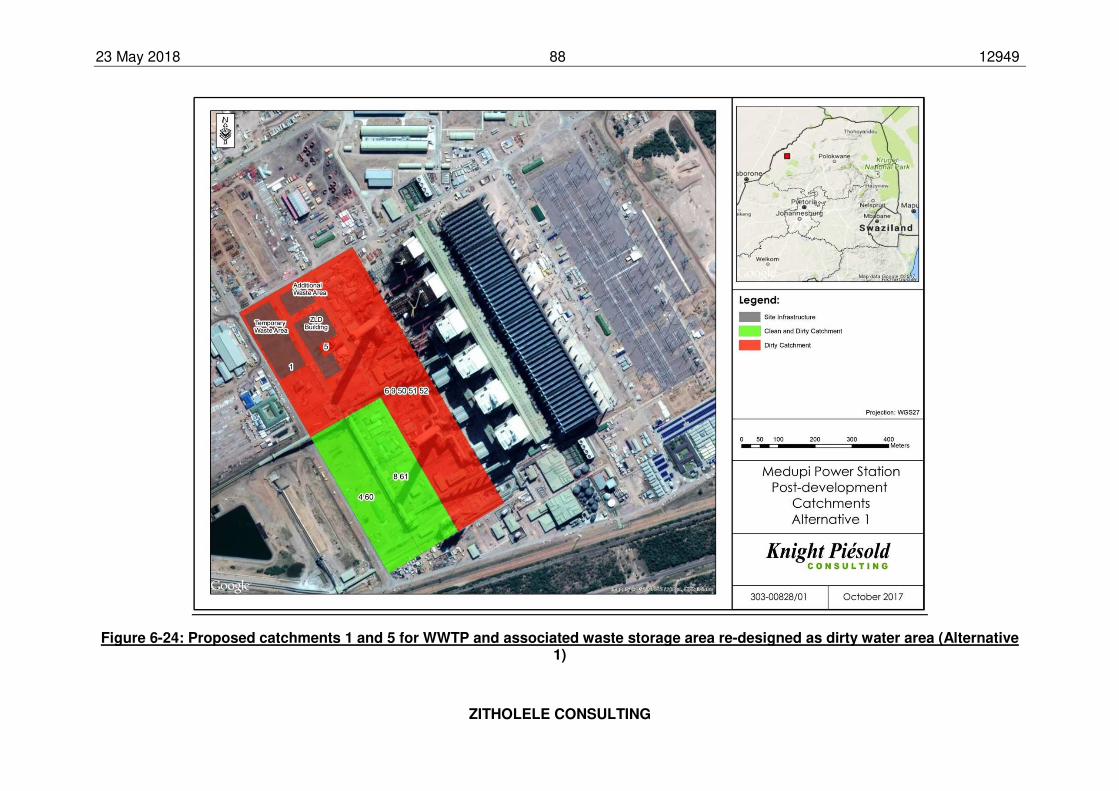
23 May 2018 88 12949
ZITHOLELE CONSULTING
Figure 6-24: Proposed catchments 1 and 5 for WWTP and associated waste storage area re-designed as dirty water area (Alternative 1)
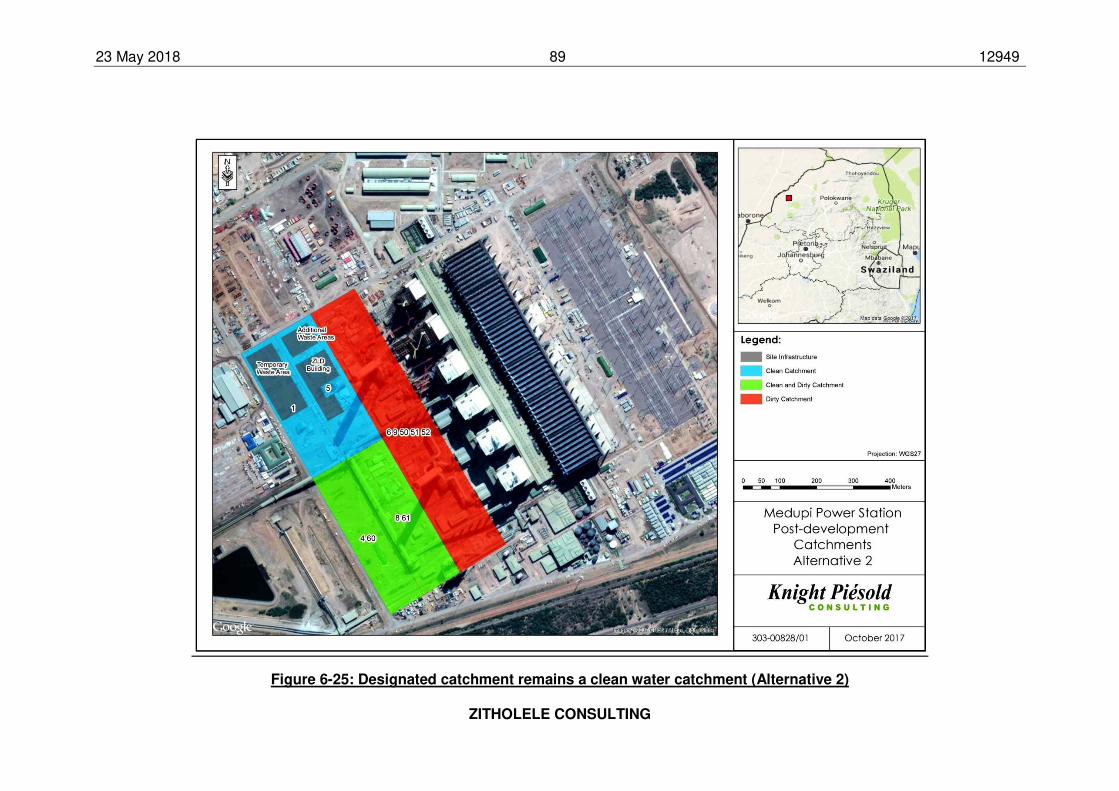
23 May 2018 89 12949
ZITHOLELE CONSULTING
Figure 6-25: Designated catchment remains a clean water catchment (Alternative 2)
23 May 2018 90 12949
ZITHOLELE CONSULTING
Based on the delineated catchments represented in Figure 6-23, the volume of runoff
calculated for the 1:50 year recurrence interval 24 hour duration storm is 40700 m3 for the
DWD and 55000 m3 for the CWD. These volumes are required to be stored over and above
the minimum water level in the dam and the operational requirements of the Power Station for
the respective dams. The total storage capacity is 102 000 m3 for the DWD and 133 400 m3
for the CWD.
6.13.2.3 Proposed storm water management infrastructure within the Medupi Power Station
Concept design of FGD main area, WWTP and temporary waste handling facility (2017)
In the storm water management assessment study undertaken by Knight Piesold (Knight
Piesold, 2017), the post-development (post-construction) catchment delineation was based
on the existing and proposed FGD main area infrastructure, the proposed WWTP and a
temporary waste handling facility with some storage capacity.
The conceptual designs considered 2 alternatives for the storm water management in this
area, which included:
1. the provision of storm water management to cater for the potential spillages which may
occur during transportation of the chemical salts and sludge, hence the area earmarked
for the development of the WWTP and associated storage area (blue area in Figure 6-23)
to be re-designed to be a dirty water catchment area, as shown in Figure 6-24;
2. The designated catchment area for the development of the WWTP and associated storage
area to remain a clean water catchment area (Figure 6-25), based on the assumption that
the area will be bunded properly to avoid contamination of the clean water storm water
system.
Findings from the study indicated that although the capacity of the existing clean storm water
management system would be sufficient to handle clean water emanating from the catchment
areas, the conversion of the clean water catchment area to a dirty water catchment area in
the recommended alternative (Alternative 1) above would result in insufficient capacity of the
DWD to store the new dirty water runoff volumes. Additional dirty water storage is therefore
required.
Updated design of WWTP and temporary waste handling facility (2018)
An updated concept design for the WWTP and the Waste Handling and Storage Facility
(WHSF) was undertaken by Zitholele Consulting in 2018 (Zitholele Consulting, 2018). As part
of this concept design, re-assessment of the storm water management requirements
associated with the proposed design was undertaken, and as a result supersedes the
assessment and findings indicated by the Knight Piesold study of 2017. Differences in the
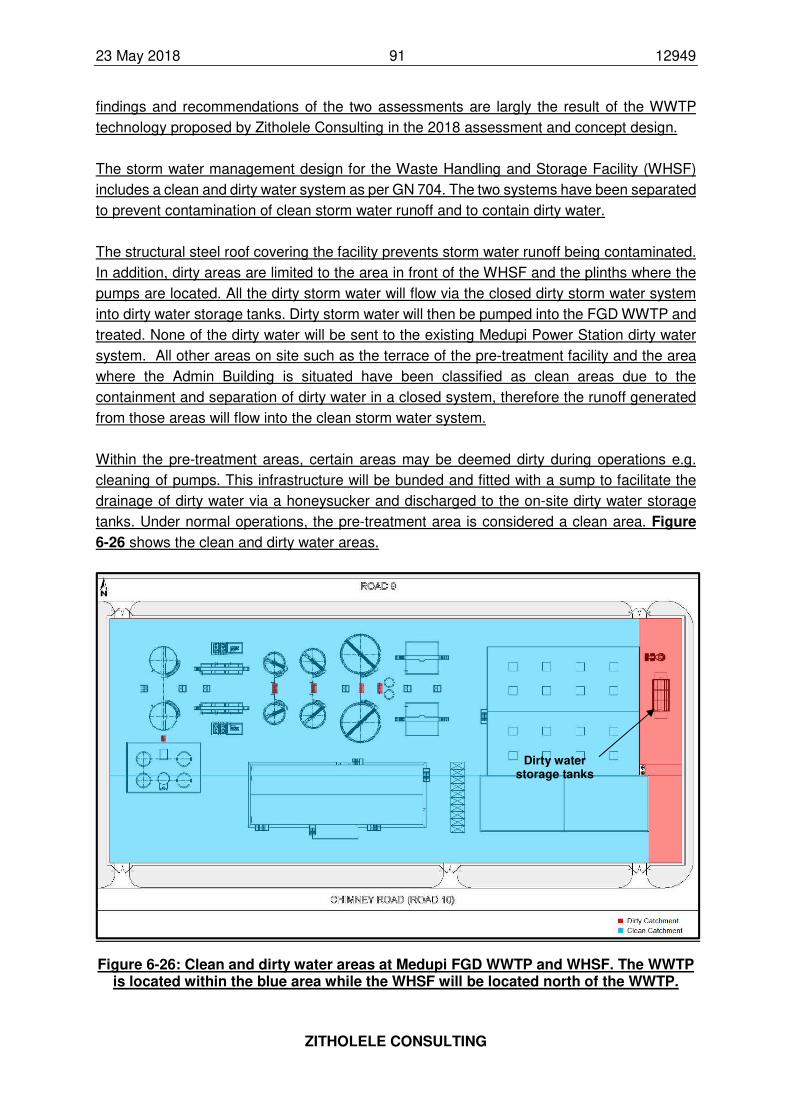
23 May 2018 91 12949
ZITHOLELE CONSULTING
findings and recommendations of the two assessments are largly the result of the WWTP
technology proposed by Zitholele Consulting in the 2018 assessment and concept design.
The storm water management design for the Waste Handling and Storage Facility (WHSF)
includes a clean and dirty water system as per GN 704. The two systems have been separated
to prevent contamination of clean storm water runoff and to contain dirty water.
The structural steel roof covering the facility prevents storm water runoff being contaminated.
In addition, dirty areas are limited to the area in front of the WHSF and the plinths where the
pumps are located. All the dirty storm water will flow via the closed dirty storm water system
into dirty water storage tanks. Dirty storm water will then be pumped into the FGD WWTP and
treated. None of the dirty water will be sent to the existing Medupi Power Station dirty water
system. All other areas on site such as the terrace of the pre-treatment facility and the area
where the Admin Building is situated have been classified as clean areas due to the
containment and separation of dirty water in a closed system, therefore the runoff generated
from those areas will flow into the clean storm water system.
Within the pre-treatment areas, certain areas may be deemed dirty during operations e.g.
cleaning of pumps. This infrastructure will be bunded and fitted with a sump to facilitate the
drainage of dirty water via a honeysucker and discharged to the on-site dirty water storage
tanks. Under normal operations, the pre-treatment area is considered a clean area. Figure
6-26 shows the clean and dirty water areas.
Figure 6-26: Clean and dirty water areas at Medupi FGD WWTP and WHSF. The WWTP is located within the blue area while the WHSF will be located north of the WWTP.
Dirty water storage tanks
23 May 2018 92 12949
ZITHOLELE CONSULTING
In the event that the dirty water storage tanks are at a high level and at risk of overflowing (no
available volume in the storage tanks), provision will be made for this water to be pumped to
the FGD WWTP using a mobile pump. Refer to Appendix C-5 for the Medupi FGD WWTP
Conceptual Report (Zitholele Consulting, 2018).
Conclusion on recommended additional dirty water infrastructure capacity
When the concept design undertaken by Knight Piesold (Knight Piesold, 2017) was
considered in light of the updated concept design for the WWTP and temporary waste storage
facility undertaken by Zitholele Consulting (Zitholele Consulting, 2018) it is evident that the
recommendations and findings were different from those of Knight Piesold, recommending
additional dirty storm water infrastructure after the footprint allocated to the WWTP and
temporary waste storage facility was changed to a dirty storm water catchment. Zitholele
Consulting on the other hand found that the WWTP and temporary waste storage facility area
could be designed to be a closed system with dirty storm water generated within the allocated
footprint being redirected to the WWTP and treated.
As a result Eskom issued a technical memorandum to confirm its stance on this specific issue
in February 2018 (Eskom Holdings SOC Limited, 2018). Eskom reiterated the fact that the
technology selection process associated with the updated concept design of the facilities
shows the use of enclosed buildings to house the process plant equipment, electrical and
control equipment and to store the salts and sludge waste products would result in clean areas
and will generate clean storm water which will feed into the clean storm water infrastructure.
The WWTP design of Zitholele Consulting (2018) will be implemented, with the area remaining
a clean storm water management area (see Figure 6-25 and Figure 6-26). The dirty footprint
has been minimised and contained, and consists of the pump plinths, the areas in front of and
behind the sludge and salt handling facility and the conveyor corridor. The dirty storm water
generated from these areas will be transported to a dirty water sump in the WWTP and reused
in the truck wash bay thus negating the need to make use of the existing dirty storm water
infrastructure.
The need for new dirty storm water infrastructure to manage the dirty storm water generated
by the footprint earmarked for the construction of the FGD WWTP as recommended by the
Knight Piesold report has therefore been addressed by the design of the FGD WWTP
undertaken by Zitholele Consulting (2018), which firstly minimises dirty storm water generation
and thereafter reuses this dirty storm water to ensure that there is no impact on the existing
dirty water infrastructure.
23 May 2018 93 12949
ZITHOLELE CONSULTING
6.13.2.4 Storm water management for rail siding, and gypsum and limestone handling area
Railway yard/rail siding
Storm water management infrastructure was considered and included in the concept designs
undertaken for the rail yard (Bosch Holdings Consortium, 2015).
The portion north of the railway line drains to a geocell lined channel at the north side of the
rail yard. This existing geocell lined channel to the north of the rail yard has a capacity of
1.26m³/s. Current storm water contributions to this channel is 4.0m³/s from the Overland
Conveyor Clean Storm Water Transfer Culvert no.1, and a 7.56m³/s from overland flow. This
channel drains from west to east and exits at a newly upgraded storm water culvert.
The clean railway storm water will be collected using concrete channels and underground
pipes to drain into a new proposed earth lined channel that will drain to a newly upgraded
culvert. The culvert below the existing service road will have to be removed and replaced by
the proposed new larger culverts below the railway platform.
A new culvert underneath the main railway platform will be constructed. This railway platform
main culvert was sized for a peak flow of 20m³/s to accommodate the combined run-off without
considering attenuation. An existing 1.5m x 1.5m box culvert crosses the existing TFR railway
line about 150m downstream of the new platform main culvert. The capacity of the existing
culvert is estimated to be 7m³/s. Downstream of the platform main culvert shaping of the
natural ground will have to be done.
The existing capacity of the 1050mm pipe culverts is 2.05m³/s. The total peak flow at the new
jacked culverts is 10.2m³/s for a 1:50 year return period. It is proposed that the existing dam
2 spillway overflow will be extended below the new railway platform and diverted to the newly
jacked rectangular culverts. Flows from the dry ash disposal facility will be drained below the
new railway platform to join the jacked culverts.
Limestone and Gypsum storage and handling area
Storm water requirements for the proposed Limestone and Gypsum storage and handling area
was investigated by Aurecon in 2017 (Aurecon, 2017a) (Aurecon, 2017b). These reports
provide feedback on the design of the Medupi storm water system within the limestone
stockpile and gypsum storage area. The limestone stockpile is an open area which will deliver
dirty storm water run-off to the proposed PCDs. The gypsum storage building will be covered
which can then be seen as a clean storm water run-off area and water will flow to the existing
clean storm water channel.
Open concrete lined trapezoidal channels are proposed to accommodate the 1:50 year peak
flows. Trapezoidal channels are proposed to be constructed as they are more accessible for
maintenance purposes and safer than deeper rectangular channels. A minimum freeboard for

23 May 2018 94 12949
ZITHOLELE CONSULTING
lined channels is taken as 100mm and for unlined channels it is about one third of the designed
water depth with a minimum depth of 150mm.
Due to the increase in impervious catchment areas, the clean water catchments accumulated
to a peak runoff of 5.66 m³/s at post-development stage compared to 4.25 m³/s at pre-
development stage. The dirty water catchment accumulated to a peak runoff of 0.67 m³/s at
post-development stage compared to 0.13 m³/s at pre-development stage.
Dirty water will first be collected and discharged through a trapezoidal channel which will then
transfer water underground into a pipe system. It will be a concrete pipe system of 600mm
diameter pipes with minimum 700mm cover. The pipes will discharge into the proposed PCD
system, which will consist of a primary pollution control dam located to the northeast of the rail
yard, while a secondary pollution control dam will be constructed to the north of the rail yard
to provide additional dirty water storage capacity (Figure 6-27). When required, dirty water
will be pumped to the secondary PCD.
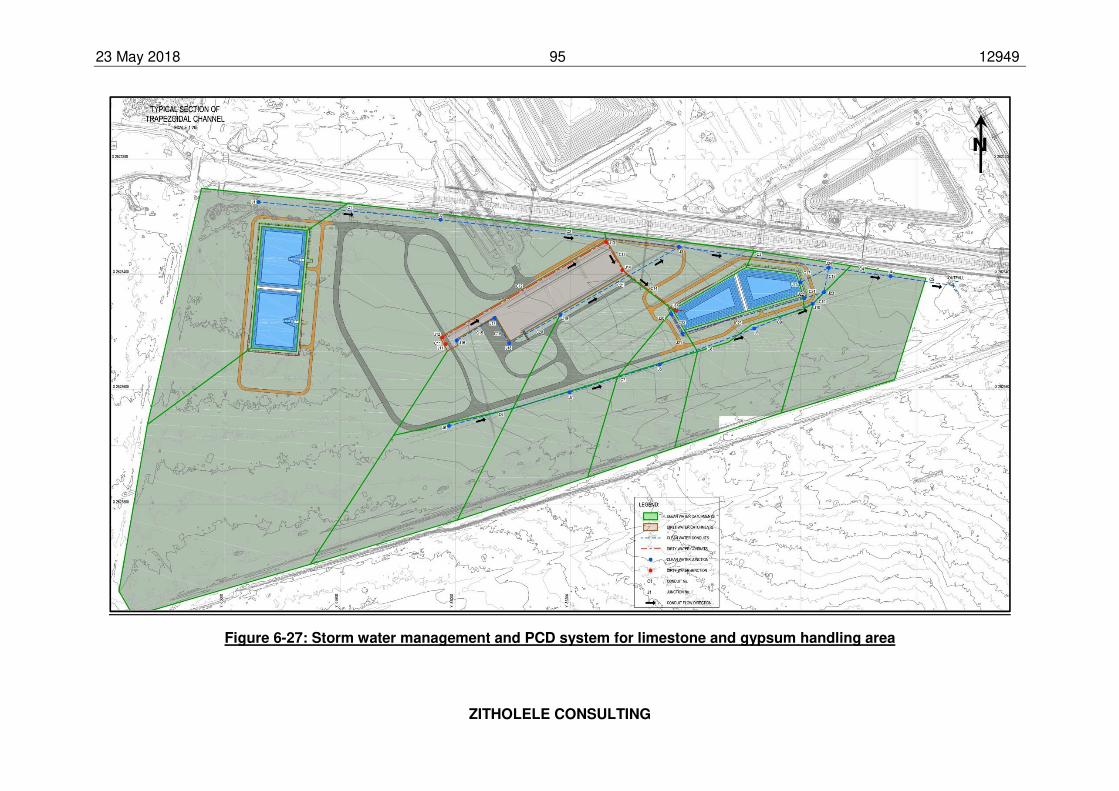
23 May 2018 95 12949
ZITHOLELE CONSULTING
Figure 6-27: Storm water management and PCD system for limestone and gypsum handling area
N
23 May 2018 96 12949
ZITHOLELE CONSULTING
In the event of an emergency spill, spilled water will be conveyed downstream into a channel
and subsequently to the existing storm water channel stretching from west to east. The
trapezoidal spillway is 0.5 m high (freeboard of 100mm included) and 1.5 m long with 1:1 side
slopes that will transition into a concrete lined trapezoidal channel, 0.5 m wide x 0.5 m deep
with 1:1 side slopes.
Water Balance Model
Taking the overall storm water management system and proposed and existing storm water
infrastructure into account, the overall water balance for the operation of Medupi Power Station
including the operation of the wet FGD units is provided in Annexure E. As per the note
attached to the water balance, the following conditions were considered in finalising the water
balance:
1. Water Treatment plant is designed based on continuous operation of 6 units at 97% Boiler
Maximum Continuous Rating (BCMR)
2. Hourly requirement’s averaged based on 24 hour cycle;
3. Construction water requirements are not included
4. Rainfall values are based on annual average rainfall
5. FGD estimates are based on worst case coal scenario and 90% load factor.
6.14 Timelines for the Medupi FGD retrofit
At the time that Eskom received environmental authorisation for the Medupi Power Station in
2007, the power station design complied with the requirements stipulated by the Air Quality
Act (Act 39 of 2004).
The power station was therefore constructed in line with the approved designs. However, on
1 April 2010, after the authorisation of the Medupi Power Station, the list of activities and
associated minimum emissions standards in terms of Section 21 of the National Environmental
Management: Air Quality Act (Act 39 of 2004) came into effect. These listed activities
amended the requirements in terms of emissions standards that needed to be adhered to by
industries, including coal-fired power stations. At this stage, it was evident that technology
would be required to reduce emissions, particularly SOx, from the Medupi Power Station in the
medium term.
The Medupi Power Station was designed to accommodate a Wet FGD technology retrofit.
The Wet FGD retrofit technology aims at reducing the SO2 emissions by up to 95%, thereby
ensuring that Medupi Power Station will comply with the NEM: Air Quality Act minimum
emission standards for “new plants” by 2030. In the interim, the Medupi Power Station will
comply with the minimum emission standards for “existing plants”.
23 May 2018 97 12949
ZITHOLELE CONSULTING
7 ALTERNATIVES ASSESSMENT
7.1 Introduction
A number of alternatives types are generally associated with EIAs. In terms of the EIA
Regulations published in Government Notice R543 of 2 August 2010 in terms of Section 24
(5) of the National Environmental Management Act (Act No. 107 of 1998), the definition of
“alternatives” in relation to a proposed activity, refers to different means of meeting the general
purpose and requirements of the activity, and may include alternatives to:
• The property on which or location where it is proposed to undertake the activity;
• The type of activity to be undertaken;
• The design or layout of the activity;
• The technology to be used in the activity;
• The operational aspects of the activity; and
• The option of not implementing the activity.
Further, in terms of NEMA and the EIA Regulations, feasible and reasonable alternatives have
to be considered within the Environmental Impact Assessment, including the ‘No Go’ option.
All identified, feasible and reasonable alternatives are required to be identified in terms of
social, biophysical, economic and technical factors. Feasible and reasonable alternatives
identified are discussed in more detail below.
7.2 Location of activity
Location alternatives: FGD Infrastructure
The location for the FGD retrofit infrastructure does not have feasible alternatives. This is
because the FGD infrastructure must be fitted to the existing Power Station infrastructure.
Placement of the FGD infrastructure is constrained by space and existing infrastructure
alignments, therefore it is accepted that the proposed FGD infrastructure layout and alignment
is already the best fit and optimised placement. Therefore, no alternatives were identified or
assessed for location of the FGD technology retrofit.
Location alternatives: Railway yard infrastructure
The location of the proposed railway yard was also pre-determined during the design and
construction of the Medupi Power Station itself. The proposed yard is situated just north of
the existing Transnet Freight Rail (TFR) mainline that runs between the towns of Thabazimbi
and Lephalale. The location and placement of the railway yard was governed by the following
factors and as a result no feasible location alternatives could be identified:
• The decision to use the existing railway network to deliver limestone to the power station.
• The position and layout of the proposed FGD plant.
23 May 2018 98 12949
ZITHOLELE CONSULTING
• Available space within the existing Medupi Power Station fence boundaries.
• The availability of existing services such as potable water, fire water and storm water
drainage structures.
See Appendix D-9 for the plot plan indicating how the FGD infrastructure and proposed
railway yard are required to be fitted to the existing Power Station facilities.
7.3 Type of activity
The Medupi Power Station Atmospheric Emission License (AEL) dated 1 April 2015 requires
that SO2 emissions be reduced from 3500 mg/Nm3 at 10% O2 to less than 500 mg/Nm3 at 10%
O2. The objective of this activity is to reduce the SO2 emissions to satisfy the legislative
requirements and World Bank loan conditions. This dictates the type of activity, which must
be a sulphur dioxide reducing technology to be retrofitted to the existing power station
infrastructure. No alternatives to the type of activity have been investigated because the
objective of this project determines the activity type.
7.4 Design or layout of activity
Design and layout alternatives: FGD infrastructure
The layout of the FGD infrastructure within the MPS footprint is predetermined by the layout
of the power station. Specific infrastructure need to be fitted to the stacks of the MPS, which
influences the effective layout for the FGD infrastructure. The remaining infrastructure must
be placed where there is adequate space, and this is also determined by the power station
layout. Appendix D-10 shows the proposed layout of the FGD retrofit within the Medupi
Power Station footprint.
Design and layout alternatives: Railway yard/rail siding
The placement of the railway yard infrastructure and associated infrastructure is constrained
by the space available at the proposed location. The design and layout of the proposed railway
yard has therefore already been optimised to maximise the use of available space while
dealing with the alignment constraints of connecting to existing and already operational
infrastructure. As such no design or layout alternatives could be considered for the proposed
railway yard infrastructure and associated infrastructure.
7.5 Technology to be used
Evolution of technology options considered
The Scoping Report concluded that the selection of the wet FGD technology was undertaken
prior to this EIA and technology alternatives and is therefore the preferred SO2 reduction
technology.
23 May 2018 99 12949
ZITHOLELE CONSULTING
Although water from the MCWAP scheme has been allocated to the Medupi FGD project,
Eskom proposed to investigate further water savings, most notably the edition of Inlet Gas
Cooler Technology. The use of Inlet Gas Cooler Technology is dependent on whether it will
be feasible for implementation based on an acceptable cost-benefit analysis. The
consideration and understanding of the Inlet Gas Cooler Technology developed throughout
the project life-cycle and this process and findings are captured in the following documents
and processes.
7.5.1.1 Technology Selection Study Report (2014)
A Technology Selection Report was initially undertaken in 2014. In this report Eskom
conducted a desktop study on the flue gas cooling technology and included this as part of the
2014 Technology Selection Study Report (TSSR). The intention of the report was to conduct
due diligence on the appropriateness of the selection of Wet FGD technology for Medupi
Power Station. The report was aimed at documenting and explaining the rationale with regards
to the selection of Wet FGD for Medupi with the technology information available at the time.
As part of normal technology selection studies during feasibility and conceptual engineering,
various design alternatives are considered that will be matured during basic and detail
engineering phases. Some of the design considerations (as was the case with the cooler), do
not go into too much detail at this stage of the design as the intent is to review feasibility and
narrow the scope of focus for the subsequent engineering phases. It was on this basis that
the cooler was included as a design alternative, however the details surrounding the actual
requirements for the fitment of the gas cooler infrastructure, fit-for-purpose design and
auxiliary requirements for this technology was not considered (which is typical at this design
stage). Therefore, the 2014 TSSR does not consider:
• The heat sink that would need to be identified to dissipate the heat recovered from the flue
gas and also the costing associated with this infrastructure.
• Actual maintenance costs - an industry standard allowance for maintenance costs of
1.25% was considered as the actual costs were not known. Differentiation in maintenance
costs for the options with and without the cooler.
• Different cooler materials and variances in the cost of materials.
• Reliability of the cooler and its impact on Unplanned Capability Loss Factor (UCLF).
Information on these items was very limited at this stage, nevertheless it was decided to
incorporate provisions for a potential future installation of a flue gas cooler as part of the basic
design scope due to the potential water savings that may be realised.
While the desktop lifecycle cost analysis showed that the installation cost of the cooler could
be offset with the reduction in operating costs due to the water savings, it is important to note
that the above-mentioned items were not considered as part of the cost estimation. In other
words, the cost estimate was based on a number of assumptions that needed to be verified in
the basic engineering phase for the cooler.
23 May 2018 100 12949
ZITHOLELE CONSULTING
7.5.1.2 2015 Basic engineering and 2016 Benchmarking for the cooler:
During the basic engineering phase, Eskom considered the practicality of the inclusion of the
flue gas cooler as well as the material selection and engineering philosophies (such as
operating and maintenance). It became apparent that only a limited number of installations
exist and the performance data of these were not publicly available. Most OEMs claim
information based on performance testing, which is done very early during the life on these
assets. It is therefore prudent that longer viewpoint on these elements be taken.
Discussions between Eskom and the World Bank due to loan conditions had Eskom look at
semi-dry installations again as the technology was being employed on higher capacity units.
As a result, Eskom decided to conduct a dual purpose benchmarking exercise to answer
unknowns regarding both semi-dry installations and flue gas cooling.
Eskom therefore travelled to various power stations across Europe, USA and China to better
understand the practical implications of this technology and the findings from the exercise form
the basis of the update to the document (i.e. the 2018 TSSR). Europe and China were chosen
due to their differences in technology applications for flue gas coolers. In Europe, coolers are
applied after the particulate abatement technology and in China before the particulate
abatement. These brought various design considerations with them which needed to be
understood.
This exercise revealed significant concerns relating to the reliability, maintainability and
lifecycle cost of Flue Gas Cooler’s (FGC’s). These coolers use expensive materials i.e.
stainless steel, carbon steel or PFA (polymer material). Medupi processes coal with a high
sulphur content and high abrasive ash with no neutralisation (and associated low adsorption)
effect. There is a high risk of erosion and corrosion damage (operating under sulphur
dewpoint) to the heat exchanger tubes which results in reduction in heat exchanger efficiency
(and therefore also a reduction in the water savings achievable) and significant plant downtime
to plug damaged tubes and manually wash clogged tubes. Furthermore, the tube materials
need to be replaced every 6-10 years (at a significantly high cost). Europe has opted for more
expensive PFA materials with tube surface area that exceeds the heating elements in the
boiler in some installations. The issue with these materials is that the tubes are prone to
damage due to fly ash contamination and still prone to acid corrosion. The power stations
visited with this installation have still required lifecycle material replacements.
The power stations visited in Europe and Asia as part of the benchmarking exercise were
selected based on technology installed and accessibility to visit these plants and engage with
the plant personnel. All three power plants visited in Europe advised against the installation.
The technology (flue gas cooling) was originally developed solely for the purposes of achieving
the exhaust flue gas temperature legislated to reduce the visible plume from the chimney (in
Europe). This requirement has recently been removed from European legislation and power
plants with the flue gas cooling technology are starting to decommission the heat exchangers
due to the significant operational and maintenance burden. In China, the cooling technology
23 May 2018 101 12949
ZITHOLELE CONSULTING
was introduced to improve the operational removal efficiency of the Electrostatic Precipitators
with the added benefit of potential WFGD water savings.
The high risk of erosion and corrosion damage and coupled with the characteristics (i.e. high
abrasive ash and sulphur) of the Medupi coal coupled with the experience of the international
power plants cannot be ignored by Eskom as part of its decision making.
Furthermore, the Medupi WFGD water requirement is approximately 0.28 m3/s for all six units.
The Mokolo Crocodile West Augmentation Phase 2 is required to bring this water to the greater
Lephalale area to stimulate economic growth. The business case for MCWAP 2 includes the
infrastructure CAPEX built into the tariff and is dependent on the portion of off-take. The costs
associated with the FGC cannot be offset with water savings due to the MCWAP 2 payment
structure. Water cost savings will therefore not be realised with a FGC installation and Eskom’s
participation in MCWAP 2 is part of the broader socio-economic strategy for the area. Eskom’s
Mokolo allocation will also be released for residential use once MCWAP 2 is completed.
7.5.1.3 Technology Selection Study Report (2018)
Eskom commissioned a cost benefit analysis of the Wet FGD, Dry FGD – Circulating Fluidized
Bed (CFB) technology, and Wet FGD with flue gas cooling technology. This report was
finalised on 9 January 2018 and is included as Appendix C-1 to this FEIR.
This report was drafted taking into consideration new information which was not known during
the 2014 TSSR and therefore replaced the 2014 report with an updated version. The report
further shows Eskom’s continuous commitment to ongoing market research in this space, and
to extend this further, not only in the cooling technology but also lower water use technology
for FGD (such as semi-dry systems).
Conclusions from the TSSR 2018 are summarised in the following sections.
Wet FGD
The Wet FGD has a long history of application to fossil fuelled power plants in units of all sizes,
and remains the predominant process utilized today. It has high removal efficiency on high
sulphur coals and only requires a single absorber vessel per boiler. The gypsum created
through this process can be used in various applications, depending on its quality, and those
uses include concrete, agricultural application, and wall board manufacturing to name a few,
or be landfilled. There is, generally, a waste water stream created that will require further
processing from this process. Additionally, the amount of water used in Wet FGD is higher
than a Dry FGD-CFB technology.
A further benefit of the implementation of WFGD technology is that it has the potential to
contribute to the broader socio-economic development of Lephalale and its surrounding areas
due to WFGD flexibility of using lower quality limestones that can be sourced from areas closer
to the power station which is not the case with the DFGD systems.
23 May 2018 102 12949
ZITHOLELE CONSULTING
Water for the WFGD will be provided from Phase 2A of the Mokolo and Crocodile Water
Augmentation Project which is being developed to bring additional water to the Lephalale area
from the Crocodile River Catchment” .The development of Phase 2A therefore creates an
opportunity for economic development in the area which cannot take place without it.
The WFGD technology is the only of the FGD technologies that has the potential for reduction
in its water consumption. Eskom is a strategic water user in the country and, based on its
commitment to water conservation, it has already taken various measures to reduce the power
station’s water consumption. The implementation of dry cooling technology and the adoption
of the zero liquid effluent discharge policy (ZLED) are notably Eskom’s most significant water-
saving initiatives. Once completed Medupi will be the largest dry-cooled power plant in the
world. The implementation of dry cooling reduces the water consumption from approximately
2 l/kWh to 0.14 l/kWh. It is expected that the water use with WFGD (power plant with WFGD≈
0.35 l/kWh) will still be lower when compared to the conventional wet-cooled power plants
(power plant without WFGD≈ 2 l/kWh), excluding water for FGD, within Eskom’s fleet.
Dry FGD-CFB
The Dry FGD-CFB has been used extensively around the world and mixes lime, water, and
fly ash-laden flue gas in a reactor to remove the sulphur dioxides from the boiler flue gas
stream. There is no waste water stream created by this process, however the fly ash
generated in the process will require disposal to landfill. This process works best with low to
medium sulphur coals and has a current reactor size maximum of 450 MW, so two reactors
would be required for each boiler for Medupi Power Station.
The cost-benefit analysis concluded that DFGD technology resulted in a 9% higher capital
cost for implementation due to modifications required for existing ductwork design and the
addition of a new fabric filter system to the existing Fabric Filter Plant (FFP) in order to retrofit
this technology. Although the DFGD processes use slightly less water for the Medupi site, the
estimated operating expense for the DFGD is 53% higher than the WFGD system, mostly due
to the significantly higher cost of the lime reagent. The use of DFGD is therefore not
economically feasible.
Wet FGD with Flue Gas Cooling Technology
The implementation of WFGD with flue gas cooling has the potential to reduce the water
consumption associated with WFGD, however the practical challenges cannot be ignored as
this is expected to have a significant impact on the maintainability and availability of the power
plant and the cost of electricity to the consumer.
When installation of a flue gas cooler before the articulate abatement plant was considered it
was concluded such an installation was not possible due to the ash characteristics. The ash
characteristics at Medupi are highly abrasive, which will erode the finned tube material easily
if the velocity is not kept sufficiently low enough. The velocity reduction in a high ash
environment although good for wear protection, will incur both dust fall-out and plugging
problems. It is therefore not advisable to install a flue gas cooler before the FFP at Medupi.
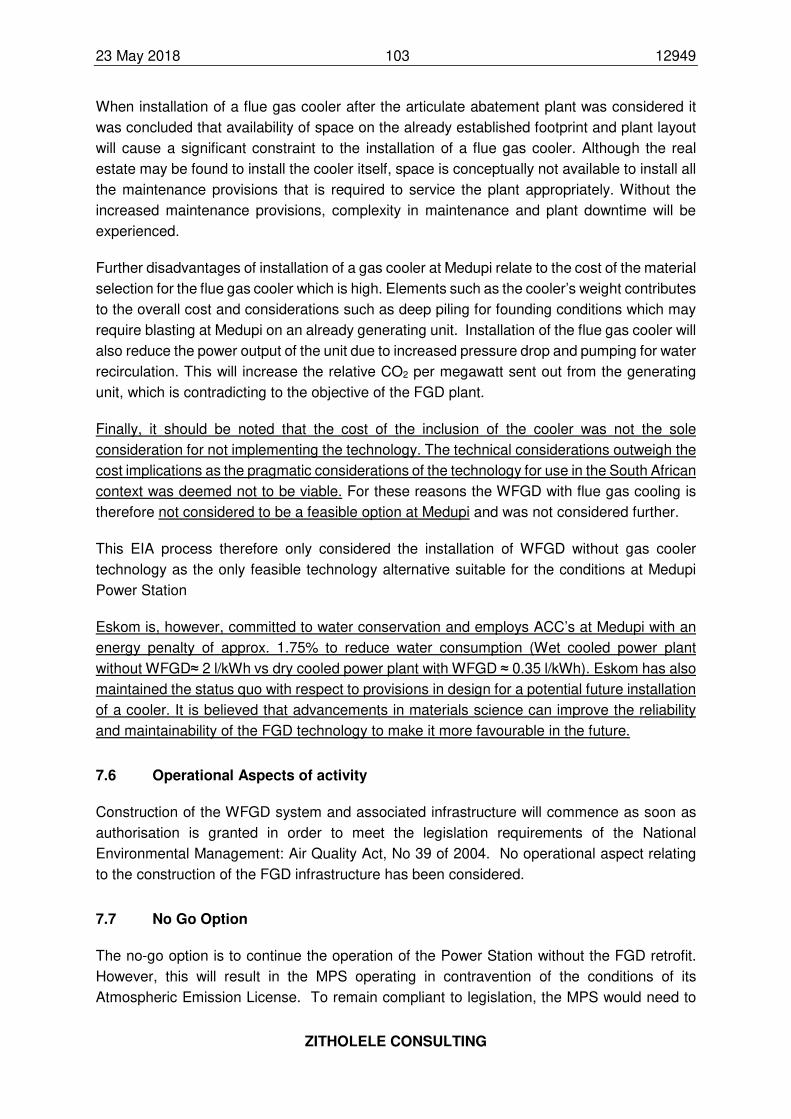
23 May 2018 103 12949
ZITHOLELE CONSULTING
When installation of a flue gas cooler after the articulate abatement plant was considered it
was concluded that availability of space on the already established footprint and plant layout
will cause a significant constraint to the installation of a flue gas cooler. Although the real
estate may be found to install the cooler itself, space is conceptually not available to install all
the maintenance provisions that is required to service the plant appropriately. Without the
increased maintenance provisions, complexity in maintenance and plant downtime will be
experienced.
Further disadvantages of installation of a gas cooler at Medupi relate to the cost of the material
selection for the flue gas cooler which is high. Elements such as the cooler’s weight contributes
to the overall cost and considerations such as deep piling for founding conditions which may
require blasting at Medupi on an already generating unit. Installation of the flue gas cooler will
also reduce the power output of the unit due to increased pressure drop and pumping for water
recirculation. This will increase the relative CO2 per megawatt sent out from the generating
unit, which is contradicting to the objective of the FGD plant.
Finally, it should be noted that the cost of the inclusion of the cooler was not the sole
consideration for not implementing the technology. The technical considerations outweigh the
cost implications as the pragmatic considerations of the technology for use in the South African
context was deemed not to be viable. For these reasons the WFGD with flue gas cooling is
therefore not considered to be a feasible option at Medupi and was not considered further.
This EIA process therefore only considered the installation of WFGD without gas cooler
technology as the only feasible technology alternative suitable for the conditions at Medupi
Power Station
Eskom is, however, committed to water conservation and employs ACC’s at Medupi with an
energy penalty of approx. 1.75% to reduce water consumption (Wet cooled power plant
without WFGD≈ 2 l/kWh vs dry cooled power plant with WFGD ≈ 0.35 l/kWh). Eskom has also
maintained the status quo with respect to provisions in design for a potential future installation
of a cooler. It is believed that advancements in materials science can improve the reliability
and maintainability of the FGD technology to make it more favourable in the future.
7.6 Operational Aspects of activity
Construction of the WFGD system and associated infrastructure will commence as soon as
authorisation is granted in order to meet the legislation requirements of the National
Environmental Management: Air Quality Act, No 39 of 2004. No operational aspect relating
to the construction of the FGD infrastructure has been considered.
7.7 No Go Option
The no-go option is to continue the operation of the Power Station without the FGD retrofit.
However, this will result in the MPS operating in contravention of the conditions of its
Atmospheric Emission License. To remain compliant to legislation, the MPS would need to

23 May 2018 104 12949
ZITHOLELE CONSULTING
shut down operation. This would have a catastrophic impact on the South African economy
and the stability of electricity supply to southern Africa. It can therefore be considered that the
No-Go Option is fatally flawed for these reasons.
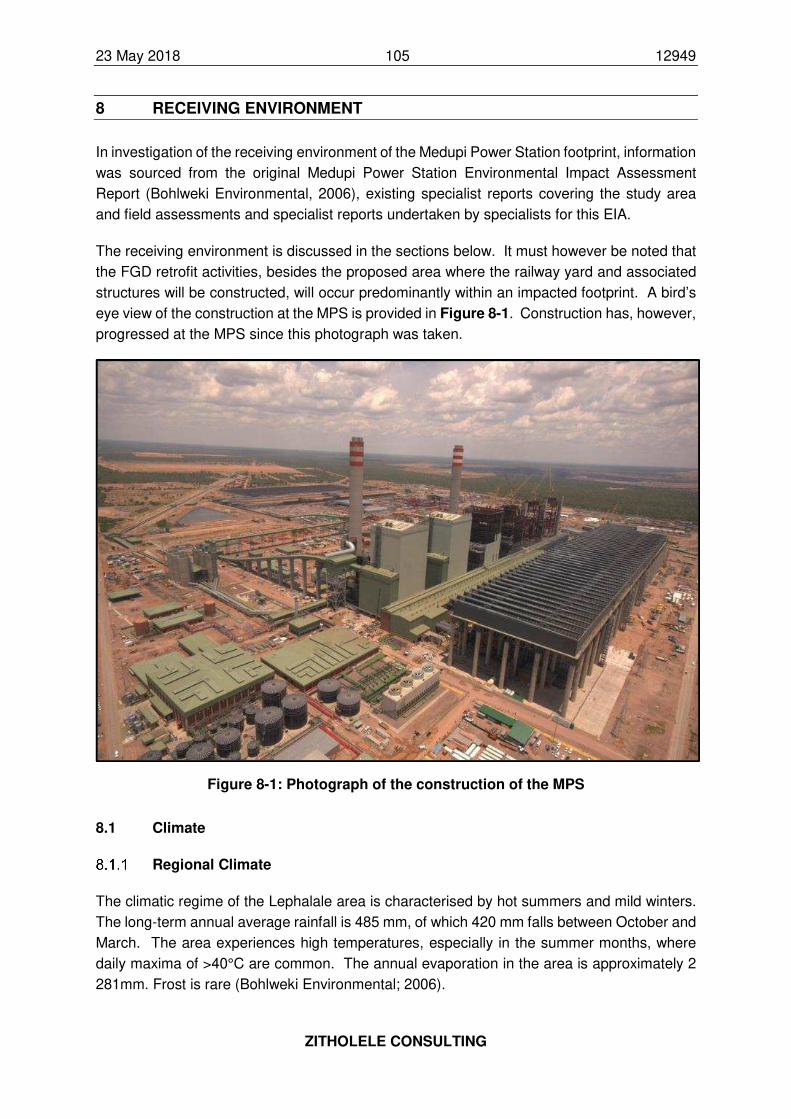
23 May 2018 105 12949
ZITHOLELE CONSULTING
8 RECEIVING ENVIRONMENT
In investigation of the receiving environment of the Medupi Power Station footprint, information
was sourced from the original Medupi Power Station Environmental Impact Assessment
Report (Bohlweki Environmental, 2006), existing specialist reports covering the study area
and field assessments and specialist reports undertaken by specialists for this EIA.
The receiving environment is discussed in the sections below. It must however be noted that
the FGD retrofit activities, besides the proposed area where the railway yard and associated
structures will be constructed, will occur predominantly within an impacted footprint. A bird’s
eye view of the construction at the MPS is provided in Figure 8-1. Construction has, however,
progressed at the MPS since this photograph was taken.
Figure 8-1: Photograph of the construction of the MPS
8.1 Climate
Regional Climate
The climatic regime of the Lephalale area is characterised by hot summers and mild winters.
The long-term annual average rainfall is 485 mm, of which 420 mm falls between October and
March. The area experiences high temperatures, especially in the summer months, where
daily maxima of >40°C are common. The annual evaporation in the area is approximately 2
281mm. Frost is rare (Bohlweki Environmental; 2006).
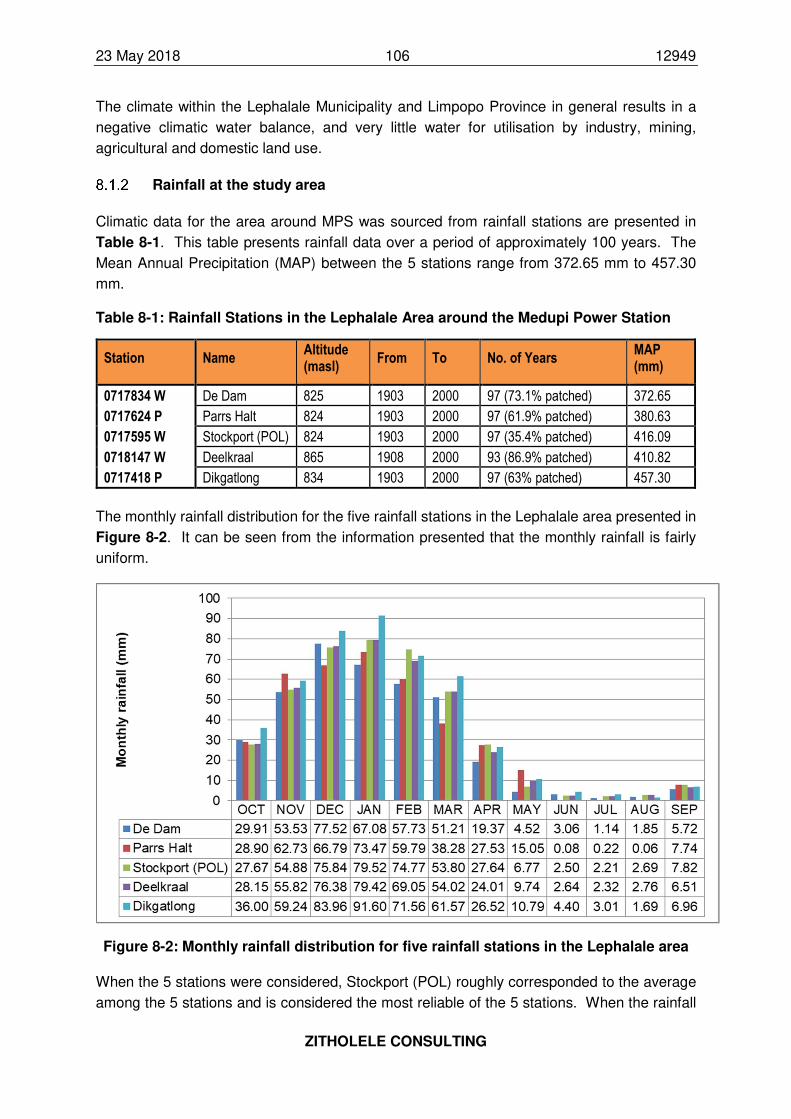
23 May 2018 106 12949
ZITHOLELE CONSULTING
The climate within the Lephalale Municipality and Limpopo Province in general results in a
negative climatic water balance, and very little water for utilisation by industry, mining,
agricultural and domestic land use.
Rainfall at the study area
Climatic data for the area around MPS was sourced from rainfall stations are presented in
Table 8-1. This table presents rainfall data over a period of approximately 100 years. The
Mean Annual Precipitation (MAP) between the 5 stations range from 372.65 mm to 457.30
mm.
Table 8-1: Rainfall Stations in the Lephalale Area around the Medupi Power Station
Station Name Altitude (masl)
From To No. of Years MAP (mm)
0717834 W De Dam 825 1903 2000 97 (73.1% patched) 372.65
0717624 P Parrs Halt 824 1903 2000 97 (61.9% patched) 380.63
0717595 W Stockport (POL) 824 1903 2000 97 (35.4% patched) 416.09
0718147 W Deelkraal 865 1908 2000 93 (86.9% patched) 410.82
0717418 P Dikgatlong 834 1903 2000 97 (63% patched) 457.30
The monthly rainfall distribution for the five rainfall stations in the Lephalale area presented in
Figure 8-2. It can be seen from the information presented that the monthly rainfall is fairly
uniform.
Figure 8-2: Monthly rainfall distribution for five rainfall stations in the Lephalale area
When the 5 stations were considered, Stockport (POL) roughly corresponded to the average
among the 5 stations and is considered the most reliable of the 5 stations. When the rainfall
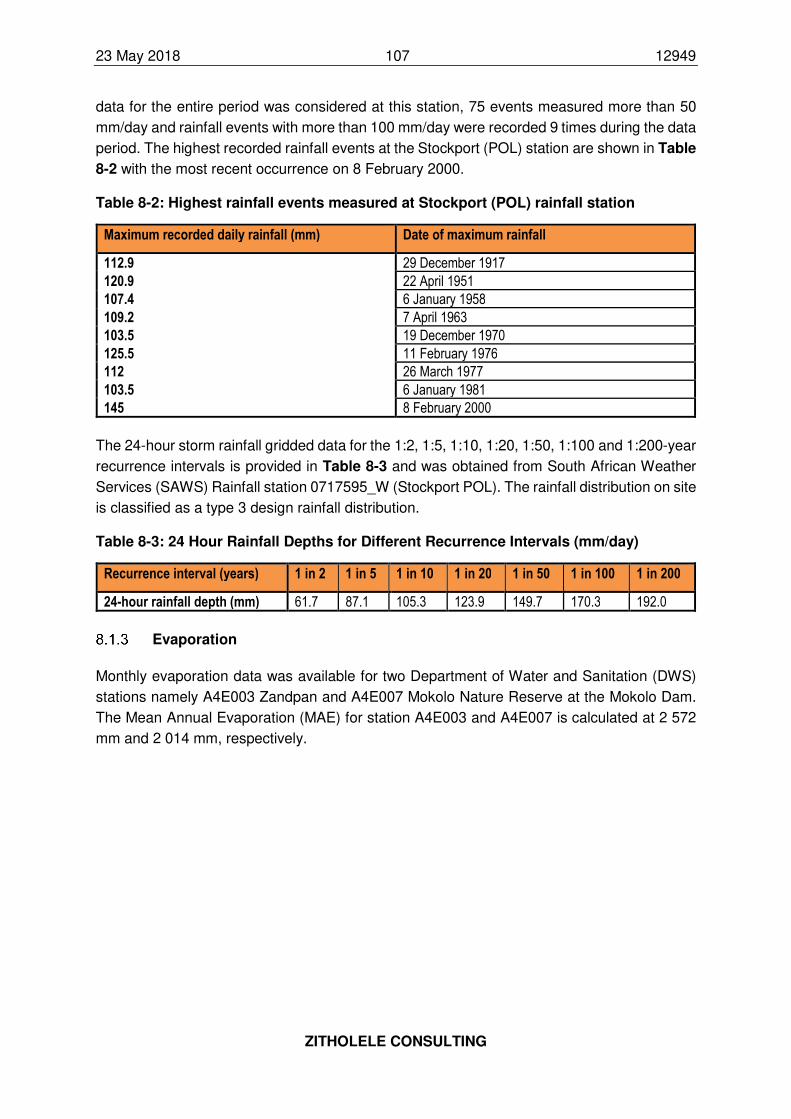
23 May 2018 107 12949
ZITHOLELE CONSULTING
data for the entire period was considered at this station, 75 events measured more than 50
mm/day and rainfall events with more than 100 mm/day were recorded 9 times during the data
period. The highest recorded rainfall events at the Stockport (POL) station are shown in Table
8-2 with the most recent occurrence on 8 February 2000.
Table 8-2: Highest rainfall events measured at Stockport (POL) rainfall station
Maximum recorded daily rainfall (mm) Date of maximum rainfall
112.9 29 December 1917
120.9 22 April 1951
107.4 6 January 1958
109.2 7 April 1963
103.5 19 December 1970
125.5 11 February 1976
112 26 March 1977
103.5 6 January 1981
145 8 February 2000
The 24-hour storm rainfall gridded data for the 1:2, 1:5, 1:10, 1:20, 1:50, 1:100 and 1:200-year
recurrence intervals is provided in Table 8-3 and was obtained from South African Weather
Services (SAWS) Rainfall station 0717595_W (Stockport POL). The rainfall distribution on site
is classified as a type 3 design rainfall distribution.
Table 8-3: 24 Hour Rainfall Depths for Different Recurrence Intervals (mm/day)
Recurrence interval (years) 1 in 2 1 in 5 1 in 10 1 in 20 1 in 50 1 in 100 1 in 200
24-hour rainfall depth (mm) 61.7 87.1 105.3 123.9 149.7 170.3 192.0
Evaporation
Monthly evaporation data was available for two Department of Water and Sanitation (DWS)
stations namely A4E003 Zandpan and A4E007 Mokolo Nature Reserve at the Mokolo Dam.
The Mean Annual Evaporation (MAE) for station A4E003 and A4E007 is calculated at 2 572
mm and 2 014 mm, respectively.
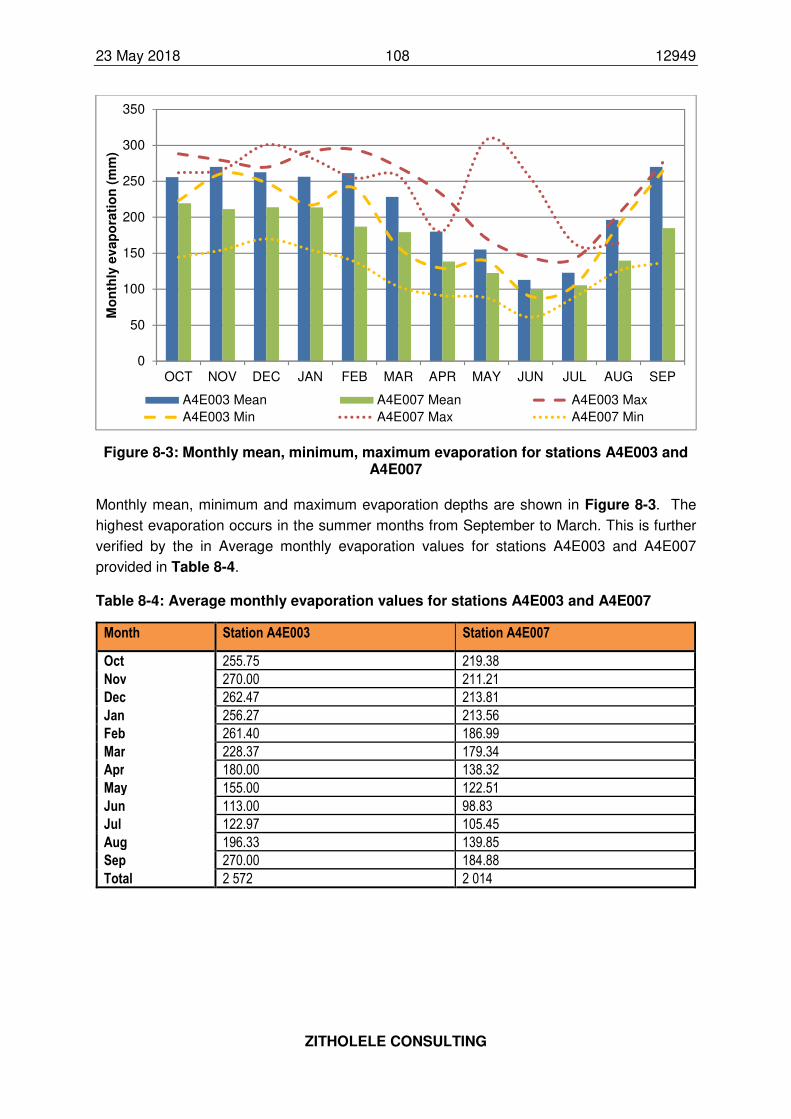
23 May 2018 108 12949
ZITHOLELE CONSULTING
Figure 8-3: Monthly mean, minimum, maximum evaporation for stations A4E003 and A4E007
Monthly mean, minimum and maximum evaporation depths are shown in Figure 8-3. The
highest evaporation occurs in the summer months from September to March. This is further
verified by the in Average monthly evaporation values for stations A4E003 and A4E007
provided in Table 8-4.
Table 8-4: Average monthly evaporation values for stations A4E003 and A4E007
Month Station A4E003 Station A4E007
Oct 255.75 219.38
Nov 270.00 211.21
Dec 262.47 213.81
Jan 256.27 213.56
Feb 261.40 186.99
Mar 228.37 179.34
Apr 180.00 138.32
May 155.00 122.51
Jun 113.00 98.83
Jul 122.97 105.45
Aug 196.33 139.85
Sep 270.00 184.88
Total 2 572 2 014
0
50
100
150
200
250
300
350
OCT NOV DEC JAN FEB MAR APR MAY JUN JUL AUG SEP
Mo
nth
ly e
vap
ora
tio
n (
mm
)
A4E003 Mean A4E007 Mean A4E003 Max
A4E003 Min A4E007 Max A4E007 Min
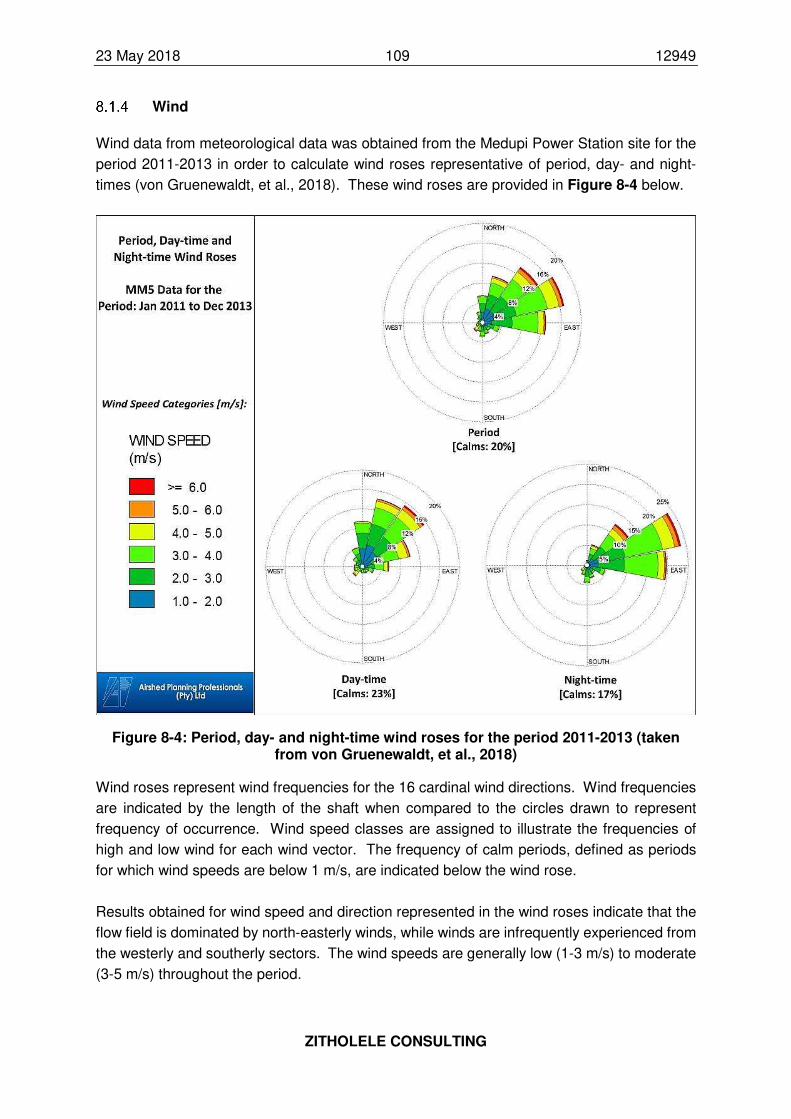
23 May 2018 109 12949
ZITHOLELE CONSULTING
Wind
Wind data from meteorological data was obtained from the Medupi Power Station site for the
period 2011-2013 in order to calculate wind roses representative of period, day- and night-
times (von Gruenewaldt, et al., 2018). These wind roses are provided in Figure 8-4 below.
Figure 8-4: Period, day- and night-time wind roses for the period 2011-2013 (taken from von Gruenewaldt, et al., 2018)
Wind roses represent wind frequencies for the 16 cardinal wind directions. Wind frequencies
are indicated by the length of the shaft when compared to the circles drawn to represent
frequency of occurrence. Wind speed classes are assigned to illustrate the frequencies of
high and low wind for each wind vector. The frequency of calm periods, defined as periods
for which wind speeds are below 1 m/s, are indicated below the wind rose.
Results obtained for wind speed and direction represented in the wind roses indicate that the
flow field is dominated by north-easterly winds, while winds are infrequently experienced from
the westerly and southerly sectors. The wind speeds are generally low (1-3 m/s) to moderate
(3-5 m/s) throughout the period.
23 May 2018 110 12949
ZITHOLELE CONSULTING
8.2 Geology
Information relating to the geology within the proposed study area were obtained from the
Soils and Land Capability Specialist Study (Appendix G-2) undertaken by Earth Science
Solutions (Jones, 2018), as well as the Geotechnical Assessment (Appendix G-1) undertaken
by Golder associated Africa (Owens-Collins, 2018), and Groundwater Impact Assessment
Study (Appendix G-3) also undertaken by Golder Associated Africa (Brink & van der Linde,
2018), including literature sited within these reports. These specialist study reports are
included in Appendix G to this FEIR.
Regional Geology
The geological description below is taken directly from the specialist geology assessment as
discussed in Sections 8 of the Scoping Report (Bohlweki, 2005) and the EIA Report (Bohlweki;
2006).
The Waterberg Coalfield comprises a graben structure with the Eenzaamheid fault forming
the southern boundary and the northern boundary being delineated by the Zoetfontein fault.
Archaean granite rocks outcrop to the north of the Zoetfontein fault and sediments of the
Waterberg Group outcrop to the south of the Eenzaamheid fault.
The study area is further subdivided by the Daarby fault, a major northeast, then northwest,
trending fault. The Daarby fault has a down throw of 360m to the north, at an angle of 50° to
60°. The down throw of 360 m to the north serves to bring the Grootegeluk Formation rocks
to the south in contact with the younger Clarens Formation sandstone and Letaba Formation
basalts in the north. Thus, the fault divides the coalfield into a shallow (opencast) coal area
to the south of the Daarby Fault, and a deep north coal area.
The Eenzaamheid fault has a throw of 250 m to the north and the fault is near vertical. The
fault brings the upthrown Waterberg Group sediments on the south side of the fault in contact
with shallow coal on the northern side of the fault.
Since the groundwater in the area has potential for enhancement, it is important that any
activities that have the potential to impact on groundwater should be located away from the
fault lines as described above.
Figure 8-5 provides an overview of the underlying geology of the receiving environment and
has been obtained from the Hydrogeology Impact Assessment Report (Brink & van der Linde,
2018).
Geology within the study area
The local geology of the area can be subdivided into a northern and southern type. The
Matimba Power station and all its facilities, except for the ash disposal facility, as well as
Grootegeluk Mine, lies on Karoo sediments. The existing licensed disposal facility, Medupi
Power Station and the Matimba ash dump lie on Waterberg sandstone, just south of the
Eenzaamheid fault (Figure 8-6).
23 May 2018 111 12949
ZITHOLELE CONSULTING
The area is classified as having a climatic N-value of almost 5, which indicates that both
chemical weathering and mechanical weathering are likely. From the description of the
geology of the area it can be expected that residual soils are generally shallow and transported
soils vary greatly in thickness.
Ground conditions within the Medupi Power Station footprint were considered based on
groundwater borehole results and include:
• The study site is underlain by a sequence of pebbles, weathered quartzitic conglomerate
with fresh variously fractured quartzitic conglomerate at depth.
• The conglomerate is interbedded with bluish grey siltstone (bands). The drilling has shown
the siltstone forms discontinuous layers of up to 50cm thick but mostly about 20cm thick.
• Generally surface weathering to shallow depth (<5m) occurs. In some boreholes a second
fractured and associated weathered zone is observed and is normally found between 7 -
14m.
• Some boreholes showed no surface weathering.
• Boreholes in the extreme north or west, show the presence of deep weathering, up to 21m.
• Water strikes were made in 14 of the 35 boreholes at depths between 6 and 10.5m below
surface.
The groundwater specialist considered Information relating to the railway yard and limestone
and gypsum handling facilities based on information contained in an existing geotechnical
study undertaken for the railway yard development and offloading facilities (Rockland
Geoscience, 2015). This study reported at test pits closest to the proposed railway yard area
medium dense silty sand to between 1.1m and 1.8m, underlain by dense gravel to between
1.5m and 2.4m, underlain by very soft rock quartzite, with TLB refusal at 1.8m on medium
hard rock quartzite, and refusal on hardpan ferricrete at 2.4m.
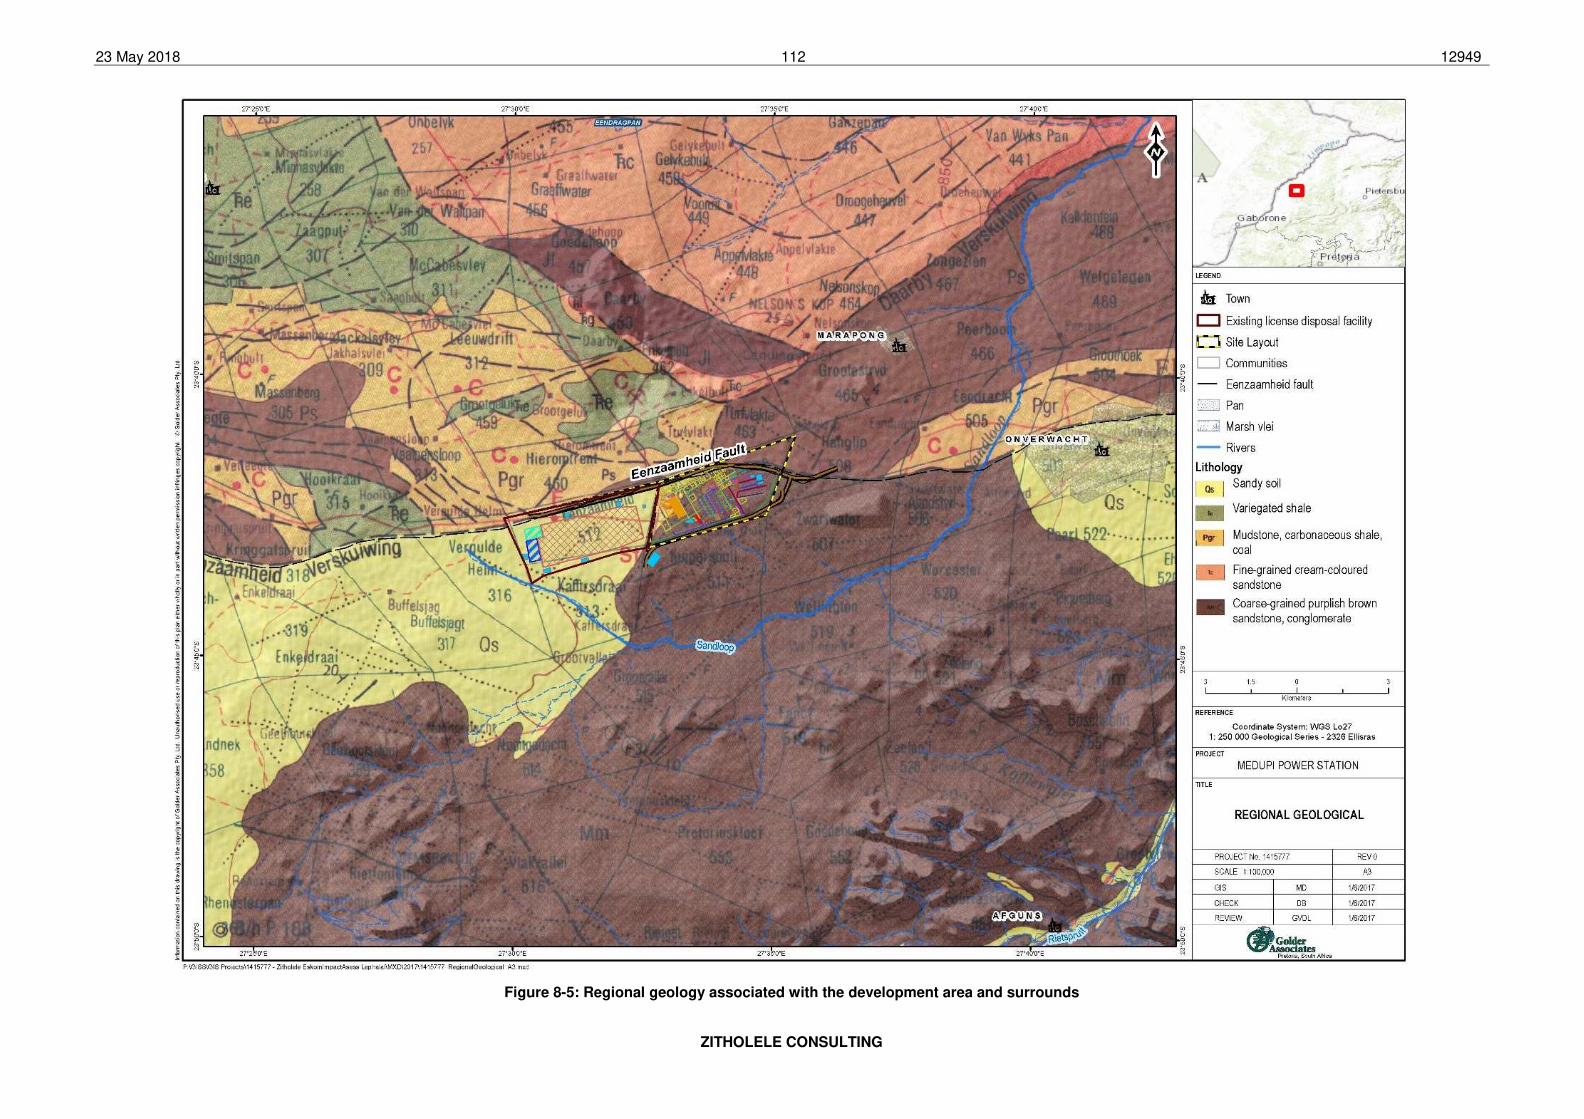
23 May 2018 112 12949
ZITHOLELE CONSULTING
Figure 8-5: Regional geology associated with the development area and surrounds
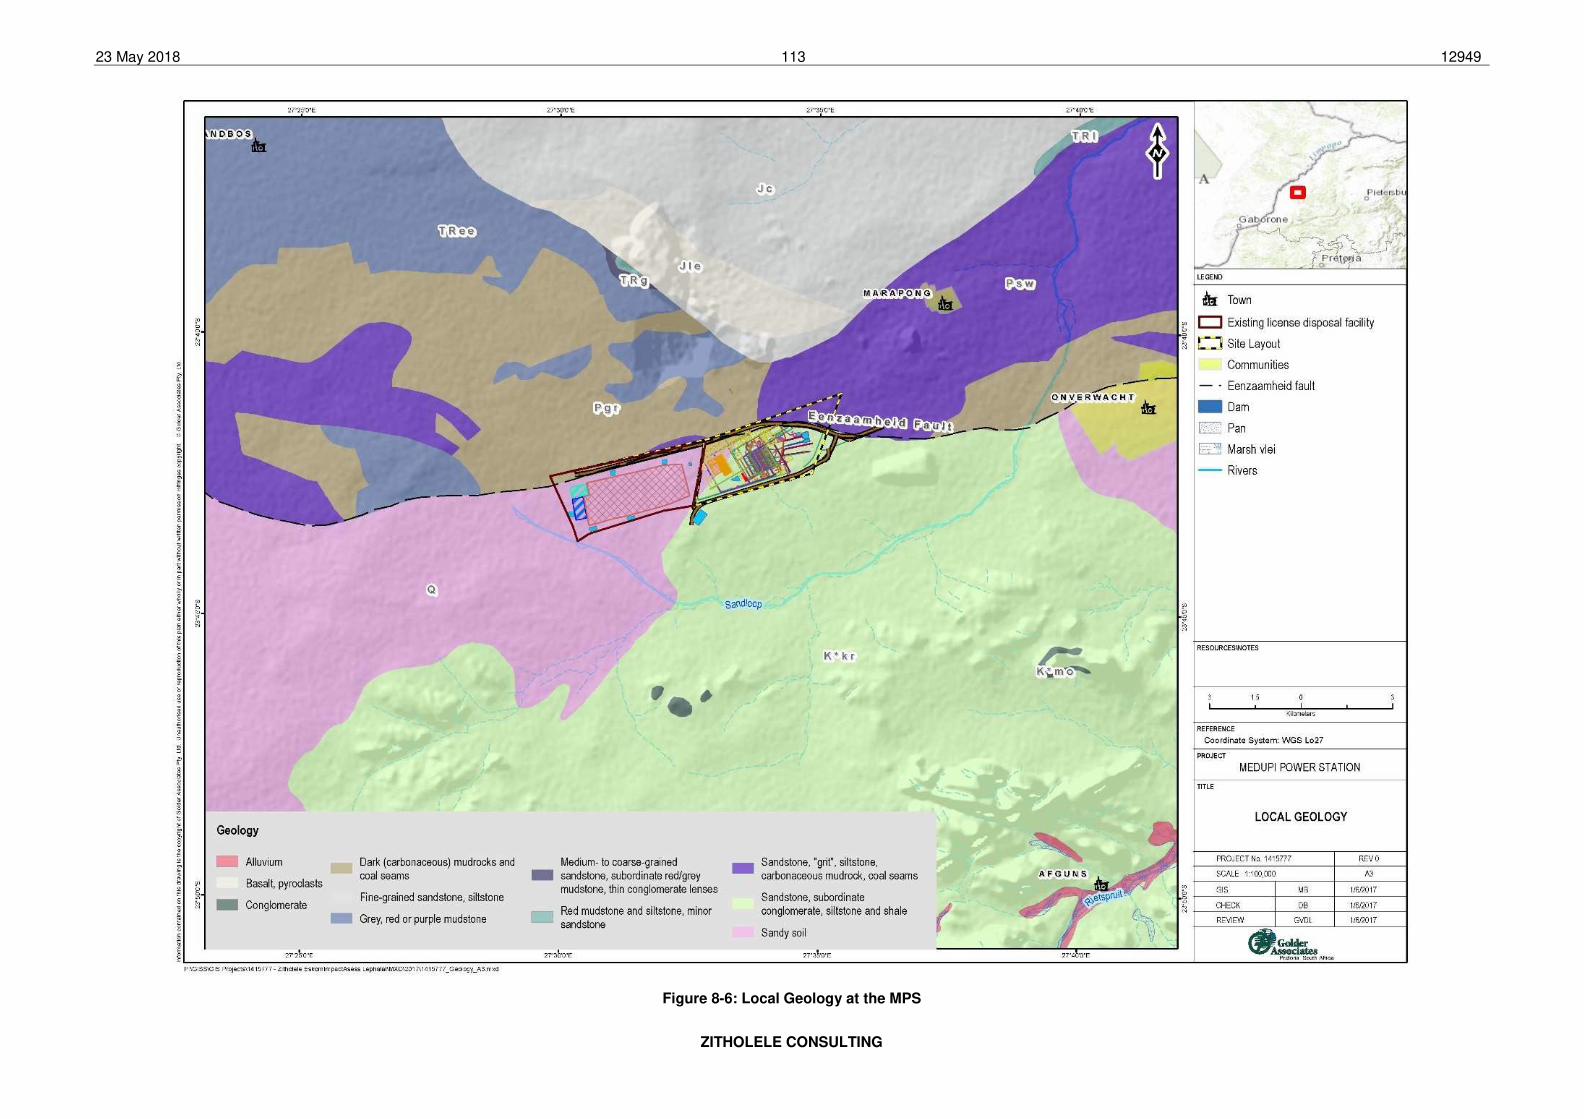
23 May 2018 113 12949
ZITHOLELE CONSULTING
Figure 8-6: Local Geology at the MPS
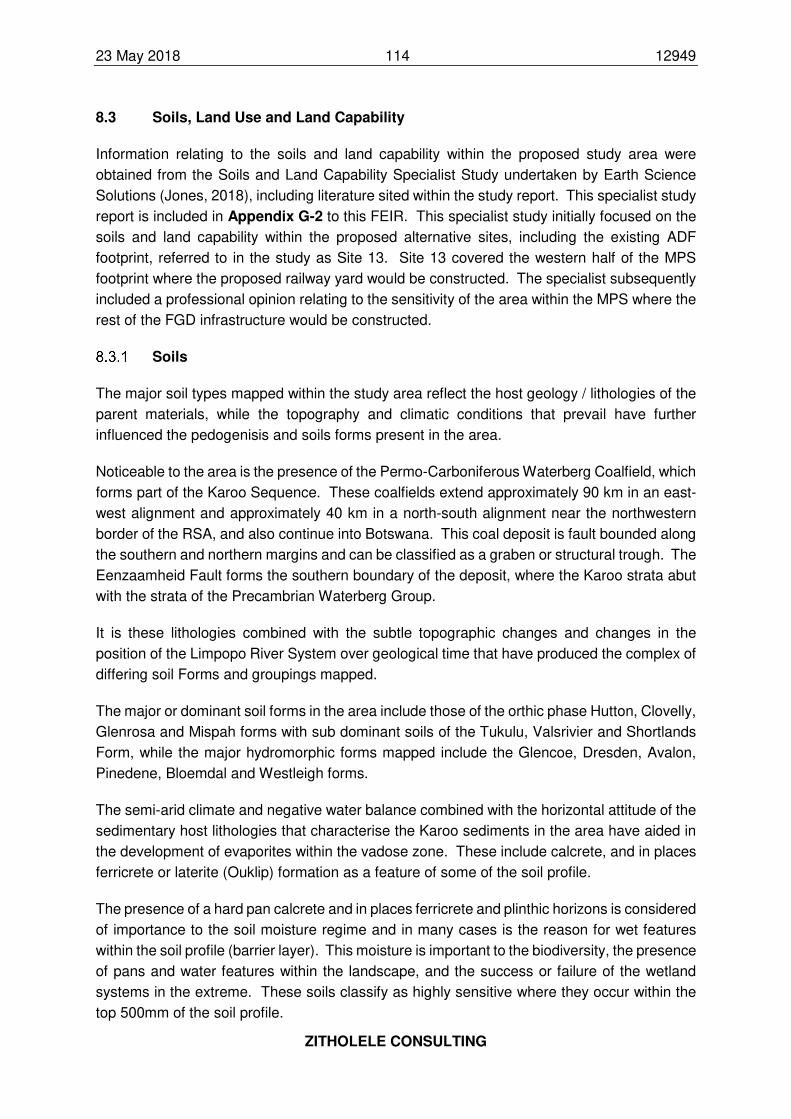
23 May 2018 114 12949
ZITHOLELE CONSULTING
8.3 Soils, Land Use and Land Capability
Information relating to the soils and land capability within the proposed study area were
obtained from the Soils and Land Capability Specialist Study undertaken by Earth Science
Solutions (Jones, 2018), including literature sited within the study report. This specialist study
report is included in Appendix G-2 to this FEIR. This specialist study initially focused on the
soils and land capability within the proposed alternative sites, including the existing ADF
footprint, referred to in the study as Site 13. Site 13 covered the western half of the MPS
footprint where the proposed railway yard would be constructed. The specialist subsequently
included a professional opinion relating to the sensitivity of the area within the MPS where the
rest of the FGD infrastructure would be constructed.
Soils
The major soil types mapped within the study area reflect the host geology / lithologies of the
parent materials, while the topography and climatic conditions that prevail have further
influenced the pedogenisis and soils forms present in the area.
Noticeable to the area is the presence of the Permo-Carboniferous Waterberg Coalfield, which
forms part of the Karoo Sequence. These coalfields extend approximately 90 km in an east-
west alignment and approximately 40 km in a north-south alignment near the northwestern
border of the RSA, and also continue into Botswana. This coal deposit is fault bounded along
the southern and northern margins and can be classified as a graben or structural trough. The
Eenzaamheid Fault forms the southern boundary of the deposit, where the Karoo strata abut
with the strata of the Precambrian Waterberg Group.
It is these lithologies combined with the subtle topographic changes and changes in the
position of the Limpopo River System over geological time that have produced the complex of
differing soil Forms and groupings mapped.
The major or dominant soil forms in the area include those of the orthic phase Hutton, Clovelly,
Glenrosa and Mispah forms with sub dominant soils of the Tukulu, Valsrivier and Shortlands
Form, while the major hydromorphic forms mapped include the Glencoe, Dresden, Avalon,
Pinedene, Bloemdal and Westleigh forms.
The semi-arid climate and negative water balance combined with the horizontal attitude of the
sedimentary host lithologies that characterise the Karoo sediments in the area have aided in
the development of evaporites within the vadose zone. These include calcrete, and in places
ferricrete or laterite (Ouklip) formation as a feature of some of the soil profile.
The presence of a hard pan calcrete and in places ferricrete and plinthic horizons is considered
of importance to the soil moisture regime and in many cases is the reason for wet features
within the soil profile (barrier layer). This moisture is important to the biodiversity, the presence
of pans and water features within the landscape, and the success or failure of the wetland
systems in the extreme. These soils classify as highly sensitive where they occur within the
top 500mm of the soil profile.
23 May 2018 115 12949
ZITHOLELE CONSULTING
In addition to the geomorphological aspects mentioned above, soil texture and structure also
played a role in the soil classification and the resultant sensitivity of the materials mapped.
The fine to medium grained nature of the top soils, the relatively low clay contents (<12%) and
the generally low organic carbon renders the majority of the top soils highly sensitive to
erosion. This is only tempered by the relative flatness of the topography for all but a few areas,
with a resultant moderate to low erosion index for most of the site if not well protected. Once
the cover is disturbed or removed, the potential for erosion is increased.
The study area generally contains moderate to deep soils (Figure 8-7) and comprise for the
most part fine to medium grained sandy topsoils on lithocutanic subsoil (Glenrosa) or sandy
loams on a hard rock base (Mispah). Area of wet based (hydromorphic) soils within the study
area.
Figure 8-7: Dominant soils in the study area (excerpt from soils specialist study)
Study area
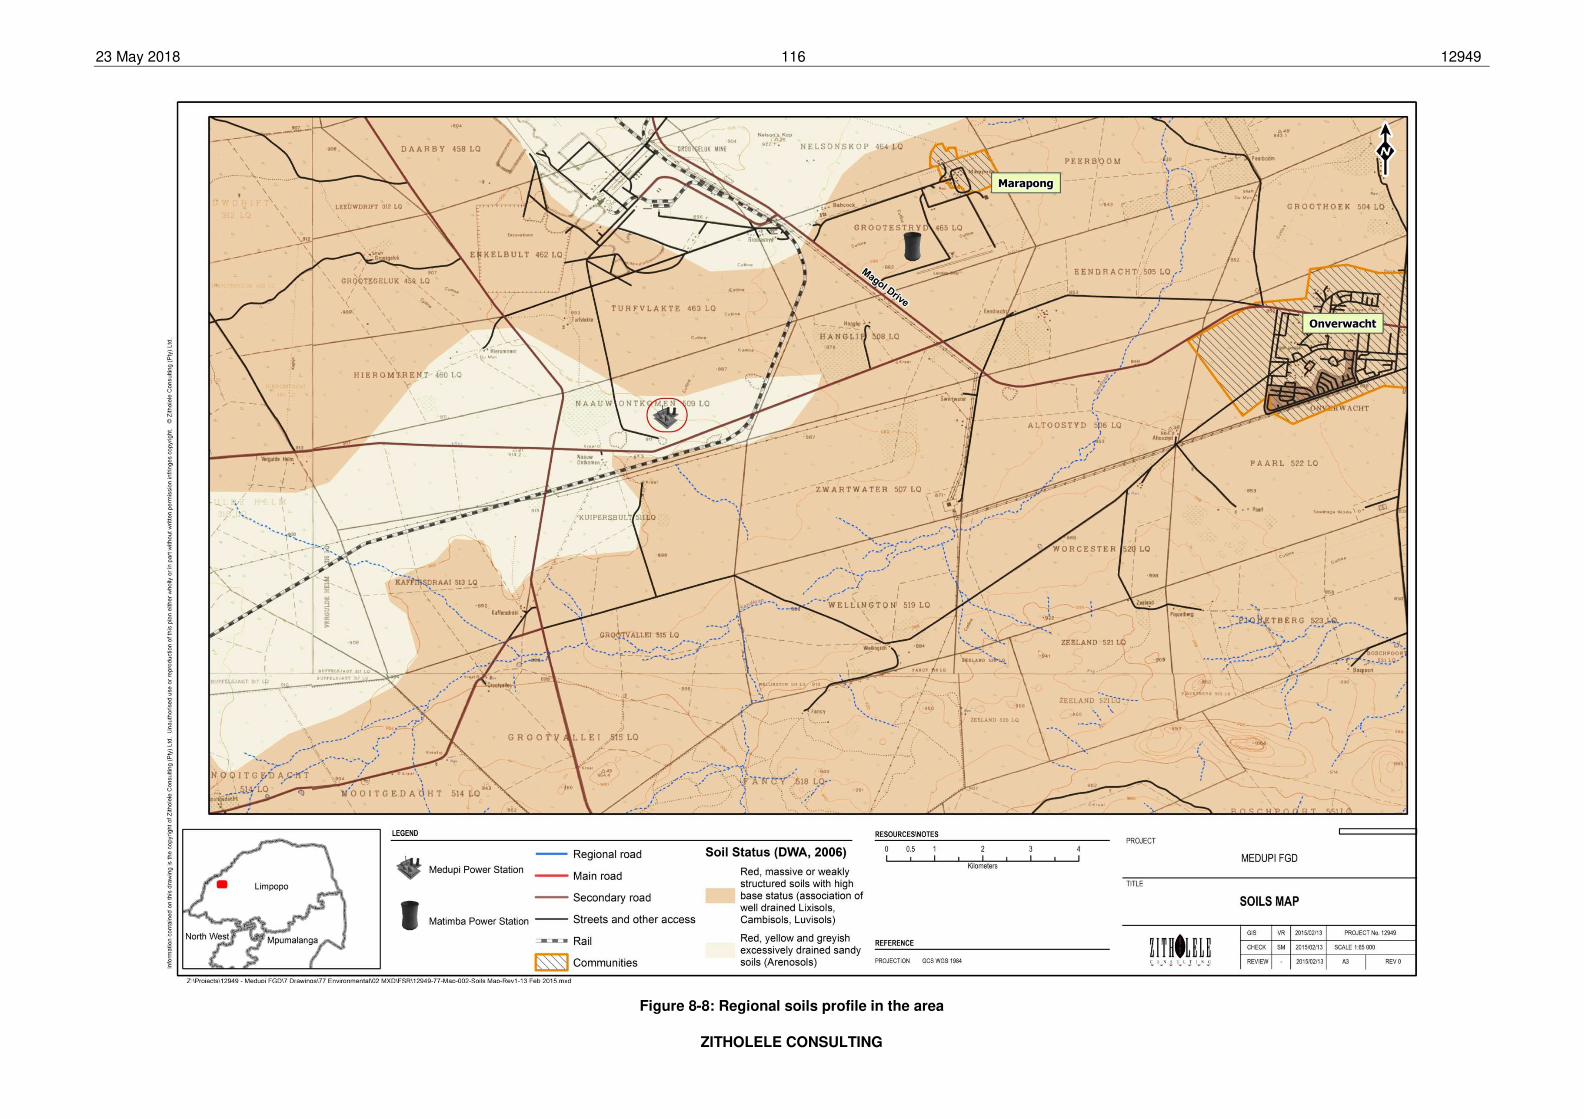
23 May 2018 116 12949
ZITHOLELE CONSULTING
Figure 8-8: Regional soils profile in the area
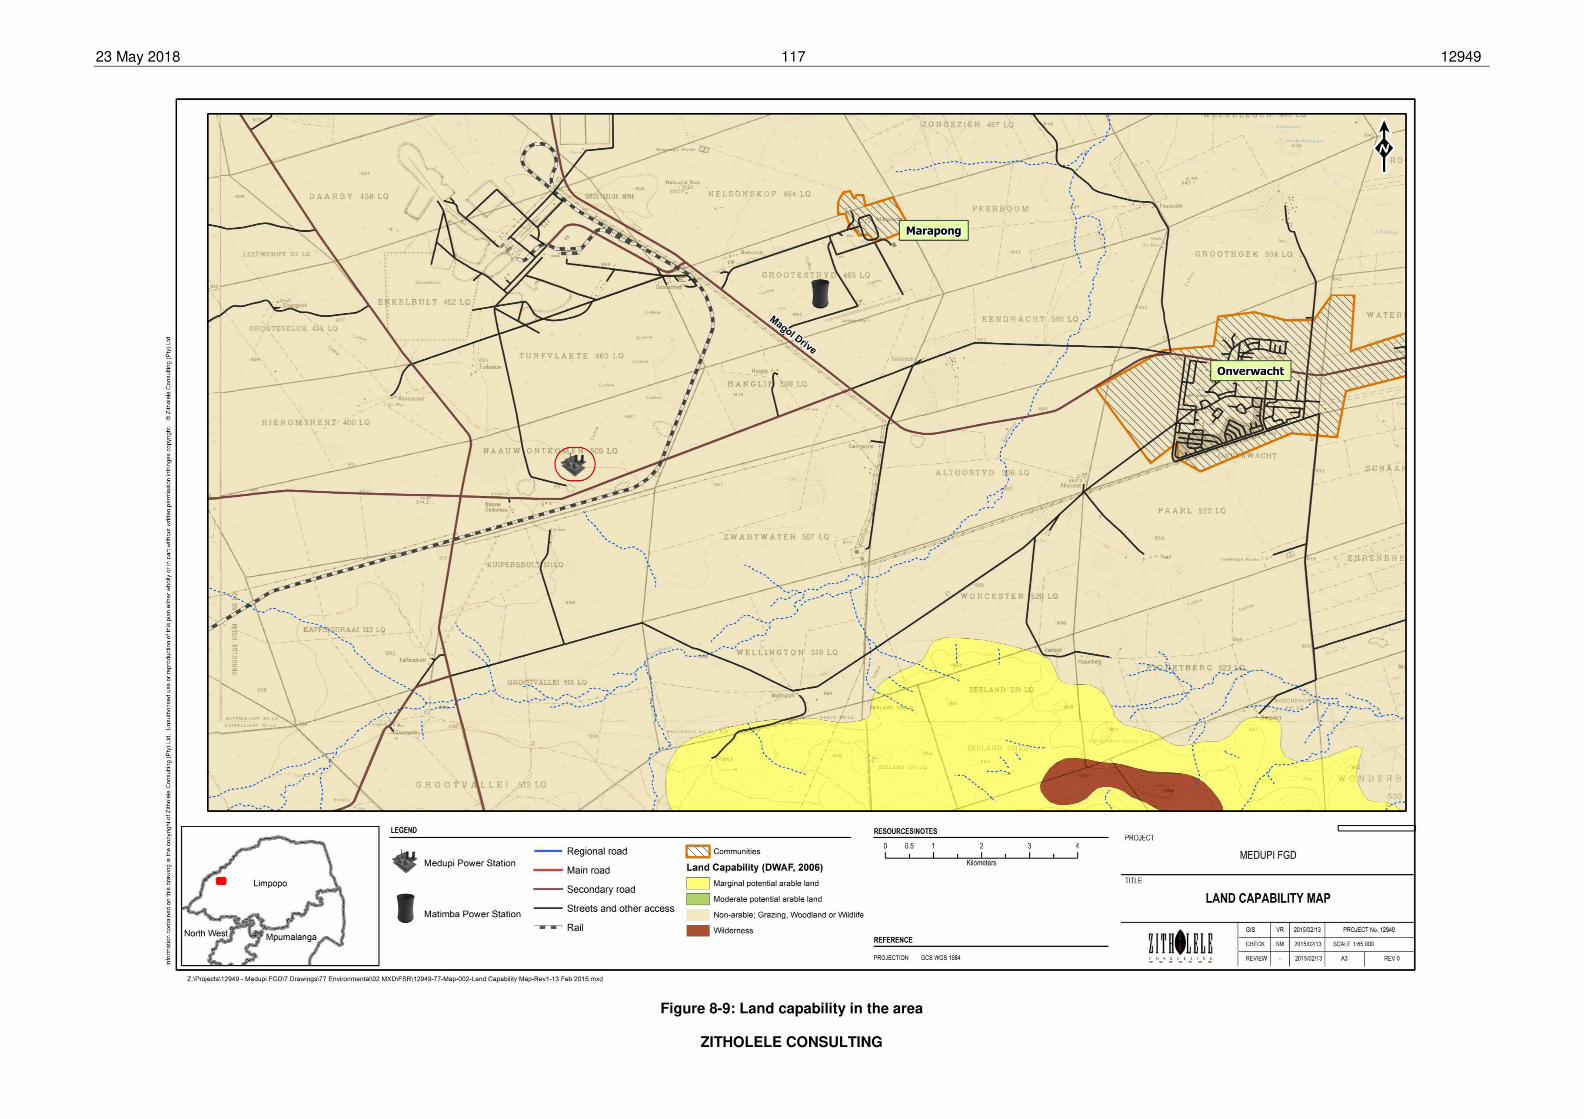
23 May 2018 117 12949
ZITHOLELE CONSULTING
Figure 8-9: Land capability in the area
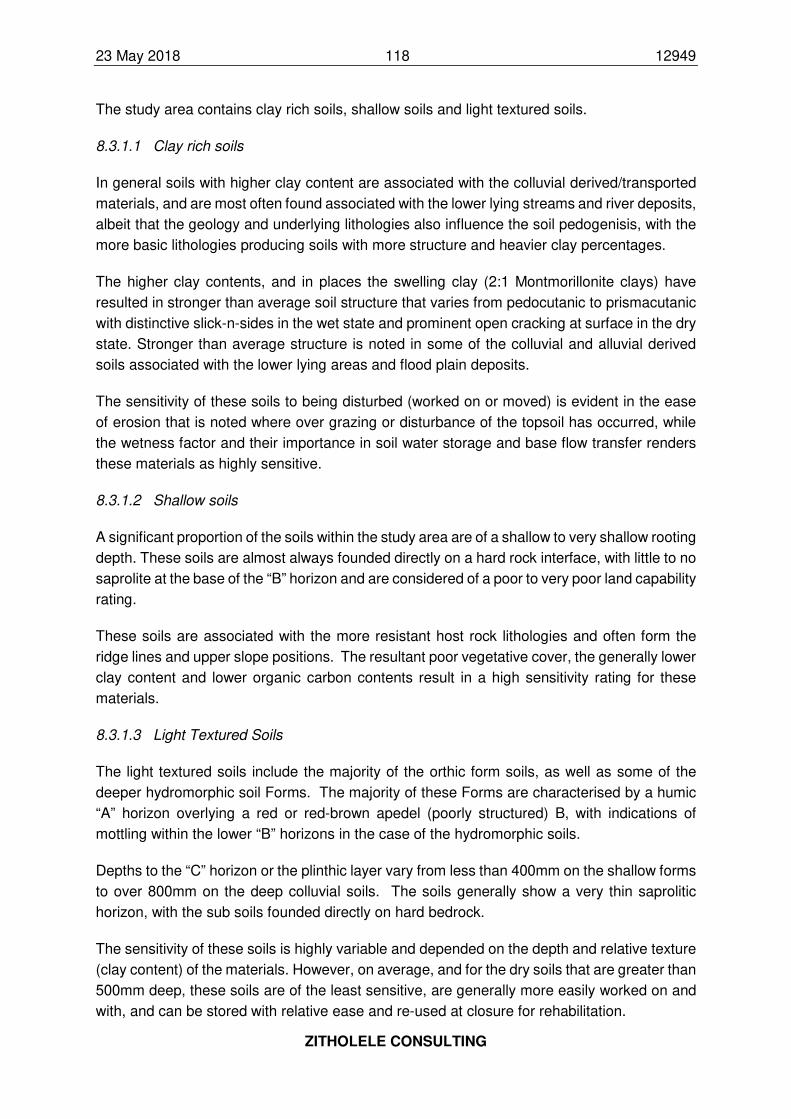
23 May 2018 118 12949
ZITHOLELE CONSULTING
The study area contains clay rich soils, shallow soils and light textured soils.
8.3.1.1 Clay rich soils
In general soils with higher clay content are associated with the colluvial derived/transported
materials, and are most often found associated with the lower lying streams and river deposits,
albeit that the geology and underlying lithologies also influence the soil pedogenisis, with the
more basic lithologies producing soils with more structure and heavier clay percentages.
The higher clay contents, and in places the swelling clay (2:1 Montmorillonite clays) have
resulted in stronger than average soil structure that varies from pedocutanic to prismacutanic
with distinctive slick-n-sides in the wet state and prominent open cracking at surface in the dry
state. Stronger than average structure is noted in some of the colluvial and alluvial derived
soils associated with the lower lying areas and flood plain deposits.
The sensitivity of these soils to being disturbed (worked on or moved) is evident in the ease
of erosion that is noted where over grazing or disturbance of the topsoil has occurred, while
the wetness factor and their importance in soil water storage and base flow transfer renders
these materials as highly sensitive.
8.3.1.2 Shallow soils
A significant proportion of the soils within the study area are of a shallow to very shallow rooting
depth. These soils are almost always founded directly on a hard rock interface, with little to no
saprolite at the base of the “B” horizon and are considered of a poor to very poor land capability
rating.
These soils are associated with the more resistant host rock lithologies and often form the
ridge lines and upper slope positions. The resultant poor vegetative cover, the generally lower
clay content and lower organic carbon contents result in a high sensitivity rating for these
materials.
8.3.1.3 Light Textured Soils
The light textured soils include the majority of the orthic form soils, as well as some of the
deeper hydromorphic soil Forms. The majority of these Forms are characterised by a humic
“A” horizon overlying a red or red-brown apedel (poorly structured) B, with indications of
mottling within the lower “B” horizons in the case of the hydromorphic soils.
Depths to the “C” horizon or the plinthic layer vary from less than 400mm on the shallow forms
to over 800mm on the deep colluvial soils. The soils generally show a very thin saprolitic
horizon, with the sub soils founded directly on hard bedrock.
The sensitivity of these soils is highly variable and depended on the depth and relative texture
(clay content) of the materials. However, on average, and for the dry soils that are greater than
500mm deep, these soils are of the least sensitive, are generally more easily worked on and
with, and can be stored with relative ease and re-used at closure for rehabilitation.
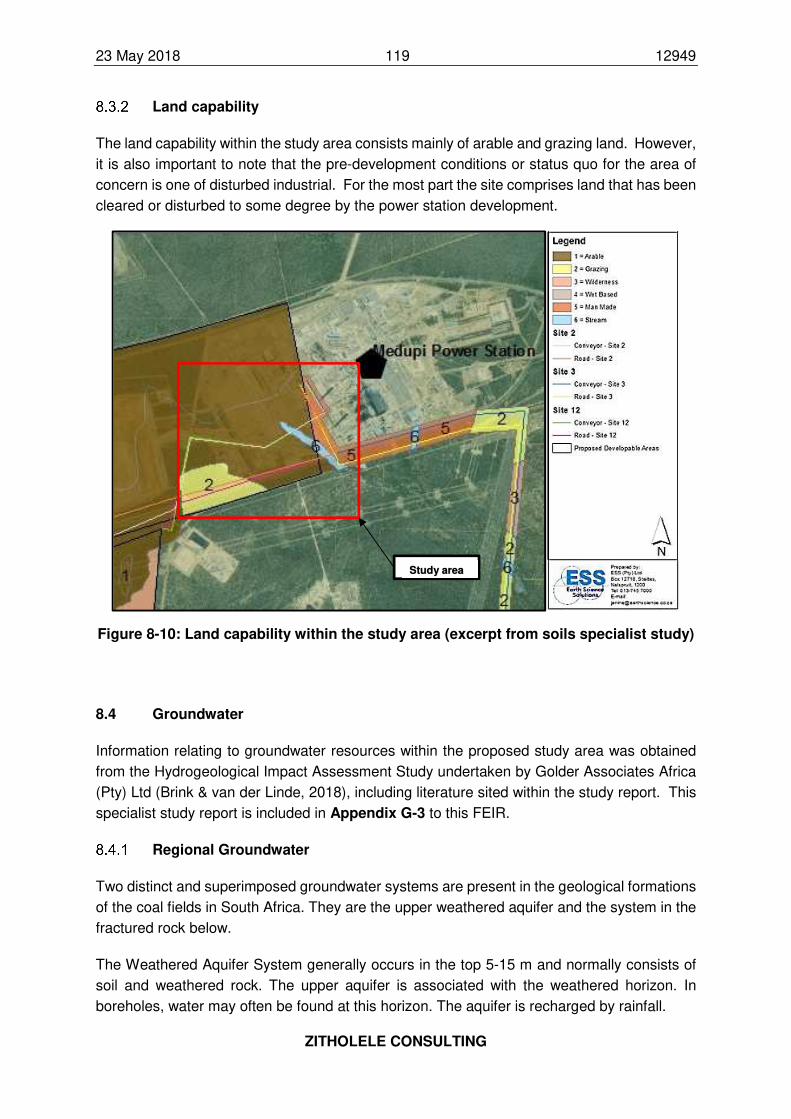
23 May 2018 119 12949
ZITHOLELE CONSULTING
Land capability
The land capability within the study area consists mainly of arable and grazing land. However,
it is also important to note that the pre-development conditions or status quo for the area of
concern is one of disturbed industrial. For the most part the site comprises land that has been
cleared or disturbed to some degree by the power station development.
Figure 8-10: Land capability within the study area (excerpt from soils specialist study)
8.4 Groundwater
Information relating to groundwater resources within the proposed study area was obtained
from the Hydrogeological Impact Assessment Study undertaken by Golder Associates Africa
(Pty) Ltd (Brink & van der Linde, 2018), including literature sited within the study report. This
specialist study report is included in Appendix G-3 to this FEIR.
Regional Groundwater
Two distinct and superimposed groundwater systems are present in the geological formations
of the coal fields in South Africa. They are the upper weathered aquifer and the system in the
fractured rock below.
The Weathered Aquifer System generally occurs in the top 5-15 m and normally consists of
soil and weathered rock. The upper aquifer is associated with the weathered horizon. In
boreholes, water may often be found at this horizon. The aquifer is recharged by rainfall.
Study area
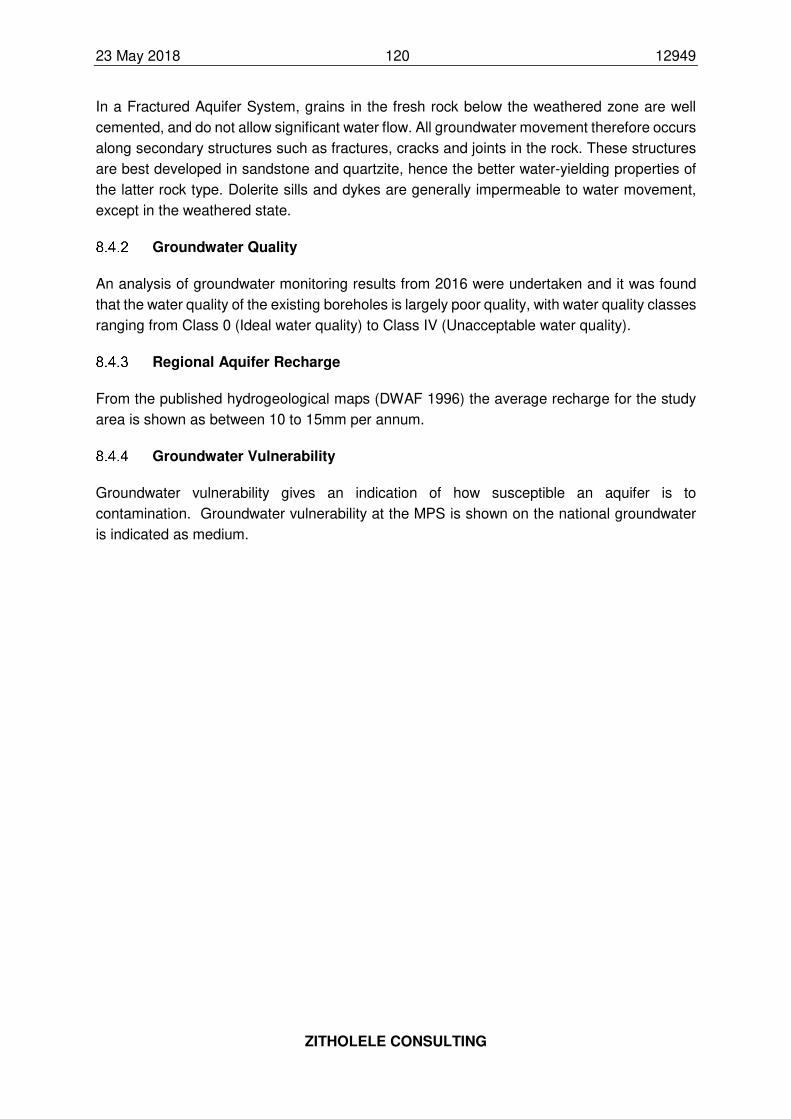
23 May 2018 120 12949
ZITHOLELE CONSULTING
In a Fractured Aquifer System, grains in the fresh rock below the weathered zone are well
cemented, and do not allow significant water flow. All groundwater movement therefore occurs
along secondary structures such as fractures, cracks and joints in the rock. These structures
are best developed in sandstone and quartzite, hence the better water-yielding properties of
the latter rock type. Dolerite sills and dykes are generally impermeable to water movement,
except in the weathered state.
Groundwater Quality
An analysis of groundwater monitoring results from 2016 were undertaken and it was found
that the water quality of the existing boreholes is largely poor quality, with water quality classes
ranging from Class 0 (Ideal water quality) to Class IV (Unacceptable water quality).
Regional Aquifer Recharge
From the published hydrogeological maps (DWAF 1996) the average recharge for the study
area is shown as between 10 to 15mm per annum.
Groundwater Vulnerability
Groundwater vulnerability gives an indication of how susceptible an aquifer is to
contamination. Groundwater vulnerability at the MPS is shown on the national groundwater
is indicated as medium.
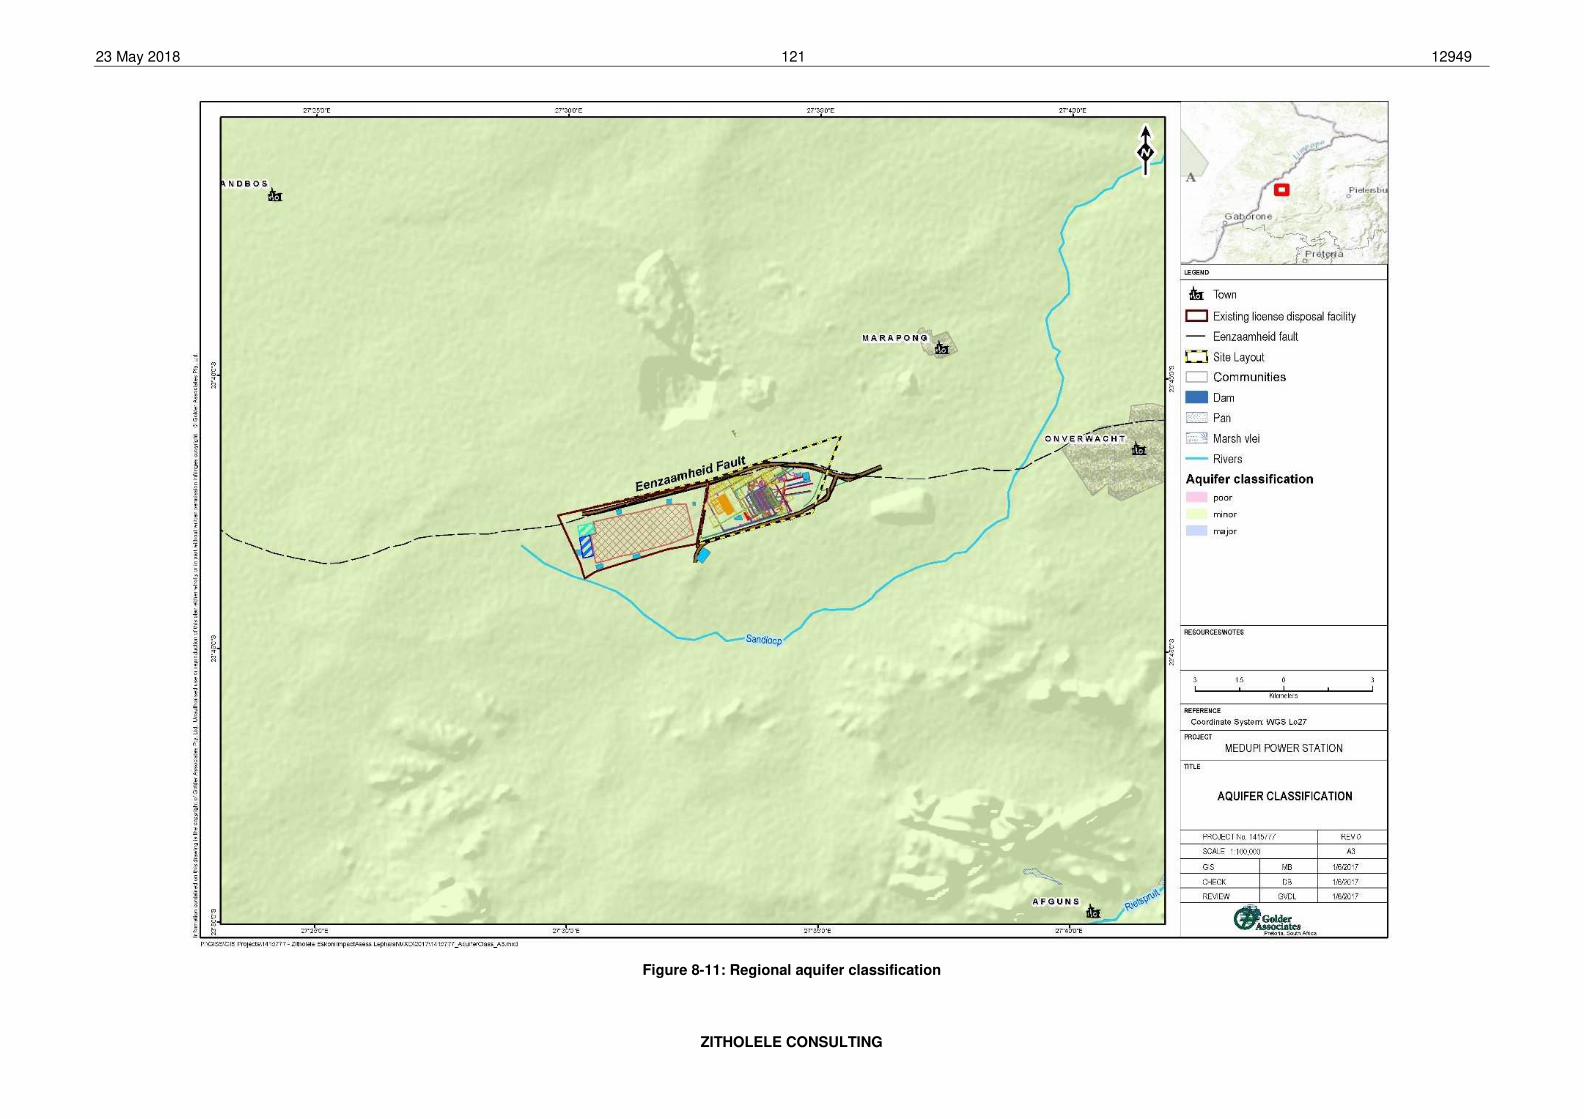
23 May 2018 121 12949
ZITHOLELE CONSULTING
Figure 8-11: Regional aquifer classification
23 May 2018 122 12949
ZITHOLELE CONSULTING
Figure 8-12: Hydrogeology Map
23 May 2018 123 12949
ZITHOLELE CONSULTING
Aquifer Classification and Borehole Yield
The published hydrogeological maps series by DWAF (1996) was used to define the regional
aquifer classification (Figure 8-11), which is classified as a minor aquifer system with fractured
aquifer zones (Figure 8-12). The published hydrogeological maps (DWAF 1996) indicate that
the average borehole yield in the area is between 0.5l/s and 2.0l/s.
Groundwater Levels and Flow Directions
From the available data and previous groundwater studies undertaken in the area,
groundwater levels ranged from between 4.41 to 69.98 meters below ground level (mbgl), with
the average water level as 30.4mbgl. The groundwater flow from the study area is primarily
away from the site, towards the east/south-east and northeast towards the non-perennial
Sandloop River.
8.5 Surface Water
Information relating to the surface water resources within the proposed study area was
obtained from the Surface Water Impact Assessment Study undertaken by Golder Associates
Africa (Pty) Ltd (Sithole & Jordaan, 2018), and Biodiversity and Wetland Assessment
undertaken by Natural Scientific Services (NSS) (Abell, et al., 2018), including literature sited
within these study report. These specialist study reports are included in Appendix G-4 to this
FEIR.
Regional Drainage Network
The study area is located within the A42J Quaternary catchment (Figure 8-13) to the south of
the Lephalale coalfield where numerous mining developments are foreseen predominantly to
the north of the Eenzaamheid Fault line. There are no perennial streams originating within the
area itself. The closest perennial river is the Mokolo into which the non-perennial Sandloop
River drains. The Mokolo flows through A42J to the Limpopo River.
Medupi is situated in the Mokolo catchment, with the non-perennial Sandloop River flowing
around the site in an easterly to north easterly direction to confluence with the Mokolo River
approximately 16 kilometres downstream of the town of Lephalale. The study site falls in a
predominantly flat area of the Limpopo Water Management Area (WMA).
Water uses in the catchment
The water use within the catchment is predominantly agriculture (87%) and industry (13%)
related. The Limpopo Province, and in particular, the Lephalale area, is a water stressed area
with evaporation significantly higher than precipitation. Agricultural and industrial land uses in
the municipal area are water intensive. There is therefore a high demand for water from an
already water-stressed catchment.
Within the provisions of the National Water Act (Act 39 of 1998 as amended) as stipulated in
the National Water Resources Strategy, there is a need to meet the water requirements of the
23 May 2018 124 12949
ZITHOLELE CONSULTING
Reserve (Basic Human needs and Ecological) in terms of water quantity and quality. Taking
the requirements into account, there is insufficient water to maintain the current balance.
Added to this, it is anticipated that water demand will increase with new developments
proposed in the Mokolo Catchment, such as new or expanded mining activities and new power
stations (Bohlweki Environmental, 2006).
The MCWAP scheme has been initiated in order to provide adequate water to supply the
current and planned water users with allocations of water from the Mokolo Dam. Medupi
Power Station already has an allocation for water from the MCWAP phase 1 scheme. There
is currently a WULA in process for additional water allocation to Medupi from the MCWAP
phase 2 scheme in order to supply for the planned FGD technology operation. This WUL is
been applied for at a strategic level by Eskom. The total water requirement will be of 15.4
million m3 per annum, the pipeline infrastructure is being sized for this and the licence will be
for the same amount.
Water Resource Classification and Resource Quality Objectives
The classification of significant water resources in the Crocodile (West), Marico, Matlabas and
Mokolo catchments in accordance with the Water Resource Classification System (WRCS)
was undertaken in 2011 / 2012 and finalised in 2013.
In terms of the classification system, each quaternary catchment is classified as a Class I, II
or III, defined as:
• Class I - Minimally used: Water resource is one which is minimally used and the overall
condition of that water resource is minimally altered from its pre-development condition;
• Class II - Moderately used: Water resource is one which is moderately used and the overall
condition of that water resource is moderately altered from its pre-development condition;
and
• Class III - Heavily used: Water resource is one which is heavily used and the overall
condition of that water resource is significantly altered from its pre-development condition.
The recommended Class for quaternary catchment A42J is a Class II (Department of Water
Affairs, 2013). In this respect mitigation implemented must be such that it will protect the water
resources so that an ecological category of B/C is maintained.
The determination of Resource Quality Objectives (RQO) for the area was undertaken in 2016/
2017 and will be gazetted during the first quarter of 2018 (DWS, 2017, Report number:
DM/WMA01/00/CON/RQO/0516). The proposed RQOs and numerical limits are set out in
Table 8-5.
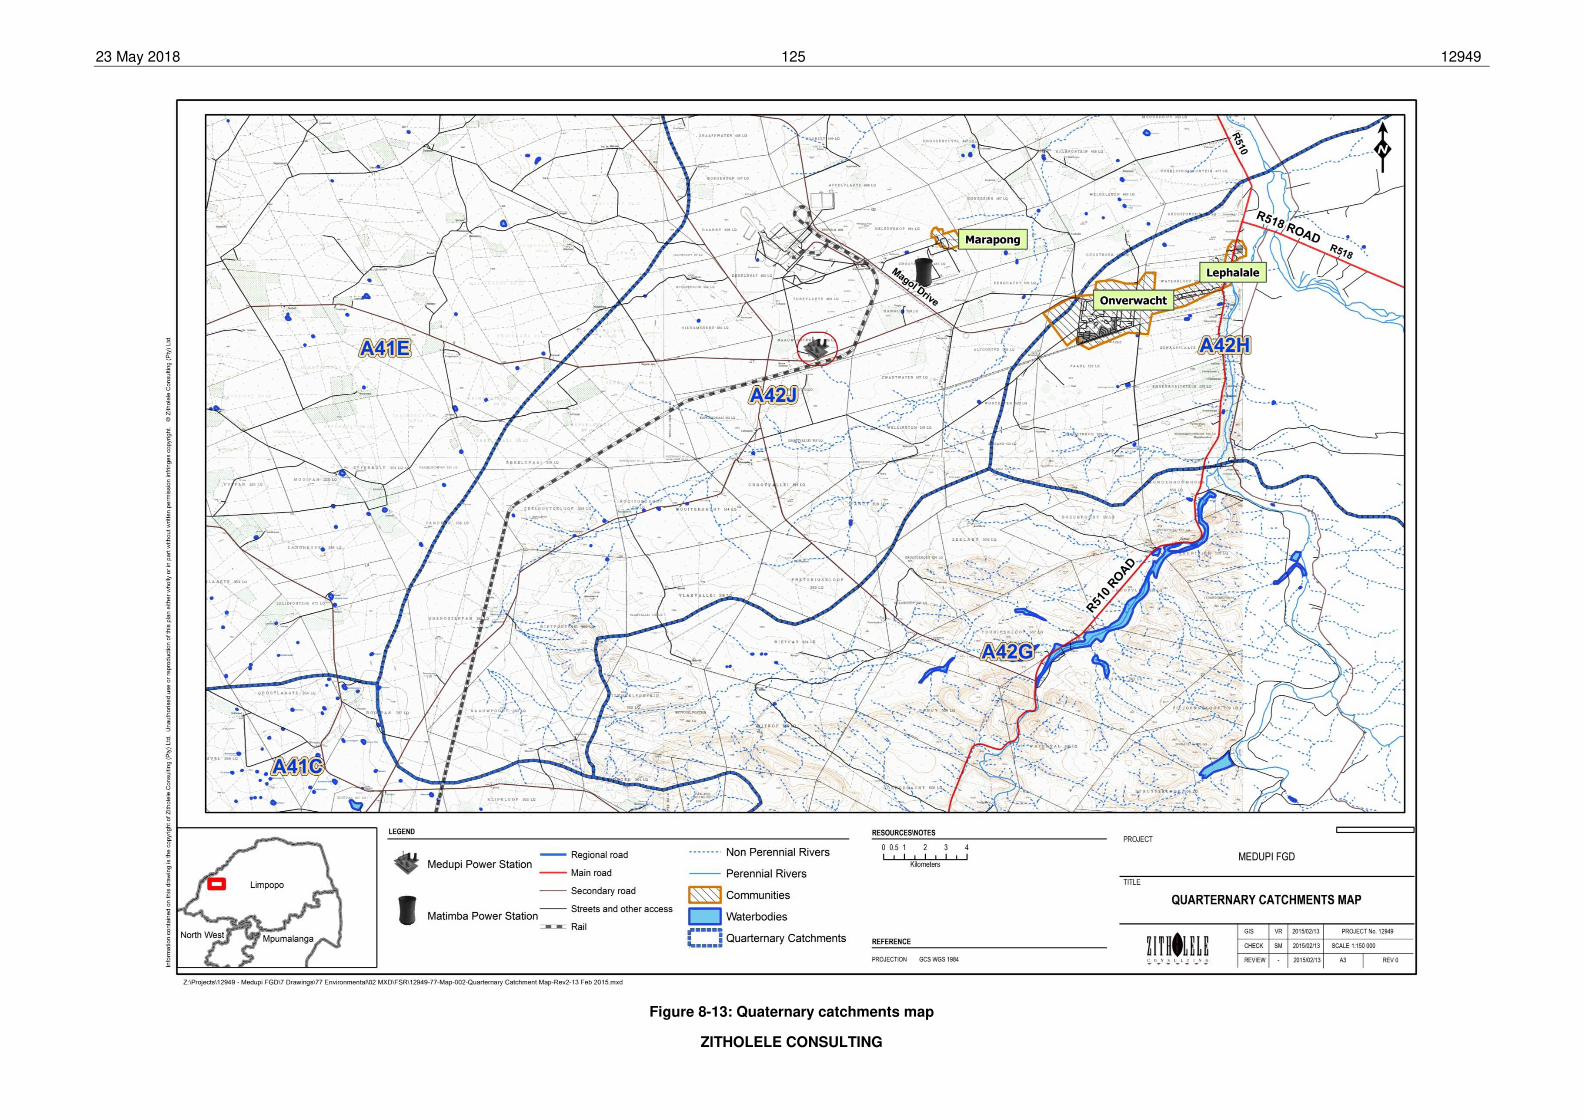
23 May 2018 125 12949
ZITHOLELE CONSULTING
Figure 8-13: Quaternary catchments map
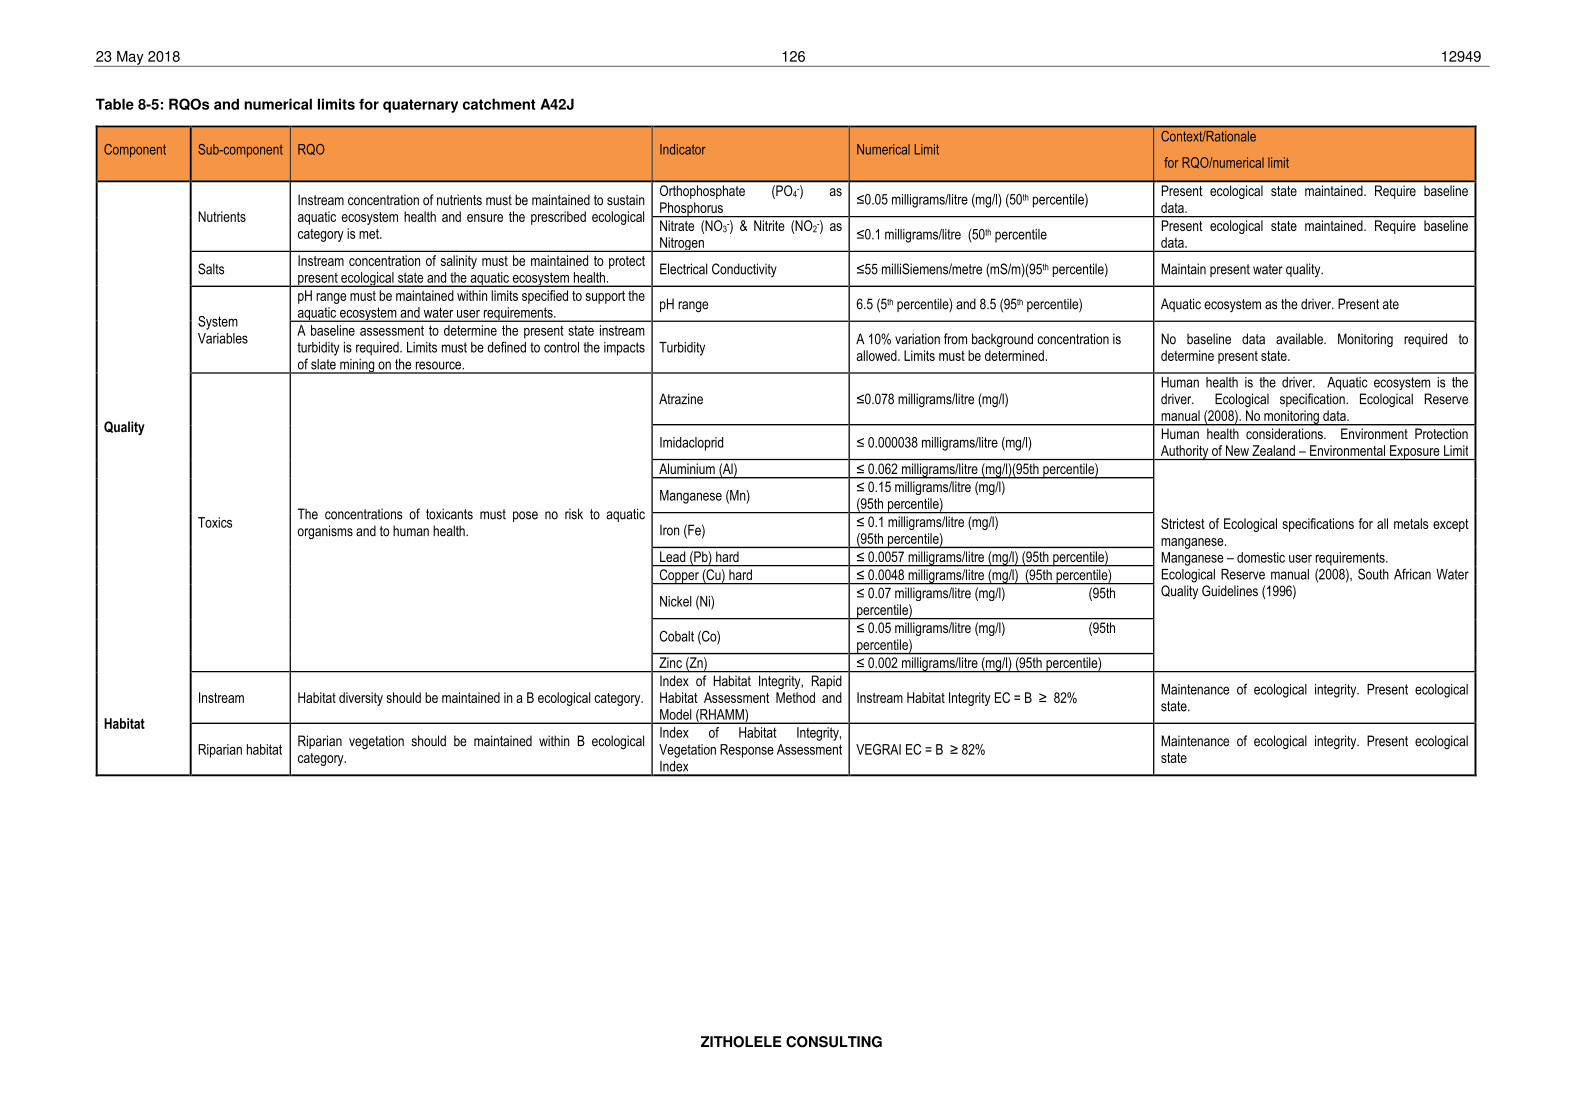
23 May 2018 126 12949
ZITHOLELE CONSULTING
Table 8-5: RQOs and numerical limits for quaternary catchment A42J
Component Sub-component RQO Indicator Numerical Limit Context/Rationale
for RQO/numerical limit
Quality
Nutrients Instream concentration of nutrients must be maintained to sustain aquatic ecosystem health and ensure the prescribed ecological category is met.
Orthophosphate (PO4-) as
Phosphorus ≤0.05 milligrams/litre (mg/l) (50th percentile)
Present ecological state maintained. Require baseline data.
Nitrate (NO3-) & Nitrite (NO2
-) as Nitrogen
≤0.1 milligrams/litre (50th percentile Present ecological state maintained. Require baseline data.
Salts Instream concentration of salinity must be maintained to protect present ecological state and the aquatic ecosystem health.
Electrical Conductivity ≤55 milliSiemens/metre (mS/m)(95th percentile) Maintain present water quality.
System Variables
pH range must be maintained within limits specified to support the aquatic ecosystem and water user requirements.
pH range 6.5 (5th percentile) and 8.5 (95th percentile) Aquatic ecosystem as the driver. Present ate
A baseline assessment to determine the present state instream turbidity is required. Limits must be defined to control the impacts of slate mining on the resource.
Turbidity A 10% variation from background concentration is allowed. Limits must be determined.
No baseline data available. Monitoring required to determine present state.
Toxics The concentrations of toxicants must pose no risk to aquatic organisms and to human health.
Atrazine ≤0.078 milligrams/litre (mg/l) Human health is the driver. Aquatic ecosystem is the driver. Ecological specification. Ecological Reserve manual (2008). No monitoring data.
Imidacloprid ≤ 0.000038 milligrams/litre (mg/l) Human health considerations. Environment Protection Authority of New Zealand – Environmental Exposure Limit
Aluminium (Al) ≤ 0.062 milligrams/litre (mg/l)(95th percentile)
Strictest of Ecological specifications for all metals except manganese. Manganese – domestic user requirements. Ecological Reserve manual (2008), South African Water Quality Guidelines (1996)
Manganese (Mn) ≤ 0.15 milligrams/litre (mg/l) (95th percentile)
Iron (Fe) ≤ 0.1 milligrams/litre (mg/l) (95th percentile)
Lead (Pb) hard ≤ 0.0057 milligrams/litre (mg/l) (95th percentile)
Copper (Cu) hard ≤ 0.0048 milligrams/litre (mg/l) (95th percentile)
Nickel (Ni) ≤ 0.07 milligrams/litre (mg/l) (95th percentile)
Cobalt (Co) ≤ 0.05 milligrams/litre (mg/l) (95th percentile)
Zinc (Zn) ≤ 0.002 milligrams/litre (mg/l) (95th percentile)
Habitat
Instream Habitat diversity should be maintained in a B ecological category. Index of Habitat Integrity, Rapid Habitat Assessment Method and Model (RHAMM)
Instream Habitat Integrity EC = B ≥ 82% Maintenance of ecological integrity. Present ecological state.
Riparian habitat Riparian vegetation should be maintained within B ecological category.
Index of Habitat Integrity, Vegetation Response Assessment Index
VEGRAI EC = B ≥ 82% Maintenance of ecological integrity. Present ecological state
23 May 2018 127 12949
ZITHOLELE CONSULTING
8.6 Biodiversity (Terrestrial Ecology) and Wetlands
Information relating to the biodiversity and wetland resources within the proposed study area
was obtained from the Biodiversity and Wetland Assessment undertaken by Natural Scientific
Services (NSS) (Abell, et al., 2018), including literature sited within these study report. This
specialist study report is included in Appendix G-5 to this FEIR.
The study area investigated by NSS largely cover undisturbed areas within the existing MPS
footprint, including the farm portion on which the ADF is located, as well as a buffer area of
500m outside the MPS property boundary. However, in this EIA only wetland resources and
possible impacts within the proposed railway yard site or FGD infrastructure footprint within
the MPS footprint, or within 500m of these sites were considered.
Regional Biodiversity (Terrestrial Ecology) setting
The Study Area is situated in the Mokolo River Catchment area (8387 km2), where the Mokolo
River system varies from good to fair health (RHP, 2006). The lower Mokolo River is
dominated by hardy, pool dwelling species of fish. It is possible that some species may have
been lost due to fragmentation of the river from the Limpopo River. No fish species requiring
permanent flow were recorded, but several species that require flowing water for breeding
purposes remain, such as the Large Scale Yellowfish (Labeobarbus marequensis) and other
Labeo species. However, no alien fish species were recorded.
The poor habitat diversity within the region caused the invertebrate assemblage to be
dominated by hardy families associated with marginal vegetation and sand. The moderately
scoring SASS assessments are likely to be as a result of the irregular flow regime.

23 May 2018 128 12949
ZITHOLELE CONSULTING
Figure 8-14: Vegetation type within the study area
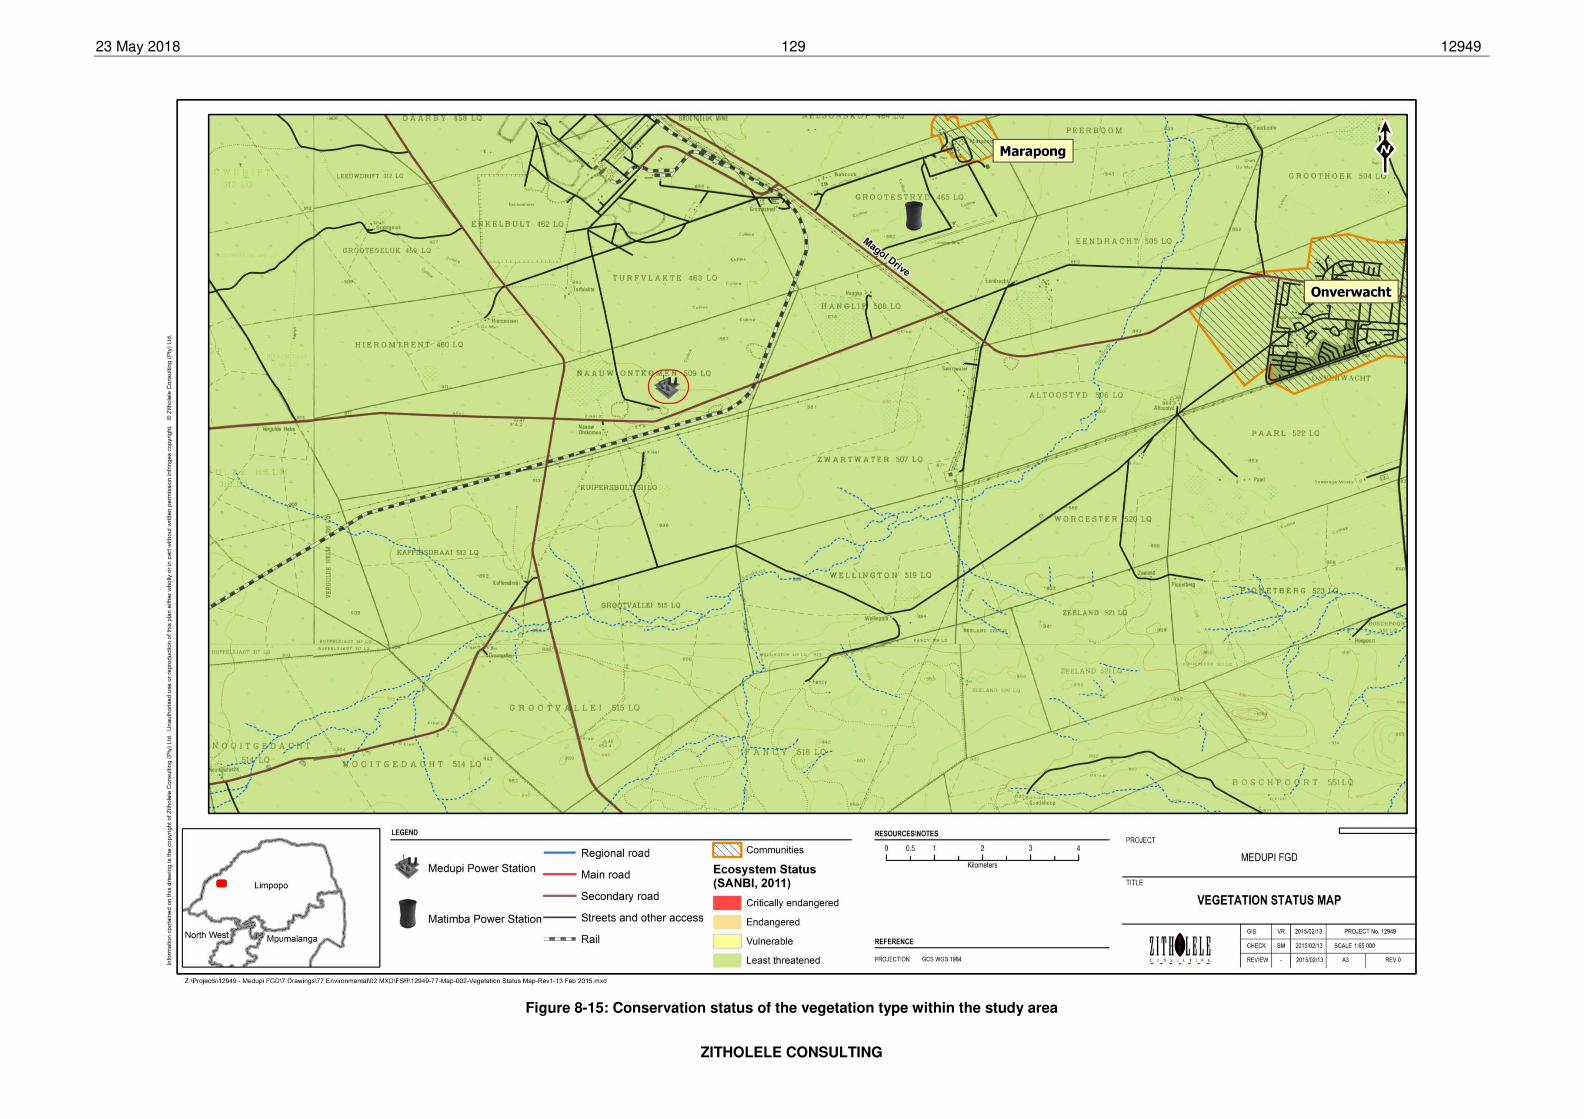
23 May 2018 129 12949
ZITHOLELE CONSULTING
Figure 8-15: Conservation status of the vegetation type within the study area

23 May 2018 130 12949
ZITHOLELE CONSULTING
Table 8-6 provides a comparison of the observed species richness, with that expected at both
local and regional scales. From this table it is evident that remaining natural and semi-natural
areas in and around Medupi support a considerable proportion of the region’s faunal diversity.
Table 8-6: Summary of faunal species richness in the study area as compared to a
regional scale (taken from Abell et. al. 2018)
FAUNAL GROUP
SPECIES RICHNESS
POTENTIAL OBSERVED
RE
GIO
N1
QD
S2
ME
DU
PI3
BE
C
(2006)
FG
D
ME
DU
PI
VIC
INIT
Y4
Mammals 124 41 89 18 43 47 54
Birds 345 314 304 67 158 183 211
Reptiles 96 83 47 7 20 20 46
Frogs 27 22 20 8 16 19 14
Butterflies 176 149 88 3 9 26 15
Dragonflies & Damselflies
66 66 48 0 2 3 1
Scorpions 11 11 11 0 1 1 2
Megalomorph Spiders 4 4 2 0 0 0 1
KEY 1Species recorded during atlas projects within the four regional QDSs 2327CB, 2327DA, 2327CD & 2327DC
2Species that have been recorded during atlas projects within the QDS 2327DA wherein Medupi is situated
3Species that are likely to occur (LoO of 2 or 3) in Medupi
4Species recorded during NSS studies in the vicinity: Grootegeluk and Limpopo West Mines, Mafutha Project and Matimba Power Station
Biodiversity at the study area
The biodiversity specialist considered vegetation and biodiversity within the MPS and ADF
footprints, as well as the area within 500m of the MPS site boundary. The EIA application,
however only consider the footprint of the proposed FGD infrastructure, railway yard and
associated structures and infrastructure within the MPS footprint as indicated by the red shape
in Figure 8-16. As a result only aspects and impacts associated with the construction and
operation of the railway yard and FGD infrastructure within the MPS were considered in this
DEIR.
The Study Area falls within the Limpopo Sweet Bushveld (code SVcb 19) vegetation type
(Figure 8-14) as described by Mucina and Rutherford (2006). The typical vegetation consists
of short open woodland. In disturbed areas thickets of Acacia erubescens, Acacia mellifera
and Dichrostachys cinerea are almost impenetrable. The conservation status of the Limpopo
Sweet Bushveld is classified as Least Threatened (Figure 8-15), however the vegetation type
has been facing increasing pressure from numerous coal mining projects within the vicinity
with a much greater percentage of land transformed.
Vegetation communities identified within the study site (red boundary indicated in Figure 8-16)
are mainly Acacia dominated Woodlands with associated Wetlands and included: Acacia
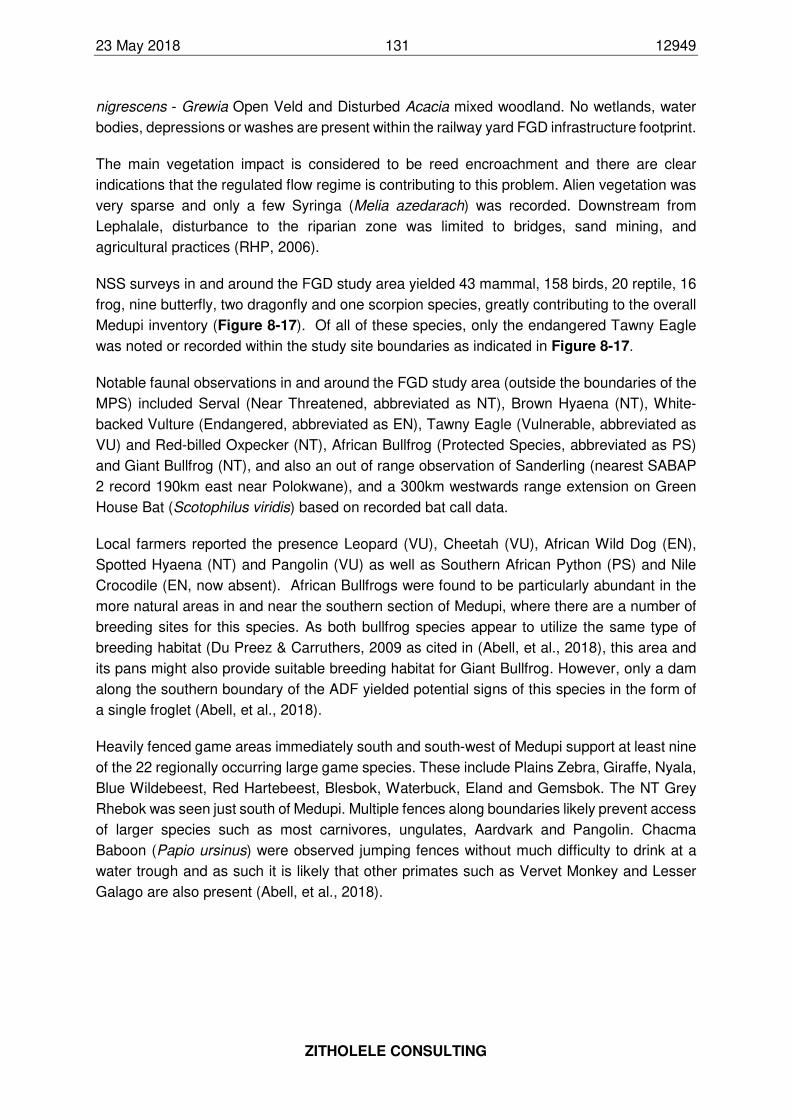
23 May 2018 131 12949
ZITHOLELE CONSULTING
nigrescens - Grewia Open Veld and Disturbed Acacia mixed woodland. No wetlands, water
bodies, depressions or washes are present within the railway yard FGD infrastructure footprint.
The main vegetation impact is considered to be reed encroachment and there are clear
indications that the regulated flow regime is contributing to this problem. Alien vegetation was
very sparse and only a few Syringa (Melia azedarach) was recorded. Downstream from
Lephalale, disturbance to the riparian zone was limited to bridges, sand mining, and
agricultural practices (RHP, 2006).
NSS surveys in and around the FGD study area yielded 43 mammal, 158 birds, 20 reptile, 16
frog, nine butterfly, two dragonfly and one scorpion species, greatly contributing to the overall
Medupi inventory (Figure 8-17). Of all of these species, only the endangered Tawny Eagle
was noted or recorded within the study site boundaries as indicated in Figure 8-17.
Notable faunal observations in and around the FGD study area (outside the boundaries of the
MPS) included Serval (Near Threatened, abbreviated as NT), Brown Hyaena (NT), White-
backed Vulture (Endangered, abbreviated as EN), Tawny Eagle (Vulnerable, abbreviated as
VU) and Red-billed Oxpecker (NT), African Bullfrog (Protected Species, abbreviated as PS)
and Giant Bullfrog (NT), and also an out of range observation of Sanderling (nearest SABAP
2 record 190km east near Polokwane), and a 300km westwards range extension on Green
House Bat (Scotophilus viridis) based on recorded bat call data.
Local farmers reported the presence Leopard (VU), Cheetah (VU), African Wild Dog (EN),
Spotted Hyaena (NT) and Pangolin (VU) as well as Southern African Python (PS) and Nile
Crocodile (EN, now absent). African Bullfrogs were found to be particularly abundant in the
more natural areas in and near the southern section of Medupi, where there are a number of
breeding sites for this species. As both bullfrog species appear to utilize the same type of
breeding habitat (Du Preez & Carruthers, 2009 as cited in (Abell, et al., 2018), this area and
its pans might also provide suitable breeding habitat for Giant Bullfrog. However, only a dam
along the southern boundary of the ADF yielded potential signs of this species in the form of
a single froglet (Abell, et al., 2018).
Heavily fenced game areas immediately south and south-west of Medupi support at least nine
of the 22 regionally occurring large game species. These include Plains Zebra, Giraffe, Nyala,
Blue Wildebeest, Red Hartebeest, Blesbok, Waterbuck, Eland and Gemsbok. The NT Grey
Rhebok was seen just south of Medupi. Multiple fences along boundaries likely prevent access
of larger species such as most carnivores, ungulates, Aardvark and Pangolin. Chacma
Baboon (Papio ursinus) were observed jumping fences without much difficulty to drink at a
water trough and as such it is likely that other primates such as Vervet Monkey and Lesser
Galago are also present (Abell, et al., 2018).
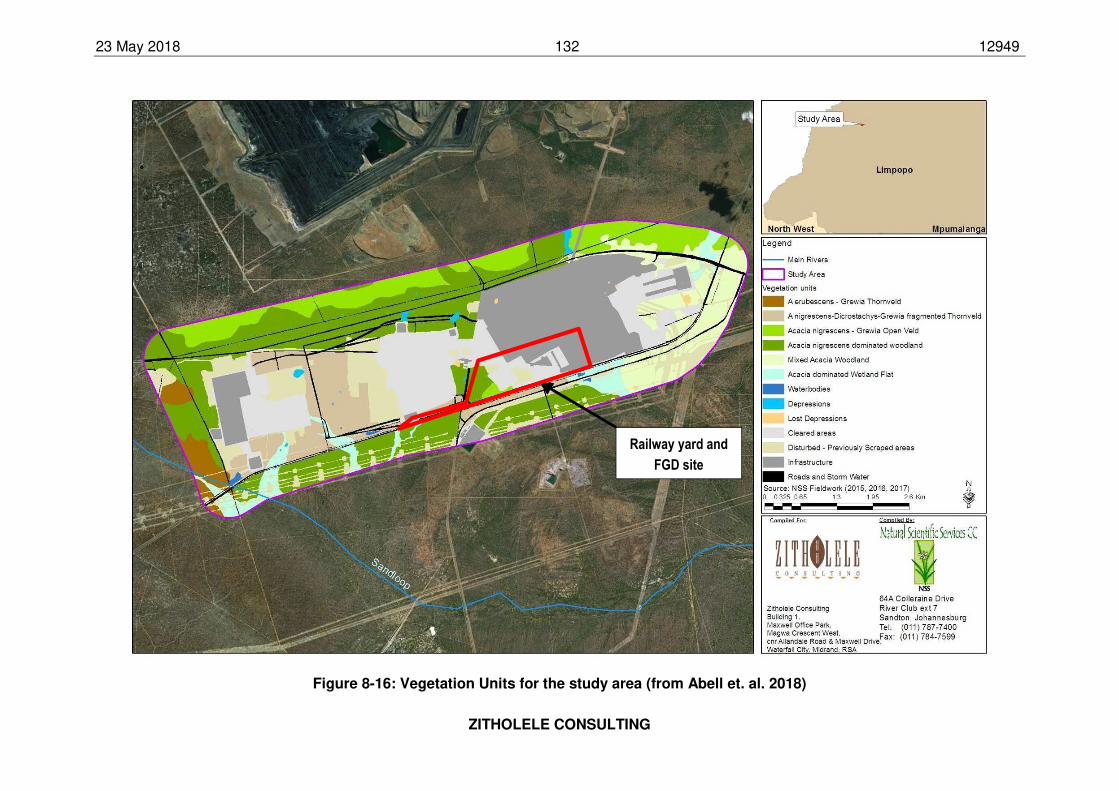
23 May 2018 132 12949
ZITHOLELE CONSULTING
Figure 8-16: Vegetation Units for the study area (from Abell et. al. 2018)
Railway yard and
FGD site
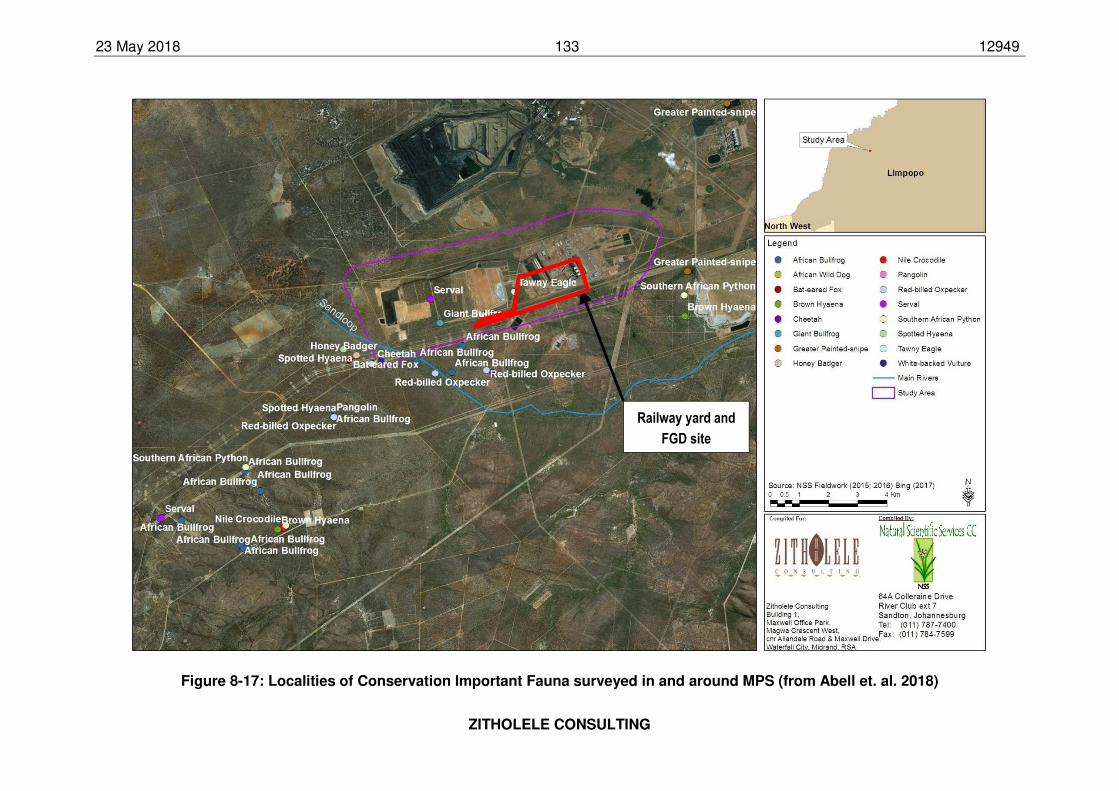
23 May 2018 133 12949
ZITHOLELE CONSULTING
Figure 8-17: Localities of Conservation Important Fauna surveyed in and around MPS (from Abell et. al. 2018)
Railway yard and
FGD site
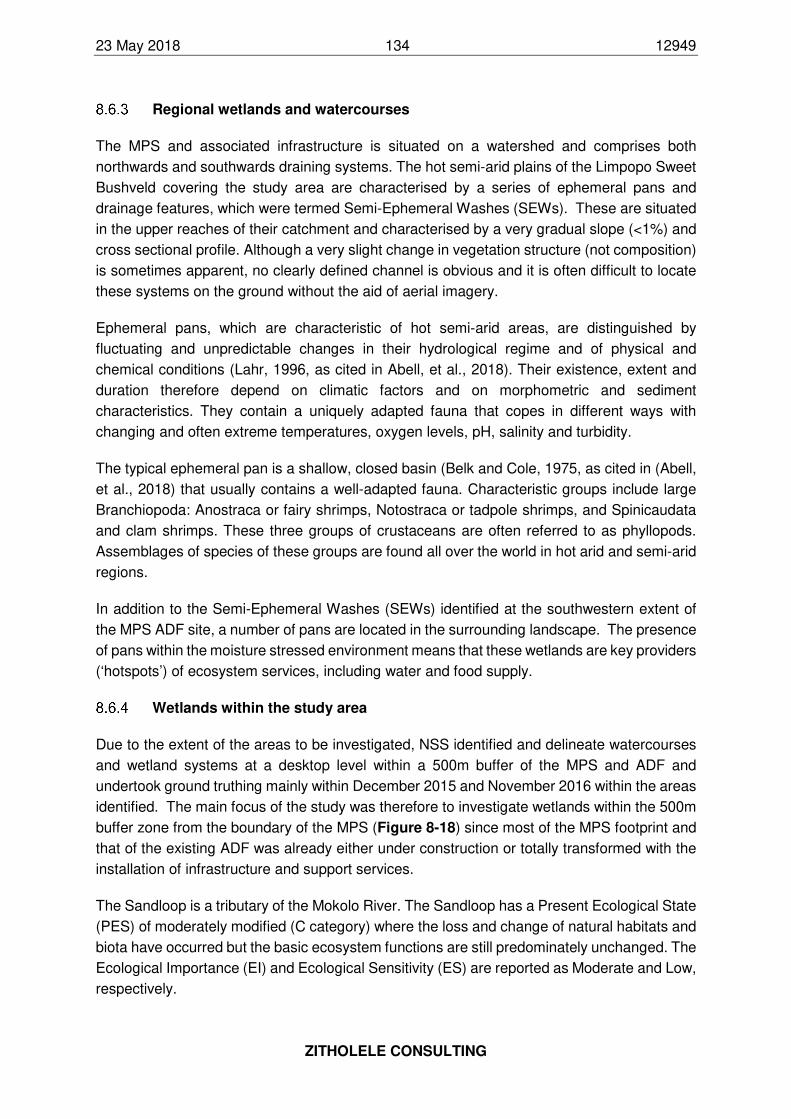
23 May 2018 134 12949
ZITHOLELE CONSULTING
Regional wetlands and watercourses
The MPS and associated infrastructure is situated on a watershed and comprises both
northwards and southwards draining systems. The hot semi-arid plains of the Limpopo Sweet
Bushveld covering the study area are characterised by a series of ephemeral pans and
drainage features, which were termed Semi-Ephemeral Washes (SEWs). These are situated
in the upper reaches of their catchment and characterised by a very gradual slope (<1%) and
cross sectional profile. Although a very slight change in vegetation structure (not composition)
is sometimes apparent, no clearly defined channel is obvious and it is often difficult to locate
these systems on the ground without the aid of aerial imagery.
Ephemeral pans, which are characteristic of hot semi-arid areas, are distinguished by
fluctuating and unpredictable changes in their hydrological regime and of physical and
chemical conditions (Lahr, 1996, as cited in Abell, et al., 2018). Their existence, extent and
duration therefore depend on climatic factors and on morphometric and sediment
characteristics. They contain a uniquely adapted fauna that copes in different ways with
changing and often extreme temperatures, oxygen levels, pH, salinity and turbidity.
The typical ephemeral pan is a shallow, closed basin (Belk and Cole, 1975, as cited in (Abell,
et al., 2018) that usually contains a well-adapted fauna. Characteristic groups include large
Branchiopoda: Anostraca or fairy shrimps, Notostraca or tadpole shrimps, and Spinicaudata
and clam shrimps. These three groups of crustaceans are often referred to as phyllopods.
Assemblages of species of these groups are found all over the world in hot arid and semi-arid
regions.
In addition to the Semi-Ephemeral Washes (SEWs) identified at the southwestern extent of
the MPS ADF site, a number of pans are located in the surrounding landscape. The presence
of pans within the moisture stressed environment means that these wetlands are key providers
(‘hotspots’) of ecosystem services, including water and food supply.
Wetlands within the study area
Due to the extent of the areas to be investigated, NSS identified and delineate watercourses
and wetland systems at a desktop level within a 500m buffer of the MPS and ADF and
undertook ground truthing mainly within December 2015 and November 2016 within the areas
identified. The main focus of the study was therefore to investigate wetlands within the 500m
buffer zone from the boundary of the MPS (Figure 8-18) since most of the MPS footprint and
that of the existing ADF was already either under construction or totally transformed with the
installation of infrastructure and support services.
The Sandloop is a tributary of the Mokolo River. The Sandloop has a Present Ecological State
(PES) of moderately modified (C category) where the loss and change of natural habitats and
biota have occurred but the basic ecosystem functions are still predominately unchanged. The
Ecological Importance (EI) and Ecological Sensitivity (ES) are reported as Moderate and Low,
respectively.
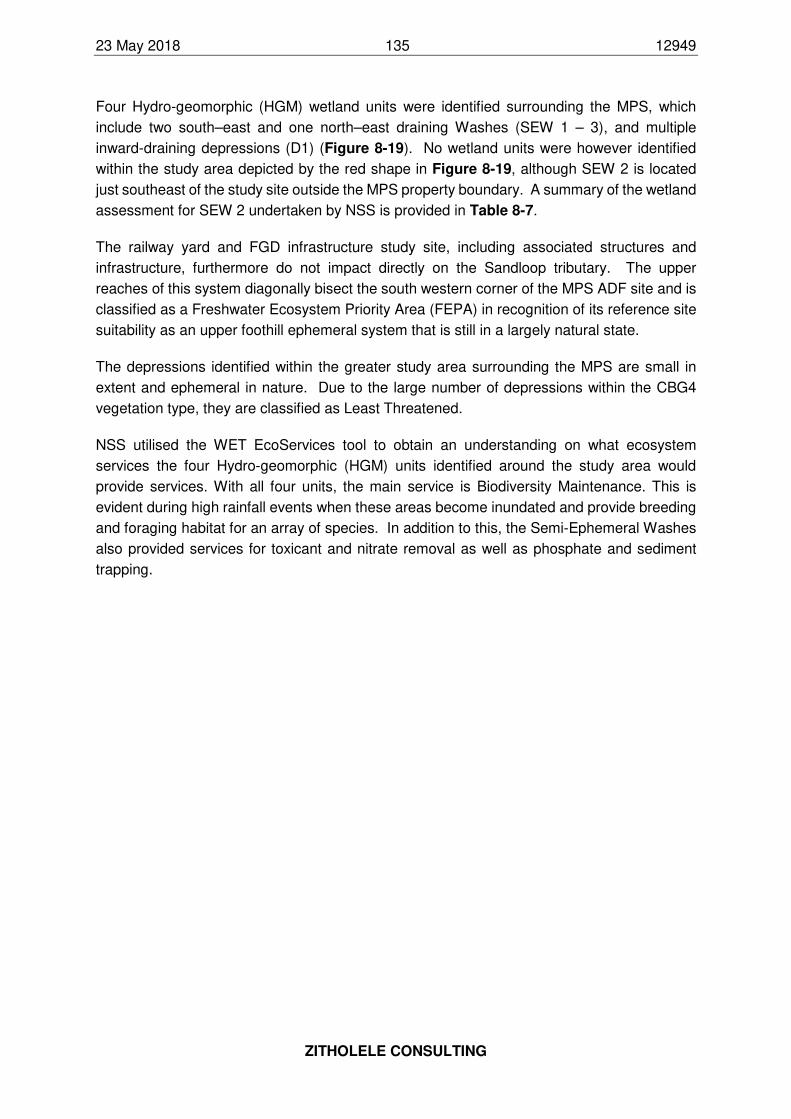
23 May 2018 135 12949
ZITHOLELE CONSULTING
Four Hydro-geomorphic (HGM) wetland units were identified surrounding the MPS, which
include two south–east and one north–east draining Washes (SEW 1 – 3), and multiple
inward-draining depressions (D1) (Figure 8-19). No wetland units were however identified
within the study area depicted by the red shape in Figure 8-19, although SEW 2 is located
just southeast of the study site outside the MPS property boundary. A summary of the wetland
assessment for SEW 2 undertaken by NSS is provided in Table 8-7.
The railway yard and FGD infrastructure study site, including associated structures and
infrastructure, furthermore do not impact directly on the Sandloop tributary. The upper
reaches of this system diagonally bisect the south western corner of the MPS ADF site and is
classified as a Freshwater Ecosystem Priority Area (FEPA) in recognition of its reference site
suitability as an upper foothill ephemeral system that is still in a largely natural state.
The depressions identified within the greater study area surrounding the MPS are small in
extent and ephemeral in nature. Due to the large number of depressions within the CBG4
vegetation type, they are classified as Least Threatened.
NSS utilised the WET EcoServices tool to obtain an understanding on what ecosystem
services the four Hydro-geomorphic (HGM) units identified around the study area would
provide services. With all four units, the main service is Biodiversity Maintenance. This is
evident during high rainfall events when these areas become inundated and provide breeding
and foraging habitat for an array of species. In addition to this, the Semi-Ephemeral Washes
also provided services for toxicant and nitrate removal as well as phosphate and sediment
trapping.
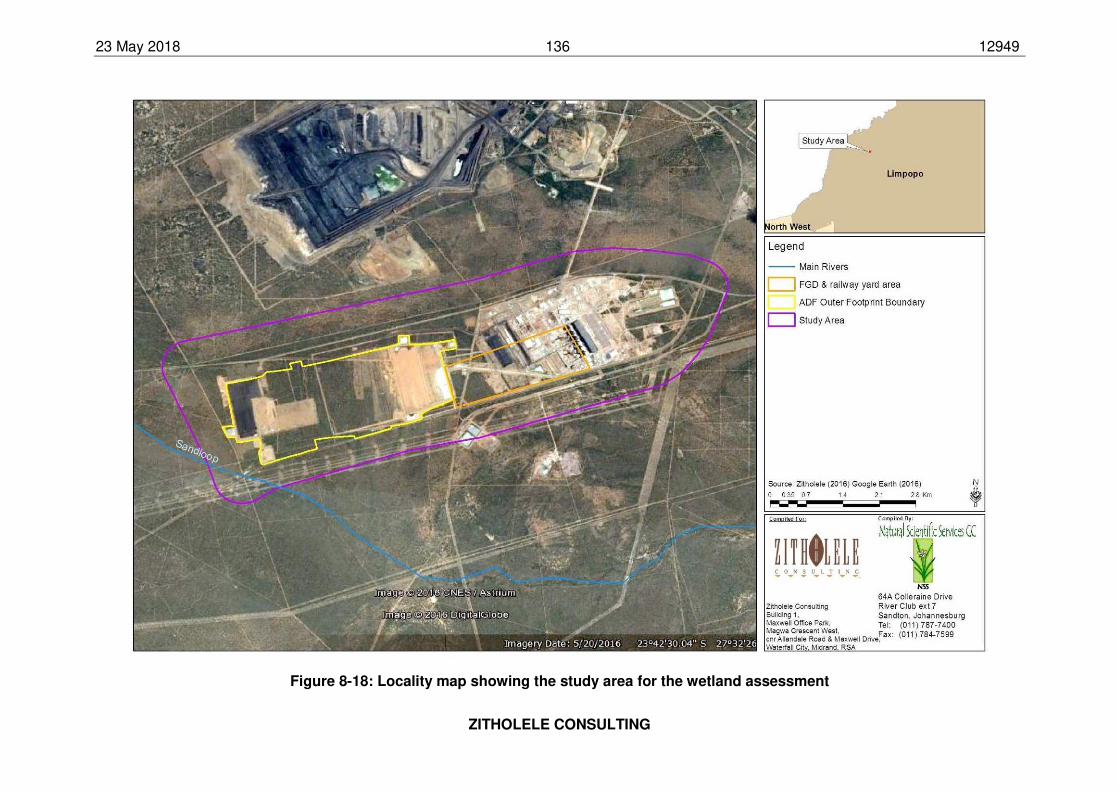
23 May 2018 136 12949
ZITHOLELE CONSULTING
Figure 8-18: Locality map showing the study area for the wetland assessment
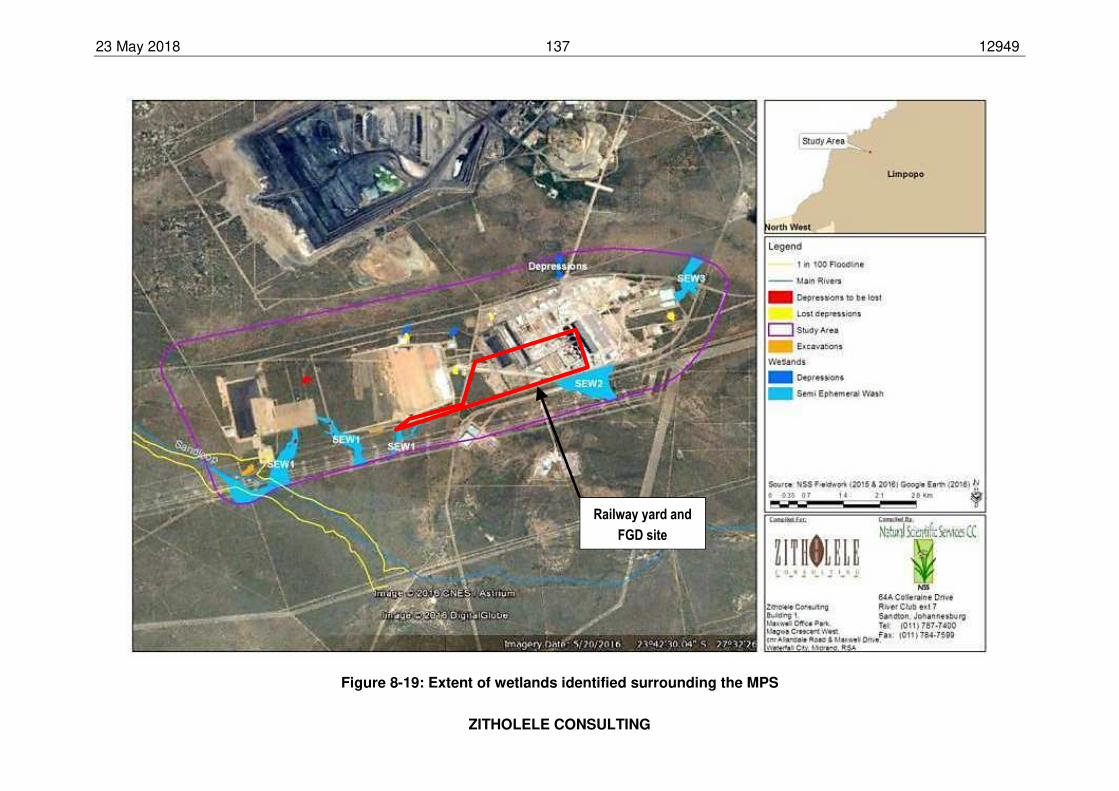
23 May 2018 137 12949
ZITHOLELE CONSULTING
Figure 8-19: Extent of wetlands identified surrounding the MPS
Railway yard and
FGD site
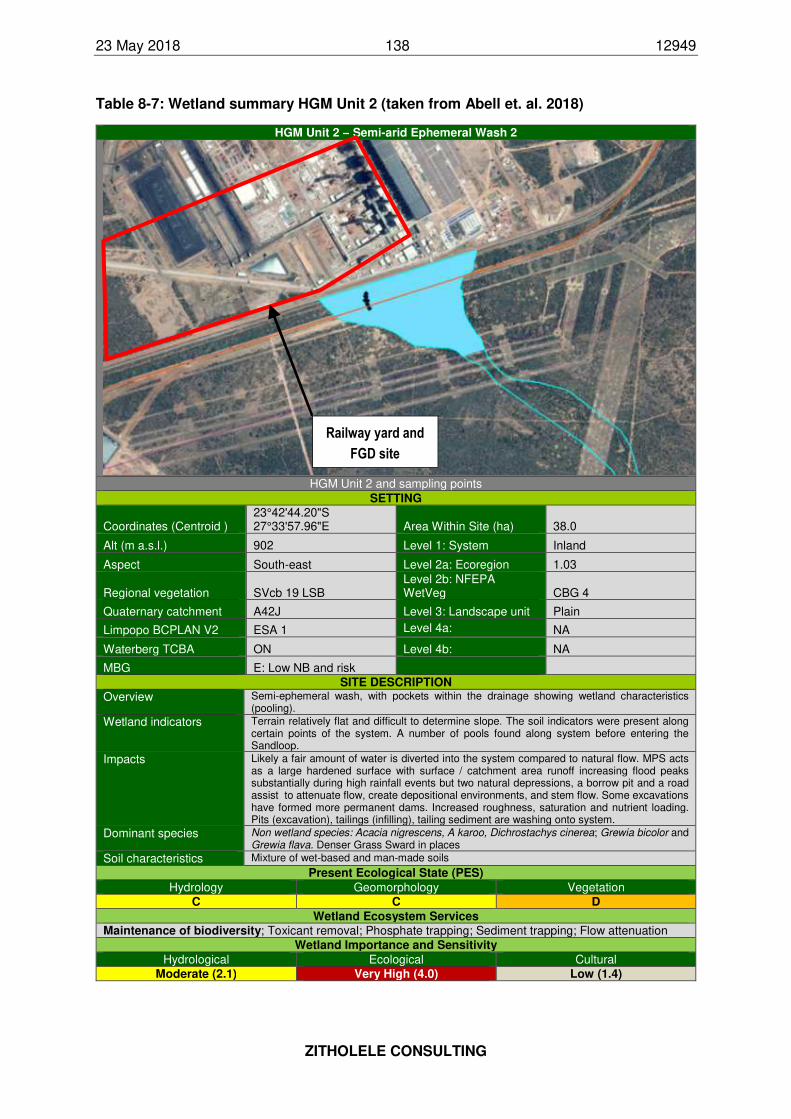
23 May 2018 138 12949
ZITHOLELE CONSULTING
Table 8-7: Wetland summary HGM Unit 2 (taken from Abell et. al. 2018)
HGM Unit 2 – Semi-arid Ephemeral Wash 2
HGM Unit 2 and sampling points SETTING
Coordinates (Centroid ) 23°42'44.20"S 27°33'57.96"E Area Within Site (ha) 38.0
Alt (m a.s.l.) 902 Level 1: System Inland
Aspect South-east Level 2a: Ecoregion 1.03
Regional vegetation SVcb 19 LSB Level 2b: NFEPA WetVeg CBG 4
Quaternary catchment A42J Level 3: Landscape unit Plain
Limpopo BCPLAN V2 ESA 1 Level 4a: NA
Waterberg TCBA ON Level 4b: NA
MBG E: Low NB and risk SITE DESCRIPTION
Overview Semi-ephemeral wash, with pockets within the drainage showing wetland characteristics (pooling).
Wetland indicators Terrain relatively flat and difficult to determine slope. The soil indicators were present along certain points of the system. A number of pools found along system before entering the Sandloop.
Impacts Likely a fair amount of water is diverted into the system compared to natural flow. MPS acts as a large hardened surface with surface / catchment area runoff increasing flood peaks substantially during high rainfall events but two natural depressions, a borrow pit and a road assist to attenuate flow, create depositional environments, and stem flow. Some excavations have formed more permanent dams. Increased roughness, saturation and nutrient loading. Pits (excavation), tailings (infilling), tailing sediment are washing onto system.
Dominant species Non wetland species: Acacia nigrescens, A karoo, Dichrostachys cinerea; Grewia bicolor and Grewia flava. Denser Grass Sward in places
Soil characteristics Mixture of wet-based and man-made soils
Present Ecological State (PES)
Hydrology Geomorphology Vegetation C C D
Wetland Ecosystem Services Maintenance of biodiversity; Toxicant removal; Phosphate trapping; Sediment trapping; Flow attenuation
Wetland Importance and Sensitivity
Hydrological Ecological Cultural Moderate (2.1) Very High (4.0) Low (1.4)
Railway yard and
FGD site
23 May 2018 139 12949
ZITHOLELE CONSULTING
8.7 Air Quality
Information relating to the air quality within the proposed study area was obtained from the Air
Quality Specialist Report undertaken by Airshed Planning Professionals (von Gruenewaldt, et
al., 2018), including literature sited within these study report. This specialist study report is
included in Appendix G-6 to this FEIR.
In the evaluation of air emissions and ambient air quality impacts reference is made to National
Ambient Air Quality Standards (NAAQS) for compliance. These standards generally apply
only to a number of common air pollutants, collectively known as criteria pollutants. Criteria
pollutants typically include SO2, NO2, carbon monoxide (CO), inhalable particulate matter,
(including Thoracic particulate matter with an aerodynamic diameter of equal to or less than
10 µm (PM10) and Inhalable particulate matter with an aerodynamic diameter equal to or less
than 2.5 µm (PM2.5), benzene, ozone and lead. For the proposed Project, pollutants of concern
included SO2, NO2, PM10 and PM2.5 (screened against NAAQS) and metals within the ash
deposition facility (screened against international health effect screening levels).
Regional Air Quality
The DEA identified the potential of an airshed priority area in the vicinity of the Waterberg
District Municipality (Government Gazette, Number 33600; 8 October 2010). This was later
expanded to include the Bojanala Platinum District Municipality, North-West Province
(Government Gazette, Number 34631; 30 September 2011) and the Waterberg-Bojanala
Priority Area (WBPA) was officially declared on 15th June 2012 (Government Gazette,
Number 35435). The Medupi Power Station therefore falls within the Waterberg-Bojanala
Priority Area.
The WBPA Air Quality Management Plan: Baseline Characterisation was released for public
comment on the 7th August 2014 (SAAQIS, 2014, access date: 2014-08-21). This Baseline
Characterisation reported that power generation activities contribute 95% of SO2, 93% of NO2
and 68% of the particulate emissions across the Waterberg District Municipality.
Air Quality at a local scale
Existing sources of atmospheric emissions which occur in the vicinity of the proposed
development sites include:
• Matimba Power Station and its associated ash dump;
• Coal mining operations (such as Grootegeluk coal mine situated just north of the MPS);
• Brickworks operating at Farm Hanglip;
• Household fuel combustion;
• Potential veld fires (infrequent);
• Sewage works (Farm Nelsonskop);
• Windblown dust from open areas and agricultural activities;
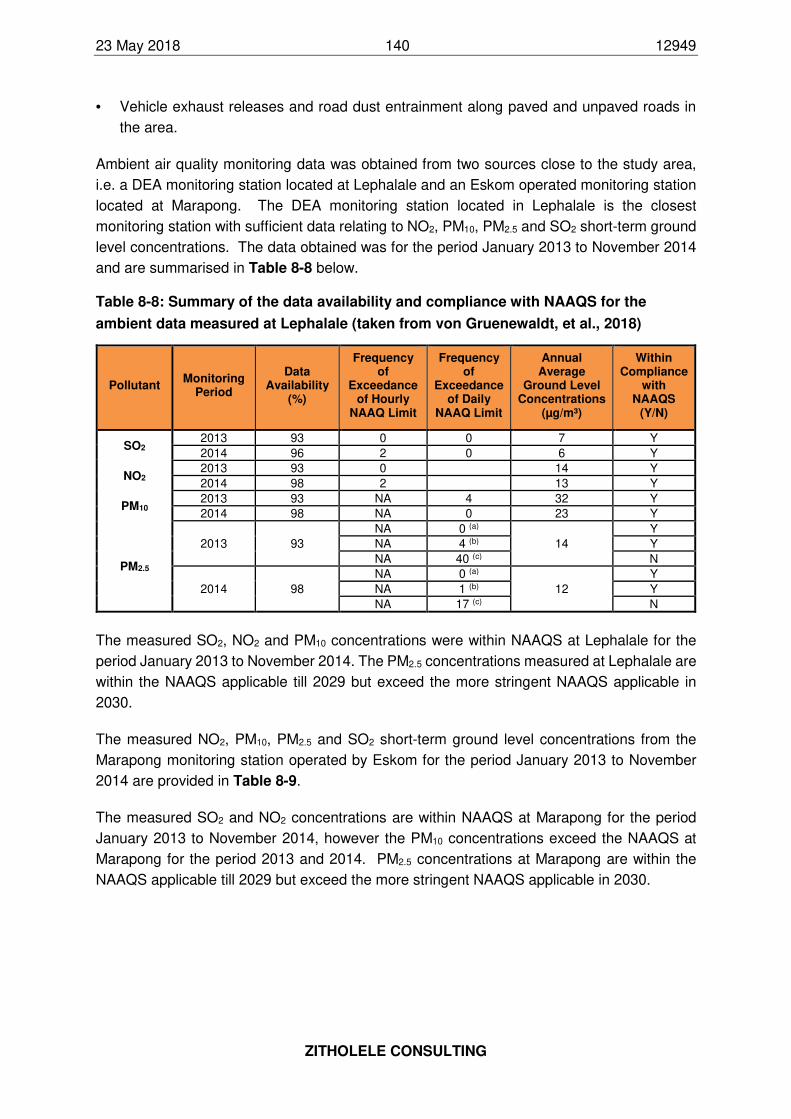
23 May 2018 140 12949
ZITHOLELE CONSULTING
• Vehicle exhaust releases and road dust entrainment along paved and unpaved roads in
the area.
Ambient air quality monitoring data was obtained from two sources close to the study area,
i.e. a DEA monitoring station located at Lephalale and an Eskom operated monitoring station
located at Marapong. The DEA monitoring station located in Lephalale is the closest
monitoring station with sufficient data relating to NO2, PM10, PM2.5 and SO2 short-term ground
level concentrations. The data obtained was for the period January 2013 to November 2014
and are summarised in Table 8-8 below.
Table 8-8: Summary of the data availability and compliance with NAAQS for the
ambient data measured at Lephalale (taken from von Gruenewaldt, et al., 2018)
Pollutant Monitoring
Period
Data Availability
(%)
Frequency of
Exceedance of Hourly
NAAQ Limit
Frequency of
Exceedance of Daily
NAAQ Limit
Annual Average
Ground Level Concentrations
(µg/m³)
Within Compliance
with NAAQS
(Y/N)
SO2 2013 93 0 0 7 Y
2014 96 2 0 6 Y
NO2 2013 93 0 14 Y
2014 98 2 13 Y
PM10 2013 93 NA 4 32 Y
2014 98 NA 0 23 Y
PM2.5
2013 93
NA 0 (a)
14
Y
NA 4 (b) Y
NA 40 (c) N
2014 98
NA 0 (a)
12
Y
NA 1 (b) Y
NA 17 (c) N
The measured SO2, NO2 and PM10 concentrations were within NAAQS at Lephalale for the
period January 2013 to November 2014. The PM2.5 concentrations measured at Lephalale are
within the NAAQS applicable till 2029 but exceed the more stringent NAAQS applicable in
2030.
The measured NO2, PM10, PM2.5 and SO2 short-term ground level concentrations from the
Marapong monitoring station operated by Eskom for the period January 2013 to November
2014 are provided in Table 8-9.
The measured SO2 and NO2 concentrations are within NAAQS at Marapong for the period
January 2013 to November 2014, however the PM10 concentrations exceed the NAAQS at
Marapong for the period 2013 and 2014. PM2.5 concentrations at Marapong are within the
NAAQS applicable till 2029 but exceed the more stringent NAAQS applicable in 2030.
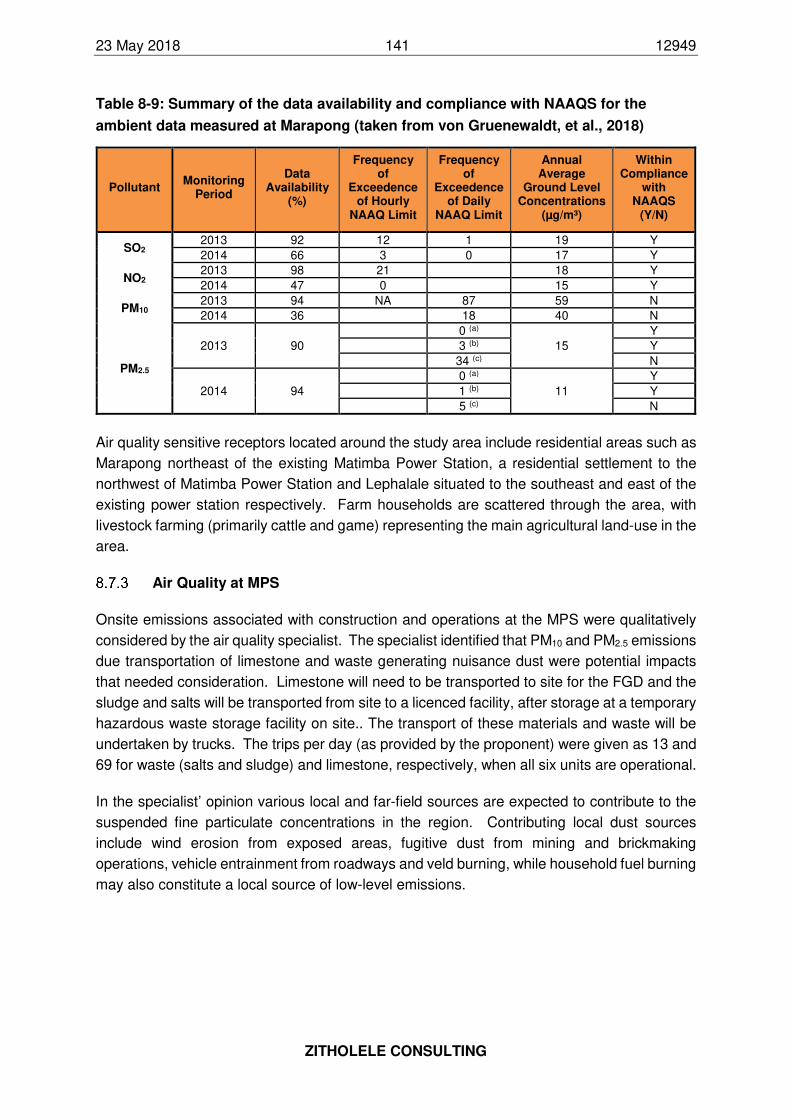
23 May 2018 141 12949
ZITHOLELE CONSULTING
Table 8-9: Summary of the data availability and compliance with NAAQS for the
ambient data measured at Marapong (taken from von Gruenewaldt, et al., 2018)
Pollutant Monitoring
Period
Data Availability
(%)
Frequency of
Exceedence of Hourly
NAAQ Limit
Frequency of
Exceedence of Daily
NAAQ Limit
Annual Average
Ground Level Concentrations
(µg/m³)
Within Compliance
with NAAQS
(Y/N)
SO2 2013 92 12 1 19 Y
2014 66 3 0 17 Y
NO2 2013 98 21 18 Y
2014 47 0 15 Y
PM10 2013 94 NA 87 59 N
2014 36 18 40 N
PM2.5
2013 90
0 (a)
15
Y
3 (b) Y
34 (c) N
2014 94
0 (a)
11
Y
1 (b) Y
5 (c) N
Air quality sensitive receptors located around the study area include residential areas such as
Marapong northeast of the existing Matimba Power Station, a residential settlement to the
northwest of Matimba Power Station and Lephalale situated to the southeast and east of the
existing power station respectively. Farm households are scattered through the area, with
livestock farming (primarily cattle and game) representing the main agricultural land-use in the
area.
Air Quality at MPS
Onsite emissions associated with construction and operations at the MPS were qualitatively
considered by the air quality specialist. The specialist identified that PM10 and PM2.5 emissions
due transportation of limestone and waste generating nuisance dust were potential impacts
that needed consideration. Limestone will need to be transported to site for the FGD and the
sludge and salts will be transported from site to a licenced facility, after storage at a temporary
hazardous waste storage facility on site.. The transport of these materials and waste will be
undertaken by trucks. The trips per day (as provided by the proponent) were given as 13 and
69 for waste (salts and sludge) and limestone, respectively, when all six units are operational.
In the specialist’ opinion various local and far-field sources are expected to contribute to the
suspended fine particulate concentrations in the region. Contributing local dust sources
include wind erosion from exposed areas, fugitive dust from mining and brickmaking
operations, vehicle entrainment from roadways and veld burning, while household fuel burning
may also constitute a local source of low-level emissions.
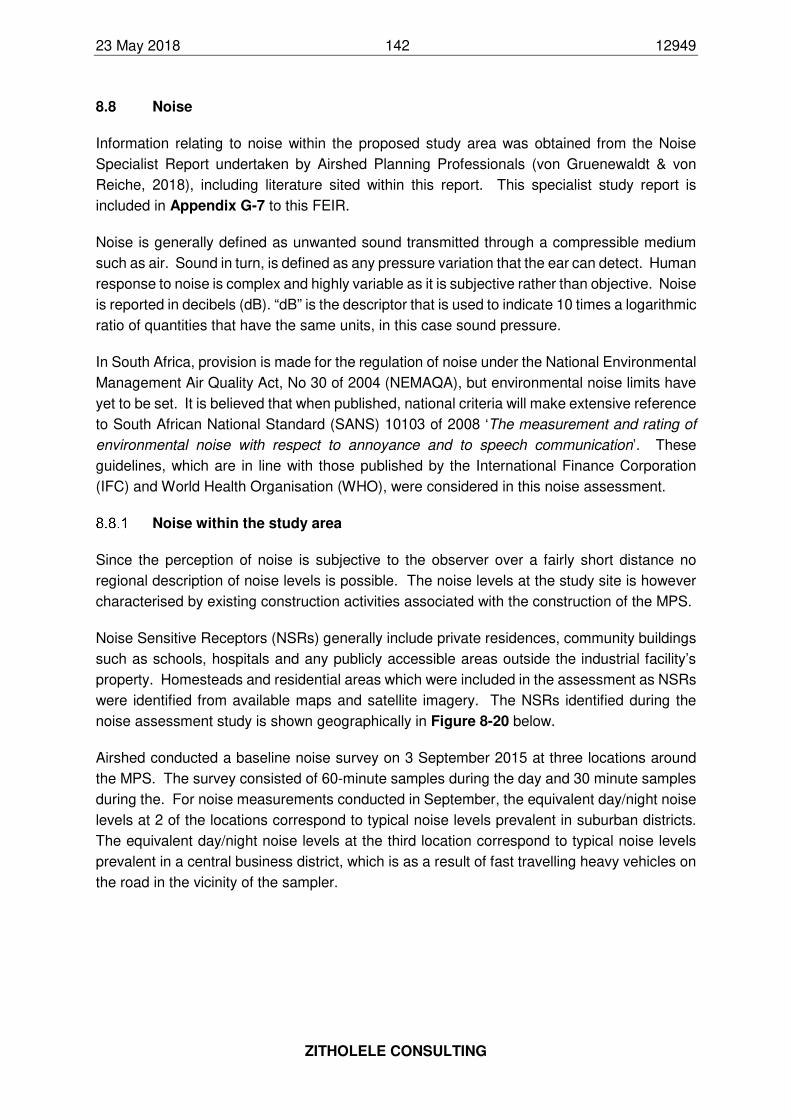
23 May 2018 142 12949
ZITHOLELE CONSULTING
8.8 Noise
Information relating to noise within the proposed study area was obtained from the Noise
Specialist Report undertaken by Airshed Planning Professionals (von Gruenewaldt & von
Reiche, 2018), including literature sited within this report. This specialist study report is
included in Appendix G-7 to this FEIR.
Noise is generally defined as unwanted sound transmitted through a compressible medium
such as air. Sound in turn, is defined as any pressure variation that the ear can detect. Human
response to noise is complex and highly variable as it is subjective rather than objective. Noise
is reported in decibels (dB). “dB” is the descriptor that is used to indicate 10 times a logarithmic
ratio of quantities that have the same units, in this case sound pressure.
In South Africa, provision is made for the regulation of noise under the National Environmental
Management Air Quality Act, No 30 of 2004 (NEMAQA), but environmental noise limits have
yet to be set. It is believed that when published, national criteria will make extensive reference
to South African National Standard (SANS) 10103 of 2008 ‘The measurement and rating of
environmental noise with respect to annoyance and to speech communication’. These
guidelines, which are in line with those published by the International Finance Corporation
(IFC) and World Health Organisation (WHO), were considered in this noise assessment.
Noise within the study area
Since the perception of noise is subjective to the observer over a fairly short distance no
regional description of noise levels is possible. The noise levels at the study site is however
characterised by existing construction activities associated with the construction of the MPS.
Noise Sensitive Receptors (NSRs) generally include private residences, community buildings
such as schools, hospitals and any publicly accessible areas outside the industrial facility’s
property. Homesteads and residential areas which were included in the assessment as NSRs
were identified from available maps and satellite imagery. The NSRs identified during the
noise assessment study is shown geographically in Figure 8-20 below.
Airshed conducted a baseline noise survey on 3 September 2015 at three locations around
the MPS. The survey consisted of 60-minute samples during the day and 30 minute samples
during the. For noise measurements conducted in September, the equivalent day/night noise
levels at 2 of the locations correspond to typical noise levels prevalent in suburban districts.
The equivalent day/night noise levels at the third location correspond to typical noise levels
prevalent in a central business district, which is as a result of fast travelling heavy vehicles on
the road in the vicinity of the sampler.
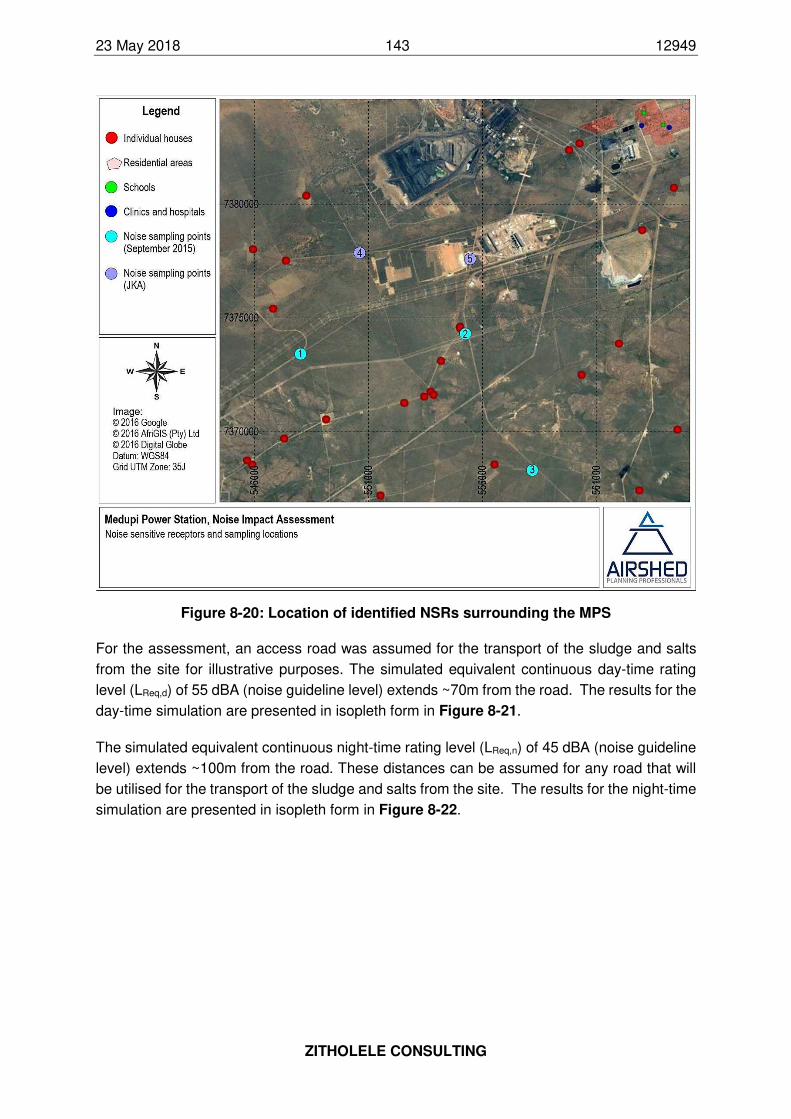
23 May 2018 143 12949
ZITHOLELE CONSULTING
Figure 8-20: Location of identified NSRs surrounding the MPS
For the assessment, an access road was assumed for the transport of the sludge and salts
from the site for illustrative purposes. The simulated equivalent continuous day-time rating
level (LReq,d) of 55 dBA (noise guideline level) extends ~70m from the road. The results for the
day-time simulation are presented in isopleth form in Figure 8-21.
The simulated equivalent continuous night-time rating level (LReq,n) of 45 dBA (noise guideline
level) extends ~100m from the road. These distances can be assumed for any road that will
be utilised for the transport of the sludge and salts from the site. The results for the night-time
simulation are presented in isopleth form in Figure 8-22.
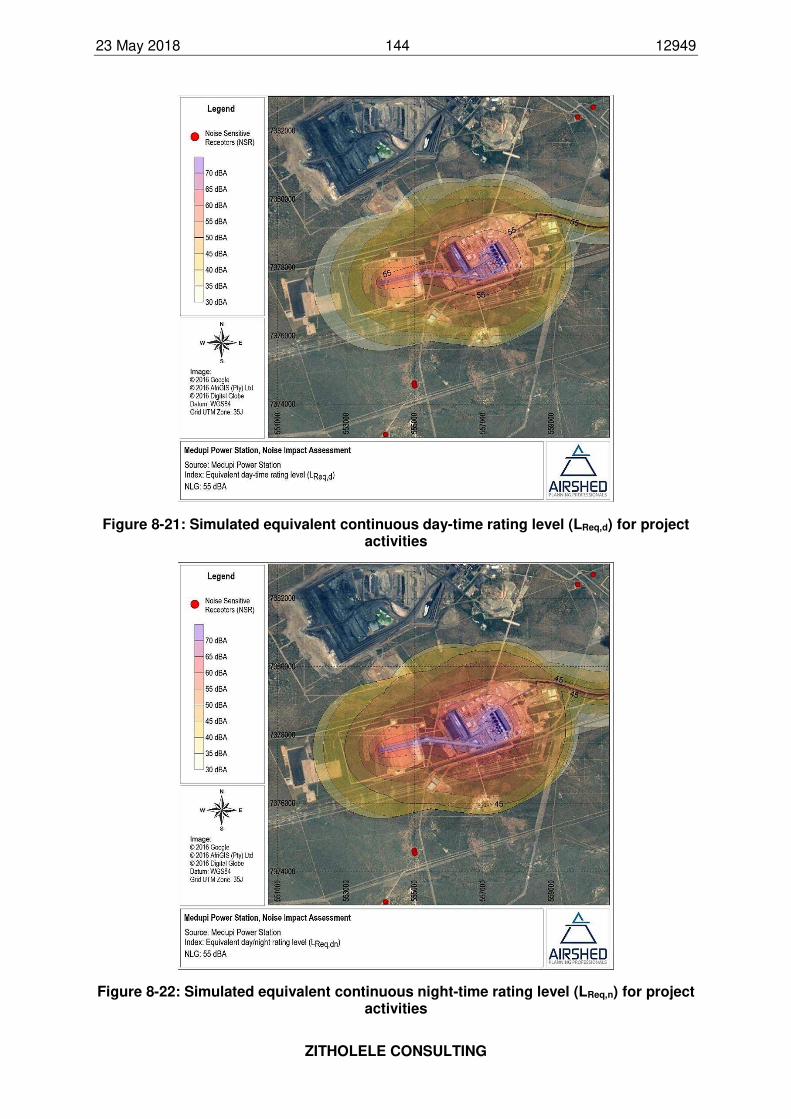
23 May 2018 144 12949
ZITHOLELE CONSULTING
Figure 8-21: Simulated equivalent continuous day-time rating level (LReq,d) for project activities
Figure 8-22: Simulated equivalent continuous night-time rating level (LReq,n) for project activities
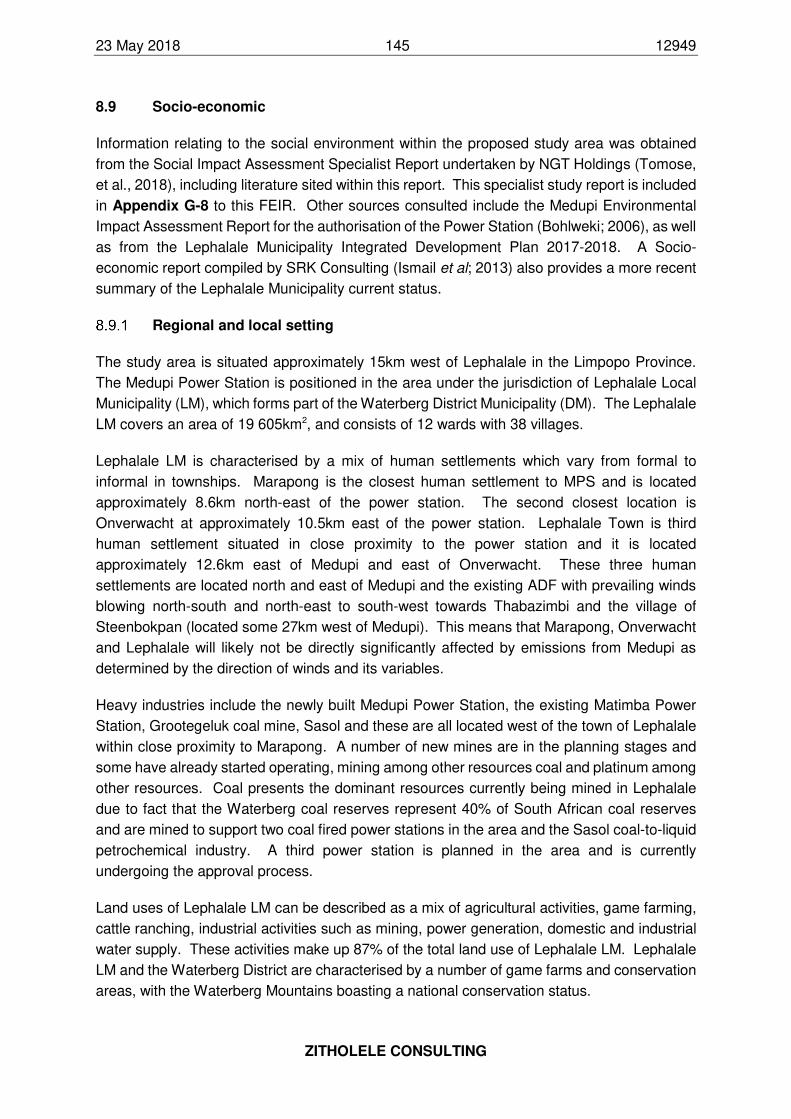
23 May 2018 145 12949
ZITHOLELE CONSULTING
8.9 Socio-economic
Information relating to the social environment within the proposed study area was obtained
from the Social Impact Assessment Specialist Report undertaken by NGT Holdings (Tomose,
et al., 2018), including literature sited within this report. This specialist study report is included
in Appendix G-8 to this FEIR. Other sources consulted include the Medupi Environmental
Impact Assessment Report for the authorisation of the Power Station (Bohlweki; 2006), as well
as from the Lephalale Municipality Integrated Development Plan 2017-2018. A Socio-
economic report compiled by SRK Consulting (Ismail et al; 2013) also provides a more recent
summary of the Lephalale Municipality current status.
Regional and local setting
The study area is situated approximately 15km west of Lephalale in the Limpopo Province.
The Medupi Power Station is positioned in the area under the jurisdiction of Lephalale Local
Municipality (LM), which forms part of the Waterberg District Municipality (DM). The Lephalale
LM covers an area of 19 605km2, and consists of 12 wards with 38 villages.
Lephalale LM is characterised by a mix of human settlements which vary from formal to
informal in townships. Marapong is the closest human settlement to MPS and is located
approximately 8.6km north-east of the power station. The second closest location is
Onverwacht at approximately 10.5km east of the power station. Lephalale Town is third
human settlement situated in close proximity to the power station and it is located
approximately 12.6km east of Medupi and east of Onverwacht. These three human
settlements are located north and east of Medupi and the existing ADF with prevailing winds
blowing north-south and north-east to south-west towards Thabazimbi and the village of
Steenbokpan (located some 27km west of Medupi). This means that Marapong, Onverwacht
and Lephalale will likely not be directly significantly affected by emissions from Medupi as
determined by the direction of winds and its variables.
Heavy industries include the newly built Medupi Power Station, the existing Matimba Power
Station, Grootegeluk coal mine, Sasol and these are all located west of the town of Lephalale
within close proximity to Marapong. A number of new mines are in the planning stages and
some have already started operating, mining among other resources coal and platinum among
other resources. Coal presents the dominant resources currently being mined in Lephalale
due to fact that the Waterberg coal reserves represent 40% of South African coal reserves
and are mined to support two coal fired power stations in the area and the Sasol coal-to-liquid
petrochemical industry. A third power station is planned in the area and is currently
undergoing the approval process.
Land uses of Lephalale LM can be described as a mix of agricultural activities, game farming,
cattle ranching, industrial activities such as mining, power generation, domestic and industrial
water supply. These activities make up 87% of the total land use of Lephalale LM. Lephalale
LM and the Waterberg District are characterised by a number of game farms and conservation
areas, with the Waterberg Mountains boasting a national conservation status.
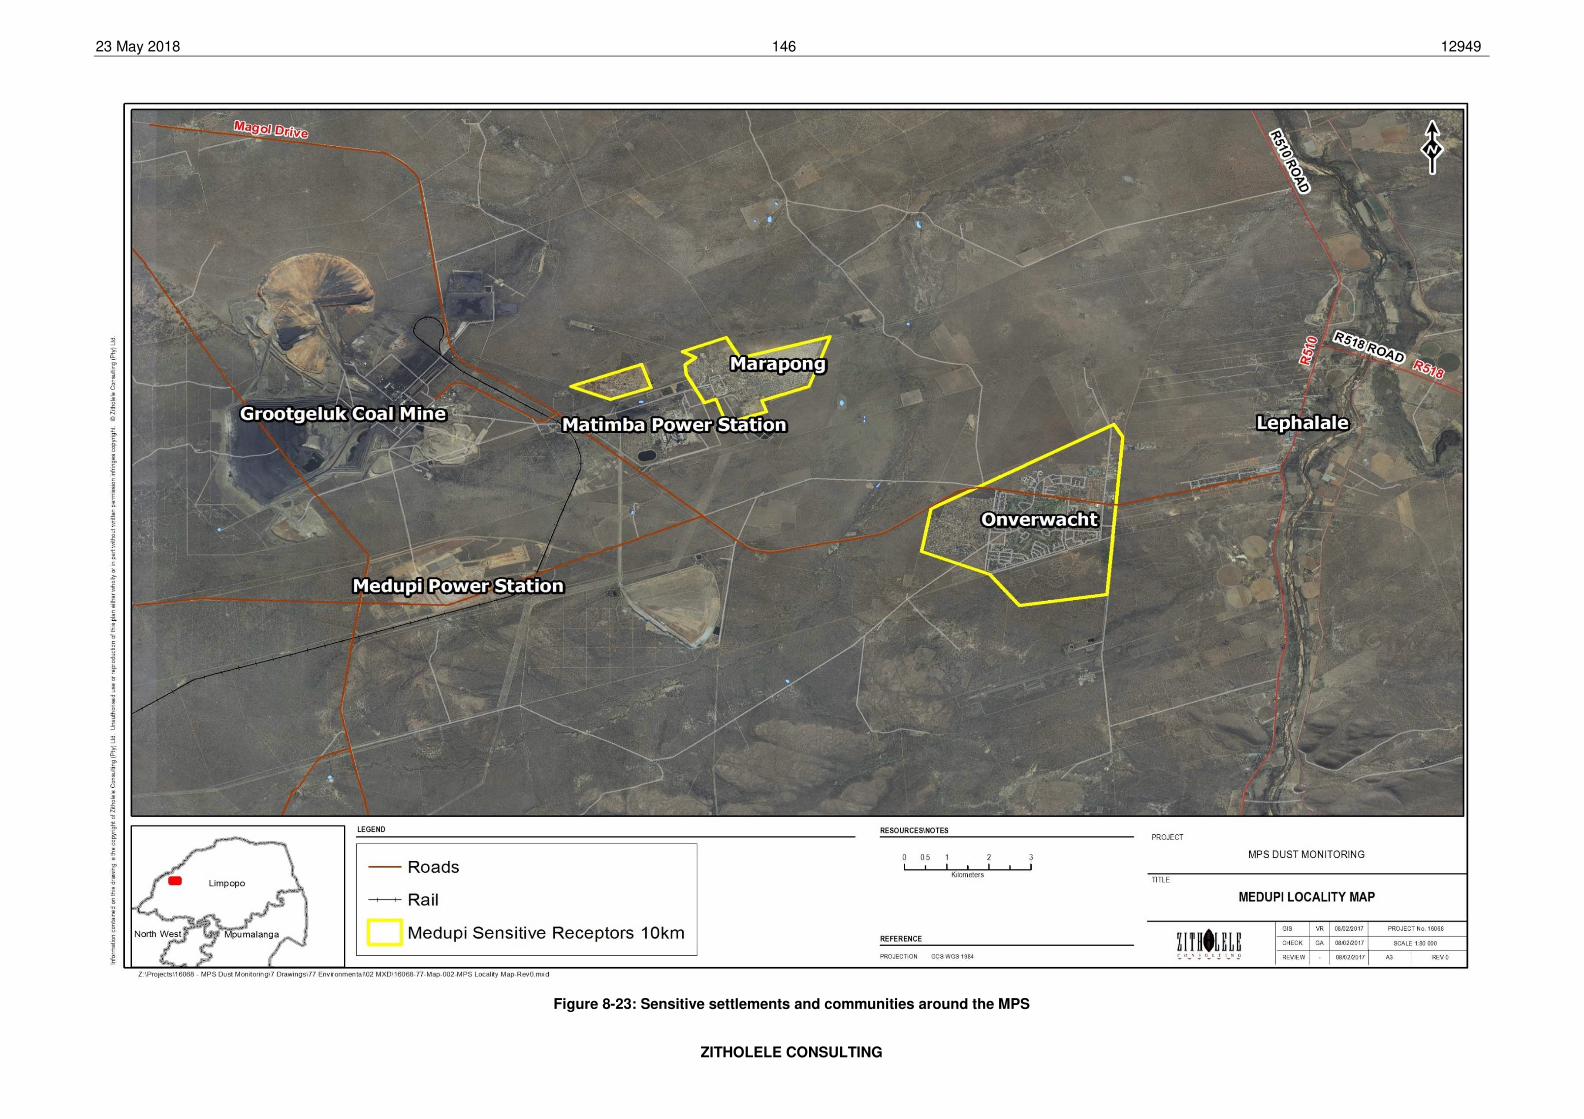
23 May 2018 146 12949
ZITHOLELE CONSULTING
Figure 8-23: Sensitive settlements and communities around the MPS
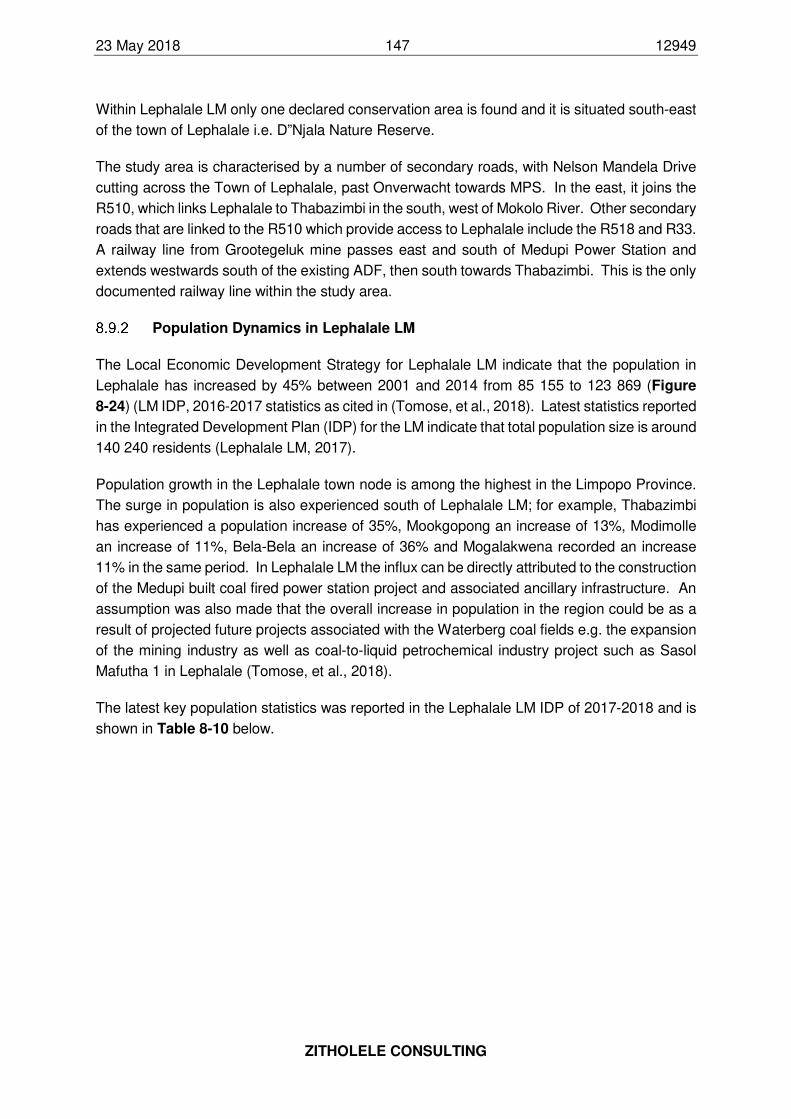
23 May 2018 147 12949
ZITHOLELE CONSULTING
Within Lephalale LM only one declared conservation area is found and it is situated south-east
of the town of Lephalale i.e. D”Njala Nature Reserve.
The study area is characterised by a number of secondary roads, with Nelson Mandela Drive
cutting across the Town of Lephalale, past Onverwacht towards MPS. In the east, it joins the
R510, which links Lephalale to Thabazimbi in the south, west of Mokolo River. Other secondary
roads that are linked to the R510 which provide access to Lephalale include the R518 and R33.
A railway line from Grootegeluk mine passes east and south of Medupi Power Station and
extends westwards south of the existing ADF, then south towards Thabazimbi. This is the only
documented railway line within the study area.
Population Dynamics in Lephalale LM
The Local Economic Development Strategy for Lephalale LM indicate that the population in
Lephalale has increased by 45% between 2001 and 2014 from 85 155 to 123 869 (Figure
8-24) (LM IDP, 2016-2017 statistics as cited in (Tomose, et al., 2018). Latest statistics reported
in the Integrated Development Plan (IDP) for the LM indicate that total population size is around
140 240 residents (Lephalale LM, 2017).
Population growth in the Lephalale town node is among the highest in the Limpopo Province.
The surge in population is also experienced south of Lephalale LM; for example, Thabazimbi
has experienced a population increase of 35%, Mookgopong an increase of 13%, Modimolle
an increase of 11%, Bela-Bela an increase of 36% and Mogalakwena recorded an increase
11% in the same period. In Lephalale LM the influx can be directly attributed to the construction
of the Medupi built coal fired power station project and associated ancillary infrastructure. An
assumption was also made that the overall increase in population in the region could be as a
result of projected future projects associated with the Waterberg coal fields e.g. the expansion
of the mining industry as well as coal-to-liquid petrochemical industry project such as Sasol
Mafutha 1 in Lephalale (Tomose, et al., 2018).
The latest key population statistics was reported in the Lephalale LM IDP of 2017-2018 and is
shown in Table 8-10 below.
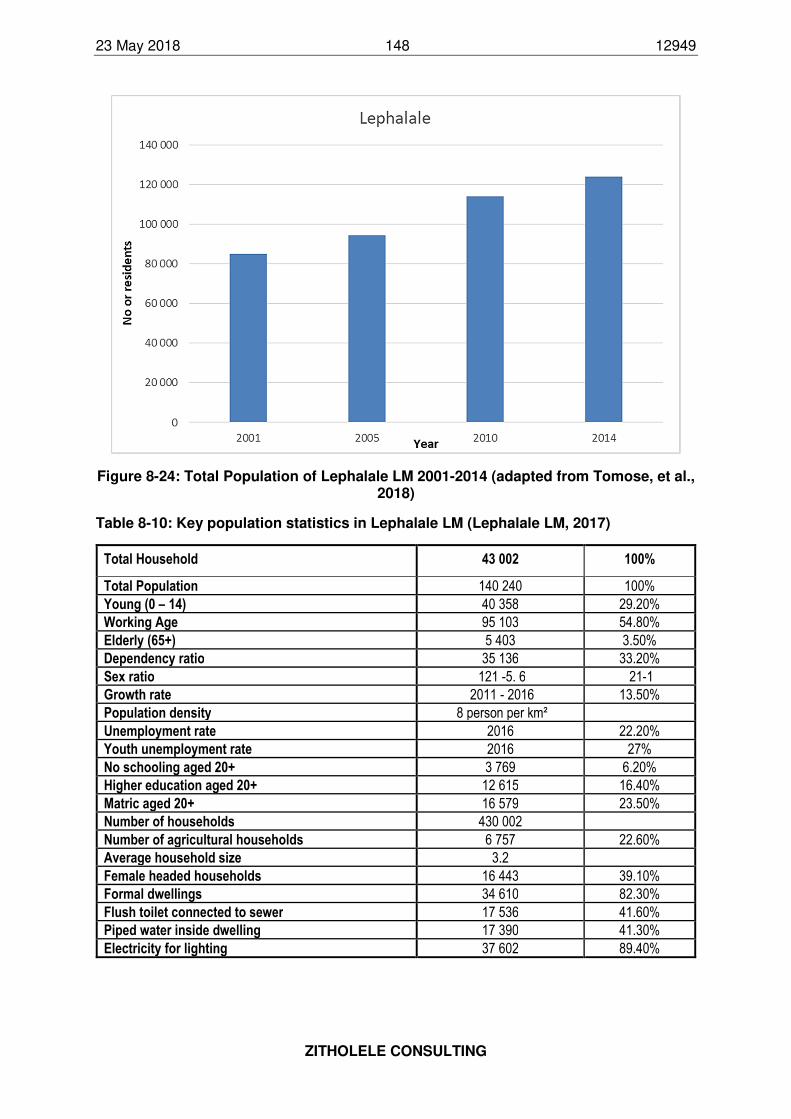
23 May 2018 148 12949
ZITHOLELE CONSULTING
Figure 8-24: Total Population of Lephalale LM 2001-2014 (adapted from Tomose, et al., 2018)
Table 8-10: Key population statistics in Lephalale LM (Lephalale LM, 2017)
Total Household 43 002 100%
Total Population 140 240 100%
Young (0 – 14) 40 358 29.20%
Working Age 95 103 54.80%
Elderly (65+) 5 403 3.50%
Dependency ratio 35 136 33.20%
Sex ratio 121 -5. 6 21-1
Growth rate 2011 - 2016 13.50%
Population density 8 person per km²
Unemployment rate 2016 22.20%
Youth unemployment rate 2016 27%
No schooling aged 20+ 3 769 6.20%
Higher education aged 20+ 12 615 16.40%
Matric aged 20+ 16 579 23.50%
Number of households 430 002
Number of agricultural households 6 757 22.60%
Average household size 3.2
Female headed households 16 443 39.10%
Formal dwellings 34 610 82.30%
Flush toilet connected to sewer 17 536 41.60%
Piped water inside dwelling 17 390 41.30%
Electricity for lighting 37 602 89.40%
23 May 2018 149 12949
ZITHOLELE CONSULTING
Education and Skills Levels in Lephalale LM
Lephalale LM has a total of 94 various educational facilities spread throughout the
municipality. According to the LM’s IDP report (2015-2016), more than 95% of the population
is within 30 minutes walking distance to the nearest education facility. Accessibility to schools
in the rural areas is relatively good particularly for primary schools. This is not the case with
regards to secondary schools as there are still students who stay more than 10km away from
the nearest education facility. Access to secondary education has resulted in low numbers of
pupils proceeding to tertiary education. The assumption is made that this could be as the
result of learners being despondent of traveling long distance to go to school and the cost of
public transport resulting in absenteeism and poor learner performance at the end of the year
prohibiting them to proceed further with their education.
In terms of overall performance, the LM seems to be slightly higher than the Waterberg DM
and Limpopo Province in terms of education levels but not sufficient to respond to the needs
of the growing economy such as that of Lephalale. Statistics on level of education within the
Lehpalale LM, Waterberg DM and Limpopo Province is presented in Figure 8-25.
Figure 8-25: Education levels within the Lephalale LM, Waterberg DM and Limpopo Province (taken from Tomose, et al., 2018)
Community Health and Wellness in Lephalale LM
The World Health Organisation (WHO) in 2012 reported that one in eight deaths in the world
is due to air pollution. The pollution is either ambient (outdoor) or indoor. WHO further
concluded that 88% of premature deaths in middle and low income countries whose economy
is coal based to ambient pollution. South Africa is one of such countries whose economy is
coal based economy.
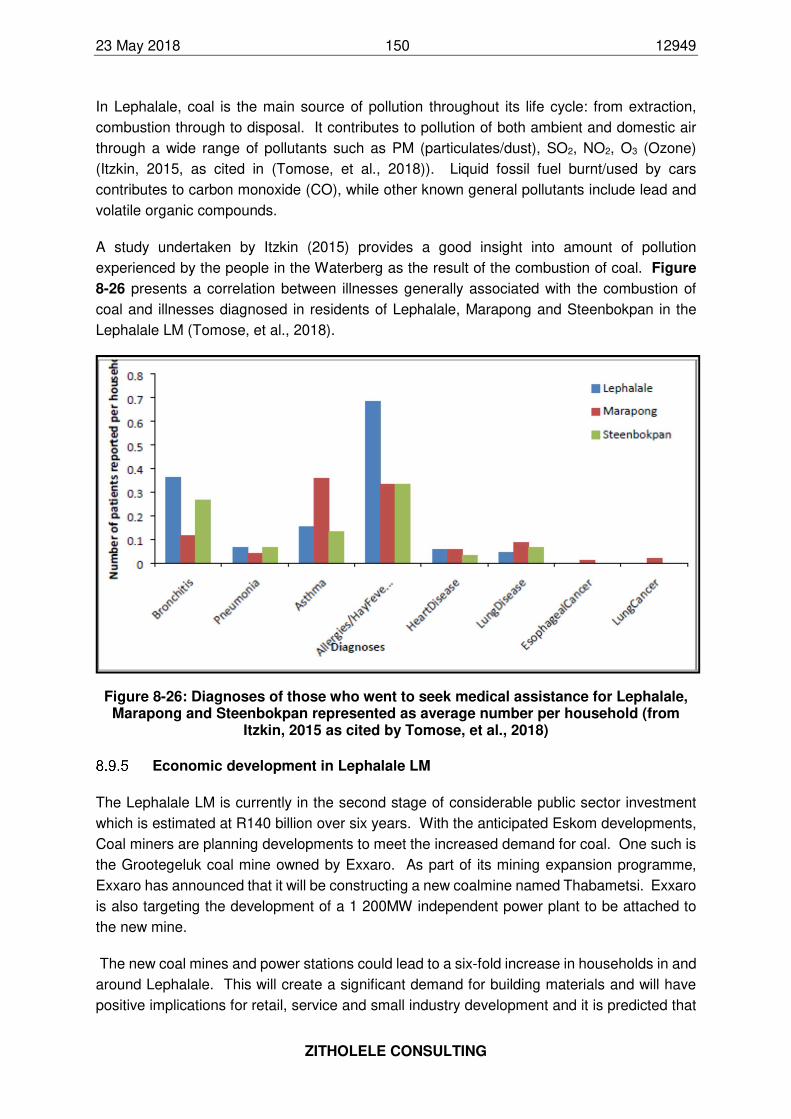
23 May 2018 150 12949
ZITHOLELE CONSULTING
In Lephalale, coal is the main source of pollution throughout its life cycle: from extraction,
combustion through to disposal. It contributes to pollution of both ambient and domestic air
through a wide range of pollutants such as PM (particulates/dust), SO2, NO2, O3 (Ozone)
(Itzkin, 2015, as cited in (Tomose, et al., 2018)). Liquid fossil fuel burnt/used by cars
contributes to carbon monoxide (CO), while other known general pollutants include lead and
volatile organic compounds.
A study undertaken by Itzkin (2015) provides a good insight into amount of pollution
experienced by the people in the Waterberg as the result of the combustion of coal. Figure
8-26 presents a correlation between illnesses generally associated with the combustion of
coal and illnesses diagnosed in residents of Lephalale, Marapong and Steenbokpan in the
Lephalale LM (Tomose, et al., 2018).
Figure 8-26: Diagnoses of those who went to seek medical assistance for Lephalale, Marapong and Steenbokpan represented as average number per household (from
Itzkin, 2015 as cited by Tomose, et al., 2018)
Economic development in Lephalale LM
The Lephalale LM is currently in the second stage of considerable public sector investment
which is estimated at R140 billion over six years. With the anticipated Eskom developments,
Coal miners are planning developments to meet the increased demand for coal. One such is
the Grootegeluk coal mine owned by Exxaro. As part of its mining expansion programme,
Exxaro has announced that it will be constructing a new coalmine named Thabametsi. Exxaro
is also targeting the development of a 1 200MW independent power plant to be attached to
the new mine.
The new coal mines and power stations could lead to a six-fold increase in households in and
around Lephalale. This will create a significant demand for building materials and will have
positive implications for retail, service and small industry development and it is predicted that
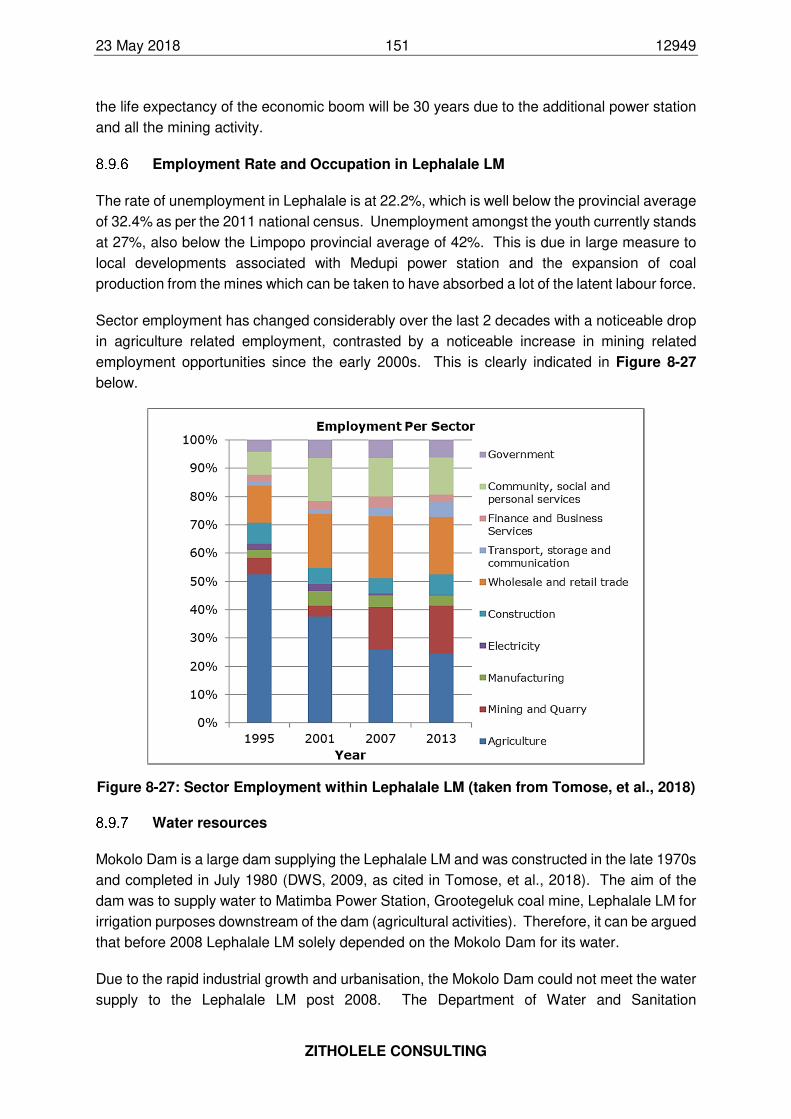
23 May 2018 151 12949
ZITHOLELE CONSULTING
the life expectancy of the economic boom will be 30 years due to the additional power station
and all the mining activity.
Employment Rate and Occupation in Lephalale LM
The rate of unemployment in Lephalale is at 22.2%, which is well below the provincial average
of 32.4% as per the 2011 national census. Unemployment amongst the youth currently stands
at 27%, also below the Limpopo provincial average of 42%. This is due in large measure to
local developments associated with Medupi power station and the expansion of coal
production from the mines which can be taken to have absorbed a lot of the latent labour force.
Sector employment has changed considerably over the last 2 decades with a noticeable drop
in agriculture related employment, contrasted by a noticeable increase in mining related
employment opportunities since the early 2000s. This is clearly indicated in Figure 8-27
below.
Figure 8-27: Sector Employment within Lephalale LM (taken from Tomose, et al., 2018)
Water resources
Mokolo Dam is a large dam supplying the Lephalale LM and was constructed in the late 1970s
and completed in July 1980 (DWS, 2009, as cited in Tomose, et al., 2018). The aim of the
dam was to supply water to Matimba Power Station, Grootegeluk coal mine, Lephalale LM for
irrigation purposes downstream of the dam (agricultural activities). Therefore, it can be argued
that before 2008 Lephalale LM solely depended on the Mokolo Dam for its water.
Due to the rapid industrial growth and urbanisation, the Mokolo Dam could not meet the water
supply to the Lephalale LM post 2008. The Department of Water and Sanitation

23 May 2018 152 12949
ZITHOLELE CONSULTING
commissioned the Mokolo Crocodile (West) Water Argumentation Project (MCWAP) to meet
future water demands in Lephalale LM. MCWAP was staged into two phases, namely Phase
1 and Phase 2.
Phase 1 (augmentation of existing water supplies) aimed at providing drinking quality water to
industries and municipality and Phase 2 (transferring the surplus effluent return flow from the
Crocodile River (West) / Marico WMA) aimed at providing low quality water to industries.
Among the known stakeholders who participated in the project and who require water in the
area for current and future needs are the Lephalale LM, Eskom (Matimba, Medupi + 4 coal
fired power stations), IPPs, Grootegeluk Mine (coal mining), Exxaro Projects and Sasol
(Mafutha 1).
Ninety two (92%) percent of water infrastructure in the Municipality is over 20 years old, while
sixteen percent (16%) of the water service system has been identified as being in poor to very
poor condition. Additional challenges that are faced around water infrastructure include:
• Poor borehole yields in rural areas.
• Bulk water services in urban areas have reached full utilization.
• Illegal connections in rural areas.
• Lack of accountability to water losses.
• Limited availability of ground water in rural areas.
• Low quality of drinking water in rural areas.
Sanitation services
Sanitation is another social service that is directly linked to the availability of water resources.
The assessment of this infrastructure within the project area around Medupi power station has
found that 94% of waterborne sanitation infrastructure in the municipality is over 20 years old.
About 15% of the sanitation network had been identified as being in very poor condition. The
assets have experienced significant deterioration and may be experience impairment in
functionality and will require renewal and upgrading (Lephalale Local Municipality, 2014, as
cited in Tomose, et al., 2018).
Problems noted around the question of sanitation are that there is a need to redesign the
existing sewer networks in Lephalale Town and Onverwacht to reduce the number of pump
stations. Further, the area does not have sufficient water resources and infrastructure to
accommodate a waterborne sanitation system for all households. More than 50% of
households in the municipality are without hygienic toilets (Table 8-11). Sanitation backlog is
estimated to be 14 250 units, mostly in the farms and rural village. Other than what will be
distributed by the Phase 2 MCWAP, there is no clear indication on what percentage of low
quality (effluent) water will be derived from the existing Lephalale LM sanitary infrastructure.
23 May 2018 153 12949
ZITHOLELE CONSULTING
Table 8-11: Sanitation within the Lephalale LM (taken from Tomose, et al., 2018)
Type of Toilet
1995 2001 2007 2013
No of household
% No of
household %
No of household
% No of
household %
Flush or chemical toilet
6,367 33% 9,190 45% 12,119 44% 13,784 45%
Pit latrine 9,647 50% 11,240 54% 12,723 46% 14,435 47%
Below RDP 3,384 17% 207 1% 2,835 10% 2,518 8%
Total 19,397 100% 20,638 100% 27,677 100% 30,737 100%
8.10 Heritage, Archaeology and Palaeontology
Information relating to the heritage, archaeological and palaeontological resources within the
proposed study area was obtained from the Heritage Impact Assessment Specialist Report
(Tomose & Sutton, 2018) and Palaeontological Impact Assessment Specialist Report
(Tomose & Bamford, 2018) undertaken by NGT Holdings, including literature sited within this
report. This Heritage and Archaeological Assessment specialist report is included in
Appendix G-9, while the Palaeontological Assessment specialist report is included in
Appendix G-10 to this FEIR.
South African cultural heritage extends as far back as 2.0 million years ago (mya) in the form
of Stone Age artefacts that represent some of the earliest tool types found. The South African
archaeological record covers all the Stone Age periods, Iron Age periods and more recent
historical periods. This rich cultural heritage also includes culturally significant places on the
landscape that became important to the many varied groups of people that once lived here
and whose descendants continue to live here.
Regional heritage, archaeological and palaeontological setting
There have been recorded scattered finds of Stone Age sites, rock paintings and engravings
in the larger region. Most of the Stone Age sites can be classified as open (surface) sites
which imply that most of the artefacts occur in secondary context. There are a number of
known Stone Age sites in the Limpopo Province.
Southeast of the study area, but less than 150km away, is Makapansgat. This site complex
includes the Makapansgat Lime Works site which has yielded fossils dated to greater than 4.0
mya. The Lime Works has also yielded hominin fossils of Australopithecus Africanus (Tobias,
1973; Reed et al., 1993, as cited in Tomose & Sutton, 2018). Adjacent to the Lime Works is
Cave of Hearths. This site has one of the longest sequences of occupation in southern Africa,
yielding Early Stone Age (ESA) tools beyond 300k years old up to Later Stone Age artefacts.
Southwest in the Waterberg Plateau area a number of Middle Stone Age (MSA) and Late
Stone Age (LSA) sites have been identified.

23 May 2018 154 12949
ZITHOLELE CONSULTING
A large (9,000ha) survey undertaken northwest of the current area identified a number of MSA
sites. The scatters of artefacts were primarily located in the calcrete pans of the area. They
identified the technological attributes of the stone tools to a post-Howiesons Poort industry
that falls <70k years ago. However, no formal sites or sites within primary context were noted.
One Rock Art site has been noted in the area. Nelsonskop, near Lephalale contains
engravings and cut markings on the rock face (van Schalkwyk, 2005, as cited in Tomose &
Sutton, 2018).
Further west in Limpopo along the Makgabeng Plateau there is a higher density of Iron Age
evidence. The region has yielded pottery of the Eiland style that falls in the late Early Iron
Age. The Eiland facies is contemporary with one of the more important Limpopo Iron Age
sites, Mapungubwe.
A number of heritage assessment reports have been conducted in the wider area that reflects
varying degrees of heritage present. While these reports did not cover the current project
footprint, areas around the project have been surveyed.
Heritage, archaeological and palaeontological resources within the study site
Known archaeological resources within the MPS footprint include Stone Age occurrences,
Rock Art, Iron Age occupations and historical activity. The Phase II HIA study of the MPS
footprint conducted by Mbofho Consulting and Project Managers has resulted to information
that has been used to construct the receiving environment showing areas known to have
contained graves. These are graves that according to the local communities were destructed
with the construction of Medupi PS and the associated infrastructure.
The study undertaken by Tomose & Sutton (2018) did not result to the identification of any
heritage resources. A survey of the existing ADF footprint and the Medupi precinct in which
the FGD technology and the proposed railway yard is to be constructed was undertaken by
Nkosinathi Tomose in January 2018. The proposed development area for the construction of
the FGD technology and the proposed railway yard has been significantly transformed through
previous construction activities. For example, the foundations for the FGD technology are
within an area that was deeply excavated during the construction of the Medupi PS six units.
The proposed railway yard is within an area where there has been disturbances associated
with Medupi PS associated infrastructure such as storm water management systems, the
existing ADF and site roads.
A potential grave site, however, was identified outside of the current project footprint for the
railway yard and FGD infrastructure, but could potentially be impacted by additional
construction and expansion of the area. This grave is situated between the Medupi Power
Station and the existing ADF (Figure 8-28). A summary of the possible grave site is provided
in Table 8-12 below. From Figure 8-28 it is clear that the possible grave site is located outside
the proposed footprint for the railway yard (green triangular shape), conveyor alignment
(yellow shape) and FGD infrastructure (blue shape) within the MPS.
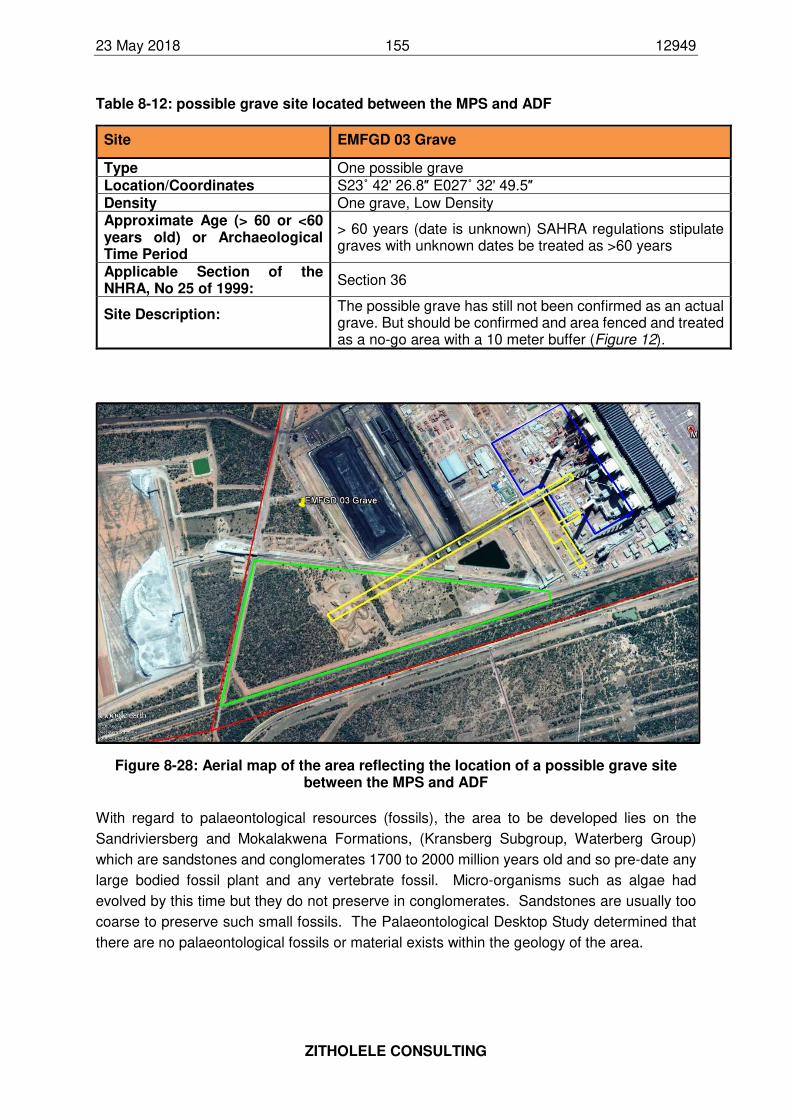
23 May 2018 155 12949
ZITHOLELE CONSULTING
Table 8-12: possible grave site located between the MPS and ADF
Site EMFGD 03 Grave
Type One possible grave Location/Coordinates S23˚ 42' 26.8″ E027˚ 32' 49.5″ Density One grave, Low Density Approximate Age (> 60 or <60 years old) or Archaeological Time Period
> 60 years (date is unknown) SAHRA regulations stipulate graves with unknown dates be treated as >60 years
Applicable Section of the NHRA, No 25 of 1999:
Section 36
Site Description:
The possible grave has still not been confirmed as an actual grave. But should be confirmed and area fenced and treated as a no-go area with a 10 meter buffer (Figure 12).
Figure 8-28: Aerial map of the area reflecting the location of a possible grave site between the MPS and ADF
With regard to palaeontological resources (fossils), the area to be developed lies on the
Sandriviersberg and Mokalakwena Formations, (Kransberg Subgroup, Waterberg Group)
which are sandstones and conglomerates 1700 to 2000 million years old and so pre-date any
large bodied fossil plant and any vertebrate fossil. Micro-organisms such as algae had
evolved by this time but they do not preserve in conglomerates. Sandstones are usually too
coarse to preserve such small fossils. The Palaeontological Desktop Study determined that
there are no palaeontological fossils or material exists within the geology of the area.
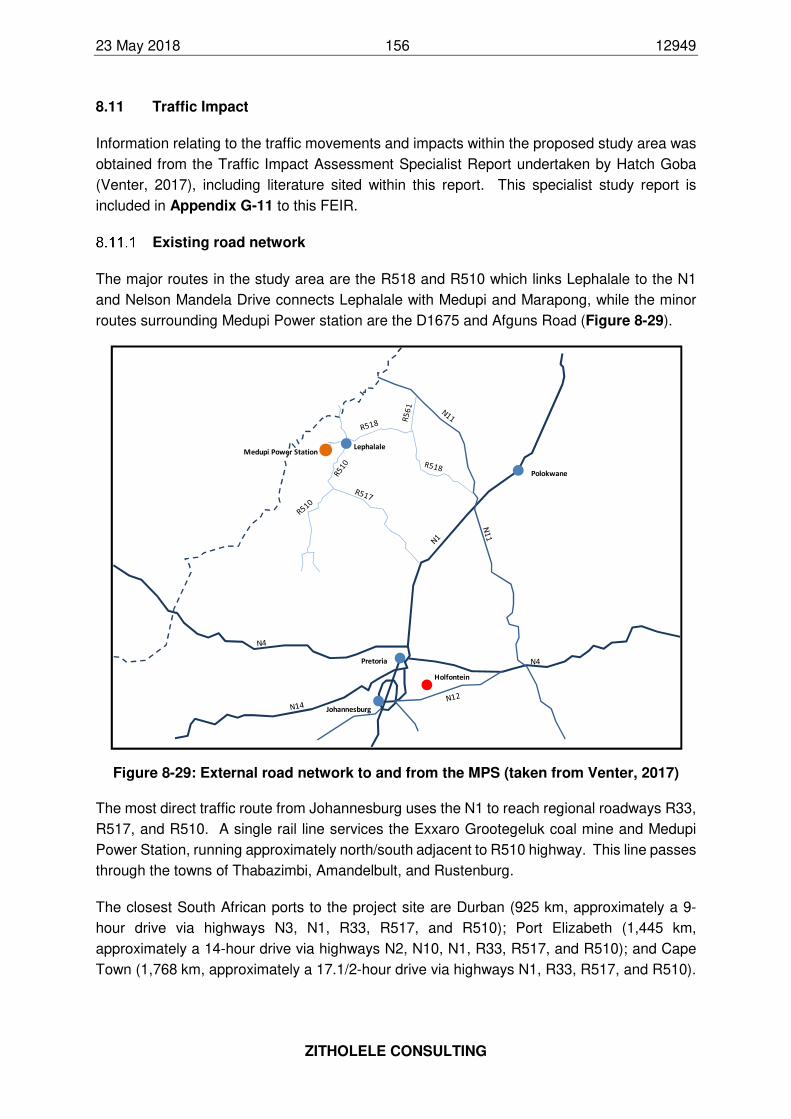
23 May 2018 156 12949
ZITHOLELE CONSULTING
8.11 Traffic Impact
Information relating to the traffic movements and impacts within the proposed study area was
obtained from the Traffic Impact Assessment Specialist Report undertaken by Hatch Goba
(Venter, 2017), including literature sited within this report. This specialist study report is
included in Appendix G-11 to this FEIR.
Existing road network
The major routes in the study area are the R518 and R510 which links Lephalale to the N1
and Nelson Mandela Drive connects Lephalale with Medupi and Marapong, while the minor
routes surrounding Medupi Power station are the D1675 and Afguns Road (Figure 8-29).
Figure 8-29: External road network to and from the MPS (taken from Venter, 2017)
The most direct traffic route from Johannesburg uses the N1 to reach regional roadways R33,
R517, and R510. A single rail line services the Exxaro Grootegeluk coal mine and Medupi
Power Station, running approximately north/south adjacent to R510 highway. This line passes
through the towns of Thabazimbi, Amandelbult, and Rustenburg.
The closest South African ports to the project site are Durban (925 km, approximately a 9-
hour drive via highways N3, N1, R33, R517, and R510); Port Elizabeth (1,445 km,
approximately a 14-hour drive via highways N2, N10, N1, R33, R517, and R510); and Cape
Town (1,768 km, approximately a 17.1/2-hour drive via highways N1, R33, R517, and R510).
Medupi Power Station
Polokwane
Pretoria
Johannesburg
N4
Lephalale
Holfontein
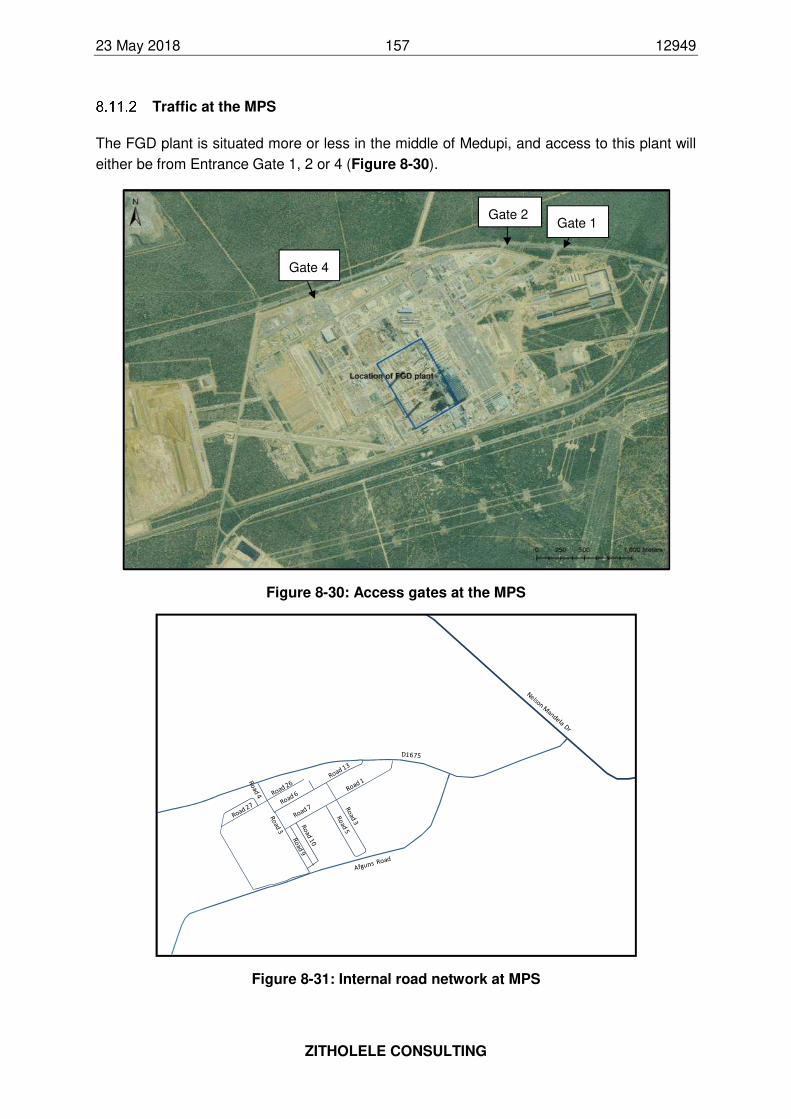
23 May 2018 157 12949
ZITHOLELE CONSULTING
Traffic at the MPS
The FGD plant is situated more or less in the middle of Medupi, and access to this plant will
either be from Entrance Gate 1, 2 or 4 (Figure 8-30).
Figure 8-30: Access gates at the MPS
Figure 8-31: Internal road network at MPS
Gate 1 Gate 2
Gate 4
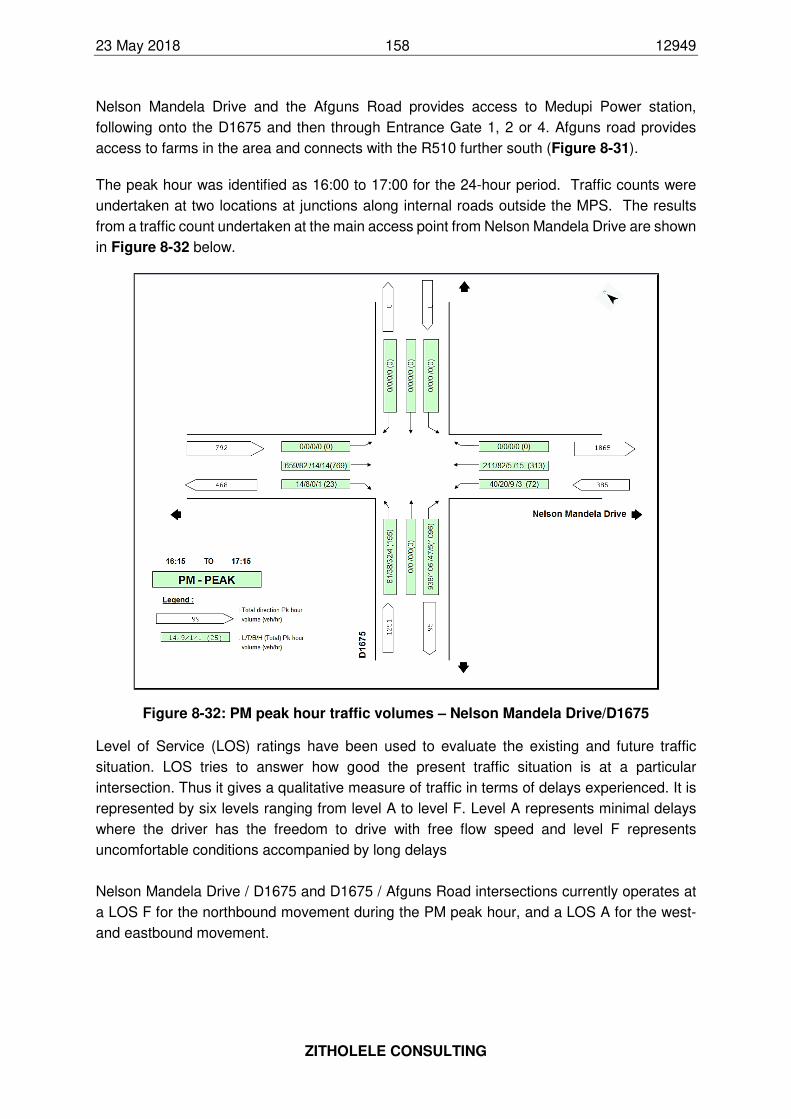
23 May 2018 158 12949
ZITHOLELE CONSULTING
Nelson Mandela Drive and the Afguns Road provides access to Medupi Power station,
following onto the D1675 and then through Entrance Gate 1, 2 or 4. Afguns road provides
access to farms in the area and connects with the R510 further south (Figure 8-31).
The peak hour was identified as 16:00 to 17:00 for the 24-hour period. Traffic counts were
undertaken at two locations at junctions along internal roads outside the MPS. The results
from a traffic count undertaken at the main access point from Nelson Mandela Drive are shown
in Figure 8-32 below.
Figure 8-32: PM peak hour traffic volumes – Nelson Mandela Drive/D1675
Level of Service (LOS) ratings have been used to evaluate the existing and future traffic
situation. LOS tries to answer how good the present traffic situation is at a particular
intersection. Thus it gives a qualitative measure of traffic in terms of delays experienced. It is
represented by six levels ranging from level A to level F. Level A represents minimal delays
where the driver has the freedom to drive with free flow speed and level F represents
uncomfortable conditions accompanied by long delays
Nelson Mandela Drive / D1675 and D1675 / Afguns Road intersections currently operates at
a LOS F for the northbound movement during the PM peak hour, and a LOS A for the west-
and eastbound movement.

23 May 2018 159 12949
ZITHOLELE CONSULTING
This indicates that it operates well within capacity for the priority movement, but the vehicles
coming from Medupi Power Station and Afguns road, wanting to turn into Nelson Mandela
Drive are struggling to find a gap and long delays are experienced by motorists.
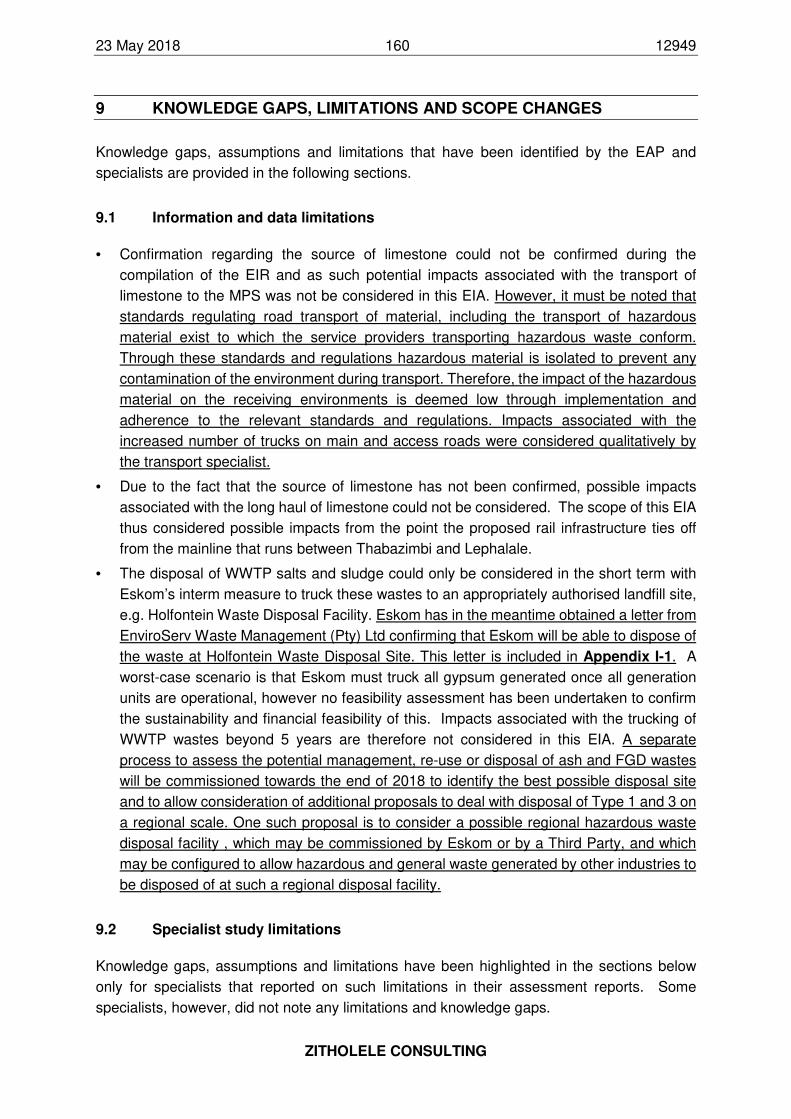
23 May 2018 160 12949
ZITHOLELE CONSULTING
9 KNOWLEDGE GAPS, LIMITATIONS AND SCOPE CHANGES
Knowledge gaps, assumptions and limitations that have been identified by the EAP and
specialists are provided in the following sections.
9.1 Information and data limitations
• Confirmation regarding the source of limestone could not be confirmed during the
compilation of the EIR and as such potential impacts associated with the transport of
limestone to the MPS was not be considered in this EIA. However, it must be noted that
standards regulating road transport of material, including the transport of hazardous
material exist to which the service providers transporting hazardous waste conform.
Through these standards and regulations hazardous material is isolated to prevent any
contamination of the environment during transport. Therefore, the impact of the hazardous
material on the receiving environments is deemed low through implementation and
adherence to the relevant standards and regulations. Impacts associated with the
increased number of trucks on main and access roads were considered qualitatively by
the transport specialist.
• Due to the fact that the source of limestone has not been confirmed, possible impacts
associated with the long haul of limestone could not be considered. The scope of this EIA
thus considered possible impacts from the point the proposed rail infrastructure ties off
from the mainline that runs between Thabazimbi and Lephalale.
• The disposal of WWTP salts and sludge could only be considered in the short term with
Eskom’s interm measure to truck these wastes to an appropriately authorised landfill site,
e.g. Holfontein Waste Disposal Facility. Eskom has in the meantime obtained a letter from
EnviroServ Waste Management (Pty) Ltd confirming that Eskom will be able to dispose of
the waste at Holfontein Waste Disposal Site. This letter is included in Appendix I-1. A
worst-case scenario is that Eskom must truck all gypsum generated once all generation
units are operational, however no feasibility assessment has been undertaken to confirm
the sustainability and financial feasibility of this. Impacts associated with the trucking of
WWTP wastes beyond 5 years are therefore not considered in this EIA. A separate
process to assess the potential management, re-use or disposal of ash and FGD wastes
will be commissioned towards the end of 2018 to identify the best possible disposal site
and to allow consideration of additional proposals to deal with disposal of Type 1 and 3 on
a regional scale. One such proposal is to consider a possible regional hazardous waste
disposal facility , which may be commissioned by Eskom or by a Third Party, and which
may be configured to allow hazardous and general waste generated by other industries to
be disposed of at such a regional disposal facility.
9.2 Specialist study limitations
Knowledge gaps, assumptions and limitations have been highlighted in the sections below
only for specialists that reported on such limitations in their assessment reports. Some
specialists, however, did not note any limitations and knowledge gaps.
23 May 2018 161 12949
ZITHOLELE CONSULTING
Groundwater Assessment
The following groundwater information gaps were identified:
• Additional groundwater information may be required for the existing licensed disposal
facility;
• The only available aquifer parameters were defined by Groundwater Complete (2017) on
five existing monitoring boreholes and at Medupi Power station during 2008 (IGS) and
2009 (Golder). More site specific aquifer parameters are required to the north and west of
the existing licensed disposal facility. Hydraulic conductivity (k) and Transmissivity (T) are
values that indicate the rate at which groundwater flows in the subsurface. These aquifer
parameters can be highly variable in the aquifers systems due to the different geological
unit’s sandstone, shale, clay, mudstone and coal and geological conditions (faults, dykes,
sills, and weathering) that apply. These hydraulic parameters are essential to understand
and update the conceptual model and form the basis for estimating potential contaminant
migration rates. These are calculated from borehole testing results.
Surface Water Impact Assessment
The following limitations and assumptions have been made in this specialist study:
• No flow and rainfall data against which the runoff calculations might be calibrated were
available. The runoff volumes were therefore calculated theoretically;
• Since there is very limited flow data available for a precise estimation of the roughness
coefficients, the Manning’s ‘n’ coefficients were estimated by comparing the vegetation
and nature of the channel surfaces to published data (Webber, 1971, as cited in (Sithole
& Jordaan, 2018), therefore slightly conservative estimations were adopted.
• With regard to the specialist opinion provide for trucking of salts and sludge, the nature of
materials being transported, the mode of transportation, the route chosen for
transportation, and the distance over which the materials are transported were of most
significance in assessing the potential surface water impacts;
• The assumption was furthermore made that the transportation route does intersect with
surface water resources;
Biodiversity (Terrestrial Ecology) and Wetlands
The following limitations and assumptions have been made in this specialist study:
• It is important to note that the absence of species on site does not conclude that the
species is not present at the site. Reasons for not finding certain species during the
different visits (all conducted in mid-summer) may be due to:
o The fragmented nature of the remaining natural vegetation within the boundary of the
Medupi Power Station FGD Project area.
23 May 2018 162 12949
ZITHOLELE CONSULTING
o The duration of fieldwork and the period at which rainfall events took place. I.e. while
the December 2015 fieldwork took place during a heavy rainfall period – this was
beneficial for faunal species. Floral species require some growth time after such
events.
o Some plant species, which are small, have short flowering times, rare or otherwise
difficult to detect may not have been detected even though they were potentially
present on site.
• As an alternative to other vegetation cover methods (such as the Domin method), the
Braun-Blanquet cover-abundance scale was used to analyse vegetation. It is reported that
the Braun-Blanquet method requires only one third to one fifth the field time required to
other similar methods. Furthermore, cover-abundance ratings are better suited than
density values to elucidate graphically species-environment relationships. For extensive
surveys this method provides sufficiently accurate baseline data to allow environmental
impact assessment as required by regulatory agencies. However, there are a couple of
problems that have been detected with such sampling methods. These are as follows:
o It can be seen as subjective and dependent upon the experience and knowledge of
the vegetation type by the surveyor. The cover estimate may vary from observer to
observer.
o There also may be a problem when the cover estimate is very close to two different
classes (on the border so to speak) and then it is for the observer to decide which class
it should be allocated to. In Hurford & Schneider’s (2007) experience, in marginal
situations, where the cover of a species is close to a boundary between two classes,
the chance of two observers allocating the species to the same cover class is no better
than 50:50. However, when comparing to other sampling methods such as Domin,
Braun-Blanquet scale is better adapted for monitoring (less cover classes and fewer
boundaries).
• Several inherent and unavoidable limitations need to be considered when interpreting
survey results. Reasons for the lack of detection of some species include:
o Inductions and security protocol which significantly decreased the amount of time
spent in the study area.
o The small, fragmented nature of the study area, and disturbances from Medupi Power
Station.
o The short duration of each field survey, and the lack of significant rainfall preceding
the January survey.
o The cryptic nature of certain species or simply lack of species presence. Some animal
species, which are uncommon, small, migratory, secretive or otherwise difficult to find

23 May 2018 163 12949
ZITHOLELE CONSULTING
may not have been detected even though they were potentially present in the study
area.
• Even though all attempts were made to take samples under optimal conditions certain
limitations were encountered. The limitations to this study included:
o Wetland assessment techniques are inherently subjective.
o The PES and EcoServices were also not designed for systems such as Ephemeral
Washes
o The boundary determined by infield wetland delineation can often occur within a certain
tolerance because of the potential for the change in gradient of the wetness zones
within wetlands.
o The modification of the soil profile related to agricultural activities and the clearing of
the site and the modification of the hydrological conditions within disturbed sites limits
the accuracy of the resulting boundary as the sampling methodology relies heavily on
interpretation of undisturbed soil morphology and characteristic.
o The use of vegetation indicators (seasonal and temporary zones) was limited to non-
existent due to the ephemeral nature of the systems. Riparian vegetation was even
not evident. Only vegetation structure in comparison to surrounding areas was
conducted.
o Water was limited to sandy pools within the drainage features in the study area.
o None of the biomonitoring indices could be used due to the ephemeral nature of these
systems (Not within this Scope). Instead Invertebrate hatching at two pans in the ADF
site was conducted. Due to time constraints the hatching experiment was allowed to
run for 10 days but it would have been ideal to continue for up to 28 days.
Air Quality
The following limitations and assumptions have been made in this specialist study:
• Emissions emanating from all existing sources in the area were not quantified nor were
resultant ambient air pollutant concentrations due to such sources simulated, with the
exception of the existing Matimba Power Station and its associated ashing operations.
Given that Matimba Power Station is the most significant source of ambient SO2
concentrations in the region, this study limitation is not significant for assessing compliance
and health risk potentials due to SO2. Matimba Power Station is, however, not the major
contributor to ambient fine particulate concentrations. In order to project cumulative
particulate concentrations other significant sources, particularly local mining operation
emissions, would need to be quantified.
• Routine emissions from power station operations were estimated and modelled.
Atmospheric releases occurring as a result of accidents were not accounted for.
23 May 2018 164 12949
ZITHOLELE CONSULTING
• For the current assessment, the assumption was made that the ash and gypsum would be
mixed and disposed of together at the existing disposal facility. The gypsum material on
the disposal facility is expected to provide a crust when mixed with water. To what extent
this material will crust will depend on how the material is disposed (i.e. mixed with the ash
or deposited as layers of gypsum material in between the ash material) and how much
water is added to the disposal facility. The crust may also be disturbed from time to time
with activity on the disposal facility, therefore for the current assessment, the effectiveness
of this crust in lowering windblown emissions could not be quantified.
• Mesoscale Model version 5 (MM5) was used as the “initial guess” field for the CALMET
model. Although two monitoring stations are located within the study area, MM5 could not
be used together with the surface measurements as the Eskom-operated Marapong
station is sited incorrectly providing questionable wind direction and, with one
representative station (South African Weather Service Station located at Lephalale),
CALMET requires 100% data availability which was not present.
• Source parameters and emission rates for these emission scenarios required for input to
the dispersion modelling study were provided by Eskom personnel. The assumption was
made that this information was accurate and correct.
• A constant NH3 background concentration of 20 ppb was used in Calpuff (Scorgie et al,
2006, as cited in (von Gruenewaldt, et al., 2018). Measured ozone data from the Marapong
station was included for the background data required for the chemical transformation
module in Calpuff.
Noise Assessment
The following limitations and assumptions have been made in this specialist study:
• The quantification of sources of noise was restricted to activities associated with the project
scope.
• Shielding effect of infrastructure was not considered in simulations. This approach will
provide a conservative estimate of the estimated sound pressure levels from the project.
• Terrain was not accounted for in this assessment, providing a conservative estimate of
noise levels as no natural shielding is taken into account.
• Source strength calculations were based on theoretical estimates not taking into account
acoustic shielding or mitigation as a conservative estimate.
• The background used for the estimation of cumulative change in noise levels was selected
from measured data points within the study area.
Social Assessment
The following assumptions and limitations are applicable to this study:
• In order to understand the social environment and to predict impacts, complex systems
have to be reduced to simple representations of reality. The experience of impacts is
23 May 2018 165 12949
ZITHOLELE CONSULTING
subjective on what one person may see as a negative impact may not be perceived as
such by another person.
• The study was based on information available to the author during the assessment process
and at the time of compilation of the SIA report.
• In addition to the various drafts of the SIA for the FGD Retrofit Project report compiled by
NGT, information on stakeholders and comments received during the various public
participation meetings for the project was utilised, as is usually the case with SIAs that
form part of the Environmental Impact Assessment (EIA) process. SIAs normally draw
heavily from information gathered during public participation (identified stakeholders as
well as comments received).
• No economic modelling or analysis was done as part of the SIA. Any data relating to the
economic profile of the area was obtained from municipal sources, such as municipality /
provincial websites, Integrated Development Plans (IDPs), Service Delivery and Budget
Implementation Plans (SDBIPs) and census data.
• This report only applies to the Medupi Power Station FGD Retrofit Project, the existing
authorised ADF, the proposed railway yard with its associated infrastructure and it will not
necessarily be accurate for and applicable to similar activities at other sites.
Heritage, Archaeology and Palaeontology
The following assumptions and limitations are applicable to this study:
• Based on the findings made by Mbofho Consulting and Project Managers, NGT cannot
rule out the subterranean burial grounds and graves since in some areas they identified
areas with soil heaps that are reportedly to have been dumped on top of graves. NGT
was not part of this Phase II HIA study conducted on site; it therefore not take full
responsibility or liability for any issues that were raised and addressed in this report other
than to make reference to it as an important document to consider in dealing with heritage
issues at Medupi PS. may be addressed by the current heritage social consultation on site.
Traffic Assessment
• The following gaps existed at completion of the TIA report:
o The arrival and departure profiles of the traffic/trucks during the construction and
operation phases.
o The origin and destination of the generated traffic during construction.
o Staff movements and transport during construction and operation.
o Details regarding abnormally dimensioned machine components required during the
construction and operation of the FGD facility.
• Eskom is still in the process of developing their heavy haul/lift plans and thus we could not
include any information under this section.
23 May 2018 166 12949
ZITHOLELE CONSULTING
9.3 Changes in project / process scope
Towards the middle of 2017 changes to the authorisation and licencing approach for the
Medupi FGD Retrofit Project applications were proposed in order to streamline the application
processes to ensure compliance with the NEMAQA compliance requirements by the year
2021. The following changes were subsequently implemented:
• Confirmation that the assessment of an additional multiuse disposal facilities, which could
be used for the disposal of ash and gypsum, and maybe salts and sludge have been
removed from this current application scope and will be undertaken as a separate
authorisation process.
• The application for a Waste Management Licence (WML) for the existing ADF was
removed from the integrated Environmental Impact Assessment process hence the EIA
application will not be an integrated Environmental Impact Assessment application. The
proposed disposal of gypsum together with ash on the existing authorised ADF footprint
will be dealt with through a separate amendment process to the existing ADF WML.
• The EIA application in terms of the National Environmental Management Act, 107 of 1998,
as amended, will include application for activities associated with the construction and
operation of the FGD system within the Medupi PS footprint and the railway yard and
siding, including limestone and gypsum handling facilities, e.g. PCDs, diesel storage
facilities new access roads, Waste Water Treatment plant, facilities for temporary storage
of salts and sludge.
• A Water Use Licence Application will focus on water uses triggered by the construction
and operation of the FGD system, railway yard and limestone / gypsum handling areas,
and within 500m of the approved ADF footprint.
As a result of these changes the project scope for specialists was updated and specialists
were requested to amend their reports to reflect these changes.
23 May 2018 167 12949
ZITHOLELE CONSULTING
10 SUMMARY OF SPECIALIST STUDIES
A number of specialists were appointed by Zitholele Consulting to investigate several aspects
of the proposed FGD system and its associated infrastructure, and the railway yard
development. A summary of these specialists’ findings and recommendations are provided in
the following sections.
10.1 Geology
Based on this limited information, the following brief comments were provided:
• The site is mainly underlain by quartzites, shale, sandstones and conglomerates. Soils
and weathered and fractures rock are present to depths typically varying from 10 to 15m,
below which the soils become relatively fresh.
• Standard foundation systems are expected to be applicable, comprising generally shallow
foundations.
• Excavatability is expected to be soft to intermediate, with hard rock class (drill and blast)
for excavation in moderately weathered or harder rock (location dependent, but generally
below about 5m depth).
• The Limestone and Gypsum Offloading Facility below the railway yard is proposed to be
15m in depth. Hard rock (drill and blasting) excavation will be required from a depth of
about 2m.
• Dependent on the thickness of the surficial soils and any fill materials over the area, a
contingency allowance should be made for encountering rock during the installation of
such services or shallow foundations, where hard rock excavation (hydraulic rock hammer
or drill and blast) may be necessary.
• Standard footing systems such as shallow pad and strip footings are expected to be
applicable for the area.
• Deep excavations are expected to require reinforcement and/or stabilisation, particularly
at shallow depths. Dependent on the quality of the rock and degree of fracturing, the lower
half of the 15m deep excavation may potentially be unreinforced and unstabilised. Core
orientated geotechnical drilling and associated structural analysis of the ground will be
required prior to design to test for this design solution.
• Groundwater can be expected from a shallow depth in the excavation. The volume of water
seepage is expected to be relatively low, and reducing as the excavation proceeds into
less fractured rock.
• No significant geotechnical hazards or fatal flaws were identified. All the geotechnical
considerations mentioned can be mitigated in the design of the facility. Significant further
investigations will be required for all items of infrastructure as the design proceeds.
23 May 2018 168 12949
ZITHOLELE CONSULTING
10.2 Soils and Land Capability
The infrastructure planned for the facility will include some large and heavy structures and
relatively deep excavations. These will entail the removal of significant quantities of soil, and
possibly the complete removal of soil and soft overburden in places were the foundations for
the larger structures are to be excavated.
A number of site-specific baseline (existing environment) conditions are of special significance
and need to be taken into account when considering potential impacts associated with the
proposed development. These include:
• FGD retrofit infrastructure to be constructed and operated within the Medupi Power Station
footprint;
• Temporary storage of FGD WWTP solid waste (salts and sludge) at a hazardous waste
storage facility within the Medupi Power Station footprint, to be removed by an accredited
service provider to an approved waste disposal facility;
• Temporary trucking of salts and sludge from the FGD WWTP to a designated hazardous
waste facility for disposal;
• Construction of a pollution control facility receiving dirty water runoff from the limestone
holding area (licencing in terms of the NWA); and
• Construction of infrastructure for the loading and offloading of gypsum and limestone at
the proposed railway siding for the possible transport of limestone and gypsum to and from
the power station, respectively.
It is furthermore important to note that the pre-development conditions for the area of concern
are one of disturbed industrial. For the most part the site comprises land that has been cleared
or disturbed to some degree by the power station development. The concerns and probable
impacts that could affect the soils and associated land capability include:
• The loss of the soil resource due the change in land use and the removal of the resource
from the existing system (Sterilization) as a result of construction activities. These
activities could result in the complete loss of the soil resource for the life of the project.
The management of waste could potentially sterilize the soils permanently, if not
removed/striped, stored and well managed;
• The loss of the soil resource due to erosion (wind and water) of unprotected materials due
to the removal of vegetative cover and/or topsoil;
• The loss of the utilization potential of the soil and land capability due to compaction of
areas adjacent to the constructed facilities by vehicle and construction activities;
• Loss of the resource due to removal of materials for use in other activities;
• The contamination of the resource due to spillage of raw materials and reagents
(Gypsum, limestone etc.) that are transported to the site;
• The contamination of stored or in-situ materials due to dust or dirty water from the project
area and transport routes;
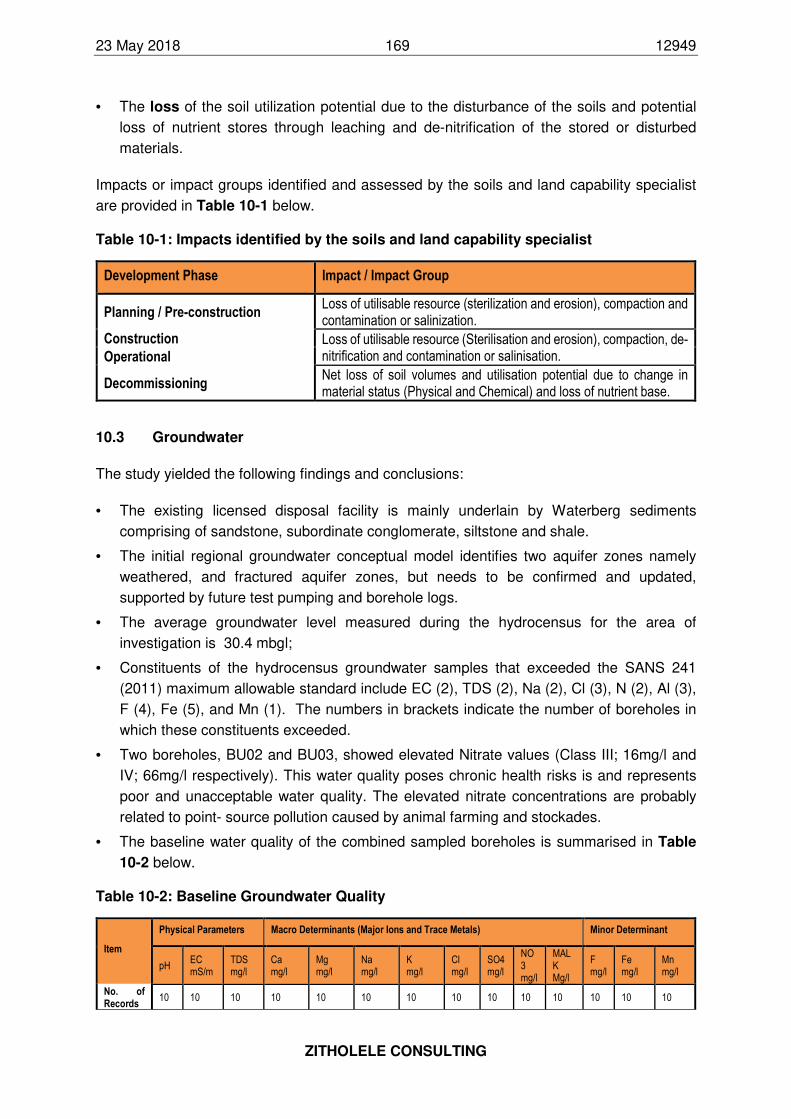
23 May 2018 169 12949
ZITHOLELE CONSULTING
• The loss of the soil utilization potential due to the disturbance of the soils and potential
loss of nutrient stores through leaching and de-nitrification of the stored or disturbed
materials.
Impacts or impact groups identified and assessed by the soils and land capability specialist
are provided in Table 10-1 below.
Table 10-1: Impacts identified by the soils and land capability specialist
Development Phase Impact / Impact Group
Planning / Pre-construction Loss of utilisable resource (sterilization and erosion), compaction and contamination or salinization.
Construction Loss of utilisable resource (Sterilisation and erosion), compaction, de-nitrification and contamination or salinisation. Operational
Decommissioning Net loss of soil volumes and utilisation potential due to change in material status (Physical and Chemical) and loss of nutrient base.
10.3 Groundwater
The study yielded the following findings and conclusions:
• The existing licensed disposal facility is mainly underlain by Waterberg sediments
comprising of sandstone, subordinate conglomerate, siltstone and shale.
• The initial regional groundwater conceptual model identifies two aquifer zones namely
weathered, and fractured aquifer zones, but needs to be confirmed and updated,
supported by future test pumping and borehole logs.
• The average groundwater level measured during the hydrocensus for the area of
investigation is 30.4 mbgl;
• Constituents of the hydrocensus groundwater samples that exceeded the SANS 241
(2011) maximum allowable standard include EC (2), TDS (2), Na (2), Cl (3), N (2), Al (3),
F (4), Fe (5), and Mn (1). The numbers in brackets indicate the number of boreholes in
which these constituents exceeded.
• Two boreholes, BU02 and BU03, showed elevated Nitrate values (Class III; 16mg/l and
IV; 66mg/l respectively). This water quality poses chronic health risks is and represents
poor and unacceptable water quality. The elevated nitrate concentrations are probably
related to point- source pollution caused by animal farming and stockades.
• The baseline water quality of the combined sampled boreholes is summarised in Table
10-2 below.
Table 10-2: Baseline Groundwater Quality
Item
Physical Parameters Macro Determinants (Major Ions and Trace Metals) Minor Determinant
pH EC mS/m
TDS mg/l
Ca mg/l
Mg mg/l
Na mg/l
K mg/l
Cl mg/l
SO4 mg/l
NO3 mg/l
MALK Mg/l
F mg/l
Fe mg/l
Mn mg/l
No. of Records
10 10 10 10 10 10 10 10 10 10 10 10 10 10
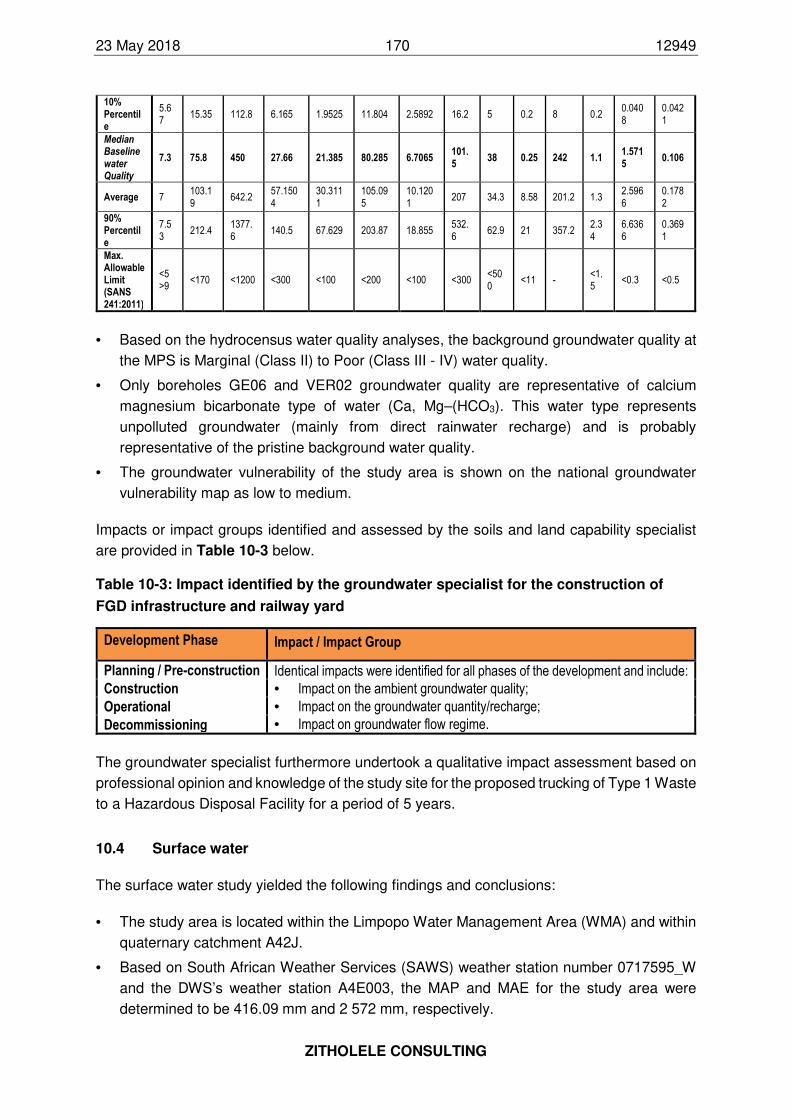
23 May 2018 170 12949
ZITHOLELE CONSULTING
10% Percentile
5.67
15.35 112.8 6.165 1.9525 11.804 2.5892 16.2 5 0.2 8 0.2 0.0408
0.0421
Median Baseline water Quality
7.3 75.8 450 27.66 21.385 80.285 6.7065 101.5
38 0.25 242 1.1 1.5715
0.106
Average 7 103.19
642.2 57.1504
30.3111
105.095
10.1201
207 34.3 8.58 201.2 1.3 2.5966
0.1782
90% Percentile
7.53
212.4 1377.6
140.5 67.629 203.87 18.855 532.6
62.9 21 357.2 2.34
6.6366
0.3691
Max. Allowable Limit (SANS 241:2011)
<5 >9
<170 <1200 <300 <100 <200 <100 <300 <500
<11 - <1.5
<0.3 <0.5
• Based on the hydrocensus water quality analyses, the background groundwater quality at
the MPS is Marginal (Class II) to Poor (Class III - IV) water quality.
• Only boreholes GE06 and VER02 groundwater quality are representative of calcium
magnesium bicarbonate type of water (Ca, Mg–(HCO3). This water type represents
unpolluted groundwater (mainly from direct rainwater recharge) and is probably
representative of the pristine background water quality.
• The groundwater vulnerability of the study area is shown on the national groundwater
vulnerability map as low to medium.
Impacts or impact groups identified and assessed by the soils and land capability specialist
are provided in Table 10-3 below.
Table 10-3: Impact identified by the groundwater specialist for the construction of
FGD infrastructure and railway yard
Development Phase Impact / Impact Group
Planning / Pre-construction Identical impacts were identified for all phases of the development and include:
• Impact on the ambient groundwater quality;
• Impact on the groundwater quantity/recharge;
• Impact on groundwater flow regime.
Construction
Operational
Decommissioning
The groundwater specialist furthermore undertook a qualitative impact assessment based on
professional opinion and knowledge of the study site for the proposed trucking of Type 1 Waste
to a Hazardous Disposal Facility for a period of 5 years.
10.4 Surface water
The surface water study yielded the following findings and conclusions:
• The study area is located within the Limpopo Water Management Area (WMA) and within
quaternary catchment A42J.
• Based on South African Weather Services (SAWS) weather station number 0717595_W
and the DWS’s weather station A4E003, the MAP and MAE for the study area were
determined to be 416.09 mm and 2 572 mm, respectively.
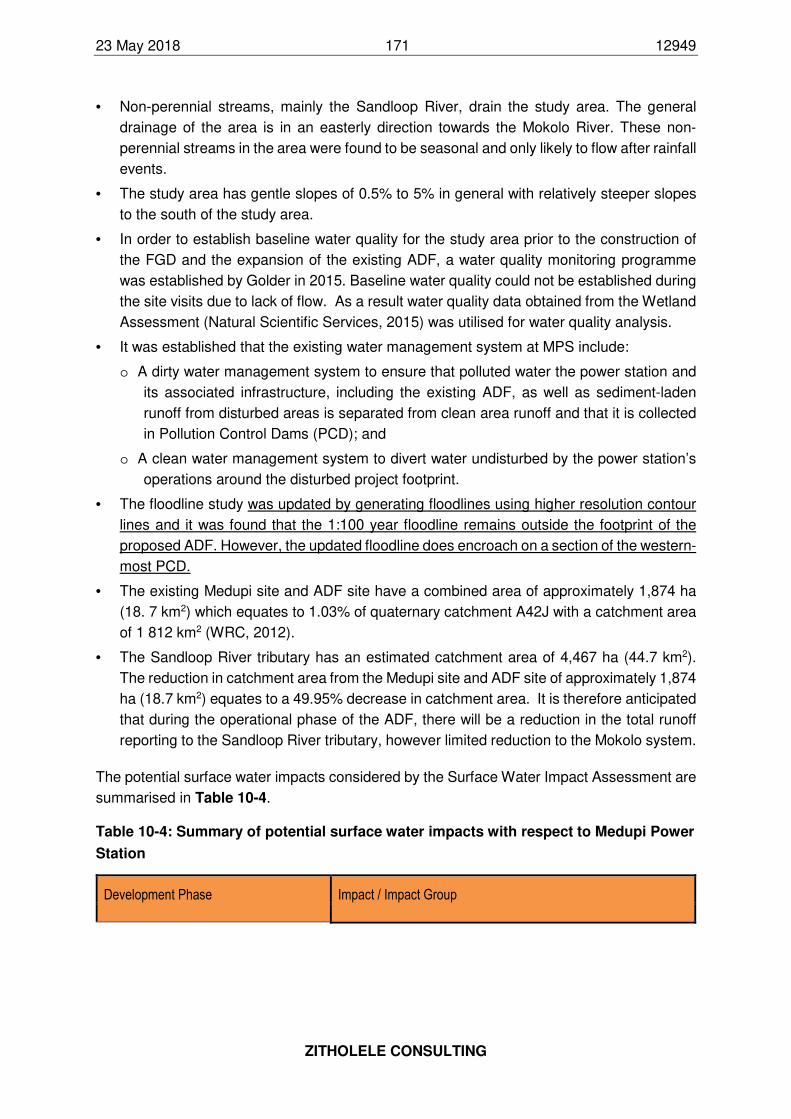
23 May 2018 171 12949
ZITHOLELE CONSULTING
• Non-perennial streams, mainly the Sandloop River, drain the study area. The general
drainage of the area is in an easterly direction towards the Mokolo River. These non-
perennial streams in the area were found to be seasonal and only likely to flow after rainfall
events.
• The study area has gentle slopes of 0.5% to 5% in general with relatively steeper slopes
to the south of the study area.
• In order to establish baseline water quality for the study area prior to the construction of
the FGD and the expansion of the existing ADF, a water quality monitoring programme
was established by Golder in 2015. Baseline water quality could not be established during
the site visits due to lack of flow. As a result water quality data obtained from the Wetland
Assessment (Natural Scientific Services, 2015) was utilised for water quality analysis.
• It was established that the existing water management system at MPS include:
o A dirty water management system to ensure that polluted water the power station and
its associated infrastructure, including the existing ADF, as well as sediment-laden
runoff from disturbed areas is separated from clean area runoff and that it is collected
in Pollution Control Dams (PCD); and
o A clean water management system to divert water undisturbed by the power station’s
operations around the disturbed project footprint.
• The floodline study was updated by generating floodlines using higher resolution contour
lines and it was found that the 1:100 year floodline remains outside the footprint of the
proposed ADF. However, the updated floodline does encroach on a section of the western-
most PCD.
• The existing Medupi site and ADF site have a combined area of approximately 1,874 ha
(18. 7 km2) which equates to 1.03% of quaternary catchment A42J with a catchment area
of 1 812 km2 (WRC, 2012).
• The Sandloop River tributary has an estimated catchment area of 4,467 ha (44.7 km2).
The reduction in catchment area from the Medupi site and ADF site of approximately 1,874
ha (18.7 km2) equates to a 49.95% decrease in catchment area. It is therefore anticipated
that during the operational phase of the ADF, there will be a reduction in the total runoff
reporting to the Sandloop River tributary, however limited reduction to the Mokolo system.
The potential surface water impacts considered by the Surface Water Impact Assessment are
summarised in Table 10-4.
Table 10-4: Summary of potential surface water impacts with respect to Medupi Power
Station
Development Phase Impact / Impact Group
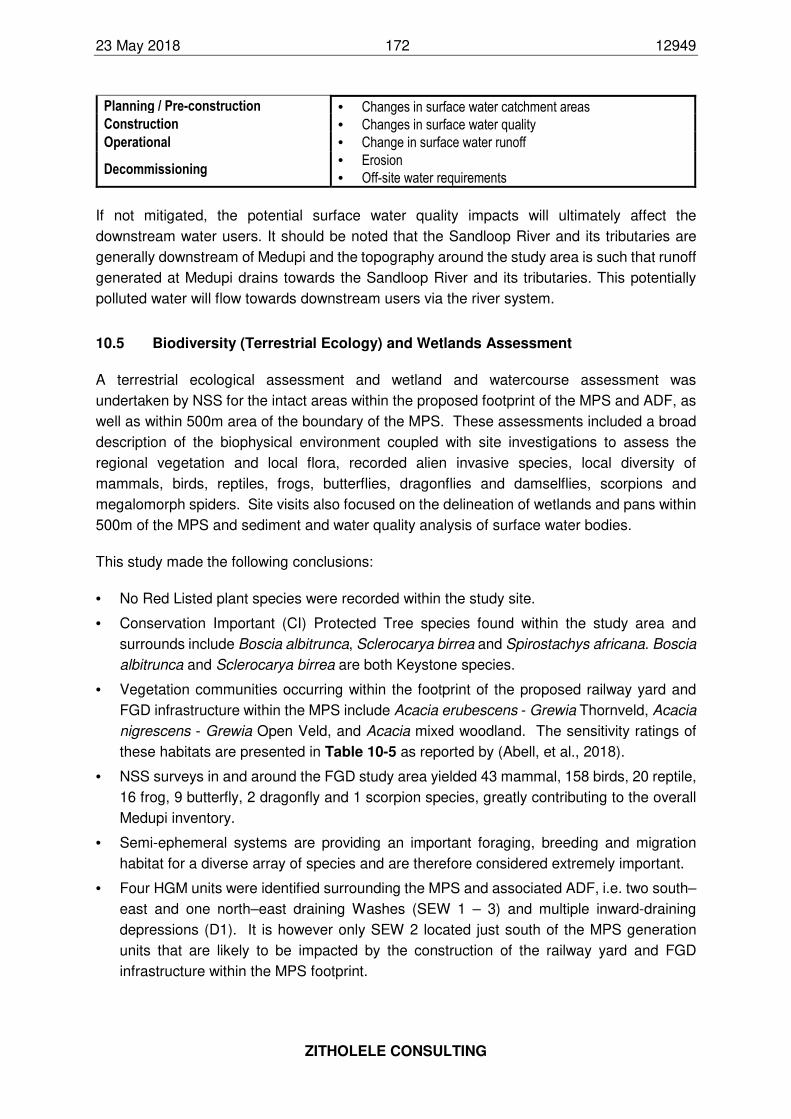
23 May 2018 172 12949
ZITHOLELE CONSULTING
Planning / Pre-construction • Changes in surface water catchment areas
• Changes in surface water quality
• Change in surface water runoff
• Erosion
• Off-site water requirements
Construction
Operational
Decommissioning
If not mitigated, the potential surface water quality impacts will ultimately affect the
downstream water users. It should be noted that the Sandloop River and its tributaries are
generally downstream of Medupi and the topography around the study area is such that runoff
generated at Medupi drains towards the Sandloop River and its tributaries. This potentially
polluted water will flow towards downstream users via the river system.
10.5 Biodiversity (Terrestrial Ecology) and Wetlands Assessment
A terrestrial ecological assessment and wetland and watercourse assessment was
undertaken by NSS for the intact areas within the proposed footprint of the MPS and ADF, as
well as within 500m area of the boundary of the MPS. These assessments included a broad
description of the biophysical environment coupled with site investigations to assess the
regional vegetation and local flora, recorded alien invasive species, local diversity of
mammals, birds, reptiles, frogs, butterflies, dragonflies and damselflies, scorpions and
megalomorph spiders. Site visits also focused on the delineation of wetlands and pans within
500m of the MPS and sediment and water quality analysis of surface water bodies.
This study made the following conclusions:
• No Red Listed plant species were recorded within the study site.
• Conservation Important (CI) Protected Tree species found within the study area and
surrounds include Boscia albitrunca, Sclerocarya birrea and Spirostachys africana. Boscia
albitrunca and Sclerocarya birrea are both Keystone species.
• Vegetation communities occurring within the footprint of the proposed railway yard and
FGD infrastructure within the MPS include Acacia erubescens - Grewia Thornveld, Acacia
nigrescens - Grewia Open Veld, and Acacia mixed woodland. The sensitivity ratings of
these habitats are presented in Table 10-5 as reported by (Abell, et al., 2018).
• NSS surveys in and around the FGD study area yielded 43 mammal, 158 birds, 20 reptile,
16 frog, 9 butterfly, 2 dragonfly and 1 scorpion species, greatly contributing to the overall
Medupi inventory.
• Semi-ephemeral systems are providing an important foraging, breeding and migration
habitat for a diverse array of species and are therefore considered extremely important.
• Four HGM units were identified surrounding the MPS and associated ADF, i.e. two south–
east and one north–east draining Washes (SEW 1 – 3) and multiple inward-draining
depressions (D1). It is however only SEW 2 located just south of the MPS generation
units that are likely to be impacted by the construction of the railway yard and FGD
infrastructure within the MPS footprint.
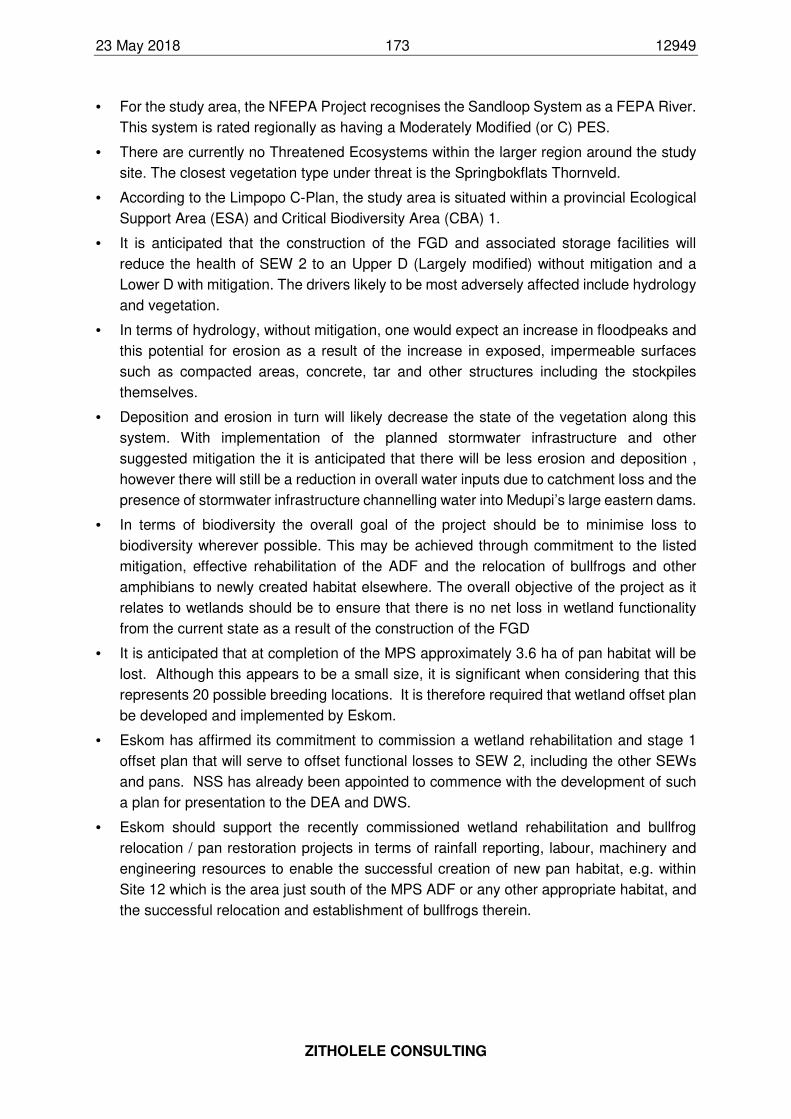
23 May 2018 173 12949
ZITHOLELE CONSULTING
• For the study area, the NFEPA Project recognises the Sandloop System as a FEPA River.
This system is rated regionally as having a Moderately Modified (or C) PES.
• There are currently no Threatened Ecosystems within the larger region around the study
site. The closest vegetation type under threat is the Springbokflats Thornveld.
• According to the Limpopo C-Plan, the study area is situated within a provincial Ecological
Support Area (ESA) and Critical Biodiversity Area (CBA) 1.
• It is anticipated that the construction of the FGD and associated storage facilities will
reduce the health of SEW 2 to an Upper D (Largely modified) without mitigation and a
Lower D with mitigation. The drivers likely to be most adversely affected include hydrology
and vegetation.
• In terms of hydrology, without mitigation, one would expect an increase in floodpeaks and
this potential for erosion as a result of the increase in exposed, impermeable surfaces
such as compacted areas, concrete, tar and other structures including the stockpiles
themselves.
• Deposition and erosion in turn will likely decrease the state of the vegetation along this
system. With implementation of the planned stormwater infrastructure and other
suggested mitigation the it is anticipated that there will be less erosion and deposition ,
however there will still be a reduction in overall water inputs due to catchment loss and the
presence of stormwater infrastructure channelling water into Medupi’s large eastern dams.
• In terms of biodiversity the overall goal of the project should be to minimise loss to
biodiversity wherever possible. This may be achieved through commitment to the listed
mitigation, effective rehabilitation of the ADF and the relocation of bullfrogs and other
amphibians to newly created habitat elsewhere. The overall objective of the project as it
relates to wetlands should be to ensure that there is no net loss in wetland functionality
from the current state as a result of the construction of the FGD
• It is anticipated that at completion of the MPS approximately 3.6 ha of pan habitat will be
lost. Although this appears to be a small size, it is significant when considering that this
represents 20 possible breeding locations. It is therefore required that wetland offset plan
be developed and implemented by Eskom.
• Eskom has affirmed its commitment to commission a wetland rehabilitation and stage 1
offset plan that will serve to offset functional losses to SEW 2, including the other SEWs
and pans. NSS has already been appointed to commence with the development of such
a plan for presentation to the DEA and DWS.
• Eskom should support the recently commissioned wetland rehabilitation and bullfrog
relocation / pan restoration projects in terms of rainfall reporting, labour, machinery and
engineering resources to enable the successful creation of new pan habitat, e.g. within
Site 12 which is the area just south of the MPS ADF or any other appropriate habitat, and
the successful relocation and establishment of bullfrogs therein.
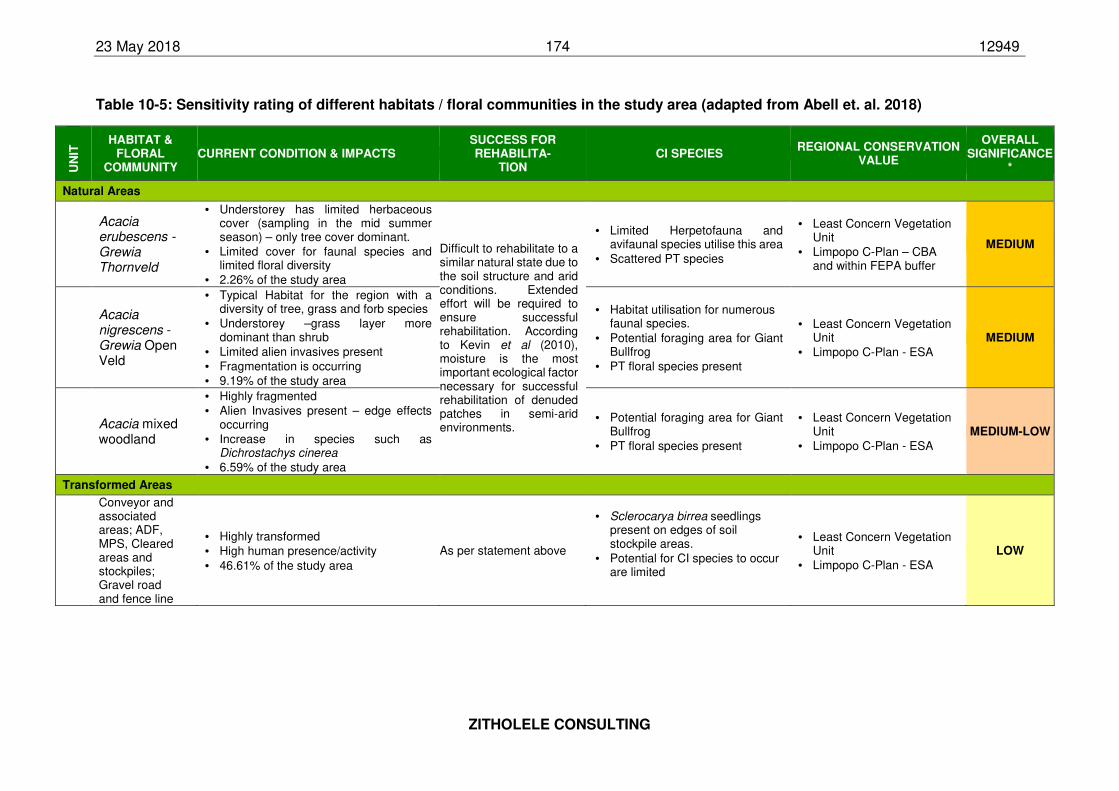
23 May 2018 174 12949
ZITHOLELE CONSULTING
Table 10-5: Sensitivity rating of different habitats / floral communities in the study area (adapted from Abell et. al. 2018)
UN
IT HABITAT &
FLORAL COMMUNITY
CURRENT CONDITION & IMPACTS SUCCESS FOR REHABILITA-
TION CI SPECIES
REGIONAL CONSERVATION VALUE
OVERALL SIGNIFICANCE
*
Natural Areas
Acacia erubescens - Grewia Thornveld
• Understorey has limited herbaceous cover (sampling in the mid summer season) – only tree cover dominant.
• Limited cover for faunal species and limited floral diversity
• 2.26% of the study area
Difficult to rehabilitate to a similar natural state due to the soil structure and arid conditions. Extended effort will be required to ensure successful rehabilitation. According to Kevin et al (2010), moisture is the most important ecological factor necessary for successful rehabilitation of denuded patches in semi-arid environments.
• Limited Herpetofauna and avifaunal species utilise this area
• Scattered PT species
• Least Concern Vegetation Unit
• Limpopo C-Plan – CBA and within FEPA buffer
MEDIUM
Acacia nigrescens - Grewia Open Veld
• Typical Habitat for the region with a diversity of tree, grass and forb species
• Understorey –grass layer more dominant than shrub
• Limited alien invasives present • Fragmentation is occurring • 9.19% of the study area
• Habitat utilisation for numerous faunal species.
• Potential foraging area for Giant Bullfrog
• PT floral species present
• Least Concern Vegetation Unit
• Limpopo C-Plan - ESA MEDIUM
Acacia mixed woodland
• Highly fragmented • Alien Invasives present – edge effects
occurring • Increase in species such as
Dichrostachys cinerea • 6.59% of the study area
• Potential foraging area for Giant Bullfrog
• PT floral species present
• Least Concern Vegetation Unit
• Limpopo C-Plan - ESA MEDIUM-LOW
Transformed Areas
Conveyor and associated areas; ADF, MPS, Cleared areas and stockpiles; Gravel road and fence line
• Highly transformed • High human presence/activity
• 46.61% of the study area
As per statement above
• Sclerocarya birrea seedlings present on edges of soil stockpile areas.
• Potential for CI species to occur are limited
• Least Concern Vegetation Unit
• Limpopo C-Plan - ESA LOW
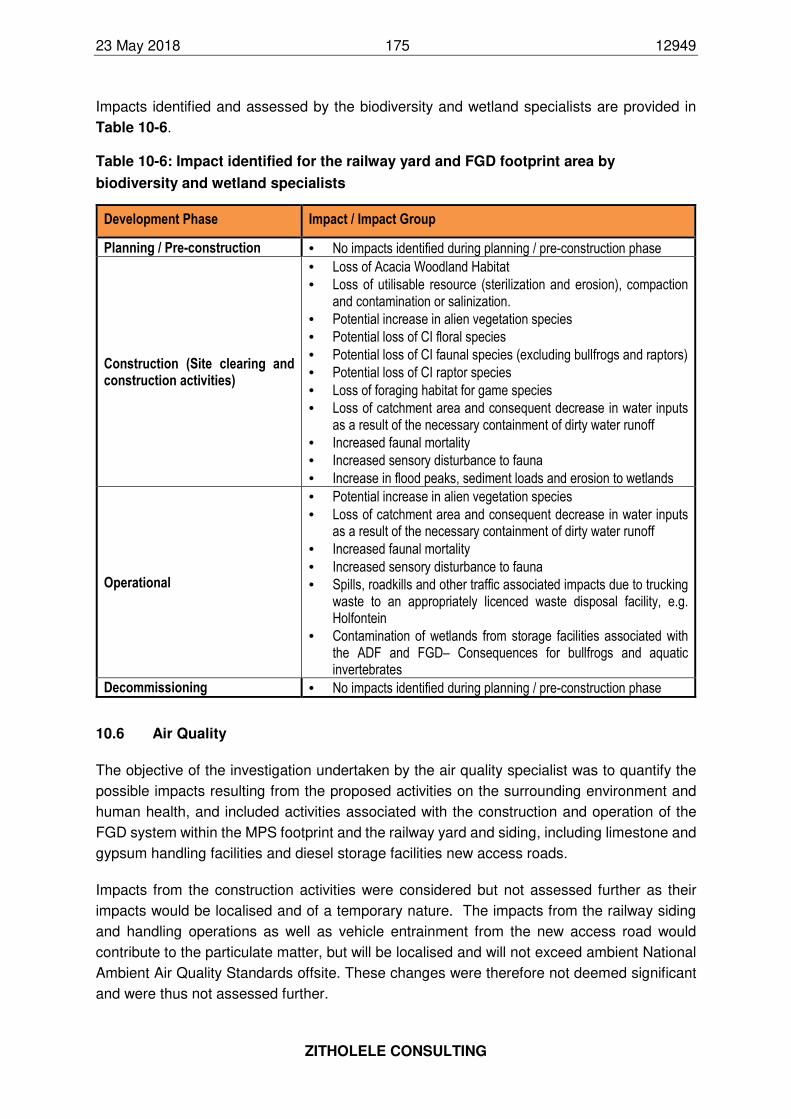
23 May 2018 175 12949
ZITHOLELE CONSULTING
Impacts identified and assessed by the biodiversity and wetland specialists are provided in
Table 10-6.
Table 10-6: Impact identified for the railway yard and FGD footprint area by
biodiversity and wetland specialists
Development Phase Impact / Impact Group
Planning / Pre-construction • No impacts identified during planning / pre-construction phase
Construction (Site clearing and construction activities)
• Loss of Acacia Woodland Habitat
• Loss of utilisable resource (sterilization and erosion), compaction and contamination or salinization.
• Potential increase in alien vegetation species
• Potential loss of CI floral species
• Potential loss of CI faunal species (excluding bullfrogs and raptors)
• Potential loss of CI raptor species
• Loss of foraging habitat for game species
• Loss of catchment area and consequent decrease in water inputs as a result of the necessary containment of dirty water runoff
• Increased faunal mortality
• Increased sensory disturbance to fauna
• Increase in flood peaks, sediment loads and erosion to wetlands
Operational
• Potential increase in alien vegetation species
• Loss of catchment area and consequent decrease in water inputs as a result of the necessary containment of dirty water runoff
• Increased faunal mortality
• Increased sensory disturbance to fauna
• Spills, roadkills and other traffic associated impacts due to trucking waste to an appropriately licenced waste disposal facility, e.g. Holfontein
• Contamination of wetlands from storage facilities associated with the ADF and FGD– Consequences for bullfrogs and aquatic invertebrates
Decommissioning • No impacts identified during planning / pre-construction phase
10.6 Air Quality
The objective of the investigation undertaken by the air quality specialist was to quantify the
possible impacts resulting from the proposed activities on the surrounding environment and
human health, and included activities associated with the construction and operation of the
FGD system within the MPS footprint and the railway yard and siding, including limestone and
gypsum handling facilities and diesel storage facilities new access roads.
Impacts from the construction activities were considered but not assessed further as their
impacts would be localised and of a temporary nature. The impacts from the railway siding
and handling operations as well as vehicle entrainment from the new access road would
contribute to the particulate matter, but will be localised and will not exceed ambient National
Ambient Air Quality Standards offsite. These changes were therefore not deemed significant
and were thus not assessed further.
23 May 2018 176 12949
ZITHOLELE CONSULTING
Furthermore, dust emissions potentially resulting from the transportation of limestone and
wastes generated by the FGD process were considered. The air quality specialists compiled
a screening model to qualitatively assess the significance of this potential impact. This
qualitative assessment concluded that PM10 and PM2.5 concentrations resulting from vehicle
entrainment as a result of transporting limestone, salts and sludge on a paved road surface
(assuming all six units are operational) are well below the NAAQS.
An Impact Prediction Study was undertaken where SO2, NO2 and particulate concentrations
were simulated using the CALMET/CALPUFF dispersion modelling suite. Ambient
concentrations were simulated to ascertain highest hourly, daily and annual averaging levels
occurring as a result of the baseline and proposed Project operations.
Three scenarios were assessed: (i) 2014 baseline: the potential impacts due to the Matimba
Power Station operations, (ii) 2020 baseline: the potential impacts due to the Matimba Power
Station operations and the Medupi Power Station operations including all six units without
FGD, and (iii) proposed Project operations: the potential impacts due to the Matimba Power
Station operations and the Medupi Power Station operations including all six units with FGD.
The fugitive emissions due to windblown dust from the existing ash facility was also quantified
at the existing Ash Disposal Facility (ADF) as an unmitigated operation (no controls in place)
and as a mitigated operation (80% control efficiency in place through active re-vegetation and
wetting). Stack emissions and parameters were provided by Eskom personnel for the study.
Main findings of the air quality study include:
• SO2 concentrations were measured to infrequently exceed short-term NAAQ limits at the
monitoring stations located at Marapong and Lephalale. Modelled SO2 concentrations also
indicate infrequent short-term exceedances of the National Ambient Air Quality (NAAQ)
limits at these sensitive receptors. There is however compliance with the NAAQS.
• Currently, the Matimba Power Station is likely to be the main contributing source to the
ambient SO2 ground level concentrations in the study area due to the magnitude of its
emissions. Other sources which may contribute significantly due to their low release level
include: spontaneous combustion of coal discards associated with mining operations,
clamp firing emissions during brickmaking at Hanglip and potentially household fuel
burning within Marapong.
• NO2 concentrations have been measured to infrequently exceed short-term NAAQ limits
(but are in compliance with NAAQS) at the monitoring stations located at Marapong and
Lephalale. Low level sources of NOx in the region include combustion within coal discard
dumps, brick firing operations and possibly also household fuel burning and infrequent
veld burning.
• Measured PM10 concentrations exceed the daily NAAQS at Marapong for the period 2014
but are lower at Lephalale (where levels comply with daily NAAQS). The measured PM2.5
concentrations are within the daily NAAQS applicable till 2030 at Marapong and Lephalale,
but exceed the more stringent daily NAAQS applicable in 2030. The annual average PM10
and PM2.5 concentrations measured at Lephalale are within NAAQS.
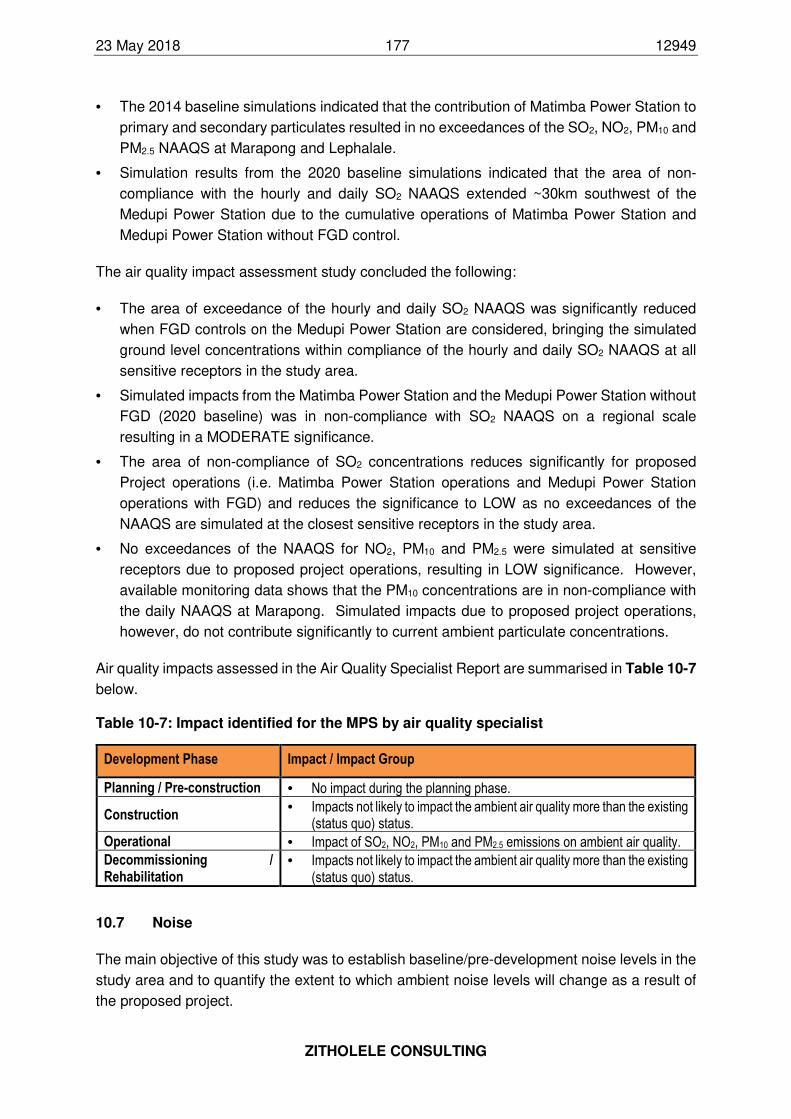
23 May 2018 177 12949
ZITHOLELE CONSULTING
• The 2014 baseline simulations indicated that the contribution of Matimba Power Station to
primary and secondary particulates resulted in no exceedances of the SO2, NO2, PM10 and
PM2.5 NAAQS at Marapong and Lephalale.
• Simulation results from the 2020 baseline simulations indicated that the area of non-
compliance with the hourly and daily SO2 NAAQS extended ~30km southwest of the
Medupi Power Station due to the cumulative operations of Matimba Power Station and
Medupi Power Station without FGD control.
The air quality impact assessment study concluded the following:
• The area of exceedance of the hourly and daily SO2 NAAQS was significantly reduced
when FGD controls on the Medupi Power Station are considered, bringing the simulated
ground level concentrations within compliance of the hourly and daily SO2 NAAQS at all
sensitive receptors in the study area.
• Simulated impacts from the Matimba Power Station and the Medupi Power Station without
FGD (2020 baseline) was in non-compliance with SO2 NAAQS on a regional scale
resulting in a MODERATE significance.
• The area of non-compliance of SO2 concentrations reduces significantly for proposed
Project operations (i.e. Matimba Power Station operations and Medupi Power Station
operations with FGD) and reduces the significance to LOW as no exceedances of the
NAAQS are simulated at the closest sensitive receptors in the study area.
• No exceedances of the NAAQS for NO2, PM10 and PM2.5 were simulated at sensitive
receptors due to proposed project operations, resulting in LOW significance. However,
available monitoring data shows that the PM10 concentrations are in non-compliance with
the daily NAAQS at Marapong. Simulated impacts due to proposed project operations,
however, do not contribute significantly to current ambient particulate concentrations.
Air quality impacts assessed in the Air Quality Specialist Report are summarised in Table 10-7
below.
Table 10-7: Impact identified for the MPS by air quality specialist
Development Phase Impact / Impact Group
Planning / Pre-construction • No impact during the planning phase.
Construction • Impacts not likely to impact the ambient air quality more than the existing
(status quo) status.
Operational • Impact of SO2, NO2, PM10 and PM2.5 emissions on ambient air quality.
Decommissioning / Rehabilitation
• Impacts not likely to impact the ambient air quality more than the existing (status quo) status.
10.7 Noise
The main objective of this study was to establish baseline/pre-development noise levels in the
study area and to quantify the extent to which ambient noise levels will change as a result of
the proposed project.
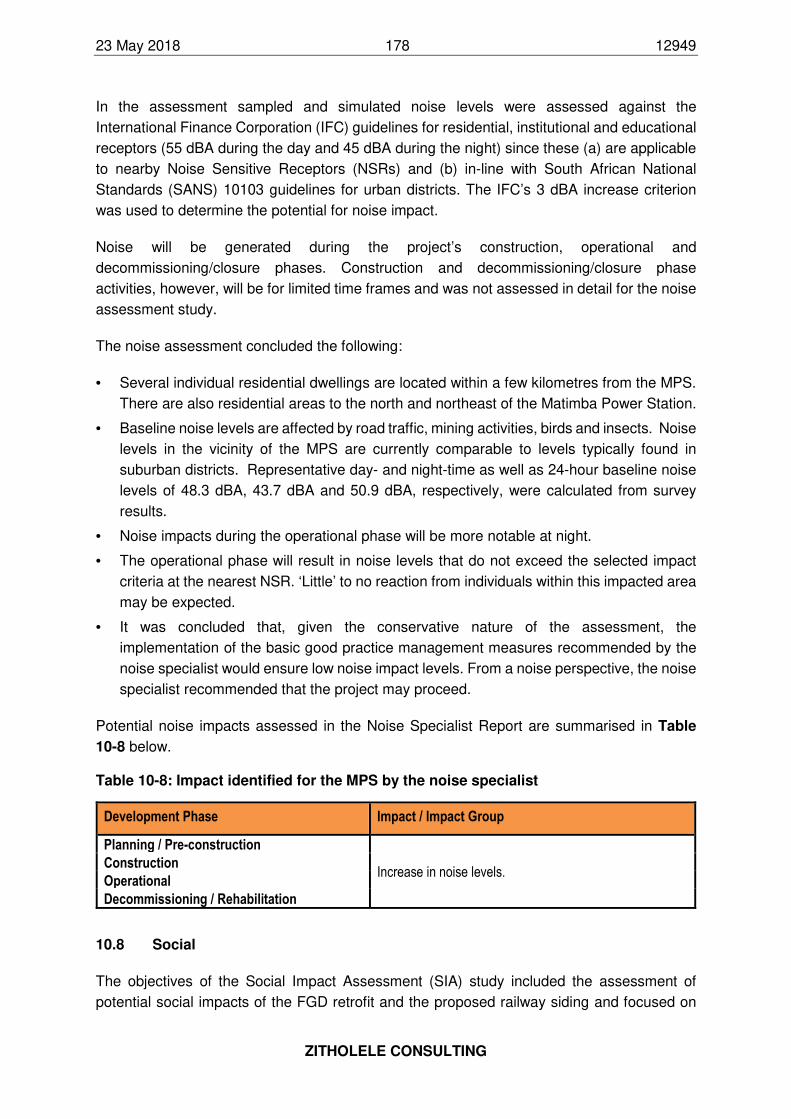
23 May 2018 178 12949
ZITHOLELE CONSULTING
In the assessment sampled and simulated noise levels were assessed against the
International Finance Corporation (IFC) guidelines for residential, institutional and educational
receptors (55 dBA during the day and 45 dBA during the night) since these (a) are applicable
to nearby Noise Sensitive Receptors (NSRs) and (b) in-line with South African National
Standards (SANS) 10103 guidelines for urban districts. The IFC’s 3 dBA increase criterion
was used to determine the potential for noise impact.
Noise will be generated during the project’s construction, operational and
decommissioning/closure phases. Construction and decommissioning/closure phase
activities, however, will be for limited time frames and was not assessed in detail for the noise
assessment study.
The noise assessment concluded the following:
• Several individual residential dwellings are located within a few kilometres from the MPS.
There are also residential areas to the north and northeast of the Matimba Power Station.
• Baseline noise levels are affected by road traffic, mining activities, birds and insects. Noise
levels in the vicinity of the MPS are currently comparable to levels typically found in
suburban districts. Representative day- and night-time as well as 24-hour baseline noise
levels of 48.3 dBA, 43.7 dBA and 50.9 dBA, respectively, were calculated from survey
results.
• Noise impacts during the operational phase will be more notable at night.
• The operational phase will result in noise levels that do not exceed the selected impact
criteria at the nearest NSR. ‘Little’ to no reaction from individuals within this impacted area
may be expected.
• It was concluded that, given the conservative nature of the assessment, the
implementation of the basic good practice management measures recommended by the
noise specialist would ensure low noise impact levels. From a noise perspective, the noise
specialist recommended that the project may proceed.
Potential noise impacts assessed in the Noise Specialist Report are summarised in Table
10-8 below.
Table 10-8: Impact identified for the MPS by the noise specialist
Development Phase Impact / Impact Group
Planning / Pre-construction
Increase in noise levels. Construction
Operational
Decommissioning / Rehabilitation
10.8 Social
The objectives of the Social Impact Assessment (SIA) study included the assessment of
potential social impacts of the FGD retrofit and the proposed railway siding and focused on
23 May 2018 179 12949
ZITHOLELE CONSULTING
the social benefits of the proposed FGD on the surrounding communities and industries, as
well as impacts on the ecosystem such as the biosphere and its natural resources like water
and ecology.
Based on the various impact assessment and impact rating processes, the following
conclusion were made about the proposed Medupi FGD and the proposed railway siding:
• The significance of positive social impacts generally exceeds the significance of negative
social impacts in the implementation of the FGD, the ADF and the railway siding
throughout all four stages of the project.
• The implementation of the proposed FGD technology at Medupi will result in reduced
levels of SO2 in the medium and long term. As the result of this, the significance of health
risks associated with the SO2 emissions will be minimized on a long-term basis.
• The outcome of the FGD retrofit will be an improved biosphere in the region and South
Africa, which will translate to improved quality of life for the citizens of Lephalale and the
communities located south and southwest of the study area who are also affected by
pollutants containing SO2.
• One of the most pressing issues identified during the survey relates to stakeholder
relations and project communication. Eskom and its stakeholders have done a significant
amount of work in dealing with concerns of various interested and affected parties on the
ground. Collectively, they have contributed to the establishment structures entrusted with
the management of stakeholder relations and communication as part of the Medupi
project. A committee has been established to deal with such issues; for example, the
Medupi Environmental Monitoring Committee (EMC) as well as the Stakeholder Relations
Office in the region. It is therefore concluded that necessary strategies and measures
have been put in place to deal with and manage stakeholder relations and communication.
• Taking into consideration of ecosystem services beneficiaries and drivers, the potential
impacts of the proposed railway siding for lime off-taking were assessed. The land on
which the proposed siding is to be constructed is already reformed or altered, therefore it
was concluded that the railway siding will not have any adverse negative social and
economic impacts in terms of increase in traffic volumes and possible road carnage
resulting from trucks transporting lime to Medupi.
• In conclusion, the water issue was assessed to be the biggest threat in the project lifespan.
The current allocation to Medupi will be able to operate the six generation units at Medupi
but will not be able to meet the full water demand for the FGD. The current raw water
abstraction from Mokolo Dam of which the Lephalale LM is also dependent on for raw
water to support its domestic and farming communities’ poses is a biggest socio-economic
threat in terms of ecosystems support services.
The social specialist recommended that from a social point of view, the proposed FGD
technology retrofit project and the proposed railway siding should be granted authorisation
provided that there will be implementation of and adherence to the following:
23 May 2018 180 12949
ZITHOLELE CONSULTING
• Mitigation measures in the SIA must be included in the Environmental Management
Programme (EMPr), which will be approved as condition of environmental authorisation.
• Although Eskom has done a lot to address concerns relating to communication with local
communities and stakeholders, it is recommended that the EMC should further strengthen
its multi-stakeholder engagement strategy or adopt new forms of communication that
resonate with the interests of I & APs in the region.
• Strengthening multi-stakeholder engagement should be done in a manner that does not
polarise relations between existing stakeholders. One way of addressing this issue is to
develop a sub-committee for the Environmental Monitoring Committee (EMC).
• If established, the EMC sub-committee could include a representative from each of the
affected communities. This would be in addition to those communities’ representatives
already listed in the EMC Terms of Reference (ToR).
• Community representatives from Steenbokpan (Leseding) and the farms (farming
community) would form part of the EMC sub-committee due to the fact that they feel
excluded in programmes and workshops that deal with issues arising from Medupi
construction and the associated infrastructure and technology such as the FGD.
• In addition to EMC public meetings and workshops, the sub-committee would ensure that
all community concerns and grievances are deliberated on and addressed directly by the
EMC and outside the EMC public meetings. The EMC ToR allows for the election of
alternates. Therefore, this recommendation for EMC sub-committee is in line with EMC
ToR.
• In projects of similar nature to Medupi, a grievance mechanism committee is often
established and communicated to the community in line with best practice. The Medupi
EMC is a sufficient structure to handle all issues relating to the environment, monitoring
and auditing. However, without increasing bureaucracy, Eskom should consider
appointing an independent company/specialist that specialises in the management of
Social Risks.
• The social specialist recommended that Eskom should fast-track the retrofitting and
synchronising of the FGD technology.
• In terms of material transport to and from site for the construction of the FGD and to
transport gypsum, salts and sludge by-products of the FGD. This will help mitigate
environmental risks associated with the use of public roads to transport these materials.
It will also assist alleviate possible increase in traffic volumes associated with the FGD
construction material transportation.
• In terms of FGD by-products it recommended that Eskom should considered tendering the
offtake of gypsum for commercial purposes instead of its combined disposal with the ash.
This will be dependent on the quality of gypsum. In the event poor quality gypsum is
produced, it will be disposed of with ash on a WSF.
• The specialist further recommended that Eskom should lobby (together with other
industries) DWS to speed up the implementation of Phase 2 MCWAP. This will guarantee
Eskom and other industries in Lephalale appropriate water allocation to support the FGD
and the growing industries around it such as expanded coal mining due to coal reserves
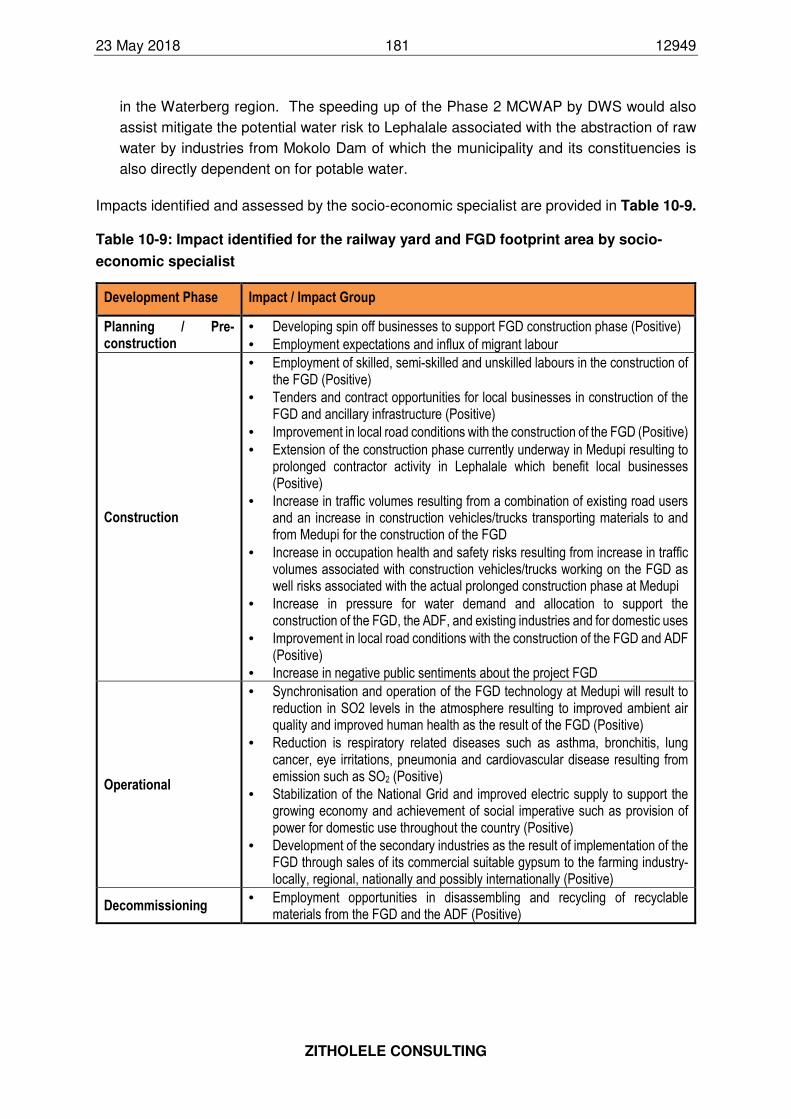
23 May 2018 181 12949
ZITHOLELE CONSULTING
in the Waterberg region. The speeding up of the Phase 2 MCWAP by DWS would also
assist mitigate the potential water risk to Lephalale associated with the abstraction of raw
water by industries from Mokolo Dam of which the municipality and its constituencies is
also directly dependent on for potable water.
Impacts identified and assessed by the socio-economic specialist are provided in Table 10-9.
Table 10-9: Impact identified for the railway yard and FGD footprint area by socio-
economic specialist
Development Phase Impact / Impact Group
Planning / Pre-construction
• Developing spin off businesses to support FGD construction phase (Positive)
• Employment expectations and influx of migrant labour
Construction
• Employment of skilled, semi-skilled and unskilled labours in the construction of the FGD (Positive)
• Tenders and contract opportunities for local businesses in construction of the FGD and ancillary infrastructure (Positive)
• Improvement in local road conditions with the construction of the FGD (Positive)
• Extension of the construction phase currently underway in Medupi resulting to prolonged contractor activity in Lephalale which benefit local businesses (Positive)
• Increase in traffic volumes resulting from a combination of existing road users and an increase in construction vehicles/trucks transporting materials to and from Medupi for the construction of the FGD
• Increase in occupation health and safety risks resulting from increase in traffic volumes associated with construction vehicles/trucks working on the FGD as well risks associated with the actual prolonged construction phase at Medupi
• Increase in pressure for water demand and allocation to support the construction of the FGD, the ADF, and existing industries and for domestic uses
• Improvement in local road conditions with the construction of the FGD and ADF (Positive)
• Increase in negative public sentiments about the project FGD
Operational
• Synchronisation and operation of the FGD technology at Medupi will result to reduction in SO2 levels in the atmosphere resulting to improved ambient air quality and improved human health as the result of the FGD (Positive)
• Reduction is respiratory related diseases such as asthma, bronchitis, lung cancer, eye irritations, pneumonia and cardiovascular disease resulting from emission such as SO2 (Positive)
• Stabilization of the National Grid and improved electric supply to support the growing economy and achievement of social imperative such as provision of power for domestic use throughout the country (Positive)
• Development of the secondary industries as the result of implementation of the FGD through sales of its commercial suitable gypsum to the farming industry- locally, regional, nationally and possibly internationally (Positive)
Decommissioning • Employment opportunities in disassembling and recycling of recyclable
materials from the FGD and the ADF (Positive)
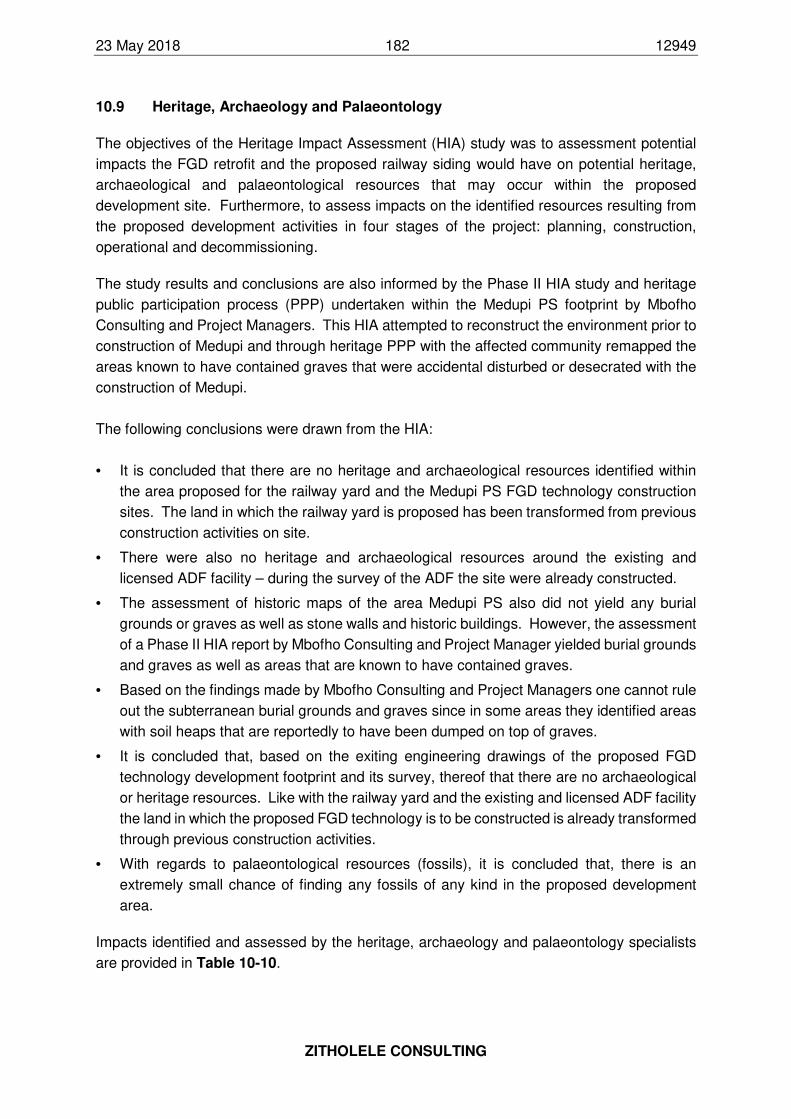
23 May 2018 182 12949
ZITHOLELE CONSULTING
10.9 Heritage, Archaeology and Palaeontology
The objectives of the Heritage Impact Assessment (HIA) study was to assessment potential
impacts the FGD retrofit and the proposed railway siding would have on potential heritage,
archaeological and palaeontological resources that may occur within the proposed
development site. Furthermore, to assess impacts on the identified resources resulting from
the proposed development activities in four stages of the project: planning, construction,
operational and decommissioning.
The study results and conclusions are also informed by the Phase II HIA study and heritage
public participation process (PPP) undertaken within the Medupi PS footprint by Mbofho
Consulting and Project Managers. This HIA attempted to reconstruct the environment prior to
construction of Medupi and through heritage PPP with the affected community remapped the
areas known to have contained graves that were accidental disturbed or desecrated with the
construction of Medupi.
The following conclusions were drawn from the HIA:
• It is concluded that there are no heritage and archaeological resources identified within
the area proposed for the railway yard and the Medupi PS FGD technology construction
sites. The land in which the railway yard is proposed has been transformed from previous
construction activities on site.
• There were also no heritage and archaeological resources around the existing and
licensed ADF facility – during the survey of the ADF the site were already constructed.
• The assessment of historic maps of the area Medupi PS also did not yield any burial
grounds or graves as well as stone walls and historic buildings. However, the assessment
of a Phase II HIA report by Mbofho Consulting and Project Manager yielded burial grounds
and graves as well as areas that are known to have contained graves.
• Based on the findings made by Mbofho Consulting and Project Managers one cannot rule
out the subterranean burial grounds and graves since in some areas they identified areas
with soil heaps that are reportedly to have been dumped on top of graves.
• It is concluded that, based on the exiting engineering drawings of the proposed FGD
technology development footprint and its survey, thereof that there are no archaeological
or heritage resources. Like with the railway yard and the existing and licensed ADF facility
the land in which the proposed FGD technology is to be constructed is already transformed
through previous construction activities.
• With regards to palaeontological resources (fossils), it is concluded that, there is an
extremely small chance of finding any fossils of any kind in the proposed development
area.
Impacts identified and assessed by the heritage, archaeology and palaeontology specialists
are provided in Table 10-10.
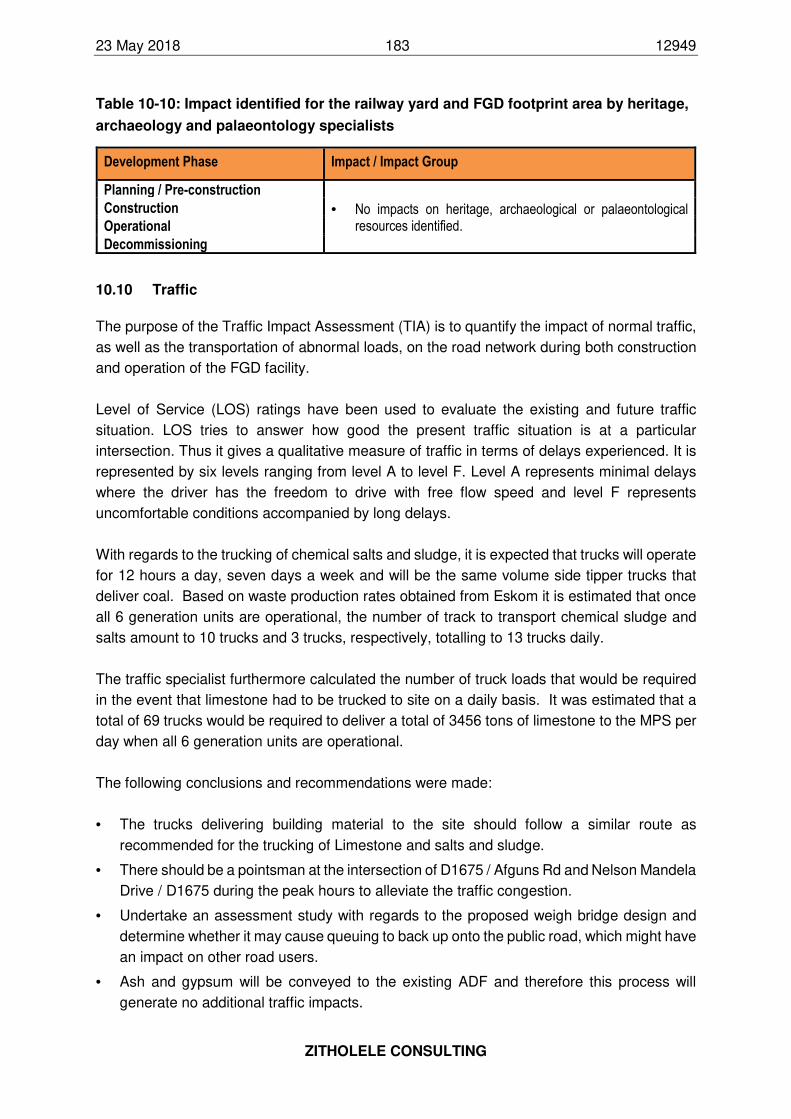
23 May 2018 183 12949
ZITHOLELE CONSULTING
Table 10-10: Impact identified for the railway yard and FGD footprint area by heritage,
archaeology and palaeontology specialists
Development Phase Impact / Impact Group
Planning / Pre-construction
• No impacts on heritage, archaeological or palaeontological resources identified.
Construction
Operational
Decommissioning
10.10 Traffic
The purpose of the Traffic Impact Assessment (TIA) is to quantify the impact of normal traffic,
as well as the transportation of abnormal loads, on the road network during both construction
and operation of the FGD facility.
Level of Service (LOS) ratings have been used to evaluate the existing and future traffic
situation. LOS tries to answer how good the present traffic situation is at a particular
intersection. Thus it gives a qualitative measure of traffic in terms of delays experienced. It is
represented by six levels ranging from level A to level F. Level A represents minimal delays
where the driver has the freedom to drive with free flow speed and level F represents
uncomfortable conditions accompanied by long delays.
With regards to the trucking of chemical salts and sludge, it is expected that trucks will operate
for 12 hours a day, seven days a week and will be the same volume side tipper trucks that
deliver coal. Based on waste production rates obtained from Eskom it is estimated that once
all 6 generation units are operational, the number of track to transport chemical sludge and
salts amount to 10 trucks and 3 trucks, respectively, totalling to 13 trucks daily.
The traffic specialist furthermore calculated the number of truck loads that would be required
in the event that limestone had to be trucked to site on a daily basis. It was estimated that a
total of 69 trucks would be required to deliver a total of 3456 tons of limestone to the MPS per
day when all 6 generation units are operational.
The following conclusions and recommendations were made:
• The trucks delivering building material to the site should follow a similar route as
recommended for the trucking of Limestone and salts and sludge.
• There should be a pointsman at the intersection of D1675 / Afguns Rd and Nelson Mandela
Drive / D1675 during the peak hours to alleviate the traffic congestion.
• Undertake an assessment study with regards to the proposed weigh bridge design and
determine whether it may cause queuing to back up onto the public road, which might have
an impact on other road users.
• Ash and gypsum will be conveyed to the existing ADF and therefore this process will
generate no additional traffic impacts.
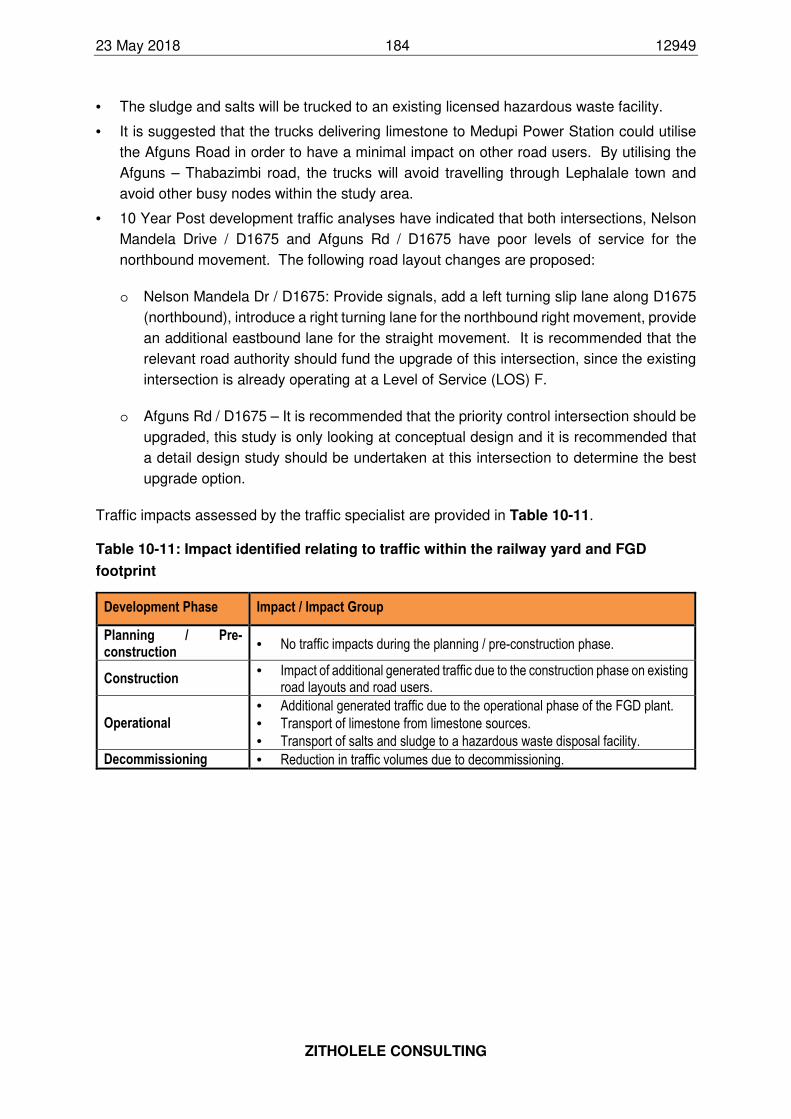
23 May 2018 184 12949
ZITHOLELE CONSULTING
• The sludge and salts will be trucked to an existing licensed hazardous waste facility.
• It is suggested that the trucks delivering limestone to Medupi Power Station could utilise
the Afguns Road in order to have a minimal impact on other road users. By utilising the
Afguns – Thabazimbi road, the trucks will avoid travelling through Lephalale town and
avoid other busy nodes within the study area.
• 10 Year Post development traffic analyses have indicated that both intersections, Nelson
Mandela Drive / D1675 and Afguns Rd / D1675 have poor levels of service for the
northbound movement. The following road layout changes are proposed:
o Nelson Mandela Dr / D1675: Provide signals, add a left turning slip lane along D1675
(northbound), introduce a right turning lane for the northbound right movement, provide
an additional eastbound lane for the straight movement. It is recommended that the
relevant road authority should fund the upgrade of this intersection, since the existing
intersection is already operating at a Level of Service (LOS) F.
o Afguns Rd / D1675 – It is recommended that the priority control intersection should be
upgraded, this study is only looking at conceptual design and it is recommended that
a detail design study should be undertaken at this intersection to determine the best
upgrade option.
Traffic impacts assessed by the traffic specialist are provided in Table 10-11.
Table 10-11: Impact identified relating to traffic within the railway yard and FGD
footprint
Development Phase Impact / Impact Group
Planning / Pre-construction
• No traffic impacts during the planning / pre-construction phase.
Construction • Impact of additional generated traffic due to the construction phase on existing
road layouts and road users.
Operational
• Additional generated traffic due to the operational phase of the FGD plant.
• Transport of limestone from limestone sources.
• Transport of salts and sludge to a hazardous waste disposal facility.
Decommissioning • Reduction in traffic volumes due to decommissioning.
23 May 2018 185 12949
ZITHOLELE CONSULTING
11 ENVIRONMENTAL IMPACT ASSESSMENT
11.1 Impact Assessment Methodology
Impacts identified during this EIA were ranked according to the methodology described below.
Mitigation or management measures were provided to avoid, minimise, reduce or manage
potential impacts. In order to ensure uniformity, a standard impact assessment methodology
was utilised by all specialists and EAP so that a wide range of impacts can be compared with
each other. The impact assessment methodology makes provision for the assessment of
impacts against the following criteria, as discussed below.
Nature of the impact
Each impact should be described in terms of the features and qualities of the impact. A
detailed description of the impact will allow for contextualisation of the assessment.
Extent of the impact
Extent intends to assess the footprint of the impact. The larger the footprint, the higher the
impact rating will be. Table 11-1 below provides the descriptors and criteria for assessment.
Table 11-1: Criteria for the assessment of the extent of the impact.
Extent Descriptor Definition Rating
Site Impact footprint remains within the boundary of the site. 1
Local Impact footprint extends beyond the boundary of the site to the adjacent
surrounding areas. 2
Regional Impact footprint includes the greater surrounds and may include an
entire municipal or provincial jurisdiction. 3
National The scale of the impact is applicable to the Republic of South Africa. 4
Global The impact has global implications 5
Duration of the impact
The duration of the impact is the period of time that the impact will manifest on the receiving
environment. Importantly, the concept of reversibility is reflected in the duration rating. The
longer the impact endures, the less likely it is to be reversible. See Table 11-2 for the criteria
for rating duration of impacts.
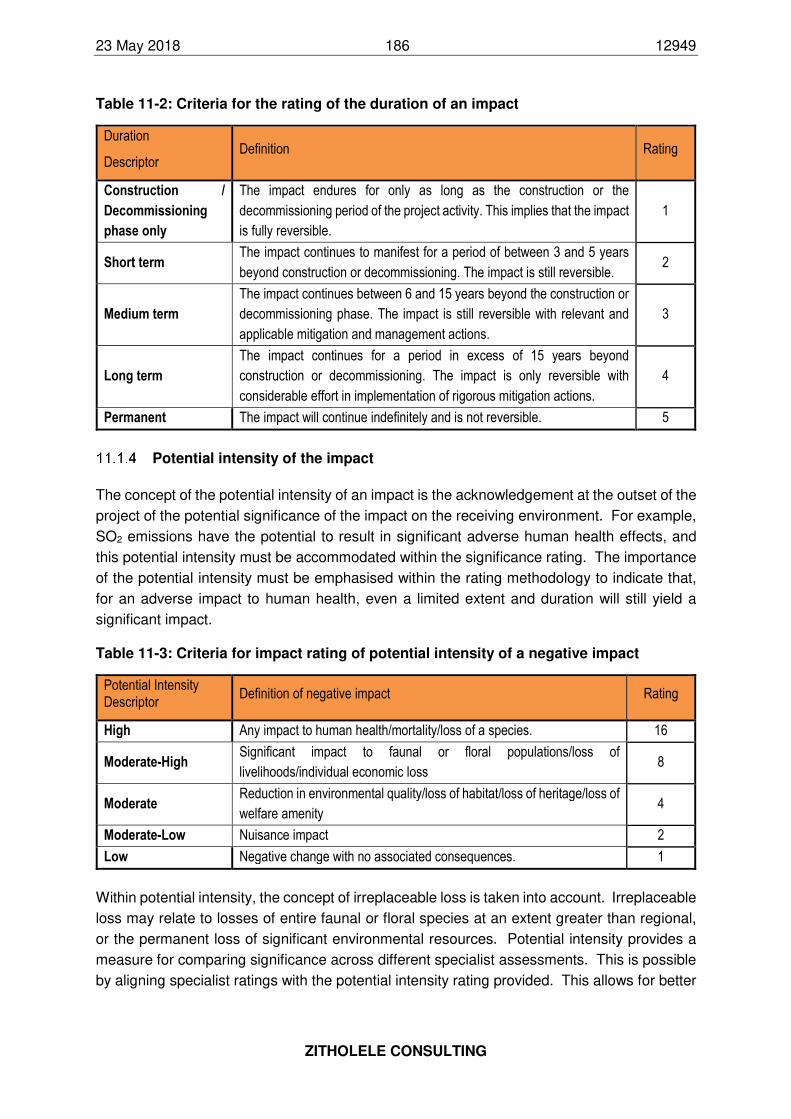
23 May 2018 186 12949
ZITHOLELE CONSULTING
Table 11-2: Criteria for the rating of the duration of an impact
Duration
Descriptor Definition Rating
Construction /
Decommissioning
phase only
The impact endures for only as long as the construction or the
decommissioning period of the project activity. This implies that the impact
is fully reversible.
1
Short term The impact continues to manifest for a period of between 3 and 5 years
beyond construction or decommissioning. The impact is still reversible. 2
Medium term
The impact continues between 6 and 15 years beyond the construction or
decommissioning phase. The impact is still reversible with relevant and
applicable mitigation and management actions.
3
Long term
The impact continues for a period in excess of 15 years beyond
construction or decommissioning. The impact is only reversible with
considerable effort in implementation of rigorous mitigation actions.
4
Permanent The impact will continue indefinitely and is not reversible. 5
Potential intensity of the impact
The concept of the potential intensity of an impact is the acknowledgement at the outset of the
project of the potential significance of the impact on the receiving environment. For example,
SO2 emissions have the potential to result in significant adverse human health effects, and
this potential intensity must be accommodated within the significance rating. The importance
of the potential intensity must be emphasised within the rating methodology to indicate that,
for an adverse impact to human health, even a limited extent and duration will still yield a
significant impact.
Table 11-3: Criteria for impact rating of potential intensity of a negative impact
Potential Intensity Descriptor
Definition of negative impact Rating
High Any impact to human health/mortality/loss of a species. 16
Moderate-High Significant impact to faunal or floral populations/loss of
livelihoods/individual economic loss 8
Moderate Reduction in environmental quality/loss of habitat/loss of heritage/loss of
welfare amenity 4
Moderate-Low Nuisance impact 2
Low Negative change with no associated consequences. 1
Within potential intensity, the concept of irreplaceable loss is taken into account. Irreplaceable
loss may relate to losses of entire faunal or floral species at an extent greater than regional,
or the permanent loss of significant environmental resources. Potential intensity provides a
measure for comparing significance across different specialist assessments. This is possible
by aligning specialist ratings with the potential intensity rating provided. This allows for better
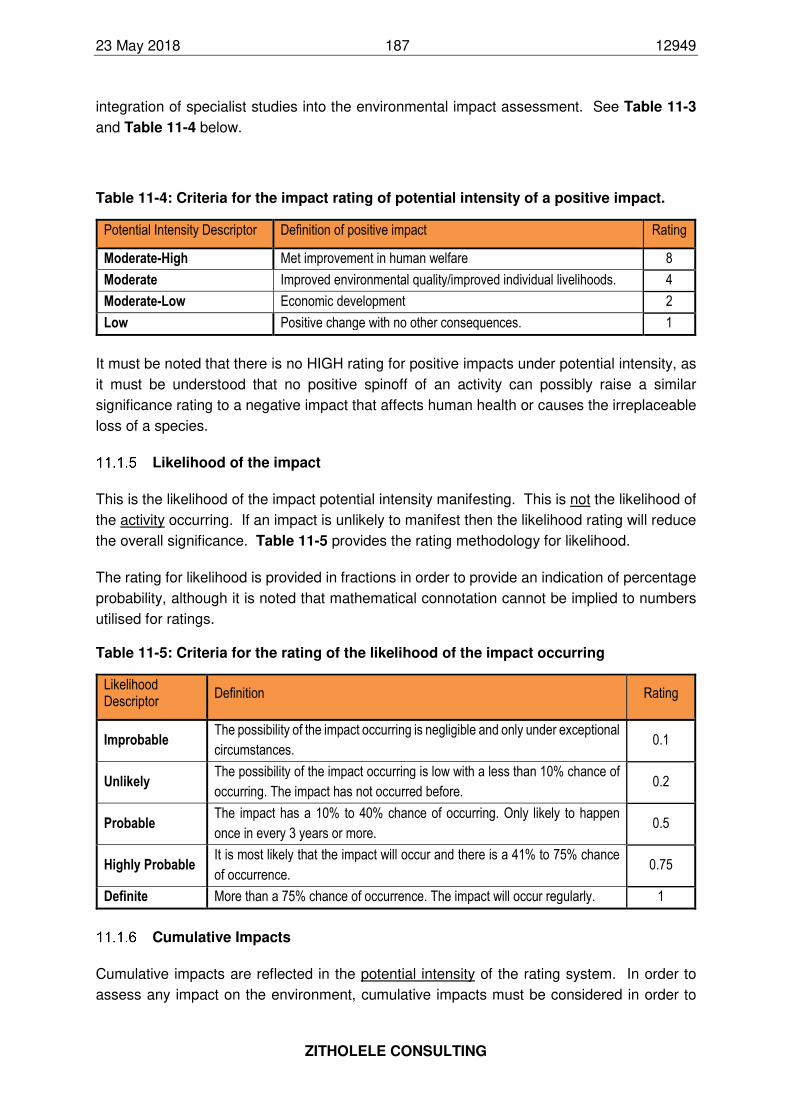
23 May 2018 187 12949
ZITHOLELE CONSULTING
integration of specialist studies into the environmental impact assessment. See Table 11-3
and Table 11-4 below.
Table 11-4: Criteria for the impact rating of potential intensity of a positive impact.
Potential Intensity Descriptor Definition of positive impact Rating
Moderate-High Met improvement in human welfare 8
Moderate Improved environmental quality/improved individual livelihoods. 4
Moderate-Low Economic development 2
Low Positive change with no other consequences. 1
It must be noted that there is no HIGH rating for positive impacts under potential intensity, as
it must be understood that no positive spinoff of an activity can possibly raise a similar
significance rating to a negative impact that affects human health or causes the irreplaceable
loss of a species.
Likelihood of the impact
This is the likelihood of the impact potential intensity manifesting. This is not the likelihood of
the activity occurring. If an impact is unlikely to manifest then the likelihood rating will reduce
the overall significance. Table 11-5 provides the rating methodology for likelihood.
The rating for likelihood is provided in fractions in order to provide an indication of percentage
probability, although it is noted that mathematical connotation cannot be implied to numbers
utilised for ratings.
Table 11-5: Criteria for the rating of the likelihood of the impact occurring
Likelihood Descriptor
Definition Rating
Improbable The possibility of the impact occurring is negligible and only under exceptional
circumstances. 0.1
Unlikely The possibility of the impact occurring is low with a less than 10% chance of
occurring. The impact has not occurred before. 0.2
Probable The impact has a 10% to 40% chance of occurring. Only likely to happen
once in every 3 years or more. 0.5
Highly Probable It is most likely that the impact will occur and there is a 41% to 75% chance
of occurrence. 0.75
Definite More than a 75% chance of occurrence. The impact will occur regularly. 1
Cumulative Impacts
Cumulative impacts are reflected in the potential intensity of the rating system. In order to
assess any impact on the environment, cumulative impacts must be considered in order to
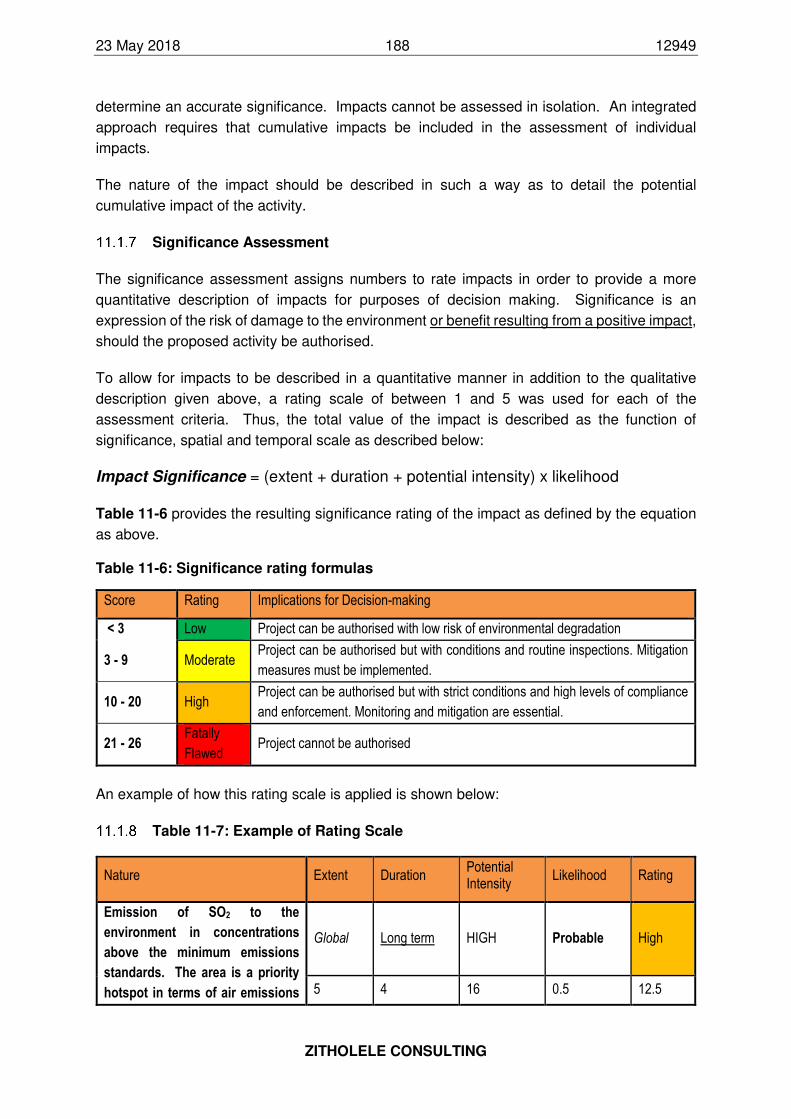
23 May 2018 188 12949
ZITHOLELE CONSULTING
determine an accurate significance. Impacts cannot be assessed in isolation. An integrated
approach requires that cumulative impacts be included in the assessment of individual
impacts.
The nature of the impact should be described in such a way as to detail the potential
cumulative impact of the activity.
Significance Assessment
The significance assessment assigns numbers to rate impacts in order to provide a more
quantitative description of impacts for purposes of decision making. Significance is an
expression of the risk of damage to the environment or benefit resulting from a positive impact,
should the proposed activity be authorised.
To allow for impacts to be described in a quantitative manner in addition to the qualitative
description given above, a rating scale of between 1 and 5 was used for each of the
assessment criteria. Thus, the total value of the impact is described as the function of
significance, spatial and temporal scale as described below:
Impact Significance = (extent + duration + potential intensity) x likelihood
Table 11-6 provides the resulting significance rating of the impact as defined by the equation
as above.
Table 11-6: Significance rating formulas
Score Rating Implications for Decision-making
< 3 Low Project can be authorised with low risk of environmental degradation
3 - 9 Moderate Project can be authorised but with conditions and routine inspections. Mitigation
measures must be implemented.
10 - 20 High Project can be authorised but with strict conditions and high levels of compliance
and enforcement. Monitoring and mitigation are essential.
21 - 26 Fatally
Flawed Project cannot be authorised
An example of how this rating scale is applied is shown below:
Table 11-7: Example of Rating Scale
Nature Extent Duration Potential Intensity
Likelihood Rating
Emission of SO2 to the
environment in concentrations
above the minimum emissions
standards. The area is a priority
hotspot in terms of air emissions
Global Long term HIGH Probable High
5 4 16 0.5 12.5
23 May 2018 189 12949
ZITHOLELE CONSULTING
and there are several industrial
operations that contribute to
extensive emissions of SO2.
Notation of Impacts
In order to make the report easier to read the following notation format is used to highlight the
various components of the assessment:
• Extent- in italics
• Duration – in underline
• Potential intensity – IN CAPITALS
• Likelihood - in bold
11.2 Geology and Geotechnical suitability
The geology and geotechnical conditions at the proposed railway yard area and FGD
infrastructure within the MPS footprint were considered by the geotechnical specialist based
on existing geological and geotechnical information obtained from existing studies covering
the study area.
Based in this available information the geotechnical specialist undertook a qualitative
assessment based on professional opinion of the impact of the underlying geology on the
proposed infrastructure developments.
FGD system within the MPS footprint
Based on existing information, most notably Golder report reference 12087-8856-1 entitled:
Medupi Power Station: Shallow Groundwater Study, dated June 2009, the following ground
conditions are apparent within the MPS footprint:
• The site is underlain by a sequence of pebbles, weathered quartzitic conglomerate with
fresh variously fractured quartzitic conglomerate at depth.
• The conglomerate is interbedded with bluish grey siltstone bands. The drilling has shown
that the siltstone forms discontinuous layers of up to 50cm thick but mostly about 20cm
thick.
• Generally surface weathering to shallow depth (<5m) occurs, while in some boreholes a
second fractured and associated weathered zone is observed and is normally found
between 7 - 14m.
• Some boreholes showed no surface weathering, while boreholes in the extreme north or
west, show the presence of deep weathering, up to 21m.
• Water strikes were made in 14 of the 35 boreholes at depths between 6 and 10.5m below
surface
The specialist concluded that:
23 May 2018 190 12949
ZITHOLELE CONSULTING
• Standard foundation systems are expected to be applicable, comprising generally shallow
foundations.
• Excavatability is expected to be soft to intermediate, with hard rock class (drill and blast)
for excavation in moderately weathered or harder rock (location dependent, but generally
below about 5m depth).
Railway yard, including limestone and gypsum handling facilities and
associated infrastructure
A qualitative assessment (professional opinion) of the geotechnical conditions within the
railway yard site was undertaken based on the existing Rockland Geocscience report (Ref:
RG014/169/Rev0) dated March 2015 entitled: Report on the Geotechnical Investigation
Conducted for a Proposed Rail Siding, Railway yard and Off-loading Facility at Medupi Power
Station, Lephalale, Limpopo Province.
The following conclusions were reached:
• Excavation of test pits and geophysical surveys across the site encountered medium
dense silty sand to between 1.1m and 1.8m, underlain by dense gravel to between 1.5m
and 2.4m, underlain by very soft rock quartzite, with TLB refusal at 1.8m on medium hard
rock quartzite at one test pit location, and finally refusal on hardpan ferricrete at 2.4m.
• Data and information on two boreholes closest to the railway yard revealed that one
borehole was dry while the other supported water levels at 2.6 m below surface. The dry
borehole indicates slightly and moderately weathered conglomeratic quartzite in zones
below 3.5m depth, becoming fresh from 14.5m depth, whilst the borehole containing water
indicated the boundary between slightly to moderately weathered quartzite and fresh
quartzite at 16.5m.
The Limestone Offloading Facility at the railway yard is proposed to be 15m in depth. Based
on the above, the following is interpreted:
• Hard rock (drill and blast) excavation will be required from a depth of about 2m.
• Dependent on the thickness of the surficial soils and any fill materials over the area, a
contingency allowance should be made for encountering rock during the installation of
such services or shallow foundations, where hard rock excavation (hydraulic rock hammer
or drill and blast) may be necessary.
• Standard footing systems such as shallow pad and strip footings are expected to be
applicable for the area.
• Deep excavations are expected to require reinforcement and/or stabilisation, particularly
at shallow depths. Dependent on the quality of the rock and degree of fracturing, the lower
half of the 15m deep excavation may potentially be unreinforced and unstabilised.
• Groundwater can be expected from a shallow depth in the excavation. The volume of water
seepage is expected to be relatively low, and reducing as the excavation proceeds into
less fractured rock.
23 May 2018 191 12949
ZITHOLELE CONSULTING
It was concluded, based on available studies and specialist opinion, that no significant
geotechnical hazards or fatal flaws were identified. All the geotechnical considerations
mentioned can be mitigated in the design of the facilities.
11.3 Soils and Land Capability
When considering the potential impacts of the proposed railway yard and FGD infrastructure
on the soils and land capability, firstly, it is important to note that the pre-development
conditions or status quo for the area of concern is one of disturbed industrial. For the most
part the site comprises land that has been cleared or disturbed to some degree by the existing
power station development.
Planning / Pre-development phase: Soils and Land Capability
No potential impacts on soils or land use were identified during the planning and pre-
development phase. The MPS was constructed to be wet FGD ready, therefore alignment of
the FGD system, railway yard and associated infrastructure were pre-determined during the
planning phases for the power station itself. Although design of the infrastructure is still
required to align with existing infrastructure at the MPS, no pre-construction intrusive work
was required to inform the designs.
Construction phase: Soils and Land Capability
Impact 1: Loss of utilisable resource (sterilization and erosion), compaction and
contamination or salinisation
During construction it is expected that soils within the development area will be stripped,
followed by preparation of laydown areas, stockpile areas and preparation of the surface for
construction of infrastructure.
Existing impact: Most of the proposed development site within the proposed FGD footprint
has been stripped of topsoil and transformed for construction purposes, therefore potential
loss of topsoil has potentially occurred already. In contrast, a large portion of the railway yard
site still has intact vegetation, which will be removed and topsoil stripped during the
construction phase.
Cumulative impact: Construction activities especially at the railway yard footprint will
contribute to the potential loss of topsoil if not managed and mitigated to acceptable levels.
The proposed retrofit project will, if improperly managed and without mitigation, have a
definite, MODERATE to HIGH negative significance, that will affect the development site and
its immediate surroundings for the medium to long term (life of the project and possibly
beyond), and is going to occur.
Residual impact: The proposed mitigation measures will probably reduce the negative
significance rating and resultant risk impact to a MODERATE or LOW. Based on the historical
activities (disturbed nature of the site) these actions are very likely to occur.
23 May 2018 192 12949
ZITHOLELE CONSULTING
Operational phase: Soils and Land Capability
Impact 1: Loss of utilisable resource (sterilization and erosion), compaction and
contamination or salinisation
The loss of utilisable soil resources during the operational phase revolve around potential for
spillage and contamination of the in-situ and stockpiled materials, contamination due to dirty
water run-off and/or contaminated dust deposition/dispersion, the de-nutrification of the
stockpiled soils due to excessive through flow and the leaching out of nutrients and metals
due to rain water on unconsolidated and poorly protected soils.
Existing impact: A positive impact will be the rehabilitation with stockpiled soils of areas
where temporary infrastructure was constructed or areas were cleared during the start-up and
construction phase.
Cumulative impact: This impact relates to the cumulative impact on stockpiled topsoil or
insitu soil due to spillages of hazardous substances, compaction due to uncontrolled vehicle
and pedestrian traffic, and loss of topsoil due to improperly managed erosion and handling.
In the un-managed scenario these activities will probably result in a MODERATE to HIGH
negative significance that will affect the development footprint and adjacent sites for the
medium to long term. These effects are very likely to occur.
Residual Impact: In the long term (Life of the operation and beyond) and if implemented
correctly, the above mitigation measures will probably reduce the negative impact on the
utilisable soil reserves to a significance rating of MODERATE LOW in the medium term, and
is very likely to occur.
However, if the soils are not retained/stored and managed, and a workable management plan
is not implemented the residual impact will definitely incur additional costs and result in the
impacting of secondary areas (Borrow Pits etc.) in order to obtain cover materials etc.
Decommissioning and closure phase: Soils and Land Capability
Impact 1: Net loss of soil volumes and utilisation potential due to change in material
status (Physical and Chemical) and loss of nutrient base.
Existing impact: The impacts on the soil resource during the decommissioning and closure
phase may potentially have both a positive (i.e. reduction in areas of disturbance through
rehabilitation and return of soil utilization potential), and a negative effect, through loss of soils,
erosion, compaction and contamination of the natural resource.
Cumulative impact: The impact will probably remain the net loss of the soil resource if no
intervention or mitigating strategy is implemented. The intensity potential will remain
MODERATE and negative for the medium to short term for all of the activities if there is no
active management (rehabilitation and intervention) in the decommissioning phase, and
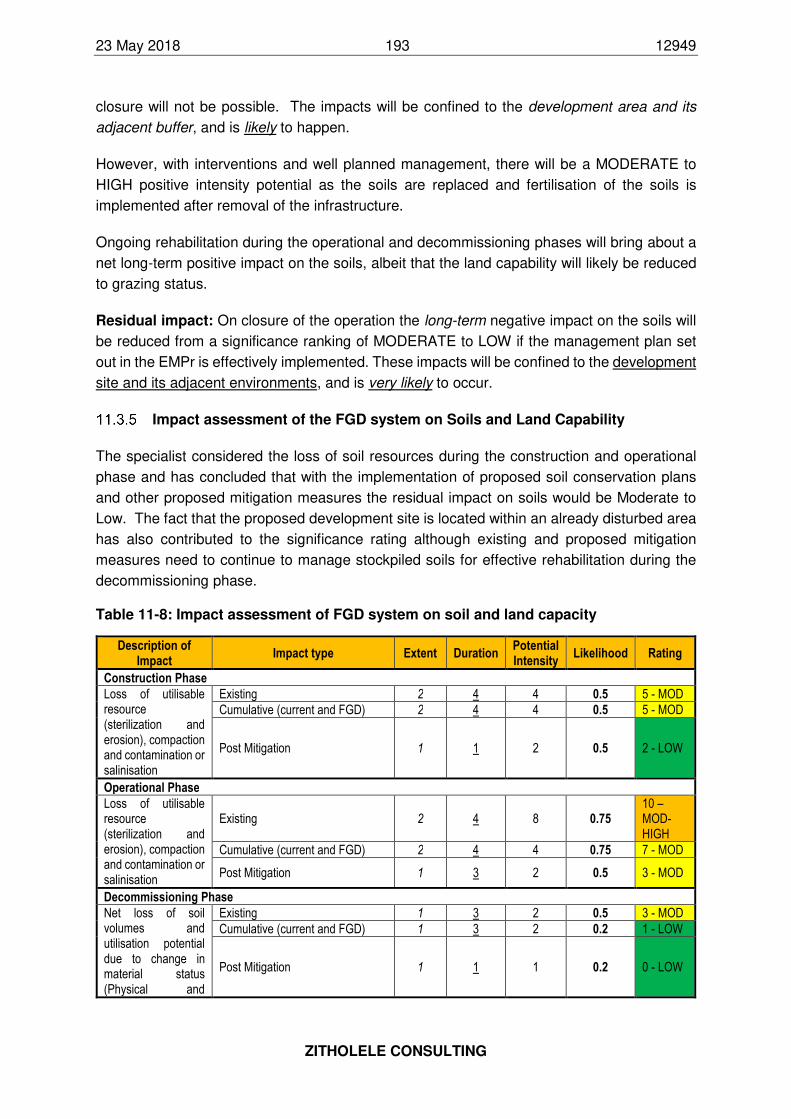
23 May 2018 193 12949
ZITHOLELE CONSULTING
closure will not be possible. The impacts will be confined to the development area and its
adjacent buffer, and is likely to happen.
However, with interventions and well planned management, there will be a MODERATE to
HIGH positive intensity potential as the soils are replaced and fertilisation of the soils is
implemented after removal of the infrastructure.
Ongoing rehabilitation during the operational and decommissioning phases will bring about a
net long-term positive impact on the soils, albeit that the land capability will likely be reduced
to grazing status.
Residual impact: On closure of the operation the long-term negative impact on the soils will
be reduced from a significance ranking of MODERATE to LOW if the management plan set
out in the EMPr is effectively implemented. These impacts will be confined to the development
site and its adjacent environments, and is very likely to occur.
Impact assessment of the FGD system on Soils and Land Capability
The specialist considered the loss of soil resources during the construction and operational
phase and has concluded that with the implementation of proposed soil conservation plans
and other proposed mitigation measures the residual impact on soils would be Moderate to
Low. The fact that the proposed development site is located within an already disturbed area
has also contributed to the significance rating although existing and proposed mitigation
measures need to continue to manage stockpiled soils for effective rehabilitation during the
decommissioning phase.
Table 11-8: Impact assessment of FGD system on soil and land capacity
Description of Impact
Impact type Extent Duration Potential Intensity
Likelihood Rating
Construction Phase
Loss of utilisable resource (sterilization and erosion), compaction and contamination or salinisation
Existing 2 4 4 0.5 5 - MOD
Cumulative (current and FGD) 2 4 4 0.5 5 - MOD
Post Mitigation 1 1 2 0.5 2 - LOW
Operational Phase
Loss of utilisable resource (sterilization and erosion), compaction and contamination or salinisation
Existing 2 4 8 0.75 10 – MOD-HIGH
Cumulative (current and FGD) 2 4 4 0.75 7 - MOD
Post Mitigation 1 3 2 0.5 3 - MOD
Decommissioning Phase
Net loss of soil volumes and utilisation potential due to change in material status (Physical and
Existing 1 3 2 0.5 3 - MOD
Cumulative (current and FGD) 1 3 2 0.2 1 - LOW
Post Mitigation 1 1 1 0.2 0 - LOW
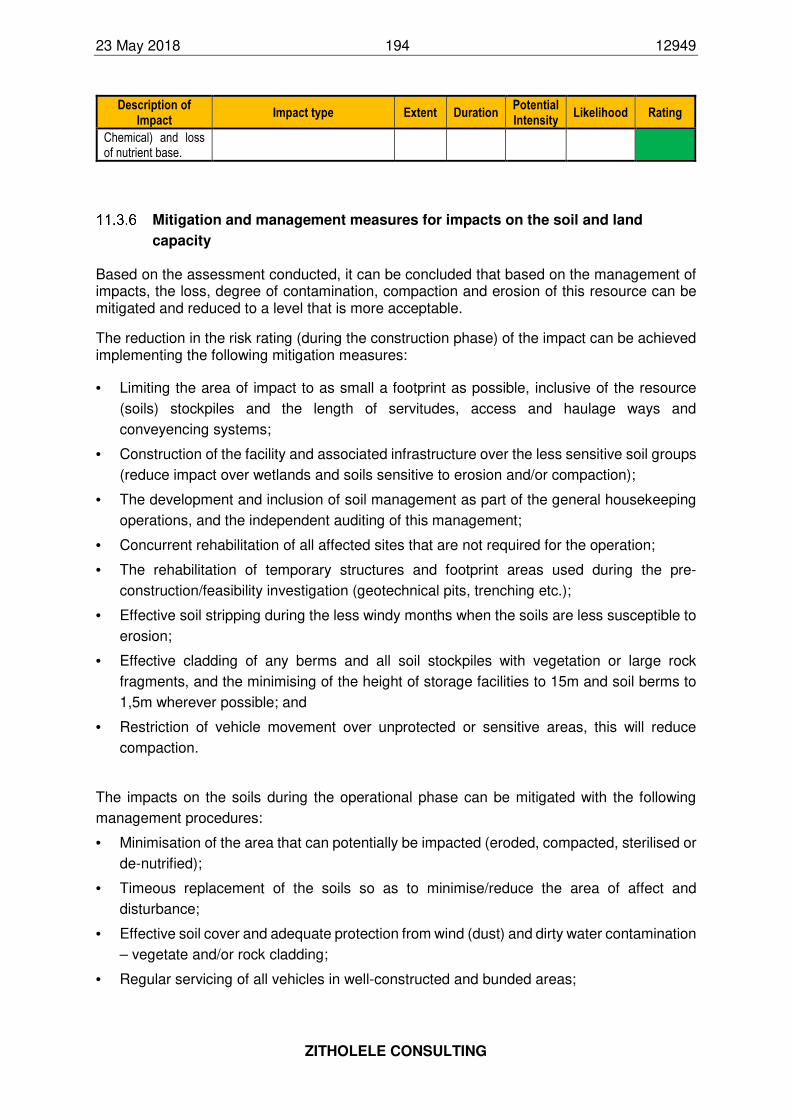
23 May 2018 194 12949
ZITHOLELE CONSULTING
Description of Impact
Impact type Extent Duration Potential Intensity
Likelihood Rating
Chemical) and loss of nutrient base.
Mitigation and management measures for impacts on the soil and land
capacity
Based on the assessment conducted, it can be concluded that based on the management of impacts, the loss, degree of contamination, compaction and erosion of this resource can be mitigated and reduced to a level that is more acceptable.
The reduction in the risk rating (during the construction phase) of the impact can be achieved implementing the following mitigation measures:
• Limiting the area of impact to as small a footprint as possible, inclusive of the resource
(soils) stockpiles and the length of servitudes, access and haulage ways and
conveyencing systems;
• Construction of the facility and associated infrastructure over the less sensitive soil groups
(reduce impact over wetlands and soils sensitive to erosion and/or compaction);
• The development and inclusion of soil management as part of the general housekeeping
operations, and the independent auditing of this management;
• Concurrent rehabilitation of all affected sites that are not required for the operation;
• The rehabilitation of temporary structures and footprint areas used during the pre-
construction/feasibility investigation (geotechnical pits, trenching etc.);
• Effective soil stripping during the less windy months when the soils are less susceptible to
erosion;
• Effective cladding of any berms and all soil stockpiles with vegetation or large rock
fragments, and the minimising of the height of storage facilities to 15m and soil berms to
1,5m wherever possible; and
• Restriction of vehicle movement over unprotected or sensitive areas, this will reduce
compaction.
The impacts on the soils during the operational phase can be mitigated with the following
management procedures:
• Minimisation of the area that can potentially be impacted (eroded, compacted, sterilised or
de-nutrified);
• Timeous replacement of the soils so as to minimise/reduce the area of affect and
disturbance;
• Effective soil cover and adequate protection from wind (dust) and dirty water contamination
– vegetate and/or rock cladding;
• Regular servicing of all vehicles in well-constructed and bunded areas;
23 May 2018 195 12949
ZITHOLELE CONSULTING
• Regular cleaning and maintenance of all haulage ways, conveyencing routes and service
ways, drains and storm water control facilities;
• Containment and management of spillage;
• Soil replacement and the preparation of a seed bed to facilitate and accelerate the re-
vegetation program and to limit potential erosion on all areas that become available for
rehabilitation (temporary servitudes), and
• Soil amelioration (rehabilitated and stockpiled) to enhance the growth capability of the soils
and sustain the soils ability to retain oxygen and nutrients, thus sustaining vegetative
material during the storage stage.
11.4 Groundwater
The groundwater specialist undertook a qualitative assessment (professional opinion) of the
potential impact that identified aspects or activities may have on groundwater resources
underlying the railway yard and FGD infrastructure study area within the MPS. The qualitative
assessment took into consideration the existing groundwater studies that were undertaken
during the initial EIA application for the MPS itself, as well as subsequent groundwater studies
and monitoring reports that was undertaken within the proposed study area. Qualitative
assessments were undertaken for the following aspects / activities:
• Trucking of Type 1 Waste to a Hazardous Disposal Facility;
• Construction and operation of the FGD system within the Medupi Power Station Footprint,
including all associated infrastructure and processes necessary to support its operation;
and
• Construction and operation of the railway yard, limestone and gypsum handling facilities,
including diesel storage facilities and associated infrastructure between the Medupi Power
Station and existing ADF.
Professional opinion on trucking of Type 1 Waste to a Hazardous Disposal
Facility
For a 5-year period of the operational phase, sludge and salts will be trucked to a licensed
hazardous waste disposal site. During transportation of hazardous waste, the trucking
contractor should adhere to all regulations and standards of both environment and safety. Safe
Working Procedures (SWP) for transportation of hazardous waste must be in place, to
minimize the risk of contamination to the environment and groundwater should a spillage
occur.
A hazardous spillage could contaminate the groundwater, and samples of any nearby
boreholes should be analysed and monitored after a spillage incident. Storage of hazardous
waste on site will arise to additional disposal facilities and increasing risks to contamination
the groundwater regime.
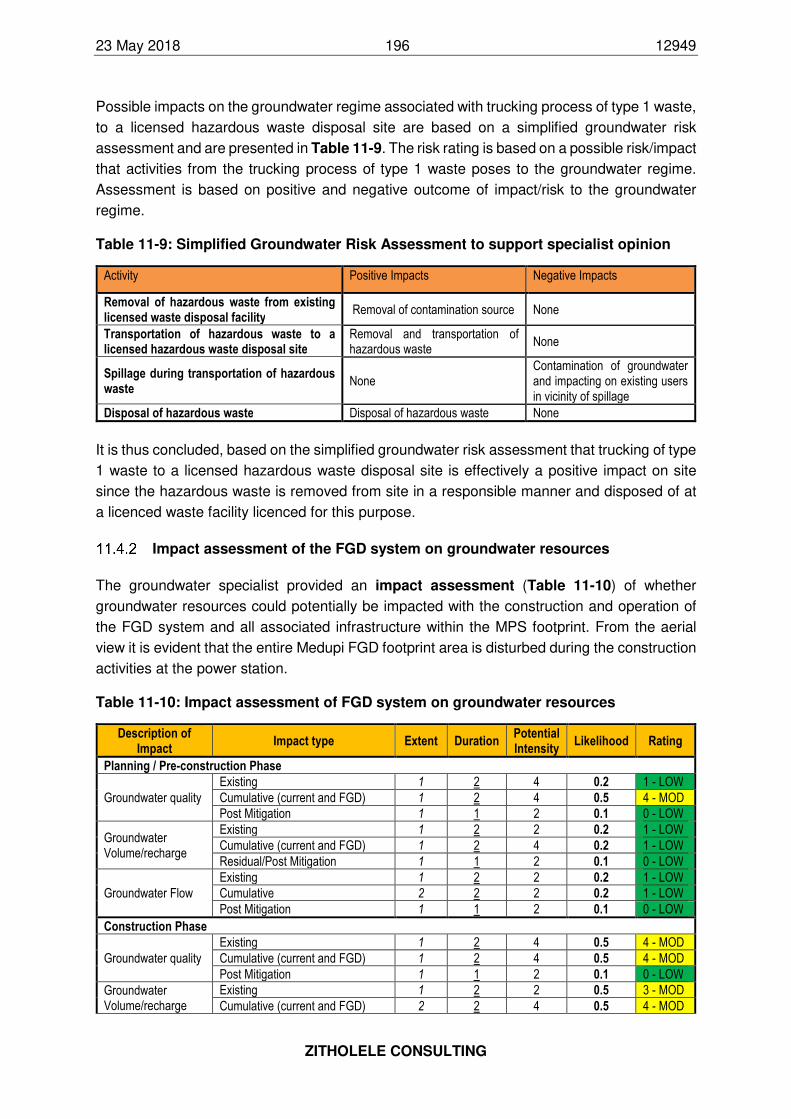
23 May 2018 196 12949
ZITHOLELE CONSULTING
Possible impacts on the groundwater regime associated with trucking process of type 1 waste,
to a licensed hazardous waste disposal site are based on a simplified groundwater risk
assessment and are presented in Table 11-9. The risk rating is based on a possible risk/impact
that activities from the trucking process of type 1 waste poses to the groundwater regime.
Assessment is based on positive and negative outcome of impact/risk to the groundwater
regime.
Table 11-9: Simplified Groundwater Risk Assessment to support specialist opinion
Activity Positive Impacts Negative Impacts
Removal of hazardous waste from existing licensed waste disposal facility
Removal of contamination source None
Transportation of hazardous waste to a licensed hazardous waste disposal site
Removal and transportation of hazardous waste
None
Spillage during transportation of hazardous waste
None Contamination of groundwater and impacting on existing users in vicinity of spillage
Disposal of hazardous waste Disposal of hazardous waste None
It is thus concluded, based on the simplified groundwater risk assessment that trucking of type
1 waste to a licensed hazardous waste disposal site is effectively a positive impact on site
since the hazardous waste is removed from site in a responsible manner and disposed of at
a licenced waste facility licenced for this purpose.
Impact assessment of the FGD system on groundwater resources
The groundwater specialist provided an impact assessment (Table 11-10) of whether
groundwater resources could potentially be impacted with the construction and operation of
the FGD system and all associated infrastructure within the MPS footprint. From the aerial
view it is evident that the entire Medupi FGD footprint area is disturbed during the construction
activities at the power station.
Table 11-10: Impact assessment of FGD system on groundwater resources
Description of Impact
Impact type Extent Duration Potential Intensity
Likelihood Rating
Planning / Pre-construction Phase
Groundwater quality
Existing 1 2 4 0.2 1 - LOW
Cumulative (current and FGD) 1 2 4 0.5 4 - MOD
Post Mitigation 1 1 2 0.1 0 - LOW
Groundwater Volume/recharge
Existing 1 2 2 0.2 1 - LOW
Cumulative (current and FGD) 1 2 4 0.2 1 - LOW
Residual/Post Mitigation 1 1 2 0.1 0 - LOW
Groundwater Flow
Existing 1 2 2 0.2 1 - LOW
Cumulative 2 2 2 0.2 1 - LOW
Post Mitigation 1 1 2 0.1 0 - LOW
Construction Phase
Groundwater quality
Existing 1 2 4 0.5 4 - MOD
Cumulative (current and FGD) 1 2 4 0.5 4 - MOD
Post Mitigation 1 1 2 0.1 0 - LOW
Groundwater Volume/recharge
Existing 1 2 2 0.5 3 - MOD
Cumulative (current and FGD) 2 2 4 0.5 4 - MOD
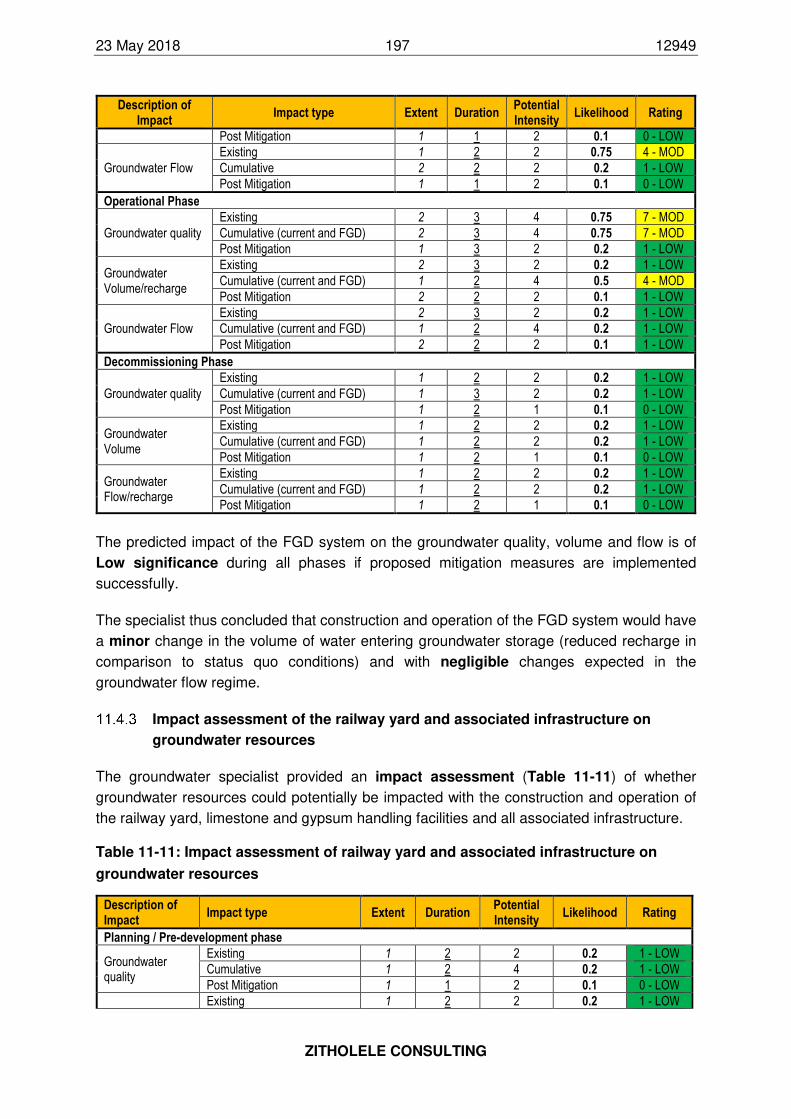
23 May 2018 197 12949
ZITHOLELE CONSULTING
Description of Impact
Impact type Extent Duration Potential Intensity
Likelihood Rating
Post Mitigation 1 1 2 0.1 0 - LOW
Groundwater Flow
Existing 1 2 2 0.75 4 - MOD
Cumulative 2 2 2 0.2 1 - LOW
Post Mitigation 1 1 2 0.1 0 - LOW
Operational Phase
Groundwater quality
Existing 2 3 4 0.75 7 - MOD
Cumulative (current and FGD) 2 3 4 0.75 7 - MOD
Post Mitigation 1 3 2 0.2 1 - LOW
Groundwater Volume/recharge
Existing 2 3 2 0.2 1 - LOW
Cumulative (current and FGD) 1 2 4 0.5 4 - MOD
Post Mitigation 2 2 2 0.1 1 - LOW
Groundwater Flow
Existing 2 3 2 0.2 1 - LOW
Cumulative (current and FGD) 1 2 4 0.2 1 - LOW
Post Mitigation 2 2 2 0.1 1 - LOW
Decommissioning Phase
Groundwater quality
Existing 1 2 2 0.2 1 - LOW
Cumulative (current and FGD) 1 3 2 0.2 1 - LOW
Post Mitigation 1 2 1 0.1 0 - LOW
Groundwater Volume
Existing 1 2 2 0.2 1 - LOW
Cumulative (current and FGD) 1 2 2 0.2 1 - LOW
Post Mitigation 1 2 1 0.1 0 - LOW
Groundwater Flow/recharge
Existing 1 2 2 0.2 1 - LOW
Cumulative (current and FGD) 1 2 2 0.2 1 - LOW
Post Mitigation 1 2 1 0.1 0 - LOW
The predicted impact of the FGD system on the groundwater quality, volume and flow is of
Low significance during all phases if proposed mitigation measures are implemented
successfully.
The specialist thus concluded that construction and operation of the FGD system would have
a minor change in the volume of water entering groundwater storage (reduced recharge in
comparison to status quo conditions) and with negligible changes expected in the
groundwater flow regime.
Impact assessment of the railway yard and associated infrastructure on
groundwater resources
The groundwater specialist provided an impact assessment (Table 11-11) of whether
groundwater resources could potentially be impacted with the construction and operation of
the railway yard, limestone and gypsum handling facilities and all associated infrastructure.
Table 11-11: Impact assessment of railway yard and associated infrastructure on
groundwater resources
Description of Impact
Impact type Extent Duration Potential Intensity
Likelihood Rating
Planning / Pre-development phase
Groundwater quality
Existing 1 2 2 0.2 1 - LOW
Cumulative 1 2 4 0.2 1 - LOW
Post Mitigation 1 1 2 0.1 0 - LOW
Existing 1 2 2 0.2 1 - LOW
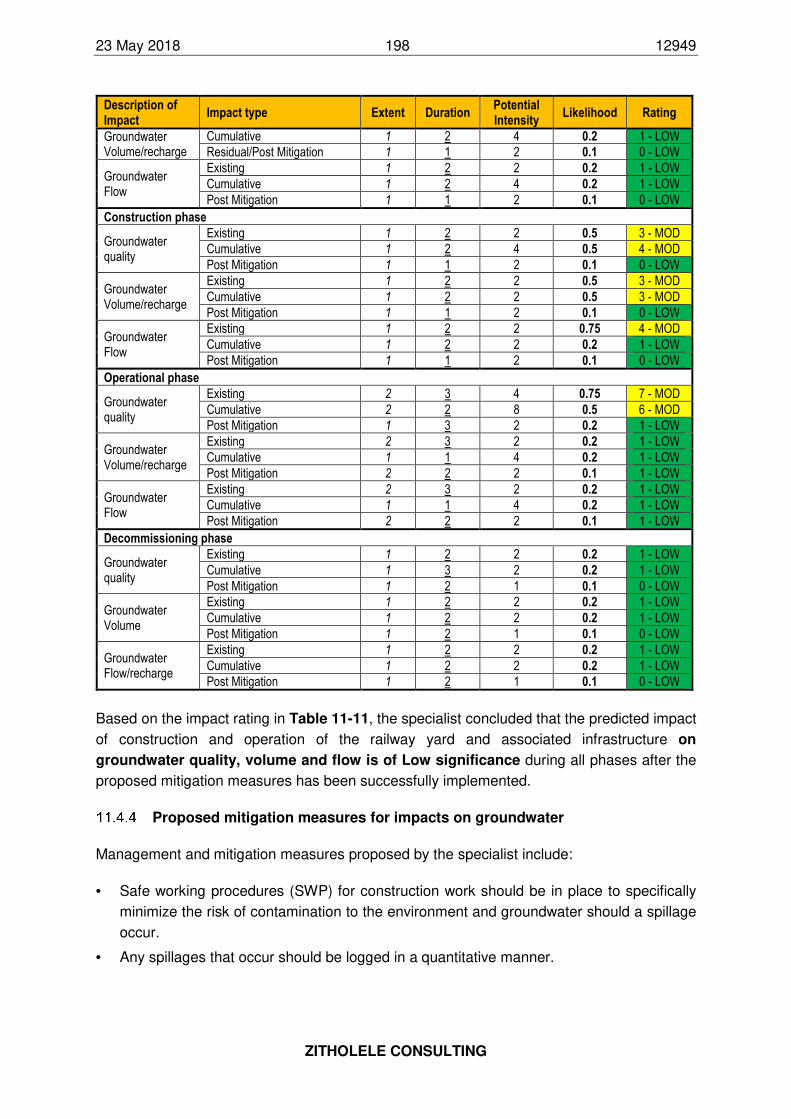
23 May 2018 198 12949
ZITHOLELE CONSULTING
Description of Impact
Impact type Extent Duration Potential Intensity
Likelihood Rating
Groundwater Volume/recharge
Cumulative 1 2 4 0.2 1 - LOW
Residual/Post Mitigation 1 1 2 0.1 0 - LOW
Groundwater Flow
Existing 1 2 2 0.2 1 - LOW
Cumulative 1 2 4 0.2 1 - LOW
Post Mitigation 1 1 2 0.1 0 - LOW
Construction phase
Groundwater quality
Existing 1 2 2 0.5 3 - MOD
Cumulative 1 2 4 0.5 4 - MOD
Post Mitigation 1 1 2 0.1 0 - LOW
Groundwater Volume/recharge
Existing 1 2 2 0.5 3 - MOD
Cumulative 1 2 2 0.5 3 - MOD
Post Mitigation 1 1 2 0.1 0 - LOW
Groundwater Flow
Existing 1 2 2 0.75 4 - MOD
Cumulative 1 2 2 0.2 1 - LOW
Post Mitigation 1 1 2 0.1 0 - LOW
Operational phase
Groundwater quality
Existing 2 3 4 0.75 7 - MOD
Cumulative 2 2 8 0.5 6 - MOD
Post Mitigation 1 3 2 0.2 1 - LOW
Groundwater Volume/recharge
Existing 2 3 2 0.2 1 - LOW
Cumulative 1 1 4 0.2 1 - LOW
Post Mitigation 2 2 2 0.1 1 - LOW
Groundwater Flow
Existing 2 3 2 0.2 1 - LOW
Cumulative 1 1 4 0.2 1 - LOW
Post Mitigation 2 2 2 0.1 1 - LOW
Decommissioning phase
Groundwater quality
Existing 1 2 2 0.2 1 - LOW
Cumulative 1 3 2 0.2 1 - LOW
Post Mitigation 1 2 1 0.1 0 - LOW
Groundwater Volume
Existing 1 2 2 0.2 1 - LOW
Cumulative 1 2 2 0.2 1 - LOW
Post Mitigation 1 2 1 0.1 0 - LOW
Groundwater Flow/recharge
Existing 1 2 2 0.2 1 - LOW
Cumulative 1 2 2 0.2 1 - LOW
Post Mitigation 1 2 1 0.1 0 - LOW
Based on the impact rating in Table 11-11, the specialist concluded that the predicted impact
of construction and operation of the railway yard and associated infrastructure on
groundwater quality, volume and flow is of Low significance during all phases after the
proposed mitigation measures has been successfully implemented.
Proposed mitigation measures for impacts on groundwater
Management and mitigation measures proposed by the specialist include:
• Safe working procedures (SWP) for construction work should be in place to specifically
minimize the risk of contamination to the environment and groundwater should a spillage
occur.
• Any spillages that occur should be logged in a quantitative manner.
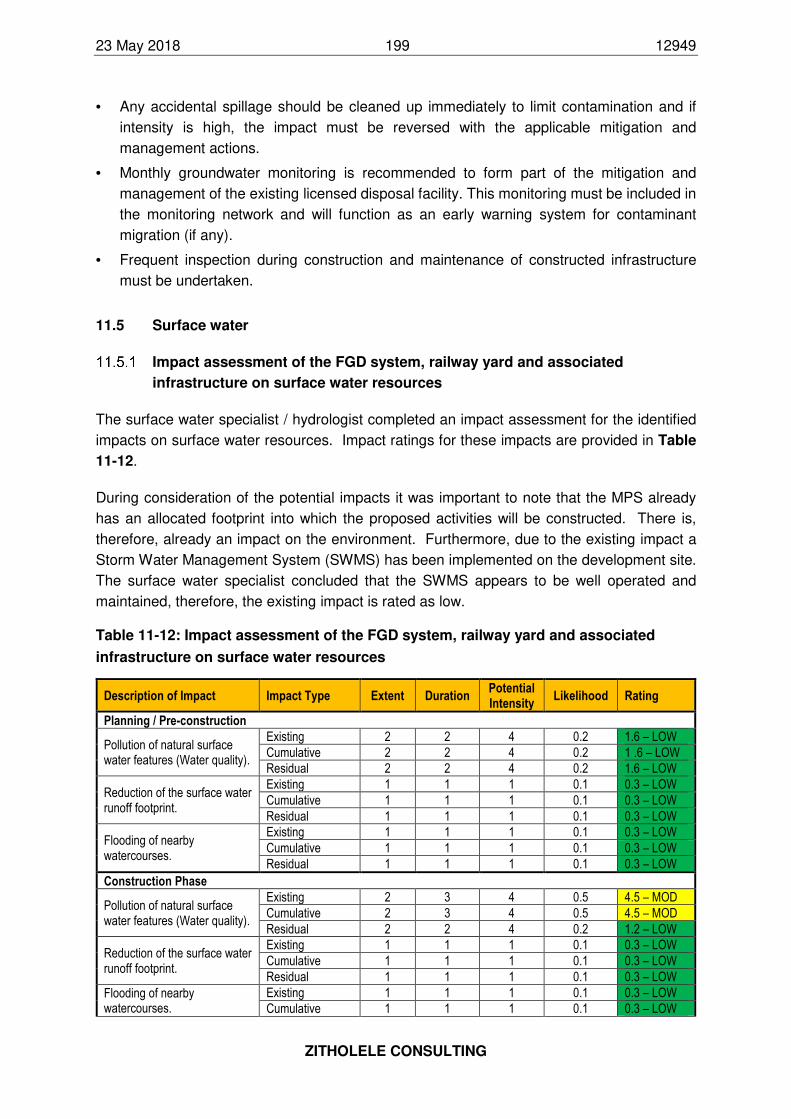
23 May 2018 199 12949
ZITHOLELE CONSULTING
• Any accidental spillage should be cleaned up immediately to limit contamination and if
intensity is high, the impact must be reversed with the applicable mitigation and
management actions.
• Monthly groundwater monitoring is recommended to form part of the mitigation and
management of the existing licensed disposal facility. This monitoring must be included in
the monitoring network and will function as an early warning system for contaminant
migration (if any).
• Frequent inspection during construction and maintenance of constructed infrastructure
must be undertaken.
11.5 Surface water
Impact assessment of the FGD system, railway yard and associated
infrastructure on surface water resources
The surface water specialist / hydrologist completed an impact assessment for the identified
impacts on surface water resources. Impact ratings for these impacts are provided in Table
11-12.
During consideration of the potential impacts it was important to note that the MPS already
has an allocated footprint into which the proposed activities will be constructed. There is,
therefore, already an impact on the environment. Furthermore, due to the existing impact a
Storm Water Management System (SWMS) has been implemented on the development site.
The surface water specialist concluded that the SWMS appears to be well operated and
maintained, therefore, the existing impact is rated as low.
Table 11-12: Impact assessment of the FGD system, railway yard and associated
infrastructure on surface water resources
Description of Impact Impact Type Extent Duration Potential Intensity
Likelihood Rating
Planning / Pre-construction
Pollution of natural surface water features (Water quality).
Existing 2 2 4 0.2 1.6 – LOW
Cumulative 2 2 4 0.2 1 .6 – LOW
Residual 2 2 4 0.2 1.6 – LOW
Reduction of the surface water runoff footprint.
Existing 1 1 1 0.1 0.3 – LOW
Cumulative 1 1 1 0.1 0.3 – LOW
Residual 1 1 1 0.1 0.3 – LOW
Flooding of nearby watercourses.
Existing 1 1 1 0.1 0.3 – LOW
Cumulative 1 1 1 0.1 0.3 – LOW
Residual 1 1 1 0.1 0.3 – LOW
Construction Phase
Pollution of natural surface water features (Water quality).
Existing 2 3 4 0.5 4.5 – MOD
Cumulative 2 3 4 0.5 4.5 – MOD
Residual 2 2 4 0.2 1.2 – LOW
Reduction of the surface water runoff footprint.
Existing 1 1 1 0.1 0.3 – LOW
Cumulative 1 1 1 0.1 0.3 – LOW
Residual 1 1 1 0.1 0.3 – LOW
Flooding of nearby watercourses.
Existing 1 1 1 0.1 0.3 – LOW
Cumulative 1 1 1 0.1 0.3 – LOW
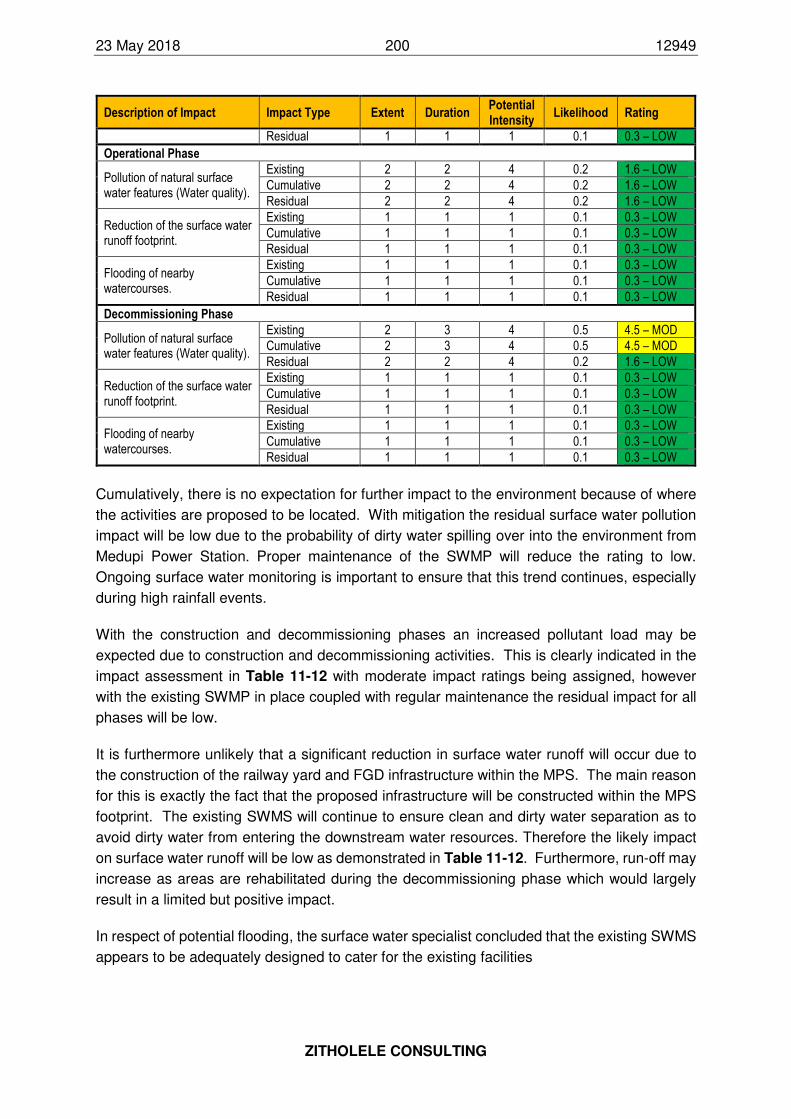
23 May 2018 200 12949
ZITHOLELE CONSULTING
Description of Impact Impact Type Extent Duration Potential Intensity
Likelihood Rating
Residual 1 1 1 0.1 0.3 – LOW
Operational Phase
Pollution of natural surface water features (Water quality).
Existing 2 2 4 0.2 1.6 – LOW
Cumulative 2 2 4 0.2 1.6 – LOW
Residual 2 2 4 0.2 1.6 – LOW
Reduction of the surface water runoff footprint.
Existing 1 1 1 0.1 0.3 – LOW
Cumulative 1 1 1 0.1 0.3 – LOW
Residual 1 1 1 0.1 0.3 – LOW
Flooding of nearby watercourses.
Existing 1 1 1 0.1 0.3 – LOW
Cumulative 1 1 1 0.1 0.3 – LOW
Residual 1 1 1 0.1 0.3 – LOW
Decommissioning Phase
Pollution of natural surface water features (Water quality).
Existing 2 3 4 0.5 4.5 – MOD
Cumulative 2 3 4 0.5 4.5 – MOD
Residual 2 2 4 0.2 1.6 – LOW
Reduction of the surface water runoff footprint.
Existing 1 1 1 0.1 0.3 – LOW
Cumulative 1 1 1 0.1 0.3 – LOW
Residual 1 1 1 0.1 0.3 – LOW
Flooding of nearby watercourses.
Existing 1 1 1 0.1 0.3 – LOW
Cumulative 1 1 1 0.1 0.3 – LOW
Residual 1 1 1 0.1 0.3 – LOW
Cumulatively, there is no expectation for further impact to the environment because of where
the activities are proposed to be located. With mitigation the residual surface water pollution
impact will be low due to the probability of dirty water spilling over into the environment from
Medupi Power Station. Proper maintenance of the SWMP will reduce the rating to low.
Ongoing surface water monitoring is important to ensure that this trend continues, especially
during high rainfall events.
With the construction and decommissioning phases an increased pollutant load may be
expected due to construction and decommissioning activities. This is clearly indicated in the
impact assessment in Table 11-12 with moderate impact ratings being assigned, however
with the existing SWMP in place coupled with regular maintenance the residual impact for all
phases will be low.
It is furthermore unlikely that a significant reduction in surface water runoff will occur due to
the construction of the railway yard and FGD infrastructure within the MPS. The main reason
for this is exactly the fact that the proposed infrastructure will be constructed within the MPS
footprint. The existing SWMS will continue to ensure clean and dirty water separation as to
avoid dirty water from entering the downstream water resources. Therefore the likely impact
on surface water runoff will be low as demonstrated in Table 11-12. Furthermore, run-off may
increase as areas are rehabilitated during the decommissioning phase which would largely
result in a limited but positive impact.
In respect of potential flooding, the surface water specialist concluded that the existing SWMS
appears to be adequately designed to cater for the existing facilities
23 May 2018 201 12949
ZITHOLELE CONSULTING
The specialist further concluded that the runoff around the facility in the clean areas is not
markedly changed for the sub-catchment of the Sandloop, resulting in a potential impact
significance of low.
Specialist Opinion on sludge and salts trucking impact
The surface water specialist provided a qualitative assessment (specialist opinion) on the
significance of the surface water impacts for the proposed trucking of sludge and salts from
MPS proposed temporary hazardous waste storage area in Limpopo Province to an
appropriately licensed existing hazardous waste facility outside of the Medupi Power Station
study area. The specialist made the following observations and conclusions:
• The trucking of salts and sludge from Medupi to the licensed hazardous waste site will
pose a medium potential risk impact to the water resources in the study area.
• The medium, rather than high, risk impact assessment rating is in light of the fact that MPS
has taken significant steps in investigating this matter beforehand. Various specialist
studies have been commissioned to investigate this matter and its associated risks
thoroughly and give specialist opinions as well as mitigation measures where possible.
• The specialist concluded in his opinion that the transportation of salts and sludge from
Medupi Power Station to an appropriately licensed existing hazardous waste facility
outside of the study area will not pose a serious threat to water resources in the region.
Mitigation and management measures for potential surface water impacts
Considering all potential impacts identified on the surface water resources the specialist
proposed the following mitigation and management measures:
• As this will be within the existing footprint, it is unlikely that there will be considerable
impacts from the removal of vegetation and/or topsoil during excavation. However, this
aspect should be considered and managed to reduce erosion which could cause siltation
of the surrounding surface water resources.
• Removal of topsoil should be done systematically, only clearing the necessary areas at a
time.
• Clean and dirty surface water channels must be constructed to divert runoff separately to
the appropriate storage dams (dirty water to the PCD to avoid eroded soils entering the
clean water areas) as required by the relevant legislation and norms and standards.
• The existing SWMS will need to be optimally operated and maintained.
• Ongoing monitoring of the surface water must continue or be commissioned for pH, Total
Dissolved Solids, Electrical Conductivity, Alkalinity, potassium, calcium, sodium, chloride,
fluoride, sulphate, nitrate, ammonium, Total Hardness, Metals: arsenic, beryllium,
cadmium, barium, chromium, copper, lead, mercury, molybdenum, nickel, selenium,
uranium, vanadium and zinc using ICP-MS), orthophosphate, Total Suspended Solids, Oil
and Grease.
23 May 2018 202 12949
ZITHOLELE CONSULTING
• Monitoring of surface water must be undertaken in accordance with the stipulations of the
Water Use Licence, once issued.
• To prevent possible pollution of the receiving surface water environment, dirty water
containment structures should be designed, constructed, maintained and operated such
that they do not spill over more than once in 50 years. A minimum freeboard of 0.8 m
above Full Supply Level (FSL) must also be maintained as per GN704 requirements (flow-
based hydraulic sizing requirements).
• Water accumulated in the containment facility during the wet season should be used as a
priority in the process water circuit to ensure that the capacity requirements are not
compromised during periods of heavy and/or extended rainfall.
• It is recommended that an update to both the storm water management plan (SWMP) and
the existing water balance be undertaken such that it caters for the proposed FGD and
ADF infrastructure as well as be designed and operated in line with the DWS’s GN704.
• The proposed water quality monitoring programme, as per the stipulations of the Water
Use Licence, once issued, must be strictly followed and sustained so that chemical
constituent levels can be monitored and analysed over time.
• Pollution of surrounding surface water features should be avoided at all costs during the
lifespan of the Medupi Power Station project. In the unfortunate occurrence of surface
water resources pollution, swift and effective corrective measures should be implemented,
and the relevant authorities notified without delay.
• With respect to the transportation of sludge and salts from Medupi to a hazardous waste
disposal site, it is recommended that a route selection study be carried out to determine
the least potential water surface impacts, considering other factors such as the traffic
impact assessment. From a surface water perspective, a route via a national road
(highway) would be most appropriate as the likelihood of accidents and spillages due to
poor road conditions will be minimised.
• The service provider must undertake all required permitting and compliance processes, as
required.
11.6 Biodiversity (Terrestrial Ecology) and Wetlands
Impact assessment of the FGD system, railway yard and associated
infrastructure on terrestrial ecology and wetlands
The terrestrial ecologist and wetland specialist undertook an impact assessment for the
identified impacts on ecology and wetland resources in and around the study site. Impact
ratings for identified impacts are provided in Table 11-13.
It should be noted that the scope of the biodiversity specialist assessment included
assessment of impact on terrestrial ecology and wetlands resulting from the construction and
operation of the FGD system, railway yard, all associated infrastructure, fuel storage areas
and ADF, and surrounding sensitive areas. This EIA however only considered the
construction and operation of the FGD system, railway yard and associated infrastructure,
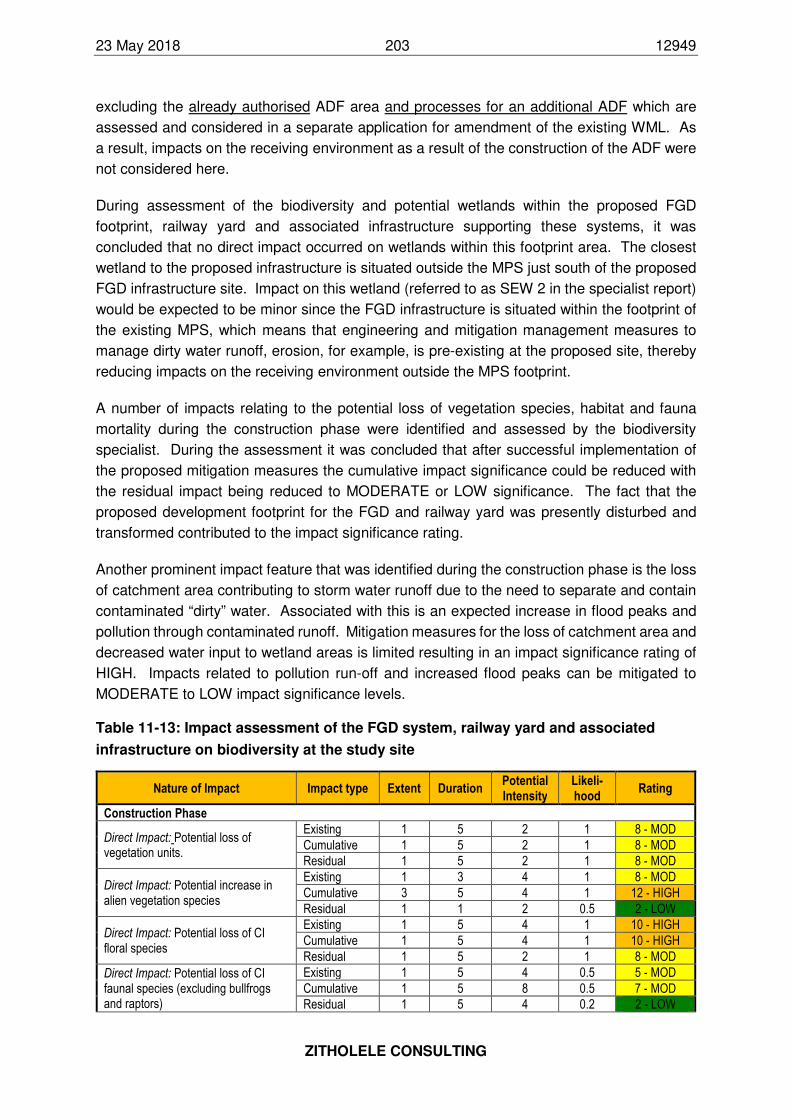
23 May 2018 203 12949
ZITHOLELE CONSULTING
excluding the already authorised ADF area and processes for an additional ADF which are
assessed and considered in a separate application for amendment of the existing WML. As
a result, impacts on the receiving environment as a result of the construction of the ADF were
not considered here.
During assessment of the biodiversity and potential wetlands within the proposed FGD
footprint, railway yard and associated infrastructure supporting these systems, it was
concluded that no direct impact occurred on wetlands within this footprint area. The closest
wetland to the proposed infrastructure is situated outside the MPS just south of the proposed
FGD infrastructure site. Impact on this wetland (referred to as SEW 2 in the specialist report)
would be expected to be minor since the FGD infrastructure is situated within the footprint of
the existing MPS, which means that engineering and mitigation management measures to
manage dirty water runoff, erosion, for example, is pre-existing at the proposed site, thereby
reducing impacts on the receiving environment outside the MPS footprint.
A number of impacts relating to the potential loss of vegetation species, habitat and fauna
mortality during the construction phase were identified and assessed by the biodiversity
specialist. During the assessment it was concluded that after successful implementation of
the proposed mitigation measures the cumulative impact significance could be reduced with
the residual impact being reduced to MODERATE or LOW significance. The fact that the
proposed development footprint for the FGD and railway yard was presently disturbed and
transformed contributed to the impact significance rating.
Another prominent impact feature that was identified during the construction phase is the loss
of catchment area contributing to storm water runoff due to the need to separate and contain
contaminated “dirty” water. Associated with this is an expected increase in flood peaks and
pollution through contaminated runoff. Mitigation measures for the loss of catchment area and
decreased water input to wetland areas is limited resulting in an impact significance rating of
HIGH. Impacts related to pollution run-off and increased flood peaks can be mitigated to
MODERATE to LOW impact significance levels.
Table 11-13: Impact assessment of the FGD system, railway yard and associated
infrastructure on biodiversity at the study site
Nature of Impact Impact type Extent Duration Potential Intensity
Likeli-hood
Rating
Construction Phase
Direct Impact: Potential loss of vegetation units.
Existing 1 5 2 1 8 - MOD
Cumulative 1 5 2 1 8 - MOD
Residual 1 5 2 1 8 - MOD
Direct Impact: Potential increase in alien vegetation species
Existing 1 3 4 1 8 - MOD
Cumulative 3 5 4 1 12 - HIGH
Residual 1 1 2 0.5 2 - LOW
Direct Impact: Potential loss of CI floral species
Existing 1 5 4 1 10 - HIGH
Cumulative 1 5 4 1 10 - HIGH
Residual 1 5 2 1 8 - MOD
Direct Impact: Potential loss of CI faunal species (excluding bullfrogs and raptors)
Existing 1 5 4 0.5 5 - MOD
Cumulative 1 5 8 0.5 7 - MOD
Residual 1 5 4 0.2 2 - LOW
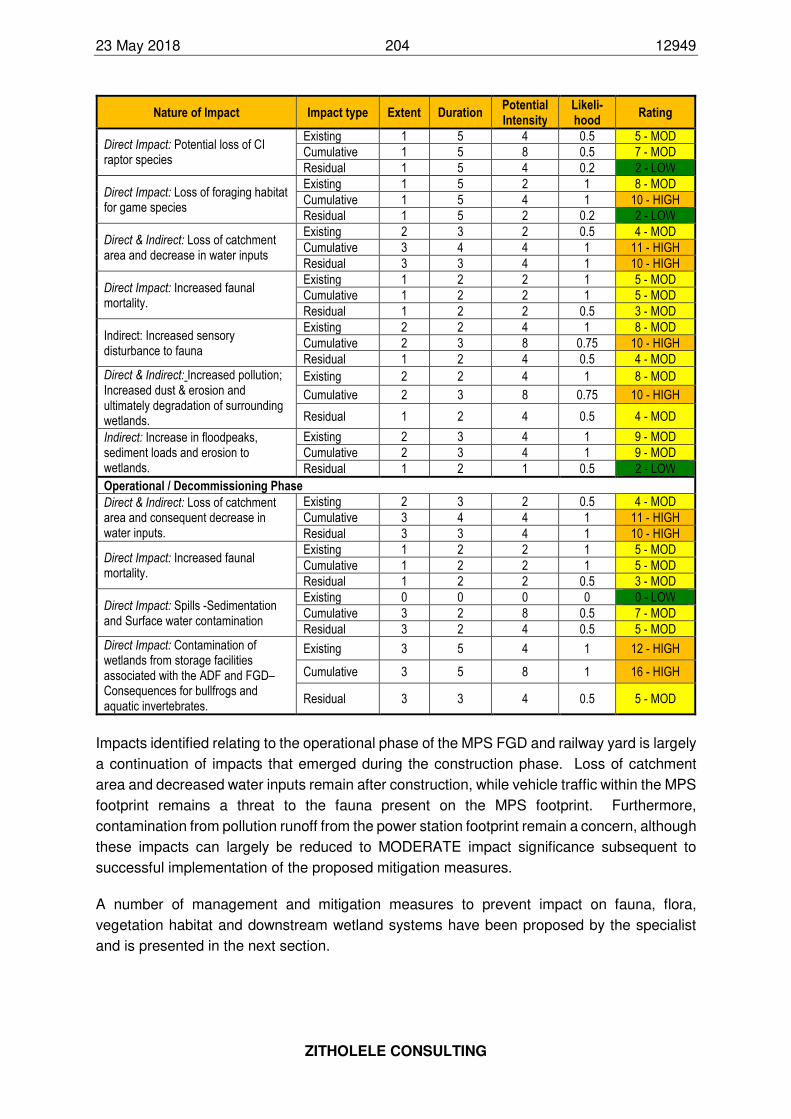
23 May 2018 204 12949
ZITHOLELE CONSULTING
Nature of Impact Impact type Extent Duration Potential Intensity
Likeli-hood
Rating
Direct Impact: Potential loss of CI raptor species
Existing 1 5 4 0.5 5 - MOD
Cumulative 1 5 8 0.5 7 - MOD
Residual 1 5 4 0.2 2 - LOW
Direct Impact: Loss of foraging habitat for game species
Existing 1 5 2 1 8 - MOD
Cumulative 1 5 4 1 10 - HIGH
Residual 1 5 2 0.2 2 - LOW
Direct & Indirect: Loss of catchment area and decrease in water inputs
Existing 2 3 2 0.5 4 - MOD
Cumulative 3 4 4 1 11 - HIGH
Residual 3 3 4 1 10 - HIGH
Direct Impact: Increased faunal mortality.
Existing 1 2 2 1 5 - MOD
Cumulative 1 2 2 1 5 - MOD
Residual 1 2 2 0.5 3 - MOD
Indirect: Increased sensory disturbance to fauna
Existing 2 2 4 1 8 - MOD
Cumulative 2 3 8 0.75 10 - HIGH
Residual 1 2 4 0.5 4 - MOD
Direct & Indirect: Increased pollution; Increased dust & erosion and ultimately degradation of surrounding wetlands.
Existing 2 2 4 1 8 - MOD
Cumulative 2 3 8 0.75 10 - HIGH
Residual 1 2 4 0.5 4 - MOD
Indirect: Increase in floodpeaks, sediment loads and erosion to wetlands.
Existing 2 3 4 1 9 - MOD
Cumulative 2 3 4 1 9 - MOD
Residual 1 2 1 0.5 2 - LOW
Operational / Decommissioning Phase
Direct & Indirect: Loss of catchment area and consequent decrease in water inputs.
Existing 2 3 2 0.5 4 - MOD
Cumulative 3 4 4 1 11 - HIGH
Residual 3 3 4 1 10 - HIGH
Direct Impact: Increased faunal mortality.
Existing 1 2 2 1 5 - MOD
Cumulative 1 2 2 1 5 - MOD
Residual 1 2 2 0.5 3 - MOD
Direct Impact: Spills -Sedimentation and Surface water contamination
Existing 0 0 0 0 0 - LOW
Cumulative 3 2 8 0.5 7 - MOD
Residual 3 2 4 0.5 5 - MOD
Direct Impact: Contamination of wetlands from storage facilities associated with the ADF and FGD– Consequences for bullfrogs and aquatic invertebrates.
Existing 3 5 4 1 12 - HIGH
Cumulative 3 5 8 1 16 - HIGH
Residual 3 3 4 0.5 5 - MOD
Impacts identified relating to the operational phase of the MPS FGD and railway yard is largely
a continuation of impacts that emerged during the construction phase. Loss of catchment
area and decreased water inputs remain after construction, while vehicle traffic within the MPS
footprint remains a threat to the fauna present on the MPS footprint. Furthermore,
contamination from pollution runoff from the power station footprint remain a concern, although
these impacts can largely be reduced to MODERATE impact significance subsequent to
successful implementation of the proposed mitigation measures.
A number of management and mitigation measures to prevent impact on fauna, flora,
vegetation habitat and downstream wetland systems have been proposed by the specialist
and is presented in the next section.
23 May 2018 205 12949
ZITHOLELE CONSULTING
Mitigation and management measures for impacts on terrestrial ecology and
wetlands
The following management and mitigation measures were proposed by the biodiversity and
wetland specialists:
• All clearing of vegetation needs to occur only within the required construction and
operational footprint of the proposed FGD / railway yard area. If at all possible vegetation
in the western corner of the railway yard area must remain intact and undisturbed.
• The area of construction should be fenced to prevent encroachment into surrounding
vegetation.
• Any bulbous or protected species that can be transplanted must be removed and
transplanted to a similar habitat nearby.
• Alien species must be monitored and controlled under the MPS Alien Control Programme.
• Construction crew must be made aware of the alien species that occur on site, specifically
Category 1 species and must be trained in the basics for recognition and removal.
• MPS has removed tree species successfully during the construction phase of their MPS.
Therefore the same would apply here. The Environmental Officer (EO), or trained botanist
will be required to tag all Protected Trees within the footprint for removal and relocation.
These individual plants will need to be monitored over the long term.
• Permits will be required from the Department of Agriculture, Forestry and Fisheries (DAFF)
for the removal of sensitive or protected tree species.
• Any other species that may be identified as Conservation Important (CI) must either be
translocated (if possible) or specific mitigation must be compiled by a qualified botanist in
collaboration with the MPS EO.
• In order to reduce the impact on CI faunal species on site, it is recommended that clearing
be undertaken in winter, where possible. It is recommended that immediately prior to
clearing that a walk down be conducted by Eskom’s environmental manager or
environmental officer in conjunction with a suitable specialist, preferably one with expertise
in arachnids, to intensively search the site preferably in the height of the rainy season
(December) to detect and relocate any baboon or trapdoor spiders or scorpions frogs,
tortoises. If any of these species are encountered during development the specialist with
should advise upon and oversee relocation.
• Likelihood is very low that nests of CI raptor species would be encountered on site.
However, if encountered during construction, its location should be marked and reported
to the relevant authorities before construction continues. Normally a minimum 1km radius
buffer or exclusion zone should is applied to such points but given the complex nature of
this project would require in-depth consultation with an appropriately experienced
ornithologist. As far as possible large trees above 5m should be marked and safeguarded
in the unaffected areas.
• Minimise disturbance footprint and restrict construction and operation activities to within
the proposed construction and operational footprint area. The Environmental Officer (EO)
must monitor the carrying capacity relative the game within the Railyard area and act
23 May 2018 206 12949
ZITHOLELE CONSULTING
accordingly to ensure that there is enough grazing land for the existing game within this
area, otherwise implement capture and relocation.
• The mitigation with regards to catchment loss is limited and the residual impact risk
remains High. Efforts should be centred on minimising catchment loss by minimizing the
PCD, coal stockpile and other associated infrastructure to as small an area as possible.
• Mitigation of increased faunal mortality require the site to be searched prior to clearing by
an appropriately qualified specialist and any less mobile fauna relocated. Maintain existing
tortoise road signs and insert new ones where necessary. Continue to enforce speed
regulation controls such as speed humps and limits.
• Keep lighting to a minimum during construction but most significantly during operation to
limit the impact of increased sensory disturbance to fauna. Lights should be angled
downwards and hooded to lower light pollution. Restrict unnecessary access to the
remaining patches of natural vegetation.
• To mitigate impacts from traffic and human activity the following should be applied:
o Remain outside of the Sandloop buffer area;
o Service and maintain vehicles regularly;
o Eskom must ensure that all trucks before leaving the storage area shall be completely
covered with a tarpaulin or any other effective measure/device. Trucks must not be over-
loaded to ensure no spillage during transportation;
o Reduce coal movement as much as possible during high wind events;
o Proper drainage system shall be provided in the coal storage area so that water drained
from sprinkling and runoff is collected at a common tank and can be reused after
treatment.
o Traffic and construction activities should be limited to daylight hours.
o Regular surface wetting is required;
o Demarcate and restrict anthropogenic disturbances to the construction area.
o Measures such as speed humps, signage and fines should be implemented to reduce
speeding and any off-road driving.
o Off-road driving must be prohibited in all surrounding natural areas as this could increase
the risks of erosion.
• Erosion and Storm Water Management Plan must be revised to allow for heavy rainfall
events.
• Measures to reduce the risk of contamination from the trucking spills include a concrete
slab layer beneath roads and kerb inlets to the dirty water system.
• Spilt material must regularly be cleaned up and that all drains inlets and stormwater
infrastructure is regularly inspected for blockages and cleared out.
• The gypsum offtake structure may be a problem following high rainfall events, however a
concrete bunding and a central depression is proposed to prevent spills. Again it is
important to ensure this area is kept tidy and regularly cleaned out.
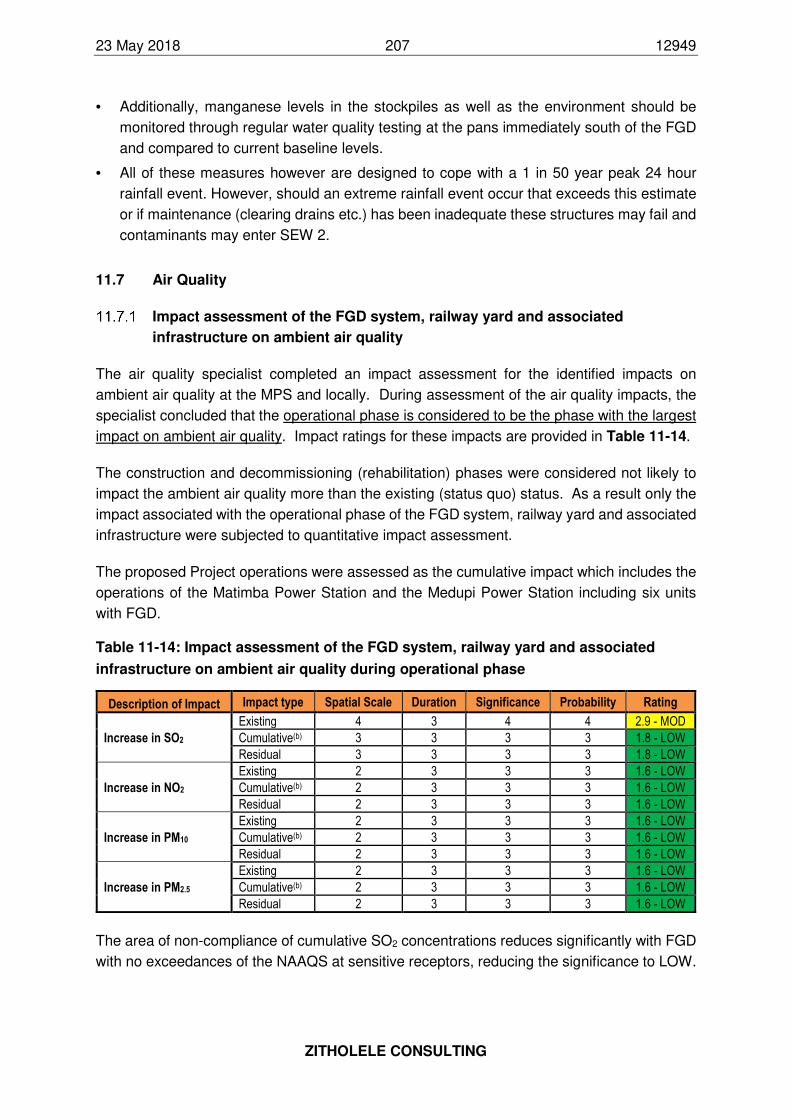
23 May 2018 207 12949
ZITHOLELE CONSULTING
• Additionally, manganese levels in the stockpiles as well as the environment should be
monitored through regular water quality testing at the pans immediately south of the FGD
and compared to current baseline levels.
• All of these measures however are designed to cope with a 1 in 50 year peak 24 hour
rainfall event. However, should an extreme rainfall event occur that exceeds this estimate
or if maintenance (clearing drains etc.) has been inadequate these structures may fail and
contaminants may enter SEW 2.
11.7 Air Quality
Impact assessment of the FGD system, railway yard and associated
infrastructure on ambient air quality
The air quality specialist completed an impact assessment for the identified impacts on
ambient air quality at the MPS and locally. During assessment of the air quality impacts, the
specialist concluded that the operational phase is considered to be the phase with the largest
impact on ambient air quality. Impact ratings for these impacts are provided in Table 11-14.
The construction and decommissioning (rehabilitation) phases were considered not likely to
impact the ambient air quality more than the existing (status quo) status. As a result only the
impact associated with the operational phase of the FGD system, railway yard and associated
infrastructure were subjected to quantitative impact assessment.
The proposed Project operations were assessed as the cumulative impact which includes the
operations of the Matimba Power Station and the Medupi Power Station including six units
with FGD.
Table 11-14: Impact assessment of the FGD system, railway yard and associated
infrastructure on ambient air quality during operational phase
Description of Impact Impact type Spatial Scale Duration Significance Probability Rating
Increase in SO2
Existing 4 3 4 4 2.9 - MOD
Cumulative(b) 3 3 3 3 1.8 - LOW
Residual 3 3 3 3 1.8 - LOW
Increase in NO2
Existing 2 3 3 3 1.6 - LOW
Cumulative(b) 2 3 3 3 1.6 - LOW
Residual 2 3 3 3 1.6 - LOW
Increase in PM10
Existing 2 3 3 3 1.6 - LOW
Cumulative(b) 2 3 3 3 1.6 - LOW
Residual 2 3 3 3 1.6 - LOW
Increase in PM2.5
Existing 2 3 3 3 1.6 - LOW
Cumulative(b) 2 3 3 3 1.6 - LOW
Residual 2 3 3 3 1.6 - LOW
The area of non-compliance of cumulative SO2 concentrations reduces significantly with FGD
with no exceedances of the NAAQS at sensitive receptors, reducing the significance to LOW.
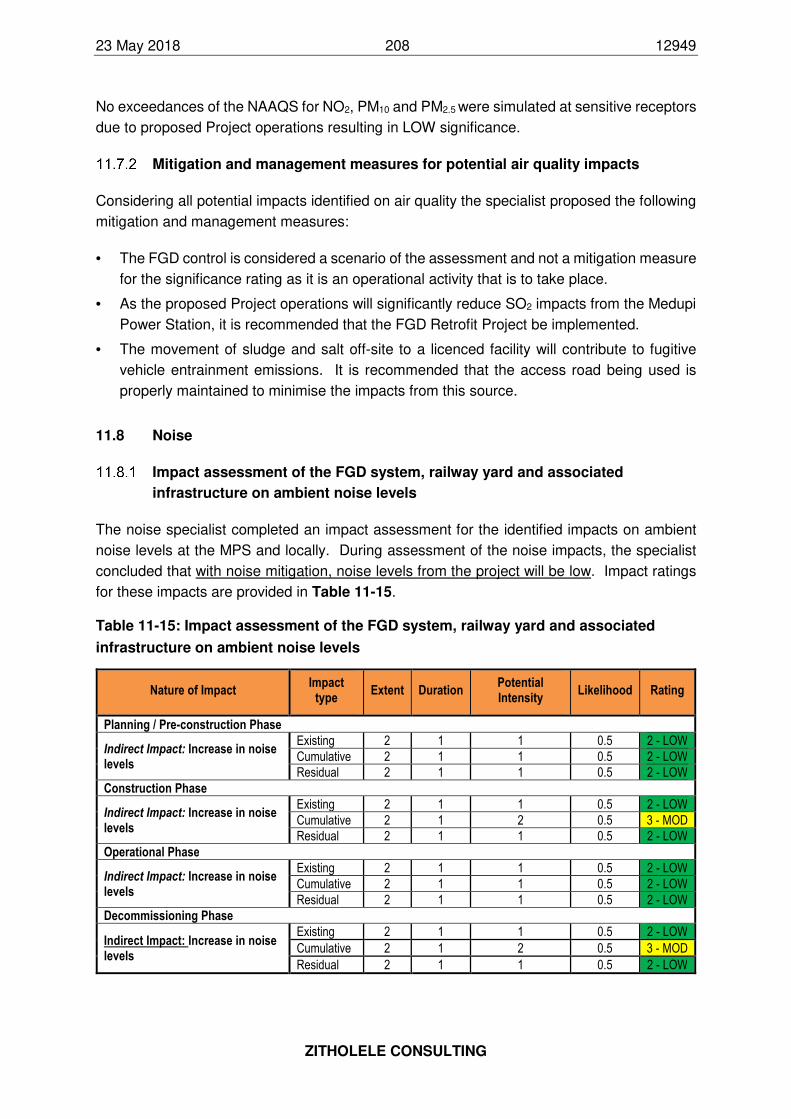
23 May 2018 208 12949
ZITHOLELE CONSULTING
No exceedances of the NAAQS for NO2, PM10 and PM2.5 were simulated at sensitive receptors
due to proposed Project operations resulting in LOW significance.
Mitigation and management measures for potential air quality impacts
Considering all potential impacts identified on air quality the specialist proposed the following
mitigation and management measures:
• The FGD control is considered a scenario of the assessment and not a mitigation measure
for the significance rating as it is an operational activity that is to take place.
• As the proposed Project operations will significantly reduce SO2 impacts from the Medupi
Power Station, it is recommended that the FGD Retrofit Project be implemented.
• The movement of sludge and salt off-site to a licenced facility will contribute to fugitive
vehicle entrainment emissions. It is recommended that the access road being used is
properly maintained to minimise the impacts from this source.
11.8 Noise
Impact assessment of the FGD system, railway yard and associated
infrastructure on ambient noise levels
The noise specialist completed an impact assessment for the identified impacts on ambient
noise levels at the MPS and locally. During assessment of the noise impacts, the specialist
concluded that with noise mitigation, noise levels from the project will be low. Impact ratings
for these impacts are provided in Table 11-15.
Table 11-15: Impact assessment of the FGD system, railway yard and associated
infrastructure on ambient noise levels
Nature of Impact Impact
type Extent Duration
Potential Intensity
Likelihood Rating
Planning / Pre-construction Phase
Indirect Impact: Increase in noise levels
Existing 2 1 1 0.5 2 - LOW
Cumulative 2 1 1 0.5 2 - LOW
Residual 2 1 1 0.5 2 - LOW
Construction Phase
Indirect Impact: Increase in noise levels
Existing 2 1 1 0.5 2 - LOW
Cumulative 2 1 2 0.5 3 - MOD
Residual 2 1 1 0.5 2 - LOW
Operational Phase
Indirect Impact: Increase in noise levels
Existing 2 1 1 0.5 2 - LOW
Cumulative 2 1 1 0.5 2 - LOW
Residual 2 1 1 0.5 2 - LOW
Decommissioning Phase
Indirect Impact: Increase in noise levels
Existing 2 1 1 0.5 2 - LOW
Cumulative 2 1 2 0.5 3 - MOD
Residual 2 1 1 0.5 2 - LOW
23 May 2018 209 12949
ZITHOLELE CONSULTING
The impacts on ambient noise levels relate entirely to the potential increase in noise levels
through all phases of the proposed development as shown in Table 11-15.
The impact assessment undertaken by the noise specialist rated impact on noise levels during
the planning and operational phases as low. The specialist concluded that during these
phases the noise levels in the area are representative of suburban districts. Cumulative
impacts would be similar to baseline levels during the planning phase, while change in noise
levels due to operation is expected to be slight at NSRs.
The specialist identified that during the construction and decommissioning phases the
construction and decommissioning activities would result in a Moderate noise impacts, but
with noise levels remaining local yet still notable.
The specialist therefore concluded that in the quantification of noise emissions and simulation
of noise levels as a result of the proposed project, it was calculated that ambient noise
evaluation criteria for human receptors will not be exceeded at NSRs. Therefore, reaction
from members of the community within this impact area is not very likely.
Mitigation and management measures for potential noise level impacts
Considering all potential impacts identified on noise levels the specialist proposed the
following mitigation and management measures as described below.
For general activities, the following good engineering practice must be applied:
• To minimise noise generation, vendors should be required to guarantee optimised
equipment design noise levels.
• A mechanism to monitor noise levels, record and respond to complaints and mitigate
impacts should be developed.
In managing transport noise specifically related to trucks, efforts should be directed at:
• Minimizing individual vehicle engine, transmission and body noise/vibration. This is
achieved through the implementation of an equipment maintenance program.
• Minimize slopes by managing and planning road gradients to avoid the need for excessive
acceleration/deceleration.
• Maintain road surface regularly to avoid corrugations, potholes etc.
• Avoid unnecessary idling times.
• Minimizing the need for trucks/equipment to reverse. This will reduce the frequency at
which disturbing but necessary reverse warnings will occur. Alternatives to the traditional
reverse ‘beeper’ alarm such as a ‘self-adjusting’ or ‘smart’ alarm should be considered.
These alarms include a mechanism to detect the local noise level and automatically adjust
the output of the alarm is so that it is 5 to 10 dB above the noise level in the vicinity of the
moving equipment. The promotional material for some smart alarms does state that the
23 May 2018 210 12949
ZITHOLELE CONSULTING
ability to adjust the level of the alarm is of advantage to those sites ‘with low ambient noise
level’ (Burgess & McCarty, 2009, as cited in (von Gruenewaldt & von Reiche, 2018).
11.9 Social
Impact assessment of the FGD system, railway yard and associated
infrastructure on the social environment
An Impact assessment of the FGD system, railway yard and associated infrastructure on the
social environment was undertaken by the appointed social specialist. The impact
assessment table provided by the specialist in his specialist report (included as Appendix G
to this FEIR) has been simplified, summarised and reduced to highlight the major findings and
trends concluded by the social specialist (Table 11-16). The reader is urged to peruse the
impacts assessment table in the Social Impact Assessment Report as the specialist
furthermore aligned recommendations or mitigation measures with each impact in the table,
provided a short motivation to support the impact assessment ratings.
For the benefit of I&APs the main impacts and mitigation measures are highlighted in this
section in order to provide the reader an overall understanding of impacts and mitigation
measures / recommendations concluded by the specialist. A number of positive impacts were
identified by the social specialist and for the reader’s benefit the impact descriptions (column
1 in Table 11-16) of these positive impacts has been shaded in a light shade of green.
All impacts identified during the Operational and Decommissioning Phases were considered
positive impacts, whereas half of the impacts identified during the construction phase are
positive impacts on the surrounding community.
During the Planning / Pre-construction Phase the establishment of spin-off businesses, e.g.
B&Bs, to support the construction phase of the Medupi FGD and railway yard was identified
as a positive impact that could contribute to the local economy and employment opportunities.
However, the publication of the proposed FGD construction project is likely to attract migrant
labourers with employment expectations at the MPS.
Positive impacts associated with the Construction Phase of the FGD, railway yard and
associated infrastructure revolve around economic and employment opportunities as well as
upgrading of infrastructure such as local roads. However, the Construction Phase is also likely
to result in increased traffic within the study area, and higher demand on already stressed
water allocation for the Lephalale area.
Positive impacts identified during the Operational Phase of the FGD include the improvement
of the ambient air quality through the significant reduction of SO2 due the operational FGD
system, a reduction in respiratory related diseases coupled with an overall improvement in the
quality of life, the stabilisation of the national electricity grid to support amongst other local
economic development, and the establishment of business and employment opportunities
resulting from the sale of gypsum.
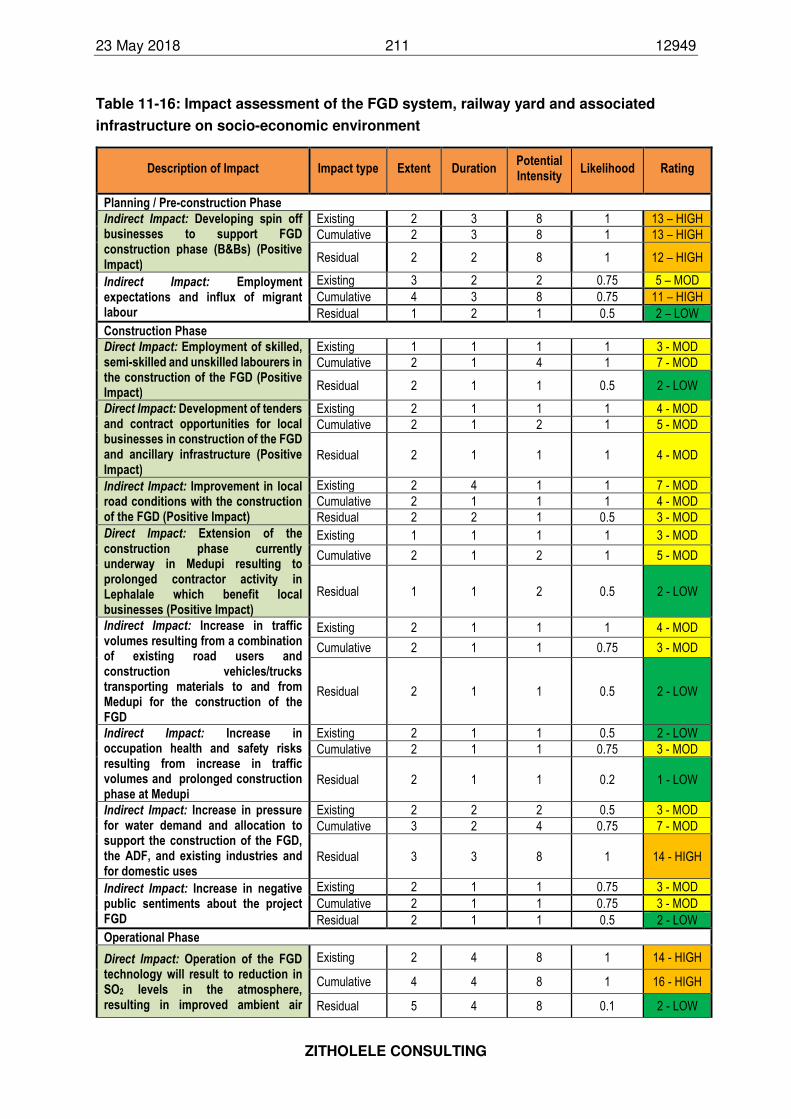
23 May 2018 211 12949
ZITHOLELE CONSULTING
Table 11-16: Impact assessment of the FGD system, railway yard and associated
infrastructure on socio-economic environment
Description of Impact Impact type Extent Duration Potential Intensity
Likelihood Rating
Planning / Pre-construction Phase
Indirect Impact: Developing spin off businesses to support FGD construction phase (B&Bs) (Positive Impact)
Existing 2 3 8 1 13 – HIGH
Cumulative 2 3 8 1 13 – HIGH
Residual 2 2 8 1 12 – HIGH
Indirect Impact: Employment expectations and influx of migrant labour
Existing 3 2 2 0.75 5 – MOD
Cumulative 4 3 8 0.75 11 – HIGH
Residual 1 2 1 0.5 2 – LOW
Construction Phase
Direct Impact: Employment of skilled, semi-skilled and unskilled labourers in the construction of the FGD (Positive Impact)
Existing 1 1 1 1 3 - MOD
Cumulative 2 1 4 1 7 - MOD
Residual 2 1 1 0.5 2 - LOW
Direct Impact: Development of tenders and contract opportunities for local businesses in construction of the FGD and ancillary infrastructure (Positive Impact)
Existing 2 1 1 1 4 - MOD
Cumulative 2 1 2 1 5 - MOD
Residual 2 1 1 1 4 - MOD
Indirect Impact: Improvement in local road conditions with the construction of the FGD (Positive Impact)
Existing 2 4 1 1 7 - MOD
Cumulative 2 1 1 1 4 - MOD
Residual 2 2 1 0.5 3 - MOD
Direct Impact: Extension of the construction phase currently underway in Medupi resulting to prolonged contractor activity in Lephalale which benefit local businesses (Positive Impact)
Existing 1 1 1 1 3 - MOD
Cumulative 2 1 2 1 5 - MOD
Residual 1 1 2 0.5 2 - LOW
Indirect Impact: Increase in traffic volumes resulting from a combination of existing road users and construction vehicles/trucks transporting materials to and from Medupi for the construction of the FGD
Existing 2 1 1 1 4 - MOD
Cumulative 2 1 1 0.75 3 - MOD
Residual 2 1 1 0.5 2 - LOW
Indirect Impact: Increase in occupation health and safety risks resulting from increase in traffic volumes and prolonged construction phase at Medupi
Existing 2 1 1 0.5 2 - LOW
Cumulative 2 1 1 0.75 3 - MOD
Residual 2 1 1 0.2 1 - LOW
Indirect Impact: Increase in pressure for water demand and allocation to support the construction of the FGD, the ADF, and existing industries and for domestic uses
Existing 2 2 2 0.5 3 - MOD
Cumulative 3 2 4 0.75 7 - MOD
Residual 3 3 8 1 14 - HIGH
Indirect Impact: Increase in negative public sentiments about the project FGD
Existing 2 1 1 0.75 3 - MOD
Cumulative 2 1 1 0.75 3 - MOD
Residual 2 1 1 0.5 2 - LOW
Operational Phase
Direct Impact: Operation of the FGD technology will result to reduction in SO2 levels in the atmosphere, resulting in improved ambient air
Existing 2 4 8 1 14 - HIGH
Cumulative 4 4 8 1 16 - HIGH
Residual 5 4 8 0.1 2 - LOW
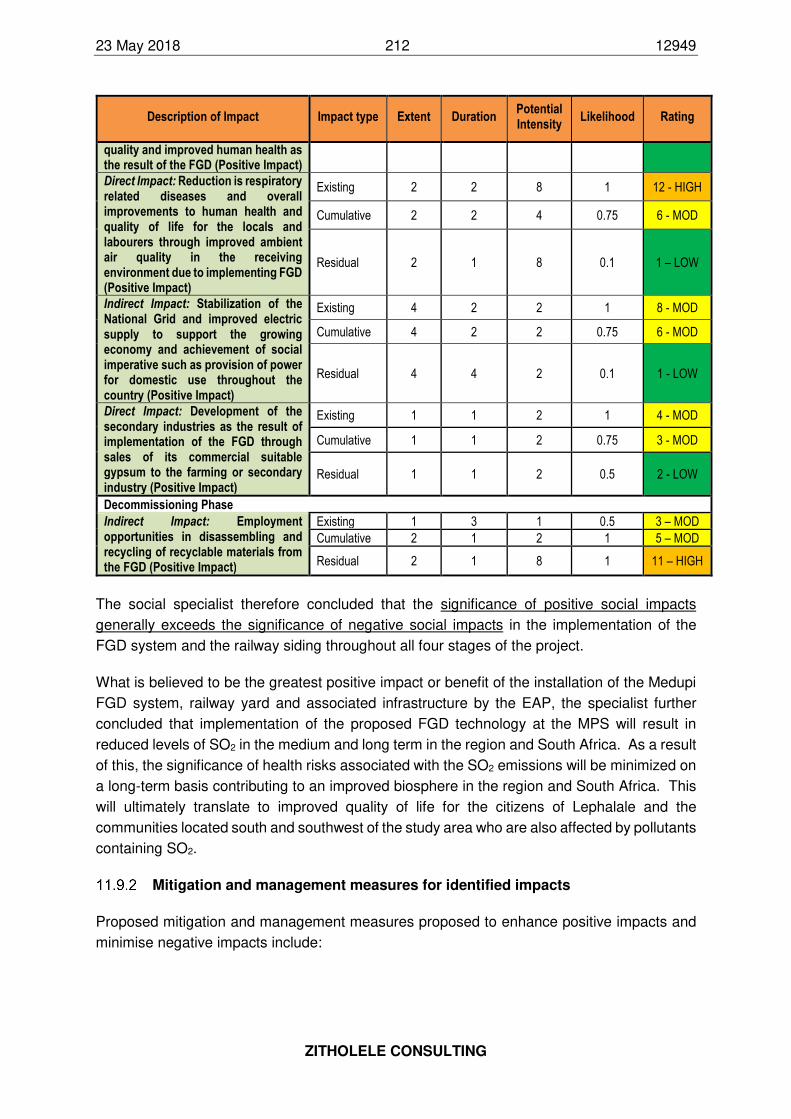
23 May 2018 212 12949
ZITHOLELE CONSULTING
Description of Impact Impact type Extent Duration Potential Intensity
Likelihood Rating
quality and improved human health as the result of the FGD (Positive Impact)
Direct Impact: Reduction is respiratory related diseases and overall improvements to human health and quality of life for the locals and labourers through improved ambient air quality in the receiving environment due to implementing FGD (Positive Impact)
Existing 2 2 8 1 12 - HIGH
Cumulative 2 2 4 0.75 6 - MOD
Residual 2 1 8 0.1 1 – LOW
Indirect Impact: Stabilization of the National Grid and improved electric supply to support the growing economy and achievement of social imperative such as provision of power for domestic use throughout the country (Positive Impact)
Existing 4 2 2 1 8 - MOD
Cumulative 4 2 2 0.75 6 - MOD
Residual 4 4 2 0.1 1 - LOW
Direct Impact: Development of the secondary industries as the result of implementation of the FGD through sales of its commercial suitable gypsum to the farming or secondary industry (Positive Impact)
Existing 1 1 2 1 4 - MOD
Cumulative 1 1 2 0.75 3 - MOD
Residual 1 1 2 0.5 2 - LOW
Decommissioning Phase
Indirect Impact: Employment opportunities in disassembling and recycling of recyclable materials from the FGD (Positive Impact)
Existing 1 3 1 0.5 3 – MOD
Cumulative 2 1 2 1 5 – MOD
Residual 2 1 8 1 11 – HIGH
The social specialist therefore concluded that the significance of positive social impacts
generally exceeds the significance of negative social impacts in the implementation of the
FGD system and the railway siding throughout all four stages of the project.
What is believed to be the greatest positive impact or benefit of the installation of the Medupi
FGD system, railway yard and associated infrastructure by the EAP, the specialist further
concluded that implementation of the proposed FGD technology at the MPS will result in
reduced levels of SO2 in the medium and long term in the region and South Africa. As a result
of this, the significance of health risks associated with the SO2 emissions will be minimized on
a long-term basis contributing to an improved biosphere in the region and South Africa. This
will ultimately translate to improved quality of life for the citizens of Lephalale and the
communities located south and southwest of the study area who are also affected by pollutants
containing SO2.
Mitigation and management measures for identified impacts
Proposed mitigation and management measures proposed to enhance positive impacts and
minimise negative impacts include:
23 May 2018 213 12949
ZITHOLELE CONSULTING
• Construction activities for the FGD system, railway yard and associated infrastructure
should be restricted within the existing Medupi footprint in order to minimise land use
impacts on surrounding properties.
• All measures and recommendation proposed by the traffic specialist to reduce traffic
impacts must be implemented to reduce social impacts associated with increased traffic
volumes. Recommended measures include installation of traffic lights and traffic circles at
major intersections such as D1675, Afguns and Nelson Mandela Drive near Medupi and
Matimba Power Station, and the introduction/implementation of appropriate traffic calming
measures.
• Eskom explore alternative water sources to minimise the risk of overly depending to
MCWAP Phase 2 for the implementation of the FGD, if possible.
• Eskom must continue to undertake project public participation and communication with
stakeholder groups in order to strengthen multi-stakeholder engagement and participation
in the planning and implementation of the FGD retrofit project.
The social specialist proposed recommendations to be considered by Eskom for
implementation. It should therefore be understood that such recommendations may not
necessarily be implemented after consideration. Proposed recommendations highlighted by
the social specialist include:
• Eskom could develop initiatives to contribute towards educating and developing necessary
skills for the locals to take advantage of opportunities associated with the FGD construction
and operation.
• Local businesses could be incubated and developed to be able to take opportunities in the
FGD BID.
• Eskom to advertise the types of available jobs, the required education and skillset to take
up employment opportunities in order to potentially reduce influx of migrant labour.
• Although Eskom has done a lot to address concerns relating to communication with
stakeholders, it is recommended that the EMC should further strengthen its multi-
stakeholder engagement strategy or adopt new forms of communication that resonate with
the interests of I & APs in the region. This should be done in a manner that does not
polarise relations between existing stakeholders. One way of addressing this issue could
be to develop a sub-committee for the EMC, if found to be required through consultation
with EMC stakeholders. If deemed necessary, the sub-committee should include a
representative from each of the affected communities. This should be in addition to those
communities’ representatives already listed in the EMC Terms of Reference (ToR).
• Community representatives from Steenbokpan (Leseding) and the farms (farming
community) should form part of the EMC sub-committee due to the fact that they feel
excluded in programmes and workshops that deal with issues arising from Medupi
construction and the associated infrastructure and technology such as the FGD.
• In addition to EMC public meetings and workshops, the sub-committee will ensure that all
community concerns and grievances are deliberated on and addressed directly by the
EMC and outside the EMC public meetings. The EMC ToR allows for the election of
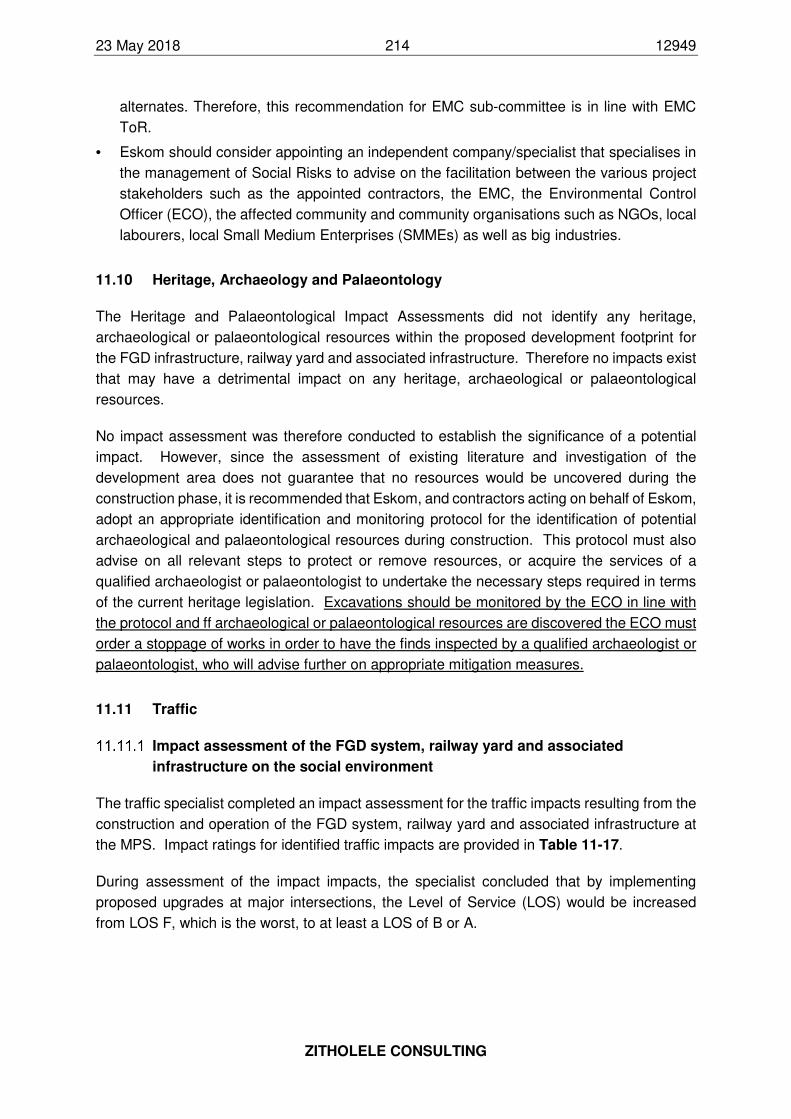
23 May 2018 214 12949
ZITHOLELE CONSULTING
alternates. Therefore, this recommendation for EMC sub-committee is in line with EMC
ToR.
• Eskom should consider appointing an independent company/specialist that specialises in
the management of Social Risks to advise on the facilitation between the various project
stakeholders such as the appointed contractors, the EMC, the Environmental Control
Officer (ECO), the affected community and community organisations such as NGOs, local
labourers, local Small Medium Enterprises (SMMEs) as well as big industries.
11.10 Heritage, Archaeology and Palaeontology
The Heritage and Palaeontological Impact Assessments did not identify any heritage,
archaeological or palaeontological resources within the proposed development footprint for
the FGD infrastructure, railway yard and associated infrastructure. Therefore no impacts exist
that may have a detrimental impact on any heritage, archaeological or palaeontological
resources.
No impact assessment was therefore conducted to establish the significance of a potential
impact. However, since the assessment of existing literature and investigation of the
development area does not guarantee that no resources would be uncovered during the
construction phase, it is recommended that Eskom, and contractors acting on behalf of Eskom,
adopt an appropriate identification and monitoring protocol for the identification of potential
archaeological and palaeontological resources during construction. This protocol must also
advise on all relevant steps to protect or remove resources, or acquire the services of a
qualified archaeologist or palaeontologist to undertake the necessary steps required in terms
of the current heritage legislation. Excavations should be monitored by the ECO in line with
the protocol and ff archaeological or palaeontological resources are discovered the ECO must
order a stoppage of works in order to have the finds inspected by a qualified archaeologist or
palaeontologist, who will advise further on appropriate mitigation measures.
11.11 Traffic
Impact assessment of the FGD system, railway yard and associated
infrastructure on the social environment
The traffic specialist completed an impact assessment for the traffic impacts resulting from the
construction and operation of the FGD system, railway yard and associated infrastructure at
the MPS. Impact ratings for identified traffic impacts are provided in Table 11-17.
During assessment of the impact impacts, the specialist concluded that by implementing
proposed upgrades at major intersections, the Level of Service (LOS) would be increased
from LOS F, which is the worst, to at least a LOS of B or A.
23 May 2018 215 12949
ZITHOLELE CONSULTING
Table 11-17: Impact assessment of the FGD system, railway yard and associated
infrastructure on traffic to and from the MPS
Nature of Impact Impact type Extent Duration Potential Intensity
Likelihood Rating
Construction Phase
Direct Impact: Impact of additional generated traffic due to the construction phase on existing road layout and road users
Existing 3 4 4 1 11 - HIGH
Cumulative 3 1 8 1 12 - HIGH
Residual 3 3 1 0.1 1 - LOW
Operational Phase
Direct Impact: Impact of additional generated traffic due to the operational phase of the FGD plant
Existing 3 4 8 1 15 - HIGH
Cumulative 3 5 16 1 24 - FLAW
Residual 3 3 1 0.1 1 - LOW
Indirect Impact: Impact of the transport of Limestone from the limestone sources
Existing 4 3 4 0.1 1 - LOW
Cumulative 4 4 8 0.75 12 - HIGH
Residual 4 3 4 0.2 2 - LOW
Indirect Impact: Impact of transported salts and sludge to one of the four potential licensed hazardous waste facilities
Existing 4 3 4 0.1 1 - LOW
Cumulative 4 4 8 0.75 12 - HIGH
Residual 4 3 4 0.2 2 - LOW
Decommissioning Phase
Direct Impact: Impact of reduction in traffic volumes due to decommissioning phase
Existing 3 1 16 1 20 - HIGH
Cumulative 3 1 8 1 12 - HIGH
Residual 3 1 1 0.1 1 - LOW
No impacts on the road network were anticipated during the Planning / Pre-construction
phase, and as a result no impact rating for this phase was determined.
Furthermore it is concluded that all identified impacts were regarded as low once the proposed
mitigation measures has been implemented.
Mitigation and management measures for potential traffic impacts
Proposed management measures and recommendations to reduce traffic impacts include:
• Proposed upgrades for the following major road intersections include:
Nelson Mandela Drive / D1675
o Provide signals;
o Add a left turning slip lane along D1675 (northbound);
o The introduction of a right turning lane for the northbound right movement;
o Provision of an additional eastbound lane for the straight movement;
o It is recommended that the relevant road authority should fund the upgrade of this
intersection, since the existing intersection is already operating at a LOS F.
D1675 / Afguns Rd
o Upgrade the priority control intersection to a one lane roundabout.
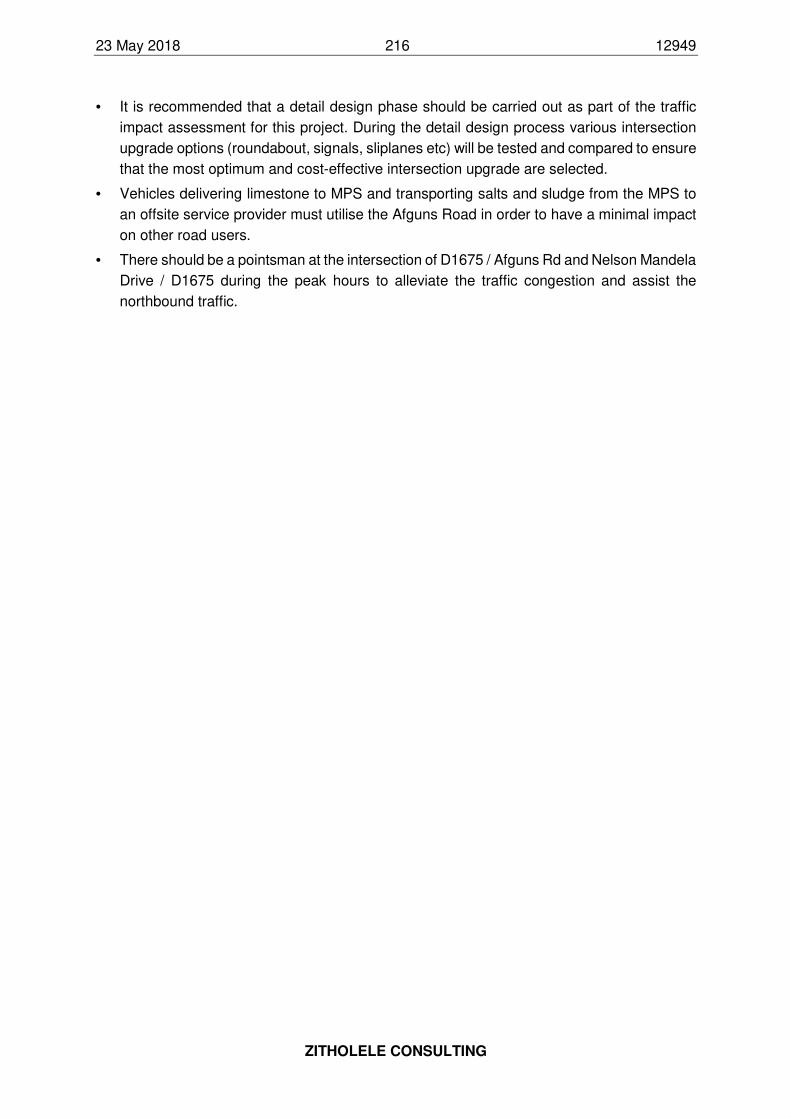
23 May 2018 216 12949
ZITHOLELE CONSULTING
• It is recommended that a detail design phase should be carried out as part of the traffic
impact assessment for this project. During the detail design process various intersection
upgrade options (roundabout, signals, sliplanes etc) will be tested and compared to ensure
that the most optimum and cost-effective intersection upgrade are selected.
• Vehicles delivering limestone to MPS and transporting salts and sludge from the MPS to
an offsite service provider must utilise the Afguns Road in order to have a minimal impact
on other road users.
• There should be a pointsman at the intersection of D1675 / Afguns Rd and Nelson Mandela
Drive / D1675 during the peak hours to alleviate the traffic congestion and assist the
northbound traffic.
23 May 2018 217 12949
ZITHOLELE CONSULTING
12 MONITORING AND MAINTENANCE
A number of the specialist assessments, that was undertaken for the construction and
operation of the FGD infrastructure, railway yard and associated infrastructure, recommended
monitoring and maintenance measures that must be implemented prior, during the
construction phase or during decommissioning / rehabilitation phase.
These proposed monitoring and maintenance measures are provided in the sections below.
12.1 Soils
The soils and land capability specialist proposed a soil conservation plan for the construction,
operational and decommissioning phases of the proposed development. These soil
conservation plans aims to maintain the integrity of the topsoil removed during construction.
Making provision for retention of utilisable material for the decommissioning and/or during
rehabilitation will not only save significant costs at closure, but will ensure that additional
impacts to the environment do not occur.
The proposed soil conservation plans for the construction, operational and decommissioning
phases of the development is provided in Table 12-1, Table 12-2 and Table 12-3 below.
Table 12-1: Construction Phase – Soil Utilization Plan
Phase Step Factors to Consider Comments
Stripping will only occur where soils are to be disturbed by activities that are
described in the design report, and where a clearly defined end rehabilitation use
for the stripped soil has been identified.
It is recommened that all vegetation is stripped and stored as part of the utilizable
soil. However, the requirements for moving and preserving fauna and flora
according to the biodiversity action plan should be consulted.
Handling
Where possible, soils should be handled in dry weather conditions so as to cause as
little compaction as possible. Utilizable soil (Topsoil and upper portion of subsoil
B2/1) must be removed and stockpiled separately from the lower "B" horizon, with
the ferricrete layer being seperated from the soft/decomposed rock, and wet based
soils seperated from the dry soils if they are to be impacted.
Stripping
The "Utilizable" soil will be stripped to a depth of 750mm or until hard
rock/ferricrete is encountered. These soils will be stockpiled together with any
vegetation cover present (only large vegetation to be removed prior to stripping).
The total stripped depth should be 750mm, wherever possible.
Location
Stockpiling areas will be identified in close proximity to the source of the soil to
limit handling and to promote reuse of soils in the correct areas. All stockpiles will
be founded on stabilized and well engineered "pads"
Designation of AreasSoils stockpiles will be demarcated, and clearly marked to identify both the soil
type and the intended area of rehabilitation.
Delineation of areas to be stripped
Reference to biodiversity action plan
Stripping and
Handling of soils
Delineation of
Stockpiling areas
Co
nst
ruct
ion
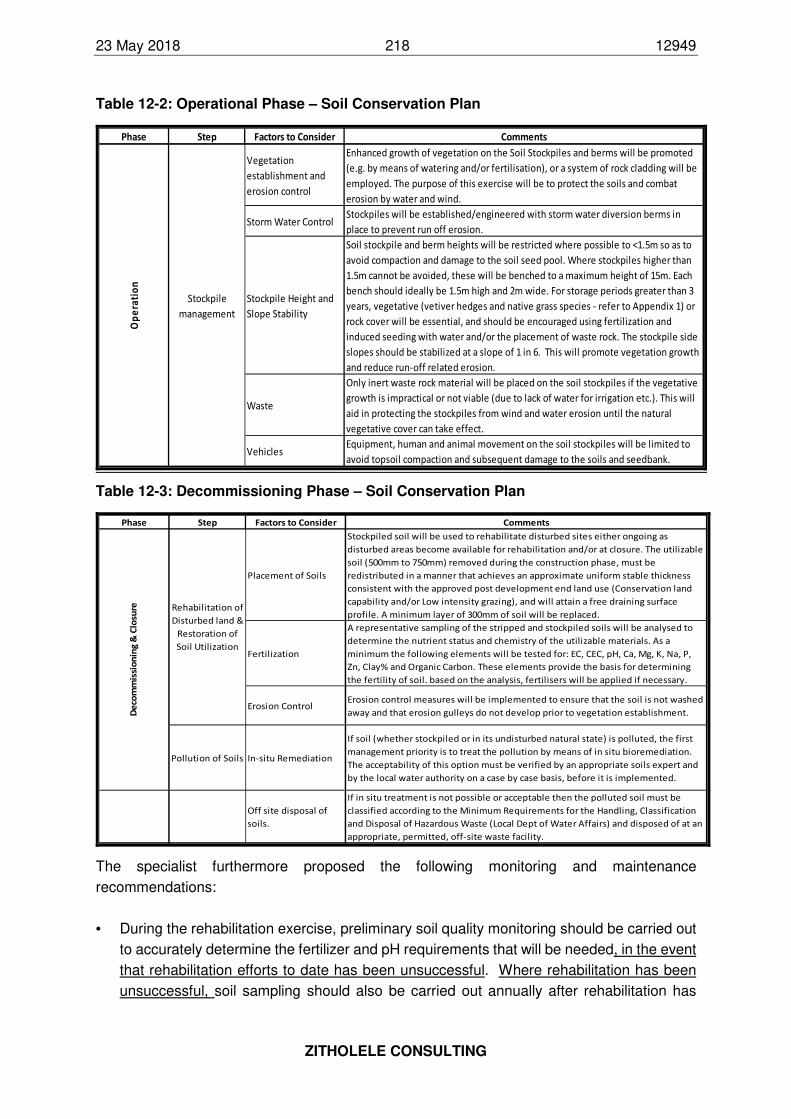
23 May 2018 218 12949
ZITHOLELE CONSULTING
Table 12-2: Operational Phase – Soil Conservation Plan
Phase Step Factors to Consider Comments
Vegetation
establishment and
erosion control
Enhanced growth of vegetation on the Soil Stockpiles and berms will be promoted
(e.g. by means of watering and/or fertilisation), or a system of rock cladding will be
employed. The purpose of this exercise will be to protect the soils and combat
erosion by water and wind.
Storm Water ControlStockpiles will be established/engineered with storm water diversion berms in
place to prevent run off erosion.
Stockpile Height and
Slope Stability
Soil stockpile and berm heights will be restricted where possible to <1.5m so as to
avoid compaction and damage to the soil seed pool. Where stockpiles higher than
1.5m cannot be avoided, these will be benched to a maximum height of 15m. Each
bench should ideally be 1.5m high and 2m wide. For storage periods greater than 3
years, vegetative (vetiver hedges and native grass species - refer to Appendix 1) or
rock cover will be essential, and should be encouraged using fertilization and
induced seeding with water and/or the placement of waste rock. The stockpile side
slopes should be stabilized at a slope of 1 in 6. This will promote vegetation growth
and reduce run-off related erosion.
Waste
Only inert waste rock material will be placed on the soil stockpiles if the vegetative
growth is impractical or not viable (due to lack of water for irrigation etc.). This will
aid in protecting the stockpiles from wind and water erosion until the natural
vegetative cover can take effect.
VehiclesEquipment, human and animal movement on the soil stockpiles will be limited to
avoid topsoil compaction and subsequent damage to the soils and seedbank.
Op
era
tio
n
Stockpile
management
Table 12-3: Decommissioning Phase – Soil Conservation Plan
Phase Step Factors to Consider Comments
Placement of Soils
Stockpiled soil will be used to rehabilitate disturbed sites either ongoing as
disturbed areas become available for rehabilitation and/or at closure. The utilizable
soil (500mm to 750mm) removed during the construction phase, must be
redistributed in a manner that achieves an approximate uniform stable thickness
consistent with the approved post development end land use (Conservation land
capability and/or Low intensity grazing), and will attain a free draining surface
profile. A minimum layer of 300mm of soil will be replaced.
Fertilization
A representative sampling of the stripped and stockpiled soils will be analysed to
determine the nutrient status and chemistry of the utilizable materials. As a
minimum the following elements will be tested for: EC, CEC, pH, Ca, Mg, K, Na, P,
Zn, Clay% and Organic Carbon. These elements provide the basis for determining
the fertility of soil. based on the analysis, fertilisers will be applied if necessary.
Erosion ControlErosion control measures will be implemented to ensure that the soil is not washed
away and that erosion gulleys do not develop prior to vegetation establishment.
Pollution of Soils In-situ Remediation
If soil (whether stockpiled or in its undisturbed natural state) is polluted, the first
management priority is to treat the pollution by means of in situ bioremediation.
The acceptability of this option must be verified by an appropriate soils expert and
by the local water authority on a case by case basis, before it is implemented.
Off site disposal of
soils.
If in situ treatment is not possible or acceptable then the polluted soil must be
classified according to the Minimum Requirements for the Handling, Classification
and Disposal of Hazardous Waste (Local Dept of Water Affairs) and disposed of at an
appropriate, permitted, off-site waste facility.
Rehabilitation of
Disturbed land &
Restoration of
Soil Utilization
De
com
mis
sio
nin
g &
Clo
sure
The specialist furthermore proposed the following monitoring and maintenance
recommendations:
• During the rehabilitation exercise, preliminary soil quality monitoring should be carried out
to accurately determine the fertilizer and pH requirements that will be needed, in the event
that rehabilitation efforts to date has been unsuccessful. Where rehabilitation has been
unsuccessful, soil sampling should also be carried out annually after rehabilitation has
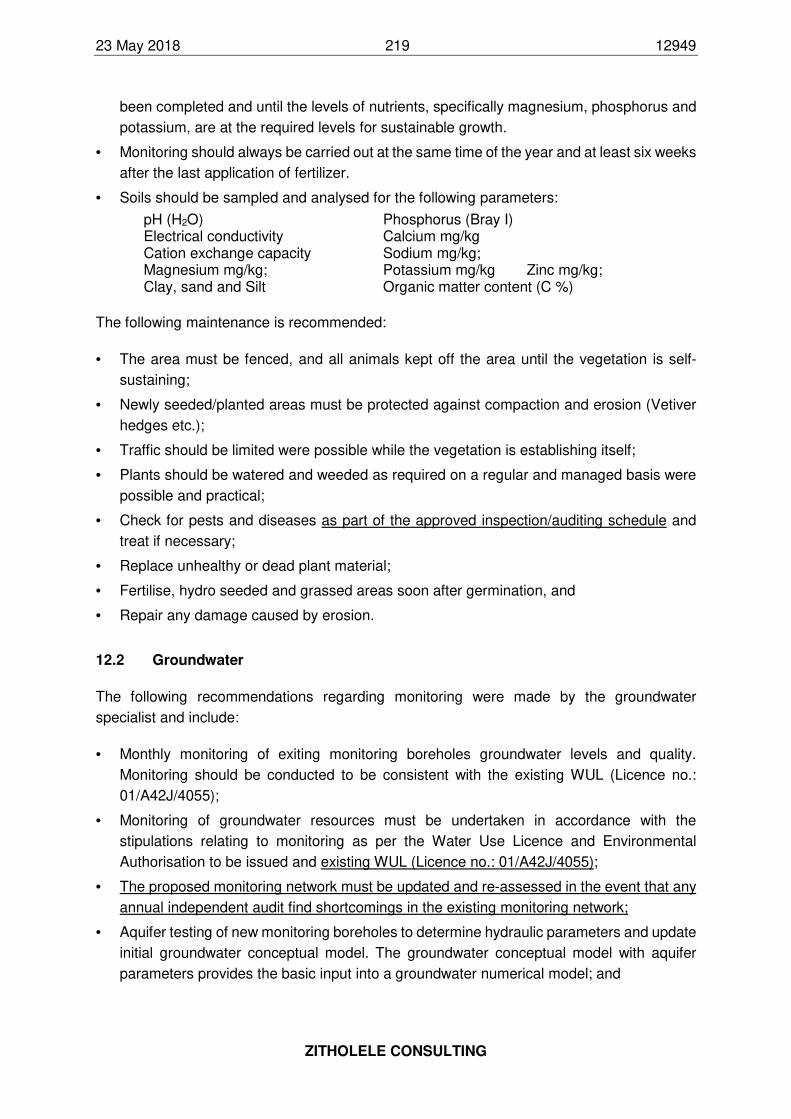
23 May 2018 219 12949
ZITHOLELE CONSULTING
been completed and until the levels of nutrients, specifically magnesium, phosphorus and
potassium, are at the required levels for sustainable growth.
• Monitoring should always be carried out at the same time of the year and at least six weeks
after the last application of fertilizer.
• Soils should be sampled and analysed for the following parameters:
pH (H2O) Phosphorus (Bray I) Electrical conductivity Calcium mg/kg Cation exchange capacity Sodium mg/kg; Magnesium mg/kg; Potassium mg/kg Zinc mg/kg; Clay, sand and Silt Organic matter content (C %)
The following maintenance is recommended:
• The area must be fenced, and all animals kept off the area until the vegetation is self-
sustaining;
• Newly seeded/planted areas must be protected against compaction and erosion (Vetiver
hedges etc.);
• Traffic should be limited were possible while the vegetation is establishing itself;
• Plants should be watered and weeded as required on a regular and managed basis were
possible and practical;
• Check for pests and diseases as part of the approved inspection/auditing schedule and
treat if necessary;
• Replace unhealthy or dead plant material;
• Fertilise, hydro seeded and grassed areas soon after germination, and
• Repair any damage caused by erosion.
12.2 Groundwater
The following recommendations regarding monitoring were made by the groundwater
specialist and include:
• Monthly monitoring of exiting monitoring boreholes groundwater levels and quality.
Monitoring should be conducted to be consistent with the existing WUL (Licence no.:
01/A42J/4055);
• Monitoring of groundwater resources must be undertaken in accordance with the
stipulations relating to monitoring as per the Water Use Licence and Environmental
Authorisation to be issued and existing WUL (Licence no.: 01/A42J/4055);
• The proposed monitoring network must be updated and re-assessed in the event that any
annual independent audit find shortcomings in the existing monitoring network;
• Aquifer testing of new monitoring boreholes to determine hydraulic parameters and update
initial groundwater conceptual model. The groundwater conceptual model with aquifer
parameters provides the basic input into a groundwater numerical model; and
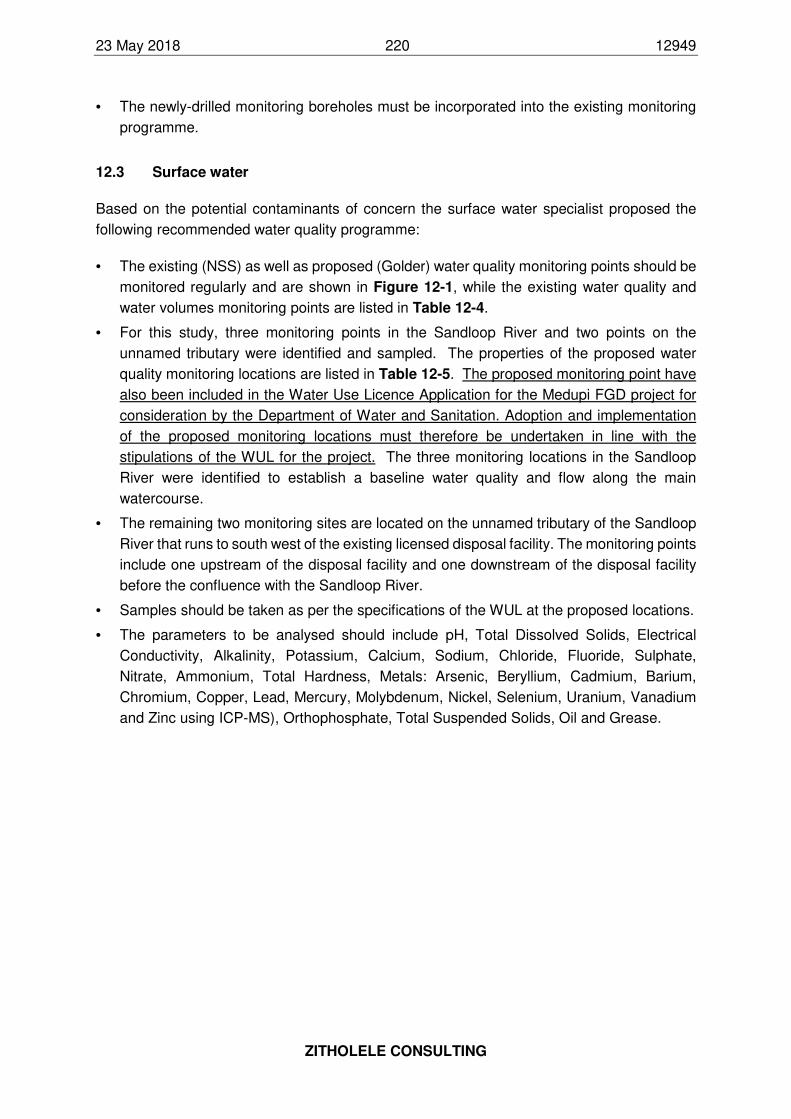
23 May 2018 220 12949
ZITHOLELE CONSULTING
• The newly-drilled monitoring boreholes must be incorporated into the existing monitoring
programme.
12.3 Surface water
Based on the potential contaminants of concern the surface water specialist proposed the
following recommended water quality programme:
• The existing (NSS) as well as proposed (Golder) water quality monitoring points should be
monitored regularly and are shown in Figure 12-1, while the existing water quality and
water volumes monitoring points are listed in Table 12-4.
• For this study, three monitoring points in the Sandloop River and two points on the
unnamed tributary were identified and sampled. The properties of the proposed water
quality monitoring locations are listed in Table 12-5. The proposed monitoring point have
also been included in the Water Use Licence Application for the Medupi FGD project for
consideration by the Department of Water and Sanitation. Adoption and implementation
of the proposed monitoring locations must therefore be undertaken in line with the
stipulations of the WUL for the project. The three monitoring locations in the Sandloop
River were identified to establish a baseline water quality and flow along the main
watercourse.
• The remaining two monitoring sites are located on the unnamed tributary of the Sandloop
River that runs to south west of the existing licensed disposal facility. The monitoring points
include one upstream of the disposal facility and one downstream of the disposal facility
before the confluence with the Sandloop River.
• Samples should be taken as per the specifications of the WUL at the proposed locations.
• The parameters to be analysed should include pH, Total Dissolved Solids, Electrical
Conductivity, Alkalinity, Potassium, Calcium, Sodium, Chloride, Fluoride, Sulphate,
Nitrate, Ammonium, Total Hardness, Metals: Arsenic, Beryllium, Cadmium, Barium,
Chromium, Copper, Lead, Mercury, Molybdenum, Nickel, Selenium, Uranium, Vanadium
and Zinc using ICP-MS), Orthophosphate, Total Suspended Solids, Oil and Grease.
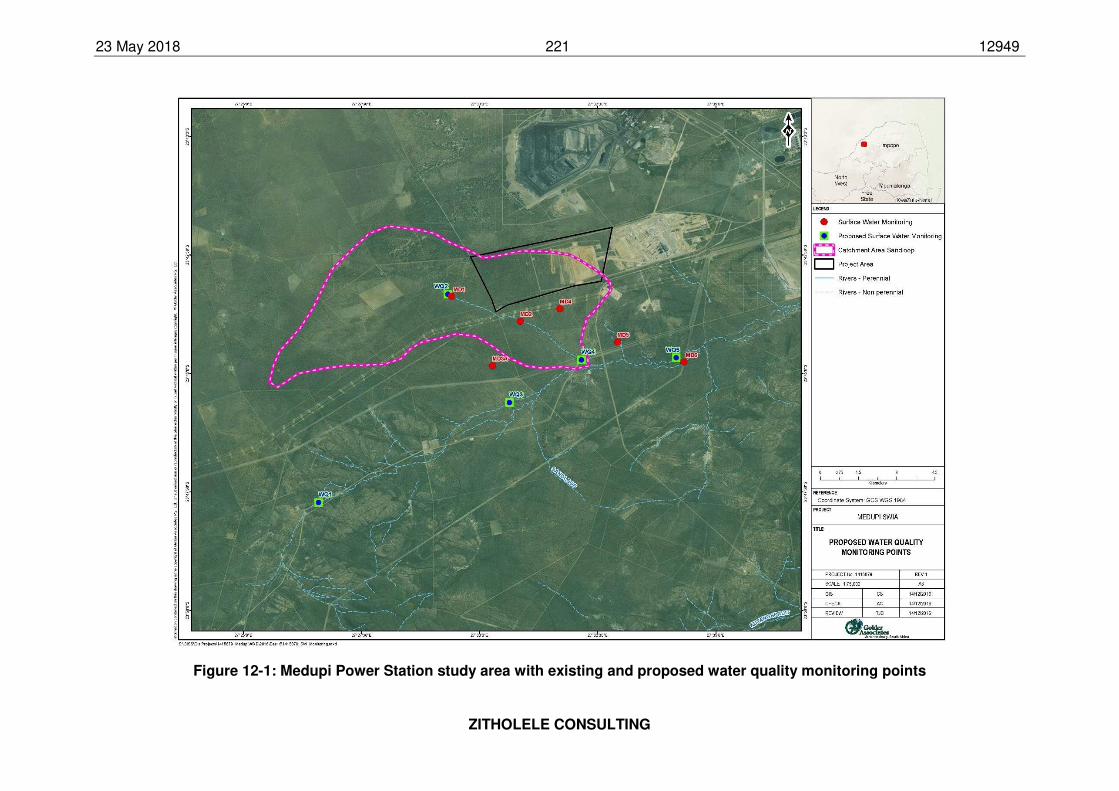
23 May 2018 221 12949
ZITHOLELE CONSULTING
Figure 12-1: Medupi Power Station study area with existing and proposed water quality monitoring points
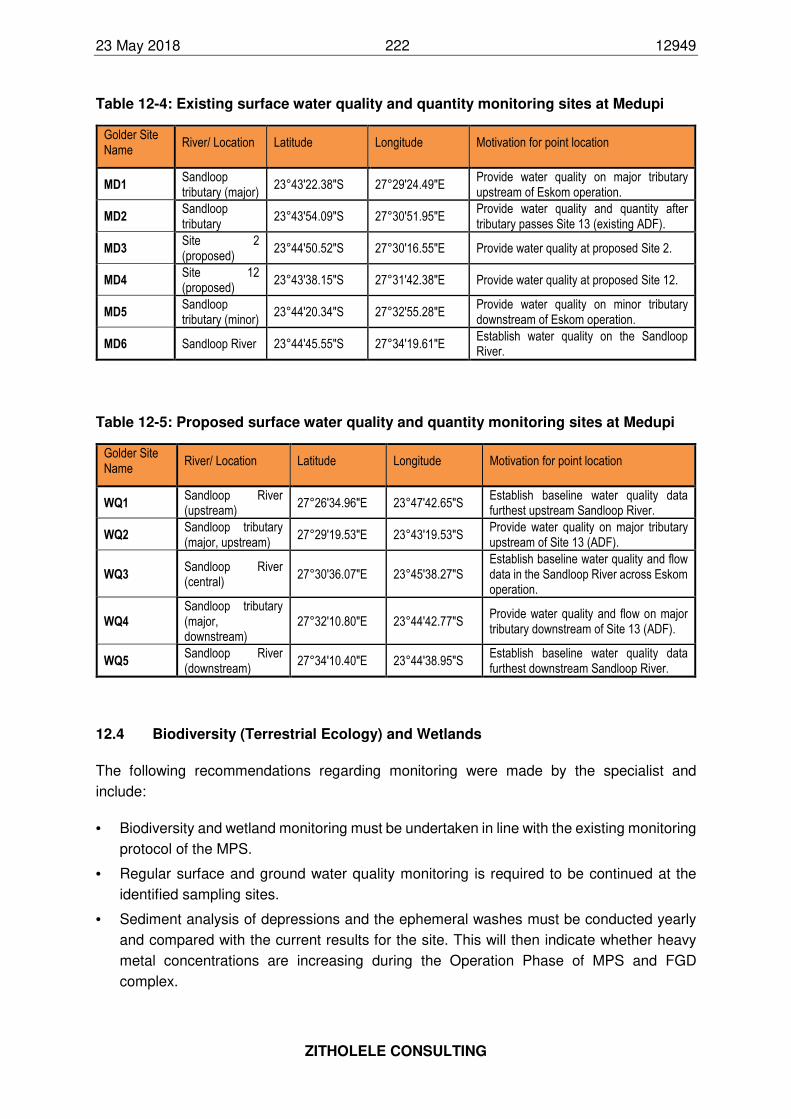
23 May 2018 222 12949
ZITHOLELE CONSULTING
Table 12-4: Existing surface water quality and quantity monitoring sites at Medupi
Golder Site Name
River/ Location Latitude Longitude Motivation for point location
MD1 Sandloop tributary (major)
23°43'22.38"S 27°29'24.49"E Provide water quality on major tributary upstream of Eskom operation.
MD2 Sandloop tributary
23°43'54.09"S 27°30'51.95"E Provide water quality and quantity after tributary passes Site 13 (existing ADF).
MD3 Site 2 (proposed)
23°44'50.52"S 27°30'16.55"E Provide water quality at proposed Site 2.
MD4 Site 12 (proposed)
23°43'38.15"S 27°31'42.38"E Provide water quality at proposed Site 12.
MD5 Sandloop tributary (minor)
23°44'20.34"S 27°32'55.28"E Provide water quality on minor tributary downstream of Eskom operation.
MD6 Sandloop River 23°44'45.55"S 27°34'19.61"E Establish water quality on the Sandloop River.
Table 12-5: Proposed surface water quality and quantity monitoring sites at Medupi
Golder Site Name
River/ Location Latitude Longitude Motivation for point location
WQ1 Sandloop River (upstream)
27°26'34.96"E 23°47'42.65"S Establish baseline water quality data furthest upstream Sandloop River.
WQ2 Sandloop tributary (major, upstream)
27°29'19.53"E 23°43'19.53"S Provide water quality on major tributary upstream of Site 13 (ADF).
WQ3 Sandloop River (central)
27°30'36.07"E 23°45'38.27"S Establish baseline water quality and flow data in the Sandloop River across Eskom operation.
WQ4 Sandloop tributary (major, downstream)
27°32'10.80"E 23°44'42.77"S Provide water quality and flow on major tributary downstream of Site 13 (ADF).
WQ5 Sandloop River (downstream)
27°34'10.40"E 23°44'38.95"S Establish baseline water quality data furthest downstream Sandloop River.
12.4 Biodiversity (Terrestrial Ecology) and Wetlands
The following recommendations regarding monitoring were made by the specialist and
include:
• Biodiversity and wetland monitoring must be undertaken in line with the existing monitoring
protocol of the MPS.
• Regular surface and ground water quality monitoring is required to be continued at the
identified sampling sites.
• Sediment analysis of depressions and the ephemeral washes must be conducted yearly
and compared with the current results for the site. This will then indicate whether heavy
metal concentrations are increasing during the Operation Phase of MPS and FGD
complex.
23 May 2018 223 12949
ZITHOLELE CONSULTING
• Annual monitoring of the aquatic invertebrate assemblage should be conducted at the
various remaining sediment sampling sites.
• Amphibian assemblages should be monitored at key sediment sampling sites as well as
the newly created pans once a year by means of acoustic, visual encounter transects.
• Measures should be implemented to minimise erosion on site, and potential sedimentation
and contamination of the downstream ephemeral watercourse and associated dams;
• It is advised that water quality at local boreholes (if present) be monitored before and
during construction of the site. The exact duration, frequency and positioning of the
sampling points should be determined from the geohydrological studies commissioned for
the site.
12.5 Noise
In the event that noise related complaints are received, short term (24-hour) ambient noise
measurements should be conducted as part of investigating the complaints. The results of
the measurements should be used to inform any follow up interventions.
The following procedure should be adopted for all noise surveys:
• Any surveys should be designed and conducted by a trained specialist.
• Sampling should be carried out using a Type 1 Sound Level Meter (SLM) that meets all
appropriate International Electrotechnical Commission (IEC) standards and is subject to
annual calibration by an accredited laboratory.
• The acoustic sensitivity of the SLM should be tested with a portable acoustic calibrator
before and after each sampling session.
• Samples of at least 24 hours in duration and sufficient for statistical analysis should be
taken with the use of portable SLM’s capable of logging data continuously over the time
period. Samples representative of the day- and night-time acoustic climate should be
taken.
• The following acoustic indices should be recoded and reported:
LAeq (T)
LAIeq (T)
Statistical noise level LA90
LAmin and LAmax
Octave band or 3rd octave band frequency spectra.
• The SLM should be located approximately 1.5 m above the ground and no closer than 3
m to any reflecting surface.
• Efforts should be made to ensure that measurements are not affected by the residual noise
and extraneous influences, e.g. wind, electrical interference and any other non-acoustic
interference, and that the instrument is operated under the conditions specified by the
manufacturer. It is good practice to avoid conducting measurements when the wind speed
is more than 5 m/s, while it is raining or when the ground is wet.
23 May 2018 224 12949
ZITHOLELE CONSULTING
• A detailed log and record should be kept. Records should include site details, weather
conditions during sampling and observations made regarding the acoustic climate of each
site.
12.6 Heritage, archaeology and palaeontology
If in the extremely unlikely event that any fossils are discovered during the construction of the
FGD copmplex, then it is strongly recommended that a palaeontologist be called to assess
their importance and rescue them if necessary.
23 May 2018 225 12949
ZITHOLELE CONSULTING
13 ENVIRONMENTAL IMPACT STATEMENT
13.1 Key considerations
Given the circumstances of the proposed retrofitting of the FGD plant and associated
infrastructure and construction of the railway yard and associated structures and infrastructure
a number of key considerations must be considered in order to reach a balanced and
sustainable recommendation regarding the proposed construction and operational activities.
To illustrate the aspects related to key considerations, an environmental sensitivity overlay
map has been included in Figure 13-1 hereafter, which shows the proposed FGD complex,
railway yard, and associated infrastructure in relation to key environmental sensitivities. The
environmental sensitivity overlay map has also been included in A3 size in Appendix D-4 to
this FEIR.
Key considerations that must be taken into account include:
• The Medupi Power Station is currently under construction, with 3 generation units already
operational, while the remaining 3 units are under construction. The construction activities
associated with the generation units are clearly seen in Figure 13-1, with the power station
area under active construction being classified as no natural habitat remaining.
• The FGD retrofit infrastructure will be constructed and operated within the Medupi Power
Station footprint;
• The railway yard development area furthermore falls within the existing MPS footprint
between the power station and existing ADF. A large portion of the railway yard area is
currently transformed due to construction activities, while the remaining portion still has
intact vegetation, although characterised by notable alien infestation. The extent of intact
vegetation is evident from Figure 13-1, with the secondary PCD and a portion of the
proposed railway yard to be constructed within the intact vegetation.
• Existing pollution management measures such as clean and dirty water separation
infrastructure, is already installed within the MPS footprint. This already provides some
assurance that possible impacts originating from the FGD system and associated
infrastructure will be managed within the existing pollution management system.
• The construction of the FGD system and the proposed railway yard has been considered
during the initial planning phases of the MPS before construction started. As a result, the
station has been designed and constructed to allow retrofitting of a wet FGD system,
whereas the area earmarked for the railway yard was specifically set aside to allow
alignment of the proposed railway yard with the existing mainline between Thabazimbi and
Lephalale passing the power station along its southern boundary. The placement and
alignment of the proposed infrastructure is therefore already considered optimal and
therefore alternatives were not considered.
• The MPS was granted an Environmental Authorisation for construction and operation of
the current ADF. An investigation was undertaken to identify an additional ADF site which
would receive ash and gypsum (both type 3 wastes), and chemical salts and sludge from
23 May 2018 226 12949
ZITHOLELE CONSULTING
the WWTP (Type 1 waste). However, this investigation was met with several site
constraints relating to biodiversity and social flaws and as a result Eskom made a decision
to apply for the long terms waste disposal site in a separate EA application process. There
is consideration for a development of a regional waste management facility, in which there
could be disposal, recycling, etc, and such can be developed by Eskom or a Third Party.
• This EA application therefore only considered the short-term waste disposal option of
trucking chemical salts and sludge to a licenced waste disposal facility for the first 5 years
of operation. However, in the event that an additional waste disposal facility to receive
power station and FGD waste has not been developed before the estimated 5 year has
passed, disposal of the chemical salts and sludge to a licenced waste disposal facility may
continue, or an alternative facility contracted, until such time that a suitably licenced waste
disposal facility has been constructed and operational to accept these waste streams.
• Temporary storage of FGD WWTP solid waste (salts and sludge) will be occur at a
hazardous waste storage facility (identified by the purple outlined areas in Figure 13-1)
within the Medupi Power Station footprint, designed and constructed according to specific
requirements as stipulated in the Norms and Standards for the Storage of Waste, which
will be removed by an accredited service provider to an approved waste disposal facility;
• It is understood that the demand for water in the region is high and with the expected
growth of the local economy in Lephalale and influx of labourers, contractors and support
services, the demand is expected to increase. Eskom has already been granted a water
allocation from the MCWAP Phase 1 to operate the MPS fully including the operation of 3
of the 6 FGD absorber units. Furthermore, Eskom has engaged the Department of Water
and Sanitation (DWS) to provide the required water allocation from the MCWAP Phase 2A
to operate the remaining 3 FGD absorber units.
• The MCWAP Phase 1 and 2 has been designed not only to supply water to Eskom for
operation of the MPS, but also to ensure a supply of water to other industries such as
mining, as well as a sufficient supply of potable water to the local municipality and
communities in the district. Therefore, it should be noted that the water allocation granted
to Eskom will not be in competition with the water demands from other water users in the
region.
• The MPS, which is a dry-cooled power station, is furthermore designed and constructed
to significantly reduce water consumption when compared to other wet-cooled power
stations in the Eskom fleet. Although the operation of the FGD will result in an increased
consumption of water due to the implementation of the wet FGD technology, it is estimated
that even with the additional consumption of water by the wet FGD system, the MPS’s
water consumption will still be significantly less than that of wet-cooled power stations.
• Through the construction and operation of the MPS, Eskom has already established
mechanisms to engage with communities that may be affected within the power station’s
zone of influence through existing forums such as the MPS Environmental Monitoring
Committee (EMC) and other initiatives to make a difference in the lives of local residents.
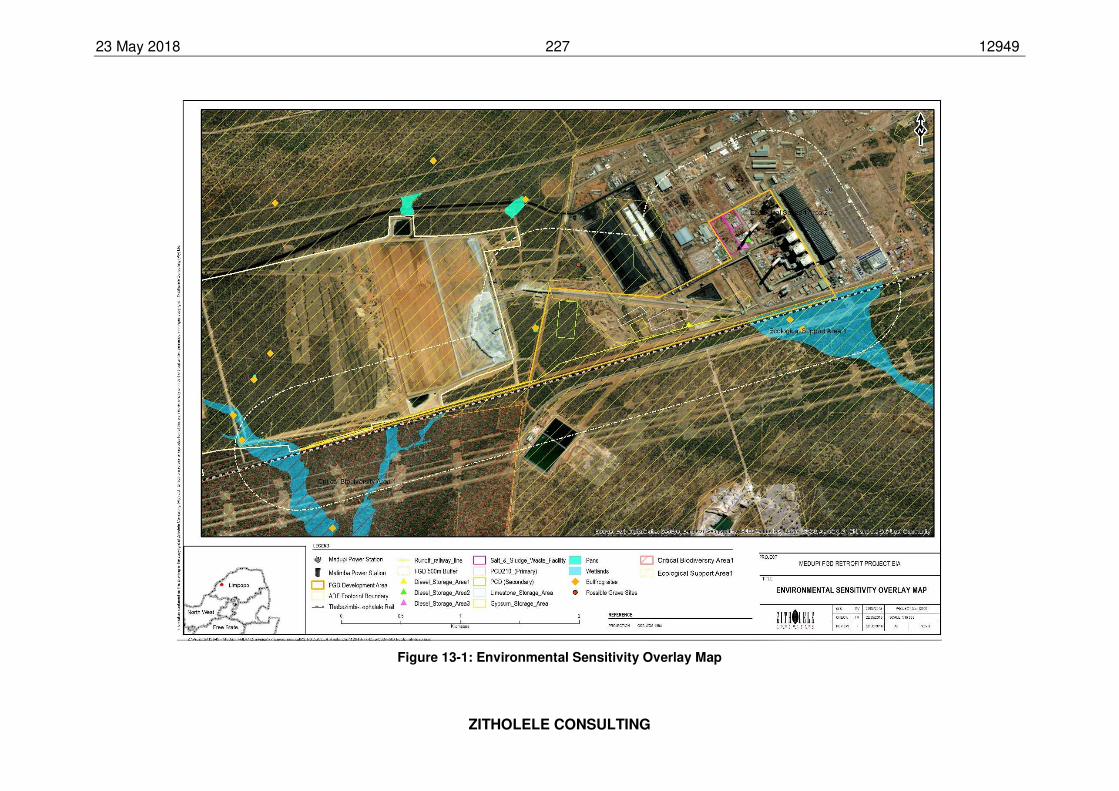
23 May 2018 227 12949
ZITHOLELE CONSULTING
Figure 13-1: Environmental Sensitivity Overlay Map
23 May 2018 228 12949
ZITHOLELE CONSULTING
13.2 Key findings
A summary of the key findings and conclusions reached by the specialists commissioning on
this project include the following sections.
Geotechnical considerations
The geotechnical specialist concluded, based on available studies and specialist opinion
compiled by the specialist, that no significant geotechnical hazards or fatal flaws were
identified within the study area. Foundation designs for all infrastructure to be constructed
at the FGD and railway yard areas is expected to require standard foundation design that does
not require additional engineering specification. The only deep excavation that will be
undertaken is an estimated 15m excavation for the limestone offloading facility (Tippler
building). It is likely that ground water may be intersected, however the specialist concluded
that all the geotechnical considerations mentioned can be mitigated in the design of the
limestone offloading facility.
Soils and Land Capability
The key findings from the soils and land capability specialist indicate the impact of concern is
loss of soil resources at the development site. No potential impacts on soils or land use were
identified during the planning and pre-development phase. The specialist considered the loss
of soil resources during the construction and operational phase and has concluded that with
the implementation of proposed soil conservation plans included in section 12.1, and other
proposed mitigation measures the residual impact on soils would be Moderate to Low.
The fact that the proposed development site is located within an already disturbed area has
also contributed to the significance rating although existing and proposed mitigation measures
need to continue to manage stockpiled soils for effective rehabilitation during the
decommissioning phase.
Groundwater Resources
Key findings highlighted by the groundwater impact assessment are that groundwater levels
are generally shallow, i.e. ~2m in some areas, with an average groundwater level of 30.4 mbgl.
The hydrocensus water quality analyses concluded that the background groundwater quality
at the MPS is Marginal (Class II) to Poor (Class III - IV) water quality, with exceedances of
some constituents observed in some boreholes tested.
The specialist also concluded, based on the simplified groundwater risk assessment that
trucking of type 1 waste to a licensed hazardous waste disposal site is effectively a positive
impact on site since the hazardous waste is removed from site in a responsible manner and
disposed of at a waste facility licenced for this purpose.
The groundwater impact assessment furthermore concluded that residual impacts on
groundwater quality, volume and flow relating to the construction and operation of the FGD,
23 May 2018 229 12949
ZITHOLELE CONSULTING
railway yard and associated infrastructure shows an overwhelmingly Low impact
significance if proposed mitigation measures are implemented successfully.
Surface water
The surface water specialist raised an important consideration during the assessment of
impacts on surface water quality, runoff and flooding. Since an existing impact is already
occurring on site, a Storm Water Management System (SWMS) has been implemented on the
development site. The surface water specialist concluded that the SWMS appears to be well
operated and maintained, therefore the existing impact is rated as Low.
It is furthermore unlikely that a significant reduction in surface water runoff will occur
due to the construction of the railway yard and FGD infrastructure within the MPS. The main
reason for this is exactly the fact that the proposed infrastructure will be constructed within the
MPS footprint. The existing SWMS will continue to ensure clean and dirty water separation,
amongst other management measures, to avoid dirty water from entering the downstream
water resources. Therefore, the likely impact on surface water runoff will be of Low
significance.
The specialist further concluded that the runoff around the facility in the clean areas is not
markedly changed for the sub-catchment of the Sandloop, resulting in a potential impact
significance of low.
The surface water specialist also compiled a professional opinion to assess the likely impact
of trucking salts and sludge to an off-site waste disposal facility. It was concluded that the
transportation of salts and sludge from Medupi Power Station to an appropriately licensed
existing hazardous waste facility outside of the study area will not pose a serious threat to
water resources in the region.
Biodiversity (Terrestrial Ecology) and Wetlands
It must again be noted here that although the wetland specialist assessed potential impacts
on wetlands resulting from the MPS and ADF, wetlands were largely impacted by the
development of the ADF. Impact on semi-ephemeral wash SEW 2 as a result of the FGD
plant, railway yard, and associated infrastructure is expected to be minor since the FGD
infrastructure is situated within the footprint of the existing MPS, which means that engineering
and mitigation management measures to manage dirty water runoff, erosion, for example, is
pre-existing at the proposed site, thereby reducing impacts on the receiving environment
outside the MPS footprint.
A key finding of the biodiversity and wetlands specialists relate to the potential loss of
vegetation species, habitat and fauna mortality during the construction. It was concluded
that after successful implementation of the proposed mitigation measures, such as
rehabilitation of downstream wetlands and pans, and proposed offsets, the cumulative impact
significance could be reduced with the residual impact being reduced to Moderate or Low
significance.
23 May 2018 230 12949
ZITHOLELE CONSULTING
Another prominent impact feature that was identified during the construction phase is the loss
of catchment area contributing to storm water runoff, increased flood peaks and pollution
through contaminated runoff. The specialist concluded that impacts related to pollution run-
off and increased flood peaks can be mitigated to Moderate to Low impact significance
levels.
It must lastly by taken into account that the specialist has assessed impacts to the identified
wetlands in relation to the Mining and Biodiversity Guidelines (MBG), and FEPA guidelines as
it relates to mining activity, and recommended that a 1km buffer on around all FEPA listed
systems is enforced. The operation of a power station can certainly not be considered mining
operations and it is therefore concluded that the specialist has inappropriately linked the ash
disposal facilities to mining classifying the ADF as a “residue stockpile”, and therefore that the
MBG’s are applicable. In terms of the NEMWA, as amended, the definition of “residue
stockpile” is “any debris, discard, tailings, slimes, screening, slurry, waste rock, foundry sand,
mineral processing plant waste, ash or any other product derived from or incidental to a mining
operation and which is stockpiled, stored or accumulated within the mining area for potential
reuse, or which is disposed of, by the holder of a mining right, mining permit or, production
right or an old order right, including historic mines and dumps created before implementation
of this Act.” When considering this definition it becomes clear that the following conditions
must be true:
1. ash must be derived or incidental to a mining operation, and 2. ash must be stockpiled, stored or accumulated within the mining area, 3. by the holder of a mining right, mining permit or, production right
This is not the case for ash generated from a power station, therefore the recommendations
of a 1km buffer area around FEPA wetlands should not be seen as definite. The EAP proposes
that the 500m buffer as per the NWA is acceptable in this case and should be the guideline
against which encroachment into the wetland buffer area should be considered.
Air quality
The air quality specialist assessed potential air quality impacts relating to the implementation
of the FGD during the operational phase. Other possible impacts resulting from the
construction phase, e.g. dust nuisance, were regarded as negligible and was expected not to
exceed current air quality levels.
The specialist concluded that cumulative SO2 concentrations would reduce significantly
with the implementation of the FGD system, with no exceedances of the NAAQS at sensitive
receptors, resulting in an impact significance of Low. Furthermore, continuing operation of
the power station until such time the FGD infrastructure is installed and operational will not
result in exceedances of the current minimum emissions standards in force.
The air quality specialist furthermore concluded that no exceedances of the NAAQS for NO2,
PM10 and PM2.5 resulted from simulations run at sensitive receptors also resulting in Low
impact significance.
23 May 2018 231 12949
ZITHOLELE CONSULTING
Noise
The impact assessment undertaken by the noise specialist rated impact on ambient noise
levels during the planning and operational phases as low. The specialist concluded that
during these phases the noise levels in the area are representative of suburban districts. The
specialist also found that construction and decommissioning activities would result in a
Moderate noise impact, but with noise levels remaining local yet still notable.
The specialist therefore concluded that in the quantification of noise emissions and simulation
of noise levels as a result of the proposed project, it was calculated that ambient noise
evaluation criteria for human receptors will not be exceeded at NSRs.
The impacts on ambient noise levels through all phases of the proposed development
therefore resulted in overwhelmingly Low impact significance.
Social
A social specialist undertook an extensive impact assessment of the proposed FGD retrofit
project on local communities and social aspects characteristic of the Lephalale area. All
impacts identified during the Operational and Decommissioning Phases were
considered positive impacts, whereas half of the impacts identified during the construction
phase are positive impacts on the surrounding community.
During the Planning / Pre-construction Phase the establishment of spin-off businesses, e.g.
B&Bs, to support the construction phase of the Medupi FGD and railway yard was identified
as a positive impact that could contribute to the local economy and employment
opportunities.
Positive impacts associated with the Construction Phase of the FGD, railway yard and
associated infrastructure revolve around economic and employment opportunities as well
as upgrading of infrastructure such as local roads.
The social specialist therefore concluded that the significance of positive social impacts
generally exceeds the significance of negative social impacts in the implementation of
the FGD system and the railway siding throughout all four stages of the project.
Heritage, Archaeology and Palaeontology
The Heritage and Palaeontological Impact Assessments did not identify any heritage,
archaeological or palaeontological resources within the proposed development footprint for
the FGD infrastructure, railway yard and associated infrastructure. Therefore no impacts
exist that may have a detrimental impact on any heritage, archaeological or
palaeontological resources.
23 May 2018 232 12949
ZITHOLELE CONSULTING
Traffic
During assessment of the impact impacts, the specialist concluded that by implementing
proposed upgrades at major intersections, the Level of Service (LOS) would be increased
from LOS F, which equates to relatively long delays at intersections, to at least a LOS of B or
A, indicating short stoppage times at intersections.
No impacts on the road network were anticipated during the Planning / Pre-construction
phase, and as a result no impact rating for this phase was determined.
Furthermore, it is concluded that all identified impacts were regarded as low once the
proposed mitigation measures has been implemented.
13.3 Summary of impacts and risks
The Environmental Impact Statement provides an account of the key findings of the EIA.
Based on the significance ratings assigned to the anticipated environmental impacts, the EAP
makes the following conclusions relating to impacts and risks:
• Potential impacts on geotechnical aspects, noise levels, heritage, archaeology,
palaeontology, and traffic are minor and can successfully be mitigated to acceptable levels
with proposed mitigation.
• Assessment of the proposed air quality impacts has demonstrated what was anticipated,
i.e. that implementation of the FGD system would significantly reduce the SO2 emissions
at the MPS to very low levels. However, within the MPS operations the Wet FGD system
will consume more water than the alternative technologies considered. The increased
water demand from the Wet FGD system is offset by a water allocation from MCWAP
Phase 1 and 2.
• The potential impact on local communities and social aspects is an overwhelmingly
positive impact. Reduction of SO2 levels is the primary positive impact that will result in
better quality of life for residents in the region. Additionally, indirect positive impacts
resulting from growth in the local economy and greater employment opportunities will be
significant.
• Overall the impact of the installation of the FGD system, railway yard and associated
infrastructure will have a Moderate to High impact on the local biodiversity, and to a lesser
degree, wetlands in close proximity to the FGD. Although loss to intact vegetation types
and habitat will be permanent for the life of the power station, impacts on fauna can be
mitigated to more successfully to a greater extent.
23 May 2018 233 12949
ZITHOLELE CONSULTING
14 REASONED OPINION OF THE EAP
During preparation of the reasoned opinion by the EAP for impacts associated with the
proposed construction of the FGD complex, railway yard and all associated infrastructure, the
following aspects were strongly considered:
1. The MPS is currently under construction with 3 of the 6 generation units already
synchronised and operational.
2. The MPS was designed and constructed to incorporate wet FGD technology through
a retrofit process. The available footprint for the FGD structure is therefore aligned
with the existing infrastructure layout of the MPS and changes in technology will result
in structural changes to the existing infrastructure.
3. The footprint of the railway yard was also reserved specifically to align with the existing
rail infrastructure and MPS infrastructure layout to ensure ease of integration later on.
4. The MPS already has management and mitigation measures installed, whether it is
optimised design and construction or the implementation of specific mitigation
measures emanating from the original environmental authorisation. Assurance, to a
large degree, already exists that additional impacts that may arise due to the FGD
system and railway yard will also be managed within the existing management system.
5. All identified impacts relating to geotechnical conditions, soils and land capability,
groundwater surface water resources, noise, social, heritage resources and traffic are
largely of Low impact significance or has a positive impact, given that proposed
mitigation measures are implemented successfully.
6. The positive impacts of the FGD system on the quality of life, economic and
employment opportunities for local communities resulting from the operation of the
MPS with FGD needs specific consideration.
7. It is acknowledged that impacts on biodiversity and existing wetlands are Moderate to
High, and therefore stringent mitigation measures must be implemented to offset these
impacts. The EAP further believes that the fact that the construction of the FGD
system, railway yard and associated infrastructure within the existing MPS footprint,
which is zoned for industrial activity, contribute to a large degree in the mitigation of
identified impacts. The management of impacts from this infrastructure will be
undertaken within the framework of an existing Environmental Management System
further contribute to prioritise the mitigation of any significant impacts on the
surrounding biodiversity and wetlands.
8. The high demand for water within a water stressed catchment is further acknowledged.
It is expected that the demand for water will only increase with the increase in local
economic development and influx of employers, labourers and businesses. These
facts must however be considered in the light of the implementation of the MCWAP
23 May 2018 234 12949
ZITHOLELE CONSULTING
Phase 1 and development of MCWAP Phase 2 that has been commissioned by the
DWS specifically to bring different qualities of water to the region to secure water in
the long term for household use and human consumption, agricultural uses, as well as
to support industrial activities such as the MPS, mines in the region and other industrial
activities. It must also be considered that the MPS was designed as a dry-cooled
power station specifically to operate sustainably within a water stressed environment,
even with the operation of wet FGD technology.
9. Ultimately, when considering the No-Go option, that if the FGD system is not installed,
the MPS will not obtain compliance with its AEL conditions and funder requirements,
and as a result will likely have to stop operation, the expected negative impact on the
supply of electricity, economic growth and extensive economic benefits the No-Go
option will approach a fatally flawed impact significance.
Therefore, taking all the aforementioned considerations into account it is the reasoned opinion
of the EAP that the negative impacts associated with impacts on biodiversity and wetlands
can be successfully mitigated to within acceptable levels, with the development contributing
to the overwhelming positive impacts associated with the reduction in SO2, significant benefits
to the local economy and quality of life for local residents, the proposed activities be
authorised.
The EAP recommends the following general conditions to be included:
• Environmental authorisation (EA) will be subject to the implementation of mitigation
measures and conditions stipulated within the EMPr and this Environmental Impact
Report.
• Construction must commence within a period of 5 years
• EA will be valid for the life of the Medupi Power Station, subject to revisions and
amendments through legislated procedures as the need arise.
• Eskom must continue to investigate water saving measures for the Medupi Power Station.
• Eskom must continue to investigate mechanisms for waste reduction or minimisation,
especially relating to the re-use of ash and gypsum. This has the potential to unlock further
economic benefits for local communities living near power stations.
The DEA Director: Biodiversity Conservation furthermore recommended the following
conditions explicitly to be included as specific conditions in the Environmental Authorisation
(EA):
• All wetlands areas must be avoided by the development activities, including a suitable
buffer zone to avoid impacts on these water courses;
• Harvest of hill wash material must be prohibited within 100m of the delineated edge of all
identified depressions and semi-arid ephemeral wash wetlands and within 500m radial
buffer of the identified bullfrog breeding site;
23 May 2018 235 12949
ZITHOLELE CONSULTING
• A pre- and post-construction alien and invasive control, monitoring and eradication
programme must be implemented along with an on-going programme to ensure
persistence of indigenous species;
• Rehabilitation work must be done during low rainfall seasons and soil compaction should
be prevented as far as possible;
• Alien invasive plant species in and around the road reserve must be removed in terms of
Conservation of Agricultural Resources Act (CARA), and follow-up actions for at least 5
years need to take place; and
• All re-vegetation must be done with local indigenous plant species as specified by the
Provincial Co-ordinator and/or Wetland Ecologist.
These conditions have furthermore been incorporated into the Environmental Management
Programme (EMPr) for the Medupi FGD Retrofit Project.
23 May 2018 236 12949
ZITHOLELE CONSULTING
15 REFERENCES
Abell, S. et al., 2018. Biodiversity and Wetland Asessment for the FGDProject at Medupi Power
Station - Lephalale, Limpopo. Report Ref.:2112, Johannesburg: Natural Scientific Services CC.
AEPA, 2007. Guidelines for Separation Distances. s.l.:Australian Environmental Protection Agengy.
Aurecon, 2017a. Medupi FGD Retrofit: Stormwater Design Report, Rev B. Document Ref. No.:
500332-0000-REP-WD-0001., Pretoria: Aurecon.
Aurecon, 2017b. Medupi FGD Retrofit: Water Balance Report, Rev B. Document Ref. No.: 200332-
0000-REP-WW-0001., Pretoria: Aurecon.
Aurecon, 2018. Medupi FGD Retrofit: Concept Design Report, Rev E. Document ID: 500332-0000-
REP-JJ-0001., Pretoria: Aurecon South Africa (Pty) Ltd.
Bohlweki Environmental, 2006. Environmental Impact Assessment Report for the proposed
establishment of a new coal-fired power station in the Lephalale area, Limpopo Province, Lephalale: Eskom Holdings SOC Limited.
Bosch Holdings Consortium, 2015. Basic and detailed design of Medupi rail yard and offloading
facility, Report Ref No: 1184-099-4-100-R-0001-Rev03, Johannesburg: Eskom Holdings SOC Limited.
Brink, D. & van der Linde, G., 2018. Hydrogeological Impact Assessment of Existsing Licenced
Disposal Facility for Medupi FLue Gas. Report No: 1415777-311754-2_Rev1, Johannesburg: Golder Associates Africa.
Chang, D., van Wyk, L. & Bagus, M., 2018. Medupi Flue Gas Desulphurisation: Technology Selection
Study Report, Revision 3 Unique Identifier 474-10175, Johannesburg: Eskom Holdings SOC Limited.
Department of Environmental Affairs, 2017. Environmental Impact Assessment Regulations, 2014, as
amended, Pretoria: DEA.
Eskom Holdings SOC Limited, 2014. Medupi FGD Retrofit Conceptual Design Report, Johannesburg: Eskom Holdings SOC Limited.
Eskom Holdings SOC Limited, 2015. Eskom Air Quality Strategy, Document 32-114. Ref No: ENV15-
R054, Midrand: Eskom Holdings SOC Limited.
Eskom Holdings SOC Limited, 2016. Medupi FGD Retrofit Project Plot Plan, Drawing No 178771-
GAU-G1000, 0.84/36776-Rev7, Johannesburg: Eskom Holdings SOC Limited.
Eskom Holdings SOC Limited, 2017. Climate Change & COP 17: Eskom's six step approach to
climate change. [Online] Available at: http://www.eskom.co.za/AboutElectricity/FactsFigures/Documents/Kusile_and_Medupi.pdf [Accessed 20 November 2017].
Eskom Holgins SOC Limited, 2014. Medupi FGD Retrofit Basic Design Report, Johannesburg: Eskom Holdings SOC Limited.
Harris, D., 2014. Medupi FGD Retrofit Basic Design Report, Midrand: Eskom Holdings SOC Limited.
Harris, D., Hart, A. & Odendaal, D., 2014. Medupi FGD Retrofit Technology Selection Study Report,
Johannesburg: Eskom Holdings SOC Limited.
HPA, 2011. Highveld Priority Area Air Quality Management Plan., Pretoria: Department of Environmental Affairs, Chief Directorate: Air Quality Management.
Jones and Wagener, 2015. Waste Assessment of Ash and Flue Gas Desulphurisation Wastes for the
Medupi Power Station. Report No.: JW197/14/E173-REV 02., Johannesburg: Jones and Wagener.
23 May 2018 237 12949
ZITHOLELE CONSULTING
Jones and Wagener, 2017. Medupi Power Station Northern Ash and Gypsum Disposal Facility,
Concept Design Report. Report No.: JW158/17/G145-Rev 1., Johannesburg: Jones and Wagener.
Jones, I., 2018. Eskom Medupi Power Station - Flue Gas Desulphurisation Retrofit Project: Specialist
Soils and Land Capability Studies. Report No:ZC.MFG.S.14.10.040, 19 January 2018, s.l.: Earth Science Solutions.
Lephalale LM, 2017. Integrated Development Plan 2017-2018, Lephalale: Lephalale Local Municipality.
Marticorena, B. & Bergametti, G., 1995. Modelling the Atmospheric Dust Cycle 1 Design of a Soil-Derived Dust Emission Scheme.. Journal of Geophysical Research, Volume 100, pp. 16415 - 16430.
Owens-Collins, S., 2018. Eskom Medupi FGD Geotehnical Impact Assessment Study, Report No
1415881-299047-2, Midrand: Golder Associated Africa, January 2018.
Rockland Geoscience, 2015. Report on the Geotechnical Investigation conducted for a Proposed Rail
Siding and Off-loading Facility at Medupi Power Station, Lephalale, Limpopo Province. Report No:
RG014/169/Rev0, s.l.: Rockland Geoscience.
Scultze, R. et al., 1997. South African Atlas of Agrohydrology and Climatology, Pretoria: Water Research Commission (WRC Report: TT82/96).
Shao, Y., 2008. Physics ad Modelling of Wind Erosion. Atmospheric and Oceanographic Science
Library, 2nd Revised and Expanded Edition, s.l.: Springer Science.
Sithole, Z. & Jordaan, J., 2018. Surface Water Impact Assessment and Baseline Report for Medupi
Power Station. Report No. 1415879-310165-2, Johannesburg: Golder Associates Africa.
Tomose, N. & Bamford, M., 2018. Desktop Palaeontological Impact Assessment for the Proposed
Medupi Power Station Flue Gas Desulphurisation Retrofit Project and the Existing Medupi Power
Station Ash Disposal Facility, Lephalale, Limpopo Province, South Africa, Johannesburg: NGT Holdings (Pty) Ltd.
Tomose, N., Damane, Z., Tomose, Z. & Aspelling, T., 2018. Social Impact Assessment for the
Proposed Medupi Power Station Flue Gas Desulphurisation Retrofit Project and the existing Medupi
Power Station Ash Disposal Facility, Lephalale, Limpopo Province, South Africa., Johannesburg: NGT Holdings (Pty) Ltd.
Tomose, N. & Sutton, M., 2018. Heritage Impact Assessment for the Proposed Medupi Power Station
Flue Gas Desulphurisation Retrofit Project and the Existing Medupi Power Station Ash Disposal
Facility, Lephalale, Limpopo Province, South Africa, Johannesburg: HGT Holdings (Pty) Ltd.
US EPA, 2016. Sulphur Dioxide (SO2) Pollution: Sulfur Dioxide Basics. [Online] Available at: https://www.epa.gov/so2-pollution/sulfur-dioxide-basics#effects [Accessed 20 November 2017].
Venter, Y., 2017. Medupi Flue Gas Desulphurisation Traffic Impact Assessment, Johannesburg: HATCH Goba.
von Gruenewaldt, R., Burger, L. & Kornelius, G., 2018. Air Quality Specialist Report for the Proposed
Medupi Flue Gas Desulphurisation (FGD) Retrofit Project. Report No.: 14ZIT10, Johannesburg: Airshed Planning Professionals.
von Gruenewaldt, R. & von Reiche, N., 2018. Noise Specialist Report for the Proposed Medupi Flue
Gas Desulphurisation (FGD) Retrofit Project. Report No.:14ZIT08_N, Rev0.2. , Johannesburg: Airshed Planning Professionals.
ZITHOLELE CONSULTING (PTY) LTD
Related Documents