12.2 Management’s Discussion and Analysis (MD&A) 12.2.1 Overview The Group is the leader in Advertising Media and Managing Merchandising Spaces in BTS System, Modern Trade, and prime office buildings. The Company started to operate since 1999 by acquiring the Exclusive Rights to procure revenue from advertising media, commercial spaces, train body, and other additional areas on the BTS Skytrain system. In return, the Company agreed to pay BTSC for Remuneration for Management Right as specified in the License to Manage Marketing Services Agreement between the Company and BTSC. Later on, the Group emerged itself into Marketing Service business at 3 leading Modern Trades— which are Tesco Lotus, Big C (including former Carrefour), and Watsons. As of 30 June 2012, all three Modern Trades have an extensive network covering 1,624 branches nationwide. All of which, the Company own exclusive rights on the areas specified in the Advertisement Display Concession Agreement. The terms vary from 3 – 5 years and are essential in expanding the reach toward the Mass Media Viewers. After that, the Company acquired all shares of Point of View Media Group Co., Ltd. (“POV”), who owns the Right to Install and Manages Advertising Media in office buildings and various entertainment venues. The acquisition aimed to expand the Company’s Market Viewer into middle and upper income groups. In August 2011, the group, by VGI Advertising China Company Limited (“VGI Ad China”) – the Company’s subsidiary – received the Rights to Manage Advertising Media through Point of Purchase radio in CP Lotus in China. From the continuous expansion, the Company’s network in Advertising Media was able to extend nationwide penetrating a Mass Media Viewers and different target audiences. As a result, the operation of the Group was able to achieve sustainable growth; in whicih the consolidated revenue increased from 1,137.23 million Baht for the fiscal year ended 31 March 2010, to 1,412.01 million Baht for the fiscal year ended 31 March 2011, and 2,004.82 million Baht for the fiscal year ended 31 March 2012. This resulted in the annual growth rate of 24.16% and 41.98% respectively. The figures are significantly the result from the continuous growth of Advertising Media in Modern Trades and Advertising Space on BTS that increases in-line with the 12 additional trains in April 2011. In return, this has increased the Company and its subsidiaries’ net profit of 99.90 million Baht during the fiscal year ended March 2010 to 172.37 million Baht and 278.45 million Baht for the fiscal year ended 31 March 2011 and 2012 respectively; resulting in a 72.54% and 61.54% increase respectively.

Welcome message from author
This document is posted to help you gain knowledge. Please leave a comment to let me know what you think about it! Share it to your friends and learn new things together.
Transcript

12.2 Management’s Discussion and Analysis (MD&A)
12.2.1 Overview
The Group is the leader in Advertising Media and Managing Merchandising Spaces in BTS System,
Modern Trade, and prime office buildings. The Company started to operate since 1999 by acquiring the
Exclusive Rights to procure revenue from advertising media, commercial spaces, train body, and other
additional areas on the BTS Skytrain system. In return, the Company agreed to pay BTSC for Remuneration
for Management Right as specified in the License to Manage Marketing Services Agreement between the
Company and BTSC.
Later on, the Group emerged itself into Marketing Service business at 3 leading Modern Trades—
which are Tesco Lotus, Big C (including former Carrefour), and Watsons. As of 30 June 2012, all three
Modern Trades have an extensive network covering 1,624 branches nationwide. All of which, the Company
own exclusive rights on the areas specified in the Advertisement Display Concession Agreement. The terms
vary from 3 – 5 years and are essential in expanding the reach toward the Mass Media Viewers. After that, the
Company acquired all shares of Point of View Media Group Co., Ltd. (“POV”), who owns the Right to Install
and Manages Advertising Media in office buildings and various entertainment venues. The acquisition aimed
to expand the Company’s Market Viewer into middle and upper income groups. In August 2011, the group, by
VGI Advertising China Company Limited (“VGI Ad China”) – the Company’s subsidiary – received the Rights
to Manage Advertising Media through Point of Purchase radio in CP Lotus in China.
From the continuous expansion, the Company’s network in Advertising Media was able to extend
nationwide penetrating a Mass Media Viewers and different target audiences. As a result, the operation of the
Group was able to achieve sustainable growth; in whicih the consolidated revenue increased from 1,137.23
million Baht for the fiscal year ended 31 March 2010, to 1,412.01 million Baht for the fiscal year ended 31
March 2011, and 2,004.82 million Baht for the fiscal year ended 31 March 2012. This resulted in the annual
growth rate of 24.16% and 41.98% respectively. The figures are significantly the result from the continuous
growth of Advertising Media in Modern Trades and Advertising Space on BTS that increases in-line with the
12 additional trains in April 2011. In return, this has increased the Company and its subsidiaries’ net profit of
99.90 million Baht during the fiscal year ended March 2010 to 172.37 million Baht and 278.45 million Baht for
the fiscal year ended 31 March 2011 and 2012 respectively; resulting in a 72.54% and 61.54% increase
respectively.

For the quarter ended 30 June 2012, the total revenue of the Company and its subsidiaries has
increased from 479.50 million Baht for the quarter ended 30 June 2011, to 653.66 million Baht; which is a
36.32% increase. The growth was led by the increased in revenue from advertising in Sales Floor in Tesco
Lotus, and the additional Advertisement Display Concession for Sales Floor at Big C (including former
Carrefour). The profit for the quarter, period ending on 30 June 2012, grew from 80.35 million Baht to 159.89
million Baht, or 99.00% year on year.
Total asset for the fiscal year ended 31March 2010, 31 March 2011, 31 March 2012, and for the
quarter ended 30 June 2012 were 1,271.36 million Baht, 1,297.17 million Baht, 1,313.89 million Baht, and
1,550.43 million Baht, respectively, which made the growth rate of 2.03%, 1.29%, and 18.00%. The increased
in assets was mainly due to the increase in trade accounts receivable which has increased in-line with the
revenue.
At the same time, the Company and its subsidiaries’ total liabilities for the fiscal year ended 31 March
2010, 31 March 2011, 31 March 2012, and for the quarter ended 30 June 2012, were 818.17 million Baht,
883.45 million Baht, 1,020.75 million Baht, and 1,003.04 million Baht, respectively. The increasing liabilities
were mainly from the increased in trade accounts payable and tax payable. The shareholder equities were
gradually decreased from 453.20 million Baht for the fiscal year ended 31 March 2010, to 413.73 million Baht
as of 31 March 2011, and 293.14 million Baht as of 31 March 2012, mainly due to the dividend payment from
the net profit and retained earnings during the period. However, the shareholder equities for the fiscal year
ended 30 June 2012 increased to 547.39 million Baht mainly due to 1) paid-up capital increased from 100.00
million Baht to 274.00 million Baht in May 2012, and 2) the increased in net profit of 80.35 million Baht for the
quarter ended 30 June 2011, to 159.89 million Baht for the quarter ended 30 June 2012.
12.2.2 Operating Result Analysis
(1) Operating result overview
The total revenue of the Company and its subsidiaries had gradually increased from 1,137.23
million Baht for the fiscal year ended 31 March 2010, to 1,412.01 million Baht for the fiscal year ended 31
March 2011, and to 2,004.82 million Baht for the fiscal year ended 31 March 2012. As a result, the total
revenue of the Company had increased from 479.50 million Baht to 653.66 million Baht, or 36.32% increased
year on year.

Revenue structure, Cost of services, and Gross profit of the Company and its subsidiaries in the fiscal ended
31 March 2010, 31 March 2011, and 31 March 2012
Item
Fiscal year ended 31 March
2010 2011 2012 2010 2011 2012 2011 2012
Million Baht % of Total Revenue % Growth
Revenue
Revenue from Advertising Media and Merchandising Space Rental
In BTS Skytrain System 889.10 934.40 1,143.18 78.18 66.18 57.02 5.09 22.34
In Modern Trade 206.87 390.91 754.10 18.19 27.68 37.61 88.97 92.91
In Office and other Buildings 18.59 75.73 80.06 1.63 5.36 3.99 307.41 5.72
Total Revenue from Advertising
Media and Merchandising Space
Rental
1,114.56 1,401.04 1,977.34 98.01 99.22 98.63 25.70 41.13
Other Revenue 22.67 10.97 27.48 1.99 0.78 1.37 (51.60) 150.39
Total Revenue 1,137.23 1,412.01 2,004.82 100.00 100.00 100.00 24.16 41.98
Cost of Services
Cost of Services for Advertising Media and Merchandising Space Rental
In BTS Skytrain System 528.97 548.42 650.35 46.51 38.84 32.44 3.68 18.59
In Modern Trade 204.09 327.03 619.68 17.95 23.16 30.91 60.24 89.49
In Office and other Buildings 10.64 31.07 25.47 0.94 2.20 1.27 191.95 (18.03)
Total Cost of Services for
Advertising Media and
Merchandising Space Rental
743.71 906.53 1,295.50 65.40 64.20 64.62 21.89 42.91
Gross Profit
370.85 494.51 681.84 33.27 35.30 34.48 33.34 37.88
Note: Gross profit is profit from Advertising Media and Merchandising Space Rental only, does not include revenue from other businesses.
An increase in the total revenue for the fiscal year ended 31 March 2011, was driven by (1)
additional Advertising Display Concession Agreement for the Modern Trades area to manage Point of
Purchase Radio for all branches of Tesco Lotus, and to manage Advertising Display for Sales Floor
area in Tesco Lotus. (2) The First year to recognize full year revenue from the Advertising Display
Concession Agreements for Modern Trade area in which the Company acquired the right for the fiscal
year ended 31 March 2010, to manage advertising display at Non-Sales Floor area in former-Carrefour
(it is now Big C). As a result from the two factors, the revenue from Advertising Media in Modern Trades
area had been increasing significantly from 206.87 million Baht for the fiscal year ended 31 March
2010, to 390.91 million Baht for the fiscal year ended 31 March 2011, accounting for an increase of
88.97%. (3) The first year to recognize full year revenue from the POV (the Company acquired POV
and recognised the revenue since 1 November 2009), resulting in an increase in revenue from the
office building to be 75.73 million Baht for the fiscal year ended 31 March 2011, from 18.59 million Baht
for the fiscal year ended 31 March 2010, or 307.41% increased year on year. The revenue growth from
Advertising Media and Merchandising Space Rental in the BTS Skytrain system was not significant.
Due to the direct impact to the business from the political riot, it increased from 889.10 million Baht for
the fiscal year ended 31 March 2010, to 934.40 million Baht for the fiscal year ended 31 March 2011,
or 5.09% increased year on year.
An increase in the total revenue for the fiscal year ended 31 March 2012, was driven by (1) The
first year to recognize full year revenue from the Advertising Display management on sale floor area in
Tesco Lotus and the additional agreement to manage advertising display on sales floor area in former-
Carrefour (it is now Big C). The acquisition of an additional advertising space drove the revenue from
Advertising Media in Modern Trades to significantly increase from 390.91 million Baht for the fiscal year
ended 31 March 2011, to 754.10 million Baht for the fiscal year ended 31 March 2012, accounting for
an increase of 92.91%. (2) 12 additional BTS Skytrain, with 4 carriages per train, in April 2011,
resulting in an increase in the number of digital mornitors per round of air-time and the number of
market viewer per round of air-time that generated the demand for advertising on digital media from
the agencies and the owners of products and services. According to the rise in demand in April 2011,
the Company adjusted the advertising rates for digital mornitor on BTS Skytrain System. An increase in
revenue from the Advertising Media and Merchandising Space Rental on BTS Skytrain system was,
thus, rose from 934.40 million Baht for the fiscal year ended 31 March 2011, to 1,143.18 million Baht for
the fiscal year ended 31 March 2012, or 22.34% increased year on year.
The overall annual service cost increased by 21.89% and 42.91% respectively. However; the
main cost of the Group is the license fee that varied with the growth of revenue. The proportion of
service cost to the revenue was relatively stable at 65.40% for the fiscal year ended 31 March 2010,
64.20% for the fiscal year ended 31 March 2011, and 64.62% for the fiscal year ended 31 March 2012.
The gross profit of the Company was, thus, relative stable at 33.27% for the fiscal year ended31 March
2010, 35.30% for the fiscal year ended 31 March 2011, and 34.48% for the fiscal year ended 31 March
2012.

Revenue structure, Cost of services, and Gross profit of the Company and its subsidiaries for 3-month period
ended ended 30 June 2011, and 30 June 2012
Item
3-month period ended 30 June
2011 2012 2011 2012 2012
million Baht % of Total Revenue % Growth
Revenue
Revenue from Advertising Media and Merchandising Space Rental
In BTS Skytrain System 292.21 307.60 60.94 47.06 5.27
In Modern Trade 161.15 307.26 33.61 47.01 90.67
In Office and other Buildings 17.90 35.45 3.73 5.42 98.04
Total Revenue from Advertising Media
and Merchandising Space Rental
471.25 650.30 98.28 99.49 37.99
Other Revenue 8.24 3.36 1.72 0.51 (59.28)
Total Revenue 479.50 653.66 100.00 100.00 36.32
Cost of Services
Cost of Services for Advertising Media and Merchandising Space Rental
In BTS Skytrain System 165.86 111.92 34.59 17.12 (32.52)
In Modern Trade 129.05 226.36 26.91 34.63 75.41
In Office and other Buildings 6.29 7.30 1.31 1.12 15.91
Total Cost of Services for Advertising
Media and Merchandising Space Rental 301.20 345.57 62.82 52.87 14.73
Gross Profit
170.06 304.73 36.09 46.86 79.19
Note: Gross profit is profit from Advertising Media and Merchandising Space Rental only, does not include revenue from
other businesses.
Total revenue of the Company and its subsidiaries for the quarter ended 30 June 2012, was
653.66 million Baht, compared to that of the quarter ended 30 June 2011, which was 479.50 million
Baht, or 36.32% increased year on year. An increase in revenue was driven by (1) A rise in the revenue
from the Advertising Display for the sales floor area in Tesco Lotus, (2) An additional agreement to
manage Point of Purchase Radio and Advertising Display Concession Agreement with former-
Carrefour (it is now Big C). As a result from two factors, the revenue from Advertising Media in Modern
Trades had been increasing significantly from 161.15 million Baht for the quarter ended 30 June 2011,
to 307.26 million Baht for the quarter ended 30 June 2012, or 90.67% increased year on year. (3)
Acquired the right to manage advertising media in 4 additional office buildings that added up the total
number of office building under management to be 51 buildings, and (4) launched an agency business
to sell air-time on LED billboard located at Water Gate junction, Rama 9, and Victory Monument.

Therefore, the revenue from Advertising Media in office and other buildings had been increasing
significantly from 17.90 million Baht for the quarter ended 30 June 2011, to 35.45 million Baht for the
quarter ended 30 June 2012, or 98.04% increased year on year. The revenue growth from Advertising
Media and Merchandising Space Rental in the BTS Skytrain system was not significant. It increased
from 292.21 million Baht for the quarter ended 30 June 2011, to 307.60 million Baht for the quarter
ended 30 June 2012, or 5.27% increased year on year.
Service costs increased from 301.20 million Baht for the quarter ended 30 June 2011, to 345.57
million Baht for the quarter ended 30 June 2012, or 14.73% increased year on year. However, the ratio
of service costs to total revenue decreased from 62.82% for the quarter ended 30 June 2011, to
52.87% for the quarter ended 30 June 2012. A decrease in ratio was mainly due to the reduction of
remuneration for the management right that the Company pays BTSC according to the terms in the
contract and conditions as stated in the license between BTSC and the Company since 18 May 2012.
The lower fee payment resulted in the reduction in the service costs for Advertising Media in BTS
Skytrain System in which decreased from 165.86 million Baht for the quarter ended 30 June 2011, to
111.92 million Baht for the quarter ended 30 June 2012, or 32.52% decreased year on year. As a
result, the ratio of gross profit to total revenue increased from 36.09% for the quarter ended 30 June
2011, to 46.86% for the quarter ended 30 June 2012.
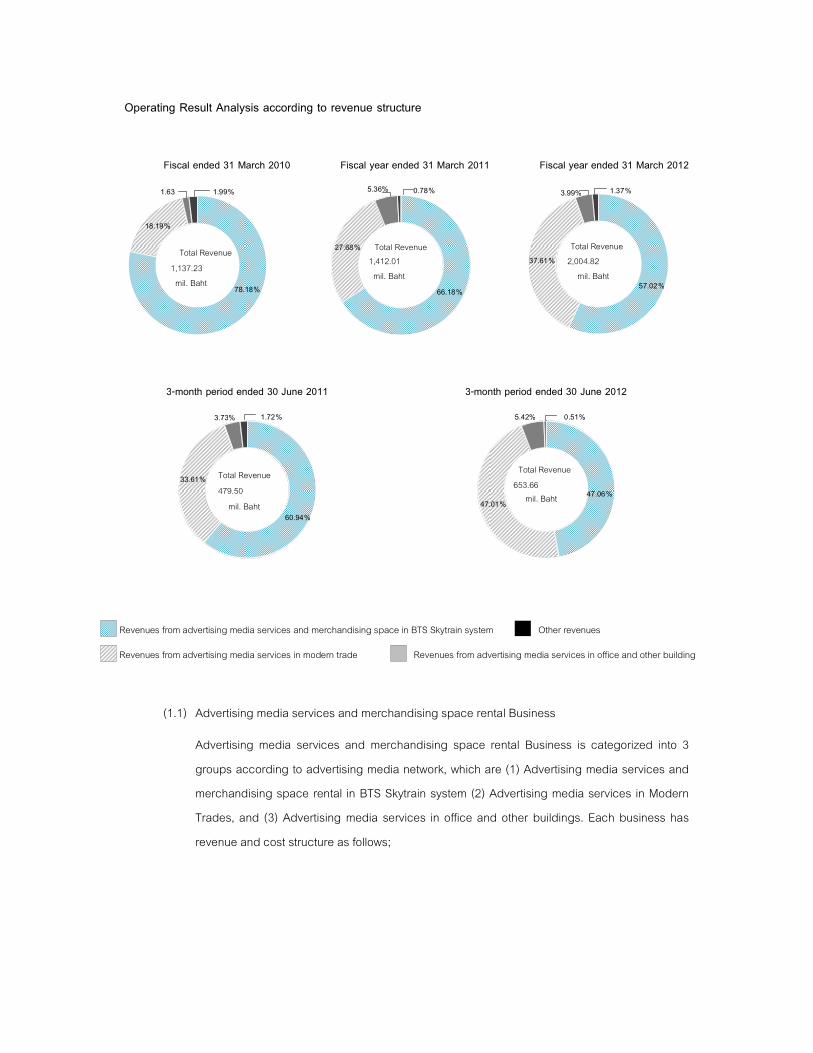
Operating Result Analysis according to revenue structure
Fiscal ended 31 March 2010 Fiscal year ended 31 March 2011 Fiscal year ended 31 March 2012
3-month period ended 30 June 2011 3-month period ended 30 June 2012
(1.1) Advertising media services and merchandising space rental Business
Advertising media services and merchandising space rental Business is categorized into 3
groups according to advertising media network, which are (1) Advertising media services and
merchandising space rental in BTS Skytrain system (2) Advertising media services in Modern
Trades, and (3) Advertising media services in office and other buildings. Each business has
revenue and cost structure as follows;
78.18 %
18.19 %
1.63% 1.99%
Total Revenue 1,137.23
mil. Baht66.18 %
27.68%
0.78%
Total Revenue 1,412.01
mil. Baht 57.02 %
37.61 %
3.99% 1.37%
Total Revenue 2,004.82
mil. Baht
60.94%
33.61 %
3.73% 1.72%
Total Revenue
479.50
mil. Baht
47.06%47.01%
0.51%
Total Revenue 653.66
mil. Baht
%
Revenues from advertising media services and merchandising space in BTS Skytrain system
Revenues from advertising media services in modern trade Revenues from advertising media services in office and other building
Other revenues
5.36%
5.42%
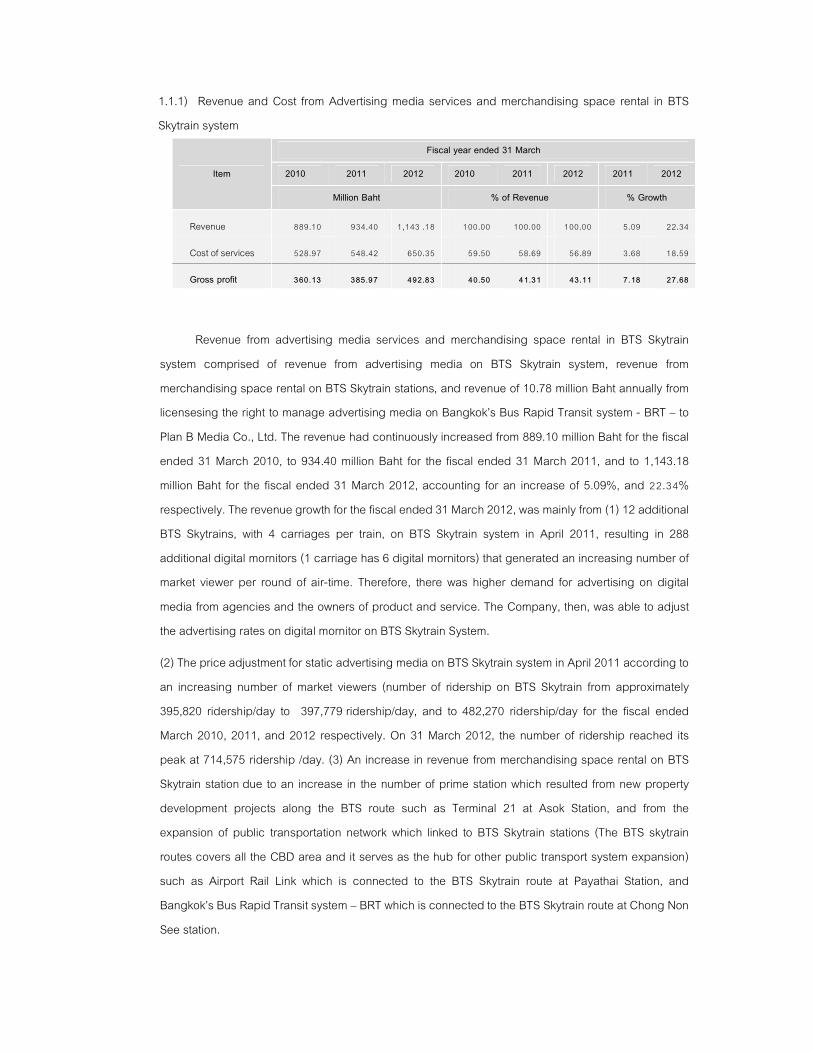
1.1.1) Revenue and Cost from Advertising media services and merchandising space rental in BTS
Skytrain system
Item
Fiscal year ended 31 March
2010 2011 2012 2010 2011 2012 2011 2012
Million Baht % of Revenue % Growth
Revenue 889.10 934.40 1,143 .18 100.00 100.00 100.00 5.09 22.34
Cost of services 528.97 548.42 650.35 59.50 58.69 56.89 3.68 18.59
Gross profit 360.13 385.97 492.83 40.50 41.31 43.11 7.18 27.68
Revenue from advertising media services and merchandising space rental in BTS Skytrain
system comprised of revenue from advertising media on BTS Skytrain system, revenue from
merchandising space rental on BTS Skytrain stations, and revenue of 10.78 million Baht annually from
licensesing the right to manage advertising media on Bangkok’s Bus Rapid Transit system - BRT – to
Plan B Media Co., Ltd. The revenue had continuously increased from 889.10 million Baht for the fiscal
ended 31 March 2010, to 934.40 million Baht for the fiscal ended 31 March 2011, and to 1,143.18
million Baht for the fiscal ended 31 March 2012, accounting for an increase of 5.09%, and 22.34%
respectively. The revenue growth for the fiscal ended 31 March 2012, was mainly from (1) 12 additional
BTS Skytrains, with 4 carriages per train, on BTS Skytrain system in April 2011, resulting in 288
additional digital mornitors (1 carriage has 6 digital mornitors) that generated an increasing number of
market viewer per round of air-time. Therefore, there was higher demand for advertising on digital
media from agencies and the owners of product and service. The Company, then, was able to adjust
the advertising rates on digital mornitor on BTS Skytrain System.
(2) The price adjustment for static advertising media on BTS Skytrain system in April 2011 according to
an increasing number of market viewers (number of ridership on BTS Skytrain from approximately
395,820 ridership/day to 397,779 ridership/day, and to 482,270 ridership/day for the fiscal ended
March 2010, 2011, and 2012 respectively. On 31 March 2012, the number of ridership reached its
peak at 714,575 ridership /day. (3) An increase in revenue from merchandising space rental on BTS
Skytrain station due to an increase in the number of prime station which resulted from new property
development projects along the BTS route such as Terminal 21 at Asok Station, and from the
expansion of public transportation network which linked to BTS Skytrain stations (The BTS skytrain
routes covers all the CBD area and it serves as the hub for other public transport system expansion)
such as Airport Rail Link which is connected to the BTS Skytrain route at Payathai Station, and
Bangkok’s Bus Rapid Transit system – BRT which is connected to the BTS Skytrain route at Chong Non
See station.

The service cost from the advertising media services and merchandising space rental in BTS
Skytrain system are mainly variable costs, for example the Remuneration for Management Right as
specified in the license to manage Marketing Services Agreement between the Company and BTSC,
and the cost from production of advertising media. For the fiscal ended 31 March 2010, 2011, and
2012, the service cost from the Advertising media services and merchandising space rental in BTS
Skytrain system was 528.97 million Baht, 548.42 million Baht, and 650.35 million Baht respectively,
accounting for an increase of 3.68% and 18.59% respectively. An increase in service cost was less
than an increase in the revenue which was 5.09% and 22.34% respectively, mainly due to an increase
in fixed costs, such as employee expenses, which was less than an increase in revenue. As a result,
the gross profit margin from the advertising media services and merchandising space rental in BTS
Skytrain system had increased from 40.50% to 41.31%, and to 43.11% for the fiscal ended 31 March
2010, 2011, and 2012 respectively.
Item
3-month period ended 30 June 2012
2011 2012 2011 2012 2012
Million Baht % of Revenue %Growth
Revenue 292.21 307.60 100.00 100.00 5.27
Cost of services 165.86 111.92 56.76 36.38 (32.52)
Gross profit 126.35 195.68 43.24 63.62 54.87
The revenue from advertising media services and merchandising space rental in BTS Skytrain
system for the quarter ended 30 June 2012 was 307.60 million baht, increasing from 292.21 million
baht for the quarter ended 30 June 2011, or 5.27% increased year on year due to (1) an increase in
revenue from static advertising media on Train Body Wrap and static and digital advertising media in
the carriage due to 12 additional BTS Skytrains with 4 carriages per train in April 2011. The new trains
were gradually added into the system for the quarter ended 30 June 2011. The Company started to
fully recognize the revene from the new trains from July 2011 onward. (2) An increase in revenue from
merchandising space rental in BTS Skytrain system due to an increase in the number of stalls and the
occupancy of stalls as a result of an increase in a number of prime stations - Payathai, Asok, and
Chong Non See.
The service cost from the advertising media services and merchandising Space rental in BTS
Skytrain system had significantly decreased from 165.86 million Baht in the quarter, period ending on
30 June 2011, to 111.92 million Baht for the quarter ended 30 June 2012, accounting for a decrease of
32.52% due to the reduction of the licence fee that the Company had to pay BTSC. The Company had

initially paid the license fee at 50% (including VAT) of the annual total revenue. During 18 May 2012 to
17 May 2022, the fee was reduced to 5% of the annual total revenue (excluding VAT) and it will be
adjusted to the rate of 10 - 20% from 18 May 2022 onward.
As a result, the gross profit margin from the Advertising media services and merchandising space
rental in BTS Skytrain system had increased from 43.24% for the quarter ended 30 June 2011 to
63.62% for the quarter ended 30 June 2012.
1.1.2) Revenue and cost from Advertising media services in Modern Trades
Item
Fiscal year ended 31 March
2010 2011 2012 2010 2011 2012 2011 2012
Million Baht % of revenue % Growth
Revenue 206.87 390.91 754.10 100.00 100.00 100.00 88.97 92.91
Cost of services 204.09 327.03 619.68 98.66 83.66 82.17 60.24 89.49
Gross profit 2.78 63.88 134.43 1.34 16.34 17.83 2,201.22 110.44
The revenue from Advertising Media services in Modern Trades had been growing continuously
from 206.87 million Baht to 390.91 million Baht and to 754.10 million Baht for the fiscal year ended31
March 2010, 2011, and 2012 respectively, or 88.97% and 92.91% increased respectively, due to (1)
First time of full-year revenue recognitions from the Advertisement Display Concession Agreements on
Non-Sales Floor in Carrefour (it is now Big C), (2) Granted additional Advertising Display Concession
Agreement in Modern Trades which were the right to manage Point of Purchase Radiobroadcasted,
and the right for Advertisement Display on Sales Floor in Tesco Lotus; which, from a marketing point of
view, is the key strategic location that impact the Buyer’s decision making and has marketing budget
more than Non-Sales Floor. (3) An increase in revenue from advertising media production. The
Company required that advertisement on Sales Floor must use the sevices of the Company for
production and installation of the advertisement because pieces of advertisement must pass standards
and qualities required by the property owners. As a result, when the Company received additional
Concession Agreement for Advertisement Display on Sales Floor in Tesco Lotus for all medium and
large supermarkets in March 2011, the revenue from advertisement production has increased
accordingly.
An increase in revenue from the advertising media services in Modern Trades for the fiscal year ended31
March 2012 was mainly due to (1) first time of full-year revenue recognitions from the Advertisement Display
Concession Agreements on Sales Floor in Tesco Lotus. (2) Granted additional Advertising Display
Concession Agreement in Modern Trades which were the right for Advertisement Display on Sales Floor in Big

C, and the right to manage Point of Purchase Radio broadcasted and Advertisement Display on Sales Floor in
Carrefour (it is now Big C). The location of advertisement the Company was granted the rights to are high-
valued spots because they have significant impact to Buyer’s decision making. (3) An increase in revenue
from advertising media production is the result of the additional rights for Advertisement Display on Sales
Floor in all branches of Big C (including former Carrefour). As of 31 March 2012, Big C had 176 branches in
total.
Summary of License to Manage Marketing Services Agreement at Modern Trades in fiscal year ended 31
March 2010, 2011, and 2012
Concession Agreements Revenue Recognition
Agreement signed in fiscal year ended 31 March 2010 (1 April 2009 to 31 March 2010)
Advertisement Display Concession Agreement at Non-Sales Floor with Carrefour (it is
now Big C)
July 2009
Advertisement media Concession Agreement with Watsons January 2010
Agreement signed in fiscal year ended 31 March 2011 (1 April 2010 to 31 March 2011)
Concession Agreement to manage Point of Purchase Radio broadcasted with Tesco
Lotus
May 2010
Concession Agreement to manage static and digital media on Sales Floor with Tesco
Lotus
March 2011
Agreement signed in fiscal year ended 31 March 2012 (1 April 2011 to 31 March 2012)
Concession Agreement to manage static and digital media on Sales Floor with Big C July 2011
Additional Advertisement media Concession Agreement on Sales Floor with Big C November 2011
Concession Agreement to manage static and digital media on Sales Floor with
Carrefour (it is now Big C)
January 2012
Concession Agreement to manage Point of Purchase Radio broadcasted with Carrefour
(it is now Big C)
January 2012
Additional Advertisement media Concession Agreement on Sales Floor with Tesco
Lotus
March 2012
Concession Agreement to manage Point of Purchase Radio broadcasted with Big C June 2012
The service costs from the advertising media services in Modern Trades increased from 204.09
million Baht for the fiscal year ended31 March 2010, to 327.03 million Baht, and 619.68 million Baht for
the fiscal year ended 31 March 2011, and 2012 respectively, or 60.24% , and 89.49% increased year
on year respectively. An increase in the cost for the fiscal year ended 31 March 2011, mainly due to an

increase in the remuneration for the concession agreements with Tesco Lotus in terms of revenue
sharing for the Point of Purchase Radio broadcasted and Advertisement media on Sales Floor, and
maintenance costs for advertising equipment and application system software. An increase in the cost
at end of fiscal year ending on 31 March 2012, was mainly due to an increase in the remuneration for
the concession agreements with Tesco Lotus and former-Carrefour (now Big C) for the Point of
Purchase Radio broadcasted and Advertisement media on Sales Floor including the remuneration for
the concession agreements with Big C for Advertisement media on Sales Floor. However, cost per
revenue for the advertising media services in Modern Trades had been continuously decreased from
98.66% for the fiscal year ended 31 March 2010, to 83.66%, and 82.17% for the fiscal year ended31
March 2011 and 2012 respectively, mainly due to (1) rapid growth of revenue from Additional
Advertisement media Concession Agreements which include Advertisement media on Sales Floor, and
(2) the growth of the Company’s fixed costs; such as utilities cost, employee expenses, and
depreciation costs, were lower than the growth of revenue. As a result, the gross profit margin from the
advertising media services in Modern Trades has increased from 1.34% for the fiscal year ended 31
March 2010, to 16.34% and 17.83% for the fiscal year ended31 March 2011 and 2012 respectively.
Item
3-month period ended 30 June
2011 2012 2011 2012 2012
Million Baht % of Revenue % Growth
Revenue 161.15 307.26 100.00 100.00 90.67
Cost of services 129.05 226.36 80.08 73.67 75.41
Gross profit 32.10 80.90 19.92 26.33 152.01
The revenue from advertising media services in Modern Trade for the quarter ended 30 June
2012, increased significantly to 307.26 million Baht from 161.15 million Baht in the same period of the
previous year, or 90.67% increased year on year. It was primarily due to (1) the increasing revenue
from Advertisement media on Sales Floor at Tesco Lotus, (2) Granting additional Advertising Display
Concession Agreement in Modern Trades which were the rights to manage Point of Purchase Radio
broadcasted and Advertisement Display on Sales Floor in Big C, and that in former-Carrefour (it is now
Big C), (3) Granting 9 additional advertisement spaces on Sales Floor in Big C, and (4) the increasing
revenue from advertising media production as a result of the additional right for Advertisement Display
on Sales Floor in all branches of former-Carrefour (it is now Big C). As of 30 June 2012, Big C had 202
branches in total.
The service costs from advertising media services in Modern Trade for the quarter ended 30
June 2012, was 226.36 million Baht, increased from 129.05 million Baht for the quarter ended 30 June
2011, or 75.41% increased year on year. It was primarily due to an increase in the remuneration for the
concession agreements with Tesco Lotus, Big C, and former-Carrefour (now Big C) in terms of revenue
sharing for the Point of Purchase Radio broadcasted and Advertisement media on Sales Floor.
However, cost per revenue for the advertising media services in Modern Trades for the quarter ended
30 June 2012, decreased to 80.08% from 98.66% for the quarter ended 30 June 2011, primarily due to
(1) rapid growth of revenue from Additional Advertisement media Concession Agreements, (2) the cost
for remuneration for Advertisement media Concession Agreements on Sales Floor paying to Tesco for
the quarter ended 30 June 2011, were higher than that of the same period, ending on 2012, because
the agreement was granted in 2011 and during the early period of the agreement, the minimum
payment rate exceeded the revenue sharing rate, the Company then had to pay Tesco Lotus at the
minimum payment rate. However, for the quarter ended 30 June 2012, when the Company had higher
revenue from this agreement, the remuneration then become at revenue sharing rate, (3) the growth of
the Company’s fixed costs; such as utilities cost, employee expenses, maintainance cost for media
equipment, and depreciation costs, were lower than the growth of revenue. As a result, the gross profit
margin from the advertising media services in Modern Trades for the quarter ended 30 June 2012,
increased to 26.33% from 19.92% for the quarter ended 30 June 2012.
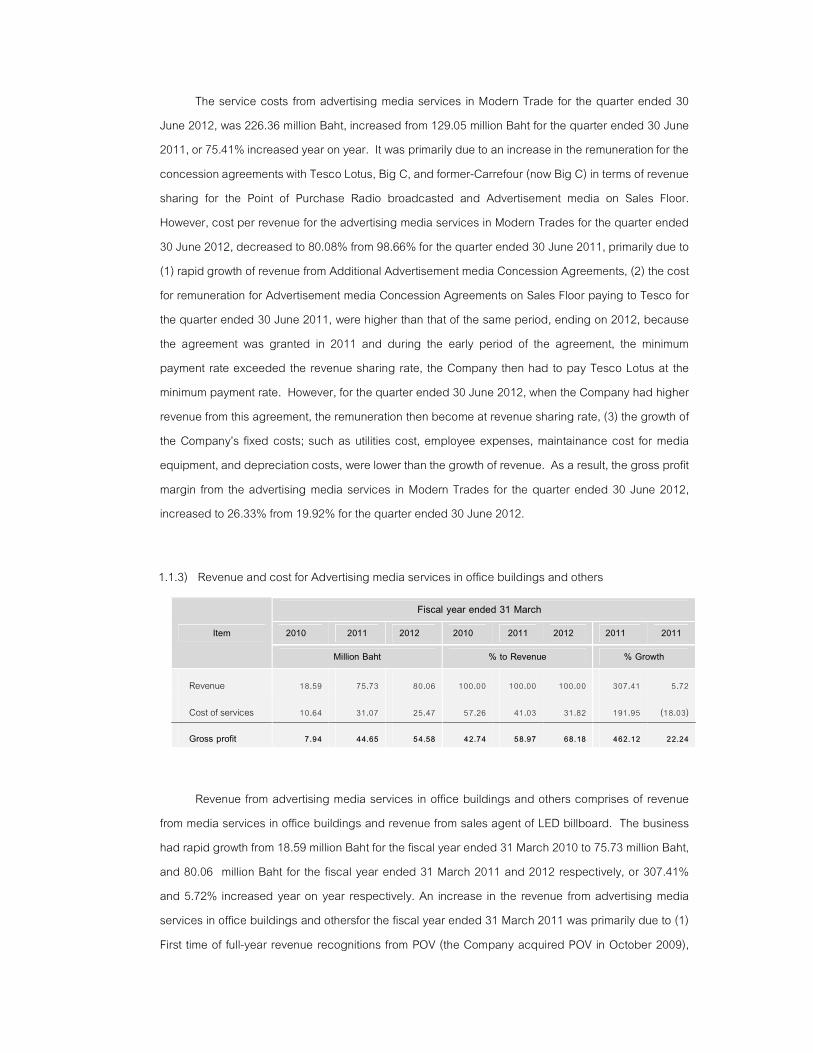
1.1.3) Revenue and cost for Advertising media services in office buildings and others
Item
Fiscal year ended 31 March
2010 2011 2012 2010 2011 2012 2011 2011
Million Baht % to Revenue % Growth
Revenue 18.59 75.73 80.06 100.00 100.00 100.00 307.41 5.72
Cost of services 10.64 31.07 25.47 57.26 41.03 31.82 191.95 (18.03)
Gross profit 7.94 44.65 54.58 42.74 58.97 68.18 462.12 22.24
Revenue from advertising media services in office buildings and others comprises of revenue
from media services in office buildings and revenue from sales agent of LED billboard. The business
had rapid growth from 18.59 million Baht for the fiscal year ended 31 March 2010 to 75.73 million Baht,
and 80.06 million Baht for the fiscal year ended 31 March 2011 and 2012 respectively, or 307.41%
and 5.72% increased year on year respectively. An increase in the revenue from advertising media
services in office buildings and othersfor the fiscal year ended 31 March 2011 was primarily due to (1)
First time of full-year revenue recognitions from POV (the Company acquired POV in October 2009),
and (2) the Group’s selling stategy that bundles advertisement for all office buildings into monthly
package which advertisement buyers cannot select which building to on-air their advertisements. As a
result, the Company is able to sell air-time in both - high-trafic-viewer or low-trafic-viewer buildings.
Moreover, the growth was from strategy to promote the packages which include the advertisement in
office buildings together with other digital media such as digital media on BTS Skytrain system and/or
digital media in Modern Trades (Tesco Lotus and/or Watsons)
An increase in the revenue from advertising media services in office buildings and others for the
the fiscal year ended 31 March 2012 was primarily due to (1) the additional right for advertising media
in 4 additional office buildings which made the total number of office under managent rose from 47
buildings to 51 buildings, and (2) lauching the business as an agency for air-time on LED billboard
located at Water Gate, Rama 9, and Victory Monument junction.
The cost of services from advertising media services in office buildings and others increased
from 10.64 million Baht for the fiscal year ended 31 March 2010 to 31.07 million Baht for the fiscal year
ended 31 March 2011, or 191.95% increased year on year. The cost for the fiscal year ended 31
March 2012 was 25.47 million Baht or 18.03% decreased year on year. An increase in cost of services
from advertising media services in office buildings and others for the fiscal year ended in 2011 was
lower than that of the revenue during the period which increased 307.41%. it was mainly due to (1) the
rapid growth of revenue from advertising media services in office buildings and others during the
period resulted from bundling digital media in office buildings with other digital media such as digital
media in BTS Skytrain system and/or digital media in modern trade and (2) the growth of the
Company’s fixed costs, such as utilities cost, maintainance cost for media equipments, and
depreciation costs, was lower than the growth of revenue.
decreasing decrease in cost of services from advertising media services in office buildings and
others for the fiscal year ended in 2012 was primarily due to the expiration of advertising space rental
contract for elevator doors in the fiscal year 2011 which the Company did not renew the contract in the
fiscal year 2012. As the cost per revenue ratio from the advertising space on the elevator doors was
higher than the cost per revenue ratio from the advertising digital media in elevators, with out the
service operation on elevator’s door, the overall ratio of cost per revenue from Advertising media
services in office and other buildings then decreased from 41.03% for the fiscal year ended 2011 to
31.82% for the fiscal year ended 2012.
Item
3-month period ended 30 June
2011 2012 2011 2012 2012
Million Baht % of Revenue % Growth
Revenue 17.90 35.45 100.00 100.00 98.04
Cost of services 6.29 7.30 35.16 20.58 15.91
Gross profit 11.60 28.15 64.84 79.42 142.58
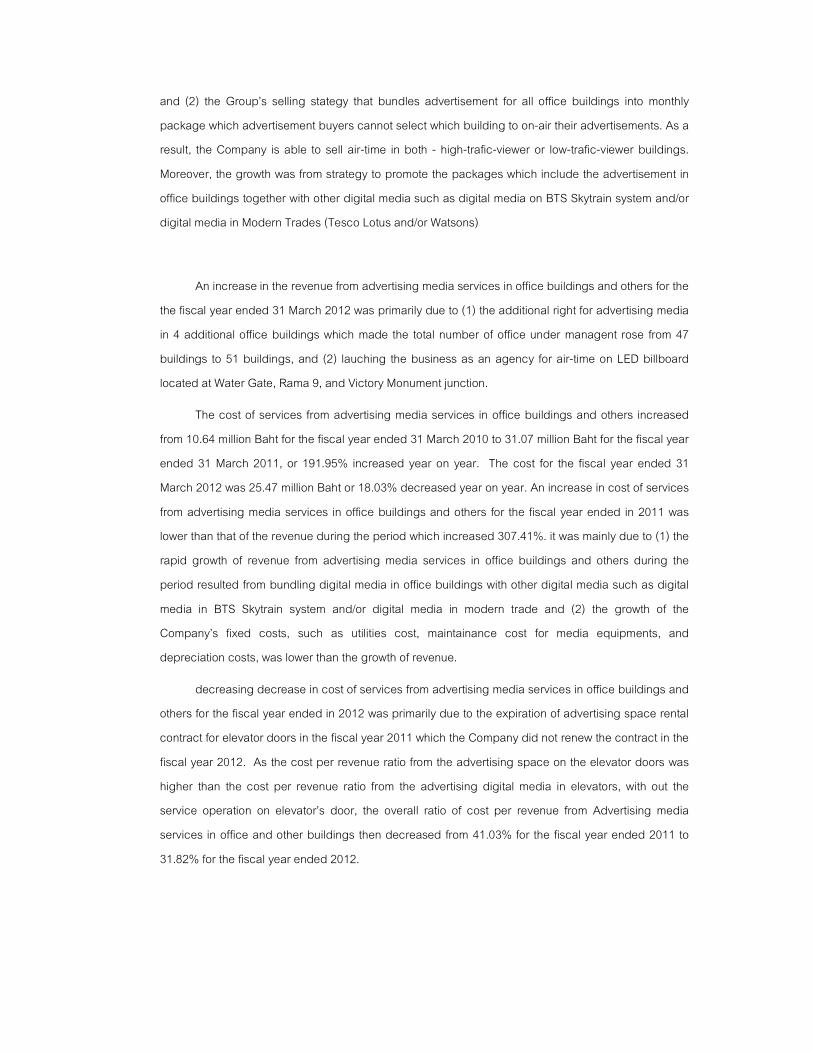
Revenue from advertising media in office buildings and others increased from 17.90 million
Baht for the quarter ended 30 June 2011 to 35.45 million Baht for the quarter ended 30 June 2012, or
98.04% increased year on year. The increased in the utilisation of advertising space during the period
was mainly due to (1) the additional right for advertising media in 4 additional office buildings which
made the total number of office under managent rose from 47 buildings to 51 buildings, (2) the Group’s
strategy to sell advertising media in package which bundles advertising media in office buildings with
digital media in BTS Skytrain system. As a result, the sales of advertising media in office buildings went
higher, and (3) the start of sales agency busiess for air-time on LED billboard located at Water Gate,
Rama 9, and Victory Monument junction.
The cost from advertising media services in office buildings and others increased from 6.29
million Baht for the quarter ended 30 June 2011 to 7.30 million Baht for the quarter ended 30 June
2012, or 15.91% increased year on year, due to an increase in the license fee payment in terms of
revenue sharing. However, the cost per revenue from advertising media services in office buildings
and otheres decrease from 35.16% for the quarter ended 30 June 2011 to 20.58% for the quarter
ended 30 June 2012. It was mainly due to (1) the rapid growth of revenue from advertising media
services in office buildings and others for the quarter ended 30 June 2012 (2) the growth of the
Company’s fixed costs, such as utilities cost, maintainance cost for media equipments, and
depreciation costs, was lower than the growth of revenue. As a result the gross profit margin from
advertising media services in office buildings and others increased from 64.84% for the quarter ended
30 June 2011 to 79.42% for the quarter ended 30 June 2012.
(1.2) Other revenues
Other revenues comprised of profit from sales of assets, interest income, and profit from
reversal of provision of 22.68 million Baht, 10.97 million Baht ,and 27.48 million Baht for the fiscal year
ended 31 March 2010, 2011, and 2012 respectively. Other revenues for the fiscal year ended 31
March 2011 was significant lower than that of 2010 because in the fiscal year ended 2010, the
Company had reversal of accrued expenses of 5.27 million Baht. An increase in other revenues for the

fiscal year ended 31 march 2012 was mainly due to the interest income and reversal of accrued
expenses of 13.39 million Baht during the period.
Other Revenues was 3.36 million Baht for the quarter ended 30 June 2012, decreased from 8.24
million Baht for the quarter ended 30 June 2011, mainly due to (1) there was reversal of accrued
expenses of 4.06 million Baht for the quarter ended 30 June 2011, and (2) a decrease in revenue from
interest income from short-term bill of exchange from 2.50 million Baht for the quarter ended 30 June
2011 to 0.98 million Baht for the quarter ended 30 June 2012.
(2) Selling and Administration Expenses (SG&A)
item
Fiscal year ended 31 March
2010 2011 2012 2010 2011 2012 2011 2012
Million Baht % to Revenue % Growth
Selling expenses 31.62 56.72 43.91 2.78 4.02 2.19 79.39 (22.59)
Administration Expenses 196.66 187.27 226.38 17.29 13.26 11.29 (4.77) 20.88
Total Selling and
Administration Expenses 228.27 243.99 270.28 20.07 17.28 13.48 6.89 10.78
Selling and administration expenses slightly increased from 228.27 million Baht for the fiscal
year ended 31 March 2010 to 243.99 million Baht and 270.28 million Baht for the fiscal year ended 31
March 2011 and 2012 respectively, or 6.89% and 10.78% increased year on year respectively.
However, SG&A per total revenue ratio continuously decreased from 20.07% for the fiscal year ended
31 March 2010 to 17.28%, and 13.48% for the fiscal year ended 31 March 2011 and 2012 respecively.
A decrease in the ratio for the fiscal year ended 31 March 2011 was due to one-time advisory expense
for business acquisition for the fiscal ended 31 March 2010, while there was no such fee in the fiscal
year ended 2011. A decrease in SG&A per total revenue for the fiscal ended 31 March 2012 was
mainly due to a decrease in marketing and research expense.
item
3-month ended 30 June
2011 2012 2011 2012 2012
Million Baht % to Revenue % Growth
Selling Expenses 9.29 18.08 1.94 2.77 94.57
Administratrion Expenses 49.53 76.48 10.33 11.70 54.40
Total Selling and Administration
Expenses 58.83 94.56 12.27 14.47 60.75

Selling and administrative expenses increased from 58.83 million Baht for the fiscal year ended
31 March 2010 to 94.56 million Baht for the fiscal year ended 31 March 2011, or 60.75% increased
year on year, mainly due to an increase in selling expenses, which vary to sales revenue, and the
preparation cost for listing the Company in the Stock Exchange of Thailand.
(2.1) Selling Expenses
Selling expenses, which comprised of marketing costs, marketing research and development
costs, sales promotional costs and other costs of 31.62 million Baht for the fiscal year ended 31 March
2010, increased to 56.72 million Baht and 43.91million Baht forn the fiscal year ended 31 March 2011
and 2012 respectively. This made the selling expenses to total revenue ratio increased to 2.78%,
4.02% and 2.19% respectively. An increase in the selling expenses for the fiscal year ended 31 March
2011 was mainly due to the marketing and marketing research and development, from 9.85 million
Baht for the fiscal year ended 31 March 2010 to 29.60 million Baht for the fiscal year ended 31 March
2011, or 200.51% increased. An increase in such expenses was due to the establishment of VGI
Advertising China Company Limited to provide Point of Purchase radio in CP Lotus in China on 25
June 2010. Thus, the new company generated high one-time expenses.
For the quarter ended 30 June 2012, selling expenses increased from 9.29 million Baht for the
quarter ended 30 June 2011 to 18.08 million Baht, or 94.57% increased year on year. This was mainly
due to (1) an increase in commission fee for sales staff according to an increase in revenues from
sales services, and (2) an increase in the marketing research and development on media industry in
order to benefit from advertising space management.
(2.2) Administration Costs
Item
For fiscal year ended 31 March
2010 2011 2012 2010 2011 2012 2011 2012
Million Baht % to Revenue % Growth
Employee Expenses 112.02 116.73 151.94 9.85 8.27 7.58 4.21 30.16
Depreciation of office
equipments Expenses 10.02 10.06 10.52 0.88 0.71 0.52 0.47 4.55
Other Adminstration
Expenses 74.62 60.47 63.91 6.56 4.28 3.19 (18.96) 5.69
Total Administration
Expenses 196.66 187.27 226.38 17.29 13.26 11.29 (4.77) 20.88
Administration expenses decreased from 196.66 million Baht for the fiscal year ended 31 March
2010 to 187.27 million Baht for fiscal year ended 31 March 2011, or 4.77% decreased year on year,
and increased to 226.38 million Baht for the fiscal year ended 31 March 2012, or 20.88% increased
year on year. A decrease in in the administration expenses for the fiscal year ended 2011, which
resulted in the decreasing in administration to total revenue ratio from 17.29% for the fiscal year ended
31 March 2010 to 13.26% for the fiscal year ended 31 March 2011, was mainly due to the one-time
advisory expenses for business acquisition of 11.40 million Baht for the fiscal year ended 31 March
2010.
An increase in administration expenses for the fiscal year ended 31 March 2012 was mainly
from an increase in employee expenses from 116.73 million Baht for the fiscal year ended 31 march
2011 to 151.94 million Baht for the fiscal year ended 31 march 2012. It was because in March 2011,
July 2011, and January 2012, the Company was granted an additional advertising media agreements
on Sales Floor from Tesco Lotus, Big C, and former-Carrefour (it is now Big C) respectively, therefore,
the Company employed more staff. However, the administrative expenses, which were mainly fixed
costs, increased in smaller proportion compared to an increase in revenues. As a result,
administration expenses to total revenue ratio decreased from 13.26% for the fiscal year ended 31
March 2011 to 11.29% for the fiscal year ended 31 March 2012. Thus, in order to prepare for potential
higher advertising services, the Company increased the number of employees from 263 employees as
of 31 Mach 2011 to 431 employees as of 31 March 2012.
Item
3-month ended 30 June
2011 2012 2011 2012 2012
Million Baht % to Revenue % Growth
Employee Expenses
Depreciation of office
equipments Expenses
35.59 50.01 7.42 7.65 40.54
2.27 3.34 0.47 0.51 46.66
Other Adminstration
Expenses 11.67 23.13 2.43 3.54 98.14
Total Administration
Expenses 49.53 76.48 10.33 11.70 54.40
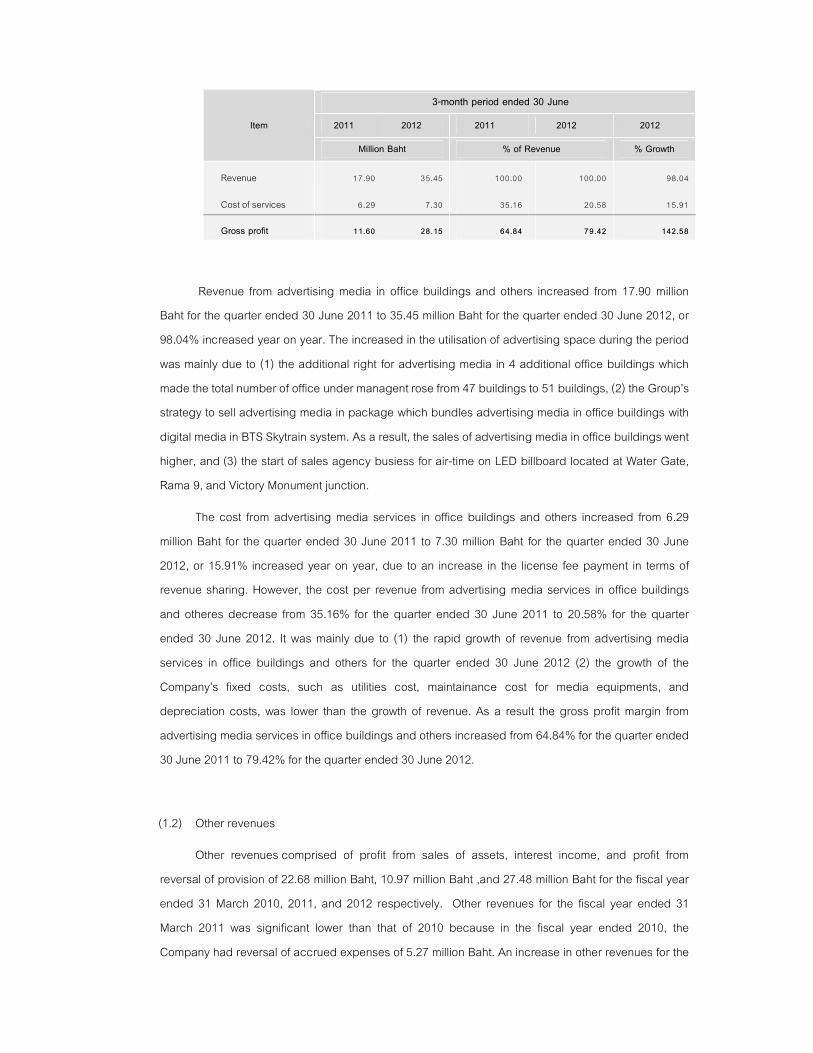
Administration expenses increased from 49.53 million for the quarter ended 30 June 2011 to
76.48 million Baht for the quarter ended 30 June 2012, or 54.40% increased year on year. It was mainly
due to (1) an increase in the employee expenses from 35.59 million for the quarter ended 30 June
2011 to 50.01 million Baht for the quarter ended 30 June 2012 according to an increase in the number
of employee from 278 employees, as of 30 June 20011, to 448 employees, as of 30 June 2011, in
preparation of potential higher advertising services from the additional advertising media agreements

on Sales Floor from Tesco Lotus, Big C, and former-Carrefour (it is now Big C) (2) Advisory expenses
and other administrative expenses that went up according to the preparation cost for listing the
Company in the Stock Exchange of Thailand.
(3) Operating profit and Net profit
Item
Million Baht % Growth
Fiscal year ended 31 March 3-month
ended 30 June
Fiscal year
ended 31 March
3-month
ended 30 June
2010 2011 2012 2011 2012 2011 2012 2012
Operating profit 164.55 262.22 427.12 119.17 213.34 59.36 62.89 79.02
Net profit 99.90 172.37 278.45 80.35 159.89 72.54 61.55 99.00
An increase in the operating profit and net profit for the fiscal year ended 31 March 2011 and
2012 was due to (1) acontinuous increase in revenue from advertising media, (2) Effective cost-
control, and (3) an increase in selling and administrative expenses, which is fixed cost, was lower than
an increase in total revenue. As a result, the operating profit margin and net profit margin increased
continuously as shown in the table below;
(Unit: %) Fiscal year ended 31 March
2010 2011 2012
Operating profit margin 14.76 18.72 21.60
Net profit margin 8.78 12.21 13.89
An increase in operating profit and net profit for the quarter ended 30 June 2012 was mainly
due to (1) an increase in revenue from advertising media, (2) the reduction in the licence fee that the
Company had to pay BTSC. Previously, the Company had been paying the license fee at 50%
(including VAT) of the annual total revenue. However, the fee was reduced to 5% of the annual total
revenue ( excluding VAT) during 18 May 2012 to 17 May 2022, and then at the rate 10%-20% from 18
May 2022 onward, and (3) Effective cost-control.
(Unit: %) 3-month period ended 30 June
2011 2012
Operating profit margin 25.29 32.81
Net profit margin 16.76 24.46
12.2.3 Financial Position Analysis
(1) Asset
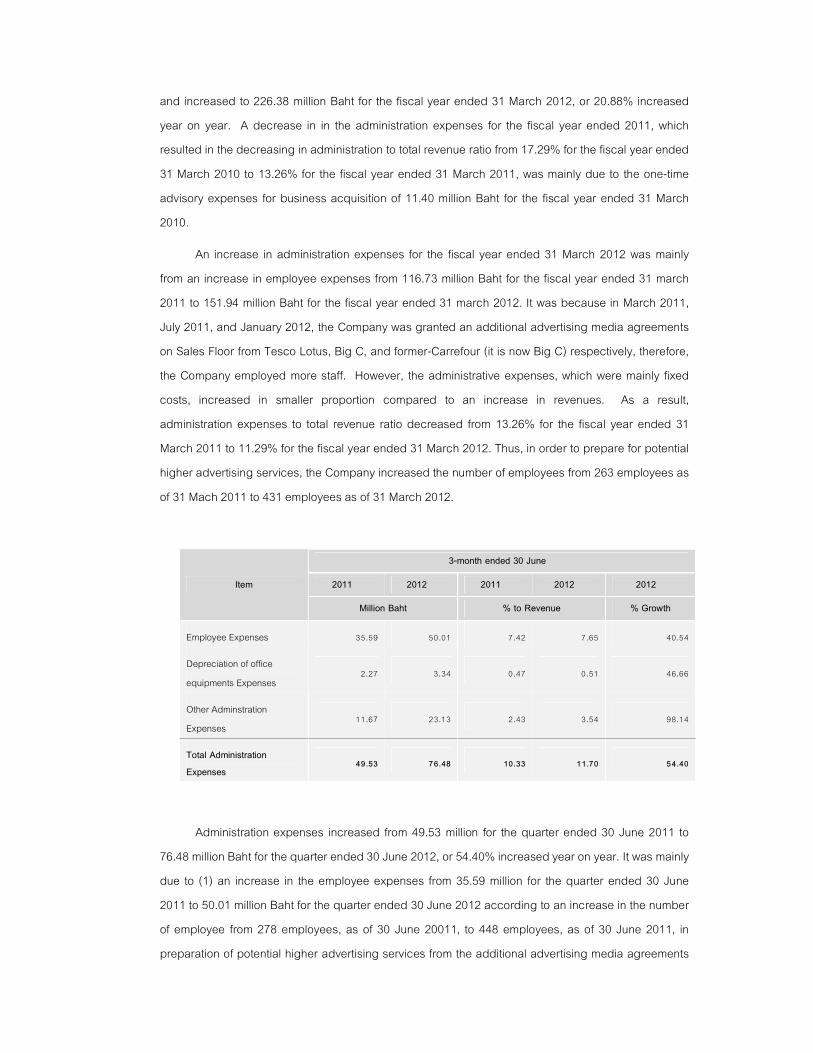
As of 30 June 2012, the Company and its subsidiaries had total asset of 1,550.43 million Baht,
increased from 1,313.89 million Baht, 1,297.17 million Baht, and 1,271.36 million Baht as of 31 March
2012, 2011, and 2010 respectively. An increase in the total asset during the period was mainly due to
an increase in trade accounts receivable which increased in accordance with an increase in revenue
of the Company and its subsidiaries.
A ccording to the nature of business operation of the Company and its subsidiaries, there were
low investment in non-current asset; therefore, the majority of the assets are current asset which
accounted for approximately 70-80% of the total asset. The majority of asset of the Company and its
subsidiaries comprised of cash and cash equivalents, accounts receivable, and equipment – net
which was 26.35% , 45.09% , and 14.69% respectively in proportion to the total assets, as of 30 June
2012.
As of 31 March 2010 As of 31 March 2011 As of 31 March 2012
As of 30 June 2011 As of 30 June 2012
Current Asset Non-Current Asset
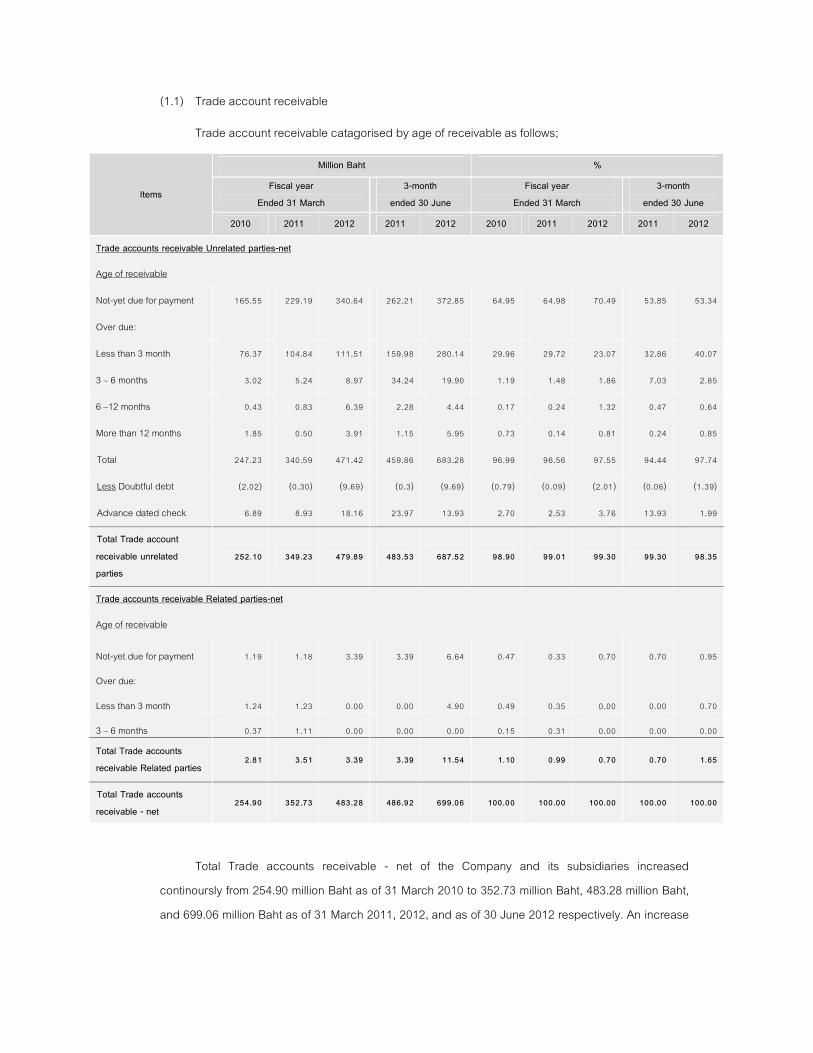
(1.1) Trade account receivable
Trade account receivable catagorised by age of receivable as follows;
Items
Million Baht %
Fiscal year
Ended 31 March
3-month
ended 30 June
Fiscal year
Ended 31 March
3-month
ended 30 June
2010 2011 2012 2011 2012 2010 2011 2012 2011 2012
Trade accounts receivable Unrelated parties-net
Age of receivable
Not-yet due for payment 165.55 229.19 340.64 262.21 372.85 64.95 64.98 70.49 53.85 53.34
Over due:
Less than 3 month 76.37 104.84 111.51 159.98 280.14 29.96 29.72 23.07 32.86 40.07
3 – 6 months 3.02 5.24 8.97 34.24 19.90 1.19 1.48 1.86 7.03 2.85
6 –12 months 0.43 0.83 6.39 2.28 4.44 0.17 0.24 1.32 0.47 0.64
More than 12 months 1.85 0.50 3.91 1.15 5.95 0.73 0.14 0.81 0.24 0.85
Total 247.23 340.59 471.42 459.86 683.28 96.99 96.56 97.55 94.44 97.74
Less Doubtful debt (2.02) (0.30) (9.69) (0.3) (9.69) (0.79) (0.09) (2.01) (0.06) (1.39)
Advance dated check 6.89 8.93 18.16 23.97 13.93 2.70 2.53 3.76 13.93 1.99
Total Trade account
receivable unrelated
parties
252.10 349.23 479.89 483.53 687.52 98.90 99.01 99.30 99.30 98.35
Trade accounts receivable Related parties-net
Age of receivable
Not-yet due for payment 1.19 1.18 3.39 3.39 6.64 0.47 0.33 0.70 0.70 0.95
Over due:
Less than 3 month 1.24 1.23 0.00 0.00 4.90 0.49 0.35 0.00 0.00 0.70
3 – 6 months 0.37 1.11 0.00 0.00 0.00 0.15 0.31 0.00 0.00 0.00
Total Trade accounts
receivable Related parties 2.81 3.51 3.39 3.39 11.54 1.10 0.99 0.70 0.70 1.65
Total Trade accounts
receivable - net 254.90 352.73 483.28 486.92 699.06 100.00 100.00 100.00 100.00 100.00
Total Trade accounts receivable - net of the Company and its subsidiaries increased
continoursly from 254.90 million Baht as of 31 March 2010 to 352.73 million Baht, 483.28 million Baht,
and 699.06 million Baht as of 31 March 2011, 2012, and as of 30 June 2012 respectively. An increase

in total accounts recievable-net was in accordance with an increase in revene of the Company and its
subsidiaries.
The Company and its subsidiaries have credit term policy of 30-90 days depending onthe type
of customers. Generally, agency customers, which are accounted for 65% of all customers, have
credit term of 60-90 days when the product/service owners have credit term of 30 days.
Trade accounts receivable of the Company and its subsidiaries comprised of trade accounts
receivable-unrelated parties, and trade accounts receivable-related parties. Almost all of trade
accounts receivable, 99%, is trade account receivable-unrelated parties. Only the minority of 1% are
trade accounts receivable-related parties.
Trade accounts receivable-unrelated parties mostly not-yet mature, which were accounted for
64.95%, 64.98%, 70.49%, and 53.34% of total trade account receivable as of 31 March 2010, 2011,
2012, and 30 June 2012 respectively. Over-3-months overdue trade accounts receivable were
accounted for 2.08%, 1.86%, 3.99%, and 4.33% of total trade accounts receivable as of 31 March
2010, 2011, 2012, and 30 June 2012 respectively. The main reason of an increase in over-3-months
overdue trade accounts receivable increased for the fiscal year ended 30 March 2012 and the quarter
ended 30 June 2012 was due to one customer who had liquidity difficulty and unable to payback debt.
Currently, the Company is on the legal process and had already set up an allowance for doubtful
account. The Company and its subsidiaries have policy to set up an allowance for doubtful by
considering from the maturity period of receivable, historical payment, and the creditability of each
customer. The proportion of trade accounts receivable which was over due more than 3 months for the
quarter ended 30 June 2011 and 2012 was higher than in the fiscal ended 31 March of each year.
(1.2) Investments in subsidiaries
The Company has investment in 6 subsidiaries in which 5 companies were registered in
Thailand and 1 company was registred in the Republic of China. The detail of investment as of 30
June 2012 was as follows;

Companies % Shareholding Registered Capital
(mil. Bt.)
Investment
in cost method
(mil. Bt.)
VGI Advertising Media Company Limited 100.00 10.00 10.00
VGI Multi-Tech International Company Limited 100.00 22.50 22.50
888 Media Company Limited 100.00 20.00 20.00
999 Media Company Limited 100.00 7.50 3.00
Point of View (POV) Media Group Company Limited 100.00 40.00 90.00
VGI Advertising China Company Limited 100.00 44.431
(USD 1.4 million)
44.431
(USD 1.4 million)
Total 144.43 189.93
Note 1rate USD 1 = 31.74 Baht
(1.3) Equipment-net
Item
(Unit : Baht)
Fiscal year
ended 31 March
3-month
ended 30 June
2010 2011 2012 2011 2012
Begining 240.67 284.46 253.69 253.69 227.86
Additional asset in the period 126.03 59.72 73.26 7.98 24.40
Sales of asset in the period (0.85) (19.36) (8.46) (2.83) (1.20)
Equipment value before depreciations 365.85 324.82 318.49 258.84 251.06
Depreciation in the period (81.39) (71.15) (90.78) (20.67) (23.51)
differences 0.00 0.02 0.16 0.03 0.22
Net book value 284.46 253.69 227.86 238.20 227.77
A pproximately 80% of total euipment of the Company was used in advertising media operation,
for example static banners, and digital mornitors with the useful life of 3-5 years. As of 30 June 2012,
the Company and its subsidiaries had equipment (net) of 227.77 million Baht, decreased from 227.86
million Baht, 253.69 million Baht, and 284.46 million Baht as of 31 March 2012, 2011, and 2010
respectively. A decrease in equipment (net) was mainly due to the investment in the equipment during
the period was less than the depreciation cost during the period. Except in the quarter ended 30 June
2012 that the Company and its subsidiaries invested in the equipment valued relatively equivalent to
the value of the depreciation cost occurred during the period. For the fiscal year ended 31 March
2010, 2011, and 2012, the Company invested in fixed assets amount of 126.03 million Baht, 59.72

million Baht, and 73.26 million Baht respectively. The depreciation cost during the same periods was
mostly the depreciation of digital mornitors of 81.39 million Baht, 71.15 million Baht, and 90.78 million
Baht respectively. Although the Company and its subsidiaries have additional right for advertising
media on Sales Floor in Modern Trades, the investment value in equipments, frames, and banners was
not relatively high since most of the equipments used on Sales Floor were considered as consumables.
(2) Capital structure
(2.1) Total liabilities
As of 30 June 2012, 31 march 2012, 2011, and 2010, the Company and its subsidiaries had
total liabilities of 1,003.04 million Baht, 1,020.75 million Baht, 883.45 million Baht, and 818.17 million
Baht respectively. An increase in the liabilities during the past 3 years was mainly from an increase in
trade accounts payable, especially the the license fee payable as specified in the License to Manage
Marketing Services in BTS Skytrain System between the Company and BTSC.
The majority of the Company’s debt is current liabilities, leading by trade accounts payable
which related to the license fee for the right to manage advertising media and accrued expenses.

As of 31 March 2010 As of 31 March 2011 As of 31 March 2012
As of 30 June 2011 As of 30 June 2011
Current Liabilities Non-Current Liabilities
2.1.1) Trade Account payable
Item
million Baht % to Total value of Trade account payable
Fiscal year
ended 31 March
3-month
ended 30 June
Fiscal year
ended 31 March
3-month
ended 30 June
2010 2011 2012 2011 2012 2010 2011 2012 2011 2012
Trade Account payable –
Others 42.97 56.03 43.75 48.99 57.05 11.02 13.30 9.40 8.98 12.09
Trade Account payable -
Related parties 347.03 365.25 421.92 496.54 414.67 88.98 86.70 90.60 91.02 87.91
Total 390.00 421.28 465.67 545.53 471.72 100.00 100.00 100.00 100.00 100.00

The Company and its subsidiaries had trade accounts payable as of 31 March 2010, 2011,
2012, and 30 June 2011 and 2012 of 390.00 million Baht 421.28 million Baht 465.67 million Baht,
and 471.72 million Baht respectively. Major trade accounts payable are premises owners where the
advertising media are installed and the Company has to pay the license fees as specified in the
agreement.
The other major trade accounts payable are modern trade companies who granted the
Company and its subsidiaries the right to manage advertising media in Modern Trade, and
advertisement producer. Approximately 90% of the accounts payable of the Company and its
subsidiaries is trade accounts payable-related parties from BTSC who granted the license to manage
advertising media and merchandising space in BTS Skytrain System to the Company. The proportion
of accounts payable-related parties to total accounts payable was relatively high because (1) the
proportion of revenue from managing advertisement and merchandising space in BTS Skytrain system
per total revenue was high at the percentage of approximately 78.18%, 66.18%, 57.02% , and 47.06%
of total revenue. For the fiscal year ended 31 March 2010, 2011, 2012, and 30 June 2012 respectively,
and (2) credit term for trade accounts payable-related parties was longer than the credit term for other
parties. According to the license fee payment as specified in the License to Manage Marketing
Services in BTS Skytrain System, the annual payment for BTSC (stated in the previous agreement) was
the 3 installments payment per year whereas the payment for trade accounts payable of the modern
trade customers was monthly or quarterly, and for trade accounts payble of advertisement producer
was 1-2 months. For advertisement producer, the Company needs times for quality control after
installation of advertisements prior to the payment. However, the new License to Manage Marketing
Services in BTS Skytrain System specified the license fee (exclude VAT) at 5% of total annual revenue
started from 18 May 2012 to 17 May 2017, and at 10-20% from 18 May 2017 onward, while the
previous license set the license fee at 50% (include VAT) of total annual revenue. Moreover the
payment term for the new license is quarterly payment. As a result, the trade account payable-related
parties tends to continuously decreased,as shown in the recent trade account payable-related parties
which decreased from 496.54 million Baht in the quarter ended 2011 to 414.67 million Baht in the
quarter ended 30 June 2012.
However, other trade accounts payable increased from the license fee to advertising media in
modern trades as the Company and its subsidiaries were continuously granted additional agreements.
As of 31 March 2010, 2011, 2012, and 30 June 2012, the Company and its subsidiaries had other
trade accounts payable of 42.97 million Baht, 56.03 million Baht, 43.75 million Baht, and 57.05
million Baht respectively.

2.1.2) Accrued expenses
The Company and its subsidiaries had accrued expenses as of 31 March 2010, 2011, 2012,
and 30 June 2012 of 320.33 million Baht, 315.04 million B,aht 340.18 million Baht, and 278.07 million
Baht respectively. The major accrued expense, which was 30-50% of total accrued expenses, was
property tax payable to Bangkok Metropolitant Authority (BMA). As of 30 June 2012, the property tax
payable was 93.11 million Baht in which 64.77 million Baht of that amount was accrued for more than 5
years as it is still in the appeal court process by BMA. However, the Company has already booked full
amount of the accrued expense. Thus, the result of the court case will not have any effect to the
Company’s operating result.
Summary of the Property tax accrued expense from 2000 – 2012
Item Year
Property tax account payable
As of 30 June 2012
( million Baht )
Property tax accrued expense under court consideration by BMA 2000 - 2003 64.771
Property tax accrued expense – not yet due 2011 11.39
Property accrued expense – not yet due 2012 16.95
Total Property tax account payable 93.11
Note 1 the Company booked the Property tax account payable in the financial statement amount of 64.77 million Baht which
is higher than the amount that BMA appealed to the court, amounting 61.04 million Baht because it includes possible
penalty which may occur during the appeal period.
Apart from the property tax accrued expense, the Company has other accrued expense
coveringan accrued expenses for license fee to business partner, accrued expenses for sales
promotional to agency customers, and accrued expence for employees, which accounted for 29.91%,
19.57%, and 12.03% of total accrued expenses.
2.1.3) Loan and Financial L,eases
The majority of capital of the Company was from the equity and cashflow from operation which
was sufficient for the business operation. Therefore, as of 31 March 2010, 2011, 2012, and 30 June
2012, the Company and its subsidiaries did not have either short-term or long-term debt from financial
institutions, only liabilities from financial lease for hire purchase for business operation of 0.65 million
Baht as of 31 March 2010, and 0.41 million Baht as of 31 March 2011. However, all hire purchase
contracts are operating leases, therefore, as of 30 June 2012, the Company did not have any liabilities
for financial leases.
2.1.4) Obligation for employee benefits
From 1 April 2011 onward, the Company and its subsidiaries had adobted TAS 19 outlining the
accounting requirements for employee benefit. Under the new standard, the Company had obligation
to provide pension benefit for employee on retirement under Labour Laws applicable in Thailand and
the Company’s employment policy. The Company defines the commutation as employee’s benefit
plan which the Company recognized the transaction when it incurs. The obligation under the defined
benefit plan is determined by a professional and qualified independent actuary based on actuarial
techniques, using the projected unit credit method. Such determination was made based on various
assumptions, including discount rate, future salary increase rate, staff turnover rate, mortality rate, and
inflation rates.
The Group has booked forward retained earnings adjustment as of 1 April 2011 for the first time
adoption of this accounting standard by using the retained earnings as of 31 March 2011 of 282.28
million Baht, deducted by the employee benefit obligation of 13.30 million Baht. As a result, the
retained earnings as of 1 April 2011 was 268.98 million Baht which complied with the options for the
first-time practise set by TAS. For the fiscal year ended 31 March 2012, and the quarter ended 30
June 2012, the Company and its subsidiaries recognized the employee benefits of 2.54 million Baht,
and 0.69 million Baht. As a result, the liabilities of employee benefit obligations increased to 15.84
million Baht and 16.53 million Baht respectively.
(2.2) Shareholders’ equity
As of 31 March 2012, Shareholders’ equity was 293.14 million Baht in which decreased from
413.73 million Baht as of 31 March 2011, and from 453.18 million Baht as of 31 March 2010. A
decrease in shareholders’ equity was mainly due to the dividend payment from net profit and from
retained earning of 200.00 million Baht, or 116.03% of net profit, at the fiscal year ended 31 March
2011, and 400.00 million Baht, or 143.63% of net profit, for the fiscal year ended 31 March 2012.
Shareholders’ equity as of 30 June 2012 increased to 547.39 million Baht ,mainly from an increase in
the Company’s capital from 100.00 million Baht to 274.00 million Baht in May 2012, and an increase
in net profit in the quarter ended 30 June 2012 to 159.89 million Baht from 80.35 million Baht in the
quarter ended 30 June 2011.

Item
million Baht % of net profit
fiscal year
ended 31 March
3-month
ended 30 June
fiscal year
ended 31 March
3-month
ended 30 June
2010 2011 2012 2011 2012 2010 2011 2012 2011 2012
Dividend payment - 200.00 400.00 - 80.00 - 116.031
143.651
- 50.03
Note 1 the dividend payment for the fiscal year ended 31 March 2011 and 31 March 2012, which were more than 100% of net profit, were paid from net profit and
retained earnings of the periods.
(3) Liquidity and important Financial ratio
(3.1) Cash flows
Item
(Unit: million Baht )
Fiscal year
ended 31 March
3-month
ended 30 June
2010 2011 2012 2011 2012
Cash flows from Operating activities before
changing in operating assets and liabilities 251.95 351.83 537.85 143.72 238.48
changing in operating assets and liabilities (32.88) (173.44) (195.27) 46.75 293.19
Net cash received from (used in) operating
activities 219.07 178.39 342.58 96.97 (54.71)
Net cash received from (used in) investing
activities 299.60 (50.32) (59.33) (3.88) (12.08)
Net cash received from (used in) financing (1.46) (200.24) (400.41) (0.06) 94.00
Translation of financial statement differences 0.00 (0.78) 0.82 0.53 0.14
Cash and cash equivalents at end period 570.55 497.60 381.25 591.15 408.61
The Company’s Cash flows from operating activities before changing in operating assets and
liabilities increased annually from 251.95 million Baht to 351.83 million Baht, and 537.85 million Baht
for the fiscal year ended 31 March 2010, 2011, and 2012 respectively , and 143.72 million Baht and
238.48 million Baht in the quarter ended 30 June 2011, and 2012 respectively. An increasein the cash
flows was in accordance with an increase in revenue from the business expansion during the past 3
years. However, the advance license fee paid for the right of managing additional advertising space in
a modern trade in the fiscal year 2011 of 55.00 million Baht, the payment for accrued property tax of
43.30 million Baht, and accrued employees’ bonus of 19.02 million Baht for the quarter ended 30 June
2012, resulted in the reduction in cash flows for the fiscal year ended 31 March 2011, and for the
quarter ended 30 June 2012, while the cash flows from operating activities before changing in
operating assets and liabilities increased from the same period in the previous year.

The Company had net cash from investing activities amount of 299.60 million Baht for the fiscal
year ended 31 March 2010 from cash received from full loan repayment from directors and related
parties of 440.19 million Baht, and cash used in investing in advertising media equipments of 138.78
million Baht. Net cash used in investing activities was 50.32 million Baht, and 59.33 million Baht for the
fiscal year ended 31 March 2011, and 2012 respectively, and 3.88 million Baht and 12.08 million Baht
for the quarter ended 30 June 2011, and 2012 respectively. The investments aligned with normal
business operations which required an investment in advertising media such as digital mornitors, for
example.
Net cash used in financing activities of the Company and its subsidiaries was 1.46 million Baht,
200.24 million Baht, and 400.41 million Baht for the fiscal year ended 31 March 2010, 2011, and 2012
respectively, and 0.06 million Baht, and 94.00 million Baht for the quarter ended 30 June 2011, 2012.
The spendings were mainly for dividend payments which detail are as follows;
Fiscal year Date of dividend payment amount
(unit: million Baht )
Ended 31 March 2011 11 August 2010 125.00
(1 April 2010 to 31 March 2011 ) 11 February 2011 75.00
Total 200.00
Ended 31 March 2012 21 July 2011 250.00
(1 April 2011 to 31 March 2012 ) 31 January 2012 150.00
Total 400.00
3-month period ended 30 June 2012 10 May 2012 80.00 1
(1 April 2012 to 30 June 2012 ) Total 80.00
Note 1 the dividend payment amount of 80 million Baht paid in 3-month period ended 30 June 2012 was from the operating
profit in the fiscal ended 31 March 2012
Apart from the dividend payment for the quarter ended 30 June 2012 of 80.00 million Baht, the
Company had another financing activity, resulting in an increase in capital of 174.00 million Baht. As a
result, the net cash from financing activities in the quarter ended 30 June 2012 was 94.00 million Baht.
Therefore, cash and cash equivalence of the Company and its subsidiaries as of 31 March
2010, 2011, and 2012 was 570.55 million Baht, 497.60 million Baht, and 381.25 million Baht
respectively, and as of 30 June 2011, and 2012 was 591.15 million Baht and 408.61 million Baht
respectively.
(3.2) Liquidity Ratio
Liquidity Ratio of the Company and its subsidiaries was 1.08 times, 1.09 times, and 0.96 times
as of 31 March 2010, 2011, and 2012 respectively. It was 1.18 times, and 1.23 times as of 30 June
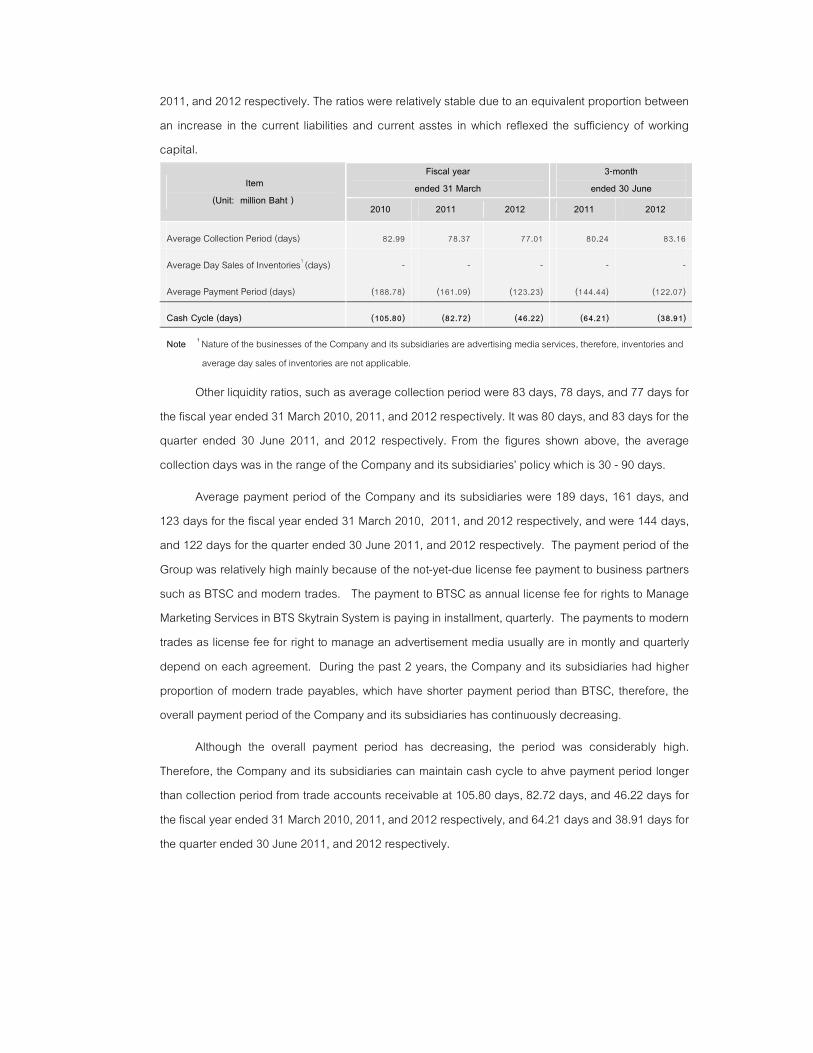
2011, and 2012 respectively. The ratios were relatively stable due to an equivalent proportion between
an increase in the current liabilities and current asstes in which reflexed the sufficiency of working
capital.
Item
(Unit: million Baht )
Fiscal year
ended 31 March
3-month
ended 30 June
2010 2011 2012 2011 2012
Average Collection Period (days) 82.99 78.37 77.01 80.24 83.16
Average Day Sales of Inventories1 (days)
- - - - -
Average Payment Period (days) (188.78) (161.09) (123.23) (144.44) (122.07)
Cash Cycle (days) (105.80) (82.72) (46.22) (64.21) (38.91)
Note 1
Nature of the businesses of the Company and its subsidiaries are advertising media services, therefore, inventories and
average day sales of inventories are not applicable.
Other liquidity ratios, such as average collection period were 83 days, 78 days, and 77 days for
the fiscal year ended 31 March 2010, 2011, and 2012 respectively. It was 80 days, and 83 days for the
quarter ended 30 June 2011, and 2012 respectively. From the figures shown above, the average
collection days was in the range of the Company and its subsidiaries’ policy which is 30 - 90 days.
Average payment period of the Company and its subsidiaries were 189 days, 161 days, and
123 days for the fiscal year ended 31 March 2010, 2011, and 2012 respectively, and were 144 days,
and 122 days for the quarter ended 30 June 2011, and 2012 respectively. The payment period of the
Group was relatively high mainly because of the not-yet-due license fee payment to business partners
such as BTSC and modern trades. The payment to BTSC as annual license fee for rights to Manage
Marketing Services in BTS Skytrain System is paying in installment, quarterly. The payments to modern
trades as license fee for right to manage an advertisement media usually are in montly and quarterly
depend on each agreement. During the past 2 years, the Company and its subsidiaries had higher
proportion of modern trade payables, which have shorter payment period than BTSC, therefore, the
overall payment period of the Company and its subsidiaries has continuously decreasing.
Although the overall payment period has decreasing, the period was considerably high.
Therefore, the Company and its subsidiaries can maintain cash cycle to ahve payment period longer
than collection period from trade accounts receivable at 105.80 days, 82.72 days, and 46.22 days for
the fiscal year ended 31 March 2010, 2011, and 2012 respectively, and 64.21 days and 38.91 days for
the quarter ended 30 June 2011, and 2012 respectively.

(3.3) other important ratios
Item
(Unit: million Baht )
Fiscal year
ended 31 March
3-month
ended 30 June
2010 2011 2012 2011 2012
Growth of Total Revenue (%) 16.35 24.16 41.98 n/a 36.32
Growth of Net Profit (%)
38.33 72.53 61.55 n/a 99.00
Return on Asset (%) 7.86 13.42 21.33 22.91 44.66
Return on Fixed Asset (%) 64.46 96.04 155.18 168.14 322.02
Return on Equity (%) 22.04 39.77 78.78 70.76 152.18
Debt per Equity (times) 1.81 2.14 3.48 2.05 1.83
Dividend Payment (%) - 116.03 143.65 - 50.03
Return on asset continuously increased from 7.86% for the fiscal year ended 31 March 2010 to
13.42% and 21.33% for the fiscal year ended 31 March 2011, and 2012 respectively, and increased
from 22.91% for the quarter ended 30 June 2011 to 44.66% for the quarter ended 30 June 2012.
Return on fixed asset increased from 64.46% for the fiscal year ended 31 March 2010 to 96.04% and
155.18% for the fiscal year ended 31 March 2011, and 2012 respectively, and increased from 168.14%
for the quarter ended 30 June 2011 to 322.02% for the quarter ended 30 June 2012. The high return
on asset, and on fixed asset of the Company and its subsidiaries was mainly due to the nature of
business which has low investment in non-current assets. Moreover, the Company did not plan to
invest in new digital mornitors which are primary assets with 3-5 years useful life. Apart from that, a
continous increase in total revenue and net profit of the Company and its subsidiaries had driven the
utilization of the assets to be more efficient. As a result, the return on asset and fixed asset increased
continuously as an increase in total assets was less than an increase in revenues and net profits.
Return on equity has continuously increased from 22.04% for the fiscal year ended 31 March
2010 to 39.77%, and 78.78% for the fiscal year ended 31 March 2011, and 2012 respectively, and
increased from 70.76% for the quarter ended 30 June 2011 to 152.18% for the quarter ended 30 June
2012. An increase was mainly from a significant increase in net profit during the period from 99.90
million Baht for the fiscal year ended 31 March 2010 to 172.37 million Baht, and to 278.45 million Baht
for the fiscal year ended 31 March 2011, and 2012 respectively, or 72.53% and 61.55% year on year
respectively. Also, the net profit increased from 80.35 million Baht for the quarter ended 30 June 2011
to 159.89 million Baht for the quarter ended 30 June 2012 or 99.00% increased year on year. The
other reason of an increase in return on equity during the past 3 years was from the dividend payment
for fiscal year ended 31 March 2011, and 2012. During the two years, the Company paid dividend of

200.00 million Baht and 400.00 million Baht respectively, resulting in a decreases in the shareholders’
equity.
Debt to equity ratio of the Company as of 31 March 2012 was 3.48 times, increased from 2.14
times and 1.81 times as of 31 March 2011, and 2010 respectively. An increase in debt to Equity ratio
during the past 2 years was from a decrease in the dividend payment as described above, and an
increase in the trade accounts payable was driven by an increase in revenues. The debt to equity ratio
as of 30 June 2012 was 1.83 times, decreased from 2.05 times as of 30 June 2011. A decrease in debt
to equity ratio was mainly due to an increase in equity by an increasing registered capital from 100.00
million Baht to 274.00 million Baht for the quarter ended 30 June 2012, and by an increase in net profit
from 80.35 million Baht for the quarter ended 30 June 2011 to 159.89 million Baht for the quarter ended
30 June 2012. Interest bearing debt to equity was 0.14% , 0.10% , and 0.00% as of 31 March 2010,
2011, and 2012 respectively. It was 0.07% and 0.00% as of 30 June 2011 and 2012 respectively,
because the Company did not have loan from financial institutions, it had only financial lease which
was not a significant portion.
Dividend payment for the fiscal ended 31 March 2011 and 2012 was higher than the net profit,
which paid at 116.03% and 143.65% respectively as it was partly paid from retained earnings, which
was earning from the past operating performance. The dividend paid for the quarter ended 30 June
2012 was from the operating result for the fiscal ended 31 March 2012 which accounted for 50.03% of
the net profit of the period. In the future, the Company had the dividend policy to pay dividend not less
than 50% of the net profit.
Related Documents