newfoundiand labrador ~ ~ a nalcor energy company December 13, 2018 The Board of Commissioners of Public Utilities Prince Charles Building 120 Torbay Road, PO Box 21040 St. John's, NL A1A 5B2 Attention: Ms. Cheryl Blundon Director of Corporate Services and Board Secretary Dear Ms. Blundon: Hydro Place. 500 Columbus Drive. P .O. Box 12400. St. john's. Nt Canada A1B 4K7 t . 709.737.1400 f. 709.737.1800 w ww.nEh.nl.ca Re: The Board's Investigation and Hearing into Supply Issues and Power Outages on the Island Interconnected System —Operational Studies —Stage 4 Reports F urther to Newfoundland and Labrador Hydro's correspondence of August 4, 2017, please find attached an original and twelve copies of the following reports: • TransGrid Solutions, "Stage 4A LIL Bipole: Preliminary Assessment of High Power O peration," November 21, 2018; and ~ TransGrid Solutions, "Stage 4B: Power System Stabilizer Design," November 8, 2018. " Stage 4C: Labrador Transfer Analysis" and "Stage 4D: High Power Operational Limits" will be f iled in the first quarter of 2019. Should you have any questions, please contact the undersigned. Yours truly, NEWFOUNDLAND AND LABRADOR HYDRO ~ „~~ Shirley A. Walsh Senior Regulatory Counsel SAW/sk E ncl. cc: Gerard Hayes —Newfoundland Power Dennis Brown, Q.C. —Browne Fitzgerald Morgan &Avis Paul Coxworthy—Stewart McKelvey Danny Dumaresque ecc: Denis Fleming —Cox &Palmer Larry Bartlett —Teck Resources Limited Roberta Frampton Benefiel —Grand Riverkeeper° Lab

Welcome message from author
This document is posted to help you gain knowledge. Please leave a comment to let me know what you think about it! Share it to your friends and learn new things together.
Transcript
newfoundiand labrador
~~
a nalcor energy company
December 13, 2018
The Board of Commissioners of Public Utilities
Prince Charles Building
120 Torbay Road, PO Box 21040
St. John's, NL A1A 5B2
Attention: Ms. Cheryl Blundon
Director of Corporate Services and Board Secretary
Dear Ms. Blundon:
Hydro Place. 500 Columbus Drive.
P.O. Box 12400. St. john's. NtCanada A1B 4K7
t. 709.737.1400 f. 709.737.1800
www.nEh.nl.ca
Re: The Board's Investigation and Hearing into Supply Issues and Power Outages on the
Island Interconnected System —Operational Studies —Stage 4 Reports
Further to Newfoundland and Labrador Hydro's correspondence of August 4, 2017, please find
attached an original and twelve copies of the following reports:
• TransGrid Solutions, "Stage 4A LIL Bipole: Preliminary Assessment of High Power
Operation," November 21, 2018; and
~ TransGrid Solutions, "Stage 4B: Power System Stabilizer Design," November 8, 2018.
"Stage 4C: Labrador Transfer Analysis" and "Stage 4D: High Power Operational Limits" will be
filed in the first quarter of 2019.
Should you have any questions, please contact the undersigned.
Yours truly,
NEWFOUNDLAND AND LABRADOR HYDRO
~„~~
Shirley A. Walsh
Senior Regulatory CounselSAW/sk
Encl.
cc: Gerard Hayes —Newfoundland Power Dennis Brown, Q.C. —Browne Fitzgerald Morgan &AvisPaul Coxworthy—Stewart McKelvey Danny Dumaresque
ecc: Denis Fleming —Cox &Palmer Larry Bartlett —Teck Resources Limited
Roberta Frampton Benefiel —Grand Riverkeeper° Lab


Engineering Support Services for: RFI Studies Newfoundland and Labrador Hydro
Attention: Mr. Rob Collett
Stage 4A LIL Bipole: Preliminary Assessment of High Power Operation
Technical Note: TN1205.62.05 Date of issue: November 21, 2018 Prepared By: TransGrid Solutions Inc. 100-78 Innovation Dr. Winnipeg, MB R3T 6C2 CANADA

Newfoundland and Labrador Hydro RFI Studies
Stage 4A LIL Bipole: Preliminary Assessment of High Power Operation
©TransGrid Solutions Inc., 2018 i | P a g e Technical Note: TN1205.62.05, November 21, 2018
Disclaimer This technical note was prepared by TransGrid Solutions Inc. (“TGS”), whose responsibility is limited to
the scope of work as shown herein. TGS disclaims responsibility for the work of others incorporated or
referenced herein. This technical note has been prepared exclusively for Newfoundland and Labrador
Hydro and the project identified herein and must not be reused or modified without the prior written
authorization of TGS.
Revisions Project Name: RFI Studies
Document Title: Stage 4A LIL Bipole: Preliminary Assessment of High Power Operation
Document Type: Technical Note
Document No.: TN1205.62.05
Last Action Date: November 21, 2018
Rev.
No.
Status Prepared By Checked By Date Comments
00 DFC R. Ostash May 14, 2018 Preliminary draft Issued for
review by Hydro
01 DFC R. Ostash June 20, 2018 Draft updated based on
comments received from
Hydro on May 25, 2018
02 IFC R. Ostash June 25, 2018 Updated based on comments
received on June 25, 2018.
Issued for further comments
from Hydro.
03 IFC R. Ostash August 17, 2018 Updated based on comments
received from Hydro and
combined with UFLS study
report.
04 IFA R. Ostash Sept. 13, 2018 Updated based on comments
received from Hydro on
August 30, 2018.
05 ABC R. Ostash Nov. 21, 2018 Updated based on final
comments received from
Hydro on November 19,
2018.

Newfoundland and Labrador Hydro RFI Studies
Stage 4A LIL Bipole: Preliminary Assessment of High Power Operation
©TransGrid Solutions Inc., 2018 ii | P a g e Technical Note: TN1205.62.05, November 21, 2018
Legend of Document Status:
Approved by Client ABC Issued for Approval IFA
Draft for Comments DFC Issued for Information IFI
Issued for Comments IFC Returned for Correction RFC

Newfoundland and Labrador Hydro RFI Studies
Stage 4A LIL Bipole: Preliminary Assessment of High Power Operation
©TransGrid Solutions Inc., 2018 iii | P a g e Technical Note: TN1205.62.05, November 21, 2018
Table of Contents 1. Executive Summary ...................................................................................................................... 1
1.1 Introduction .................................................................................................................................. 1
1.2 Conclusions ................................................................................................................................... 3
1.3 Loss of the ML Bipole or Pole ........................................................................................................ 6
2. Study Models and Criteria ............................................................................................................ 7
2.1 Interconnected Island System ....................................................................................................... 7
2.2 LIL .................................................................................................................................................. 7
2.3 Study Criteria ................................................................................................................................ 8
2.4 Contingencies ................................................................................................................................ 8
2.5 PSSE Base Cases ............................................................................................................................ 9
3. Review of Three‐Phase Faults ..................................................................................................... 10
3.1 Considering a 3PF at BDE ............................................................................................................ 10
3.2 Relaxed Consideration of a 3PF at BDE ....................................................................................... 16
4. Loss of Largest Generator in IIS ................................................................................................... 19
4.1 LIL in‐service ................................................................................................................................ 19
4.2 LIL out‐of‐service ......................................................................................................................... 19
5. Loss of a LIL Pole ......................................................................................................................... 21
5.1 During ML Export ........................................................................................................................ 21
5.2 During ML Import ........................................................................................................................ 22
6. Loss of an ML Pole ...................................................................................................................... 23
6.1 During ML Export ........................................................................................................................ 23
6.2 During ML Import ........................................................................................................................ 23
7. Loss of the LIL Bipole .................................................................................................................. 25
7.1 Permanent Loss of the LIL Bipole ................................................................................................ 25
7.2 LIL Temporary Bipole Outage ...................................................................................................... 29
8. Loss of the ML Bipole ................................................................................................................. 35
8.1 During ML Export ........................................................................................................................ 35
8.2 During ML Import ........................................................................................................................ 35
9. Conclusions ................................................................................................................................ 37
9.1 Conclusions ................................................................................................................................. 37
9.2 Summary of Technical Issues ...................................................................................................... 40
9.3 Next Steps ................................................................................................................................... 42

Newfoundland and Labrador Hydro RFI Studies
Stage 4A LIL Bipole: Preliminary Assessment of High Power Operation
©TransGrid Solutions Inc., 2018 iv | P a g e Technical Note: TN1205.62.05, November 21, 2018
Appendices Appendix 1 – Revised UFLS Scheme
List of Figures Figure 1‐1. LIL Transfer limits vs. Island Generation Blue: ML at 157 MW export Orange: ML at 0 MW .... 5
Figure 2‐1. Interconnected Island System 230 kV grid ................................................................................. 7
Figure 3‐1. 3PF BDE on TL267, Peak load, 840 MW flow eastward out of BDE .......................................... 11
Figure 3‐2. 3PF at BDE on TL267, Intermediate load, 590 MW flow eastward out of BDE ........................ 12
Figure 3‐3. 3PF at BDE on TL267, Intermediate load, 458 MW flow eastward out of BDE ........................ 16
Figure 3‐4. 3PF at BDE on TL267, Island demand 1225 MW, LIL out of service ......................................... 17
Figure 7‐1. LIL Transfer limits vs. Island Generation Blue: ML @ 157 MW export Orange: ML @ 0 MW .. 27
Figure 7‐2. Loss of LIL Bipole (Case HP26 with HRD GT on) ........................................................................ 28
Figure 7‐3. Temporary Loss of LIL Bipole (Case HP27), restart in 300 ms, 59 Hz (no UFLS) ....................... 31
Figure 7‐4. Temporary Loss of LIL Bipole (Case HP27), restart in 1 second ................................................ 33
Figure 7‐5. Temporary Loss of LIL Bipole (Case HP27), restart in 1 second, no LIL frequency controller .. 34
Figure 9‐1. LIL Transfer limits vs. Island Generation Blue: ML @ 157 MW export Orange: ML @ 0 MW .. 39

Newfoundland and Labrador Hydro RFI Studies
Stage 4A LIL Bipole: Preliminary Assessment of High Power Operation
©TransGrid Solutions Inc., 2018 1 | P a g e Technical Note: TN1205.62.05, November 21, 2018
1. Executive Summary 1.1 Introduction Three previous operational studies were performed to determine the system operating limits of the
Newfoundland and Labrador Hydro (Hydro) Island Interconnected System (IIS) for the following periods
in time:
1. Stage 1: “ML Only” study1; when the Maritime Link (ML) is in‐service, but prior to the Labrador
Island Link (LIL) coming in to service. The Soldiers Pond (SOP) synchronous condensers were
assumed not to be in service.
2. Stage 2: “ML and SOP Syncs”2 study; when the Maritime Link (ML) and the Soldiers Pond (SOP)
synchronous condensers are in‐service, but prior to the Labrador Island Link (LIL) coming in to
service.
3. Stage 3: “ML, SOP Syncs and LIL Monopole”3 study; when the Maritime Link (ML), Soldiers Pond
(SOP) synchronous condensers and the LIL as a 225 MW monopole (phased approach) are in‐
service, but prior to the Muskrat Falls generating units coming in to service.
Stage 4 is the final stage of studies and includes the 900 MW LIL bipole, the Muskrat Falls (MFA)
generators, the SOP synchronous condensers and the ML. The Holyrood thermal generators, the
Stephenville Gas Turbine, and the Hardwoods Gas Turbine are no longer in‐service4. Holyrood Unit 3 is
operating as a synchronous condenser.
This report addresses technical considerations5 identified by the Liberty Consulting Group as part of
Phase 2 of the Hearing into Supply Issues and Power Outages on the Island Interconnected System.
Specifically, the report addresses the technical considerations that relate to analyses being performed as
part of Stage IV of the operational studies. These technical issues are summarized as follows:
Options (e.g. operating limits) to reduce UFLS
Re‐strikes on the LIL‐OHL
ML‐LIL interaction studies
Bay d’Espoir instability issues
ML frequency controller study
1 TN1205.50.04, “Operational Studies: Maritime Link ONLY”, TransGrid Solutions, September 8, 2017. 2 TN1205.51.03, “Operational Studies: Maritime Link & Soldiers Pond Synchronous Condensers”, TransGrid Solutions, November 10, 2017. 3 TN1205.54.03, “Operational Studies: Maritime Link, SOP Syncs and LIL Monopole”, TransGrid Solutions, May 18, 2018. 4 The Stephenville Gas Turbine and the Hardwoods Gas Turbine are scheduled to be retired in in the early 2020’s. This study considers long term operation after these units are no longer in service. 5 Second Quarterly Monitoring Report on the Integration of Power Supply Facilities to the Island Interconnected System, The Liberty Consulting Group, Section 6e, The Liberty Consulting Group, May 23, 2018.

Newfoundland and Labrador Hydro RFI Studies
Stage 4A LIL Bipole: Preliminary Assessment of High Power Operation
©TransGrid Solutions Inc., 2018 2 | P a g e Technical Note: TN1205.62.05, November 21, 2018
IIS performance with ML in and out of service
Soldiers Pond site for 4th high inertia synchronous condenser.
This report consists of the following sections to address these items.
1. Review of Three‐Phase Faults
This section includes a technical review of impacts of three‐phase faults within the eastern portion of
the Interconnected Island System (IIS) from Bay d’Espoir to Soldiers Pond6. Faults in this area,
particularly at Bay d’Espoir, are of interest since they are the most sensitive to angular instability and
voltage instability.7
2. Loss of the Largest Unit within the IIS
This section investigates loss of the largest generator within the IIS. Frequency controller coordination
and LIL operating limits are investigated to ensure that the IIS frequency stays above the 59 Hz in
accordance with Transmission Planning Criteria to avoid customer load interruptions.
3. Loss of a LIL Pole
This section reviews the coordination of frequency controllers, HVdc runbacks and spinning reserves to
ensure that the IIS frequency stays above the 59 Hz limit of the Transmission Planning Criteria. LIL
operating limits are defined for situations when the ML frequency controller is out of service.
4. Loss of the LIL Bipole
This section determines the modifications required to the present‐day UFLS scheme to ensure that the
system frequency remains above the 58 Hz limit of the Transmission Planning Criteria. LIL operating
limits are defined for various IIS operating conditions.
5. Review of Temporary Bipole Outages
This section reviews the impacts of a temporary LIL bipole outage. Analysis is performed to assess the
maximum duration of a LIL bipole outage with a restart that can occur while meeting the 59 Hz criteria
and avoiding UFLS. Analysis is also performed to determine the maximum duration of a LIL bipole outage
with a restart to ensure the system frequency remains above the 58 Hz limit, as pecified in Transmission
Planning Criteria. This section addresses re‐strikes on the LIL‐OHL.
6. Loss of the ML Bipole or Pole
This section reviews loss of the ML bipole and loss of an ML pole when operating at the 500 MW export
limit and the 325 MW import8 limit to ensure the Transmission Planning Criteria are met for
overfrequency and underfrequency response.
6 A complete review of the steady state and transient stability performance of the IIS and the Labrador Transmission System will be performed as part of upcoming analyses to be performed Stage IV operational studies. 7 Upgrade the Transmission Line Corridor from Bay d’Espoir to Western Avalon, Hydro, April 28, 2014 8 Limit as per Summary of Maritime Link Transfer Capability, Maine & Atlantic Technical Planning Committee, NBP/NLH/NSPI Reserve Study Working Group, April. 2017

Newfoundland and Labrador Hydro RFI Studies
Stage 4A LIL Bipole: Preliminary Assessment of High Power Operation
©TransGrid Solutions Inc., 2018 3 | P a g e Technical Note: TN1205.62.05, November 21, 2018
1.2 Conclusions The results of the analysis are summarized in the sections below.
1.2.1 Three-Phase Faults near SOP, BDE and the Avalon Peninsula The analysis included a review of three‐phase faults on the 230 kV lines between Bay d’Espoir (BDE) and
SOP. It was found that instability resulting from such faults is a function of power flow in this corridor.
Preliminary analysis was performed to assess transfer limits, which will be confirmed during the final
Stage 4 operational studies9. Preliminary results related to the ability to serve Island demand are
discussed below for situations when the LIL is in‐service and when the LIL is out‐of‐service.
1) LIL in‐service
The preliminary analysis indicates that flow in the BDE to Avalon Peninsula corridor can be restricted to
avoid instability from the three‐phase faults listed above without impacting the capacity of the
transmission system to meet forecasted peak loads and ML export commitments10 when the LIL is in‐
service as a bipole or as a monopole.
2) LIL out‐of‐service
If the LIL is out‐of‐service, peak Island demand cannot be served. With the LIL out of service, the
maximum Island demand that can be served is around 1200 MW if the 3PF at BDE is considered. As
noted below, the limitation of power flow from BDE to the Avalon Peninsula is also required to ensure
system stability in the event of a loss of the LIL bipole.
In order to be capable of serving higher Island demand without a stability issue under a three‐phase
fault scenario on TL202, TL206 or TL267 with the LIL out of service, it is likely that either new generation
would be required on the Avalon peninsula, that dynamic reactive power support would be required
near Sunnyside, or that new AC transmission eastward out of BDE would be needed in order to transfer
more generation from the west of the Island to the Avalon Peninsula.
1.2.2 Loss of Largest Unit with the IIS After retirement of the Holyrood generating units, BDE Unit 7 at 154.4 MW is the largest generator on
the Island. Frequency should remain above 59 Hz for loss of BDE Unit 7 to avoid UFLS.
Table 1‐1 summarizes the LIL reserve requirements to ensure that loss of the largest generator meets
the 59 Hz criteria to avoid UFLS.
Table 1-1. LIL reserve requirements for loss of largest generator ML Frequency Controller Reserve required on LIL
In‐service None
Out‐of‐service 54 MW to 130 MW, depending on system conditions
9 Stage 4 studies include a review of the underfrequency load shedding schemes, HVdc runback coordination and frequency controller settings, spinning reserve requirements, and the application of power system stabilizers. Operating limits will be investigated after these other system considerations have been studied. 10 ML export commitments of 157 MW are assumed to represent the Emera Export Block.

Newfoundland and Labrador Hydro RFI Studies
Stage 4A LIL Bipole: Preliminary Assessment of High Power Operation
©TransGrid Solutions Inc., 2018 4 | P a g e Technical Note: TN1205.62.05, November 21, 2018
1.2.3 Loss of a LIL Pole Similar to loss of the largest generator, frequency should remain above 59 Hz for loss of a LIL pole and
UFLS should be avoided.
If one of the LIL poles is lost, the remaining pole has an overload rating of 2.0 pu for 10 minutes, after
which the rating drops down to a 1.5 pu continuous rating. The reduction in delivered power at SOP
following the transition to monopole operation depends on how much power the LIL was transferring
prior to loss of the pole. In a worst case, if operating at 900 MW, this study showed that prior to
converter transformer tap‐changer action and due to increased DC line losses associated with the
resistance of the line electrode, the remaining pole is only able to provide 633 MW at Soldiers Pond, as
opposed to the 830 MW it was providing pre‐contingency, resulting in the net loss of 267 MW to the IIS.
Operating restrictions to keep the IIS frequency above 59 Hz for loss of a LIL pole are summarized in
Table 1‐2.
Table 1-2. Operating restrictions to ensure loss of LIL pole meets 59 Hz criteria During ML Export At full LIL power transfer of 900 MW, loss of a LIL pole will require the ML to be
runback in the range of 100 MW to 150 MW, depending on system conditions,
and depending on whether or not the ML frequency controller is in‐ or out‐of‐
service.
During ML
Import
If the ML import is at the maximum level of 325 MW, it cannot transiently import
more power from Nova Scotia via its frequency controller or via a runback,
therefore it cannot not help the IIS during underfrequency events. In this case,
LIL power transfer would be limited to around 400 MW to 500 MW (depending
on system conditions) to avoid UFLS..
1.2.4 Loss of the LIL Bipole Per Transmission Planning Critieria, controlled underfrequency load shedding is permitted for loss of the
LIL bipole, however, the IIS frequency shall not drop below 58 Hz. Additionally, if the ML is exporting, the
export will be runback to 0 MW if the LIL bipole trips.
In addition to running back ML export to 0 MW, modifications to the existing UFLS scheme are needed
to maintain the IIS frequency above 58 Hz for loss of the LIL bipole. Additional blocks of load were added
to the UFLS scheme, and the blocks were shifted to distribute the load shedding over a frequency range
of 58.9 Hz to 58.4 Hz.
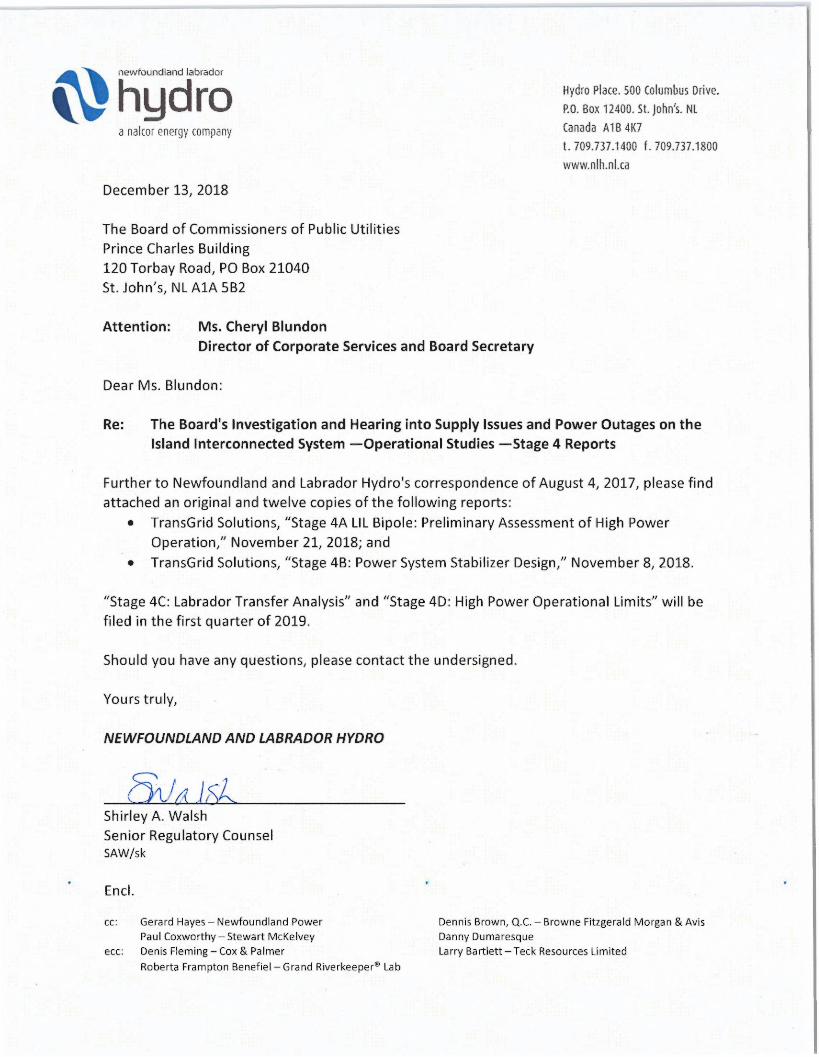
Despite the newly designed UFLS scheme, it is not possible to transfer the full 900 MW on the LIL unless
there is sufficient Island generation on‐line to provide adequate voltage and inertial support if the LIL
bipole is lost. A preliminary operating guideline is defined in Figure 1‐1, which limits LIL transfer based
on a minimum requirement for Island generation. The LIL transfer limits are defined for two scenarios:
ML is exporting firm transfer of 157 MW, and is relied upon to runback these exports to 0 MW
ML is operating at 0 MW and only frequency controller action is available
Newfoundland and Labrador Hydro RFI Studies
Stage 4A LIL Bipole: Preliminary Assessment of High Power Operation
©TransGrid Solutions Inc., 2018 5 | P a g e Technical Note: TN1205.62.05, November 21, 2018
Figure 1-1. LIL Transfer limits vs. Island Generation Blue: ML at 157 MW export Orange: ML at 0 MW
In addition to the LIL transfer limits shown in Figure 1‐1, other conclusions include:
Instability can arise in cases when there is a high power flow from BDE to the Avalon Peninsula.
Operation of the HRD GT during peak load conditions is required to prevent system instability if
the LIL bipole is lost.
The Come‐By‐Chance capacitor banks should be in‐service when the power flow eastward from
BDE towards SOP is high to help support the voltage if the LIL bipole is lost. Keeping the pre‐
contingency voltage near Sunnyside as high as possible (within criteria) improves the system
response to the worst case contingencies, including 3PF on TL202, TL206 and TL267 that were
discussed in Section 1.2.1.
1.2.5 LIL Temporary Bipole Outage According to Transmission Planning Criteria, a temporary bipole outage should not cause the IIS
frequency to drop below 59 Hz and UFLS should be avoided.
Two LIL bipole outage durations were studied under worst case system conditions11:
1) Maximum outage time to ensure IIS frequency stays above 59 Hz and UFLS is avoided
11 Case HP27 was found to be the worst case for loss of LIL bipole.

Newfoundland and Labrador Hydro RFI Studies
Stage 4A LIL Bipole: Preliminary Assessment of High Power Operation
©TransGrid Solutions Inc., 2018 6 | P a g e Technical Note: TN1205.62.05, November 21, 2018
2) Outage time by which all blocks of load will have been shed at 58.0 Hz.
Table 1‐3 summarizes these results for the worst case system conditions.
Table 1-3. Duration of LIL Bipole Outage Number of SOP
synchronous
condensers in‐service
Duration to
Avoid UFLS
Duration at which
all blocks of load
have shed
2 300 ms 680 ms
3 380 ms 780 ms
It is important to note that the LIL frequency controller must be in‐service if the LIL will be automatically
restarted after a bipole outage. This is to account for the runback of ML export to 0 MW and the
possibility that load has shed. If the LIL frequency controller is not in‐service when the LIL bipole is
automatically restarted, the ML frequency controller alone cannot maintain the IIS frequency to within
62 Hz if all blocks of load are shed.
1.3 Loss of the ML Bipole or Pole As per Tranmission Planning Criteria, the loss of an ML pole (when importing) should not result in UFLS
and frequency should remain above 59 Hz. Loss of the ML bipole is allowed to result in UFLS, however
the frequency should remain above 58 Hz.
If exporting, frequency should remain below 62 Hz for loss of an ML pole or bipole .
The results for loss of an ML pole or bipole are summarized in Table 1‐4.
Table 1-4. Summary of results for loss of ML bipole or pole ML Import/Export Loss of ML Pole Loss of ML Bipole
500 MW export Max. frequency of 60.6 Hz
(light load)
Max. frequency of 61.2 Hz
(light load)
320 MW import LIL in‐service:
min. frequency > 59 Hz
LIL out‐of‐service:
min. frequrency 58.9 Hz, with 26
MW of loadshed
LIL in‐service:
min. frequency 58.86 Hz, with 0‐76 MW
of loadshed
LIL out‐of‐service:
min frequrency 58.24 Hz, with 273‐389
MW of loadshed
Newfoundland and Labrador Hydro RFI Studies
Stage 4A LIL Bipole: Preliminary Assessment of High Power Operation
©TransGrid Solutions Inc., 2018 7 | P a g e Technical Note: TN1205.62.05, November 21, 2018
2. Study Models and Criteria The Interconnected Island System (IIS) is the area of focus for this study.
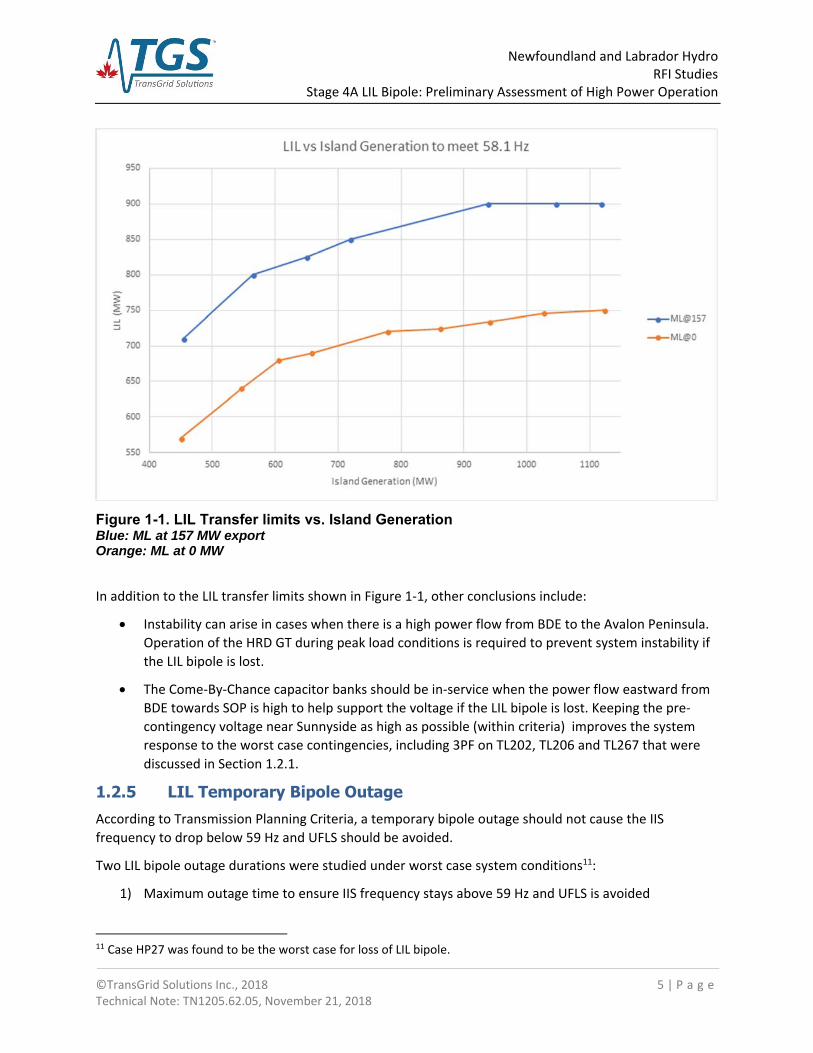
2.1 Interconnected Island System The 230 kV network of the IIS is shown in Figure 2‐1.
Figure 2-1. Interconnected Island System 230 kV grid
The system was setup as follows:
The Holyrood thermal generators are no longer available
The Hardwoods and Stephenville Gas Turbines are no longer available
Holyrood Unit 3 is operating as a synchronous condenser
Two of the three 175 MVA SOP synchronous condensers are in‐service (assuming one is out for
maintenance)
2.2 LIL The following LIL reactive power elements were available in the models:
MFA: 4x72 MVAR filters
SOP: 5x75 MVAR filters

Newfoundland and Labrador Hydro RFI Studies
Stage 4A LIL Bipole: Preliminary Assessment of High Power Operation
©TransGrid Solutions Inc., 2018 8 | P a g e Technical Note: TN1205.62.05, November 21, 2018
2.3 Study Criteria The applicable Transmission Planning Criteria for this study is summarized below:
Steady state voltage : 0.95 pu – 1.05 pu during n‐0 conditions
Steady state voltage : 0.90 pu – 1.1 pu during n‐1 conditions
Post fault recovery voltages on the ac system shall be as follows:
o Transient undervoltages following fault clearing should not drop below 70%
o The duration of the voltage below 80% following fault clearing should not exceed 20
cycles
Post fault system frequencies shall not drop below 59 Hz and shall not rise above 62 Hz
For a permanent loss of the LIL bipole, underfrequency load shedding shall be permitted, but
controlled, and the system frequency shall not drop below 58 Hz
2.4 Contingencies Table 2‐1 lists the contingencies that were considered in this study.
Table 2-1. Contingencies
Line/Generator Fault
Location (230 kV)
Description
TL217 SOP WAV
3PF cleared in 100 ms
TL203 WAV SSD
3PF cleared in 100 ms
TL202 SSD BDE
3PF cleared in 100 ms
TL267 WAV BDE
3PF cleared in 100 ms
TL268 SOP 3PF cleared in 100 ms
TL242 SOP 3PF cleared in 100 ms
SOP sync SOP 3PF cleared in 100 ms
BDE unit #7 BDE 3PF cleared in 100 ms
BDE Unit 7 BDE 3PF cleared in 100 ms
Loss of LIL pole n/a Permanent loss of LIL pole. Remaining LIL pole increases transfer to 2 pu (10 min overload rating) using ground return
Loss of ML pole n/a Permanent loss of ML pole. Remaining ML pole increases transfer power lost on faulted pole, up to its rating
Loss of LIL bipole n/a Permanent loss of LIL bipole
Loss of ML bipole n/a Permanent loss of ML bipole
Temporary loss of LIL bipole
n/a Temporary loss of LIL bipole. Test various durations and number of restart attemps.

Newfoundland and Labrador Hydro RFI Studies
Stage 4A LIL Bipole: Preliminary Assessment of High Power Operation
©TransGrid Solutions Inc., 2018 9 | P a g e Technical Note: TN1205.62.05, November 21, 2018
2.5 PSSE Base Cases Table 2‐2 lists the base cases that were used to analyze the IIS system in this study.
Table 2-2. Base cases provided by Hydro
Number Load Condition Island
Demand (MW)12
ML Import/Export (at BBK)(MW)
LIL LAB to NF Flow (at
MFA)(MW)
Island Generation
(MW)
HP1 Peak13 1824.8 157 (export) 900 (import) 1147.0
HP2 Intermediate Peak 1689.3 157 (export) 900 (import) 1012.9
HP3 Intermediate 1347.5 500 (export) 900 (import) 1012.8
HP4 Peak 1832.0 157 (export) 694 (import) 1333.6
HP5 Intermediate Peak 1717.0 157 (export) 694 (import) 1218.8
HP6 Intermediate 1374.6 500 (export) 694 (import) 1218.7
HP7 Peak 1904.6 320 (import) 294.4 (import) 1296.7
HP8 Peak 1905.2 320 (import) 337 (import) 1256.7
HP9 Intermediate 1224.4 320 (import) 0 903.6
HP10 Intermediate Peak 1756.9 104.8 (export) ~675 (import) 1302.9
HP11 Peak 1833.7 104.8 (export) ~675 (import) 1380.2
HP12 Intermediate Peak 1697.7 104.8 (export) ~675 (import) 1243.8
HP13 Peak 1812.4 158 (export) ~605 (import) 1307.3
HP14 Peak 1816.6 320 (import) ~605 (import) 833.3
HP15 Intermediate 1307.2 500 (export) ~605 (import) 1142.5
HP16 Intermediate 1272.5 158 (export) ~605 (import) 765.7
HP17 Intermediate 1278.7 320 (import) ~500 (import) 478.4
HP18 Light 779.2 500 (export) ~480 (import) 817.35
HP19 Light 742.7 158 (export) ~200 (import) 703.64
HP20 Light 767.8 320 (import) 0 447.01
HP21 Extreme Light 458.1 158 (export) ~90 (import) 526.1
HP22 Extreme Light 498.75 500 (export) ~470 (import) 546.1
HP23 Peak 1632.2 500 (export) 900 (import) 1296.8
HP24 Intermediate 1123 500 (export) 900 (import) 788.9
HP25 Light 843.6 500 (export) 900 (import) 509.4
HP26 Peak 1827.7 157 (export) 900 (import) 1150.6
HP27 Intermediate 1245.3 157 (export) 900 (import) 567.7
12 Island Demaind includes load and losses. Variations in Island Demand for the same loading condition are attributed to incremental losses associated with variations in dispatch. 13 Peak loading conditions are based on 2027 forecasted load.

Newfoundland and Labrador Hydro RFI Studies
Stage 4A LIL Bipole: Preliminary Assessment of High Power Operation
©TransGrid Solutions Inc., 2018 10 | P a g e Technical Note: TN1205.62.05, November 21, 2018
3. Review of Three-Phase Faults Of the three‐phase ac faults (3PF) that were studied, unacceptable performance was found for 3PF
located anywhere on one of the three 230 kV lines running eastward of BDE, namely TL267, TL202 and
TL206. Anlysis indicates that the system response is a function of power flow in this corridor. The worst
case 3PF location is at Bay d’Espoir (BDE). As noted above, a 3PF at BDE is excluded from Transmission
Planning Criteria. A 3PF at Sunnyside (SSD) or Western Avalon (WAV), even if on TL267, TL202 or TL206
must meet all Transmission Planning Criteria.
Analysis was performed to assess the impacts associated with three‐phase faults on the 230 kV lines in
the corridor between BDE and SOP. The following scenarios were considered:
1. Assess corridor power flow limit such that a 3PF at BDE does not result in transient undervoltage
conditions or instability.14
2. Assess corridor power flow limit with relaxed consideration of 3PF at BDE.15
3.1 Considering a 3PF at BDE 3.1.1 Violations This preliminary study found four power flow cases in which system instability or transient undervoltage
violations were observed for a 3PF at BDE. These cases are summarized in Table 3‐1. The worst system
response was observed for a 3PF at BDE on TL267.
Table 3-1. Performance Issues Resulting from a 3PF at BDE on TL267
Base Case
Flow Eastward out of BDE
(MW)
Generators in‐service at BDE
Generators in‐service Avalon
Peninsula
LIL power at MFA (MW)
ML power transfer (MW)
Island demand (MW)
Criteria Violation
HP7 840 All (1‐7) HRP 3 (sync), HRD GT
294 320 import
1905 System instability
HP8 840 All (1‐7) HRP 3 (sync), HWD (sync)
337 320 import
1905 System instability
HP9 590 1, 2, 4, 7 HRP 3 (sync), HRD GT
Out‐of‐service
320 import
1224 Transient undervoltage criteria
HP12 499 All (1‐7) HRP 3 (sync) 675
monopole104.8 export
1698 Transient undervoltage criteria
14 Such a case would be an enhancement of Transmission Planning Criteria where faults at BDE are given the same consideration as all other faults. 15 This scenario includes cases where the 3PF at BDE is neglected, in accordance with Transmission Planning Criteria. It is also includes consideration of enhanced Transmission Planning Criteria where stability must be maintained for a 3PF at BDE, but transient undervoltage violations would be permitted.

Newfoundland and Labrador Hydro RFI Studies
Stage 4A LIL Bipole: Preliminary Assessment of High Power Operation
©TransGrid Solutions Inc., 2018 11 | P a g e Technical Note: TN1205.62.05, November 21, 2018
Figure 3‐1 shows the system instability observed in case HP8 for a 3PF at BDE on TL267. The second plot
of machine speeds at BDE Unit 7 and Holyrood Unit 3 shows that the system west of BDE loses
synchronism with the system east of BDE.
Figure 3-1. 3PF BDE on TL267, Peak load, 840 MW flow eastward out of BDE
Figure 3‐2 shows an example of the transient undervoltage criteria violations observed in case HP9 for a
3PF at BDE on TL267. The system response is stable, however, the 230 kV voltage at Sunnyside is below
0.8 pu for more than 20 cycles after the fault is cleared.
3PF at BDE on TL267 - Case HP8
Time(s) 0.0 1.0 2.0 3.0 4.0 5.0
0.00
0.20
0.40
0.60
0.80
1.00
pu
VOLT 195221 [BDE TS 230.00] VOLT 195249 [SOP 230.00] VOLT 195222 [SSD B1 230.00]
-0.150
-0.100
-0.050
0.000
0.050
0.100
0.150
pu
SPD 195007[BDP G7 13.800]7 SPD 195013[HRP G3 16.000]1

Newfoundland and Labrador Hydro RFI Studies
Stage 4A LIL Bipole: Preliminary Assessment of High Power Operation
©TransGrid Solutions Inc., 2018 12 | P a g e Technical Note: TN1205.62.05, November 21, 2018
Figure 3-2. 3PF at BDE on TL267, Intermediate load, 590 MW flow eastward out of BDE
3.1.2 Mitigation To mitigate the instability and transient low voltage issues , the flow eastward out of BDE was reduced.
Table 3‐2 summarizes the maximum flow eastward out of BDE to ensure acceptable system
performance. Mitigation was not achievable for case HP9 when LIL was out‐of‐service.
Table 3-2. Mitigation for violations for a 3PF at BDE
Base Case
Limit Flow Eastward out of BDE (MW) LIL Power Transfer (MW) after limiting BDE Flow
System response
HP7 657 474 Within criteria
HP8 617 560 Within criteria
HP9 Flow of 590 MW could not be reduced since LIL is out of service and there was no other generation to turn on on the Avalon peninsula
LIL out‐of‐service Still violates transient undervoltage criteria (as shown in Figure 3‐2)
HP12 458 675 monopole Within criteria
The following sections discuss the results of Table 3‐2 in more detail.
3PF at BDE on TL267 - Case HP9
Time(s) 0.0 2.0 4.0 6.0 8.0 10.0
0.00
0.20
0.40
0.60
0.80
1.00
pu
VOLT 195221 [BDE TS 230.00] VOLT 195249 [SOP 230.00] VOLT 195222 [SSD B1 230.00]
-0.0125
-0.0100
-0.0075
-0.0050
-0.0025
0.0000
0.0025
0.0050
0.0075
0.0100
0.0125
pu
SPD 195007[BDP G7 13.800]7 SPD 195013[HRP G3 16.000]1

Newfoundland and Labrador Hydro RFI Studies
Stage 4A LIL Bipole: Preliminary Assessment of High Power Operation
©TransGrid Solutions Inc., 2018 13 | P a g e Technical Note: TN1205.62.05, November 21, 2018
3.1.2.1 LIL Operating as a Bipole – Cases HP7, HP8 In order to meet criteria for cases HP7 and HP8, power flow in the BDE‐SOP corridor was reduced by
increasing LIL infeed and adjusting ML power transfer accordingly. In both cases, a reduction of power
transfer eastward out of BDE to around 615‐650MW16 (from 840 MW) mitigated the system instability,
and ensured the system response met criteria. For case HP7, LIL power transfer (measured at MFA) was
increased from 294 MW to 474 MW. For case HP8, LIL import was increased from 337 MW to 560 MW.
In order to see if there was any appreciable improvement in allowable power transfer on the BDE to SOP
230 kV corridor, the following system additions were added to the cases (one at a time) and tested:
A third 230 kV ac line in parallel to TL201 and TL217 between WAV and SOP
Holyrood Unit 1 as a synchronous condenser
Bay d’Espoir Unit 8
Cat Arm Unit 3
New gas turbine on the Avalon Peninsula17 operating as a synchronous condenser
Table 3‐3 summarizes the increase in power transfer eastward from BDE that can be achieved with each
of these system additions. It also shows the corresponding power flow through the WAV‐SOP corridor,
which is limited to 322 MVA due to TL201 thermal constraints. Note that the 322 MVA thermal
constraint is not the most limiting constraint, since the transient stability issues are limiting the flow to
less than the 322 MVA thermal constraint.
Table 3-3. HP7 and HP8 (Peak Load)– increase in BDE power transfer with new units
System addition
Maximum eastward power flow (MW)
HP7 (HRD GT in‐service) HP8 (HRD GT out‐of‐service)
Out of
BDE
WAV‐SOP Out of BDE WAV‐SOP
None (Base case) 656 280 617 238
HRD unit 1 sync 656 280 655 275
BDE unit 8 685 307 654 273
CAT arm 3 667 293 627 250
New GT on Avalon Peninsula (sync. cond.) 656 280 645 270
3Rd ac line, in parallel with TL201 and TL217 665 301 634 266
For case HP7, which had the HRD GT in‐service, there was no additional power transfer achieved by
16 Case HP7 had the Holyrood GT in‐service, which allowed for slightly higher power transfer than case HP8 where this unit was not in‐service. 17 Generator assumed to be equivalent to a 165.9 MVA, Brush BDAX 8‐445ER unit.

Newfoundland and Labrador Hydro RFI Studies
Stage 4A LIL Bipole: Preliminary Assessment of High Power Operation
©TransGrid Solutions Inc., 2018 14 | P a g e Technical Note: TN1205.62.05, November 21, 2018
adding a synchronous condenser on the Avalon Peninsula (HRD Unit 1 or new GT operating as a
synchronous condenser). For case HP8, with the HRD GT out‐of‐service, there was a marginal increase in
power transfer, approximately 30‐40 MW, that can be achieved with a new unit on the Avalon Peninsula
operating as a synchronous condenser or by using HRD Unit 1 as a synchronous condenser.
A new BDE Unit 8 off‐loaded the existing BDE units and provided some additional reactive power
support, which allowed a marginal increase of 30‐40 MW of power transfer across the BDE to SOP
corridor for both cases HP7 and HP8.
A new unit at Cat Arm had a limited impact in both cases, given its distance from the corridor of interest.
The third ac line in parallel with TL201 and TL217 had limited benefit since the bottleneck is a dynamic
issue and not a thermal constraint.
It should be noted that in all cases, the dynamic performance of the system is more limiting than the
thermal rating of TL201 if consideration is given to the impact of the three‐phase fault at BDE. The
thermal rating of TL201 (322 MVA in the winter) was flagged as the system operating limit under peak
load conditions in the previous operational studies, prior to the retirement of the HRD generating units.
The final phase of Stage 4 operating studies will define an operating guideline regarding the maximum
power transfer eastward out of BDE over operating conditions ranging from extreme light to peak load.
3.1.2.2 LIL out-of-service – Case HP9 Case HP9 is an intermediate load case in which the LIL is out‐of‐service. Since the LIL was not in‐service,
its power infeed could not be increased to reduce the power flow on the BDE to SOP corridor. With the
HRD GT already in service, there was no additional generation available on the Avalon Peninsula that
could be turned on to reduce the power flow on the BDE to SOP corridor. Therefore, the Island demand
was scaled down to 1200 MW in order to meet transient undervoltage issue along the 230 kV corridor
between BDE and SOP.
The following mitigation options were tested to see if they could aid in serving additional Island demand
with the LIL unavailable:
Addition of a new Holyrood gas turbine, supplying 60 MW of generation on the Avalon
Peninsula
Turning on the third SOP synchronous condenser
Table 3‐4 summarizes the Island demand that can be served with the above options in place, ensuring
that the transient undervoltage issue along the BDE to SOP 230 kV corridor is mitigated.
Table 3-4. Island demand that can be served with the LIL is out-of-service
Number of SOP synchronous condensers in‐service
Island Demand that can be served (MW)
Base Case New HRD GT
(60 MW)
2 1200 1300
3 1200 1300

Newfoundland and Labrador Hydro RFI Studies
Stage 4A LIL Bipole: Preliminary Assessment of High Power Operation
©TransGrid Solutions Inc., 2018 15 | P a g e Technical Note: TN1205.62.05, November 21, 2018
The additional synchronous condenser at SOP did not provide any benefit in terms of being able to serve
additional Island demand. The new 60 MW HRD GT allowed for an additional 100 MW of Island demand
to be served by off‐loading the BDE to SOP corridor and serving load close to the source.
In order to make an appreciable improvement to the amount of load that can be served when the LIL is
out‐of‐service under BDE 3‐phase fault scenario, it is likely that either generation would be needed on
the Avalon Peninsula, dynamic reactive support would be required near Sunnyside, or new ac
transmission out of BDE would be required to allow more power to be transferred east to the Avalon
Peninsula from the generation and ML import available on the west of the Island.
3.1.2.3 LIL operating as a Monopole at 1.5 pu – Case HP12 Case HP12 is an intermediate peak load case with the LIL operating as a monopole at 1.5 pu. Since the
LIL monopolar infeed is already at maximum continuous rating, the only available mitigation was to turn
on the Holyrood GT. Setting this generator to 40 MW was sufficient to mitigate the transient
undervoltage violations. Figure 3‐3 shows the system response after turning on the Holyrood GT at 40
MW. In this case, there is 458 MW flowing east of out BDE, and 139 MW flowing from WAV to SOP.
A peak load case (HP11) was tested with the LIL operating as a monopole at 1.5 pu. This case had the
HRD GT operating at its full capacity of 123.5 MW. There were no steady state or dynamic issues
observed with this case. Therefore, the peak Island demand can be met even if the LIL is operating as a
monopole at 1.5 pu, as long as the HRD GT can be dispatched as needed.

Newfoundland and Labrador Hydro RFI Studies
Stage 4A LIL Bipole: Preliminary Assessment of High Power Operation
©TransGrid Solutions Inc., 2018 16 | P a g e Technical Note: TN1205.62.05, November 21, 2018
Figure 3-3. 3PF at BDE on TL267, Intermediate load, 458 MW flow eastward out of BDE
3.1.2.4 Summary of System Limits As discussed in the previous sections, further analysis will be performed in the upcoming stages of the
Stage 4 operational studies to define the operating guidelines required to limit flow between BDE and
SOP in order to prevent stability issues that result due to three‐phase faults on the 230 kV lines running
eastward out of BDE.
3.2 Relaxed Consideration of a 3PF at BDE 3.2.1.1 LIL Operating as a Bipole – Cases HP7, HP8 Increased flow in this corridor would be possible if 3PF at BDE is neglected, in accordance with
Transmission Planning Criteria. Increased flow would also be possible if enhanced Transmission Planning
Criteria were considered where stability must be maintained for a 3PF at BDE, but transient
undervoltage violations are permitted. Cases HP7 and HP8 were revisited on this basis and the results
are summarized in Table 3‐5.
3PF at BDE on TL267 - Case HP12
Time(s) 0.0 2.0 4.0 6.0 8.0 10.0
0.00
0.20
0.40
0.60
0.80
1.00
pu
VOLT 195221 [BDE TS 230.00] VOLT 195249 [SOP 230.00] VOLT 195222 [SSD B1 230.00]
-0.0150
-0.0100
-0.0050
0.0000
0.0050
0.0100
pu
SPD 195007[BDP G7 13.800]7 SPD 195013[HRP G3 16.000]1

Newfoundland and Labrador Hydro RFI Studies
Stage 4A LIL Bipole: Preliminary Assessment of High Power Operation
©TransGrid Solutions Inc., 2018 17 | P a g e Technical Note: TN1205.62.05, November 21, 2018
Table 3-5. BDE to SOP Corridor Limits - with and without considering 3PF at BDE
Consider a 3PF at BDE?
Maximum eastward power flow (MW)
HP7 (HRD GT in‐service) HP8 (HRD GT out‐of‐service)
Out of BDE WAV‐SOP Out of BDE WAV‐SOP
Yes 656 280 617 238
No (3PF BDE is stable but violates criteria) 709 328 690 310
No (3PF BDE is unstable) 725 344 710 331
3.2.1.2 LIL out-of-service – Case HP9 Analysis was also performed to assess increased power flow limits in this corridor when the LIL is not in
service. Case HP9 was investigated on this basis.
As discussed in Section 3.1.2.2, if a 3PF at BDE is considered to meet all Transmission Planning Criteria,
the maximum load that can be served with the LIL out of service is 1200 MW.
If the 3PF location at BDE is ignored in terms of meeting transient voltage criteria, but still required to
provide a stable system response, the maximum IIS load that can be served only increases to
approximately 1260 MW. However, at this level of Island demand, the 3PF at BDE on TL267 is on the
verge of instability as shown in Figure 3‐4.
Figure 3-4. 3PF at BDE on TL267, Island demand 1225 MW, LIL out of service
If the 3PF at BDE is neglected, as per Transmission Planning Criteria, the next worst‐case contingency
3PF at BDE on TL267
Time(s) 0.0 1.0 2.0 3.0 4.0 5.0
0.00
0.20
0.40
0.60
0.80
1.00
pu
VOLT 195249 [SOP 230.00] VOLT 195222 [SSD B1 230.00] VOLT 195229 [WAV B1B3 230.00]

Newfoundland and Labrador Hydro RFI Studies
Stage 4A LIL Bipole: Preliminary Assessment of High Power Operation
©TransGrid Solutions Inc., 2018 18 | P a g e Technical Note: TN1205.62.05, November 21, 2018
would be a 3PF at WAV, followed by a trip of TL267. A maximum Island Demand of 1290 MW can be
supported in this case.
A summary of preliminary transfer limits is provided in Table 3‐6. As discussed above, limits for all
transmission system corridors will be confirmed as part of the final phase of the Stage IV studies.
Table 3-6. BDE to SOP Corridor Limits with the LIL Out of Service - with and without considering 3PF at BDE
Consider a 3PF at BDE?
Maximum eastward power flow (MW)
Island Demand that can be met (MW)
HP9
Out of BDE WAV‐SOP
Yes 580 310 1200
No (3PF BDE is stable but violates criteria) 617 334 1260
No (3PF BDE is unstable) 645 352 1290

Newfoundland and Labrador Hydro RFI Studies
Stage 4A LIL Bipole: Preliminary Assessment of High Power Operation
©TransGrid Solutions Inc., 2018 19 | P a g e Technical Note: TN1205.62.05, November 21, 2018
4. Loss of Largest Generator in IIS After retirement of the Holyrood generating units, BDE Unit 7 at 154.4 MW is the largest generator on
the IIS. For loss of largest generator, frequency should remain above 59 Hz, and UFLS should be avoided.
4.1 LIL in-service Loss of BDE Unit 7 was tested for various Island demand levels ranging from peak load to light load with
the LIL transferring rated power of 900 MW. These tests were performed with the ML frequency
controller in‐service, and with the ML frequency controller out‐of‐service.
The purpose was to determine if any reserve is needed on the LIL to keep the frequency on the IIS above
59 Hz if BDE Unit 7 trips. Table 4‐1 summarizes the results.
Table 4-1. Loss of BDE Unit 7, with and without ML frequency controller in-service
Case Load
Condition
Island Generation
(MW)
Island Demand (MW)
LIL (MW) @ MFA
ML Export (MW)
ML Frequency Controller In‐service
ML FrequencyController
Out‐of‐service
IIS Freq (Hz) IIS Freq (Hz)
LIL (MW) to meet 59 Hz
HP23 Peak 1296.8 1632.2 900 500 59.22 58.77 846
HP24 Intermed. 788.9 1123 900 500 59.08 58.60 810
HP25 Light 509.4 843.6 900 500 59.10 58.62 770
HP26 Peak 1150.6 1827.7 900 157 59.16 58.75 830
HP27 Intermed. 567.7 1245.3 900 157 59.18 58.62 832
With the ML frequency controller in‐service, the Island frequency remained above 59 Hz for loss of BDE
Unit 7. Therefore, no reserve is required on the LIL if the ML frequency controller is in‐service.
With the ML frequency controller out‐of‐service, the frequency dropped below 59 Hz for loss of BDE unit
7, to the levels shown in Table 4‐1. In order to keep the frequency above 59 Hz, the LIL will need to
carry reserve varying from 54 MW to 130 MW as shown in Table 4‐1, depending on Island demand and
generation levels.
4.2 LIL out-of-service If the LIL is out‐of‐service, the frequency remains above 59 Hz for loss of the largest generator, as long as
the ML frequency controller is in‐service.
If the ML frequency controller is out‐of‐service, however, loss of the largest generator will cause
frequency to drop below 59 Hz and the UFLS scheme will be initiated as summarized in Table 4‐2.

Newfoundland and Labrador Hydro RFI Studies
Stage 4A LIL Bipole: Preliminary Assessment of High Power Operation
©TransGrid Solutions Inc., 2018 20 | P a g e Technical Note: TN1205.62.05, November 21, 2018
Table 4-2. Loss of Largest Generator with LIL out-of-service
Case Load
Condition
Island Generation
(MW)
Island Demand (MW)
LIL ML
Export (MW)
ML FrequencyController In‐service
ML FrequencyController
Out‐of‐service
IIS Freq (Hz) IIS Freq (Hz)
Load Shed* (MW)
HP9 Intermed. 903.6 1224.4 OUT 320 59.21 58.78 90.6
HP2018 Light 447.0 767.8 OUT 320 59.31 58.83 25.5
*Using revised UFLS discussed in Section 7
The final Stage IV study will include an assessment to determine maximum unit loading to avoid
instability and UFLS if frequency controllers are not in service.
18 Loss of BDE Unit 1 at 60 MW. BDE Unit 7 is not in‐service in this case.

Newfoundland and Labrador Hydro RFI Studies
Stage 4A LIL Bipole: Preliminary Assessment of High Power Operation
©TransGrid Solutions Inc., 2018 21 | P a g e Technical Note: TN1205.62.05, November 21, 2018
5. Loss of a LIL Pole The Transmission Planning Criteria for loss of a LIL pole states that this event should not cause the IIS
frequency to drop below 59 Hz, and it should not result in UFLS.
If one of the LIL poles is lost, the remaining pole is rated to transmit 2.0 pu for 10 minutes, after which
the continuous monopole rating drops down to 1.5 pu. The purpose of the 10‐minute 2.0 pu overload
rating is to allow operators time to quickly turn on generation to make up for the loss of infeed from the
LIL pole that was lost. However, there are two issues that restrict the LIL monopole from actually
providing the full overload rating during the transient stability timeframe (seconds):
1. When operating as a monopole, immediately after the other LIL pole has tripped, the monopole
will be operating in ground return. The LIL has a long electrode, which adds a significant amount
of resistance to the link when operating in ground return. This increased resistance results in
increased losses on the LIL DC line.
2. Within a transient stability timeframe (i.e. seconds), the remaining LIL pole is not necessarily
able to transmit the full 2.0 pu due to the rectifier firing angle hitting its minimum limit, which
keeps the DC current from getting up to the full 2.0 pu until the tap‐changers on the converter
transformers can operate to release the firing angle from its limit. Therefore, within this initial
time period after the LIL pole is lost, there is still loss of infeed to the IIS despite the 2.0 pu 10‐
minute overload rating. The amount of infeed that is lost depends on how much power the LIL
was transferring before the pole was lost. In a worst case, if operating at 900 MW, this study
showed that without tap‐changer action on the converter transformers and with hitting
minimum alpha, and also due to increased DC line losses associated with the resistance of the
line electrode, the remaining pole is only able to provide 633 MW to SOP, as opposed to the 830
MW it was providing pre‐contingency, resulting in the net initial loss of 267 MW.
5.1 During ML Export In order to keep the IIS frequency above 59 Hz, loss of a LIL pole will require a runback on the ML. The
ML will receive a signal to runback its exports to 0 MW if the LIL experiences a loss of pole. Loss of a LIL
pole was simulated for the study base cases. Table 5‐1 summarizes the results for loss of a LIL pole when
operating at 900 MW, for the scenarios with the ML frequency controller in‐service and out‐of‐service.
Table 5-1. Minimum Frequency following Loss of LIL Pole with ML runback to 0 MW
Case Load Condition LIL (MW) @ MFA
ML (MW)
Minimum Frequency Dip (Hz)
ML frequency controller in‐service
ML frequency controller out‐of‐service
HP23 Peak 900 500 (export) 59.76* 58.76
HP24 Intermediate 900 500 (export) 59.79* 59.79
HP25 Light 900 500 (export) 59.80* 59.80
HP26 Peak 900 157 (export) 59.11 58.94
HP27 Intermediate 900 157 (export) 59.14 58.84

Newfoundland and Labrador Hydro RFI Studies
Stage 4A LIL Bipole: Preliminary Assessment of High Power Operation
©TransGrid Solutions Inc., 2018 22 | P a g e Technical Note: TN1205.62.05, November 21, 2018
If the ML frequency controller is in‐service, the frequency remained above 59 Hz.
If the ML frequency controller is out of service, the cases with 157 MW of ML export (cases HP26, HP27)
experience a frequency slightly less than 59 Hz, down to around 58.8 Hz.
Please note that the cases marked with (*) in Table 5‐1 require the LIL frequency controller to be in‐
service to prevent a large overfrequency (>62 Hz) from occurring after the 500 MW ML export is run‐
back to 0 MW. Alternatively, a more sophisticated ML runback detailing a specific amount of power to
be runback would be required.
5.2 During ML Import If the ML import is at the maximum level of 320 MW, it cannot transiently import more power from
Nova Scotia via its frequency controller and it cannot be runback, therefore it cannot help the IIS during
underfrequency events. In this case, LIL power transfer would have to be limited as per Table 5‐2 in
order to keep the IIS frequency above 59 Hz in case a LIL pole is lost.
Table 5-2. LIL Transfer Limits: Loss of LIL pole during ML 320 MW import
Case Load
Condition LIL (MW) @
MFA ML (MW)
IIS Minimum Frequency (Hz)
Maximum LIL Transfer
to meet 59 Hz (MW)
HP7 Peak 294.4 320 (import) 59.66 ‐
HP8 Peak 337 320 (import) 59.44 ‐
HP14 Peak 704 320 (import) 58.76 488
HP17 Intermediate 500 320 (import) 58.80 395
The final Stage IV study will include an assessment to determine maximum LIL loading to ensure
compliance with Transmission Planning Criteria.

Newfoundland and Labrador Hydro RFI Studies
Stage 4A LIL Bipole: Preliminary Assessment of High Power Operation
©TransGrid Solutions Inc., 2018 23 | P a g e Technical Note: TN1205.62.05, November 21, 2018
6. Loss of an ML Pole 6.1 During ML Export If the ML is exporting and a pole is lost, the IIS will experience an overfrequency. This overfrequency
should not rise above 62 Hz.
The worst case occurs when the ML is at maximum export of 500 MW. If an ML pole is lost, there will be
an excess of 250 MW in the IIS. All base cases with the ML exporting 500 MW were used to simulate loss
of an ML pole. These results are summarized in Table 6‐1.
For this analysis, a runback of the LIL was not considered. Rather the LIL frequency controller was found
to adequately limit overfrequency conditions. The highest overfrequencies were found to occur during
light and extreme light load conditions, in which an overfrequency of 60.6 Hz occurred when an ML pole
was lost.
Table 6-1. ML 500 MW export cases – loss of ML pole
Case Load Condition LIL (MW) @ MFA ML (MW) Frequency (Hz)
HP3 Intermediate 900 500 (export) 60.50
HP6 Intermediate 694 500 (export) 60.49
HP15 Intermediate 704 500 (export) 60.49
HP22 Extreme Light 470 500 (export) 60.56
HP23 Peak 900 500 (export) 60.49
HP24 Intermediate 900 500 (export) 60.54
HP25 Light 900 500 (export) 60.60
6.2 During ML Import If the ML is importing and a pole is lost, the IIS will experience an underfrequency. This underfrequency
should not drop below 59 Hz and UFLS should not occur.
The worst case occurs when the ML is at maximum import of 320 MW. If an ML pole is lost, the healthy
pole will automatically increase its power from importing 160 MW to 250 MW (rating of the pole),
resulting in a net loss of approximately 70 MW to the IIS. All base cases with the ML importing 320 MW
were used to simulate loss of an ML pole. Table 6‐2 summarizes these results.
With the LIL and its frequency controller in‐service, the IIS frequency remained above 59 Hz and
the Transmission Planning Criteria is met.
With the LIL out‐of‐service, however, loss of an ML pole resulted in the IIS frequency dropping
just below 59 Hz. For the intermediate load case, the frequency drops to 58.96 Hz, however, this
is not low enough to result in load shedding. For the light load case, the frequency drops to
58.86 Hz, and load is shed.

Newfoundland and Labrador Hydro RFI Studies
Stage 4A LIL Bipole: Preliminary Assessment of High Power Operation
©TransGrid Solutions Inc., 2018 24 | P a g e Technical Note: TN1205.62.05, November 21, 2018
Table 6-2. ML 320 MW import cases – Loss of ML pole
Case Load Condition LIL (MW) @ MFA ML (MW) Frequency (Hz) Load Shed (MW)
LIL (and frequeny controller) in‐service
HP7 Peak 294.4 (import) 320 (import) 59.69 ‐
HP8 Peak 337 (import) 320 (import) 59.67 ‐
HP14 Peak 704 320 (import) 59.67 ‐
HP17 Intermediate 500 320 (import) 59.60 ‐
LIL (and frequeny controller) out‐of‐service
HP9 Intermediate Out‐of‐service 320 (import) 58.96 0
HP20 Light Out‐of‐service 320 (import) 58.86 26
The final Stage IV study will include an assessment to determine maximum ML loading to ensure
compliance with Transmission Planning Criteria.

Newfoundland and Labrador Hydro RFI Studies
Stage 4A LIL Bipole: Preliminary Assessment of High Power Operation
©TransGrid Solutions Inc., 2018 25 | P a g e Technical Note: TN1205.62.05, November 21, 2018
7. Loss of the LIL Bipole 7.1 Permanent Loss of the LIL Bipole A permanent loss of the LIL bipole (i.e. without successful restart) is the contingency that defines the
requirements of the UFLS scheme for the IIS. If the LIL bipole is lost, the ML (if exporting) will be runback
to 0 MW19. Additionally, the UFLS scheme will operate to ensure that the system remains stable and that
the IIS frequency remains above 58 Hz, as per Transmission Planning Criteria.
There are two stability issues that were found to occur when the LIL bipole is lost:
1. Fast decline in IIS frequency
2. Voltage collapse around the mid‐point of the BDE‐SOP 230 kV corridor (around Sunnyside)
Modifications to the existing UFLS scheme were required to keep the IIS frequency above the 58 Hz
criteria. The modified scheme consists of load shed blocks over a frequency range of 58.9 Hz to 58.4 Hz.
Details of the new UFLS scheme are provided in Appendix 1.
Loss of the LIL bipole was simulated for each of the study base cases using the newly defined UFLS
scheme. The results are summarized in Table 7‐1, including the amount of load that is shed for each
case. For all cases in Table 7‐1, the minimum IIS frequency was found to remain at or above 58.1 Hz,
providing a 0.1 Hz margin to the 58 Hz Transmission Planning Criteria, with the exception of cases HP8,
HP14, HP26 and HP27, which are discussed in further detail in Sections 7.1.1 and 7.1.2.
Table 7-1. Scenarios studied for permanent loss of LIL bipole, and corresponsding UFLS
Study Case
Load Condition Island
Demand (MW)
ML (at BBK) (MW)
LIL (at MFA) (MW)
Island Generation
(MW)
Load Shed (MW)
HP1 Peak 1824.8 157 (export) 900 1147 782
HP2 Intermediate Peak 1689.3 157 (export) 900 1012.9 718
HP3 Intermediate 1347.5 500 (export) 900 1012.8 268
HP4 Peak 1832 157 (export) 694 1333.6 628
HP5 Intermediate Peak 1717 157 (export) 694 1218.8 723
HP6 Intermediate 1374.6 500 (export) 694 1218.7 55
HP7 Peak 1861.7 320 (import) 474 1084.9 780
HP8* Peak 1849.5 320 (import) 560 994.1 782
HP10 Intermediate Peak 1756.9 104.8 (export) 675 (MP) 1302.9 576
HP11 Peak 1833.7 104.8 (export) 675 (MP) 1380.2 601
19 If the ML is not exporting, the ML response would be limited to frequency controller action.

Newfoundland and Labrador Hydro RFI Studies
Stage 4A LIL Bipole: Preliminary Assessment of High Power Operation
©TransGrid Solutions Inc., 2018 26 | P a g e Technical Note: TN1205.62.05, November 21, 2018
Study Case
Load Condition Island
Demand (MW)
ML (at BBK) (MW)
LIL (at MFA) (MW)
Island Generation
(MW)
Load Shed (MW)
HP12 Intermediate Peak 1697.7 104.8 (export) 675 (MP) 1243.8 716
HP13 Peak 1812.4 158 (export) 704 1307.3 653
HP14* Peak 1830.4 320 (import) 488 1040.6 779
HP15 Intermediate 1307.2 500 (export) 704 1142.5 51
HP16 Intermediate 1272.5 158 (export) 704 765.7 539
HP17 Intermediate 1285.1 320 (import) 395 582 440
HP18 Light 779.2 500 (export) 480 817.35 0
HP19 Light 742.7 158 (export) 200 703.64 0
HP21 Extreme Light 458.1 158 (export) 90 526.1 0
HP22 Extreme Light 498.75 500 (export) 470 546.1 0
HP23 Peak 1632.2 500 (export) 900 1296.8 338
HP24 Intermediate 1123 500 (export) 900 788.9 240
HP25 Light 843.6 500 (export) 900 509.4 199
HP26* Peak 1827.7 157 (export) 900 1150.6 782
HP27** Intermediate 1245.3 157 (export) 900 567 512
*Unstable unless HRD GT put in‐service
**Stable but frequency < 58 Hz unless LIL reduced to 820 MW and Island generation increased to 633 MW
7.1.1 Minimum Island Generation Based on further investigation of Case HP27, it became evident that it would not be possible to transfer
the full 900 MW on the LIL if there was not sufficient Island generation on‐line to support the IIS
frequency and voltage if the LIL bipole is lost. In the original Case HP27, the LIL is transferring 900 MW
with only 567 MW of Island generation on‐line. A series of simulations were performed from peak load
to extreme light load conditions to determine the maximum LIL transfer that could be lost for a given
amount of Island generation. This was performed by starting out at peak load, then scaling down Island
demand/generation and finding out at what LIL transfer limit the IIS frequency would drop to 58 Hz if
the LIL bipole was lost. Based on these series of simulations, a preliminary operating guideline was
developed to define LIL transfer limits based on Island generation. In this operating guideline, the
maximum LIL power transfer is tied to a minimum requirement for Island generation, as shown in Figure
7‐1. The LIL transfer limits are defined for two scenarios; one, where the ML is exporting firm transfer of
157 MW (and can be relied upon to runback these exports to 0 MW), and two, where the ML is
operating at 0 MW (and cannot be relied upon for runback).
Please note that the LIL transfer limits shown in Figure 7‐1 are valid when the ML frequency controller is
in‐service. Further restrictions on LIL transfer would likely be necessary if the ML or the ML frequency
controller is out‐of‐service. A similar graph with the ML frequency controller out‐of‐service will be
developed during the final phase of Stage 4 operating studies.
In order for Case HP27 to result in a minimum frequency of 58.1 Hz if the LIL bipole is lost, the LIL
transfer had to be reduced from 900 MW to 820 MW, and consequently the Island generation had to be

Newfoundland and Labrador Hydro RFI Studies
Stage 4A LIL Bipole: Preliminary Assessment of High Power Operation
©TransGrid Solutions Inc., 2018 27 | P a g e Technical Note: TN1205.62.05, November 21, 2018
increased from 567 MW to 633 MW. This new operating point lines up well with the blue curve in Figure
7‐1.
Figure 7-1. LIL Transfer limits vs. Island Generation Blue: ML @ 157 MW export Orange: ML @ 0 MW
7.1.2 Peak Load – Need for HRD GT to be in-service Peak load cases HP8, HP14 and HP26 are unstable even with the newly designed UFLS scheme. This is
due to voltage collapse near Sunnyside Terminal Station. Case HP26 has sufficient Island generation to
transfer the full 900 MW LIL rating, according to Figure 7‐1, and cases HP14 and HP8 have significantly
reduced LIL power transer, but yet still they are unstable.
One commonality between these three cases is that the HRD GT is not on‐line. In all of the other peak
load cases in Table 7‐1, the HRD GT is dispatched.
These cases were investigated in further detail as described below.
7.1.2.1 Case HP26 – During 900 MW LIL, 157 MW ML Export Case HP26, although it has sufficient Island generation to transfer the full 900 MW on the LIL according
Figure 7‐1, is not stable. Referring to Table 7‐1, case HP26 is the same as case HP1, except case HP1 has
the HRD GT dispatched. It was found that if the HRD GT is turned on in case HP26, while keeping the
same spinning reserve (i.e. turning off other generators that were on while keeping a spinning reserve of
70 MW), the IIS response is stable and the frequency remains above the 58 Hz criteria. The voltage in

Newfoundland and Labrador Hydro RFI Studies
Stage 4A LIL Bipole: Preliminary Assessment of High Power Operation
©TransGrid Solutions Inc., 2018 28 | P a g e Technical Note: TN1205.62.05, November 21, 2018
the Sunnyside area dips to around 0.6 pu, but the system recovers as shown in Figure 7‐2. It is important
to note that three CBC capacitor banks are in‐service in this case to help support the voltage in this area.
Figure 7-2. Loss of LIL Bipole (Case HP26 with HRD GT on)
Consequently, it may be necessary to have an additional operating guideline stating that, in addition to
the LIL transfer limits shown in Figure 7‐1, the HRD GT and three CBC capacitor banks must be in service
during peak load conditions when LIL power transfer is high.
7.1.2.2 Case HP8, Case HP14 – During 320 MW ML Import Cases HP8 and HP14 are both cases where the ML is importing 320 MW, and therefore the ML
frequency controller is not able to provide assistance when the LIL bipole is lost.
Case HP8 is one of the cases used to test high power flow eastward from BDE towards SOP.
Case HP14 is similar to case HP8. The original case HP14 as provided by Hydro had the LIL transferring
704 MW. However, loss of a LIL pole (discussed in Section 5.2) determined that the maximum LIL
transfer in this case could only be 488 MW in order to satisfy the 59 Hz criteria for loss of a LIL pole. This
case would therefore also require redispatch. However, when the LIL transfer is reduced to 488 MW, the
power flow eastward from BDE towards SOP also becomes high, similar to case HP8.
When simulating loss of the LIL bipole at these operating points, case HP7 (HRD GT in‐service) is stable
and meets criteria. However, case HP8 and case HP14 (HRD GT out‐of‐service) are not stable. In these

Newfoundland and Labrador Hydro RFI Studies
Stage 4A LIL Bipole: Preliminary Assessment of High Power Operation
©TransGrid Solutions Inc., 2018 29 | P a g e Technical Note: TN1205.62.05, November 21, 2018
cases, the LIL power transfer must be further increased to further restrict power flow in this corridor.
Case HP8 becomes stable with LIL power transfer of 600 MW (instead of 560 MW), which corresponds
to a BDE to SOP power flow of approximately 650 MW.
However, increasing LIL power beyond 488 MW will result in the 59 Hz criteria being violated if a LIL pole
is lost.
Therefore, instead of reducing power flow on the BDE to SOP corridor by increasing LIL transfer, cases
HP8 and HP14 also become stable if the HRD GT is turned on, which also results in reduced power flow
on this corridor.
Please also note that during times of high power flow between BDE and SOP, adding pre‐contingency
voltage support in the Sunnyside area is necessary. It is recommended to keep the voltage in this area as
high as possible (without violating steady state voltage criteria) by turning on the capacitor banks at
Come‐By‐Chance.
The details of the operating guideline to limit power flow between BDE and SOP will be finalized during
the final phase of the Stage 4 operational studies, taking into consideration all contingencies in the
system including three‐phase AC faults and loss of the LIL bipole. This preliminary study indicates a
power flow limit in the range of 650 MW in this corridor (as measured eastward out of BDE) in order to
maintain system stability following the loss of the LIL bipole.
It appears that during peak load conditions, the HRD GT should be placed online.Requirements for gas
turbine operation will be defined during the final Stage 4 operational studies.
7.2 LIL Temporary Bipole Outage An analysis of temporary LIL bipole outages of varying durations prior to successful restart was
performed in order to find the maximum restart time that would ensure the IIS frequency remains
above 59 Hz (in accordance with Transmission Planning Criteria to prevent an underfrequency load shed
event). A further assessment was also performed to observe how much this outage time could be
increased prior to all of the blocks of UFLS required for the permanent loss of the LIL bipole (assuming
the new UFLS scheme required for the permanent loss of the LIL bipole is in place).
In a typical HVDC link, the time for the first restart attempt is usually in the range of 100 ms to 200 ms.
Subsequent restart attempts typically add 50 ms to 100 ms for each additional restart attempt. For
example, if an HVDC link has four restart attempts, an example for possible timing for restart attempts
might be as follows:
First attempt: 150 ms
Second attempt: 200 ms
Third attempt: 300 ms
Fourth attempt: 400 ms
If it took all four restart attempts before successfully restarting the HVDC link, this could mean a total
temporary outage time of more than 1 second. A temporary LIL bipole outage of 1 second is also
simulated in this study.

Newfoundland and Labrador Hydro RFI Studies
Stage 4A LIL Bipole: Preliminary Assessment of High Power Operation
©TransGrid Solutions Inc., 2018 30 | P a g e Technical Note: TN1205.62.05, November 21, 2018
7.2.1 To Meet 59 Hz and Avoid UFLS The 900 MW LIL transfer cases from Table 7‐1 were used to simulate the temporary LIL bipole outage
with successful restart. Case HP27 was found to be the most limiting case to meet the 59 Hz criteria. As
discussed in Section 7.1.1, this case was characterized by having insufficient Island generation for the full
import of 900 MW over the LIL, and as such the LIL power transfer was reduced to 820 MW and the
Island generation was increased to 633 MW. Even at 820 MW of LIL transfer, this case was the worst in
terms of frequency dip compared to the other LIL 900 MW cases when simulated a temporary LIL bipole
outage.
Assuming that the ML (if exporting) will runback to 0 MW during the LIL temporary bipole outage, the 59
Hz criteria can be met as long as the LIL is successfully restarted within:
300 ms if two SOP synchronous condensers in‐service
380 ms if three SOP synchronous condensers in‐service
Figure 7‐3 shows the IIS response to a temporary LIL bipole outage with two SOP synchronous
condensers in‐service for case HP27. A successful restart after 300 ms is shown. It is noted that this case
includes a runback of 157 MW and frequency controller operation.
If there is no ML export to runback and/or if the ML frequency controller is not in‐service, a LIL operating
restriction would be required to meet the 59 Hz criteria. The final phase of the Stage IV studies will
determine limits to LIL import if the ML frequency controller is not in‐service or if there is no export on
the ML.
The generator additions tested earlier in this report were also tested to see if they had any impact on
the allowable LIL bipole temporary outage duration. These units included:
Holyrood Unit 1 as a synchronous condenser
Bay d’Espoir Unit 8
Cat Arm Unit 3
New gas turbine on the Avalon Peninsula20 operating as a synchronous condenser
The addition of these units did not have an appreciable impact on the frequency response of the system.
20 Generator assumed to be equivalent to Brush BDAX 8‐445ER

Newfoundland and Labrador Hydro RFI Studies
Stage 4A LIL Bipole: Preliminary Assessment of High Power Operation
©TransGrid Solutions Inc., 2018 31 | P a g e Technical Note: TN1205.62.05, November 21, 2018
Figure 7-3. Temporary Loss of LIL Bipole (Case HP27), restart in 300 ms, 59 Hz (no UFLS)
7.2.2 Outage Duration before all Blocks of Load are Shed It is planned that the LIL will have multiple restart attempts. If the total outage time of the LIL bipole
increases beyond the durations stated in Seciton 7.2.1, then blocks of UFLS will begin to activate once
the frequency falls to 58.9 Hz.
Analysis was performed to determine the total LIL bipole outage duration by which the majority of the
blocks of load will have been shed. For case HP27, the majority of the blocks of the newly designed UFLS
scheme were shed within:
Temporary Loss of LIL Bipole - Successful Restart after 300 ms
Time(sec) 0.0 2.0 4.0 6.0 8.0 10.0
59.00 59.20 59.40 59.60 59.80 60.00 60.20 60.40 60.60 60.80
Hz
FREQ 195236 [HWD B1B2 230.00] FREQ 195210 [CAT L47 230.00]
0.20
0.40
0.60
0.80
1.00
pu
VOLT 195222 [SSD B1 230.00]
-200
-150
-100
-50
0
50
100
MW
PAC BBK - ML Power
0.0
0.2k
0.4k
0.6k
0.8k
1.0k
1.2k
MW
PAC MFA P1 - LIL Power

Newfoundland and Labrador Hydro RFI Studies
Stage 4A LIL Bipole: Preliminary Assessment of High Power Operation
©TransGrid Solutions Inc., 2018 32 | P a g e Technical Note: TN1205.62.05, November 21, 2018
680 ms if two SOP synchronous condensers in‐service
780 ms if three SOP synchronous condensers are in‐service
The example of restart timings described in Section 7.2 shows that multiple restart attempts could result
in a temporary LIL bipole outage of around 1 second. This scenario was simulated to show the system
response to a temporary LIL bipole outage of 1 second. Note that in PSSE, multiple restart attempts are
not actually simulated, but rather it is simulated as a single total outage duration of 1 second.
The system response to a temporary LIL bipole outage that is successfully restarted after 1 second is
shown in Figure 7‐4. Note that upon successfully restarting, the LIL frequency controller reduces the LIL
power transfer power to near minimum power due to the load that was shed on the Island and due to
the runback of 157 MW of ML export during the temporary outage of the LIL bipole.

Newfoundland and Labrador Hydro RFI Studies
Stage 4A LIL Bipole: Preliminary Assessment of High Power Operation
©TransGrid Solutions Inc., 2018 33 | P a g e Technical Note: TN1205.62.05, November 21, 2018
Figure 7-4. Temporary Loss of LIL Bipole (Case HP27), restart in 1 second
If the LIL frequency controller is not in‐service, the system frequency continues to rise beyond 62 Hz
upon successful restart of the LIL bipole as shown in Figure 7‐5. Therefore, if restart attempts are going
to be made on LIL bipole outages, it is essential that the LIL frequency controller be in‐service, otherwise
if all blocks of load have been shed and the LIL returns to full power, the system frequency will rise far
beyond 62 Hz.
Temporary Loss of LIL Bipole - Successful Restart after 1000 ms
Time(sec) 0.0 2.0 4.0 6.0 8.0 10.0
58.00
58.50
59.00
59.50
60.00
60.50
61.00
61.50
62.00
Hz
FREQ 195236 [HWD B1B2 230.00] FREQ 195210 [CAT L47 230.00]
0.00
0.20
0.40
0.60
0.80
1.00
1.20
1.40
pu
VOLT 195222 [SSD B1 230.00]
-200
-150
-100
-50
0
50
100
150
MW
PAC BBK - ML Power
-0.4k
-0.2k
0.0
0.2k
0.4k
0.6k
0.8k
1.0k
1.2k
MW
PAC MFA P1 - LIL Power

Newfoundland and Labrador Hydro RFI Studies
Stage 4A LIL Bipole: Preliminary Assessment of High Power Operation
©TransGrid Solutions Inc., 2018 34 | P a g e Technical Note: TN1205.62.05, November 21, 2018
Figure 7-5. Temporary Loss of LIL Bipole (Case HP27), restart in 1 second, no LIL frequency controller
Temporary Loss of LIL Bipole - Successful Restart after 1000 ms - no LIL Frequency Controller
Time(sec) 0.0 1.0 2.0 3.0 4.0 5.0
56.0
58.0
60.0
62.0
64.0
66.0
68.0
70.0
Hz
FREQ 195236 [HWD B1B2 230.00] FREQ 195210 [CAT L47 230.00]
0.00
0.20
0.40
0.60
0.80
1.00
1.20
1.40
pu
VOLT 195222 [SSD B1 230.00]
-200
-150
-100
-50
0
50
100
150
MW
PAC BBK - ML Power
-0.4k
-0.2k
0.0
0.2k
0.4k
0.6k
0.8k
1.0k
1.2k
MW
PAC MFA P1 - LIL Power

Newfoundland and Labrador Hydro RFI Studies
Stage 4A LIL Bipole: Preliminary Assessment of High Power Operation
©TransGrid Solutions Inc., 2018 35 | P a g e Technical Note: TN1205.62.05, November 21, 2018
8. Loss of the ML Bipole 8.1 During ML Export If the ML is exporting and the ML bipole is lost, the IIS will experience an overfrequency. Transmission
Planning criteria states that this overfrequency should not rise above 62 Hz.
The worst case occurs when the ML is at maximum export of 500 MW. If the ML bipole is lost, there will
be an excess of 500 MW in the IIS. All base cases with the ML exporting 500 MW were used to simulate
loss of the ML bipole. These results are summarized in Table 8‐1.
Without running back power on the LIL, the worst case system conditions occur during light and
extreme light loading, which experienced an overfrequency of 61.2 Hz when the ML bipole was lost.
Table 8-1. Overfrequency due to loss of ML bipole at 500 MW export
Case Load Condition LIL (MW) @
MFA ML (MW)
Frequency (Hz)
HP3 Intermediate 900 500 (export) 60.87
HP6 Intermediate 694 500 (export) 60.86
HP15 Intermediate 704 500 (export) 60.86
HP18 Light 480 500 (export) 61.20
HP22 Extreme Light 470 500 (export) 61.20
HP23 Peak 900 500 (export) 60.86
HP24 Intermediate 900 500 (export) 60.92
HP25 Light 900 500 (export) 60.87
8.2 During ML Import If the ML bipole is lost while importing, the IIS will experience an underfrequency. Transmission Planning
criteria states that frequency should remain above 58 Hz, however controlled UFLS is permitted.
The worst case underfrequency occurs when the ML is at maximum import of 320 MW. If the ML bipole
is lost, there will be a deficiency of 320 MW in the IIS. All base cases with the ML importing 320 MW
were used to simulate loss of the ML bipole. These results are summarized in Table 8‐2. In all cases, the
frequency remained well above 58 Hz.
Table 8-2. Underfrequency due to loss of ML bipole at 320 MW import
Case Load
Condition LIL (MW) @
MFA ML (MW)
Frequency (Hz)
Load shed (MW)
HP7 Peak 294.4 320 (import) 59.35 ‐
HP8 Peak 337 320 (import) 59.32 ‐
HP9 Intermediate Out‐of‐service 320 (import) 58.48 381
HP14 Peak 704 320 (import) 58.86 76
HP17 Intermediate 500 320 (import) 59.33 ‐
HP20 Light Out‐of‐service 320 (import) 58.24 273

Newfoundland and Labrador Hydro RFI Studies
Stage 4A LIL Bipole: Preliminary Assessment of High Power Operation
©TransGrid Solutions Inc., 2018 36 | P a g e Technical Note: TN1205.62.05, November 21, 2018
In the cases with the LIL in‐service, only the peak load case (HP14) with the LIL operating at 704 MW
experienced an UFLS event of 76 MW when the ML bipole was lost. In the rest of the cases with the LIL
in‐service, the IIS frequency remained above 59 Hz.
In the cases where the LIL is out‐of‐service (HP2, HP20), its frequency controller is not available to
support the IIS frequency when the ML bipole is lost. In these cases, the frequency still remained well
above the 58 Hz criteria, however UFLS in the amount of 273 MW occurred in the light load case and
381 MW occurred in the intermediate load case using the revised UFLS scheme discussed in Section 7.

Newfoundland and Labrador Hydro RFI Studies
Stage 4A LIL Bipole: Preliminary Assessment of High Power Operation
©TransGrid Solutions Inc., 2018 37 | P a g e Technical Note: TN1205.62.05, November 21, 2018
9. Conclusions 9.1 Conclusions The results of the analysis are summarized in the sections below.
9.1.1 Three-Phase Faults near SOP, BDE and the Avalon Peninsula The analysis included a review of three‐phase faults on the 230 kV lines between Bay d’Espoir (BDE),
SOP, and the Avalon Peninsula. Anlysis indicates that the system response is a function of power flow
on 230 kV lines at BDE, namely TL202, TL206 and TL267. While the BDE three‐phase fault is excluded
from Transmission Planning Criteria, three‐phase faults at Sunnyside (SSD) and Western Avalon (WAV)
must meet criteria. A prelimary investigation of operating limits was performed and these limits will be
confirmed during the final Stage 4 operational studies.
1) LIL in‐service
The preliminary analysis indicates that flow in the BDE to Avalon Peninsula corridor can be restricted to
avoid instability from a three‐phase fault without impacting the capacity of the transmission system to
meet forecasted peak loads when the LIL is in‐service as a bipole or as a monopole.
2) LIL out‐of‐service
If the LIL is out‐of‐service, peak Island demand cannot be served. Flow in the BDE to Avalon Peninsula
corridor is restricted to avoid customer impact for a 3PF on TL202, TL206 or TL267. With the LIL out of
service, the maximum Island demand that can be served is around 1200 MW if the 3PF at BDE is
considered. Increased transfer limits are possible if consideration of the BDE 3PF location is relaxed.
In order to be capable of serving higher Island demand without a stability issue under a three‐phase
fault scenario on TL202, TL206 or TL267 with the LIL out of service, it is likely that either new generation
would be required on the Avalon peninsula, that dynamic reactive power support would be required
near Sunnyside, or that new AC transmission eastward out of BDE would be needed in order to transfer
more generation from the west of the Island to the Avalon Peninsula.
9.1.2 Loss of Largest Unit with the IIS After retirement of the Holyrood generating units, BDE Unit 7 at 154.4 MW is the largest generator on
the Island. Frequency should remain above 59 Hz for loss of BDE Unit 7 and UFLS should be avoided.
Table 9‐1 summarizes the LIL reserve requirements to ensure that loss of the largest generator meets
the 59 Hz criteria and avoids UFLS.
Table 9-1. LIL reserve requirements for loss of largest generator ML Frequency Controller Reserve required on LIL
In‐service None
Out‐of‐service 54 MW to 130 MW, depending on system conditions
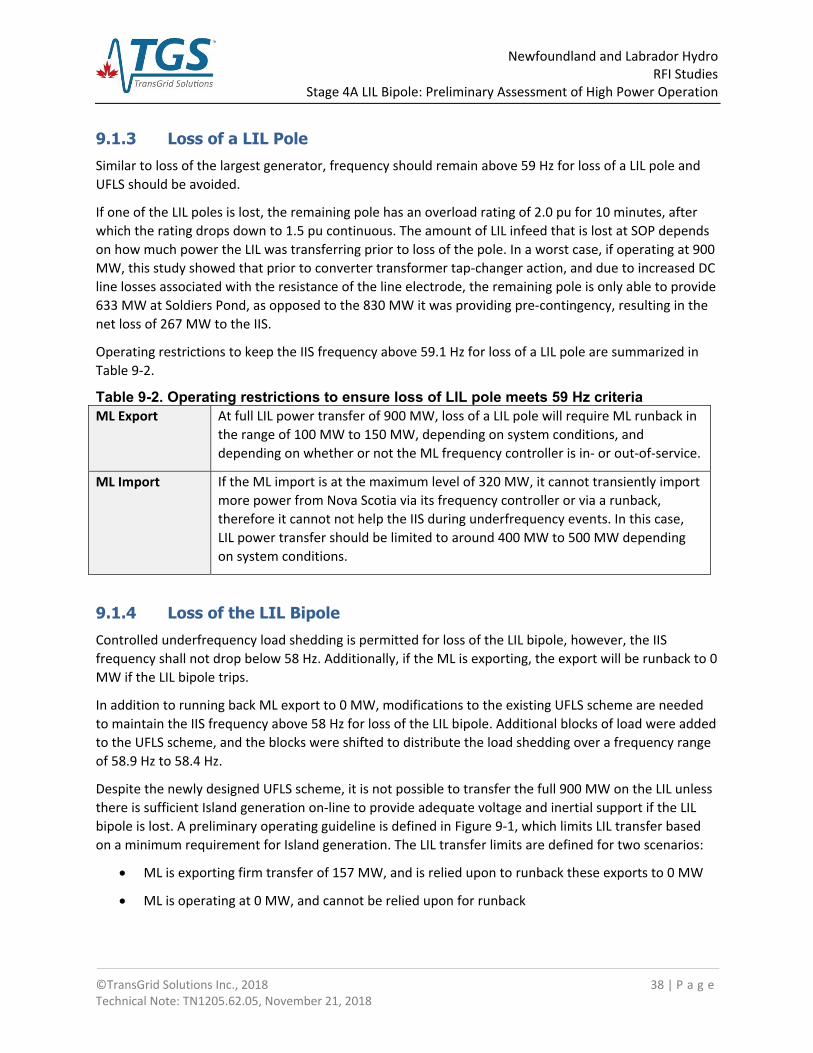
Newfoundland and Labrador Hydro RFI Studies
Stage 4A LIL Bipole: Preliminary Assessment of High Power Operation
©TransGrid Solutions Inc., 2018 38 | P a g e Technical Note: TN1205.62.05, November 21, 2018
9.1.3 Loss of a LIL Pole Similar to loss of the largest generator, frequency should remain above 59 Hz for loss of a LIL pole and
UFLS should be avoided.
If one of the LIL poles is lost, the remaining pole has an overload rating of 2.0 pu for 10 minutes, after
which the rating drops down to 1.5 pu continuous. The amount of LIL infeed that is lost at SOP depends
on how much power the LIL was transferring prior to loss of the pole. In a worst case, if operating at 900
MW, this study showed that prior to converter transformer tap‐changer action, and due to increased DC
line losses associated with the resistance of the line electrode, the remaining pole is only able to provide
633 MW at Soldiers Pond, as opposed to the 830 MW it was providing pre‐contingency, resulting in the
net loss of 267 MW to the IIS.
Operating restrictions to keep the IIS frequency above 59.1 Hz for loss of a LIL pole are summarized in
Table 9‐2.
Table 9-2. Operating restrictions to ensure loss of LIL pole meets 59 Hz criteria ML Export At full LIL power transfer of 900 MW, loss of a LIL pole will require ML runback in
the range of 100 MW to 150 MW, depending on system conditions, and
depending on whether or not the ML frequency controller is in‐ or out‐of‐service.
ML Import If the ML import is at the maximum level of 320 MW, it cannot transiently import
more power from Nova Scotia via its frequency controller or via a runback,
therefore it cannot not help the IIS during underfrequency events. In this case,
LIL power transfer should be limited to around 400 MW to 500 MW depending
on system conditions.
9.1.4 Loss of the LIL Bipole Controlled underfrequency load shedding is permitted for loss of the LIL bipole, however, the IIS
frequency shall not drop below 58 Hz. Additionally, if the ML is exporting, the export will be runback to 0
MW if the LIL bipole trips.
In addition to running back ML export to 0 MW, modifications to the existing UFLS scheme are needed
to maintain the IIS frequency above 58 Hz for loss of the LIL bipole. Additional blocks of load were added
to the UFLS scheme, and the blocks were shifted to distribute the load shedding over a frequency range
of 58.9 Hz to 58.4 Hz.
Despite the newly designed UFLS scheme, it is not possible to transfer the full 900 MW on the LIL unless
there is sufficient Island generation on‐line to provide adequate voltage and inertial support if the LIL
bipole is lost. A preliminary operating guideline is defined in Figure 9‐1, which limits LIL transfer based
on a minimum requirement for Island generation. The LIL transfer limits are defined for two scenarios:
ML is exporting firm transfer of 157 MW, and is relied upon to runback these exports to 0 MW
ML is operating at 0 MW, and cannot be relied upon for runback

Newfoundland and Labrador Hydro RFI Studies
Stage 4A LIL Bipole: Preliminary Assessment of High Power Operation
©TransGrid Solutions Inc., 2018 39 | P a g e Technical Note: TN1205.62.05, November 21, 2018
Figure 9-1. LIL Transfer limits vs. Island Generation Blue: ML @ 157 MW export Orange: ML @ 0 MW
In addition to the LIL transfer limits shown in Figure 9‐1, other conclusions include:
Instability can arise in cases when there is a high power flow from BDE to the Avalon Peninsula.
Operation of the HRD GT during peak load conditions is required to prevent system instability if
the LIL bipole is lost.
The Come‐By‐Chance capacitor banks should be in‐service when the power flow eastward from
BDE towards SOP is high to help support the voltage if the LIL bipole is lost. Keeping the pre‐
contingency voltage near Sunnyside as high as possible (within criteria) improves the system
response to the worst case contingencies, including 3PF on TL202, TL206 and TL267 that were
discussed in Section 1.2.1.
9.1.5 LIL Temporary Bipole Outage According to Transmission Planning Criteria, a temporary bipole outage should not cause the IIS
frequency to drop below 59 Hz and UFLS should be avoided.
Two LIL bipole outage durations were studied under worst case system conditions21:
1. Maximum outage time to ensure IIS frequency stays above 59 Hz and UFLS is avoided
2. Outage time by which all blocks of load will have been shed
21 Case HP27 was found to be the worst case for loss of LIL bipole.
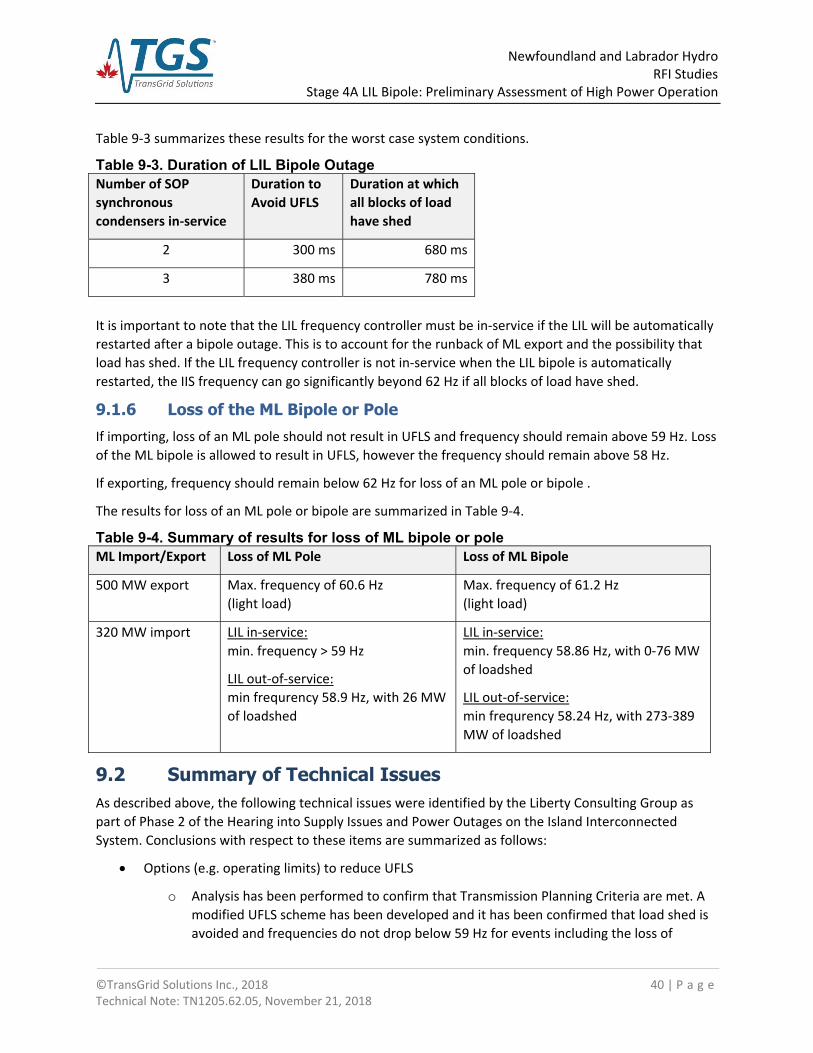
Newfoundland and Labrador Hydro RFI Studies
Stage 4A LIL Bipole: Preliminary Assessment of High Power Operation
©TransGrid Solutions Inc., 2018 40 | P a g e Technical Note: TN1205.62.05, November 21, 2018
Table 9‐3 summarizes these results for the worst case system conditions.
Table 9-3. Duration of LIL Bipole Outage Number of SOP
synchronous
condensers in‐service
Duration to
Avoid UFLS
Duration at which
all blocks of load
have shed
2 300 ms 680 ms
3 380 ms 780 ms
It is important to note that the LIL frequency controller must be in‐service if the LIL will be automatically
restarted after a bipole outage. This is to account for the runback of ML export and the possibility that
load has shed. If the LIL frequency controller is not in‐service when the LIL bipole is automatically
restarted, the IIS frequency can go significantly beyond 62 Hz if all blocks of load have shed.
9.1.6 Loss of the ML Bipole or Pole If importing, loss of an ML pole should not result in UFLS and frequency should remain above 59 Hz. Loss
of the ML bipole is allowed to result in UFLS, however the frequency should remain above 58 Hz.
If exporting, frequency should remain below 62 Hz for loss of an ML pole or bipole .
The results for loss of an ML pole or bipole are summarized in Table 9‐4.
Table 9-4. Summary of results for loss of ML bipole or pole ML Import/Export Loss of ML Pole Loss of ML Bipole
500 MW export Max. frequency of 60.6 Hz
(light load)
Max. frequency of 61.2 Hz
(light load)
320 MW import LIL in‐service:
min. frequency > 59 Hz
LIL out‐of‐service:
min frequrency 58.9 Hz, with 26 MW
of loadshed
LIL in‐service:
min. frequency 58.86 Hz, with 0‐76 MW
of loadshed
LIL out‐of‐service:
min frequrency 58.24 Hz, with 273‐389
MW of loadshed
9.2 Summary of Technical Issues As described above, the following technical issues were identified by the Liberty Consulting Group as
part of Phase 2 of the Hearing into Supply Issues and Power Outages on the Island Interconnected
System. Conclusions with respect to these items are summarized as follows:
Options (e.g. operating limits) to reduce UFLS
o Analysis has been performed to confirm that Transmission Planning Criteria are met. A
modified UFLS scheme has been developed and it has been confirmed that load shed is
avoided and frequencies do not drop below 59 Hz for events including the loss of

Newfoundland and Labrador Hydro RFI Studies
Stage 4A LIL Bipole: Preliminary Assessment of High Power Operation
©TransGrid Solutions Inc., 2018 41 | P a g e Technical Note: TN1205.62.05, November 21, 2018
generating units, the permanent loss of an HVdc pole, and for the temporary loss of a
bipole. Preliminary operating limits have been identified to ensure that UFLS is avoided
in operating conditions when HVdc links or frequency controllers are not in service.
These limits will be fully developed as part of the final phase of the operating studies.
Re‐strikes on the LIL‐OHL
o As summarized in Section 7.2, an analysis was performed to assess temporary LIL bipole
outages . It was found that UFLS is avoided if the LIL is restarted within 300 ms. This
limitation assumes that the ML frequency controller is in place and 157 MW of ML
export is being curtailed. Operating limits for the LIL will be developed to ensure that
UFLS does not occur if the ML frequency controller is not in service or if export is
reduced.
o The LIL frequency controller must be in‐service if the LIL will be automatically restarted
after a bipole outage. This is to account for the runback of ML export and the possibility
that load has shed before the LIL is successfully restarted. If the LIL frequency controller
is not in‐service when the LIL bipole is automatically restarted, the IIS frequency can go
significantly beyond 62 Hz if all blocks of load have shed.
ML‐LIL interaction studies
o The coordinated runbacks of the ML for loss of a LIL pole or the LIL bipole were studied,
as described above. It has been confirmed that UFLS is avoided under normal operation.
Preliminary operating limits have been identified to ensure that UFLS is avoided in
operating conditions when HVdc links or frequency controllers are not in service. These
limits will be fully developed as part of the final phase of the operating studies.
Bay d’Espoir instability issues
o Analysis was performed to assess the impact of a 3PF at BDE. It was found that
instability and transient undervoltage conditions for this event are a function of the
eastward flow from BDE to the Avalon Peninsula. With the LIL in service, instability
resulting from the 3PF at BDE can be avoided by limiting the flow in this corridor.
Analysis was also performed to identify maximum limits that may be transferred in this
corridor in the event of a LIL bipole outage.
ML frequency controller study
o The analyses described above include the operation of the ML frequency controller in its
current configuration. This is defined by a 0.5 Hz deadband and a capacity limit of +/‐
100 MW. These settings were the basis for the analysis presented in this report and
were found be acceptable for high power operation.
IIS performance with ML in and out of service
o As described above, preliminary analysis has been performed to assess operating limits
to the LIL the event of an outage to the ML. Reserve requirements for the LIL have also
been identified to ensure that the loss of the largest generator on the Island does not
result in UFLS in the event of an ML outage.

Newfoundland and Labrador Hydro RFI Studies
Stage 4A LIL Bipole: Preliminary Assessment of High Power Operation
©TransGrid Solutions Inc., 2018 42 | P a g e Technical Note: TN1205.62.05, November 21, 2018
Soldiers Pond site for 4th high inertia synchronous condenser
o On the basis of the above, a fourth high inertia synchronous condenser at Soldiers Pond
is not required in the near term. Study results indicate that instability resulting from the
3PF at BDE can be avoided by applying operational limits on the power flow from BDE to
the Avalon Peninsula without impacting the ability to meet peak loads. It has also been
found that the system can withstand a temporary bipole outage of up to 300 ms before
the occurrence of UFLS. Further, it has been confimed that stable system operation can
be achieved for a permanent bipole fault with a revised UFLS scheme. Based on the
findings of this report, effective system reinforcements would involve the addition of
generation on the Avalon Peninsula rather than a high inertia synchronous condenser.
Such additions would help to offload power flow from BDE to the Avalon Peninsula in
the event that LIL capacity is limited. This input will be considered as part of Hydro’s
ongoing Generation Planning review, which is expected to be completed in late 2018.
9.3 Next Steps The following studies are the next phases of the Stage 4 LIL bipole studies being performed:
1. Stage 4b ‐ PSS tuning study for all generators in the IIS
This study is nearing completion, and will determine parameters for the power system
stabilizers (PSS) for all of the generators in the IIS in order to improve the system’s damping.
2. Stage 4c ‐ Labrador Power Transfer study
This study is currently underway and will include an operational review and will define the
maximum power transfer limits between Muskrat Falls and Churchill Falls on the two 315 kV ac
lines.
3. Stage 4d – Full operational studies
Once the boundaries of the study cases have been determined by earlier Stage 4 studies (4a
through 4c), the final set of base cases can be created and the full steady state and dynamic
analysis will be performed on the system to ensure the performance of the Labrador and IIS
systems are within criteria, and to define any operating guidelines and/or further HVDC run‐
backs.
Appendix 1 Revised UFLS Scheme

/*********************************************************************** / NLH Underfrequency Load Shedding / Burgeo load shed at 58.8 Hz/ St. Albans load shed at 58.6 Hz
/ TL226 loads shed at 58.2 Hz / TL220 loads shed at 58.1 Hz//*********************************************************************** 195178,'LDSHBL',1,58.9,0.05,1.0,0.0,0.0,0.0,0.0,0.0,0.0,0.0833/ 195432,'LDSHBL',1,58.9,0.05,1.0,0.0,0.0,0.0,0.0,0.0,0.0,0.0833/ 195409,'LDSHBL',1,58.9,0.05,1.0,0.0,0.0,0.0,0.0,0.0,0.0,0.0833/ 195407,'LDSHBL',1,58.9,0.05,1.0,0.0,0.0,0.0,0.0,0.0,0.0,0.0833/ 195408,'LDSHBL',1,58.9,0.05,1.0,0.0,0.0,0.0,0.0,0.0,0.0,0.0833/ 195435,'LDSHBL',1,58.9,0.05,1.0,0.0,0.0,0.0,0.0,0.0,0.0,0.0833/ 195436,'LDSHBL',1,58.9,0.05,1.0,0.0,0.0,0.0,0.0,0.0,0.0,0.0833/ 195437,'LDSHBL',1,58.9,0.05,1.0,0.0,0.0,0.0,0.0,0.0,0.0,0.0833/
/*********************************************************************** / NP Underfrequency Load Shedding
/***********************************************************************/ 59.0 Hz 15 sec time delay block ‐ KEN1,GLV ‐ 54.9 + 8.9 196565,'LDSHBL',1,59.0,15.0167,1.0,0.0,0.0,0.0,0.0,0.0,0.0,0.1/ 195135,'LDSHBL',1,59.0,15.0167,1.000,0.0,0.0,0.0,0.0,0.0,0.0,0.1/
/ 58.8 Hz block ‐ BLK,GRH ‐ 39.5 + 15.2 196546,'LDSHBL',1,58.9,0.05,1.0,0.0,0.0,0.0,0.0,0.0,0.0,0.1/ 196221,'LDSHBL',1,58.9,0.05,1.0,0.0,0.0,0.0,0.0,0.0,0.0,0.1/
/ 58.6 Hz block ‐ MDR,KBR1 ‐ 90.2 + 39.7 (*MATCHES DFDT BLOCK) 195624,'LDSHBL',1,58.7,0.05,0.696,0.0,0.0,0.0,0.0,0.0,0.0,0.1/ 196570,'LDSHBL',1,58.7,0.05,0.600,0.0,0.0,0.0,0.0,0.0,0.0,0.1/
/ 58.4 Hz block ‐ CLV,SJM1 ‐ 57.9 + 49.7 (*SAME AS DFDT BLOCK) 195144,'LDSHBL',1,58.6,0.05,0.885,0.0,0.0,0.0,0.0,0.0,0.0,0.1/ 196568,'LDSHBL',1,58.6,0.05,1.0,0.0,0.0,0.0,0.0,0.0,0.0,0.1/
/ 58.2 Hz block ‐ GFS,RRD ‐ 0.6 + 40.6 (*SAME AS DFDT BLOCK) 195126,'LDSHBL',1,58.6,0.05,1.0,0.0,0.0,0.0,0.0,0.0,0.0,0.1/ 196572,'LDSHBL',1,58.6,0.05,1.0,0.0,0.0,0.0,0.0,0.0,0.0,0.1/
/ 58.1 Hz block ‐ GAN, VIR1, HWD1 ‐ 23.4 + 70.1 + 53.3 195132,'LDSHBL',1,58.6,0.05,1.0,0.0,0.0,0.0,0.0,0.0,0.0,0.1/ 196573,'LDSHBL',1,58.5,0.05,0.787,0.0,0.0,0.0,0.0,0.0,0.0,0.1/ 195655,'LDSHBL',1,58.5,0.05,1.0,0.0,0.0,0.0,0.0,0.0,0.0,0.1/
/ 58.0 Hz block ‐ COB, BRB, BCV, GOU, KEL, SLA ‐ 28.6 + 24.5 + 27.7 + 27.2 + 23.6 + 56.7 195130,'LDSHBL',1,58.5,0.05,1.0,0.0,0.0,0.0,0.0,0.0,0.0,0.1/ 195167,'LDSHBL',1,58.5,0.05,1.0,0.0,0.0,0.0,0.0,0.0,0.0,0.1/ 196562,'LDSHBL',1,58.4,0.05,1.0,0.0,0.0,0.0,0.0,0.0,0.0,0.1/ 196564,'LDSHBL',1,58.4,0.05,1.0,0.0,0.0,0.0,0.0,0.0,0.0,0.1/ 196560,'LDSHBL',1,58.4,0.05,1.0,0.0,0.0,0.0,0.0,0.0,0.0,0.1/ 196567,'LDSHBL',1,58.4,0.05,1.0,0.0,0.0,0.0,0.0,0.0,0.0,0.1/// Additional Load Shedding ‐ 11.1 + 38.4 + 23.5 + 17.3 + 49.1 + 63.7 + 7.0 + 10.9 + 12.4 + 6.9 + 12.5 195654,'LDSHBL',1,58.8,0.05,1.0,0.0,0.0,0.0,0.0,0.0,0.0,0.1/ 196574,'LDSHBL',1,58.8,0.05,1.0,0.0,0.0,0.0,0.0,0.0,0.0,0.1/ 196571,'LDSHBL',1,58.8,0.05,1.0,0.0,0.0,0.0,0.0,0.0,0.0,0.1/ 196569,'LDSHBL',1,58.6,0.05,1.0,0.0,0.0,0.0,0.0,0.0,0.0,0.1/ 196566,'LDSHBL',1,58.6,0.05,1.0,0.0,0.0,0.0,0.0,0.0,0.0,0.1/ 196563,'LDSHBL',1,58.6,0.05,1.0,0.0,0.0,0.0,0.0,0.0,0.0,0.1/ 195450,'LDSHBL',1,58.5,0.05,1.0,0.0,0.0,0.0,0.0,0.0,0.0,0.1/ 196559,'LDSHBL',1,58.5,0.05,1.0,0.0,0.0,0.0,0.0,0.0,0.0,0.1/ 195173,'LDSHBL',1,58.5,0.05,1.0,0.0,0.0,0.0,0.0,0.0,0.0,0.1/ 195171,'LDSHBL',1,58.4,0.05,1.0,0.0,0.0,0.0,0.0,0.0,0.0,0.1/ 195169,'LDSHBL',1,58.4,0.05,1.0,0.0,0.0,0.0,0.0,0.0,0.0,0.1/

Engineering Support Services for: RFI Studies Newfoundland and Labrador Hydro
Attention: Mr. Rob Collett
Stage 4B: Power System Stabilizer Design
Technical Note: TN1205.65.01 Date of issue: November 8, 2018 Prepared By: TransGrid Solutions Inc. 100-78 Innovation Dr. Winnipeg, MB R3T 6C2 CANADA

Newfoundland and Labrador Hydro RFI Studies
Stage 4B: Power System Stabilizer Design
©TransGrid Solutions Inc., 2018 i | P a g e Technical Note: TN1205.65.01, November 8, 2018
Disclaimer This technical note was prepared by TransGrid Solutions Inc. (“TGS”), whose responsibility is limited to
the scope of work as shown herein. TGS disclaims responsibility for the work of others incorporated or
referenced herein. This technical note has been prepared exclusively for Newfoundland and Labrador
Hydro and the project identified herein and must not be reused or modified without the prior written
authorization of TGS.
Revisions Project Name: RFI Studies
Document Title: Stage 4B: Power System Stabilizer Design
Document Type: Technical Note
Document No.: TN1205.65.01
Last Action Date: November 8, 2018
Rev.
No.
Status Prepared By Checked By Date Comments
00 IFC C. Karawita R. Ostash October 26,
2018
Issued for comments
01 ABC C. Karawita R. Ostash November 8,
2018
Updated based on
comments received from
Hydro.
Legend of Document Status:
Approved by Client ABC
Draft for Comments DFC
Issued for Comments IFC
Issued for Approval IFA
Issued for Information IFI
Returned for Correction RFC
Approval not Required ANR

Newfoundland and Labrador Hydro RFI Studies
Stage 4B: Power System Stabilizer Design
©TransGrid Solutions Inc., 2018 ii | P a g e Technical Note: TN1205.65.01, November 8, 2018
Table of Contents 1. Executive Summary ...................................................................................................................... 1
1.1 Conclusions ................................................................................................................................... 1
2. Introduction ................................................................................................................................. 3 3. Study Methodology ...................................................................................................................... 4
3.1 Small Signal Stability Tool: TGSSR ................................................................................................. 4
3.2 Small Signal Stability Analysis using TGSSR ................................................................................... 5
4. Study Models and Criteria ............................................................................................................ 7
4.1 Power Flow Cases ......................................................................................................................... 7
4.2 Contingencies ................................................................................................................................ 7
4.3 Criteria ........................................................................................................................................... 8
5. PSS Design .................................................................................................................................... 9
5.1 Step 1 ‐ Initial Small Signal Stability Assessment .......................................................................... 9
5.2 Step 2 ‐ PSS Design for Local‐Area Oscillation Modes ................................................................ 11
5.3 Step 3 – Small Signal Stability Assessment with PSSes tuned for Local‐Area Oscillations .......... 17
5.4 Step 4 – Final Small Signal Stability Assessment with PSSes ....................................................... 19
6. Performance Verification............................................................................................................ 20 7. Performance of Muskrat Fall Generators .................................................................................... 25 8. Conclusions ................................................................................................................................ 27
8.1 IIS Generators ............................................................................................................................. 27
8.2 Muskrat Falls Generators ............................................................................................................ 27
9. References ................................................................................................................................. 28
Appendices
Appendix 1 – PSS Parameters (Preliminary Values)

Newfoundland and Labrador Hydro RFI Studies
Stage 4B: Power System Stabilizer Design
©TransGrid Solutions Inc., 2018 1 | P a g e Technical Note: TN1205.65.01, November 8, 2018
1. Executive Summary Stage 4 is the final stage of operational studies that are being performed to determine the system
operating limits of the Newfoundland and Labrador Hydro (Hydro) Island Interconnected System (IIS) for
the point in time when the 900 MW LIL bipole, the Muskrat Falls (MFA) generators, the Soldiers Pond
(SOP) synchronous condensers and the Maritime Link (ML) are in‐service. The Holyrood thermal
generators, the Stephenville Gas Turbine, and the Hardwoods Gas Turbine are no longer in‐service, and
Holyrood Unit 3 is operating as a synchronous condenser.
Stage 4A1 performed a preliminary assessment of the IIS at high power operation of the LIL bipole.
Stage 4B, this study, performs a small signal stability assessment of the IIS. This report investigates the
small signal stability of the IIS and the need for tuning of power system stabilizers. The following
generating stations were evaluated to determine the need for stabilizer tuning:
i. Bay d'Espoir (BDE) units 1 to 7
ii. Cat Arm (CAT) units 1 and 2
iii. Upper Salmon (USL)
iv. Granite Canal (GCL)
v. Holyrood (HRD) Unit 3 synchronous condenser
vi. Holyrood (HRD) GT
vii. Hardwoods (HWD) synchronous condenser
viii. Soldiers Pond (SOP) synchronous condensers
The Muskrat Falls generator power system stabilizers are also evaluated in this report.
1.1 Conclusions 1.1.1 Interconnected Island System Generators The need for power system stabilizers (PSSes) was evaluated over various loading conditions and for
critical contingencies in the IIS. As a result of the small signal stability assessment, PSSes were proposed
for the following generating stations to improve the electromechanical oscillation damping in the
system:
(1) Cat Arm units 1 and 2
(2) Upper Salmon
(3) Granite Canal
(4) Bay d'Espoir units 1‐7 (for inter‐area oscillation damping)
1 TN1205.62.04, “Stage 4A LIL Bipole: Preliminary Assessment of High Power Operation”, TransGrid Solutions, September 13, 2018.

Newfoundland and Labrador Hydro RFI Studies
Stage 4B: Power System Stabilizer Design
©TransGrid Solutions Inc., 2018 2 | P a g e Technical Note: TN1205.65.01, November 8, 2018
The performance of the proposed PSSes were evaluated in PSSE for system intact and critical
contingencies. It was observed that the PSSes provide better damping compared to the cases without
PSSes. Furthermore, under light load conditions, PSSes can help to avoid instabilities in the system.
It should be noted that small signal stability assessment is a linear analysis technique and, therefore, the
non‐linear behaviors, such as the impact of frequency controllers that have dead‐bands, are not
considered in the analysis. If the system is well damped, the small signal stability analysis results
typically match well with the actual system behavior as simulated in PSSE. However, if the damping of
certain oscillations is low, other non‐linear controllers may have a significant impact (positive or
negative) on these oscillations. After the PSSes were added to the generators listed earlier, the small
signal stability analysis showed very good damping of the electromechanical oscillations in the IIS.
Therefore, such impact of the other non‐linear controllers are not expected.
It should also be noted that the validity of the powerflow scenarios under contingency conditions (N‐1
and N‐2) needs to be further evaluated in the final Stage 4 operational studies considering the steady
state and dynamic performance. Therefore, some of the operating points considered in this small signal
stability analysis may not be practical.
In summary, the PSS parameters provided in this report should be considered as preliminary values for
use and evaluation in the final Stage 4 operational study, and it is recommended to further evaluate the
performance of the PSSes during the final Stage 4 operational study.
1.1.2 Muskrat Falls Generators During the Stage 4c operational study, which investigates power transfer capability between Muskrat
Falls and Churchill Falls, it was observed that the original power system stabilizer models of the Muskrat
Falls generators are not effective under certain operating conditions when one of the two 315 kV lines
between Churchill Falls and Muskrat Falls experiences a three‐phase fault. Therefore, the Muskrat Falls
PSSes were re‐tuned to obtain acceptable damping under those operating conditions.
Newfoundland and Labrador Hydro RFI Studies
Stage 4B: Power System Stabilizer Design
©TransGrid Solutions Inc., 2018 3 | P a g e Technical Note: TN1205.65.01, November 8, 2018
2. Introduction Stage 4 is the final stage of operational studies that are being performed to determine the system
operating limits of the Newfoundland and Labrador Hydro (Hydro) Island Interconnected System (IIS) for
the point in time when the 900 MW LIL bipole, the Muskrat Falls (MFA) generators, the Soldiers Pond
(SOP) synchronous condensers and the Maritime Link (ML) are in‐service. The Holyrood thermal
generators, the Stephenville Gas Turbine, and the Hardwoods Gas Turbine are no longer in‐service, and
Holyrood Unit 3 is operating as a synchronous condenser.
NLH requested to investigate the small signal stability of the IIS and the need for tuning of power system
stabilizers. The following generating stations need to be evaluated to determine the need for stabilizer
tuning:
i. Bay d'Espoir (BDE) units 1 to 7
ii. Cat Arm (CAT) units 1 and 2
iii. Upper Salmon (USL)
iv. Granite Canal (GCL)
v. Holyrood (HRD) Unit 3 synchronous condenser
vi. Holyrood (HRD) GT
vii. Hardwoods (HWD) synchronous condenser
viii. Soldiers Pond (SOP) synchronous condensers
The Muskrat Falls generator PSSes are also evaluated in this report.

Newfoundland and Labrador Hydro RFI Studies
Stage 4B: Power System Stabilizer Design
©TransGrid Solutions Inc., 2018 4 | P a g e Technical Note: TN1205.65.01, November 8, 2018
3. Study Methodology The electromechanical oscillations of the IIS were identified through a small signal stability assessment
using TGS’s small signal stability program: “TGSSR”.
3.1 Small Signal Stability Tool: TGSSR TGSSR uses dynamic phasor based small signal stability analysis (frequency domain) in order to perform
an in‐depth analysis of the small signal stability issues in power systems including electromechanical
oscillations and sub‐synchronous oscillations. This method provides insight into the oscillation
phenomena and enables the systematic design of devices and controllers to eliminate the problems.
TGSSR is capable of analyzing oscillation phenomena such as:
Electromechanical oscillations (local and inter‐area oscillations)
Generator‐turbine – Series capacitor sub synchronous resonance (SSR)
Generator‐turbine – HVdc torsional interactions (SSTI)
Wind turbine – Series capacitor sub‐synchronous resonances/interactions (SSCI)
HVdc control interactions and DC resonance issues
Multi‐in‐feed HVdc interactions
All other sub‐synchronous frequency interactions in power systems (Interactions of FACTS
devices, Network resonances, etc.)
Power system stabilizer (PSS) and sub‐synchronous damping controller tuning
Optimization of the locations of damping controllers
The main difference between TGSSR and conventional small signal stability analysis programs is the
inclusion of the ac network dynamics and the generator stator dynamics. In addition to the generic
dynamic models provided in PSSE, TGS has developed detailed models of HVDC, VSC, FACTS devices and
wind power plants. These models have been validated against detailed EMT models. A large number of
articles related to TGSSR have been published by TGS personnel [1] [2] [3] [4] [5] [6] [7] [8] and more
than ten projects have been recently completed using TGSSR.
The inputs to TGSSR are the power flow and dynamic data of the power system. The analysis is
performed as follows:
The initial dynamic network model is created by combining the dynamic phasor based linearized
models of the transmission lines, series capacitors, shunt capacitors/reactors and dynamic loads
[5].
The linearized models of the dynamic devices such as generators, HVDC, VSC, FACTS devices and
wind power plants are obtained and then combined with the dynamic network model.
TGSSR uses Eigen value analysis techniques (small signal stability assessment) to analyze the oscillations
in the entire power system.

Newfoundland and Labrador Hydro RFI Studies
Stage 4B: Power System Stabilizer Design
©TransGrid Solutions Inc., 2018 5 | P a g e Technical Note: TN1205.65.01, November 8, 2018
3.2 Small Signal Stability Analysis using TGSSR The Eigen value analysis technique is performed as follows:
TGSSR creates the linearized models of all the dynamic devices around the steady state operating point specified by the power flow cases. Further, TGSSR combines the dynamic phasor model of the ac network to create the state space small signal stability model. More information on modeling can be found in [9]. The state space model is then analyzed using eigenvalue analysis to determine the oscillatory modes and their damping.
o A real eigenvalue corresponds to an aperiodic (non‐oscillatory) mode. If the eigenvalue is negative the mode is a decaying mode and if it is positive, the mode is unstable (aperiodic instability).
o A complex conjugate pair of eigenvalues corresponds to an oscillatory mode. If the eigenvalue pair is, 𝜆 𝜎 𝑗𝜔, the frequency of oscillation is given by,
𝑓 𝜔 / 2𝜋
The damping ratio is given by,
𝜁 𝜎/|𝜆|
If the real part of the eigenvalues is negative (i.e. damping ratio is positive), the mode is stable.
The magnitude of the damping ratio determines the rate of decay of the amplitude of the
oscillation. Usually, the damping ratio is given as a percentage value. In this study, only the
electromechanical oscillatory modes (<3Hz) of the are considered. The rule of thumb is that
damping of 5% is sufficient for the electromechanical modes.
The oscillation mode characteristics are analyzed using the properties of the eigenvectors.
o The participation factors are obtained by multiplying the relevant elements of the right eigenvector and the left eigenvector. The elements of a participation factor vector are dimensionless and the sum of the elements is unity. Therefore, the participation factor (elements) can be used as an index to compare the relative participation of the state variables for a particular mode of oscillation. Since the participation factors of an oscillatory mode are complex numbers, the magnitudes of the participation factors are used for the comparisons. Note that the participation factors give an indication of the contribution of the devices in an oscillation, however precise analysis of the contribution is not possible. Simply, the devices with higher participation factors have a higher contribution to the oscillation. In TGSSR the participation factors are scaled such that the highest participating state variable has a participation factor of 1.
o The right eigenvector of a particular mode provides the mode shape, which shows the relative phasors of the state variables when that mode is excited. Since the units and the scaling of the state variables may differ, the magnitudes of the elements cannot be compared against each other. Therefore, only the phase angles (mode shapes) are used to determine the relative phases of the state variables for a particular mode of

Newfoundland and Labrador Hydro RFI Studies
Stage 4B: Power System Stabilizer Design
©TransGrid Solutions Inc., 2018 6 | P a g e Technical Note: TN1205.65.01, November 8, 2018
oscillation. For example, the angles of mode shapes can be used to determine whether two state variables oscillate together or against each other in a particular oscillatory mode.
The process is carried out for critical operating conditions such as min‐max generation under system
intact and contingency conditions. More information on eigenvalue analysis can be found in [10].
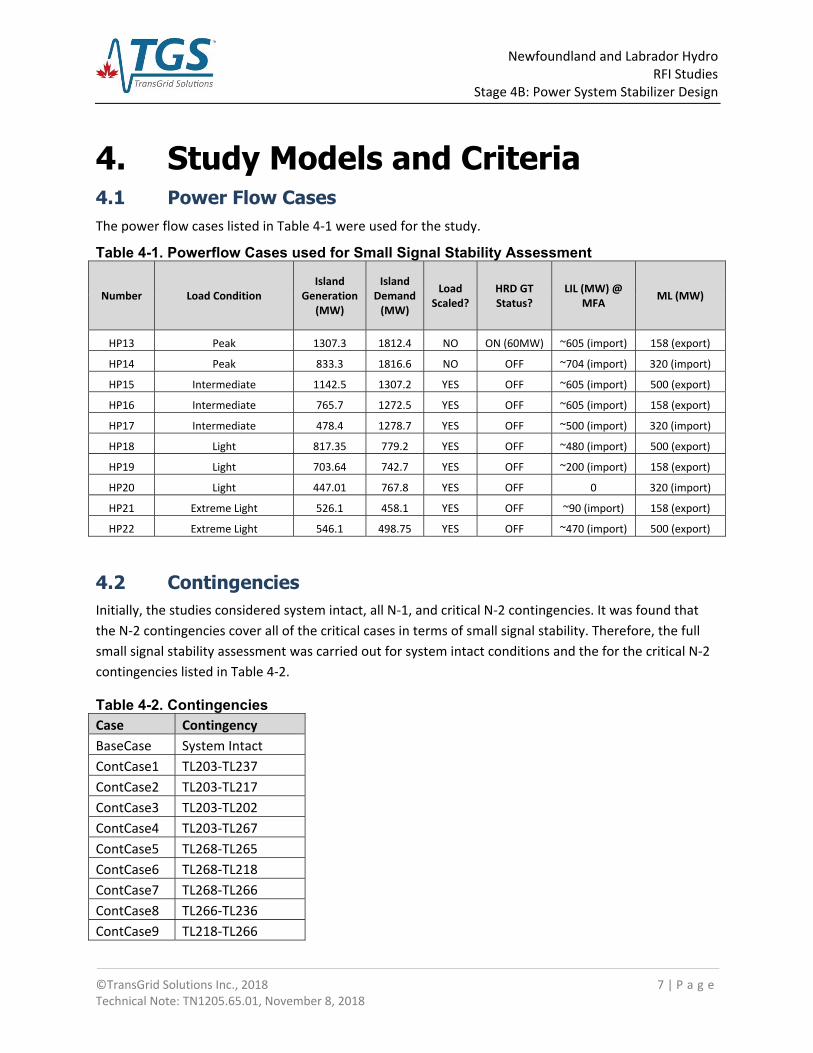
Newfoundland and Labrador Hydro RFI Studies
Stage 4B: Power System Stabilizer Design
©TransGrid Solutions Inc., 2018 7 | P a g e Technical Note: TN1205.65.01, November 8, 2018
4. Study Models and Criteria 4.1 Power Flow Cases The power flow cases listed in Table 4‐1 were used for the study.
Table 4-1. Powerflow Cases used for Small Signal Stability Assessment
Number Load Condition Island
Generation (MW)
Island Demand (MW)
Load Scaled?
HRD GT Status?
LIL (MW) @ MFA
ML (MW)
HP13 Peak 1307.3 1812.4 NO ON (60MW) ~605 (import) 158 (export)
HP14 Peak 833.3 1816.6 NO OFF ~704 (import) 320 (import)
HP15 Intermediate 1142.5 1307.2 YES OFF ~605 (import) 500 (export)
HP16 Intermediate 765.7 1272.5 YES OFF ~605 (import) 158 (export)
HP17 Intermediate 478.4 1278.7 YES OFF ~500 (import) 320 (import)
HP18 Light 817.35 779.2 YES OFF ~480 (import) 500 (export)
HP19 Light 703.64 742.7 YES OFF ~200 (import) 158 (export)
HP20 Light 447.01 767.8 YES OFF 0 320 (import)
HP21 Extreme Light 526.1 458.1 YES OFF ~90 (import) 158 (export)
HP22 Extreme Light 546.1 498.75 YES OFF ~470 (import) 500 (export)
4.2 Contingencies Initially, the studies considered system intact, all N‐1, and critical N‐2 contingencies. It was found that
the N‐2 contingencies cover all of the critical cases in terms of small signal stability. Therefore, the full
small signal stability assessment was carried out for system intact conditions and the for the critical N‐2
contingencies listed in Table 4‐2.
Table 4-2. Contingencies Case Contingency
BaseCase System Intact
ContCase1 TL203‐TL237
ContCase2 TL203‐TL217
ContCase3 TL203‐TL202
ContCase4 TL203‐TL267
ContCase5 TL268‐TL265
ContCase6 TL268‐TL218
ContCase7 TL268‐TL266
ContCase8 TL266‐TL236
ContCase9 TL218‐TL266
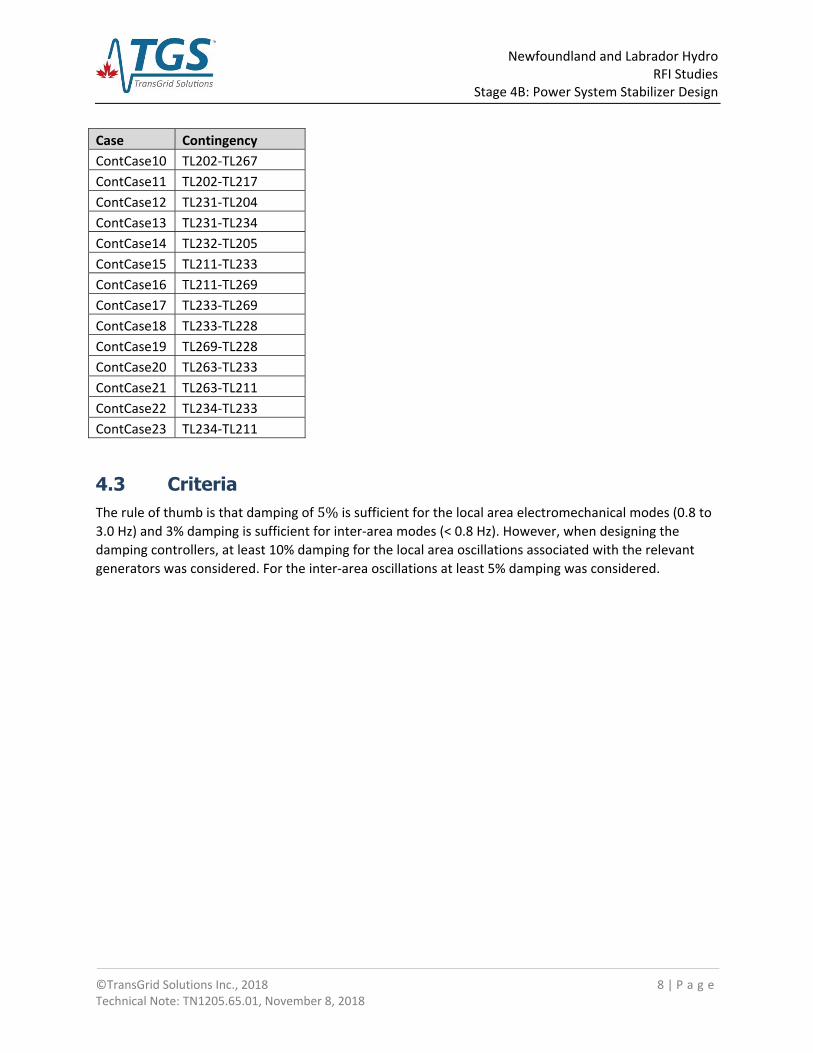
Newfoundland and Labrador Hydro RFI Studies
Stage 4B: Power System Stabilizer Design
©TransGrid Solutions Inc., 2018 8 | P a g e Technical Note: TN1205.65.01, November 8, 2018
Case Contingency
ContCase10 TL202‐TL267
ContCase11 TL202‐TL217
ContCase12 TL231‐TL204
ContCase13 TL231‐TL234
ContCase14 TL232‐TL205
ContCase15 TL211‐TL233
ContCase16 TL211‐TL269
ContCase17 TL233‐TL269
ContCase18 TL233‐TL228
ContCase19 TL269‐TL228
ContCase20 TL263‐TL233
ContCase21 TL263‐TL211
ContCase22 TL234‐TL233
ContCase23 TL234‐TL211
4.3 Criteria The rule of thumb is that damping of 5% is sufficient for the local area electromechanical modes (0.8 to
3.0 Hz) and 3% damping is sufficient for inter‐area modes (< 0.8 Hz). However, when designing the
damping controllers, at least 10% damping for the local area oscillations associated with the relevant
generators was considered. For the inter‐area oscillations at least 5% damping was considered.

Newfoundland and Labrador Hydro RFI Studies
Stage 4B: Power System Stabilizer Design
©TransGrid Solutions Inc., 2018 9 | P a g e Technical Note: TN1205.65.01, November 8, 2018
5. PSS Design The small signal stability of the IIS was first evaluated without PSSes. Then, if low damping was found,
PSS parameters were determined based on the electromechanical modes found to be associated with
each generator.
The analysis was performed using the following steps:
‐ Step 1: Initial small signal stability assessment – to identify critical local area oscillations
‐ Step 2: Design of PSSes for critical local area oscillations
‐ Step 3: Second small signal assessment with PSSes designed to damp out critical local area
oscillations – to identify critical inter‐area oscillations
‐ Step 4: Design of PSSes for critical inter‐area oscillations
‐ Step 2: Final small signal assessment with all PSSes
5.1 Step 1 - Initial Small Signal Stability Assessment The peak power flow case HP13 was initially used to evaluate the small signal stability of the system. As
the first step, the local area electromechanical oscillations associated with the IIS generators were
identified.
5.1.1 Local Oscillations - Bay d'Espoir Generators The local area electromechanical oscillations associated with the Bay d'Espoir generators, along with the
lowest possible damping observed under contingency conditions, are given in Table 5‐1. The generator
local oscillations are well damped and there is no need to add a PSS to damp out these oscillations. The
PSSes for these generators are considered later in the study for damping out inter‐area oscillations.
Table 5-1: Local Oscillations Associated with Bay d'Espoir Generators Lowest damping in Case HP13
Freq (Hz) Damping (%) Contingency
1.25 13.38 TL202‐TL267
1.54 12.42 TL202‐TL267
1.48 20.09 TL202‐TL267
1.42 19.58 TL202‐TL267
1.43 19.60 TL202‐TL267
1.43 19.45 TL202‐TL267
1.63 11.77 TL202‐TL267

Newfoundland and Labrador Hydro RFI Studies
Stage 4B: Power System Stabilizer Design
©TransGrid Solutions Inc., 2018 10 | P a g e Technical Note: TN1205.65.01, November 8, 2018
5.1.2 Local Oscillations - Cat Arm Generators There are two electromechanical oscillation modes associated with the Cat Arm generators as shown in
Table 5‐2. Both of these modes show greater than 5% damping. There is one oscillatory mode at 1.19 Hz
with approximately 6% damping. Although damping of 6% is typically considered to be acceptable since
it is greater than 5 %, there is a benefit to improving this damping because when local oscillations are
well damped, the possibility of inter‐area oscillations occurring is low. Therefore, it was decided to add
PSSes improve the damping of this mode to greater than 10%.
Table 5-2: Local Oscillations Associated with Cat Arm Generators Lowest damping in Case HP13
Freq (Hz) Damping (%) Contingency
1.19 5.95 TL234‐TL233
1.50 12.02 TL211‐TL269
5.1.3 Local Oscillations - Upper Salmon Generator There is one local oscillatory mode at 1.12 Hz associated with the Upper Salmon generator, with
damping of 3.99% following an N‐2 outage of TL234‐TL211 Therefore, it was decided to add a PSS to
improve the damping of this oscillation.
5.1.4 Local Oscillations - Granite Canal Generator The Granite Canal generator contributes to an oscillation at 1.34 Hz, with the lowest damping being
approximately 4.66% following an N‐2 outage of TL263‐TL211. Therefore, it was decided to add a PSS to
improve the damping of this oscillation.
5.1.5 Local Oscillations - Holyrood Unit 3 and GT There are two oscillatory modes associated with Holyrood Unit 3 and the Holyrood GT as shown in Table
5‐3. Both of these modes are well damped and there is no need to add PSSes for these units.
Table 5-3: Local Oscillations Associated with Holyrood Unit 3 and GT Lowest damping in Case HP13
Freq (Hz) Damping (%) Contingency
2.73 13.26 TL202‐TL267
2.08 11.87 TL268‐TL265
5.1.6 Local Oscillations - Solders Pond Synchronous Condensers There is one location oscillation at 1.33 Hz associated with the Solders Pond synchronous condensers,
however the damping is greater than 30% and therefore, PSSes are not required.

Newfoundland and Labrador Hydro RFI Studies
Stage 4B: Power System Stabilizer Design
©TransGrid Solutions Inc., 2018 11 | P a g e Technical Note: TN1205.65.01, November 8, 2018
5.2 Step 2 - PSS Design for Local-Area Oscillation Modes In Step 1 (Section 4.1), poorly damped local‐area oscillations were identified in the following generators:
‐ Cat Arm unit 1 and 2
‐ Upper Salmon unit
‐ Granite Canal unit
In this step, the PSSes were designed for these generators to damp out the identified local‐area
oscillation modes. The designing process is described in the following sub‐sections.
5.2.1 Integral-of-accelerating Power Based Stabilizer (PSS2A/PSS2B) It is common practise to use the integral‐of‐accelerating power (ΔPω) based stabilizers to damp out
electromechanical oscillations of generators. The conceptual design is summarized below.
From the swing equations:
∆𝜔 ∆𝑃 ∆𝑃 𝑑𝑡 (1)
The integral of the mechanical power can be obtained from the above equation as follows:
∆𝑃 𝑑𝑡 2𝐻 ∆𝜔 ∆𝑃 𝑑𝑡 (2)
Based on equation (2), the integral of mechanical power can be recreated from the measurements of
the generator speed and electrical power output. Therefore, the integral of the accelerating power can
be obtained as follows:
∆→
∆ ∆∆𝜔 (3)
This is the basis for the stabilizer models PSS2A and PSS2B. The control block diagram of PSS2A is shown
in Figure 5‐1. Note that the PSS2B stabilizer is very similar and the only difference is that PSS2B has an
additional lead‐lag block (3 instead of 2).
Figure 5-1: PSS2A Block Diagram
Newfoundland and Labrador Hydro RFI Studies
Stage 4B: Power System Stabilizer Design
©TransGrid Solutions Inc., 2018 12 | P a g e Technical Note: TN1205.65.01, November 8, 2018
The generator speed is considered as the first input. The washout time constant (Tw1) is selected to
block the steady state (DC) changes. Typically, Tw1 is in the range of 5 to 20 seconds when considering
electromechanical oscillations. The second washout time constant (Tw2) is also set to the same value
(i.e. two washout stages) to match the delays associated with the second input path. T6 can be used to
model the measuring delays.
The second input is the power output in per unit (pu). The integral of electrical power can be created as
follows:
∆→
∆𝑃 𝑃 (4)
Where
Tw3 = T7 = Tw1
Ks2 = Tw1/(2H)
Ks3 = 1
The second washout block is ignored (i.e. Tw4=0).
By doing this, at point “D” a signal similar to the integral of the mechanical power is created.
In order to minimize the PSS output deviations for rapid mechanical power ramping, a ramp tracking
filter is added as shown in Figure 5‐1. The most common filter coefficients are as follows:
N=1
M=5
T9 = 0.1
T8 = M*T9
At point “E”, a filtered signal proportional to the integral of mechanical power is obtained and the
integral of electrical power signal is then subtracted to obtain a signal proportional to the integral of
accelerating power at point “G”. The required phase compensation and the gain is determined using
small signal stability assessment techniques to determine the lead‐lag time constants and the gain, Ks1.
In this project, PSS2B stabilizers with 3 lead‐lag blocks were used.
5.2.2 Cat Arm PSSes There is a 1.19 Hz oscillation associated with the two units at Cat Arm. The participation factors and the
mode shapes of the generator rotor angles are shown in Figure 5‐2. The Cat Arm generators are the
main contributors. Mode shapes show that the Cat Arm generators are oscillating against the rest of the
system in this mode. The main contributors from the rest of the system are the Upper Salmon, Granite
Canal and Deer Lake units.

Newfoundland and Labrador Hydro RFI Studies
Stage 4B: Power System Stabilizer Design
©TransGrid Solutions Inc., 2018 13 | P a g e Technical Note: TN1205.65.01, November 8, 2018
The PSSes were tuned at the Cat Arm units to improve the damping of these oscillations. For this mode,
a washout time constant of 5s was considered. The PSS2B parameters were selected as follows:
Washout time constants: Tw1 = Tw2 =Tw3 = T7 = 5 s
As described in the above section, Tw4=0
Generator inertia (from PSSE data), H = 4.02 s
Therefore,
Ks2 = Tw3/(2H) = 0.6219
Ks3 = 1
N=1 M=5
T9 = 0.1 s
T8 = M*T9 = 0.5 s
The eigen sensitivities (“residues”) were used to determine the required phase compensation. It was
found that a phase lead of about 55 deg is required to compensate the total phase lag. Therefore, two
lead‐lag blocks, each providing approximately 27.5 deg phase lead, were used. In order to get the
required phase lead at 1.19 Hz:
T1 = T3 = 0.2202 s
T2 = T4 = 0.0808 s
The third lead‐lag block was bypassed (i.e. T5 = T6 = 0)
The frequency characteristics of the overall transfer function of the PSS are shown in Figure 5‐3. The
required gain of the PSS was adjusted by trial and error. Using a gain of 5 (i.e. Ks1=5), the damping of the
oscillation can be increased to 10.7%.
The PSS parameters are given in Appendix‐1.

Newfoundland and Labrador Hydro RFI Studies
Stage 4B: Power System Stabilizer Design
©TransGrid Solutions Inc., 2018 14 | P a g e Technical Note: TN1205.65.01, November 8, 2018
Figure 5-2: Participation Factors and Mode Shapes - 1.19 Hz Mode at Cat Arm

Newfoundland and Labrador Hydro RFI Studies
Stage 4B: Power System Stabilizer Design
©TransGrid Solutions Inc., 2018 15 | P a g e Technical Note: TN1205.65.01, November 8, 2018
Figure 5-3: Frequency Response of Cat Arm PSSes
5.2.3 Upper Salmon PSS There is a 1.12 Hz oscillation associated with the Upper Salmon generator. The participation factors and
the mode shapes of the generator rotor angles are shown in Figure 5‐4 for this mode. The Upper Salmon
generator is the main contributor and there is some contribution of Granite Canal generator. Mode
shapes show that these two generators are oscillating against the rest of the system in this mode.
Based on the Eigen sensitivities, it was required to have approximately 80 deg (leading) phase
compensation in the PSS. It was possible to achieve a damping of 12.3% using a gain of 10. The PSS
parameters are tabulated in Appendix‐1.
5.2.4 Granite Canal PSS There is a 1.34 Hz oscillation associated with the Granite Canal generator. The participation factors
showed that this mode is local to the generator.
Based on the Eigen sensitivities, it was required to have approximately 50 deg (leading) phase
compensation in the PSS. It was possible to achieve a damping of 11.3% using a gain of 3. The PSS
parameters are tabulated in Appendix‐1.
0
1
2
3
4
5M
ag
nitu
de
(a
bs)
0 0.2 0.4 0.6 0.8 1 1.2 1.4 1.6 1.80
30
60
Ph
ase
(d
eg
)Bode Diagram
Frequency (Hz)

Newfoundland and Labrador Hydro RFI Studies
Stage 4B: Power System Stabilizer Design
©TransGrid Solutions Inc., 2018 16 | P a g e Technical Note: TN1205.65.01, November 8, 2018
Figure 5-4: Participation Factors and Mode Shapes - 1.12 Hz Mode at Upper Salmon
Newfoundland and Labrador Hydro RFI Studies
Stage 4B: Power System Stabilizer Design
©TransGrid Solutions Inc., 2018 17 | P a g e Technical Note: TN1205.65.01, November 8, 2018
5.3 Step 3 – Small Signal Stability Assessment with PSSes tuned for Local-Area Oscillations
After adding the PSSes at the Cat Arm, Upper Salmon and Granite Canal units, the small signal stability
of the IIS was re‐evaluated for all of the power flow cases listed in Table 4‐1 considering the
contingencies in Table 4‐2. Nearly all of the electromechanical oscillations were found to be well
damped, however there is one critical inter‐area oscillation mode that was found. The frequency,
damping and the contribution of the generators in this mode depends on the operating scenario. The
frequency of this mode varies in the range of 0.75 Hz to 1.0 Hz. In case HP18, when there is a N‐2 outage
of TL231‐TL234, the damping is approximately 2%. In case HP21, when there is an N‐2 outage of TL203‐
TL237, the oscillation becomes unstable (damping is ‐7.3%). The participation factors and the mode
shapes of the generator rotor angles for this mode are shown in Figure 5‐5. The Deer Lake, Cat Arm and
Bay d'Espoir generators contribute to the oscillation. There are some contributions of the Soldiers Pond
synchronous condensers as well.
It was decided to tune the PSSes in the Bay d'Espoir generators to damp out this oscillation. Further
investigation of case HP21 during an N‐2 outage of TL203‐TL237 revealed that this case is transiently
unstable and tuning of the PSSes cannot solve this issue. The final Stage 4 operational studies will
investigate this issue since it is likely that a system operating limit will be required during a prior outage
of either TL203 or TL237 in case the other line is lost. Therefore, the PSSes were tuned based on the
next critical operating condition observed in case HP18 during an N‐2 outage of TL231‐TL234. In this
case, it was required to have a phase compensation of 45 Deg (leading). The gains of the PSSes were set
to 17. All PSS parameters are tabulated in Appendix‐1.

Newfoundland and Labrador Hydro RFI Studies
Stage 4B: Power System Stabilizer Design
©TransGrid Solutions Inc., 2018 18 | P a g e Technical Note: TN1205.65.01, November 8, 2018
Figure 5-5: Participation Factors and Mode Shapes for 0.75 Hz Inter-area Oscillations

Newfoundland and Labrador Hydro RFI Studies
Stage 4B: Power System Stabilizer Design
©TransGrid Solutions Inc., 2018 19 | P a g e Technical Note: TN1205.65.01, November 8, 2018
5.4 Step 4 – Final Small Signal Stability Assessment with PSSes
A final small signal stability assessment of the IIS was performed with the PSSes added to the Cat Arm,
Upper Salmon, Granite Canal, and Bay d'Espoir units.
5.4.1 Inter-area oscillations There are several contingencies in case HP20 (light load conditions) where the damping of the inter‐area
oscillation is less than 5% damping as shown in Table 5‐4. The cases with the PSSes show significant
improvement compared to the cases without the PSSes. However, it was found that most of these
contingencies result in transient instability if simulated in PSSE. Therefore, it is likely that the final Stage
4 operational study will define system operating limits for prior outages involving these lines. Once the
final Stage 4 operational study is complete, it is recommended to re‐evaluate the small signal stability of
these cases when system operating limits are in place for prior outages. For all other cases, more than
6% damping for the inter‐area oscillation was achieved.
Table 5-4: Inter-area oscillation mode in HP20 powerflow scenario
Powerflow Contingency With PSSes Without PSSes
Freq (Hz) Damping (%) Freq (Hz) Damping (%)
HP20 TL231‐TL204 0.90 1.67 0.87 ‐1.77
HP20 TL232‐TL205 0.91 2.33 0.88 ‐1.59
HP20 TL203‐TL237 0.80 3.02 0.75 ‐8.48
HP20 TL233‐TL228 0.95 3.44 0.91 ‐0.59
HP20 TL231‐TL234 0.94 3.61 0.91 0.18
HP20 TL233‐TL269 0.96 4.62 0.93 0.86
HP20 TL203‐TL267 0.92 4.81 0.88 ‐0.70
5.4.2 Local area oscillations All of the local area oscillations associated with the IIS showed more than 7% damping.
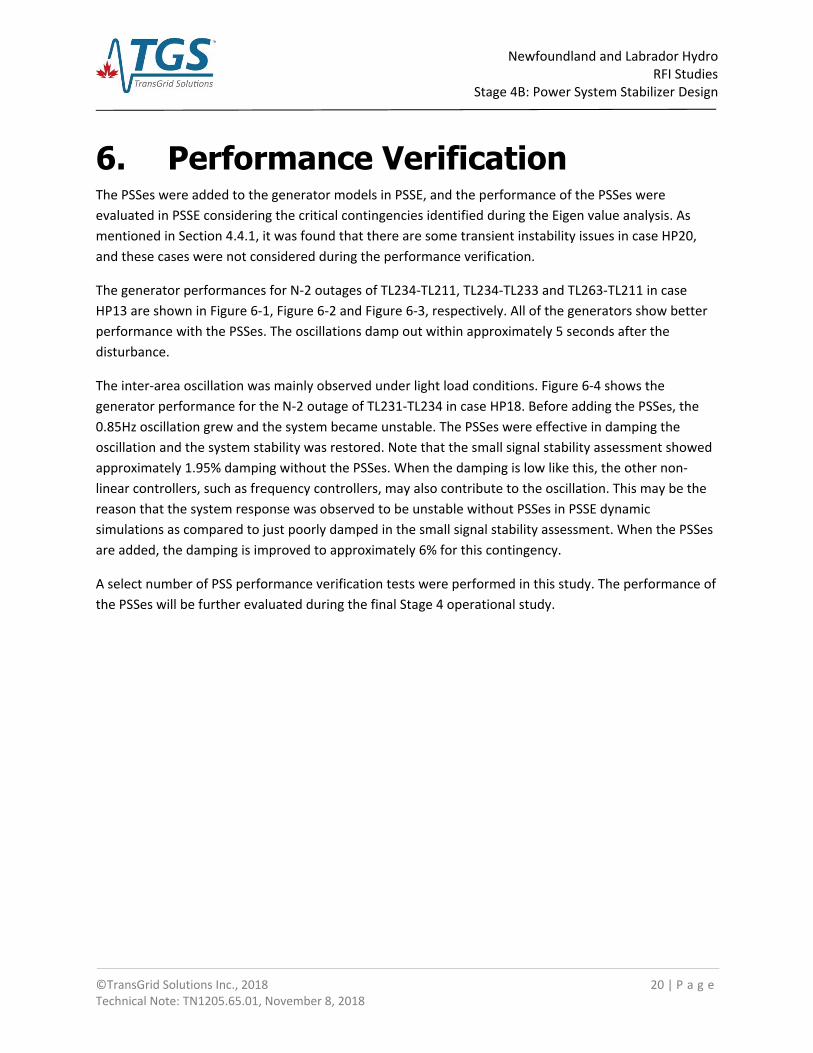
Newfoundland and Labrador Hydro RFI Studies
Stage 4B: Power System Stabilizer Design
©TransGrid Solutions Inc., 2018 20 | P a g e Technical Note: TN1205.65.01, November 8, 2018
6. Performance Verification The PSSes were added to the generator models in PSSE, and the performance of the PSSes were
evaluated in PSSE considering the critical contingencies identified during the Eigen value analysis. As
mentioned in Section 4.4.1, it was found that there are some transient instability issues in case HP20,
and these cases were not considered during the performance verification.
The generator performances for N‐2 outages of TL234‐TL211, TL234‐TL233 and TL263‐TL211 in case
HP13 are shown in Figure 6‐1, Figure 6‐2 and Figure 6‐3, respectively. All of the generators show better
performance with the PSSes. The oscillations damp out within approximately 5 seconds after the
disturbance.
The inter‐area oscillation was mainly observed under light load conditions. Figure 6‐4 shows the
generator performance for the N‐2 outage of TL231‐TL234 in case HP18. Before adding the PSSes, the
0.85Hz oscillation grew and the system became unstable. The PSSes were effective in damping the
oscillation and the system stability was restored. Note that the small signal stability assessment showed
approximately 1.95% damping without the PSSes. When the damping is low like this, the other non‐
linear controllers, such as frequency controllers, may also contribute to the oscillation. This may be the
reason that the system response was observed to be unstable without PSSes in PSSE dynamic
simulations as compared to just poorly damped in the small signal stability assessment. When the PSSes
are added, the damping is improved to approximately 6% for this contingency.
A select number of PSS performance verification tests were performed in this study. The performance of
the PSSes will be further evaluated during the final Stage 4 operational study.

Newfoundland and Labrador Hydro RFI Studies
Stage 4B: Power System Stabilizer Design
©TransGrid Solutions Inc., 2018 21 | P a g e Technical Note: TN1205.65.01, November 8, 2018
Figure 6-1. Performance of Island Generators for N-2 outage of TL234-TL211in HP13 (Blue: Without PSSes, Green: With PSSes)

Newfoundland and Labrador Hydro RFI Studies
Stage 4B: Power System Stabilizer Design
©TransGrid Solutions Inc., 2018 22 | P a g e Technical Note: TN1205.65.01, November 8, 2018
Figure 6-2. Performance of Island Generators for N-2 outage of TL234-TL233 in HP13 (Blue: Without PSSes, Green: With PSSes)

Newfoundland and Labrador Hydro RFI Studies
Stage 4B: Power System Stabilizer Design
©TransGrid Solutions Inc., 2018 23 | P a g e Technical Note: TN1205.65.01, November 8, 2018
Figure 6-3. Performance of Island Generators for N-2 outage of TL263-TL211 in HP13 (Blue: Without PSSes, Green: With PSSes)

Newfoundland and Labrador Hydro RFI Studies
Stage 4B: Power System Stabilizer Design
©TransGrid Solutions Inc., 2018 24 | P a g e Technical Note: TN1205.65.01, November 8, 2018
Figure 6-4. Performance of Island Generators for N-2 outage of TL231-TL234 in HP18 (Blue: Without PSSes, Green: With PSSes)

Newfoundland and Labrador Hydro RFI Studies
Stage 4B: Power System Stabilizer Design
©TransGrid Solutions Inc., 2018 25 | P a g e Technical Note: TN1205.65.01, November 8, 2018
7. Performance of Muskrat Fall Generators
During the Stage 4c2 operational study, which was performed to evaluate power transfer limits between
Churchill Falls and Muskrat Falls, it was observed that the Muskrat Falls generators produce low damped
oscillations under certain system conditions3 when there is a three‐phase fault one of the 315 kV circuits
between Churchill Falls and Muskrat Falls and when the line is tripped to clear the fault. The Muskrat
Falls generator speeds are shown in Figure 7‐1.
Figure 7-1: Muskrat Falls Generator Oscillations when one 315 kV circuit between Chirchill Falls and Muskrat Falls is tripped (oscillation frequency ~ 0.71 Hz)
It seems that the preliminary stabilizer models used for the Muskrat Falls generators in the PSSE
simulations are not effective for this operating condition. Therefore, a small signal stability assessment
was performed for the Muskrat Falls generators as well. The analysis revealed that the oscillations have
approximately 5% damping with the existing PSSes (IEEEST model). Note that the PSSE simulations show
much lower damping and the non‐linear controllers associated with the HVDC may be part of the reason
for the difference. If the existing stabilizers are removed, the oscillations become unstable (about ‐3%
damping).
2 TN1205.66.00, “Stage 4C LIL Bipole: Labrador Transfer Analysis”, TransGrid Solutions 3 Specifically, cases LAB5 and LAB9 from the Stage 4c study.
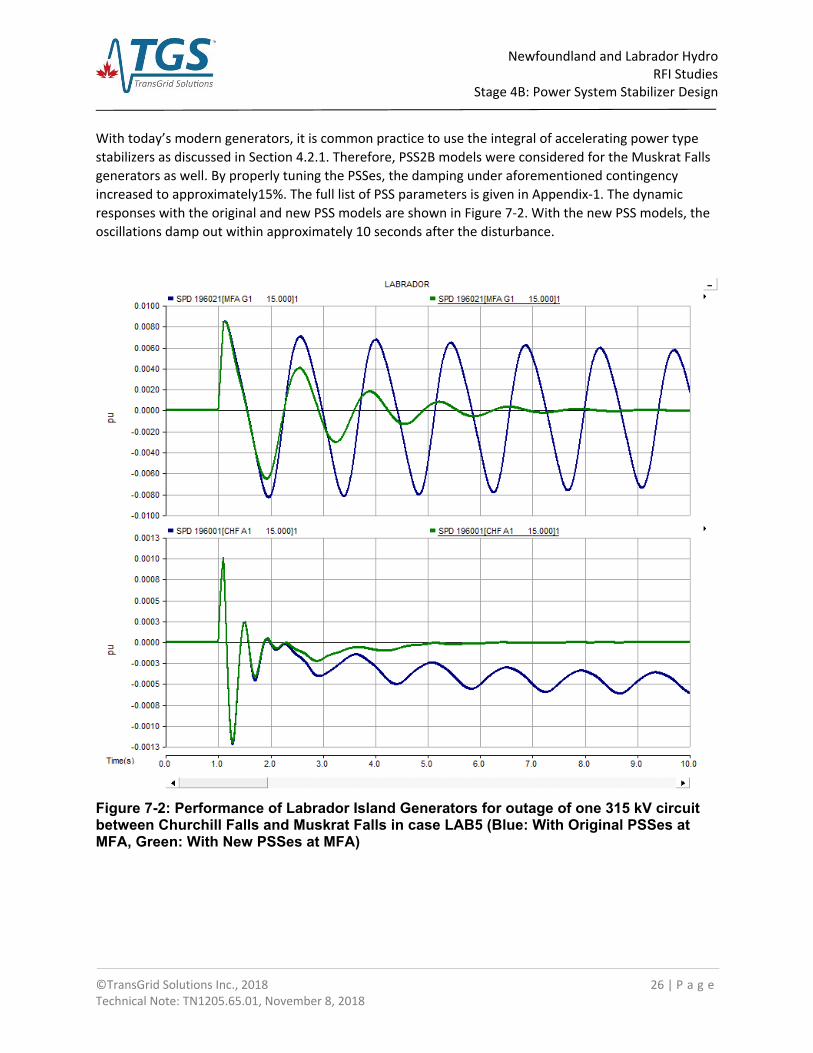
Newfoundland and Labrador Hydro RFI Studies
Stage 4B: Power System Stabilizer Design
©TransGrid Solutions Inc., 2018 26 | P a g e Technical Note: TN1205.65.01, November 8, 2018
With today’s modern generators, it is common practice to use the integral of accelerating power type
stabilizers as discussed in Section 4.2.1. Therefore, PSS2B models were considered for the Muskrat Falls
generators as well. By properly tuning the PSSes, the damping under aforementioned contingency
increased to approximately15%. The full list of PSS parameters is given in Appendix‐1. The dynamic
responses with the original and new PSS models are shown in Figure 7‐2. With the new PSS models, the
oscillations damp out within approximately 10 seconds after the disturbance.
Figure 7-2: Performance of Labrador Island Generators for outage of one 315 kV circuit between Churchill Falls and Muskrat Falls in case LAB5 (Blue: With Original PSSes at MFA, Green: With New PSSes at MFA)

Newfoundland and Labrador Hydro RFI Studies
Stage 4B: Power System Stabilizer Design
©TransGrid Solutions Inc., 2018 27 | P a g e Technical Note: TN1205.65.01, November 8, 2018
8. Conclusions 8.1 IIS Generators The need for PSSes was evaluated considering various loading conditions (cases HP13 to HP23) and
critical contingencies in the IIS. Based on the small signal stability assessment, PSSes were proposed to
be used at the following generating stations to improve the electromechanical oscillation damping in the
system:
(5) Cat Arm units 1 and 2
(6) Upper Salmon
(7) Granite Canal
(8) Bay d'Espoir units 1‐7 (for inter‐area oscillation damping)
The performance of the PSSes were evaluated in PSSE considering the system intact and critical N‐2
contingencies. It was observed that the PSSes provide better damping compared to the cases without
PSSes. Furthermore, under light load conditions, PSSes can help to avoid the instabilities in the system.
It should be noted that small signal stability assessment is a linear analysis technique and, therefore, the
non‐linear behaviors, such as the impact of frequency controllers that have dead‐bands, are not
considered in small signal stability analysis. If the system is well damped, the small signal stability
analysis results match well with the actual system behavior seen in PSSE. However, if the damping of
certain oscillations is low, other non‐linear controllers may have a significant impact (positive or
negative) on these oscillations. After the PSSes were added to the IIS, the small signal stability analysis
showed very good damping of the electromechanical oscillations in the IIS. Therefore, such impacts of
the other non‐linear controllers are not expected.
It should also be noted that the validity of the powerflow scenarios under contingency conditions (N‐1
and N‐2) needs to be further evaluated in the final Stage 4 operational study considering the steady
state and dynamic performance of the IIS. Therefore, some of the operating points considered in this
small signal stability analysis may not be practical.
In summary, the PSS parameters provided in this report should be considered as preliminary values for
use and evaluation in the final Stage 4 operational study and it is recommended to further evaluate the
performance of the PSSes during that study.
8.2 Muskrat Falls Generators During the Stage 4c operational study, which investigates power transfer capability between Muskrat
Falls and Churchill Falls, it was observed that the original power system stabilizer models of the Muskrat
Falls generators are not effective under certain operating conditions when there is a three‐phase fault
on one of the two 315 kV lines between Churchill Falls and Muskrat Falls. Therefore, the Muskrat Falls
PSSes were re‐tuned to obtain acceptable damping under those operating conditions.

Newfoundland and Labrador Hydro RFI Studies
Stage 4B: Power System Stabilizer Design
©TransGrid Solutions Inc., 2018 28 | P a g e Technical Note: TN1205.65.01, November 8, 2018
9. References
[1] C. Karawita, D. H. R. Suriyaarachchi and U. D. Annakkage, "A Case Study on the Vulnerability of VSC HVDC Systems for Sub‐synchronous Interactions with Generator‐Turbine Units," in CIGRE SCB4
Colloquium 2011 , 2011.
[2] C. Karawita, D. H. R. Suriyaarachchi and U. Annakkage, "A Case Study on the Vulnerability of VSC
HVDC Systems for Sub‐synchronous Interactions with Generator‐Turbine Units," in CIGRE SCB4
Colloquium 2011, Brisbane, Australia, October 2011.
[3] C. Karawita and U. Annakkage, "A Hybrid Network Model for Small Signal Stability Analysis of Power
Systems," Power Systems, IEEE Transactions on, vol. 25, no. 1, pp. 443‐451, Feb 2010.
[4] C. Karawita and U. Annakkage, "Control block diagram representation of an HVDC system for sub‐
synchronous frequency interaction studies," in AC and DC Power Transmission, 2010. ACDC. 9th IET
International Conference on, 2010.
[5] C. Karawita and U. Annakkage, "Multi‐Infeed HVDC Interaction Studies Using Small‐Signal Stability
Assessment," Power Delivery, IEEE Transactions on, vol. 24, no. 2, pp. 910‐918, April 2009.
[6] C. Karawita and U. D. Annakkage, "HVDC‐Generator‐Turbine Torsional Interaction Studies Using A
Linearized Model With Dynamic Network Representation," in International Conference on Power
Systems Transients, Kyoto, Japan, 2009.
[7] D. Suriyaarachchi, U. Annakkage, C. Karawita and D. Jacobson, "A Procedure to Study Sub‐
Synchronous Interactions in Wind Integrated Power Systems," Power Systems, IEEE Transactions on,
vol. 28, no. 1, pp. 377‐384, Feb 2013.
[8] D. Suriyaarachchi, U. Annakkage, C. Karawita, D. Kell, R. Mendis and R. Chopra, "Application of an
SVC to damp sub‐synchronous interaction between wind farms and series compensated
transmission lines," in Power and Energy Society General Meeting, 2012 IEEE, 2012.
[9] C. Karawita, "HVDC interaction studies using small signal stability assessment," 2009.
[10] P. Kundur, N. Balu and M. Lauby, Power system stability and control, McGraw‐Hill, 1994.

Appendix-1 PSS Parameters (Preliminary Values)
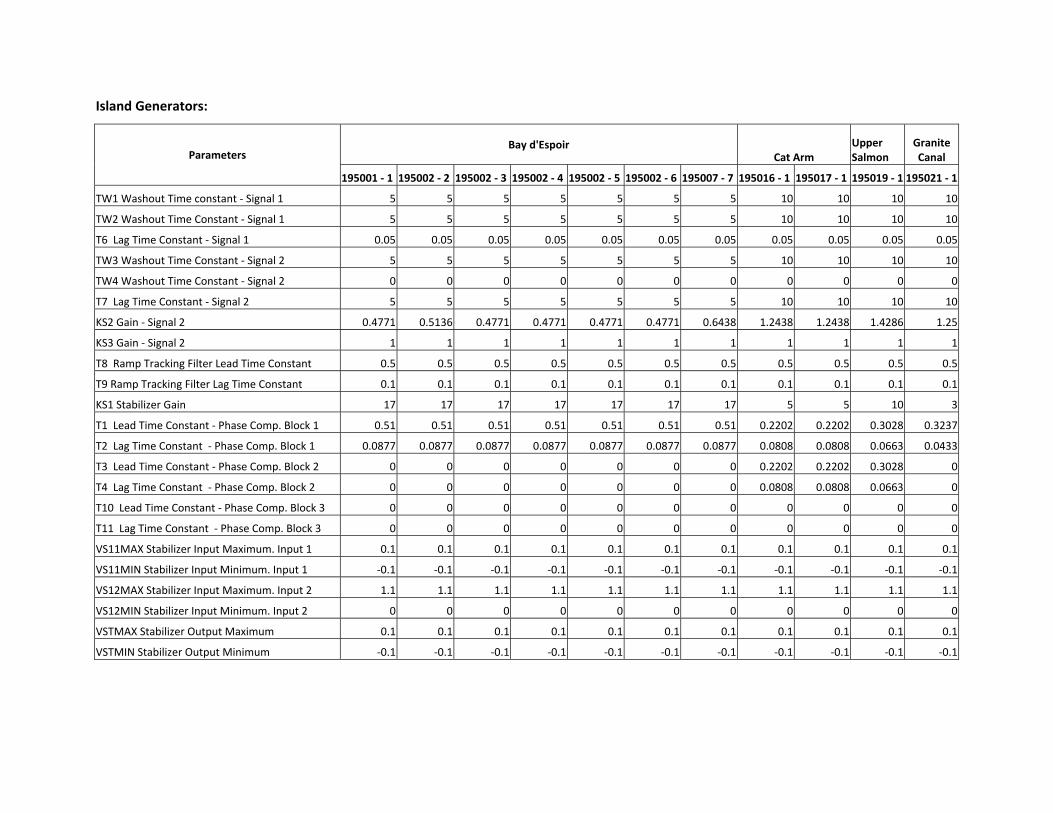
Island Generators:
Parameters Bay d'Espoir
Cat Arm Upper Salmon
Granite Canal
195001 ‐ 1 195002 ‐ 2 195002 ‐ 3 195002 ‐ 4 195002 ‐ 5 195002 ‐ 6 195007 ‐ 7 195016 ‐ 1 195017 ‐ 1 195019 ‐ 1 195021 ‐ 1
TW1 Washout Time constant ‐ Signal 1 5 5 5 5 5 5 5 10 10 10 10
TW2 Washout Time Constant ‐ Signal 1 5 5 5 5 5 5 5 10 10 10 10
T6 Lag Time Constant ‐ Signal 1 0.05 0.05 0.05 0.05 0.05 0.05 0.05 0.05 0.05 0.05 0.05
TW3 Washout Time Constant ‐ Signal 2 5 5 5 5 5 5 5 10 10 10 10
TW4 Washout Time Constant ‐ Signal 2 0 0 0 0 0 0 0 0 0 0 0
T7 Lag Time Constant ‐ Signal 2 5 5 5 5 5 5 5 10 10 10 10
KS2 Gain ‐ Signal 2 0.4771 0.5136 0.4771 0.4771 0.4771 0.4771 0.6438 1.2438 1.2438 1.4286 1.25
KS3 Gain ‐ Signal 2 1 1 1 1 1 1 1 1 1 1 1
T8 Ramp Tracking Filter Lead Time Constant 0.5 0.5 0.5 0.5 0.5 0.5 0.5 0.5 0.5 0.5 0.5
T9 Ramp Tracking Filter Lag Time Constant 0.1 0.1 0.1 0.1 0.1 0.1 0.1 0.1 0.1 0.1 0.1
KS1 Stabilizer Gain 17 17 17 17 17 17 17 5 5 10 3
T1 Lead Time Constant ‐ Phase Comp. Block 1 0.51 0.51 0.51 0.51 0.51 0.51 0.51 0.2202 0.2202 0.3028 0.3237
T2 Lag Time Constant ‐ Phase Comp. Block 1 0.0877 0.0877 0.0877 0.0877 0.0877 0.0877 0.0877 0.0808 0.0808 0.0663 0.0433
T3 Lead Time Constant ‐ Phase Comp. Block 2 0 0 0 0 0 0 0 0.2202 0.2202 0.3028 0
T4 Lag Time Constant ‐ Phase Comp. Block 2 0 0 0 0 0 0 0 0.0808 0.0808 0.0663 0
T10 Lead Time Constant ‐ Phase Comp. Block 3 0 0 0 0 0 0 0 0 0 0 0
T11 Lag Time Constant ‐ Phase Comp. Block 3 0 0 0 0 0 0 0 0 0 0 0
VS11MAX Stabilizer Input Maximum. Input 1 0.1 0.1 0.1 0.1 0.1 0.1 0.1 0.1 0.1 0.1 0.1
VS11MIN Stabilizer Input Minimum. Input 1 ‐0.1 ‐0.1 ‐0.1 ‐0.1 ‐0.1 ‐0.1 ‐0.1 ‐0.1 ‐0.1 ‐0.1 ‐0.1
VS12MAX Stabilizer Input Maximum. Input 2 1.1 1.1 1.1 1.1 1.1 1.1 1.1 1.1 1.1 1.1 1.1
VS12MIN Stabilizer Input Minimum. Input 2 0 0 0 0 0 0 0 0 0 0 0
VSTMAX Stabilizer Output Maximum 0.1 0.1 0.1 0.1 0.1 0.1 0.1 0.1 0.1 0.1 0.1
VSTMIN Stabilizer Output Minimum ‐0.1 ‐0.1 ‐0.1 ‐0.1 ‐0.1 ‐0.1 ‐0.1 ‐0.1 ‐0.1 ‐0.1 ‐0.1

Muskrat Falls Generators:
Parameter Muskert Falls
196021‐ 1 196022 ‐ 2 196023‐ 3 196024 ‐ 4
TW1 Washout Time constant ‐ Signal 1 10 10 10 10
TW2 Washout Time Constant ‐ Signal 1 10 10 10 10
T6 Lag Time Constant ‐ Signal 1 0.05 0.05 0.05 0.05
TW3 Washout Time Constant ‐ Signal 2 10 10 10 10
TW4 Washout Time Constant ‐ Signal 2 0 0 0 0
T7 Lag Time Constant ‐ Signal 2 10 10 10 10
KS2 Gain ‐ Signal 2 1.2195 1.2195 1.2195 1.2195
KS3 Gain ‐ Signal 2 1 1 1 1
T8 Ramp Tracking Filter Lead Time Constant 0.5 0.5 0.5 0.5
T9 Ramp Tracking Filter Lag Time Constant 0.1 0.1 0.1 0.1
KS1 Stabilizer Gain 15 15 15 15
T1 Lead Time Constant ‐ Phase Comp. Block 1 0.299 0.299 0.299 0.299
T2 Lag Time Constant ‐ Phase Comp. Block 1 0.0814 0.0814 0.0814 0.0814
T3 Lead Time Constant ‐ Phase Comp. Block 2 0 0 0 0
T4 Lag Time Constant ‐ Phase Comp. Block 2 0 0 0 0
T10 Lead Time Constant ‐ Phase Comp. Block 3 0 0 0 0
T11 Lag Time Constant ‐ Phase Comp. Block 3 0 0 0 0
VS11MAX Stabilizer Input Maximum. Input 1 0.1 0.1 0.1 0.1
VS11MIN Stabilizer Input Minimum. Input 1 ‐0.1 ‐0.1 ‐0.1 ‐0.1
VS12MAX Stabilizer Input Maximum. Input 2 1.1 1.1 1.1 1.1
VS12MIN Stabilizer Input Minimum. Input 2 0 0 0 0
VSTMAX Stabilizer Output Maximum 0.1 0.1 0.1 0.1
VSTMIN Stabilizer Output Minimum ‐0.1 ‐0.1 ‐0.1 ‐0.1
Related Documents