Word-of-Mouth Influence LEARNING OBJECTIVES When you have completed this chapter, you should be able to: 1 Discuss the difficulty of conducting research on word of mouth (WOM). 2 Describe how product decisions in different categories are affected by WOM. 3 Report on the relative occurrence and impact of positive and negative WOM in familiar categories. 4 Describe variations in WOM that affect its impact. 5 Report how WOM relates to the current and past usage of brands and to market share. 6 Describe ways in which WOM may build up support for a product in social networks. 7 Suggest how marketers might apply knowledge about WOM. OVERVIEW Much of the evidence on WOM is quite recent and this new research focus has probably been stimulated by the growth of the Internet. Comment on the Internet is regarded as a form of WOM, which marketers are keen to use to promote products and predict sales. In this chapter, we show how consumers use WOM to choose brands in different categories. We describe problems in researching this field and report findings on the relative frequency of positive and negative WOM (PWOM, NWOM) and the circumstances that stimulate people to give WOM. We provide evidence on the relative impact of PWOM and NWOM and we explain how different factors contribute to that impact. We describe how WOM production is related to market share, and review applications of WOM research. SECTION 1: THE NATURE OF WORD OF MOUTH In Chapter 5, we described the way in which innovations are adopted by consumers. At the centre of the adoption process is the communication of information. A person who 12 12-EAST-4534-Ch-12.indd 237 18/12/2012 4:05:30 PM

Welcome message from author
This document is posted to help you gain knowledge. Please leave a comment to let me know what you think about it! Share it to your friends and learn new things together.
Transcript
Word-of-Mouth Influence
LEARNING OBJECTIVES
When you have completed this chapter, you should be able to:
1 Discuss the difficulty of conducting research on word of mouth (WOM). 2 Describe how product decisions in different categories are affected by WOM.3 Report on the relative occurrence and impact of positive and negative WOM in familiar categories.4 Describe variations in WOM that affect its impact.5 Report how WOM relates to the current and past usage of brands and to market share.6 Describe ways in which WOM may build up support for a product in social networks.7 Suggest how marketers might apply knowledge about WOM.
OVERVIEW
Much of the evidence on WOM is quite recent and this new research focus has probably been stimulated by the growth of the Internet. Comment on the Internet is regarded as a form of WOM, which marketers are keen to use to promote products and predict sales.
In this chapter, we show how consumers use WOM to choose brands in different categories. We describe problems in researching this field and report findings on the relative frequency of positive and negative WOM (PWOM, NWOM) and the circumstances that stimulate people to give WOM. We provide evidence on the relative impact of PWOM and NWOM and we explain how different factors contribute to that impact. We describe how WOM production is related to market share, and review applications of WOM research.
SECTION 1: THE NATURE OF WORD OF MOUTH
In Chapter 5, we described the way in which innovations are adopted by consumers. At the centre of the adoption process is the communication of information. A person who
12
12-EAST-4534-Ch-12.indd 237 18/12/2012 4:05:30 PM
MARKET RESPONSE238
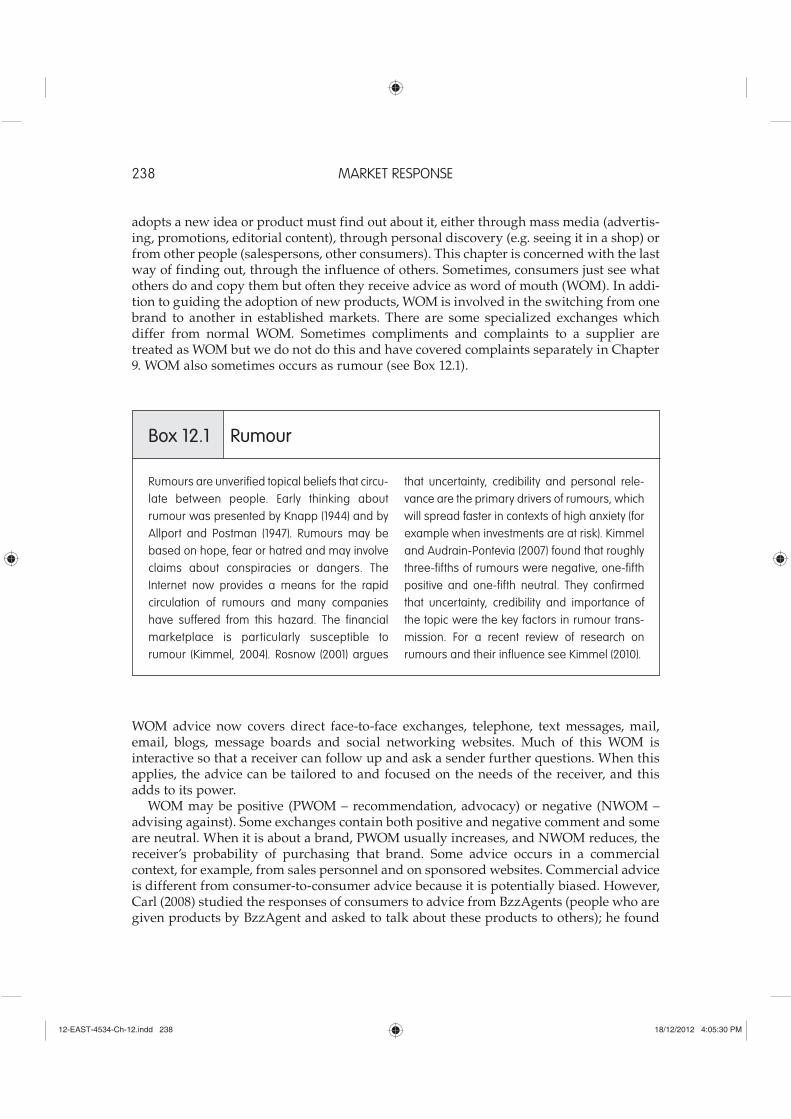
adopts a new idea or product must find out about it, either through mass media (advertis-ing, promotions, editorial content), through personal discovery (e.g. seeing it in a shop) or from other people (salespersons, other consumers). This chapter is concerned with the last way of finding out, through the influence of others. Sometimes, consumers just see what others do and copy them but often they receive advice as word of mouth (WOM). In addi-tion to guiding the adoption of new products, WOM is involved in the switching from one brand to another in established markets. There are some specialized exchanges which differ from normal WOM. Sometimes compliments and complaints to a supplier are treated as WOM but we do not do this and have covered complaints separately in Chapter 9. WOM also sometimes occurs as rumour (see Box 12.1).
Rumours are unverified topical beliefs that circu-late between people. Early thinking about rumour was presented by Knapp (1944) and by Allport and Postman (1947). Rumours may be based on hope, fear or hatred and may involve claims about conspiracies or dangers. The Internet now provides a means for the rapid circulation of rumours and many companies have suffered from this hazard. The financial marketplace is particularly susceptible to rumour (Kimmel, 2004). Rosnow (2001) argues
that uncertainty, credibility and personal rele-vance are the primary drivers of rumours, which will spread faster in contexts of high anxiety (for example when investments are at risk). Kimmel and Audrain-Pontevia (2007) found that roughly three-fifths of rumours were negative, one-fifth positive and one-fifth neutral. They confirmed that uncertainty, credibility and importance of the topic were the key factors in rumour trans-mission. For a recent review of research on rumours and their influence see Kimmel (2010).
Box 12.1 Rumour
WOM advice now covers direct face-to-face exchanges, telephone, text messages, mail, email, blogs, message boards and social networking websites. Much of this WOM is interactive so that a receiver can follow up and ask a sender further questions. When this applies, the advice can be tailored to and focused on the needs of the receiver, and this adds to its power.
WOM may be positive (PWOM – recommendation, advocacy) or negative (NWOM – advising against). Some exchanges contain both positive and negative comment and some are neutral. When it is about a brand, PWOM usually increases, and NWOM reduces, the receiver’s probability of purchasing that brand. Some advice occurs in a commercial context, for example, from sales personnel and on sponsored websites. Commercial advice is different from consumer-to-consumer advice because it is potentially biased. However, Carl (2008) studied the responses of consumers to advice from BzzAgents (people who are given products by BzzAgent and asked to talk about these products to others); he found
12-EAST-4534-Ch-12.indd 238 18/12/2012 4:05:30 PM
WORD-OF-MOUTH INFLUENCE 239
that three-quarters of respondents trusted the BzzAgent to give them good advice when they knew that he/she was a BzzAgent. In fact, the effect of the BzzAgent’s advice was often greater when their affiliation was known. If such trust extends generally to sales personnel, their advice may be quite influential despite the potential for bias.
Many of the classic studies on WOM were concerned with innovations and new categories rather than established brands; for example, Whyte (1954) on air conditioners, Coleman, Katz and Menzel (1957) on the prescribing of new drugs by physicians, and Katz’s (1961) work on new farming practices. These really new products may produce exceptional comment when compared with well-established products but there is clearly a gradation from the very novel to the familiar. Sometimes brands will have new features not offered by others and here, choice may be more like the adoption of a new product. For example, the widespread acceptance of smart phones was clearly driven by the new features that they offered. But, as the category matures and brands become more familiar, the reason for choice may not be an innovation but some simple advantage that can be drawn to a consumer’s attention. For example, one person might advise another about the relative cost of mobile phone brands, or their performance in weak-signal areas. This is useful information to a prospective buyer but it is not an innovative feature of the product.
In this chapter, we focus less on the adoption of new categories and more on brands in mature categories. Research on WOM is limited because it is difficult to measure. Ideally, we would observe WOM as it occurs and then monitor its consequences. In practice, WOM occurs too rarely for it to be observed systematically, and usually any effect is delayed, so that direct observation of the outcomes of WOM may be impossible. As a result, other methods have to be used, which are reviewed below.
Text Mining on the Internet
Although we cannot observe WOM as it happens, we may be able to measure it as comments posted on the Internet. WOM is not hard to find in consumer-generated media, but there are two challenges. First, those who set up websites may encourage more PWOM or NWOM than is typical in everyday life and, second, those who post comments on the Internet, and those who read these comments, may be different from those who give and receive offline advice. Godes and Mayzlin (2004b) did not find that the volume of online comment about TV programmes was predictive of viewing but Liu (2006) was successful in predicting box office returns from the volume of online comment about movies, and Qin (2012) also found that the volume of the WOM predicted movie sales. Interestingly, Liu did not find that the valence of the WOM (i.e. whether it was positive or negative) was predictive of sales. However, a later paper by Liu (2012) on Twitter comments suggests that the valence is more predictive than the volume of comments. More work is required here.
Internet research usually deals with aggregate effects. We can count the posts and obtain data on box office receipts. We may be able to predict returns from such data but we do not know quite how individuals have used the online information. We want to understand as well as predict and, for this, we need individual-level data so that we can connect individual responses to individual experience. Individual-level data are obtained in experiments and surveys.
12-EAST-4534-Ch-12.indd 239 18/12/2012 4:05:30 PM
MARKET RESPONSE240
Experiments
A number of experiments have examined the impact of positive and negative information (e.g. Ahluwalia, 2002; Herr, Kardes and Kim, 1991). The main problem here is that the artificiality of the laboratory situation restricts generalization to naturally occurring WOM. This artificiality has several aspects:
1 The stimulus is not like real WOM. In experiments, the ‘WOM’ is often prepared written information rather than spontaneous exchanges between people (e.g. Herr, Kardes and Kim, 1991). Such prepared advice cannot be asked for, which is often a feature of real WOM, and the advice is unlikely to be well tailored to the needs of the receiver.
2 The response measures may be inappropriate. Experimental studies of WOM have used attitude towards a product or brand and belief items to measure impact (e.g. Ahluwalia, 2002); marketers are generally more interested in the impact on purchase or purchase probability.
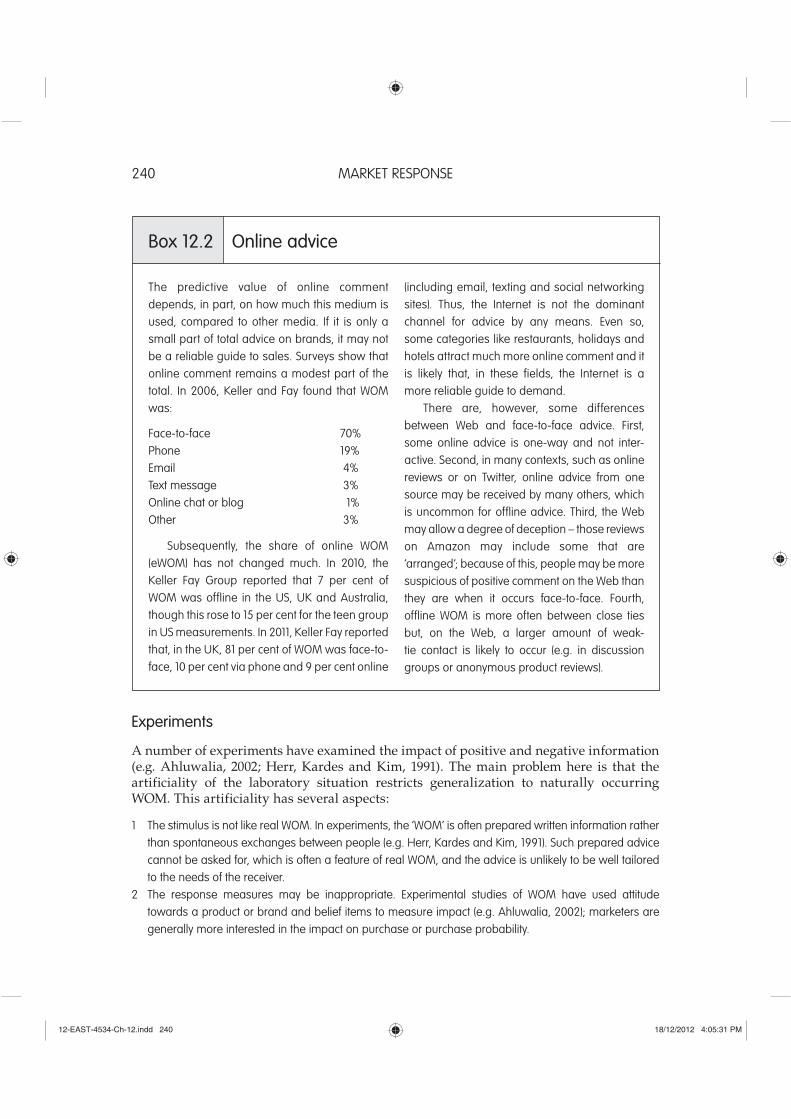
The predictive value of online comment depends, in part, on how much this medium is used, compared to other media. If it is only a small part of total advice on brands, it may not be a reliable guide to sales. Surveys show that online comment remains a modest part of the total. In 2006, Keller and Fay found that WOM was:
Face-to-face 70%Phone 19%Email 4%Text message 3%Online chat or blog 1%Other 3%
Subsequently, the share of online WOM (eWOM) has not changed much. In 2010, the Keller Fay Group reported that 7 per cent of WOM was offline in the US, UK and Australia, though this rose to 15 per cent for the teen group in US measurements. In 2011, Keller Fay reported that, in the UK, 81 per cent of WOM was face-to-face, 10 per cent via phone and 9 per cent online
(including email, texting and social networking sites). Thus, the Internet is not the dominant channel for advice by any means. Even so, some categories like restaurants, holidays and hotels attract much more online comment and it is likely that, in these fields, the Internet is a more reliable guide to demand.
There are, however, some differences between Web and face-to-face advice. First, some online advice is one-way and not inter-active. Second, in many contexts, such as online reviews or on Twitter, online advice from one source may be received by many others, which is uncommon for offline advice. Third, the Web may allow a degree of deception – those reviews on Amazon may include some that are ‘arranged’; because of this, people may be more suspicious of positive comment on the Web than they are when it occurs face-to-face. Fourth, offline WOM is more often between close ties but, on the Web, a larger amount of weak- tie contact is likely to occur (e.g. in discussion groups or anonymous product reviews).
Box 12.2 Online advice
12-EAST-4534-Ch-12.indd 240 18/12/2012 4:05:31 PM
WORD-OF-MOUTH INFLUENCE 241
3 In experiments, each participant makes an equal contribution to the outcome; in everyday life, some people say nothing while others give a lot of WOM.
4 Experiments usually rush the process by taking measures of effect shortly after exposure to the stimulus. In natural settings, people who receive WOM may not act on it for months, as discussed by Christiansen and Tax (2000).
Some of these problems are evaded by the use of role-play experiments. In a role-play experiment, the subject may be asked what he or she would do in a specified situation, for example: ‘If someone asked you about mobile phones, would you recommend/advise against …?’ There is no guarantee that participants in such role plays would do as they claim; however, Christiansen and Tax succeeded in devising quite realistic WOM experiments, using pairs of participants, with one being required to give advice to the other about a real product. Another possibility is to use field experiments. In an early study, Arndt (1967) introduced a new brand into a community and measured sales and the reported PWOM and NWOM. More recently, Godes and Mayzlin (2004a) used a field experiment to compare the extra effect on sales of WOM from loyal and non-loyal customers. Unfortunately, field experiments are very resource-intensive and, to measure WOM, the experimenter may still have to ask participants to recall what advice they have given and/or received.
Retrospective Surveys
In retrospective surveys, respondents have to report on their experience and these reports may be systematically distorted by recall error. If NWOM is more easily recalled than PWOM, a measure of relative frequency will be biased in favour of NWOM. There may also be expectation effects; if NWOM is believed to generally have more impact than PWOM, this could affect the respondents’ reports of impact.
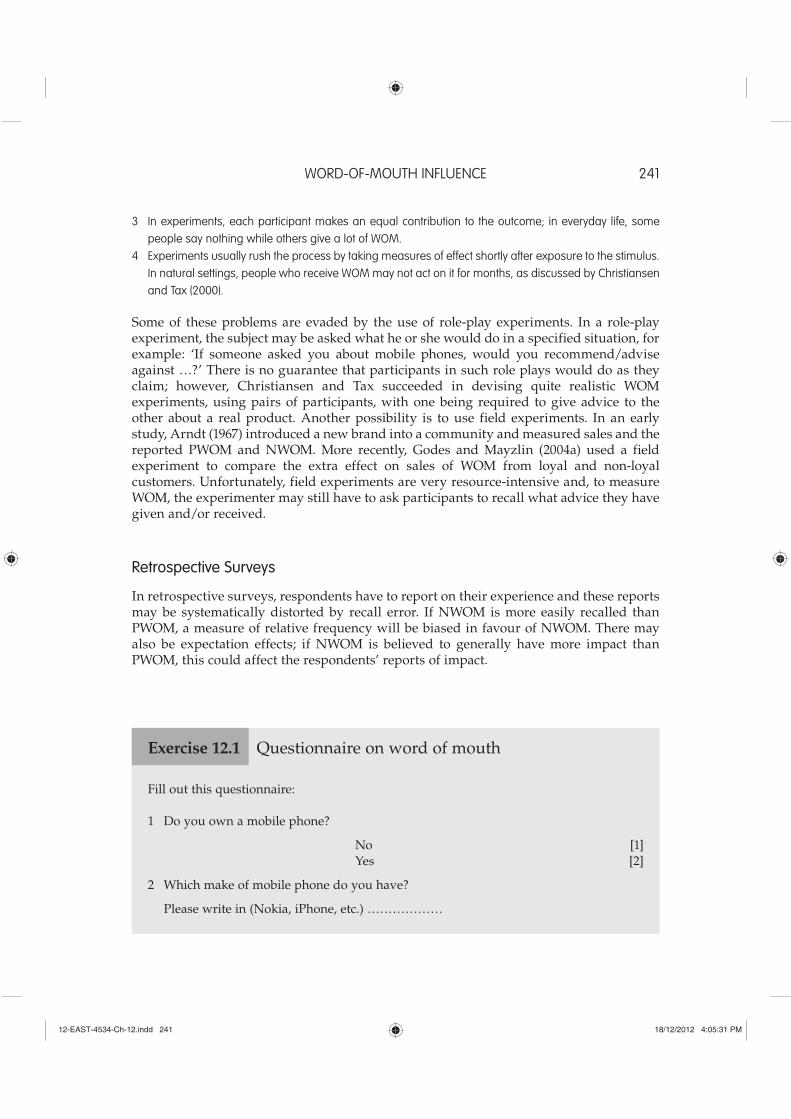
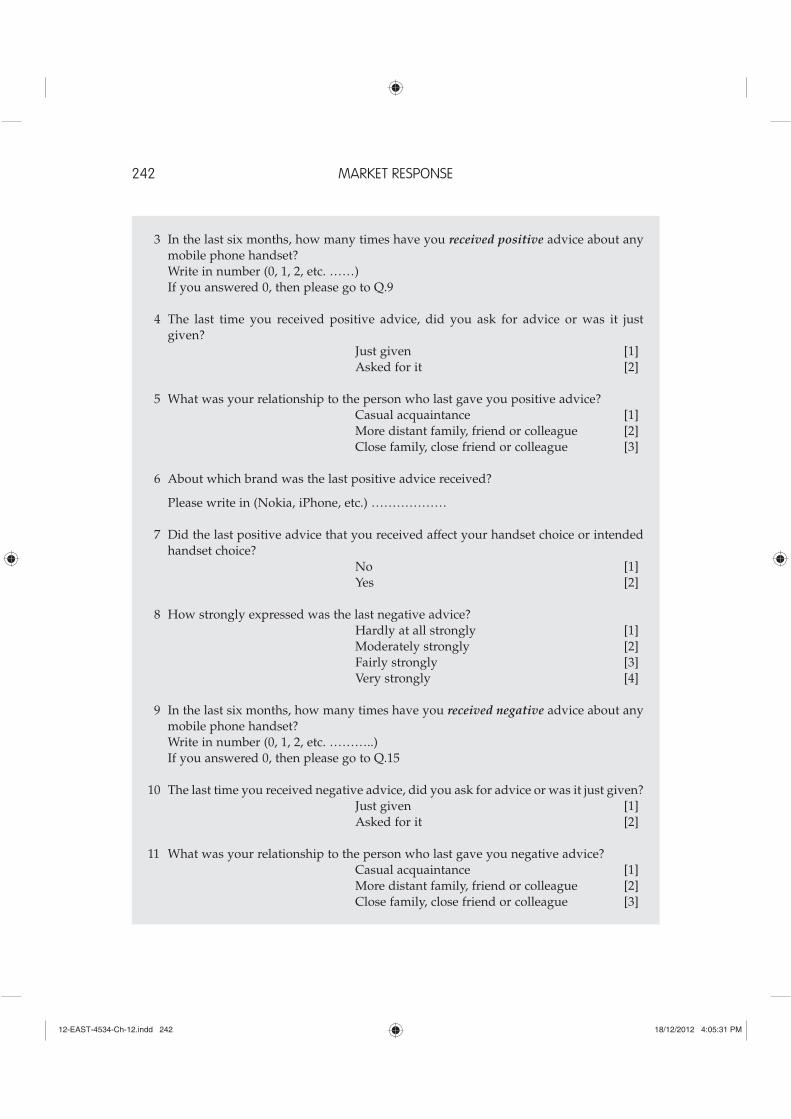
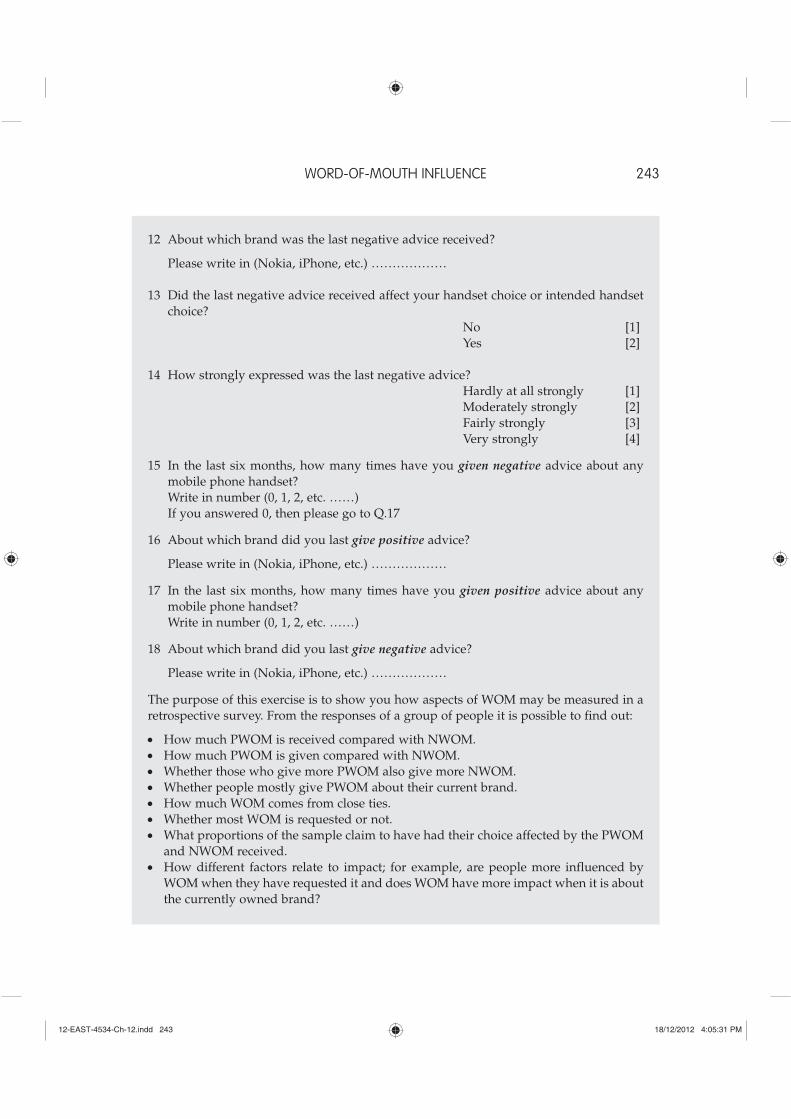
Exercise 12.1 Questionnaire on word of mouth
Fill out this questionnaire:
1 Do you own a mobile phone?
No [1] Yes [2]
2 Which make of mobile phone do you have?
Please write in (Nokia, iPhone, etc.) ………………
12-EAST-4534-Ch-12.indd 241 18/12/2012 4:05:31 PM
MARKET RESPONSE242
3 In the last six months, how many times have you received positive advice about any mobile phone handset?
Write in number (0, 1, 2, etc. ……) If you answered 0, then please go to Q.9
4 The last time you received positive advice, did you ask for advice or was it just given?
Just given [1] Asked for it [2]
5 What was your relationship to the person who last gave you positive advice? Casual acquaintance [1] More distant family, friend or colleague [2] Close family, close friend or colleague [3]
6 About which brand was the last positive advice received?
Please write in (Nokia, iPhone, etc.) ………………
7 Did the last positive advice that you received affect your handset choice or intended handset choice?
No [1] Yes [2]
8 How strongly expressed was the last negative advice? Hardly at all strongly [1] Moderately strongly [2] Fairly strongly [3] Very strongly [4]
9 In the last six months, how many times have you received negative advice about any mobile phone handset?
Write in number (0, 1, 2, etc. ………..) If you answered 0, then please go to Q.15
10 The last time you received negative advice, did you ask for advice or was it just given? Just given [1] Asked for it [2]
11 What was your relationship to the person who last gave you negative advice? Casual acquaintance [1] More distant family, friend or colleague [2] Close family, close friend or colleague [3]
12-EAST-4534-Ch-12.indd 242 18/12/2012 4:05:31 PM
WORD-OF-MOUTH INFLUENCE 243
12 About which brand was the last negative advice received?
Please write in (Nokia, iPhone, etc.) ………………
13 Did the last negative advice received affect your handset choice or intended handset choice?
No [1] Yes [2]
14 How strongly expressed was the last negative advice? Hardly at all strongly [1] Moderately strongly [2] Fairly strongly [3] Very strongly [4]
15 In the last six months, how many times have you given negative advice about any mobile phone handset?
Write in number (0, 1, 2, etc. ……) If you answered 0, then please go to Q.17
16 About which brand did you last give positive advice?
Please write in (Nokia, iPhone, etc.) ………………
17 In the last six months, how many times have you given positive advice about any mobile phone handset?
Write in number (0, 1, 2, etc. ……)
18 About which brand did you last give negative advice?
Please write in (Nokia, iPhone, etc.) ………………
The purpose of this exercise is to show you how aspects of WOM may be measured in a retrospective survey. From the responses of a group of people it is possible to find out:
How much PWOM is received compared with NWOM.How much PWOM is given compared with NWOM.Whether those who give more PWOM also give more NWOM.Whether people mostly give PWOM about their current brand.How much WOM comes from close ties.Whether most WOM is requested or not.What proportions of the sample claim to have had their choice affected by the PWOM and NWOM received.How different factors relate to impact; for example, are people more influenced by WOM when they have requested it and does WOM have more impact when it is about the currently owned brand?
12-EAST-4534-Ch-12.indd 243 18/12/2012 4:05:31 PM
MARKET RESPONSE244
A second concern about surveys relates to the recruitment of the sample, which is often based on convenience. However, problems about convenience sampling recede as more data are gathered. If we have 20 studies using diverse population samples and different categories, and these all show the same pattern, we can be more confident about the findings.
When no method is satisfactory, researchers may give up and investigate something else. This has probably led to a lack of research on WOM in the past. But this is something that we can ill afford. In many categories, WOM appears to be the most powerful influence on consumption and, outside the commercial arena, WOM assists in many social changes. In these circumstances, even weak findings should be put into the public domain.
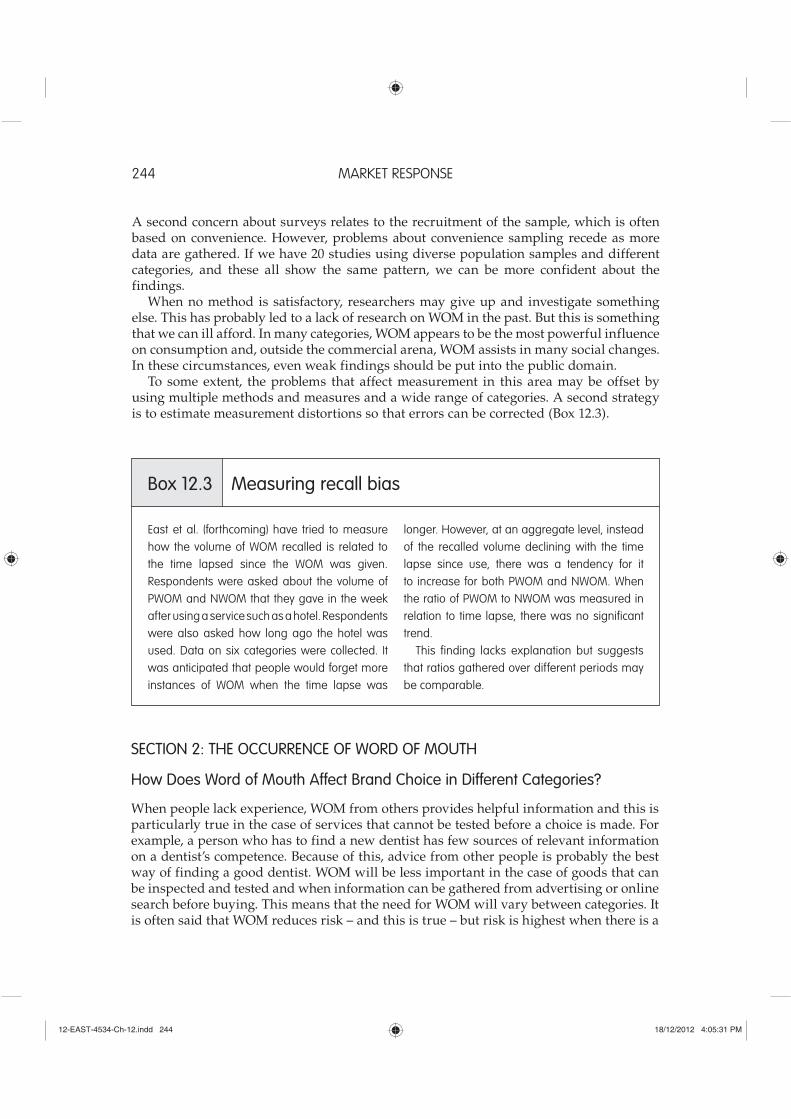
To some extent, the problems that affect measurement in this area may be offset by using multiple methods and measures and a wide range of categories. A second strategy is to estimate measurement distortions so that errors can be corrected (Box 12.3).
East et al. (forthcoming) have tried to measure how the volume of WOM recalled is related to the time lapsed since the WOM was given. Respondents were asked about the volume of PWOM and NWOM that they gave in the week after using a service such as a hotel. Respondents were also asked how long ago the hotel was used. Data on six categories were collected. It was anticipated that people would forget more instances of WOM when the time lapse was
longer. However, at an aggregate level, instead of the recalled volume declining with the time lapse since use, there was a tendency for it to increase for both PWOM and NWOM. When the ratio of PWOM to NWOM was measured in relation to time lapse, there was no significant trend.
This finding lacks explanation but suggests that ratios gathered over different periods may be comparable.
Box 12.3 Measuring recall bias
SECTION 2: THE OCCURRENCE OF WORD OF MOUTH
How Does Word of Mouth Affect Brand Choice in Different Categories?
When people lack experience, WOM from others provides helpful information and this is particularly true in the case of services that cannot be tested before a choice is made. For example, a person who has to find a new dentist has few sources of relevant information on a dentist’s competence. Because of this, advice from other people is probably the best way of finding a good dentist. WOM will be less important in the case of goods that can be inspected and tested and when information can be gathered from advertising or online search before buying. This means that the need for WOM will vary between categories. It is often said that WOM reduces risk – and this is true – but risk is highest when there is a
12-EAST-4534-Ch-12.indd 244 18/12/2012 4:05:31 PM
WORD-OF-MOUTH INFLUENCE 245
lack of information on a product and little opportunity to find out about it through direct experience.
In early work, WOM was credited with very large effects. Dichter (1966) claimed that advice figured in as many as 80 per cent of brand decisions. Katz and Lazarsfeld (1955) claimed to show that WOM was seven times as effective as newspapers and magazines, four times as effective as personal selling and twice as effective as radio advertising in influencing consumers to buy products. These early studies applied more to the adoption of new categories than to brand switching, so these claims may not tell us much about brand choice in familiar categories. However, WOM clearly has impact on brand choice; Keaveney (1995) found that about 50 per cent of service provider replacements occurred primarily through WOM.
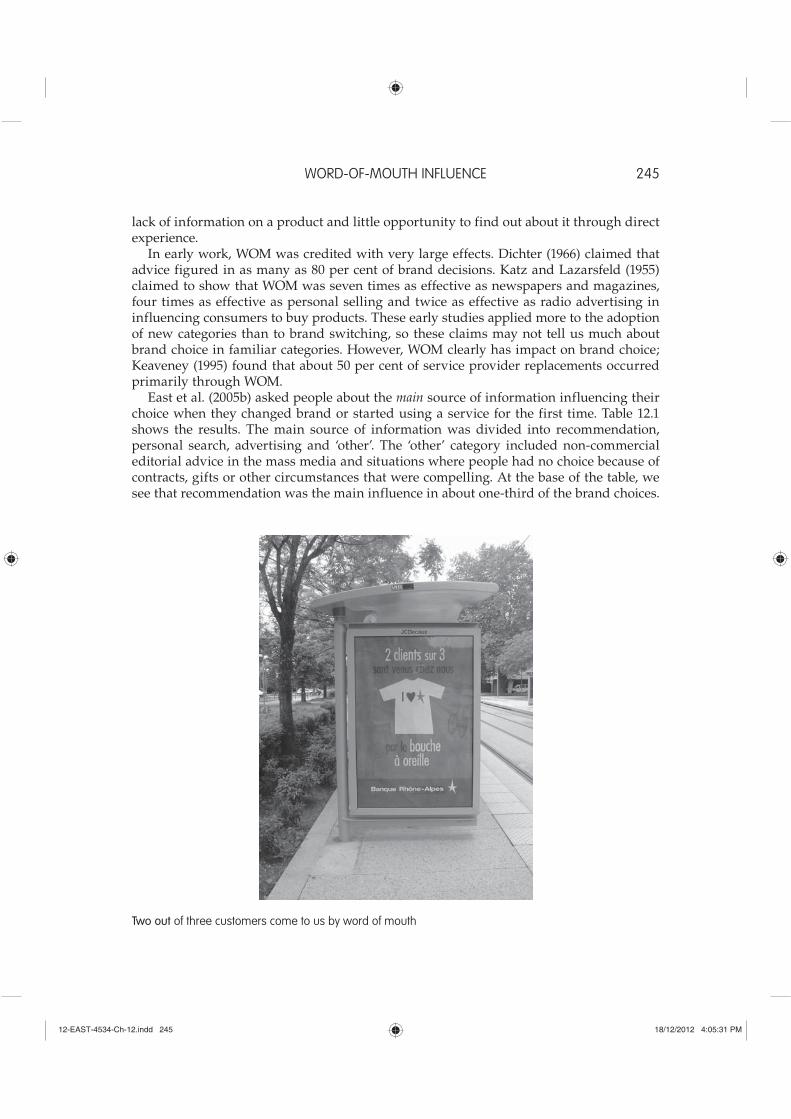
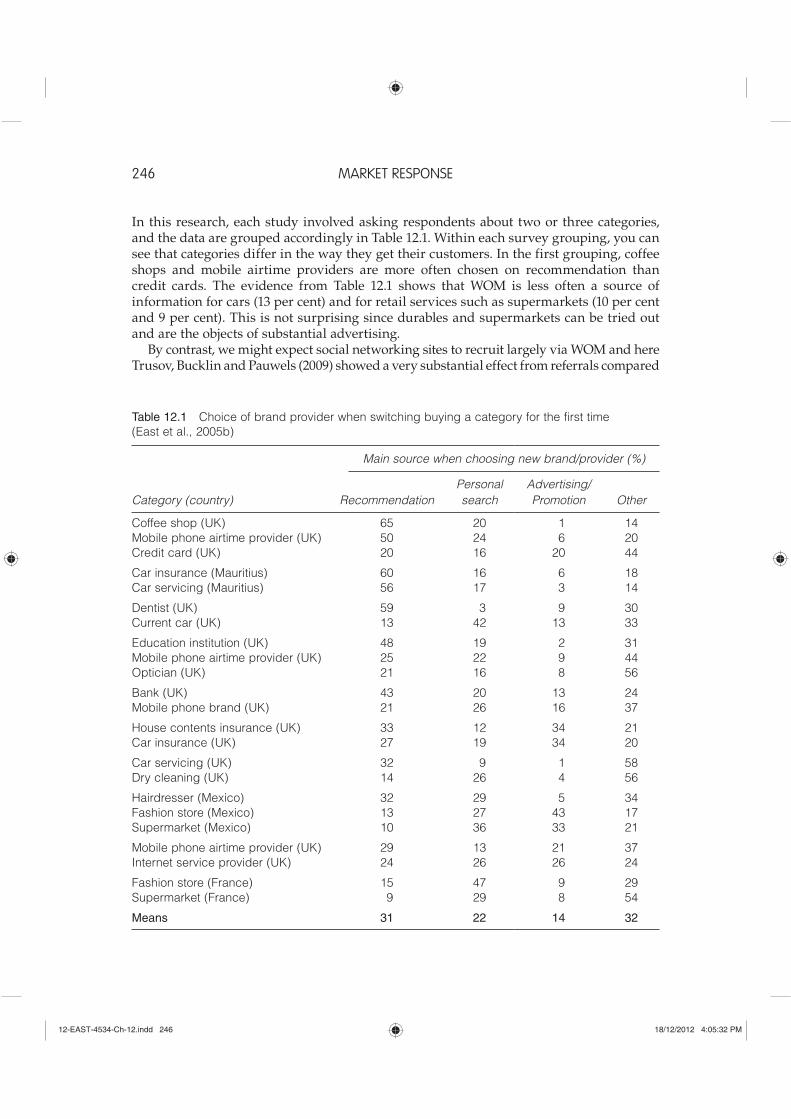
East et al. (2005b) asked people about the main source of information influencing their choice when they changed brand or started using a service for the first time. Table 12.1 shows the results. The main source of information was divided into recommendation, personal search, advertising and ‘other’. The ‘other’ category included non-commercial editorial advice in the mass media and situations where people had no choice because of contracts, gifts or other circumstances that were compelling. At the base of the table, we see that recommendation was the main influence in about one-third of the brand choices.
Two out of three customers come to us by word of mouth
12-EAST-4534-Ch-12.indd 245 18/12/2012 4:05:31 PM
MARKET RESPONSE246
In this research, each study involved asking respondents about two or three categories, and the data are grouped accordingly in Table 12.1. Within each survey grouping, you can see that categories differ in the way they get their customers. In the first grouping, coffee shops and mobile airtime providers are more often chosen on recommendation than credit cards. The evidence from Table 12.1 shows that WOM is less often a source of information for cars (13 per cent) and for retail services such as supermarkets (10 per cent and 9 per cent). This is not surprising since durables and supermarkets can be tried out and are the objects of substantial advertising.
By contrast, we might expect social networking sites to recruit largely via WOM and here Trusov, Bucklin and Pauwels (2009) showed a very substantial effect from referrals compared
Table 12.1 Choice of brand provider when switching buying a category for the first time (East et al., 2005b)
Main source when choosing new brand/provider (%)
Category (country) RecommendationPersonal search
Advertising/Promotion Other
Coffee shop (UK) 65 20 1 14Mobile phone airtime provider (UK) 50 24 6 20Credit card (UK) 20 16 20 44
Car insurance (Mauritius) 60 16 6 18Car servicing (Mauritius) 56 17 3 14
Dentist (UK) 59 3 9 30Current car (UK) 13 42 13 33
Education institution (UK) 48 19 2 31Mobile phone airtime provider (UK) 25 22 9 44Optician (UK) 21 16 8 56
Bank (UK) 43 20 13 24Mobile phone brand (UK) 21 26 16 37
House contents insurance (UK) 33 12 34 21Car insurance (UK) 27 19 34 20
Car servicing (UK) 32 9 1 58Dry cleaning (UK) 14 26 4 56
Hairdresser (Mexico) 32 29 5 34Fashion store (Mexico) 13 27 43 17Supermarket (Mexico) 10 36 33 21
Mobile phone airtime provider (UK) 29 13 21 37Internet service provider (UK) 24 26 26 24
Fashion store (France) 15 47 9 29Supermarket (France) 9 29 8 54
Means 31 22 14 32
12-EAST-4534-Ch-12.indd 246 18/12/2012 4:05:32 PM
WORD-OF-MOUTH INFLUENCE 247
with traditional marketing activity. Furthermore, both Trusov et al. and Villanueva, Yoo and Hanssens (2008) found that the customers derived from WOM were more valuable than those found by conventional marketing activity. Customers may be more valuable because they show greater retention and because they recommend the brand more to others.
How Does WOM Occur?
There is a widespread belief in marketing that PWOM comes from satisfied and NWOM from dissatisfied customers (see Box 12.4). But think back to the last advice that you gave. Was it driven by satisfaction or dissatisfaction, or were you trying to provide information that would help someone else with their decision? Our satisfaction or dissatisfaction with a product may be the main basis for giving advice but, often, we are influenced by other factors, such as the need for advice of the receiver.
Marketing textbooks such as Heskett, Sasser and Schlesinger (1997) and Hanna and Wosniak (2001) report NWOM to PWOM ratios of two or three to one when comparing satisfied and dis-satisfied customers. The origin of these reports is work by a US agency, the Technical Assistance Research Program (TARP), which finds that NWOM from dissatisfied customers occurs about twice as frequently as PWOM from satis-fied customers, though the ratio varies with the category (Goodman and Newman, 2003). Anderson’s (1998) comprehensive study also showed greater WOM among those who were very dissatisfied compared with those who were very satisfied, but he commented: ‘The widespread belief in a high degree of word of mouth by dissatisfied customers may be
unwarranted. In fact, in a sizable proportion of cases, the difference between the two is prob-ably not significant’ (Anderson, 1998: 15).
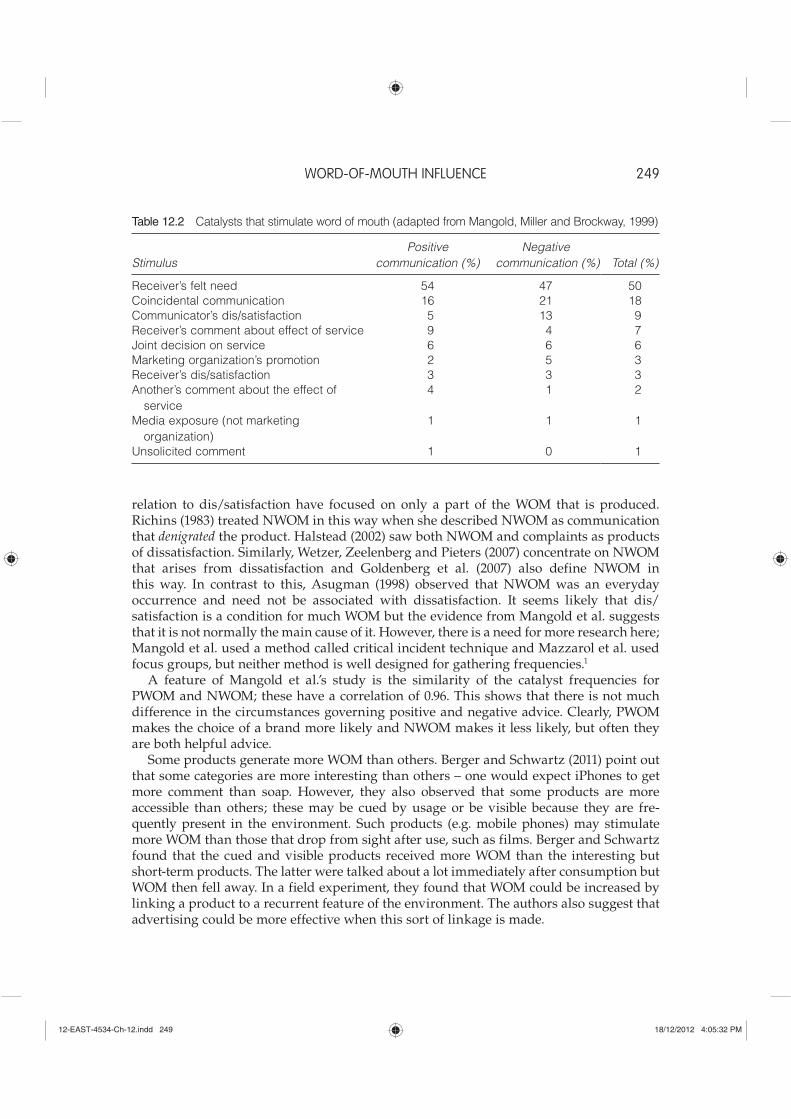
People may confuse the WOM from dis/satisfied customers with WOM in general. This may be why Silverman (2001: 134) claims that studies have shown that most WOM is negative. In Figure 12.1, we see from Anderson (1998) that WOM is also produced by those who are neither satisfied nor dissatisfied and Mangold, Miller and Brockway (1999) found that only a small part of WOM is driven primarily by satisfaction and dissatisfaction (Table 12.2). To establish the ratio of all PWOM to NWOM, we need studies on the general occurrence of PWOM and NWOM, not just studies where the WOM is based on dis/satisfaction.
Box 12.4 Comparing satisfied and dissatisfied consumers
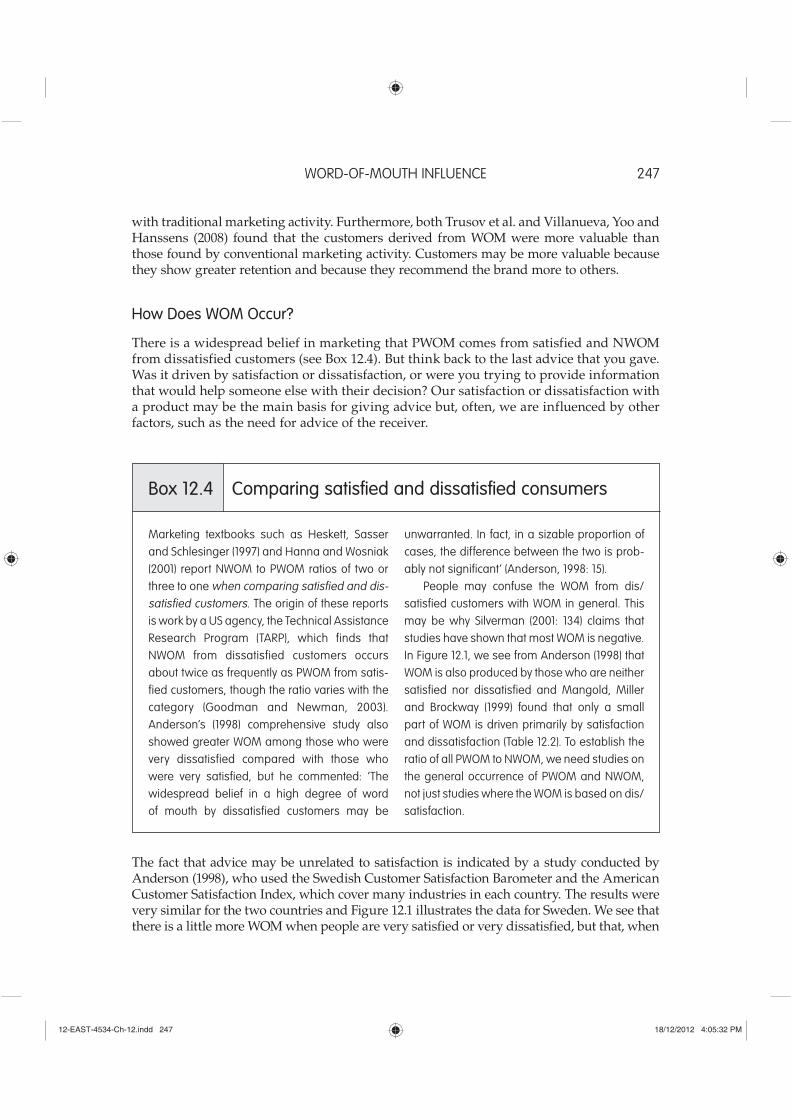
The fact that advice may be unrelated to satisfaction is indicated by a study conducted by Anderson (1998), who used the Swedish Customer Satisfaction Barometer and the American Customer Satisfaction Index, which cover many industries in each country. The results were very similar for the two countries and Figure 12.1 illustrates the data for Sweden. We see that there is a little more WOM when people are very satisfied or very dissatisfied, but that, when
12-EAST-4534-Ch-12.indd 247 18/12/2012 4:05:32 PM
MARKET RESPONSE248
they are neutral about an issue, WOM is still produced at about 80 per cent of the maximum level. This indicates that satisfaction and dissatisfaction need not be involved in the production of WOM and implies that other circumstances are relevant.
These other circumstances are illustrated by Mangold, Miller and Brockway (1999), who asked respondents to describe the last time they received positive or negative advice about a service. Mangold et al. identified ten catalysts that set off WOM, which are shown in Table 12.2. The most common catalyst was the receiver’s felt need, which was either implicit in the situation or made explicit by a request for advice. Coincidental conversation occurred when a conversation led to advice, for example, when a discussion of weekend plans led to a destination recommendation. The communicator’s dis/satisfaction with the service (as judged by the receiver) was the third catalyst and this made up 12 per cent of the total. The fourth catalyst occurred when the recipient made a comment that related to the service, for example, about the communicator’s hair, which led the communicator to recommend her hairdresser. The fifth catalyst was the effort to make a joint decision, such as which restau-rant to go to together. This work does not show that consumer satisfaction and dissatisfac-tion have little to do with WOM. What Mangold et al. found is that it is unusual to find that satisfaction and dissatisfaction are the main factors that cause WOM.
Mangold et al. only considered the catalysts from the standpoint of the receiver but Mazzarol, Sweeney and Soutar (2007) gathered data on both the giver and receiver of WOM, using focus groups, and found that ‘felt need’ was again the trigger for much of the WOM. This evidence means that researchers who have gathered evidence on WOM in
0
2
4
6
8
10
12
14
Satisfaction
Mea
n W
OM
freq
uenc
y
Dissatisfaction
Figure 12.1 Frequency of word of mouth in relation to satisfaction and dissatisfaction in Sweden (adapted from Anderson, 1998)
12-EAST-4534-Ch-12.indd 248 18/12/2012 4:05:32 PM
WORD-OF-MOUTH INFLUENCE 249
relation to dis/satisfaction have focused on only a part of the WOM that is produced. Richins (1983) treated NWOM in this way when she described NWOM as communication that denigrated the product. Halstead (2002) saw both NWOM and complaints as products of dissatisfaction. Similarly, Wetzer, Zeelenberg and Pieters (2007) concentrate on NWOM that arises from dissatisfaction and Goldenberg et al. (2007) also define NWOM in this way. In contrast to this, Asugman (1998) observed that NWOM was an everyday occurrence and need not be associated with dissatisfaction. It seems likely that dis/satisfaction is a condition for much WOM but the evidence from Mangold et al. suggests that it is not normally the main cause of it. However, there is a need for more research here; Mangold et al. used a method called critical incident technique and Mazzarol et al. used focus groups, but neither method is well designed for gathering frequencies.1
A feature of Mangold et al.’s study is the similarity of the catalyst frequencies for PWOM and NWOM; these have a correlation of 0.96. This shows that there is not much difference in the circumstances governing positive and negative advice. Clearly, PWOM makes the choice of a brand more likely and NWOM makes it less likely, but often they are both helpful advice.
Some products generate more WOM than others. Berger and Schwartz (2011) point out that some categories are more interesting than others – one would expect iPhones to get more comment than soap. However, they also observed that some products are more accessible than others; these may be cued by usage or be visible because they are fre-quently present in the environment. Such products (e.g. mobile phones) may stimulate more WOM than those that drop from sight after use, such as films. Berger and Schwartz found that the cued and visible products received more WOM than the interesting but short-term products. The latter were talked about a lot immediately after consumption but WOM then fell away. In a field experiment, they found that WOM could be increased by linking a product to a recurrent feature of the environment. The authors also suggest that advertising could be more effective when this sort of linkage is made.
Table 12.2 Catalysts that stimulate word of mouth (adapted from Mangold, Miller and Brockway, 1999)
StimulusPositive
communication (%)Negative
communication (%) Total (%)
Receiver’s felt need 54 47 50Coincidental communication 16 21 18Communicator’s dis/satisfaction 5 13 9Receiver’s comment about effect of service 9 4 7Joint decision on service 6 6 6Marketing organization’s promotion 2 5 3Receiver’s dis/satisfaction 3 3 3Another’s comment about the effect of service
4 1 2
Media exposure (not marketing organization)
1 1 1
Unsolicited comment 1 0 1
12-EAST-4534-Ch-12.indd 249 18/12/2012 4:05:32 PM
MARKET RESPONSE250
Motives for Giving WOM
Mangold et al. researched catalysts to WOM; these relate to the situational circumstances as well as motives. Others have looked more narrowly at the motivation for WOM. There are circumstances in which people deliberately go out of their way to give advice, most notably when they write product assessments and give advice online, and it is worth understanding why they choose to do this. In an early study before online advice existed, Dichter (1966) reported on the motivation to talk about products. He analyzed interviews and found that people gave advice because this gave them standing with the receiver. The recommendations which people gave were based on experience with the product, involvement with the product, the needs of the receiver and public information (such as ads) on the product. Also using interviews, Sundaram, Mitra and Webster (1998) found that PWOM was motivated by altru-ism, product involvement, self-enhancement and assisting the company producing the product. The motives for giving NWOM were altruism, anxiety reduction, vengeance and as a response to others seeking advice. Hennig-Thurau et al. (2004) turned attention to online advice. Using an online questionnaire, they found that advice was motivated, as in offline, by wanting to vent negative feelings, concern for other consumers, social benefits, economic incentives, helping the company and advice seeking but there were two other factors related to the online environment; one was a form of self-enhancement coming from expressing positive feelings and a second was the assistance provided by the platform to express advice. Related to the second point, Berger and Iyengar (2012) found that more interesting topics are covered online because the medium gives more time to consider topics and to write reviews. One problem with online studies is that the research method may evoke particular forms of PWOM and NWOM that are atypical; a second problem is that the motives are likely to vary with the product category so that aggregate findings are of limited value; and a third problem is that, by asking about motives, researchers may miss important situational determinants of WOM such as the need of the receiver, revealed by Mangold et al.
Is there More PWOM than NWOM?
Naylor and Kleiser (2000) studied users of a health and fitness resort and found more positive comment than negative. Chevalier and Mayzlin (2003) found that the majority of book reviews on two websites were positive. Godes and Mayzlin (2004b) studied TV comment on websites and found that positive appraisals occurred nearly twice as often as negative appraisals. Romaniuk (2007) found four times as much PWOM as NWOM when assessing advice about television programmes. The Keller Fay Group conducts surveys of ‘branded’ conversations that have taken place over the last 24 hours in the USA and the Group has provided us with data for 2009. Sixty-five per cent of these conversations were mainly positive, 8 per cent mainly negative, 15 per cent mixed and 12 per cent neutral. If we assume that people hearing mixed comment on a brand state that they have received both PWOM and NWOM, these data indicate a ratio of 3.5 to 1. East, Hammond and Wright (2007b) examined the ratio of PWOM to NWOM in 15 different studies, covering all the brands in a range of widely used categories (mostly services). In every case, the PWOM incidence exceeded the NWOM incidence and the average ratio was 3.1 to 1. This work was conducted by asking respondents about the PWOM and NWOM that they had given in the
12-EAST-4534-Ch-12.indd 250 18/12/2012 4:05:32 PM
WORD-OF-MOUTH INFLUENCE 251
last six months. In follow-up studies, respondents were asked about the WOM they had received in the last six months and the WOM they would give, if asked. These latter follow-up studies gave PWOM:NWOM ratios of of 2.4 to 1 and 3.4 to 1 respectively. From this evidence, it is clear that there is more PWOM than NWOM, though the ratio varies by category.
Why is there more PWOM? One explanation may be that there are not many negative things to say about goods and services. Mostly, people are satisfied with what they get according to Peterson and Wilson (1992), whose work suggested an average 10:1 ratio of satis-fied to dissatisfied (Chapter 9). A second possibility is that PWOM is seen as more useful. Most consumer choices are about selecting one from many brands. NWOM may eliminate an option but this does not settle the choice if more than one option remains. By contrast, PWOM may be used by a receiver to make a final decision. Thus, if people are trying to help others with their advice, saying what is good may be more constructive than saying what is bad.
How much Do People Talk about Their Current Brand?
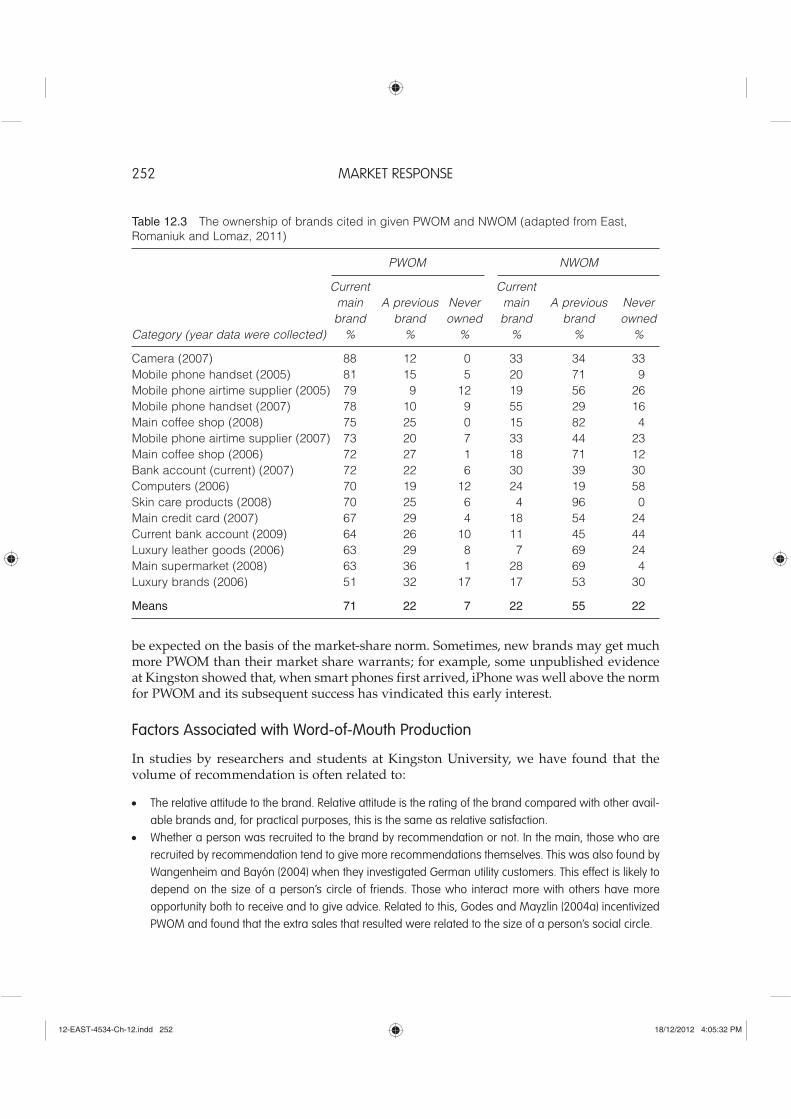
East, Romaniuk and Lomax (2011) investigated whether the brand that was referred to in PWOM and NWOM was currently used, previously used or never used (Table 12.3). Across 15 studies, they found that, on average, 71 per cent of PWOM was about the currently used brand, 22 per cent about a previously used brand and only 7 per cent about a never-used brand. For NWOM, 22 per cent was about the currently used brand, 55 per cent about a previously used brand and 22 per cent about a never-used brand. Wangenheim (2005) also found that NWOM was often about previously owned brands and Winchester and Romaniuk (2008) found that, when people expressed negative beliefs about brands, these were often about previously owned brands. Table 12.3 also shows that people are more willing to give NWOM than PWOM on brands they have not used and this suggests that, sometimes, brands become widely discussed because of their deficiencies. This is a serious worry for managers. Note that the previous work showing more PWOM than NWOM was about all the brands in a category. Individual brands could be the object of more NWOM than PWOM.
How Does the Occurrence of WOM Relate to the Market Share of the Brand?
Bigger brands, with more users, will get more recommendations because, as we see above, most recommendations are about the current main brand. As a result, the volume of rec-ommendation will tend to relate to market share. WOM for previously owned brands will reflect the market share that applied at an earlier time and, if the market has not changed much, this will approximate to the current market share. This means that NWOM volume will also relate to market share, but less so than PWOM because it relates to an earlier market structure. This was tested by Uncles, East and Lomax (2010a). They analyzed data from 13 surveys and found an average correlation between market share and PWOM vol-ume of 0.92. This was significantly greater than the corresponding correlation for NWOM which was 0.73.
This evidence shows that if one brand gets more PWOM than another, it is not necessarily performing better. To do well, a brand must get more PWOM and less NWOM than would
12-EAST-4534-Ch-12.indd 251 18/12/2012 4:05:32 PM
MARKET RESPONSE252
be expected on the basis of the market-share norm. Sometimes, new brands may get much more PWOM than their market share warrants; for example, some unpublished evidence at Kingston showed that, when smart phones first arrived, iPhone was well above the norm for PWOM and its subsequent success has vindicated this early interest.
Factors Associated with Word-of-Mouth Production
In studies by researchers and students at Kingston University, we have found that the volume of recommendation is often related to:
The relative attitude to the brand. Relative attitude is the rating of the brand compared with other avail-able brands and, for practical purposes, this is the same as relative satisfaction.Whether a person was recruited to the brand by recommendation or not. In the main, those who are recruited by recommendation tend to give more recommendations themselves. This was also found by Wangenheim and Bayón (2004) when they investigated German utility customers. This effect is likely to depend on the size of a person’s circle of friends. Those who interact more with others have more opportunity both to receive and to give advice. Related to this, Godes and Mayzlin (2004a) incentivized PWOM and found that the extra sales that resulted were related to the size of a person’s social circle.
Table 12.3 The ownership of brands cited in given PWOM and NWOM (adapted from East, Romaniuk and Lomaz, 2011)
PWOM NWOM
Current Current main A previous Never main A previous Never brand brand owned brand brand owned Category (year data were collected) % % % % % %
Camera (2007) 88 12 0 33 34 33Mobile phone handset (2005) 81 15 5 20 71 9Mobile phone airtime supplier (2005) 79 9 12 19 56 26Mobile phone handset (2007) 78 10 9 55 29 16Main coffee shop (2008) 75 25 0 15 82 4Mobile phone airtime supplier (2007) 73 20 7 33 44 23Main coffee shop (2006) 72 27 1 18 71 12Bank account (current) (2007) 72 22 6 30 39 30Computers (2006) 70 19 12 24 19 58Skin care products (2008) 70 25 6 4 96 0Main credit card (2007) 67 29 4 18 54 24Current bank account (2009) 64 26 10 11 45 44Luxury leather goods (2006) 63 29 8 7 69 24Main supermarket (2008) 63 36 1 28 69 4Luxury brands (2006) 51 32 17 17 53 30
Means 71 22 7 22 55 22
12-EAST-4534-Ch-12.indd 252 18/12/2012 4:05:32 PM
WORD-OF-MOUTH INFLUENCE 253
Whether the communicator recommends other categories. This reflects a disposition, called mavenism, to give advice across a wide range of products (Feick and Price, 1987). Age. The pattern here is that people tend to give and receive less WOM as they age, particularly when they are over 65. This may depend on opportunity, since there is likely to be a loss of social contact as people age, stop work and their children leave home. This topic is covered in more detail in Chapter 6.Whether a brand owner has heard others recommend their brand. We discuss this in Section 4.
Other factors relating to WOM production depend on the categories:
Customer tenure (duration of time as a customer of the brand). The relationship between tenure and PWOM was described in Chapter 2. In brief, East et al. (2005a) found that recommendations fell as tenure increased in the case of credit cards, bank accounts, motor insurance and supermarkets, but recommendation rose in the case of car servicing and fashion shops. In other categories there was no significant effect. Weight of purchase. Heavy buyers quite often give more WOM but not always. Perhaps, in some categories, they habituate to the brand and then become less interested in talking about it.
Interestingly, share-of-category requirement is not usually related to PWOM. High-share customers, by their nature, have more limited experience of brands other than their main one and this may limit their ability to give advice when this involves comparing brands.
SECTION 3: THE IMPACT OF WORD OF MOUTH
What Is the Impact of Positive and Negative Word of Mouth on Brand Choice?
NWOM may be less common than PWOM, but perhaps it has more impact when it does occur? There seems to be a belief among marketers that an instance of NWOM has more effect than an instance of PWOM, and there is some evidence suggesting that this might be true. Arndt (1967) showed twice as much impact on purchase from NWOM than from PWOM, but he studied only one brand. Also, a series of studies has shown a ‘negativity effect’ – that negative information has more impact on attitudes than positive information (Anderson, 1965; Chevalier and Mayzlin, 2003; Fiske, 1980; Herr, Kardes and Kim, 1991; Mittal, Ross and Baldasare, 1998; Mizerski, 1982). In these attitude studies, negative information is less common than positive information and Fiske (1980) has explained that the rarity of negative information makes it more useful than positive information because the latter is what most people already think. Thus, it is the gap between the position supported by the message and the position currently held by the receiver that is the basis for the negativity effect. For example, evidence that a brand is unreliable might be more useful than evidence that the brand is reliable because most people assume that modern products are reliable. Exceptionally, when the receiver’s expectation is negative and the information received is positive, there could be a ‘positivity effect’. Research on the negativity effect is reviewed in detail by Skowronski and Carlston (1989). However, some work has not supported the negativity effect. For example, Ahluwalia (2002) compared
12-EAST-4534-Ch-12.indd 253 18/12/2012 4:05:32 PM
MARKET RESPONSE254
responses to written positive and negative information when participants were familiar or unfamiliar with the brand. When the brand was familiar, there were no significant differences in the impact of positive and negative information.
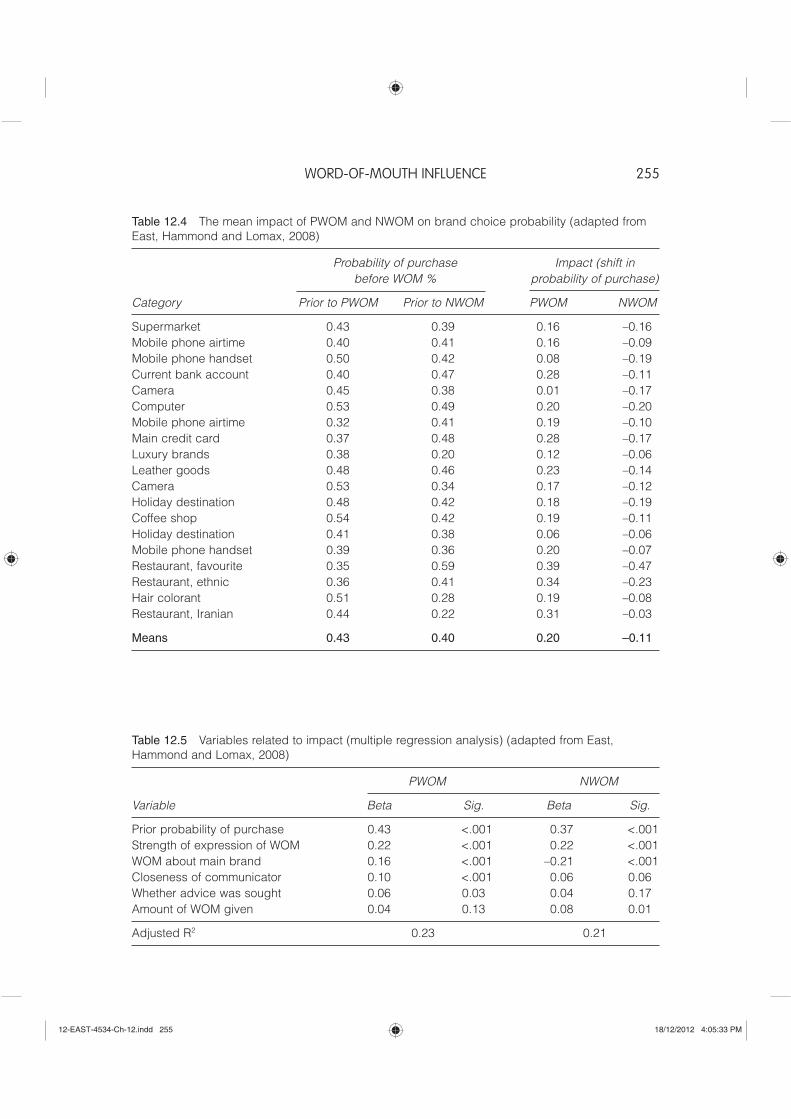
Much of this work has used measures of impact based on change in attitude or thinking. However, in marketing, impact may instead be measured in terms of change in purchase or purchase propensity. People might receive NWOM and change their attitude but not change their intention to purchase. This would happen if, prior to the NWOM, they had zero probability of purchase. East, Hammond and Lomax (2008) used the shift in purchase probability to measure the impact of WOM; they showed that positive advice will have more effect if the receiver has a low likelihood of purchase before the PWOM is received because this leaves more ‘room for change’. Conversely, NWOM will have more effect when the initial probability of purchase is high. This applies the gap notion of the negativity effect to the intention measure of impact. In Table 12.4, we show East et al.’s average results from 19 studies. Respondents were asked what their probability of purchase was before and after hearing the WOM using the Juster (1966) scale, described in Chapter 7, to measure purchase probability.
The mean probability of purchase before WOM was 0.43 for those who received PWOM and 0.40 for those receiving NWOM so that there was slightly more ‘room for change’ in the purchasing probability for the receivers of PWOM (1 – 0.43 = 0.57) than NWOM (0.40). In addition, the impact of PWOM was correspondingly greater in magnitude than that of NWOM (0.20 versus –0.11). These findings suggest that PWOM usually has more impact on brand choice than NWOM when impact is measured as a change in intention. However, as we stated at the beginning of this chapter, it is difficult to study WOM effects, and estimates of past probabilities of purchase could easily be biased by selective recall. For this reason, we should be cautious about these research findings.2
What Variables Affect the Impact of WOM?
East et al. (2008) measured how six variables affected WOM impact, where impact was measured as change in the intention to buy. These were: the prior probability of purchase; how strongly expressed the WOM was; whether the WOM was about the main brand; the closeness of the communicator and receiver (that is, whether a close friend/relative, or not); whether the WOM was sought, or not; and how much advice the respondent reported giving on the category that was studied. These factors were used in a regression analysis to predict impact. Table 12.5 shows the output from the analysis. We see that the prior probability of choice is the most significant factor, supporting the argument in the previous section. For PWOM, the greater the prior probability, the less the change (and the reverse for NWOM). The strength of WOM expression, a variable noted by Mazzarol et al. (2007) as important, is a strong determinant of impact. Also, PWOM about the currently used main brand has more effect than PWOM on other brands, while NWOM on the main brand has less impact than NWOM on other brands. The closeness of the communicator and whether the advice was sought are only significant for PWOM, and the amount of WOM given by the respondent is only significant for NWOM. An interesting feature of Table 12.5 is the similarity in the magnitude of the different determinants, as shown by the beta coefficients. Remember that we have argued that PWOM and NWOM are similar in kind since they are often both intended to help the recipient. Table 12.5 supports this claim.
12-EAST-4534-Ch-12.indd 254 18/12/2012 4:05:32 PM
WORD-OF-MOUTH INFLUENCE 255
Table 12.4 The mean impact of PWOM and NWOM on brand choice probability (adapted from East, Hammond and Lomax, 2008)
Probability of purchase Impact (shift in before WOM % probability of purchase)
Category Prior to PWOM Prior to NWOM PWOM NWOM
Supermarket 0.43 0.39 0.16 –0.16Mobile phone airtime 0.40 0.41 0.16 –0.09Mobile phone handset 0.50 0.42 0.08 –0.19Current bank account 0.40 0.47 0.28 –0.11Camera 0.45 0.38 0.01 –0.17Computer 0.53 0.49 0.20 –0.20Mobile phone airtime 0.32 0.41 0.19 –0.10Main credit card 0.37 0.48 0.28 –0.17Luxury brands 0.38 0.20 0.12 –0.06Leather goods 0.48 0.46 0.23 –0.14Camera 0.53 0.34 0.17 –0.12Holiday destination 0.48 0.42 0.18 –0.19Coffee shop 0.54 0.42 0.19 –0.11Holiday destination 0.41 0.38 0.06 –0.06Mobile phone handset 0.39 0.36 0.20 –0.07Restaurant, favourite 0.35 0.59 0.39 –0.47Restaurant, ethnic 0.36 0.41 0.34 –0.23Hair colorant 0.51 0.28 0.19 –0.08Restaurant, Iranian 0.44 0.22 0.31 –0.03
Means 0.43 0.40 0.20 –0.11
Table 12.5 Variables related to impact (multiple regression analysis) (adapted from East, Hammond and Lomax, 2008)
PWOM NWOM
Variable Beta Sig. Beta Sig.
Prior probability of purchase 0.43 <.001 0.37 <.001Strength of expression of WOM 0.22 <.001 0.22 <.001WOM about main brand 0.16 <.001 –0.21 <.001Closeness of communicator 0.10 <.001 0.06 0.06Whether advice was sought 0.06 0.03 0.04 0.17Amount of WOM given 0.04 0.13 0.08 0.01
Adjusted R2 0.23 0.21
12-EAST-4534-Ch-12.indd 255 18/12/2012 4:05:33 PM
MARKET RESPONSE256
Previous work has shown that close ties have more direct effect than distant ties (Brown and Reingen, 1987) and that sought advice is more influential than advice that is unsought (East et al., 2005a; Bansal and Voyer, 2000). The weak associations shown in Table 12.5 may relate to the method of analysis. When multiple regression is used, other variables that are associated with both the predictor and outcome variables can assume part of the explanation.
The Effect of Brand Commitment
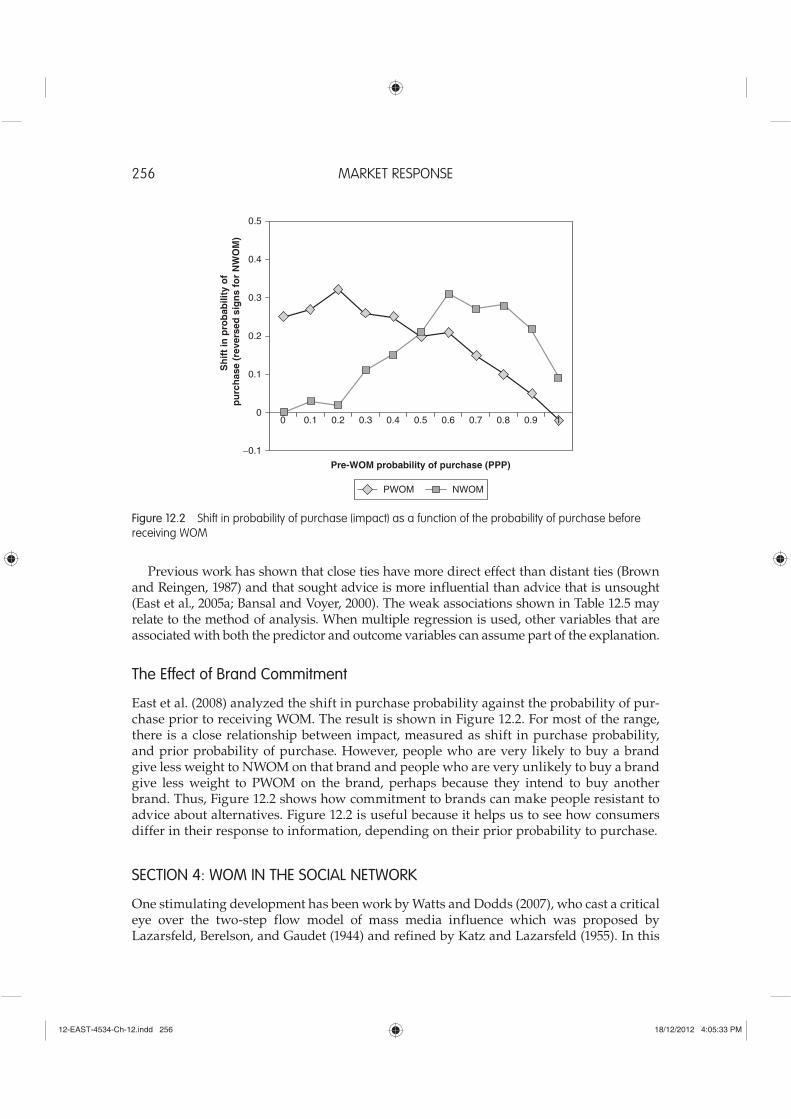
East et al. (2008) analyzed the shift in purchase probability against the probability of pur-chase prior to receiving WOM. The result is shown in Figure 12.2. For most of the range, there is a close relationship between impact, measured as shift in purchase probability, and prior probability of purchase. However, people who are very likely to buy a brand give less weight to NWOM on that brand and people who are very unlikely to buy a brand give less weight to PWOM on the brand, perhaps because they intend to buy another brand. Thus, Figure 12.2 shows how commitment to brands can make people resistant to advice about alternatives. Figure 12.2 is useful because it helps us to see how consumers differ in their response to information, depending on their prior probability to purchase.
SECTION 4: WOM IN THE SOCIAL NETWORK
One stimulating development has been work by Watts and Dodds (2007), who cast a critical eye over the two-step flow model of mass media influence which was proposed by Lazarsfeld, Berelson, and Gaudet (1944) and refined by Katz and Lazarsfeld (1955). In this
−0.1
0
0.1
0.2
0.3
0.4
0.5
0 0.1 0.2 0.3 0.4 0.5 0.6 0.7 0.8 0.9 1
Sh
ift
in p
rob
abili
ty o
f p
urc
has
e (r
ever
sed
sig
ns
for
NW
OM
)
Pre-WOM probability of purchase (PPP)
PWOM NWOM
Figure 12.2 Shift in probability of purchase (impact) as a function of the probability of purchase before receiving WOM
12-EAST-4534-Ch-12.indd 256 18/12/2012 4:05:33 PM
WORD-OF-MOUTH INFLUENCE 257
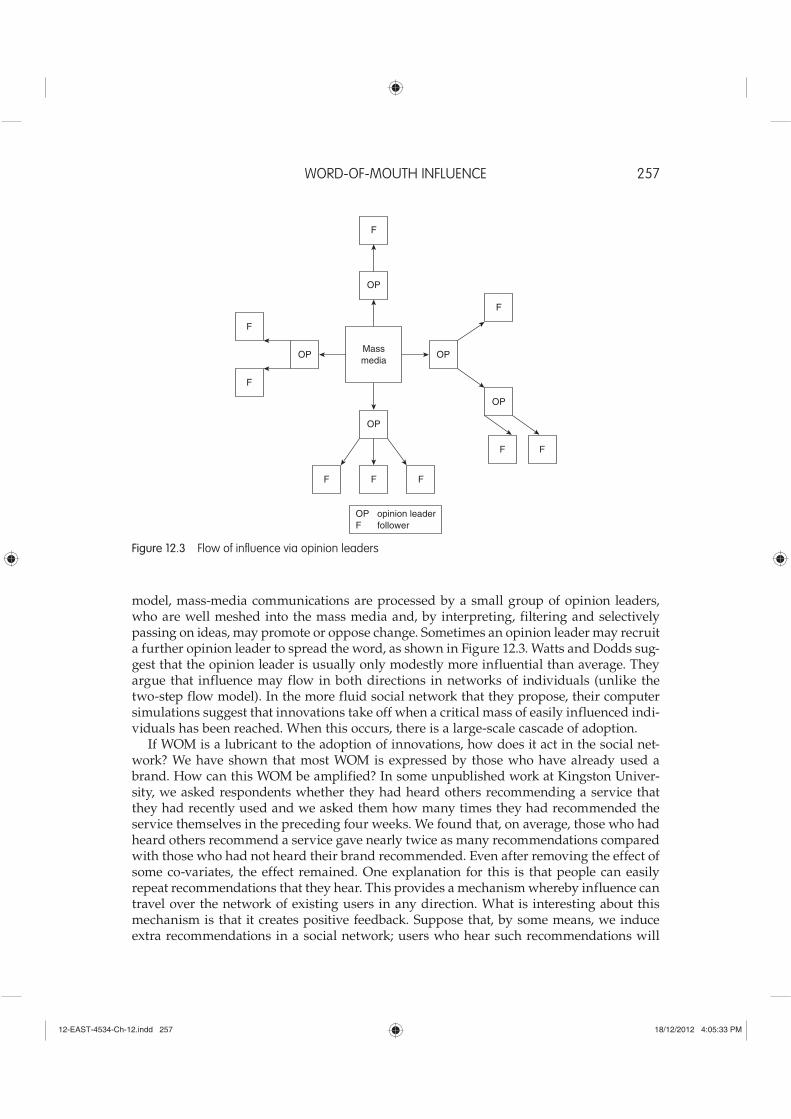
model, mass-media communications are processed by a small group of opinion leaders, who are well meshed into the mass media and, by interpreting, filtering and selectively passing on ideas, may promote or oppose change. Sometimes an opinion leader may recruit a further opinion leader to spread the word, as shown in Figure 12.3. Watts and Dodds sug-gest that the opinion leader is usually only modestly more influential than average. They argue that influence may flow in both directions in networks of individuals (unlike the two-step flow model). In the more fluid social network that they propose, their computer simulations suggest that innovations take off when a critical mass of easily influenced indi-viduals has been reached. When this occurs, there is a large-scale cascade of adoption.
If WOM is a lubricant to the adoption of innovations, how does it act in the social net-work? We have shown that most WOM is expressed by those who have already used a brand. How can this WOM be amplified? In some unpublished work at Kingston Univer-sity, we asked respondents whether they had heard others recommending a service that they had recently used and we asked them how many times they had recommended the service themselves in the preceding four weeks. We found that, on average, those who had heard others recommend a service gave nearly twice as many recommendations compared with those who had not heard their brand recommended. Even after removing the effect of some co-variates, the effect remained. One explanation for this is that people can easily repeat recommendations that they hear. This provides a mechanism whereby influence can travel over the network of existing users in any direction. What is interesting about this mechanism is that it creates positive feedback. Suppose that, by some means, we induce extra recommendations in a social network; users who hear such recommendations will
F
F
F
F F F
F F
OP
OP
OP
F
OPOPMassmedia
OP opinion leaderF follower
Figure 12.3 Flow of influence via opinion leaders
12-EAST-4534-Ch-12.indd 257 18/12/2012 4:05:33 PM
MARKET RESPONSE258
then produce more recommendations themselves and this will induce still more recom-mendations by other users, and so on. The amount of feedback will depend on the propor-tion of the population that are users and the extent to which hearing a recommendation raises the level of giving recommendations. It is possible that a process similar to this could underpin Watts and Dodds’ cascade of influence.
Such ideas may also help us to understand how advertising can affect WOM. It is known that the level of WOM on a product rises in response to advertising (Bayus, 1985; Graham and Havlena, 2007). One mechanism that could cause this is that the ad increases the salience of the brand so that previously used PWOM scripts are more likely to be expressed after the ad has been seen. Brand salience may also be increased by conversa-tions about the ad, since 20 per cent of WOM discussions refer to paid advertising content according to Keller and Fay (2009). In some cases the ad may supply a script that a receiver can repeat; this seems more likely for print and radio ads where information is already in a verbal form that can be passed on.
SECTION 5: APPLICATIONS OF WORD-OF-MOUTH RESEARCH
Net Promoter Score
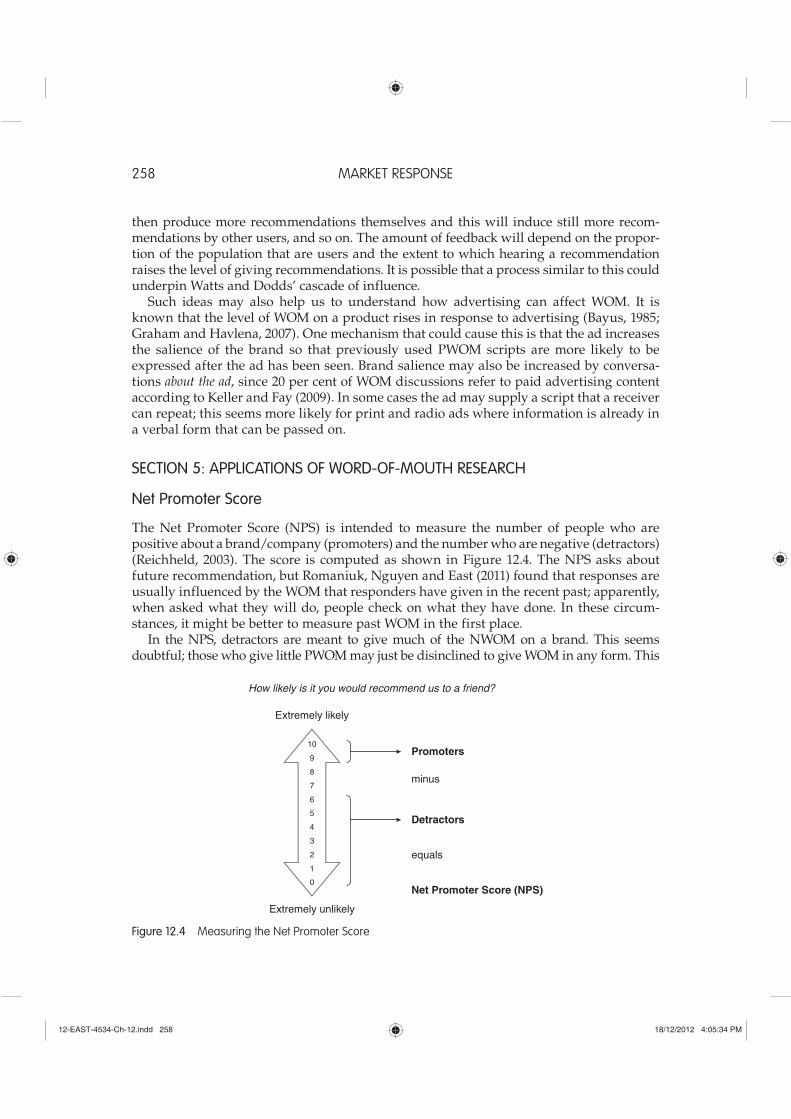
The Net Promoter Score (NPS) is intended to measure the number of people who are positive about a brand/company (promoters) and the number who are negative (detractors) (Reichheld, 2003). The score is computed as shown in Figure 12.4. The NPS asks about future recommendation, but Romaniuk, Nguyen and East (2011) found that responses are usually influenced by the WOM that responders have given in the recent past; apparently, when asked what they will do, people check on what they have done. In these circum-stances, it might be better to measure past WOM in the first place.
In the NPS, detractors are meant to give much of the NWOM on a brand. This seems doubtful; those who give little PWOM may just be disinclined to give WOM in any form. This
10
9
8
7
6
5
4
3
2
1
0
How likely is it you would recommend us to a friend?
Extremely likely
Extremely unlikely
Promoters
minus
Detractors
equals
Net Promoter Score (NPS)
Figure 12.4 Measuring the Net Promoter Score
12-EAST-4534-Ch-12.indd 258 18/12/2012 4:05:34 PM
WORD-OF-MOUTH INFLUENCE 259
was tested by East, Romaniuk and Lomax (2011a). They identified promoters and detractors in three categories and found out how much of the total PWOM and NWOM these groups had produced in the last six months. The detractors produced very little NWOM and, in two of the categories, they gave more PWOM than NWOM. Bear in mind that the NPS is based on customers and much of the NWOM on a brand is produced by ex-customers who were included in the East et al. study but are not included in the NPS measure. It appears that the NPS provides a good indication of PWOM but not NWOM because of the focus on current customers. Also, if we wish to evaluate the way that WOM supports a brand, it would be better to measure the amount of WOM received (the NPS is based on the amount of WOM given).
One of Reichheld’s contentions is that the NPS is a better measure of company perfor-mance than satisfaction. The best-known measure of satisfaction is the American Customer Satisfaction Index (ACSI), first developed in Sweden by Fornell (1992) and discussed in Chapter 9. The predictions of the ACSI and the NPS have been compared (e.g. Morgan and Rego, 2006; Keiningham et al., 2007) and generally the ACSI has been superior. However, because both the NPS and the ACSI are restricted to recent customers, there is potential for a better WOM-based measure that covers all consumers.
Reichheld’s thesis has recently been restated (Reichheld and Markey, 2011) but this book gives no answers to NPS critics. Instead, it emphasizes a corporate philosophy of designing management systems that deliver to customers the product that they like and will talk about. It is difficult to argue with this but what people like and dislike needs measurement and the NPS clearly could be improved as a measure.
Influentials or Current Users?
In the two-step flow model, advertising is relayed by a limited group of ‘influentials’ or opinion leaders who recommend widely. Thus, a popular strategy is to identify these influentials and direct communications to them. As we have seen, Watts and Dodds (2007) criticized the two-step flow model and suggested that influence was more widely spread in the network. Related to this, Balter and Butman (2005) argue that WOM is more effec-tive when it is delivered by ordinary people. Furthermore, research by Goodey and East (2008) showed that those who scored high on the mavenism index (Feick and Price, 1987) did not give much more WOM than those who scored low, so it may be difficult to identify truly influential people.
To some extent, the best strategy depends on cost. If costs are low (as when the Internet is used), it makes sense to target all those on a customer database. However, the messages need to differ between current users (responsible for most of the PWOM) and ex-users (responsible for most of the NWOM). If costs are high, it may pay to focus on the influentials; this is what happens when BzzAgents are given products to talk about. However, whether all users or just influentials are targeted, there is a need for research to find out what sort of information people pass on and what impact different forms of information have on receivers.
A popular method of using WOM from current customers is the referral programme. This is a managed intervention designed to add to naturally occurring PWOM. Often there is a reward for the person making a successful referral and sometimes an incentive for the person referred. There is evidence that the customers acquired through such campaigns are more valuable (Schmitt, Skiera and Van den Bulte, 2011).
12-EAST-4534-Ch-12.indd 259 18/12/2012 4:05:34 PM
MARKET RESPONSE260
Stopping Negative and Promoting Positive Comments
Suppliers may be able to use their customer databases to direct information to groups who could be criticizing the product. In Table 12.3, we showed that about one-fifth of negative advice relates to the communicator’s main brand. Some of this negative advice is not because the brand is disliked but because the communicator thinks that it is unsuitable for another person and it is probably unrealistic to try to reduce this sort of NWOM. However, some of the NWOM about a currently used brand may reflect dissatisfaction with the brand and, where possible, this sort of WOM should be counteracted. Even if it is impossible to detect the minority who criticize their main brand, it may still be possible to deal with common complaints by communicating with all customers. By doing so, both NWOM and defection may be targeted.
Most cases of NWOM come from past customers, who are usually still on databases. Normally, past customers are contacted with a view to recovering them but there may also be value in contact designed to counteract NWOM. When products have improved, those who no longer buy them are unlikely to know about the improvement and may continue to criticize their previous brand offering on the assumption that it is unchanged. By sending past customers information about brand improvements, suppliers may be able to lessen NWOM. East et al. (2007) found that those who gave NWOM were much more likely to give PWOM (probably on another brand); this suggests that a person who stops giving NWOM could become a strong recommender.
Information, Not Hearsay
When there are widespread misunderstandings in research evidence, there is a danger that strategies will be misjudged. Many beliefs about WOM appear to have been mistaken. It is not true that NWOM is more common than PWOM according to the evidence that has now accumulated and it does not appear that there is much evidence that NWOM has more impact. The role of satisfaction or dissatisfaction in the genesis of WOM has probably been over-emphasized. Nor is it generally true that long-term customers usually recom-mend more than short-term customers. More research findings are needed to displace such hearsay and to inform well-based marketing strategies.
SUMMARY
PWOM and NWOM are powerful influences on consumer choice but they are difficult to study. Internet research deals with only a small fraction of those giving advice, experimental research lacks rele-vance to natural settings, and survey research is prone to bias. In the absence of good evidence, some misunderstanding has occurred. It now appears that much of WOM is given to help others, and dis/satisfaction, though relevant, may not be needed for WOM. Therefore, comparisons between satisfied and dissatisfied customers are inappropriate for determining the occurrence and impact of PWOM and NWOM.
12-EAST-4534-Ch-12.indd 260 18/12/2012 4:05:34 PM
WORD-OF-MOUTH INFLUENCE 261
PWOM tends to be about the communicator’s current main brand and NWOM about previously owned brands. These patterns produce a strong association between the volume of PWOM and market share and a somewhat weaker association between NWOM volume and market share. Market share thus provides a norm for the amount of PWOM and NWOM that brands should receive on average and this allows measurement of better or worse performance for individual brands.
Research evidence shows that PWOM is more common than NWOM and that, in general, PWOM has somewhat more impact on the probability of purchase than NWOM. Impact is related to the probability of purchase before the WOM is received, the strength of expression of WOM, and whether the WOM is about the current main brand or not. Those people who are very likely to buy a brand give less weight to NWOM on this brand and those who are very unlikely to purchase the brand give less weight to PWOM on it.
There is uncertainty about the process whereby influence passes through the social structure. The two-step flow model (in which the mass media affect opinion leaders who then pass the message on to followers) has been criticized by Watts and Dodds (2007) who argue that influence is more dispersed and is bi-directional. One suggestion is that WOM production is increased by product users when they hear others recommend their brand, and this would make influence omni-directional and more dependent on ownership than opinion leadership. Managers, seeking to influence WOM, may target opinion leaders, if they can be identified, or they can seek to influence their whole customer base. The best strategy depends on costs; when these are low it is better to target the whole customer base.
The Net Promoter Score (Reichheld, 2003) is a measure of WOM, but this measure, along with the American Consumer Satisfaction Index, is based on customers and it is ex-customers who express most of the negative sentiment about brands. The Net Promoter Score measures PWOM but is a poor measure of NWOM.
Additional Resources
To see how word-of-mouth impact varies between categories and for a further review of the literature, see East, Hammond and Lomax (2008) and Mangold, Miller and Brockway (1999) who are concerned with the circumstances under which WOM is produced. It is worth checking the websites for the WOM agencies mentioned earlier, www.bzzagent.com, www.business.tremor.com and also www.womma.org. One marketing text has tried to apply the new thinking covered in this chapter, namely Allan Kimmel’s (2010) Connecting with Consumers, Oxford: Oxford University Press. Some very interesting new work is coming from Wharton; check the Internet.
Note
1 However, some recent work, so far unpublished, suggests that Mangold et al.’s method (critical incident technique) may have affected his data. Using a survey method, satisfaction and dissatisfac-tion appear to be more common factors inducing WOM.
2 A critic might argue that a better measure of impact would relate the shift in probability to the move-ment necessary to reach certainty. On this basis, the effect of PWOM would average 0.20/0.57 = 0.35 compared with 0.11/0.40 = 0.28 so, even on this basis, PWOM has more effect. Note that this is an average effect; in some categories NWOM is clearly more influential as Table 12.4 indicates.
12-EAST-4534-Ch-12.indd 261 18/12/2012 4:05:34 PM
Related Documents


