PERFORMANCE EVALUATION OF TRANSIT DATA FORMATS 1 ON A MOBILE DEVICE 2 3 Sean J. Barbeau (Corresponding Author) 4 Center for Urban Transportation Research 5 University of South Florida 6 Tampa, FL 33620 7 813-974-7208 8 [email protected] 9 10 Tatu Saloranta 11 FasterXML, LLC 12 Seattle, WA 98103 13 [email protected] 14 15 November 15, 2013 16 17 5,189 words + 9 figures (2,250) = 7,439 words 18 19 Abstract 20 Over the last decade mobile devices have changed how we access transportation information. 21 However, many past data formats used in information services have been designed without the 22 processing and energy constraints of mobile devices in mind. Newer standards, such as the 23 Service Interface for Real-time Information (SIRI) v2.0, are including mobile-friendly features 24 that reduce the processing overhead on mobile devices. Coupled with the advances in mobile 25 device processing capabilities, many believe that performance is no longer an issue of concern in 26 modern mobile phones. This paper presents an evaluation of the SIRI data format on a mobile 27 device, which indicates that not only is performance still an issue, but that app developers should 28 carefully consider certain software design choices to avoid exposing mobile users to extensive 29 wait times (e.g., wait for real-time transit arrival information). The results also demonstrate that 30 information service providers should always offer mobile-friendly interfaces (i.e., RESTful web 31 services with JSON encoding) when possible. The benchmarking software is made available as 32 an open-source application so that others can perform their own experiments, and so that app 33 developers can use this library as a foundation for building new applications based on the SIRI 34 format. 35 36

Welcome message from author
This document is posted to help you gain knowledge. Please leave a comment to let me know what you think about it! Share it to your friends and learn new things together.
Transcript
PERFORMANCE EVALUATION OF TRANSIT DATA FORMATS 1
ON A MOBILE DEVICE 2
3
Sean J. Barbeau (Corresponding Author) 4
Center for Urban Transportation Research 5
University of South Florida 6
Tampa, FL 33620 7
813-974-7208 8
10
Tatu Saloranta 11
FasterXML, LLC 12
Seattle, WA 98103 13
15
November 15, 2013 16
17
5,189 words + 9 figures (2,250) = 7,439 words 18
19
Abstract 20
Over the last decade mobile devices have changed how we access transportation information. 21
However, many past data formats used in information services have been designed without the 22
processing and energy constraints of mobile devices in mind. Newer standards, such as the 23
Service Interface for Real-time Information (SIRI) v2.0, are including mobile-friendly features 24
that reduce the processing overhead on mobile devices. Coupled with the advances in mobile 25
device processing capabilities, many believe that performance is no longer an issue of concern in 26
modern mobile phones. This paper presents an evaluation of the SIRI data format on a mobile 27
device, which indicates that not only is performance still an issue, but that app developers should 28
carefully consider certain software design choices to avoid exposing mobile users to extensive 29
wait times (e.g., wait for real-time transit arrival information). The results also demonstrate that 30
information service providers should always offer mobile-friendly interfaces (i.e., RESTful web 31
services with JSON encoding) when possible. The benchmarking software is made available as 32
an open-source application so that others can perform their own experiments, and so that app 33
developers can use this library as a foundation for building new applications based on the SIRI 34
format. 35
36
S. Barbeau, T. Saloranta 2
1. INTRODUCTION 1
Mobile devices have become ubiquitous over the last decade. In late 2011, there were an 2
estimated 5.9 billion cellular subscriptions worldwide with a global penetration rate of 87% [1]. 3
In the United States, as of December 2012 there were 326.4 million cellular subscriptions, a 4
penetration rate of 102.2% (indicating that some users have multiple subscriptions) [2]. As a 5
result, the population’s reliance on such devices for completing everyday tasks has increased. 6
According to a 2009 survey, 82% of Americans never leave their house without their phone, and 7
42% stated “they cannot live without their phone” [3]. 8
Since mobile devices aren’t restricted to a single location, they are natural tools that 9
travelers can use to access real-time information during a commute. Research has shown that 10
transit riders with access to real-time information wait around 2 minutes less for a bus than those 11
without real-time information [4]. In the same study, riders with real-time information perceived 12
their wait time to be around 30% shorter than riders without real-time information, indicating 13
that real and perceived benefits both exist [4]. 14
As is common in the early years of technology growth, mobile device and mobile app 15
evolution has been organic, with a variety of companies and individuals filling the need for 16
various transportation services as they emerge, often using a variety of proprietary data formats. 17
Eventually, however, the issue of interoperability between systems must be addressed. For 18
example, many of today’s mobile transit apps developed in one city cannot easily function in 19
another city due to differing real-time data formats. Standards, or formats agreed upon by a 20
group of stakeholders, can potentially benefit the industry by establishing a consensus on 21
communication protocols. This would, for example, enable one city to establish a real-time data 22
feed that is identical to another city, so that mobile apps for first city would be transferrable to 23
the second. 24
When examining data formats in the context of mobile device communication, key 25
differences from desktop computers have been observed in the areas of processing power, 26
communications, and energy constraints [5, 6]. Due to smaller form-factors, mobile devices 27
typically have lower-powered processors that generate less heat, resulting in lower processing 28
performance when compared to a desktop computer. Additionally, mobile devices have a 29
constrained wireless communication channel, both in terms of speed, which is slower than a 30
typical wired broadband connection, and in terms of the amount of allowed data transfer, which 31
is typically paid for by the wireless subscriber based on a tiered data plan (i.e., transferring more 32
data costs more money). Finally, mobile devices have significant energy limitations – they are 33
battery-powered, and all application actions (e.g., program execution, wireless transmissions) 34
consume energy. 35
New data standards should recognize the importance, and limitations, of mobile devices. 36
As of August 2013, the European Committee for Standardization (CEN) is in the process of 37
ratifying the new v2.0 version of the Service Interface for Real Time Information (SIRI) 38
(CEN/TS 15531) standard [7]. SIRI v2.0 includes a new “mobile-friendly” version of this 39
standard, or “SIRI Lite”, based on the experience of the Metropolitan Transit Authority (MTA) 40
when implementing the MTA Bus Time real-time transit information system in New York [8]. 41
With new “mobile friendly” data formats becoming available, and with the processing 42
capabilities of new smart phones on the market approaching 2.0 GHz and eight-core CPUs, one 43
may think that the burden on app developers for implementing smart and efficient apps is lifted. 44
However, this is far from true. 45

S. Barbeau, T. Saloranta 3
This paper presents a performance evaluation of device-to-server communication using 1
the SIRI data format on a modern smart phone. The results indicate that not only is performance 2
still an issue, but that app developers should carefully consider certain software design choices to 3
avoid exposing mobile users to extensive wait times (e.g., for real-time transit arrival 4
information). The results also demonstrate that information service providers should always 5
offer mobile-friendly interfaces when possible. Optimizations to reduce user wait times are also 6
presented. 7
Fast processing of data from a server is important because it has a direct effect on the 8
amount of time a user has to wait before they can see results fetched from the internet. For 9
example, when a user removes a phone from their pocket, opens the device, and requests updated 10
transit arrival information for their current location, the device must retrieve this information 11
from a server (e.g., a SIRI API). The user will be shown a “Please wait…” screen until the 12
device receives and completely parses a server response. Slower parsing also typically results in 13
longer CPU, screen, and radio usage, which all negatively affect battery life. 14
The benchmarking software used for these experiments is made available as an open-15
source application so that others can perform their own experiments, and so that app developers 16
can use this library as a foundation for building new applications using the SIRI format [9]. 17
2. DATA COMMUNICATIONS FOR MOBILE DEVICES 18
Fast processing of data from a server is important because it has a direct effect on the amount of 19
time a user has to wait before they can see results fetched from the internet. For example, when 20
a user removes a phone from their pocket, opens the device, and requests updated transit arrival 21
information for their current location, the device must retrieve this information from a server 22
(e.g., a SIRI API). The user will be shown a “Please wait…” screen until the device receives and 23
completely parses a server response. Slower parsing also typically results in longer CPU, screen, 24
and radio usage, which all negatively affect battery life. 25
When discussing device-to-server communication and performance, there are two typical 26
high-level design choices for a web service, or API: 27
1. The protocol used to transfer data 28
2. The format of the data being transferred 29
Protocols 30
The Hypertext Transfer Protocol (HTTP) underlies most internet communication, and therefore 31
typically plays a role in most API designs [10]. However, a second protocol, SOAP, emerged in 32
the early 2000s to support advanced enterprise server-to-server communication [11]. SOAP uses 33
the Extensible Markup Language (XML) to define protocol properties. 34
While SOAP has proven useful for advanced server-to-server communication, it is not 35
well suited for mobile devices. The extensive use of XML results in a large overhead being 36
added to each message. 37
An alternate, simpler protocol for web services, termed “RESTful” web services, is to 38
rely only on HTTP in a state-less design, which does not require advanced record-keeping on the 39
mobile device or server during communication and does not use XML in the protocol itself. 40
Previous research has shown that RESTful web services have a significantly less impact on 41
mobile devices resources [5, 6] than SOAP-based web services. One of the improvements to the 42
SIRI v2.0 “SIRI Lite” format was the inclusion RESTful query support. Since the benefits of 43
S. Barbeau, T. Saloranta 4
RESTful web services over SOAP-based web services has been demonstrated in previous 1
research, this paper focuses primarily on data formats. 2
Data Formats 3
After a protocol that defines the order and properties of data exchange is chosen, the actual 4
format of the data must be defined. Two popular data formats for web services are XML and 5
Javascript Object Notation (JSON) [12]. 6
7
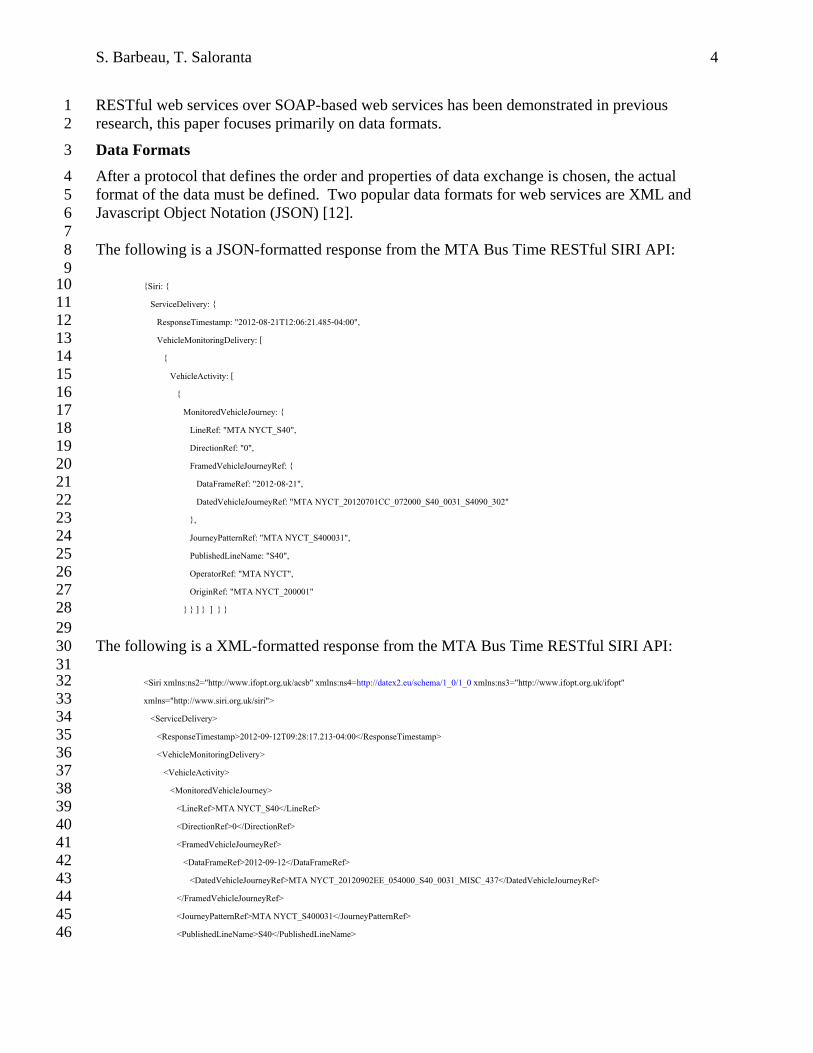
The following is a JSON-formatted response from the MTA Bus Time RESTful SIRI API: 8
9 {Siri: { 10 ServiceDelivery: { 11 ResponseTimestamp: "2012-08-21T12:06:21.485-04:00", 12 VehicleMonitoringDelivery: [ 13 { 14 VehicleActivity: [ 15 { 16 MonitoredVehicleJourney: { 17 LineRef: "MTA NYCT_S40", 18 DirectionRef: "0", 19 FramedVehicleJourneyRef: { 20 DataFrameRef: "2012-08-21", 21 DatedVehicleJourneyRef: "MTA NYCT_20120701CC_072000_S40_0031_S4090_302" 22 }, 23 JourneyPatternRef: "MTA NYCT_S400031", 24 PublishedLineName: "S40", 25 OperatorRef: "MTA NYCT", 26 OriginRef: "MTA NYCT_200001" 27 } } ] } ] } } 28
29
The following is a XML-formatted response from the MTA Bus Time RESTful SIRI API: 30
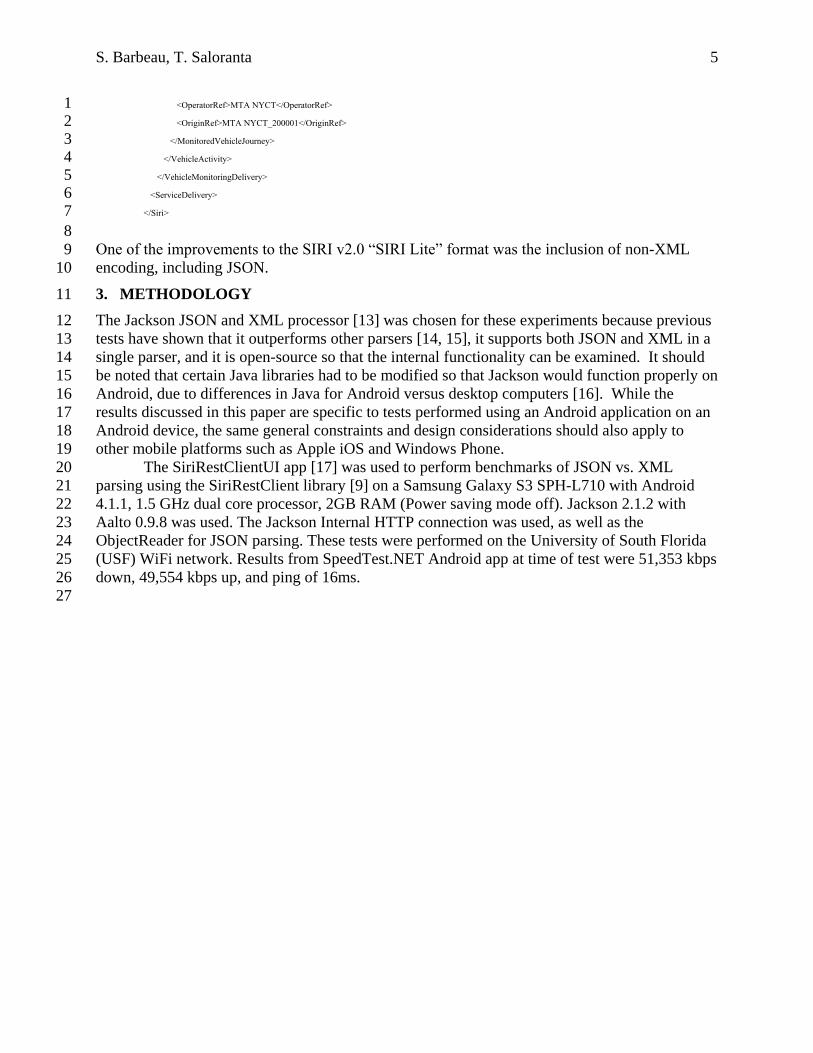
31 <Siri xmlns:ns2="http://www.ifopt.org.uk/acsb" xmlns:ns4=http://datex2.eu/schema/1_0/1_0 xmlns:ns3="http://www.ifopt.org.uk/ifopt" 32 xmlns="http://www.siri.org.uk/siri"> 33 <ServiceDelivery> 34 <ResponseTimestamp>2012-09-12T09:28:17.213-04:00</ResponseTimestamp> 35 <VehicleMonitoringDelivery> 36 <VehicleActivity> 37 <MonitoredVehicleJourney> 38 <LineRef>MTA NYCT_S40</LineRef> 39 <DirectionRef>0</DirectionRef> 40 <FramedVehicleJourneyRef> 41 <DataFrameRef>2012-09-12</DataFrameRef> 42 <DatedVehicleJourneyRef>MTA NYCT_20120902EE_054000_S40_0031_MISC_437</DatedVehicleJourneyRef> 43 </FramedVehicleJourneyRef> 44 <JourneyPatternRef>MTA NYCT_S400031</JourneyPatternRef> 45 <PublishedLineName>S40</PublishedLineName> 46
S. Barbeau, T. Saloranta 5
<OperatorRef>MTA NYCT</OperatorRef> 1 <OriginRef>MTA NYCT_200001</OriginRef> 2 </MonitoredVehicleJourney> 3 </VehicleActivity> 4 </VehicleMonitoringDelivery> 5 <ServiceDelivery> 6 </Siri> 7
8
One of the improvements to the SIRI v2.0 “SIRI Lite” format was the inclusion of non-XML 9
encoding, including JSON. 10
3. METHODOLOGY 11
The Jackson JSON and XML processor [13] was chosen for these experiments because previous 12
tests have shown that it outperforms other parsers [14, 15], it supports both JSON and XML in a 13
single parser, and it is open-source so that the internal functionality can be examined. It should 14
be noted that certain Java libraries had to be modified so that Jackson would function properly on 15
Android, due to differences in Java for Android versus desktop computers [16]. While the 16
results discussed in this paper are specific to tests performed using an Android application on an 17
Android device, the same general constraints and design considerations should also apply to 18
other mobile platforms such as Apple iOS and Windows Phone. 19
The SiriRestClientUI app [17] was used to perform benchmarks of JSON vs. XML 20
parsing using the SiriRestClient library [9] on a Samsung Galaxy S3 SPH-L710 with Android 21
4.1.1, 1.5 GHz dual core processor, 2GB RAM (Power saving mode off). Jackson 2.1.2 with 22
Aalto 0.9.8 was used. The Jackson Internal HTTP connection was used, as well as the 23
ObjectReader for JSON parsing. These tests were performed on the University of South Florida 24
(USF) WiFi network. Results from SpeedTest.NET Android app at time of test were 51,353 kbps 25
down, 49,554 kbps up, and ping of 16ms. 26
27

S. Barbeau, T. Saloranta 6
1 FIGURE 1 - XML vs. JSON Parsing - Elapsed Time from Request to Parsed Response for 50 Requests 2
50 requests were performed back-to-back using the MTA BusTime SIRI StopMonitoring 3
API. A timestamp recording feature in the SiriRestClientUI app and SiriRestClient library 4
captured how long a request took, from when the request was issued to when a Siri object 5
became available from Jackson. 6
4. RESULTS 7
The elapsed time from request to parsed response for 50 sequential requests is shown in FIGURE 8
1. There is a substantial difference between the "cold start" times (i.e., the first request) for both 9
JSON and XML. The time for the XML cold start response is almost 18 seconds, over 4 times as 10
long as the JSON cold start response (approximately 4 seconds). After the cold start, the 11
differences between the response times for JSON and XML are much smaller. 12
FIGURE 2 shows the summary statistics for XML and JSON parsing time for this test. 13
JSON outperforms XML in average response time of 401ms, vs. the XML average response time 14
of 625ms. 95th percentile of elapsed times is closer, with JSON having a 95th percentile of 15
501ms and XML having a 95th percentile of 626ms. The increase in standard deviation for XML 16
response time reflects the initial large cold start value that is substantially larger than the 17
following warm starts. The size of the JSON response was approximately 4KB, with the XML 18
response being approximately 5KB. 19
20
0
2000
4000
6000
8000
10000
12000
14000
16000
18000
20000
1 3 5 7 9 11 13 15 17 19 21 23 25 27 29 31 33 35 37 39 41 43 45 47 49
Elap
sed
Tim
e (
ms)
XML vs. JSON Parsing Time - All Requests
JSON XML

S. Barbeau, T. Saloranta 7
1 FIGURE 2 - XML vs. JSON Parsing - Summary Statistics for the Elapsed Time of 50 Requests 2
5. DISCUSSION 3
The first execution of a request to the server (i.e., a cold start) typically takes much longer than 4
subsequent requests (i.e., warm starts). This is because Jackson will dynamically construct Class 5
model from Java class definitions the first time deserializers are needed (typically when the 6
application initiates the request and the readValue() method is called). Here, JSON yields 7
significant better performance than XML - JSON performance is over 4 times faster than XML 8
with a time difference of 14 seconds. This is likely due to the additional annotation accesses 9
required for XML, an area in which Android currently performs poorly [18]. However, poor 10
XML performance when compared to JSON is not unique to Android. Other performance 11
evaluations for desktop Java virtual machines have found similar relationships, with JSON 12
processing outperforming XML processing for the same encoded content [19]. This likely 13
indicates that XML processing for cold starts will typically perform worse than JSON processing 14
on any Java virtual machine, and possibly on virtual machines for other programming languages 15
as well. 16
After this initial cold start, Jackson will typically parse subsequent responses more 17
quickly for both JSON and XML. As stated above, JSON has a slight performance advantage for 18
warm starts too - an average of 224ms faster than XML. Since recent human-computer 19
interaction studies have indicated that users can perceive time differences of 100ms when 20
waiting for a response [20], JSON still yields a noticeable performance increase for warm starts 21
from the user's perspective. 22
On Android, the warm start state can persist even if the app is closed by the user and re-23
opened. Android devices will typically keep recently closed apps in memory as a cached 24
background process to enhance future startup performance. When the user "starts" the app, it is 25
actually loading the application from the cached process in memory, which loads all the Jackson 26
data structures needed to perform quick parsing on warm starts without needing to re-initialize 27
them from a cold start state. As a result, when comparing tests, it’s important to note that the first 28
S. Barbeau, T. Saloranta 8
execution of the app will typically show significantly worse performance than subsequent warm 1
starts. 2
While the warm start state provides a significant advantage in response time 3
performance, it unfortunately cannot be relied upon for consistent performance increases after an 4
app is started on the device. Android may remove a cached process from memory if the platform 5
is running low on memory. Given the multitasking that typically occurs on most cell phones, 6
especially in a scenario where the user is waiting for a bus to arrive, performing tasks such as 7
checking email, internet browsing, or using social networking apps may result in the real-time 8
transit app being removed from the app cache. At this point, the app will revert to the cold start 9
state and there may be a significant delay in retrieving transit data. The size of the 10
SiriRestClientUI cached process was observed to typically be between 24-31MB, which is large 11
for a frequently used app. For comparison, on a Samsung Galaxy S3 the following apps had the 12
following cached sizes - Calendar app = 7.2MB, Clock = 16MB, Google+ = 17MB, Maps = 13
13MB. Since the largest non-system processes are typically the first targets for process cache 14
eviction, it is likely that this app would frequently be restored to a cold start state. 15
The above observations lead to the development of a manual caching strategy for Jackson 16
objects on Android in an attempt to consistently reduce the cold start penalty for response times. 17
The follow section discusses the results of these Jackson object manual caching optimizations. 18
6. OPTIMIZATIONS USING PARSER OBJECT CACHING 19
To improve cold start performance of retrieving and parsing the SIRI responses using Jackson, 20
further control over the caching process must be achieved. A strategy called "Pseudo-warm 21
starts" was developed, which is defined as follows: 22
23
Pseudo-warm start = An artificial warm-start by the app, where the Jackson object is 24
manually cached to persistent memory by the app and read from memory during app 25
startup (in what would otherwise be a cold start). 26
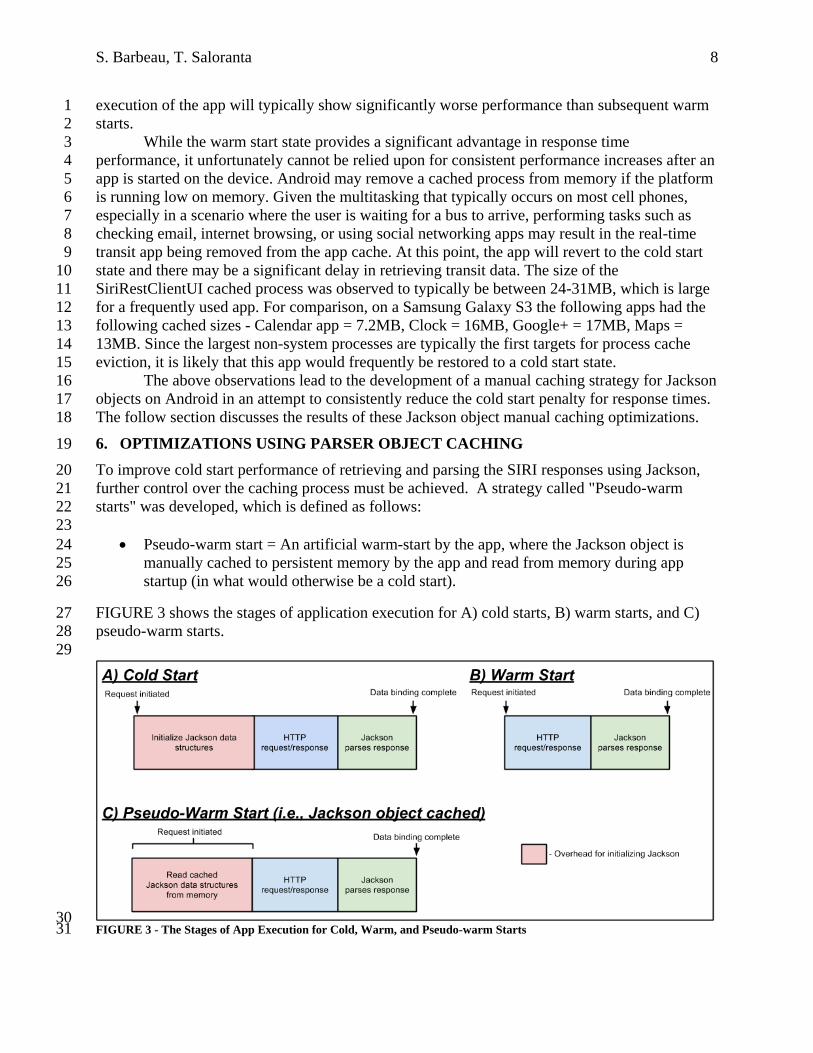
FIGURE 3 shows the stages of application execution for A) cold starts, B) warm starts, and C) 27
pseudo-warm starts. 28
29
30 FIGURE 3 - The Stages of App Execution for Cold, Warm, and Pseudo-warm Starts 31

S. Barbeau, T. Saloranta 9
The red-shaded blocks (i.e., the first block in FIGURE 3A and FIGURE 3C) indicate the 1
overhead required to initialize Jackson (note that warm starts, FIGURE 3B, do not have this 2
overhead). In FIGURE 3C, the normal Jackson initialization process is replaced with reading the 3
cached Jackson objects that were initialized in a previous application execution and then written 4
to a persistent cache (i.e., the pseudo-warm start). A note-worthy property of pseudo-warm starts 5
is that the cache read can be initiated on application start-up without requiring user initiation. 6
This flexibility is indicated in FIGURE 3 via the "Request initiated" bracket over the entire cache 7
read period, as the request may be initiated by the user at any point during the cache read. The 8
flexibility of when the cache read is initialized is important in later discussions of this 9
optimization. 10
The goal of the next set of experiments was to evaluate whether the cache read used in 11
pseudo-warm starts was faster than the normal Jackson initialization process in cold starts. 12
Methodology 13
The SiriRestClientUI app with the SiriRestClient library was again used to perform benchmarks 14
of JSON vs. XML parsing on the same Samsung Galaxy S3 device and with the same settings as 15
the previous tests. Results from SpeedTest.NET Android app at time of test were 52,176 kbps 16
down, 78,721 kbps up, and ping of 15 ms. 17
18
30 requests were performed using the MTA BusTime SIRI StopMonitoring API. The 19
following steps were repeatedly taken to reset to a cold start state between each cold start test, 20
and to the pseudo-warm start state for the pseudo warm start tests: 21
A. A cold start response time was measured, 22
B. Caching was turned on in the app and another request was made so the app caches the 23
Jackson object used to make requests to persistent memory - cache write time and cached 24
Jackson object size were measured, 25
C. The Android cached process was manually removed from memory via the Application 26
Manager to reset to a cold start state, 27
D. A pseudo-warm start response time was measured (= Time to read cached object + 28
elapsed response time). 29
E. Caching was turned off in the app, and the Android cached process was manually 30
removed from memory via the Application Manager to reset to a cold start state 31
Results 32
First, the performance of cold vs. pseudo-warm starts when using XML to format the server 33
response was examined. FIGURE 4 shows the elapsed time of 30 cold and pseudo-warm start 34
tests, and FIGURE 5 shows the summary of the results from these tests. 35
36

S. Barbeau, T. Saloranta 10
1 FIGURE 4 - Cold vs. Pseudo-Warm Start performance for XML responses from 30 requests 2
3 FIGURE 5 - Cold vs. Pseudo-Warm Start performance for XML responses - Summary 4
Because of the large cold start penalties, improve the performance of XML parsing via pseudo-5
warm starts and caching is substantially improved. Cold starts had an average elapsed time of 6
17.7 seconds, and pseudo-warm starts had an average of only 9.7 seconds, an 8 second 7
improvement. Overall, pseudo-warm starts thereby yield an average of a 44% performance 8
increase over cold starts, a dramatic improvement. 9
0.00
5,000.00
10,000.00
15,000.00
20,000.00
25,000.00
1 2 3 4 5 6 7 8 9 10 11 12 13 14 15 16 17 18 19 20 21 22 23 24 25 26 27 28 29 30
Elap
sed
Tim
e (
ms)
XML - Cold vs. Pseudo Warm Starts - All Requests
Cold Starts Pseudo-Warm Starts
0
5000
10000
15000
20000
25000
Min. Max. Avg. 50th percentile 68th percentile 95th percentile Std dev.
Elap
sed
Tim
e (
ms)
Cold vs. Pseudo-Warm Starts - Summary(n = 30)
Cold Starts Pseudo-Warm Starts

S. Barbeau, T. Saloranta 11
Next, the performance of cold vs. pseudo-warm starts when using JSON to format the 1
server response was examined. FIGURE 6 shows the elapsed time of 30 cold and pseudo-warm 2
start tests, and FIGURE 7 shows the summary of the results from these tests. 3
4
5 FIGURE 6 - Cold vs. Pseudo-Warm Start performance for JSON responses from 30 requests 6
7 FIGURE 7 - Cold vs. Pseudo-Warm Start performance for JSON responses - Summary Results 8
9
0.00
1,000.00
2,000.00
3,000.00
4,000.00
5,000.00
6,000.00
1 2 3 4 5 6 7 8 9 10 11 12 13 14 15 16 17 18 19 20 21 22 23 24 25 26 27 28 29 30
Elap
sed
Tim
e (
ms)
JSON - Cold vs. Pseudo Warm Starts - All Requests
Cold Start Pseudo-Warm Starts
0
1000
2000
3000
4000
5000
6000
Min. Max. Avg. 50th percentile 68th percentile 95th percentile Std dev.
Elap
sed
Tim
e (
ms)
JSON - Cold vs. Pseudo-Warm Starts - Summary(n = 30)
Cold Starts Pseudo-Warm Starts
S. Barbeau, T. Saloranta 12
Pseudo-warm starts perform slightly better than cold starts, with an average elapsed time of 1
3,785ms vs. the cold start average of 3,963ms - a difference of 178ms on average. This 2
difference may still be noticeable to the user [20], but is not nearly as dramatic as the 3
improvement of the XML pseudo-warm start. 4
Overall, for JSON the pseudo-warm start amounted to an average 3.96% performance 5
increase over the cold start. 6
Discussion 7
The dramatic improvement in XML parsing performance using pseudo-warm starts indicates that 8
the time required to read a cached Jackson object from mobile device persistent memory is far 9
less than the time required to newly instantiate that same object. Therefore, a huge 44% 10
performance increase on average can be produced by using pseudo-warm starts. 11
JSON pseudo-warm start performance improvements (3.96% on average), however, are 12
not nearly as impressive as their XML counterparts. This difference is partially due to the fact 13
that XML cold starts are significantly larger than JSON cold starts to begin with (by a factor of 14
4), which gives the XML pseudo-warm start a much greater margin of potential improvement. 15
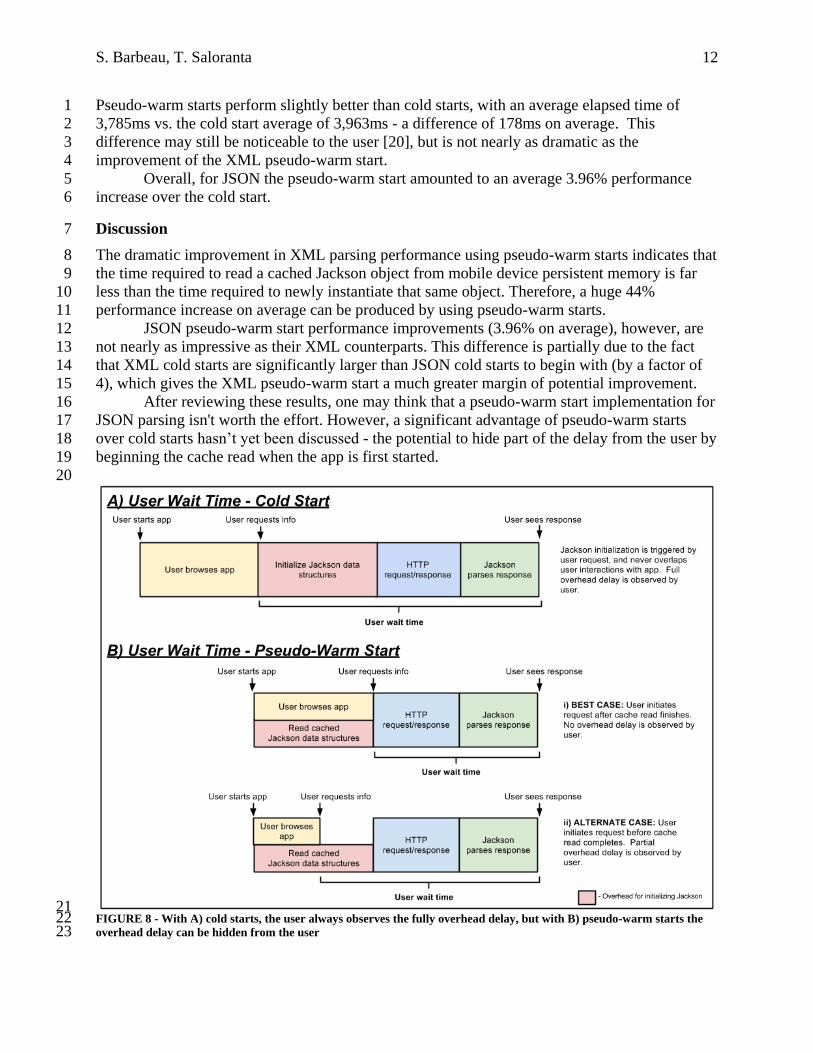
After reviewing these results, one may think that a pseudo-warm start implementation for 16
JSON parsing isn't worth the effort. However, a significant advantage of pseudo-warm starts 17
over cold starts hasn’t yet been discussed - the potential to hide part of the delay from the user by 18
beginning the cache read when the app is first started. 19
20
21 FIGURE 8 - With A) cold starts, the user always observes the fully overhead delay, but with B) pseudo-warm starts the 22 overhead delay can be hidden from the user 23

S. Barbeau, T. Saloranta 13
FIGURE 8 shows how user interactions (shaded in yellow) occur in context of cold starts 1
(FIGURE 8A) compared with pseudo-warm starts (FIGURE 8B). 2
As mentioned earlier, the cache read used in pseudo-warm starts can be initiated 3
immediately upon application start up and can execute in the background while the user is 4
browsing through the application. Therefore, using pseudo-warm starts, a considerable amount of 5
the overhead time may pass before the user actually triggers a request to the server (e.g., for real-6
time transit arrival information). In the best-case scenario, shown in FIGURE 8Bi, the entire 7
cache read finishes prior to the user initiating a request, and the user does not observe any delay. 8
In this case, pseudo-warm starts are equivalent to warm starts in performance. Cold starts, on the 9
other hand, cannot hide any of this overhead wait time from the user - Jackson initialization must 10
always start when the user initiates a server request, as shown in FIGURE 8A. 11
An alternate pseudo-warm start scenario is shown in FIGURE 8Bii. Here, the user 12
browsers the app while the cache read starts, but initiates the request to the server before the 13
cache read can complete. In this situation, the user would observe a partial delay, depending on 14
how much time has elapsed and how long the cache read will take to complete. 15
When considering that the cache read time can now be partially or completely hidden 16
from the user, the seemingly small improvements in JSON pseudo-warm start performance 17
suddenly become quite large. FIGURE 9 shows the differences between pseudo-warm starts and 18
cold starts if the user spends the entire cache read time browsing through the app. 19
20
21 FIGURE 9 - If user interactions with the app hide the cache read latency, JSON pseudo-warm starts perform 22 significantly better than cold starts 23
0
1000
2000
3000
4000
5000
6000
Min. Max. Avg. 50th percentile 68th percentile 95th percentile Std dev.
Elap
sed
Tim
e (
ms)
JSON - Cold vs. Pseudo-Warm Starts without cache read time(n = 30)
Cold Starts Pseudo-Warm Starts

S. Barbeau, T. Saloranta 14
Assuming that this cache read time is hidden from the user, the average JSON pseudo-warm start 1
elapsed time is 469ms, compared to nearly 4 seconds of cold start time. The average cache read 2
time in this test was 3.3 seconds, meaning the user would need to spend 3.3 seconds in the app 3
before requesting real-time transit information for the cache read to remain completely hidden. 4
Given the initial app start-up process and other activity of the user before they may retrieve real-5
time transit information, the expectation that at least some of the cache read will be hidden seems 6
reasonable. 7
Revisiting XML pseudo-warm starts while considering the potential to hide the cache 8
read yields even greater performance increases over cold starts. Average pseudo-warm starts 9
improve to 473ms, versus average cold starts of 17.7 seconds. However, one must also consider 10
that to fully hide the cache read for XML parsing, the user would need to spend an average of 9.3 11
seconds in the app before triggering a request to the server. This is a much longer amount of time 12
than that required for JSON, and therefore less of the XML cache read time will be hidden from 13
the user on average. The longer cache read time for XML when compared to JSON may be 14
explained by the larger cache file size for the XML (1,200kB) vs. JSON (260kB). 15
One drawback to the caching strategy of pseudo-warm starts over cold starts is the 16
persistent memory consumed by the cache file. However, the observed sizes of the cache files 17
should be negligible for most smart phones. 18
7. RELATED WORK 19
The strategy of pseudo-warm starts is just one potential avenue for improving user experience in 20
mobile applications that use real-time information from a server. This paper focuses on reducing 21
the amount of time necessary to retrieve new real-time information from a server when an update 22
needs to be retrieved. Response caches, available on Android 4.0 and up, can be used to avoid 23
retrieving a full response to the mobile device when no change in the data has occurred since the 24
last request. Compression can also be used to reduce the size of HTTP data transfers (although 25
the computational costs of device-side decompression must also be taken into account). The 26
refresh interval on the device can also be adjusted to avoid querying the server too frequently. As 27
previously mentioned, the protocol used to transfer information also affects performance. Past 28
research has shown that RESTful web services are heavily preferred to SOAP-based web 29
services on mobile devices [5, 6]. 30
8. FUTURE WORK 31
Another strategy for hiding the latency for cold starts from the user is to initiate a "dummy" read 32
of a small bit of data on startup, which will force initialization of many of the internal Jackson 33
data structures used for deserialization. While the dummy read isn't expected to increase the 34
general initialization performance, it does offer the advantage of being able to hide some of the 35
latency from the user vs. a normal cold start. Future work could compare the performance of 36
dummy reads against cache read times to quantify the differences. 37
The number of cores in mobile processors continues to increase, with eight core 38
processors just around the corner for mobile phones. Further experimentation could also 39
examine the potential for parallelizing computations on Android to speed up both JSON and 40
XML processing. However, such speedups are not expected to effect the relative relationship 41
between the time required for JSON and XML processing when the same general processing 42
model is used for both (which is the case in this paper). 43
Additional future benchmarking could also be performed in a multi-tasking environment 44
where multiple applications are being context-switched as they are brought to the foreground and 45

S. Barbeau, T. Saloranta 15
returned to the background during JSON and XML process. However, the authors do not expect 1
the general performance results presented in this paper to differ drastically in this situation. The 2
parsing and generation of data formats like JSON and XML is a relatively simple linear CPU-3
intensive (and CPU-bound) process, and as such concurrency issues are rarely problematic when 4
benchmarking this type of performance. As a result, linear single-threaded tests are usually 5
sufficient when performing such benchmarking. Additionally, in many real-world time-sensitive 6
application scenarios (e.g., a user checking the estimated arrival time while waiting at a bus 7
stop), the user is waiting for the result to be processed while the application is in the foreground, 8
in a very similar design to the tests in this paper. 9
Different size responses could also be analyzed in future work, to determine if this would 10
affect the relative relationship between JSON and XML processing time (e.g., if JSON is better 11
for smaller datasets, while XML is better for larger datasets). The authors of this paper believe 12
that the general processing relationships of JSON being faster than XML would continue to hold, 13
no matter the dataset size, as the processing models for JSON and XML are very similar at 14
conceptual and implementation level. 15
Finally, implementation-specific future work could also be examined. Tests presented in 16
this paper used Jackson v2.1.2. Newer versions of Jackson are now available and should be used 17
in future benchmarking tests. Further investigation into the time required to access annotations 18
on Android revealed an issue on the Android platform [18]. It appears that this issue is now 19
fixed in the Android Open-Source Project, but has not yet been included in any Android releases 20
(4.3 and lower) for Android devices. Future benchmarking should be performed on releases of 21
Android with this improvement to see if performance increases – however, as noted earlier, other 22
experiments on desktop computer using Java have yielded similar performance benefits of JSON 23
over XML, and therefore improvements in Android are not expected to drastically affect the 24
overall results of the experiments presented in this paper. 25
9. CONCLUSIONS 26
When using real-time information services, users must often wait for their phone to retrieve the 27
latest real-time information from a server. This paper presented an evaluation of the effect of 28
data formats on the time required for a mobile device to retrieve updated information from a 29
server, in the context of real-time estimated arrival information for public transportation. The 30
results indicate that app developers should carefully consider certain software design choices to 31
avoid exposing mobile users to extensive wait times (e.g., for real-time transit arrival 32
information). The results also demonstrate that information service providers should always 33
offer mobile-friendly data (i.e., RESTful web services with JSON encoding) when possible. 34
JSON was shown to be a preferred data transfer format over XML for mobile devices. 35
Average performance for cold starts (i.e., when the user first starts the mobile app) was over 4 36
times faster for JSON than XML, with an average time difference of 14 seconds. JSON also had 37
a noticeable performance advantage in warm starts, being an average of 224ms faster than XML. 38
An optimization strategy, pseudo-warm starts, was also presented that aims at reducing 39
the large performance penalty of cold starts. Pseudo-warm starts, which use cached Jackson 40
objects instead of re-initializing the objects on app startup, provide a dramatic increase in 41
performance for XML parsing, reducing elapsed parsing time from an average of 17.7 seconds to 42
an average of only 9.7 seconds, an 8 second improvement. Pseudo-warm start improvements for 43
JSON were more modest, with an average elapsed time of 3,785ms vs. the cold start average of 44
3,963ms - a difference of 178ms on average. 45

S. Barbeau, T. Saloranta 16
Finally, the potential impact of pseudo-warm starts vs. cold starts in the context of user-1
observable performance was discussed. Assuming that the entire cache read time is hidden from 2
the user, the average JSON pseudo-warm parsing start elapsed time improves to 469ms, 3
compared to nearly 4 seconds of cold start time. Similarly, assuming a fully hidden cache read, 4
average XML pseudo-warm starts further improve to 473ms, versus average cold starts of 17.7 5
seconds. However, given that XML cache reads take an average of 9.3 seconds, versus average 6
JSON cache read of 3.3 seconds, it may not be realistic to completely hide XML cache reads 7
from the user. 8
10. ACKNOWLEDGMENTS 9
The research described in this paper was funded by the National Center for Transit Research at 10
the University of South Florida. 11
11. REFERENCES 12
[1] International Telecommunications Union (2011). "ICT Facts and Figures - The World in 13
2011." Available at http://www.itu.int/ITU-14
D/ict/facts/2011/material/ICTFactsFigures2011.pdf 15
[2] CTIA - The Wireless Association. "Wireless Quick Facts - Year-End Figures." Accessed 16
July 31, 2013 from http://www.ctia.org/advocacy/research/index.cfm/aid/10323 17
[3] Synovate. "Synovate mobile phones survey." Accessed January 31, 2010 from 18
http://www.synovate.com/insights/infact/issues/200909/ 19
[4] Kari Edison Watkins, Brian Ferris, Alan Borning, G. Scott Rutherford, and David Layton 20
(2011), "Where Is My Bus? Impact of mobile real-time information on the perceived and 21
actual wait time of transit riders," Transportation Research Part A: Policy and Practice, 22
Vol. 45 pp. 839-848. 23
[5] Sean J. Barbeau, Nevine L. Georggi, and Philip L. Winters (2010), "Global Positioning 24
System Integrated with Personalized Real-Time Transit Information from Automatic 25
Vehicle Location," Transportation Research Record: Journal of the Transportation 26
Research Board, pp. 168-176. 27
[6] Sean Barbeau, Rafael Perez, Miguel Labrador, Alfredo Perez, Philip Winters, and Nevine 28
Georggi (2011), "A Location-Aware Framework for Intelligent Real-Time Mobile 29
Applications," Pervasive Computing, IEEE, Vol. 10 pp. 58-67. 30
[7] Michael Frumin. "CEN TC278 WG3 SG7: SIRI Version 2.0." Accessed July 31, 2013 31
from https://groups.google.com/forum/#!topic/siri-developers/apb20g8_0EI 32
[8] Metropolitan Transportation Authority. "MTA Bus Time(R)." Accessed August 1, 2012 33
from http://bustime.mta.info/ 34
[9] University of South Florida. "SIRI REST Client." Accessed July 31, 2013 from 35
https://github.com/CUTR-at-USF/SiriRestClient/wiki 36
[10] Internet Engineering Task Force, "Request for Comments (RFC) 2616 - Hypertext 37
Transfer Protocol -- HTTP/1.1," ed, 1999. 38
[11] World Wide Web Consortium (W3C), "SOAP Version 1.2 Part 1: Messaging Framework 39
(Second Edition)," ed, 2007. 40
[12] Ecma International, "Standard ECMA-262 3rd Edition," ed. Geneva, Switzerland: Ecma 41
International,,, 2011. 42
[13] LLC FasterXML, ,. "Jackson JSON and XML Processor Wiki." Accessed July 31, 2013 43
from http://wiki.fasterxml.com/JacksonHome 44

S. Barbeau, T. Saloranta 17
[14] Martin Adamek. "JSON Parsers Performance on Android (With Warmup and Multiple 1
Iterations)." Accessed July 31, 2013 from http://martinadamek.com/2011/02/04/json-2
parsers-performance-on-android-with-warmup-and-multiple-iterations/ 3
[15] Tatu Saloranta. "JSON data binding performance (again!): Jackson / Google-gson / JSON 4
Tools... and FlexJSON too." Accessed July 31, 2013 from 5
http://www.cowtowncoder.com/blog/archives/2009/12/entry_345.html 6
[16] S. Barbeau. "Parsing JSON and XML on Android." Accessed July 31, 2013 from 7
https://github.com/CUTR-at-USF/SiriRestClient/wiki/Parsing-JSON-and-XML-on-8
Android 9
[17] University of South Florida. "SIRI Rest Client UI." Accessed July 31, 2013 from 10
https://github.com/CUTR-at-USF/SiriRestClientUI/wiki 11
[18] Android Open Source Project. "Issue 43827: AnnotationFactory's cache has major 12
performance problems." Accessed July 31, 2013 from 13
https://code.google.com/p/android/issues/detail?id=43827 14
[19] Eishay Smith. "JVM Serializers." Accessed November 15, 2013 from 15
https://github.com/eishay/jvm-serializers/wiki 16
[20] R. Jota, A. Ng, P. Dietz, and D. Wigdor, "How Fast is Fast Enough? A Study of the 17
Effects of Latency in Direct-Touch Pointing Tasks," presented at the CHI 2013, Paris, 18
France, 2013. 19
20
21
Related Documents