Electoral Systems Pippa Norris ~ Harvard www.pippanorris.com

Welcome message from author
This document is posted to help you gain knowledge. Please leave a comment to let me know what you think about it! Share it to your friends and learn new things together.
Transcript

Electoral Systems
Pippa Norris ~ Harvardwww.pippanorris.com

Components of institutional design
Constitutional reform
Electoral systems and processes
Party systems
Roles and powers of the executive
Role of Parliament
Federalism and decentralization
Local governments
Innovative minor reforms
Participation, transparency, and accountability
www.pippanorris.com

www.pippanorris.com
Structure
I. Normative principles of electionsII. Types of electoral systems
– What are the choices? How do they work?
III. Explaining processes of electoral system change
– Do electoral systems determine party systems? Or the reverse?
IV. Conclusions and implications

Required readings
1. Pippa Norris. 2008. Driving Democracy: Do Power‐Sharing Institutions Work? Cambridge: Cambridge University Press. Ch 5.
2. Benoit, Kenneth. 2007. ‘Electoral laws as political consequences: explaining the origins and change of electoral institutions.’ Annual Review of Political Science 10: 363‐90. DOI: 10.1146/annurev.polisci.10.072805.101608
3. International IDEA. 2008. Electoral System Design. The new IDEA International Handbook. Ed. Andrew Reynolds, Ben Reilly and Andrew Ellis. http://www.idea.int/publications/esd/upload/ESD_Handb_low.pdf
pp1‐29.
www.pippanorris.com

www.pippanorris.com
Online Resources
1. IFES– www.ifes.org/eguide/elecguide.htm
2. ACE– http://www.aceproject.org/
3. International IDEA– www.EPICproject.int


www.pippanorris.com
Discussion Questions
What are the pros and cons of alternative electoral systems?What would you recommend if asked to advise about designing the electoral system in either (a) Afghanistan (b) Iraq (c ) Ukraine (d) Nepal or (e) Bhutan? And why?

I: NORMATIVE DEBATES
www.pippanorris.com

Normative criteriaHow would you rank the importance of these criteria for Afghanistan, Nepal, and Bhutan?
– Providing representation• Geographic, ideological, party, and descriptive
– Making elections accessible and meaningful– Providing incentives for conciliation– Facilitating stable and efficient government– Holding the government accountable– Holding individual representatives accountable– Encouraging political parties– Promoting legislative opposition and oversight– Making electoral processes sustainable– Meeting international standards
Source: International IDEA. 2008. Electoral System Design pp9‐14.www.pippanorris.com

Recap: Consociationaldemocracy
Lijphart (1968) The Politics of AccommodationNetherlands exemplified ‘pillorized’ divided societyYet there was stable democracy and elite consensusWhy? Constitutional arrangements
– Proportional representation of all major groups in elected/appointed office
– Executive power‐sharing/grand coalition– Minority veto in government– Cultural autonomy for groupsModel for other divided (plural) societies?E.g. Belgium, Switzerland, Lebanon, Cyprus

The logical sequence of consociational theory in divided
societiesPR electoral systems (or
reserved seats)
Federalism & decentralization
Election ofethnic minority
partiesPeaceful
democratic consolidation
Election ofethnic minority
parties
Greater support within minority communities
Does the logic make sense? Criticisms?

www.pippanorris.com
II: Types of electoral systems
The most basic features involve:1.The electoral formula
– how votes are counted to allocate seats,
2. The district magnitude– the number of seats per district,
3. The ballot structure– how voters can express their choices, and
The electoral threshold– the minimum votes needed by a party to secure
representation.

www.pippanorris.com
Classification of systems
AV2
2nd Ballot25
Majority27
FPTP54
Bloc Vote10
STNV2
Plurality66
Majoritarian93
Independent14
Dependent13
Combined27
STV2
Closed Open
Party List62
PR64
No direct elections7
Nation States191
Adversarial Consensual
Source: Norris: Driving democracy p113

www.pippanorris.com
1. Plurality
Single member plurality elections (First‐Past‐The‐Post)Used in 54 countries Eg US, UK, India, CanadaSingle seat districts, equal size, ‘X’ voteSimple plurality of votes determines winnerCreate ‘manufactured majority’ in votes:seats ratioGeographical dispersion of support is critical High threshold for non‐spatially concentrated minor parties and ethnic groups

www.pippanorris.com
FPTP Ballot Eg UK
X
%
30
20
15
35Elected w. plurality
Advantages and disadvantages?

www.pippanorris.com
2005 UK election resultJune 2005 % of Votes % of seats Ratio Number of
seatsLabour 35.2 54.9 1.56 355
Conservative 32.3 30.4 0.94 197
Lib Dem 22.0 9.5 0.43 62
SNP 1.5 0.9 0.60 6
PC 0.6 0.5 0.83 3
Other 8.4 3.4 0.40 23
Labour Maj. 2.9 24.5 66
Total 100 100 659
Source: Pippa Norris & Chris Wlezien Ed. Britain Votes 2005 (OUP 2005)

www.pippanorris.com
Simulated seats GB June 2005355
239197 207
62
140
0 119 180 50 44 30
50
100
150
200
250
300
350
400
Actual results FPTP List PR
LabConLdemUKIPNatGreenBNPOther
Source: Dunleavy and Margetts in Pippa Norris (Ed) Britain Votes 2005 OUP

www.pippanorris.com
Majoritarian Variants
Single Non‐Transferable Vote– Japan 1948‐1993, Jordan, Vanuatu, Afghanistan – Small multimember districts– Multiple candidates from same party– Single vote cast & plurality vote required– Advantages and disadvantages?Cumulative vote – Dual member seats eg Illinois until 1980Limited vote eg Spanish senate

www.pippanorris.com
2. Second ballot majority
Eg Presidential elections France, Russia, DRCUsed in 14/25 presidential contests + some parliamentary elections Majority required (50%+) 1st round – winnerOr ‘run off’ 2nd round w. top two candidatesAims to produce party coalitions on left and right and popular legitimacy of the winner‘Heart’ and ‘head’ votingAdvantages and disadvantages?

www.pippanorris.com
3. Alternative Vote (AV)
Eg Australian House of Representatives[Preferential voting]Single member districtsPriority ranked voting (1st, 2nd, 3rd,etc.)Majority required (50%+) 1st roundOr 2nd round bottom votes 2nd preferences redistributed etc. and results recalculated until majority achieved

www.pippanorris.com
Eg AV Australian HofRep
Advantages and disadvantages?
Must rank preferences across all candidates to be a valid ballot

2010 Australian HofR results
www.pippanorris.com
93.2% counted.Updated Thu Sep 16 03:28PM
Party % Vote Swing Won % seats
Labor 38.0 ‐5.4 72 48.0%
Coalition 43.7 +1.5 73 48.6%
Greens 11.7 +4.0 1 0.6%
Others 6.6 ‐0.1 4 Support Lab Gov
150

www.pippanorris.com

www.pippanorris.com
4. Single Transferable Vote
Used in Ireland, Australian Senate, MaltaMultimember constituencies (4/5 members)Priority voting (1,2,3,..)Quota for election eg100,000 voters/4 seats=25000+1Redistribution in successive counts from candidate with least votes

www.pippanorris.com

2007 Irish Dial election results
www.pippanorris.com
Candidates Votes % vote Change since 2002 Seats % seats Ratio Votes :
Seats
Fianna Fáil 106 858,565 41.56 +0.08 77 46.67 1.12
Fine Gael 91 564,428 27.32 +4.84 51 30.91 1.13
Labour 50 209,175 10.13 ‐0.65 20 12.12 1.19
Green Party 44 96,936 4.69 +0.85 6 3.64
Sinn Féin 41 143,410 6.94 +0.43 4 2.42
Progressive Democrats 30 56,396 2.73 ‐1.23 2 1.21
Socialist Party 4 13,218 0.64 ‐0.16 0
People before profit / SWP 5 9,333 0.45 +0.27 0
Workers Party 6 3,026 0.15 ‐0.07 0
Christian Solidarity Party 8 1,705 0.08 ‐0.18 0
Fathers rights 8 1,355 0.07 +0.07 0Immigration control 3 1,329 0.06 ‐0.01 0
Independents 74 106,934 5.18 ‐4.25 5 3.03
Total 470 2,065,810 100.00 0 165 100.00

www.pippanorris.com
5. PR – Party Lists
National or regional districtClosed or open listUsed 62/191 nations eg Israel, NetherlandsOne vote for party (X)Minimum threshold of votes

www.pippanorris.com
Eg Party List S.Africa
Advantages and disadvantages?

www.pippanorris.com
Parties Votes Seats % seats% VotesAfrican National Congress (ANC) 11,650,748 65.90 264 66.0Democratic Alliance (DA) 2,945,829 16.66 67 16.7Congress of the People (COPE) 1,311,027 7.42 30 7.5
Inkatha Freedom Party (IFP) 804,260 4.55 18 4.5
Independent Democrats (ID) 162,915 0.92 4 1.0United Democratic Movement (UDM) 149,680 0.85 4 1.0Freedom Front Plus (VF+) 146,796 0.83 4 1.0African Christian Democratic Party (ACDP) 142,658 0.81 3
United Christian Democratic Party (UCDP) 66,086 0.37 2Pan Africanist Congress (PAC) 48,530 0.27 1Minority Front (MF) 43,474 0.25 1Azanian People's Organisation (AZAPO) 38,245 0.22 1African Peoples' Convention (APC) 35,867 0.20 1Movement Democratic Party (MDP) 29,747 0.17 0 0Al Jama‐ah 25,947 0.15 0 0Christian Democratic Alliance (CDA)* 11,638 0.07 0 0
National Democratic Convention (NADECO) 10,830 0.06 0 0
New Vision Party (NVP) 9,296 0.05 0 0United Independent Front (UIF) 8,872 0.05 0 0Great Kongress of SA (GKSA) 8,271 0.05 0 0
South African Democratic Congress (SADECO) 6,035 0.03 0 0
Keep It Straight and Simple (KISS) 5,440 0.03 0 0Pan Africanist Movement (PAM) 5,426 0.03 0 0Alliance of Free Democrats (AFD) 5,178 0.03 0 0Women Forward (WF) 5,087 0.03 0 0A Party 2,847 0.02 0 0
Total 17,680,729 100.0 400 100
Summary of the 22 April 2009 South African National Assembly election results

www.pippanorris.com
PR List formula
Votes proportional to seats allocated by different formula – Highest averages
• Total votes per party divided by divisors, seats allocated to highest quotient up to total seats available– D’Hondt formula divisions 1,2,3 etc eg Poland, Spain (least prop.)
– Pure Saint‐Laguë divisor 1,3,5,7 etc eg New Zealand– Modified Saint‐Laguë 1.4, 3,5,7 etc eg Norway (most proportional)
– Largest remainder• Minimum quota (total votes/total seats)
– Hare quota total votes/total seats eg Benin, Costa Rica– Droop quota raises divisor by 1 eg S.Africa, Czech Rep.

www.pippanorris.com
Eg D’Hondt formulaHighest averages
PartySeats
Blues6
Whites3
Reds2
Green1
Yellow0
Pinks0
1 57000* 26000* 25950* 12000* 6100 30502 28500* 13000* 12975* 60003 19000* 8667* 86504 14250* 65005 11400*6 9500*

www.pippanorris.com
Eg Largest remainders Hare
Votes Quota Dividend SeatsBlues 57000 10834 5260 5Whites 26000 10834 2400 3Reds 25590 10834 2395 2Greens 12000 10834 1110 1Yellows 6010 10834 550 1Pinks 3050 10834 280 0
Quota=(130,010 total votes/12 seats=10,384)

www.pippanorris.com
6. Combined systems
Aka ‘Mixed’, ‘hybrid’, ‘side‐by‐side’‘Combined‐independent’– eg Taiwan and Ukraine– Ukraine half FPTP, half nation‐wide lists, 4% thresholds‘Combined‐dependent’– eg Germany, New Zealand, – Germany half seats by party list, half by FPTP.– Seats allocated by FPTP– Total seats proportional to 2nd party vote

www.pippanorris.com
Eg Combined system Germany
X
xAdvantages and disadvantages?

www.pippanorris.com
III: Explaining processes of change
Types of electoral rule change:1. Design of constitutions and basic electoral
law 2. Electoral administration and procedures3. Voter education4. Election observing5. Election dispute mediation6. Party building

Actors and processes
System inherited from colonial powersPeace process negotiations among domestic actorsInfluenced by the international communityRole of expert commissionsPublic consultation process, including referenda
www.pippanorris.com

Theories of electoral change
Rational choice institutionalism– Negotiation among party actors seeking to maximize their
interests (votes and seats)– Party systems and elites determine electoral reforms, not vice
versa– Exceptional process due to incumbent interests
Or policy process – Multiple actors engaged in policy outcome– More common evolutionary changes– Policy systems sequential model of agenda setting, policymaking,
implementation, and feedback
www.pippanorris.com

www.pippanorris.com
Public policy agendaLegislature and executive
Public’s agenda
International diffusion
Referendum process
Regulatory framework
Constitutional,legal &
administrative rules governing
electoral institution
Environmental contextHistorical traditions Regime type
Economic development
ElectionManagementBodies
Feedback loopFeedback loop
Election outcome
Media agenda
Party agenda
NGO agenda
Courts and judiciary
Agenda‐setting stageAgenda‐setting stage Policy‐making stagePolicy‐making stage Implementation stageImplementation stage
Figure 1: The policy‐cycle model of the origins, maintenance and reform of electoral institutions

www.pippanorris.com
Nation Type of electoral system, 1993 Type of electoral system, 2004 Freedom House, 1993 Freedom House, 2004
Bolivia List PR Combined dependent Free Partly free
Ecuador Combined independent List PR Free Partly free
Italy List PR Combined dependent Free Free
Japan SNTV Combined independent Free Free
Marshall Islands FPTP Combined independent Free Free
Monaco Two round Combined independent Free Free
Mongolia FPTP Two‐round Free Free
New Zealand FPTP Combined dependent Free Free
Papua New Guinea FPTP AV Free Partly free
Tuvalu FPTP Block vote Free Free
Albania Combined independent Combined dependent Partly free Partly free
Croatia Combined independent List PR Partly free Free
Fiji FPTP AV Partly free Partly free
Guatemala Combined independent List PR Partly free Partly free
Jordan Block vote SNTV Partly free Partly free
Kazakhstan FPTP Combined independent Partly free Not free
Lesotho FPTP Combined dependent Partly free Free
Liberia List PR No elected legislature Partly free Partly free
Macedonia Two round List PR Partly free Partly free
Madagascar List PR Combined independent Partly free Partly free
Mexico Combined independent Combined dependent Partly free Free
Moldova, Republic Of Two round List PR Partly free Partly free
Morocco FPTP List PR Partly free Partly free
Pakistan FPTP Combined independent Partly free Not free
Panama List PR Combined independent Partly free Free
Philippines Block vote Combined independent Partly free Free
Russian Federation Two round Combined independent Partly free Not free
South Africa FPTP List PR Partly free Free
Table 3: Electoral system change, 1993‐2004Note: N. 46 out of 191 independent nation states worldwide (24.1%).

www.pippanorris.com
Table 2: Net change matrix in the distribution of electoral systems, 1993 and 2004 Type of electoral system 2004
Total 1993
FPTP Block vote AV SNTV
Two‐round
Combined independe
nt
Combined
dependent
List PR STV
No elected legislatur
e
Type of electoral system 1993
FPTP 36 3 2 1 3 3 2 4 1 55 65.5
% 5.5% 3.6% 1.8% 5.5% 5.5% 3.6% 7.3% 1.8% 100.0
% Block vote 6 0 1 2 9
66.7%
.0% 11.1%
22.2% 100.0%
AV 2 2 100.0
% 100.0
% SNTV 1 1 2
50.0%
50.0% 100.0%
Two round 18 5 3 26 69.2
% 19.2% 11.5
% 100.0
% Combined independent
16 2 3 22 72.7% 9.1% 13.6
% 100.0
% Combined dependent
2 2 100.0% 100.0
% List PR 2 3 55 3 63
3.2% 4.8% 87.3%
4.8% 100.0%
STV 2 2 100.0
% 100.0
% No elected legislature
1 7 8 12.5
% 87.5% 100.0
% Total 2004 37 9 4 3 21 29 9 65 2 12 191
19.4%
4.7% 2.1% 1.6% 11.0%
15.2% 4.7% 34.0%
1.0% 6.3% 100.0%
Notes: The table lists the number (and row% ) of independent nation states worldwide using each type of electoral system for the lower house of the national parliament in 1993 and 2004. The highlighted diagonal shows those countries which have not changed their electoral system during these years. FPTP First Past the Post; 2nd Ballot; Block Vote; AV Alternative Vote; SNTV Single Non‐Transferable Vote; STV Single Transferable Vote. For the typology, see Figure 2.

Figure 5.3: Trends in types of electoral systems used worldwide, 1973-2003
www.pippanorris.com
0
20
40
60
80
100
120
1973
1975
1977
1979
1981
1983
1985
1987
1989
1991
1993
1995
1997
1999
2001
2003
Majoritarian Combined Proportional No competative elections
Source: Coded from Arthur S. Banks Cross-national Time-series Data Archive, Andrew Reynolds and Ben Reilly. Eds. 2005. The International IDEA Handbook of Electoral System Design. 2nd ed. Stockholm: International Institute for Democracy and Electoral Assistance, and related sources
Majoritarian Combined
None
PR

www.pippanorris.com
IV: Conclusions
Therefore no single ‘best’ system Depends upon priorities –choice of governability v. diversityCritical choices for many other democratic institutionsRules are often amendedWhat are the consequences of electoral systems?

www.pippanorris.com
The effects of electoral systems1. On democracy2. Proportionality of votes to seats (fair outcomes)3. Party competition4. Electoral turnout5. Parliamentary representation
– Women & ethno‐political minorities
6. Strength of cleavage politics 7. Constituency service

On democracy
www.pippanorris.com
Figure 5.4: Levels of democracy by type of electoral system, 2000
58
35
25
49
65
57
32
67
7771
42
78
0
10
20
30
40
50
60
70
80
90
FH Polity Vanhanen Cheibub
Low <
< De
moc
racy
>>
High
Majoritarian Combined PR

In plural societies
www.pippanorris.com
69
59
5046
7075
5964
7983
74
81
0
10
20
30
40
50
60
70
80
90
FH Polity FH Polity
Homogeneous Heterogeneous
Low
<<
Dem
ocra
cy >
> H
igh
Majoritarian Combined PR
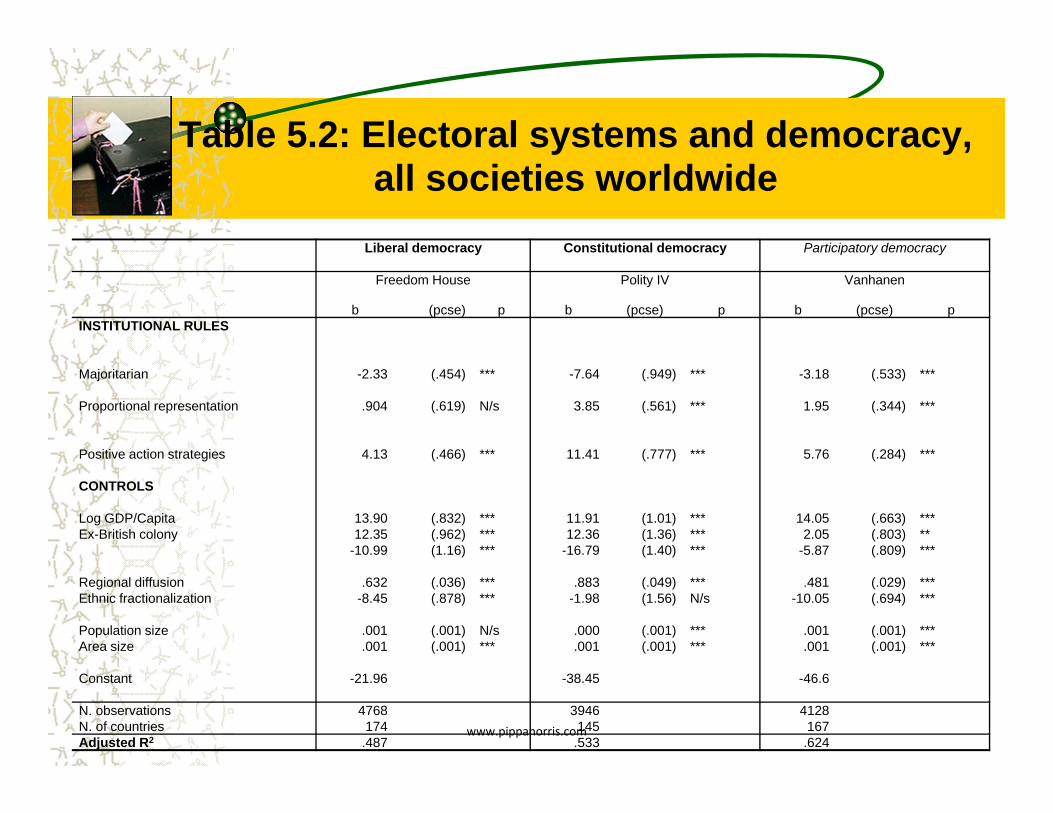
Table 5.2: Electoral systems and democracy, all societies worldwide
www.pippanorris.com
Liberal democracy Constitutional democracy Participatory democracy
Freedom House Polity IV Vanhanen
b (pcse) p b (pcse) p b (pcse) pINSTITUTIONAL RULES
Majoritarian -2.33 (.454) *** -7.64 (.949) *** -3.18 (.533) ***
Proportional representation .904 (.619) N/s 3.85 (.561) *** 1.95 (.344) ***
Positive action strategies 4.13 (.466) *** 11.41 (.777) *** 5.76 (.284) ***
CONTROLS
Log GDP/Capita 13.90 (.832) *** 11.91 (1.01) *** 14.05 (.663) ***Ex-British colony 12.35 (.962) *** 12.36 (1.36) *** 2.05 (.803) **
-10.99 (1.16) *** -16.79 (1.40) *** -5.87 (.809) ***
Regional diffusion .632 (.036) *** .883 (.049) *** .481 (.029) ***Ethnic fractionalization -8.45 (.878) *** -1.98 (1.56) N/s -10.05 (.694) ***
Population size .001 (.001) N/s .000 (.001) *** .001 (.001) ***Area size .001 (.001) *** .001 (.001) *** .001 (.001) ***
Constant -21.96 -38.45 -46.6
N. observations 4768 3946 4128N. of countries 174 145 167Adjusted R2 .487 .533 .624

www.pippanorris.com
2. Impact on proportionality
Proportionality of votes to seats
Vote share
Seat share
20%
20%2nd party, 3rd etc
Winning partyPerfect proportionality

www.pippanorris.com
ProportionalityStandardized Loosemore-Hanby Index
Proportionality
8083
8494
84868686
8889
9294
9596
8282
8489
9393
9595
9696
9798
60 65 70 75 80 85 90 95 100
MAJORITARIAN UK
CanadaAustralia
USACOMBINED
Korea, Republic ofJapan
UkraineHungaryThailand
RussiaMexico
GermanyTaiwan
New ZealandPROPORTIONAL
PolandRomaniaSlovenia
Czech RepublicSpain
SwitzerlandNetherlands
NorwayBelgium
IsraelSweden
DenmarkPeru

www.pippanorris.com
Proportionality influenced by:
1. Number of parties in the electorate2. Geographical distribution of the vote3. District magnitude4. Legal vote thresholds5. The type of electoral formulae eg d’Hondt
etc

www.pippanorris.com
3. Impact on parties:Duverger’s laws
(1) “The plurality single-ballot rule tends to party dualism.”
(2)“The double-ballot system and proportional representation tend to multipartyism.”
Maurice Duverger. 1954. Political Parties, Their Organization and Activity in the
Modern State. New York: Wiley.

www.pippanorris.com
Effect on partiesMean N of parl parties (1 seat)
Mean N of relevant parl parties (3%+
seats)
% Vote for party 1st
% Seats for party 1st
Number of countries
All Majoritarian 5.22 3.33 54.5 56.8 83
Alternative Vote 9.00 3.00 40.3 45.3 1
Block vote 5.60 4.57 52.9 56.2 10
2nd Ballot 6.00 3.20 54.8 57.8 23
FPTP 4.78 3.09 55.1 57.8 49
All Combined 8.85 4.52 46.8 49.5 26
Independent 8.89 3.94 51.7 53.9 19
Dependent 8.71 6.17 33.9 36.9 7
ALL Proportional 9.52 4.74 45.3 43.8 61
STV 5.00 2.50 45.3 50.1 2
Party List 9.68 4.82 44.5 43.6 59
TOTAL 7.05 4.12 48.7 50.0 143
Ref: Pippa Norris ‘Institutions Matter’ CUP 2003

www.pippanorris.com
ENPP by Electoral SystemEffective Number of Parliamentary Parties
2.02.1
2.63.0
2.42.5
2.92.92.9
3.33.5
3.85.4
6.0
2.73.0
3.44.2
4.34.4
4.84.9
5.15.55.6
9.1
0 1 2 3 4 5 6 7 8 9 10
MAJORITARIAN USA
UKAustralia
CanadaCOMBINED
Korea, Republic ofTaiwanMexico
ThailandJapan
GermanyHungary
New ZealandRussia
UkrainePROPORTIONAL
SpainPoland
RomaniaCzech Republic
SwedenNorway
NetherlandsDenmark
SwitzerlandSlovenia
IsraelBelgium
Ref: Pippa Norris ‘Institutions Matter’ CUP 2003

www.pippanorris.com
4. Effect on TurnoutRef: Pippa Norris 2002. Democratic Phoenix Ch 4.
Type of Electoral System Mean Vote/VAP 1990s
N.
MAJORITARIAN
Alternative Vote 65.5 2
2nd Ballot 58.5 21
First-Past-The-Post 61.2 43
Single Non-Transferable Vote 52.6 2
Block Vote 56.5 9
All majoritarian 60.4 77
COMBINED
Combined-Dependent 66.6 7
Combined-Independent 63.5 19
All combined 64.0 26
PROPORTIONAL
List PR 70.0 59
Single Transferable Vote 83.4 2
All PR Systems 70.0 68
All 65.0 164

www.pippanorris.com
Effect on TurnoutRef: Pippa Norris 2002. Democratic Phoenix Ch 4.
Type of Electoral System Mean Vote/VAP 1990s
N.
MAJORITARIAN
Alternative Vote 65.5 2
2nd Ballot 58.5 21
First-Past-The-Post 61.2 43
Single Non-Transferable Vote 52.6 2
Block Vote 56.5 9
All majoritarian 60.4 77
COMBINED
Combined-Dependent 66.6 7
Combined-Independent 63.5 19
All combined 64.0 26
PROPORTIONAL
List PR 70.0 59
Single Transferable Vote 83.4 2
All PR Systems 70.0 68
All 65.0 164

www.pippanorris.com
Impact of compulsory votingVote/VAP Vote/Reg N. of Nations
Older democracies Compulsory 79.4 86.9 7Non-Compulsory 71.7 72.7 32Difference +7.7 +14.2 39
Newer democracies Compulsory 67.7 75.8 9Non-Compulsory 69.3 73.9 31Difference -1.6 +1.9 40
Semi-democracies Compulsory 53.9 60.6 5Non-Compulsory 56.6 67.0 40Difference -2.7 -6.4 45
Non-democracies Compulsory 40.9 70.6 2Non-Compulsory 61.8 67.8 38Difference -20.9 +2.8 40
All Compulsory 65.9 75.4 23Non-Compulsory 64.2 70.0 140Difference +1.9 +5.4 163

www.pippanorris.com
5. Impact on women
“As a simple rule, women proved twice as likely to be elected under PR than majoritarian electoral systems.
Women were 10.8 percent of MPs in majoritarian systems, 15.1 percent in mixed or semi-proportional systems, and 19.8 percent of members in PR systems.”
P.Norris in R.Rose Encyclopedia of Elections (CQ 2001)

www.pippanorris.com
CO
UN
TRY
South KoreaPakistan
MaliNepal
UkraineMalawi
ThailandFranceZambia
IndiaChile
PhilippinesAustralia
UKBangladesh
USACanadaTaiwanJapan
EcuadorVenezuela
HungaryIrelandRussiaMexico
ItalyBolivia
New ZealandGermany
TurkeyMadagasgar
GreeceBrazil
Czech RepUraguayPortugal
IsraelColombia
BelgiumPoland
BulgariaCosta Rica
SpainSwitzerland
ArgentinaAustria
NetherlandsSouth Africa
MozambiqueFinland
DenmarkNorwaySweden
%Women MPs mid 1990s
50403020100
PR
Mixed
FPTP
Related Documents