Tréhu, A.M., Bohrmann, G., Torres, M.E., and Colwell, F.S. (Eds.) Proceedings of the Ocean Drilling Program, Scientific Results Volume 204 12. DATA REPORT: CONSOLIDATION AND STRENGTH CHARACTERISTICS OF SEDIMENTS FROM ODP SITE 1244, HYDRATE RIDGE, CASCADIA CONTINENTAL MARGIN 1 Brian Tan, 2 John T. Germaine, 2 and Peter B. Flemings 3 ABSTRACT Eight whole-core samples from Ocean Drilling Program Site 1244, Hydrate Ridge, Cascadia continental margin, were provided to Massa- chusetts Institute of Technology (Cambridge, Massachusetts, USA) for geotechnical characterization. The samples were collected from depths ranging from 5 to 136 meters below seafloor (mbsf). Seven of the eight whole-core samples were located within the gas hydrate stability zone, whereas the eighth sample was located in the free gas zone. Atterberg limits testing showed that the average liquid limit of the soil is 81% and the average plastic limit is 38%, giving an average plasticity index of 43%. The liquid limit is sensitive to oven drying, shown by a drop in liquid limit to 64% when tests were performed on an oven-dried sam- ple. Loss on ignition averages 5.45 wt%. Constant rate of strain consoli- dation (CRSC) tests were performed to obtain the compression charac- teristics of the soil, as well as to determine the stress history of the site. CRSC tests also provided hydraulic conductivity and coefficient of con- solidation characteristics for these sediments. The compression ratio (C c ) ranges from 0.340 to 0.704 (average = 0.568). C c is fairly constant to a depth of 79 mbsf, after which C c decreases downhole. The recompres- sion ratio (C r ) ranges from 0.035 to 0.064 (average = 0.052). C r is con- stant throughout the depth range. In situ hydraulic conductivity varies between 1.5 × 10 –7 and 3 × 10 –8 cm/s and shows no trend with depth. 1 Tan, B., Germaine, J.T., and Flemings, P.B., 2006. Data report: Consolidation and strength characteristics of sediments from ODP Site 1244, Hydrate Ridge, Cascadia continental margin. In Tréhu, A.M., Bohrmann, G., Torres, M.E., and Colwell, F.S. (Eds.), Proc. ODP, Sci. Results, 204, 1–148 [Online]. Available from World Wide Web: <http:// www-odp.tamu.edu/publications/ 204_SR/VOLUME/CHAPTERS/ 102.PDF>. [Cited YYYY-MM-DD] 2 Department of Civil and Environmental Engineering, Massachusetts Institute of Technology, Cambridge MA 02139, USA. Correspondence author: [email protected] 3 Department of Geosciences, 503 Deike Building, The Pennsylvania State University, University Park PA 16802, USA. Initial receipt: 21 April 2004 Acceptance: 5 July 2005 Web publication: 27 April 2006 Ms 204SR-102

Welcome message from author
This document is posted to help you gain knowledge. Please leave a comment to let me know what you think about it! Share it to your friends and learn new things together.
Transcript

Tréhu, A.M., Bohrmann, G., Torres, M.E., and Colwell, F.S. (Eds.)Proceedings of the Ocean Drilling Program, Scientific Results Volume 204
12. DATA REPORT: CONSOLIDATION AND STRENGTH CHARACTERISTICS OF SEDIMENTS FROM ODP SITE 1244, HYDRATE RIDGE, CASCADIA CONTINENTAL MARGIN1
Brian Tan,2 John T. Germaine,2 and Peter B. Flemings3
ABSTRACT
Eight whole-core samples from Ocean Drilling Program Site 1244,Hydrate Ridge, Cascadia continental margin, were provided to Massa-chusetts Institute of Technology (Cambridge, Massachusetts, USA) forgeotechnical characterization. The samples were collected from depthsranging from 5 to 136 meters below seafloor (mbsf). Seven of the eightwhole-core samples were located within the gas hydrate stability zone,whereas the eighth sample was located in the free gas zone. Atterberglimits testing showed that the average liquid limit of the soil is 81% andthe average plastic limit is 38%, giving an average plasticity index of43%. The liquid limit is sensitive to oven drying, shown by a drop inliquid limit to 64% when tests were performed on an oven-dried sam-ple. Loss on ignition averages 5.45 wt%. Constant rate of strain consoli-dation (CRSC) tests were performed to obtain the compression charac-teristics of the soil, as well as to determine the stress history of the site.CRSC tests also provided hydraulic conductivity and coefficient of con-solidation characteristics for these sediments. The compression ratio(Cc) ranges from 0.340 to 0.704 (average = 0.568). Cc is fairly constant toa depth of 79 mbsf, after which Cc decreases downhole. The recompres-sion ratio (Cr) ranges from 0.035 to 0.064 (average = 0.052). Cr is con-stant throughout the depth range. In situ hydraulic conductivity variesbetween 1.5 × 10⁻⁷ and 3 × 10⁻⁸ cm/s and shows no trend with depth.
1Tan, B., Germaine, J.T., and Flemings, P.B., 2006. Data report: Consolidation and strength characteristics of sediments from ODP Site 1244, Hydrate Ridge, Cascadia continental margin. In Tréhu, A.M., Bohrmann, G., Torres, M.E., and Colwell, F.S. (Eds.), Proc. ODP, Sci. Results, 204, 1–148 [Online]. Available from World Wide Web: <http://www-odp.tamu.edu/publications/204_SR/VOLUME/CHAPTERS/102.PDF>. [Cited YYYY-MM-DD]2Department of Civil and Environmental Engineering, Massachusetts Institute of Technology, Cambridge MA 02139, USA. Correspondence author: [email protected] of Geosciences, 503 Deike Building, The Pennsylvania State University, University Park PA 16802, USA.
Initial receipt: 21 April 2004Acceptance: 5 July 2005Web publication: 27 April 2006Ms 204SR-102

B. TAN ET AL.DATA REPORT: CONSOLIDATION AND STRENGTH CHARACTERISTICS 2
Ko-consolidated undrained compression/extension (CKoUC/E) testswere also performed to determine the peak undrained shear strength,stress-strain curve, and friction angle. The normalized undrainedstrength ranges from 0.29 to 0.35. The friction angle ranges from 27 to37. Because of the limited amount of soil, CRSC and CKoUC/E testswere also conducted on resedimented specimens.
INTRODUCTION
Gas hydrates are gas-water compounds formed under high pressuresand low temperatures. Gas hydrates consist of a gas molecule, mostcommonly methane, enclosed within a crystal lattice of water. The re-sulting compound is an icelike solid that dissociates into gaseous formwhen exposed to low pressures and high temperatures. Conditions fa-vorable to the formation of gas hydrates exist beneath the seafloor in aregion called the gas hydrate stability zone (GHSZ). The free gas zone(FGZ), beneath the GHSZ, is where the geothermal gradient causes thetemperature to exceed that required for gas hydrate stability.
Ocean Drilling Program (ODP) Leg 204, a 2-month-long cruise tostudy the biogeochemical factors controlling the distribution and con-centration of gas hydrates in an accretionary margin—specifically, Hy-drate Ridge, Cascadia continental margin—began in July 2002. This re-gion is located off the coast of Oregon in the Pacific Northwest, USA.ODP Site 1244 is located in 890 m of water, ~3 km northeast of thesouthern summit of Hydrate Ridge (Tréhu, Bohrmann, Rack, Torres, etal., 2003). Three-dimensional seismic data have shown that the bot-tom-simulating reflector (BSR) occurs at a depth of ~125 meters belowseafloor (mbsf) at this location (Tréhu, Bohrmann, Rack, Torres, et al.,2003). Eight whole-core samples totaling 8.5 ft obtained from HydrateRidge were brought to the Massachusetts Institute of Technology (MIT;Cambridge, Massachusetts, USA) geotechnical laboratory to perform ex-periments with the following goals in mind:
1. To determine the consolidation and strength properties of thesoil, such as the compression and recompression indexes, hy-draulic conductivity, undrained strength, friction angle, andmodulus.
2. To determine the stress history profile at the site, keeping inmind that Hydrate Ridge is located in an accretionary marginsetting and may be under passive loading.
3. To estimate the stress history and normalized soil engineeringproperties (SHANSEP) parameters for the site as a means of deter-mining the strength profile.
4. To obtain the input parameters for a complex soil model, specif-ically, the MIT E-3 soil model developed by Whittle (1987) usingthe “best-fit” parameter method proposed by Korchaiyapruk(2000).
Consolidation properties were determined from results of constantrate of strain consolidation (CRSC) tests on both intact and resedi-mented samples. Strength properties were measured from the results ofKo-consolidated undrained (CKoU) triaxial tests.
The eight whole-core samples were obtained from Holes 1244B and1244C at various depths. Table T1 gives a list of the samples providedby ODP to MIT for laboratory tests. Sections 204-1244B-1H-4, 3H-3, 4H-
T1. Whole-core sections, p. 68.

B. TAN ET AL.DATA REPORT: CONSOLIDATION AND STRENGTH CHARACTERISTICS 3
6, and 6H-8 and 204-1244C-8H-7, 9H-5, and 13H-3 were located withinthe GHSZ. The sample from Section 204-1244C-17H-3 was located be-low the BSR in the FGZ. Table T2 gives an overview of all the tests per-formed.
LABORATORY TESTING METHODOLOGY
All laboratory tests were conducted in accordance with the AmericanSociety for Testing and Materials (ASTM) standard for each test. In thecases where ASTM standards do not exist, the procedures followed wereaccording to established MIT geotechnical laboratory protocols.
Radiography and Logging
All samples were X-rayed at MIT’s radiography facility in order to as-sess the sample quality, presence of inclusions, general soil type, andvariation in soil fabric. The X-ray procedure followed is similar to ASTMstandard D4452 (ASTM International, 2003f). Radiography allows selec-tion of the best quality material for testing. The tube X-rays are foundin “Appendix A,” p. 16. In addition to the X-rays, a tube log was pro-vided for each tube (“Appendix B,” p. 18). These logs contain the vari-ous tests performed on samples from each tube, as well as their locationrelative to the tube length.
Remolded and Resedimented Sample Preparation
Because of the limited amount of intact, good-quality soil availablefor testing, a number of tests were conducted on laboratory reconsti-tuted specimens. Remolded specimens were prepared by first mixing to-gether trimmings left over from sample preparation and highly dis-turbed soil that could not be used for intact sample testing. The soil wasthen allowed to air dry until the water content was ~40%. For consoli-dation tests, the soil was pressed into the consolidation ring, makingsure that the soil was tightly packed into the ring. For strength tests, thesoil was placed in a mold that had the same dimensions of a triaxial testspecimen. The soil was slowly packed, making sure that it was placedtightly in the mold and there were no voids.
Test results showed that preparing the soil using this method doesnot produce results similar to those of tests on intact specimens, espe-cially in undrained shearing. Because of this, a more complicatedmethod for preparing remolded specimens with a higher water contentwas employed. This method, called resedimentation, is similar to theprocess used to prepare resedimented Boston blue clay (Germaine,1982). The soil for resedimentation is prepared by mixing trimmingsfrom previous tests and soil deemed unsuitable for intact sample testingin a blender with distilled water to produce a slurry. The slurry is thick-ened by placing it in a 100°C oven and removing it every hour for ~5min to stir it and let it cool. This process of stirring and cooling the soilensures the soil is only thickened and not fully dried. Once the slurryhas thickened, it is ready for bench consolidation. For consolidationtests, the slurry is placed in the consolidation ring and tested immedi-ately. For strength tests, the slurry is first scooped into a tall oedometerring. The slurry must be slowly scooped into the ring to prevent the for-mation of air pockets and voids. The slurry is incrementally loaded un-til the vertical effective stress reaches ~50 kPa. A load:increment ratio of
T2. Tests conducted on Hydrate Ridge soil, p. 69.

B. TAN ET AL.DATA REPORT: CONSOLIDATION AND STRENGTH CHARACTERISTICS 4
1 was used, with each load being maintained for at least 24 hr to ensurethe completion of primary consolidation. Once 50 kPa is achieved, theload is reduced until an overconsolidation ratio (OCR) of 4 is reached.The sample is then extruded and trimmed as an undisturbed sample.The results show that resedimented specimens exhibit similar behaviorto intact specimens, especially in undrained shearing.
Index Tests
Only one Atterberg limit test was performed on each tube. Hence, inorder to obtain an average liquid and plastic limit for each tube, smallamounts of soil from various locations within the tube were mixed to-gether and used for each Atterberg limit test. The liquid limit was ob-tained by placing the soil in a casagrande cup, grooving the soil with anASTM groove tool, and counting the number of blows necessary toclose the groove by 0.5 in. The water content at 25 blows is the liquidlimit. The plastic limit is the water content of a soil when rolled untilcrumbling occurs at a diameter of 1/8 in. The Atterberg limits tests wereconducted in accordance with ASTM D4318 (ASTM International,2003b).
Water content is measured by taking the difference in the weight of asoil before and after oven drying and dividing this difference by theoven-dried weight. In the consolidation and strength tests, two watercontents are measured: wc and wn. Wc refers to the water content mea-sured from the leftover trimmings during sample preparation. Wn refersto the water content of the test specimen itself.
Loss on ignition is performed by placing a small amount (~5 g) ofoven-dried sample in a muffle furnace at 440°C for 24 hr. The change inweight divided by the original weight gives the amount of loss on igni-tion. The test was performed in accordance with ASTM D2974 (ASTMInternational, 2003e).
Particle size analysis is used to determine the distribution of particlesize for the soil. For the fine-grained particles, the particle size distribu-tion is determined by performing the hydrometer test described inASTM D422 (ASTM International, 2003d).
Mineralogy
Soil mineralogy can be identified using X-ray diffraction (XRD). TheMIT XRD facility uses a Rigaku Rotaflex 180-mm diffractometer with agraphite-diffracted beam monochromator using CuKα radiation (λ =1.5418 Å). The diffractometer is normally rotated between 4° and 56°.
Initial random powder XRD tests showed the presence of calciumcarbonate. In order to eliminate the effect of calcium carbonate on theresults of the tests, calcite-treated random powder samples were alsoprepared. The calcite was removed by HCl digestion in accordance withASTM D4373 (ASTM International, 2004b).
XRD results show that the samples contain a significant amount ofnonclay particles. As such, random powder XRD was performed on theclay-size fraction only. The clay-size fraction was separated by sedimen-tation in a volumetric flask. Sedimentation was performed by mixingthe soil into a slurry and placing it in a flask filled with water at pH 9.The soil was then allowed to sediment in the flask for 48 hr. The sedi-mentation time was determined from the settlement time of the clay-size particles during the particle size analysis test.
B. TAN ET AL.DATA REPORT: CONSOLIDATION AND STRENGTH CHARACTERISTICS 5
Consolidation Testing
The MIT geotechnical laboratory has developed a standard methodfor performing CRSC tests. In addition, ASTM D4186 (ASTM Interna-tional, 2003c) was used as a guideline in conducting CRSC tests.
The CRSC test can be divided into three stages. The first stage of thetest involves sample preparation. This is performed by placing the sam-ple in a trimming jig that lowers the consolidation ring into the soil.Excess soil is slowly trimmed from around the perimeter, and the ring ispushed into the soil in small increments. After the sample is trimmedinto the CRSC ring, it is carefully placed in the CRSC cell. The CRSC cellis then filled with salt water and tightly sealed with the piston locked inplace.
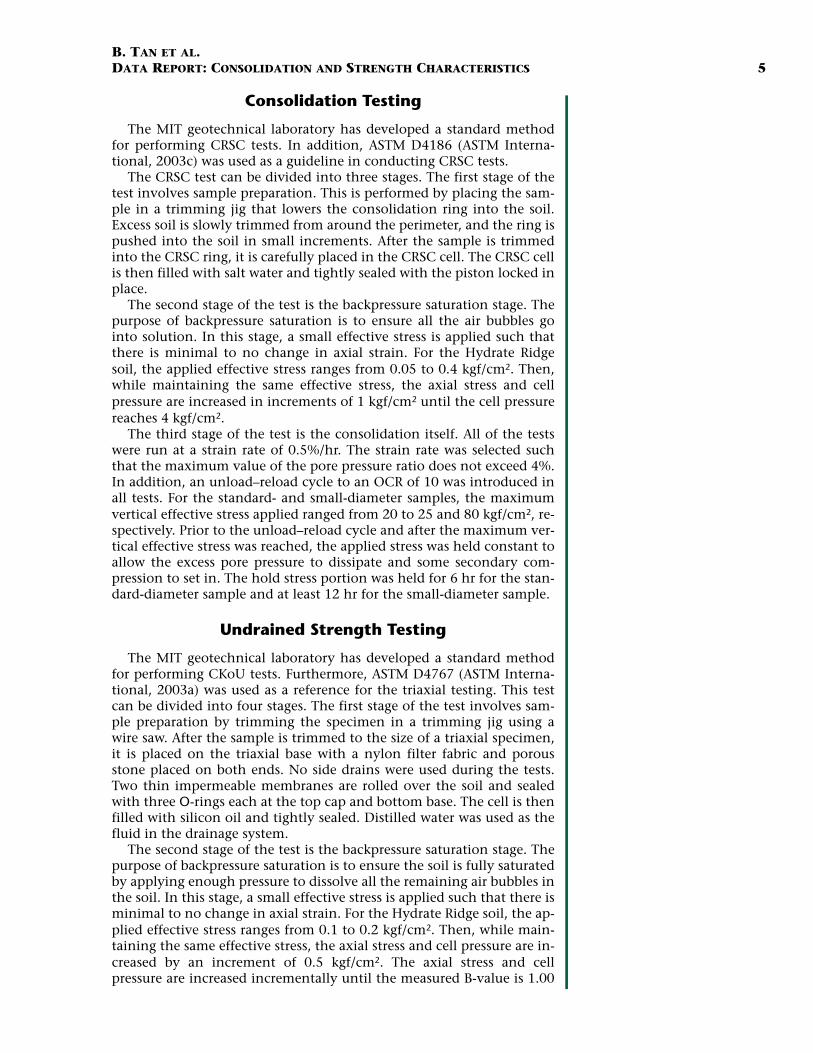
The second stage of the test is the backpressure saturation stage. Thepurpose of backpressure saturation is to ensure all the air bubbles gointo solution. In this stage, a small effective stress is applied such thatthere is minimal to no change in axial strain. For the Hydrate Ridgesoil, the applied effective stress ranges from 0.05 to 0.4 kgf/cm2. Then,while maintaining the same effective stress, the axial stress and cellpressure are increased in increments of 1 kgf/cm2 until the cell pressurereaches 4 kgf/cm2.
The third stage of the test is the consolidation itself. All of the testswere run at a strain rate of 0.5%/hr. The strain rate was selected suchthat the maximum value of the pore pressure ratio does not exceed 4%.In addition, an unload–reload cycle to an OCR of 10 was introduced inall tests. For the standard- and small-diameter samples, the maximumvertical effective stress applied ranged from 20 to 25 and 80 kgf/cm2, re-spectively. Prior to the unload–reload cycle and after the maximum ver-tical effective stress was reached, the applied stress was held constant toallow the excess pore pressure to dissipate and some secondary com-pression to set in. The hold stress portion was held for 6 hr for the stan-dard-diameter sample and at least 12 hr for the small-diameter sample.
Undrained Strength Testing
The MIT geotechnical laboratory has developed a standard methodfor performing CKoU tests. Furthermore, ASTM D4767 (ASTM Interna-tional, 2003a) was used as a reference for the triaxial testing. This testcan be divided into four stages. The first stage of the test involves sam-ple preparation by trimming the specimen in a trimming jig using awire saw. After the sample is trimmed to the size of a triaxial specimen,it is placed on the triaxial base with a nylon filter fabric and porousstone placed on both ends. No side drains were used during the tests.Two thin impermeable membranes are rolled over the soil and sealedwith three O-rings each at the top cap and bottom base. The cell is thenfilled with silicon oil and tightly sealed. Distilled water was used as thefluid in the drainage system.
The second stage of the test is the backpressure saturation stage. Thepurpose of backpressure saturation is to ensure the soil is fully saturatedby applying enough pressure to dissolve all the remaining air bubbles inthe soil. In this stage, a small effective stress is applied such that there isminimal to no change in axial strain. For the Hydrate Ridge soil, the ap-plied effective stress ranges from 0.1 to 0.2 kgf/cm2. Then, while main-taining the same effective stress, the axial stress and cell pressure are in-creased by an increment of 0.5 kgf/cm2. The axial stress and cellpressure are increased incrementally until the measured B-value is 1.00

B. TAN ET AL.DATA REPORT: CONSOLIDATION AND STRENGTH CHARACTERISTICS 6
+ 0.02, which indicates complete saturation, or until the backpressurereaches 3 kgf/cm2.
The third stage of the test is the Ko-consolidation stage. In Ko-con-solidation, the sample is consolidated one-dimensionally (i.e., no radialstrain). The MIT geotechnical laboratory employs the SHANSEP testingtechnique (Ladd, 1991). After consolidation, the applied stress was heldby keeping the vertical, cell, and pore pressures constant for 24 hr. Thehold stress portion is necessary to allow the excess pore pressure to dis-sipate and allow some secondary compression to set in.
The final stage of the test is the undrained shearing stage. Once thespecimen has undergone 24 hr of hold stress, a leak check is performedby closing the drainage valves for 30 min. During this time, the back-pressure should remain constant. After the leak check, the specimen issheared with the drainage lines closed. The specimen is sheared at0.5%/hr until a distinct failure plane has developed or 10% strain hasbeen reached.
RESULTS
The experiments performed on each section are listed in Table T2. Allof the variables are defined in Table T3. Included in this report are thedata collected from the experiment program. For interpretation of theseresults, refer to Tan (2004).
Atterberg Limits and Loss on Ignition
Atterberg limits were performed on eight undisturbed samples andone oven-dried sample (Table T2). The results of the tests can be foundin Table T4. Interestingly, performing Atterberg limits on an oven-driedsample significantly decreases the liquid limit.
Figure F1 shows the results of the Atterberg limits tests plotted on aplasticity chart in order to determine the soil classification based on theUnified Soil Classification System ASTM D2487 (ASTM International,2004a). From this chart, a cohesive soil has high plasticity if it has a liq-uid limit >50% and low plasticity if the liquid limit is <50%. Further-more, a soil is predominantly clay if it plots above the A-line andmostly silt if it plots below the A-line. Based on this chart, the HydrateRidge soil classifies as a high-plasticity silt (MH) or high-plasticity or-ganic soil (OH). In addition, analysis reveals that the soil classifies asMH and not OH because the ratio of the oven-dried liquid limit to theundisturbed liquid limit is >75%. In general, however, there is littlevariation in the Atterberg limits, suggesting the soil consists of the samebasic material.
Loss on ignition was performed on eight samples (Table T2). Table T4gives the results and shows that loss on ignition is constant with depthand relatively large.
Particle size distribution was performed on a sample from Section204-1244C-13H-3 (Table T2). Figure F2 gives the particle size distribu-tion curve. The distribution curve shows that the soil contains 50%clay-size particles. Together with the plasticity index, the resulting ac-tivity is close to 1. This result is typical of the clay mineral illite.
T3. Nomenclature, p. 70.
T4. Atterberg limits, organic mat-ter content, and calcite content tests, p. 71.
Liquid limit (%)
0
20
40
60
80
Oven-dried sampleUndisturbed samples
CL
CH
ML
MH, OH
U-Line
A-Line
Pla
stic
ity in
dex
(%)
0 20 40 60 80 100
F1. Plasticity chart, p. 19.
Particle diameter (mm)
0.00010.0010.010.10
20
40
60
80
100
Silt Clay
Per
cent
fine
r (%
)
F2. Particle size distribution curve, p. 20.

B. TAN ET AL.DATA REPORT: CONSOLIDATION AND STRENGTH CHARACTERISTICS 7
Mineralogy
The specimens prepared using random powder preparation areshown in Table T2. The X-ray diffractometer was rotated between 6°and 56° 2θ. Tables T5, T6, and T7 and Figures F3, F4, and F5 give XRDresults of the three random powder samples. Note that the intensity isplotted on a log scale.
Table T2 gives a list of the specimens used in calcite-treated randompowder preparation. Table T4 gives the calcium carbonate content ofthe soil. Tables T8, T9, T10, T11, T12, and T13 and Figures F6, F7, andF8 show the results of calcite-treated random powder testing. The re-sults of the two random powder samples show a significant amount ofnonclay particles.
In order to accurately identify the clay-size particles, XRD was per-formed on random powder samples containing only the clay-size frac-tion of the soil. Table T2 shows the samples that were tested using thispreparation. Tables T14, T15, and T16 and Figures F9, F10, and F11show XRD results on the clay-size fraction of random powder samples.
Consolidation Results
Table T17 gives a summary of the details and conditions of eachCRSC test. The first section of the table gives the water content (wc),plastic limit (wp), and liquid limit (wl) for each tube, as discussed in “In-dex Tests,” p. 4. The water content is taken from the soil trimmings.Also indicated is the number of observations (#obs) and standard devia-tion (SD) for each water content measurement. The Atterberg limits arediscussed in “Index Tests,” p. 4, and are an average for each tube.
The next section of the table gives the specimen data such as the nat-ural water content (wn), plasticity index (Ip), total density (ρt), initialvoid ratio (ei), initial saturation (Si), and specific gravity (Gs). The naturalwater content and specific gravity were taken from Tréhu, Bohrmann,Rack, Torres, et al. (2003). The plasticity index describes the range overwhich the soil behaves plastically and is defined as the difference be-tween the liquid and plastic limit.
The third section of the table gives the test conditions such as thebackpressure (ub) and the strain rate (δε/δt). The backpressure gives thepressure at which the specimen is saturated.
The last section of the table gives consolidation properties such asthe compression index, recompression index, and in situ hydraulic con-ductivity. The compression index refers to the slope of the normallyconsolidated portion of the compression curve while in e-log (σ′v)space. The compression index (Cc) ranges from 0.340 to 0.704 (average= 0.568). Cc is fairly constant to a depth of 79 mbsf, after which Cc de-creases downhole. The recompression index refers to the slope of theunload–reload portion of the curve while in e-log (σ′v) space. The re-compression index (Cr) ranges from 0.035 to 0.064 (average = 0.052). Cr
is constant throughout the depth. It must be noted that the recompres-sion index varies with the amount of unloading that occurs. As such,the quoted recompression indexes are for unloading to an OCR of 10.The in situ hydraulic conductivity is obtained by extrapolating the hy-draulic conductivity to the in situ void ratio. The in situ hydraulic con-ductivity varies between 1.5 × 10⁻⁷ and 3 × 10⁻⁸ cm/s with no trendwith depth.
Figures F12, F13, F14, F15, F16, F17, F18, F19, F20, F21, F22, F23,F24, F25, F26, F27, F28, and F29 show the consolidation curves in both
T5. XRD random powder sample, Section 204-1244B-4H-6, p. 72.
T6. XRD random powder sample, Section 204-1244C-8H-7, p. 73.
T7. XRD random powder sample, Section 204-1244C-13H-3, p. 74.
23222120191817161514131211109876
Inte
nsity
2θ CuKα (°)
204-1244C-13H-3WR204-1244C-8H-7WR204-1244B-4H-6WR
F3. XRD on random powder sam-ple 2 = 6° to 23°, p. 21.
393837363534333231302928272625242322In
tens
ity
2θ CuKα (°)
204-1244C-13H-3WR204-1244C-8H-7WR204-1244B-4H-6WR
F4. XRD on random powder sam-ple 2 = 22° to 39°, p. 22.
56555453525150494847464544434241403938
Inte
nsity
2θ CuKα (°)
204-1244C-13H-3WR204-1244C-8H-7WR204-1244B-4H-6WR
F5. XRD on random powder sam-ple 2 = 38° to 56°, p. 23.
T8. Calcite-treated XRD random powder sample, Section 204-1244B-3H-3, p. 75.
T9. Calcite-treated XRD random powder sample, Section 204-1244B-4H-6, p. 76.
T10. Calcite-treated XRD random powder sample, Section 204-1244B-6H-8, p. 77.

B. TAN ET AL.DATA REPORT: CONSOLIDATION AND STRENGTH CHARACTERISTICS 8
e-log (σ′v) and ε-log (σ′v), normalized excess pore pressure, coefficientof consolidation (cv), strain energy, and hydraulic conductivity (k) foreach CRSC test. The CRSC data can be found in tabular form in TablesT18, T19, T20, T21, T22, T23, T24, T25, T26, T27, T28, T29, T30, T31,T32, T33, T34, and T35. The first column of the table gives the timeeach measurement was made. The second column gives the strain (ε) inpercent. The third, fourth, and fifth columns give the vertical stress (σv), pore pressure (u), and cell pressure (σ cell), respectively. The sixthcolumn gives the effective stress (σ′v), which is defined as
σ′v = σv – 2/3(u – σcell). (1)
The seventh column gives the void ratio (e). The eighth column givesthe excess pore pressure, which is defined as
u – σcell. (2)
The ninth and tenth columns give the hydraulic conductivity (k) andcoefficient of consolidation (cv), respectively. The following are theequations used to define these parameters:
k = (ε × H2 × γ)/(2 × Δub), and (3)
cv = (H2/2 × Δub) (Δσv/Δt). (4)
The eleventh and twelfth columns give the normalized excess porepressure (ΔU/σv) and the work, which is used for the strain energy calcu-lations. The following equation is used to measure the work:
work = [(σ i + σ i–1)/2] × ln[(1 – εi–1)/(1 – εi)]. (5)
It must be noted that all stresses are measured in ksc (kgf/cm2). The con-version of ksc to SI units is 1 kPa = 98.07 kPa.
Strength Results
Table T36 gives the details and conditions of each CKoU triaxial forthe consolidation stage of the test. The first and second sections refer tothe same parameters in the CRSC results. The third section gives the ini-tial effective stress (σi) and backpressure (ub). In this section, εa refers tothe axial strain at the end of saturation. εvol is the water inflow neces-sary to saturate the soil and system. Included in this section is the B-value, which is used to test the degree of saturation of the sample. Asample with a B-value of 100 ± 2 means that it has been fully saturatedafter the backpressure saturation stage. The fourth section of this tablegives the general consolidation results. This section gives the preconsol-idation pressure (σ′p) using the strain energy method, the strain rate(δε/δt), and the compression index (Cc). The fifth section gives the con-solidation properties at the maximum stress condition. εa and εvol givethe axial and volumetric strain at this condition, whereas σ′vm gives themaximum vertical effective stress. ts gives the length of time the stresswas held constant, and Kc gives the maximum lateral stress ratio (σ′h/σ′v). The sixth section gives the consolidation properties at the preshearcondition. For normally consolidated specimens, the maximum stresscondition is the preshear condition; hence, these consolidation proper-
T11. Calcite-treated XRD random powder sample, Section 204-1244C-8H-7, p. 78.
T12. Calcite-treated XRD random powder sample, Section 204-1244C-13H-3, p. 79.
T13. Calcite-treated XRD random powder sample, Section 204-1244C-17H-3, p. 80.
22212019181716151413121110987654
Inte
nsity
2θ CuKα (°)
204-1244B-3H-3WR204-1244B-4H-6WR204-1244B-6H-8WR204-1244B-8H-7WR204-1244C-13H-3WR204-1244C-17H-3WR
F6. XRD on calcite-treated ran-dom powder sample 2 = 4° to 22°, p. 24.
39383736353433323130292827262524232221
Inte
nsity
204-1244B-3H-3WR204-1244B-4H-6WR204-1244B-6H-8WR204-1244B-8H-7WR204-1244C-13H-3WR204-1244C-17H-3WR
2θ CuKα (°)
F7. XRD on calcite-treated ran-dom powder sample 2 = 21° to 39°, p. 25.
56555453525150494847464544434241403938
Inte
nsity
2θ CuKα (°)
204-1244B-3H-3WR204-1244B-4H-6WR204-1244B-6H-8WR204-1244B-8H-7WR204-1244C-13H-3WR204-1244C-17H-3WR
F8. XRD on calcite-treated ran-dom powder sample 2 = 38° to 56°, p. 26.
T14. Clay-fraction XRD random powder sample, Section 204-1244B-4H-6, p. 81.
T15. Clay-fraction XRD random powder sample, Section 204-1244C-8H-7, p. 82.

B. TAN ET AL.DATA REPORT: CONSOLIDATION AND STRENGTH CHARACTERISTICS 9
ties are the same. For overconsolidated specimens, the vertical effectivestress is reduced, causing the maximum stress condition to differ fromthe preshear condition; hence, certain consolidation properties will bedifferent. εa and εvol give the axial and volumetric strain at the end ofunloading, whereas σ′vc gives the consolidation vertical effective stress.ts gives the length of time the stress was held constant, and Kc gives thelateral stress ratio (σ′h/σ′v) after unloading. OCR indicates the overcon-solidation ratio at the end of unloading.
Table T37 gives the details, test conditions, and strength propertiesfor the undrained shearing stage of each test. The strength propertiesare given for both the case when maximum shear occurs and when ei-ther maximum obliquity or the end of shearing is reached. Obliquityrefers to the ratio of the normalized shear stress to the normalized meaneffective stress (q/p′). The normalized undrained strength ranges from0.29 to 0.35, whereas the friction angle ranges from 27 to 37 at peakstrength.
Incidentally, maximum obliquity also occurs when the friction angleis the greatest. It must be noted that shearing in extension was per-formed after shearing in compression for tests on Samples 204-1244B-1H-4, 138–148 cm, 4H-6, 125–135 cm, 204-1244C-9H-5, 115–125 cm,and the resedimented sample (TX 644).
Figures F30, F31, F32, F33, F34, F35, F36, F37, F38, F39, F40, F41,F42, F43, F44, F45, F46, F47, F48, and F49 show the consolidation andundrained shearing results for each triaxial test. The odd-numbered fig-ures show the consolidation results including the consolidation curvein e-log (σ′v) and ε-log (σ′v) space, lateral stress ratio, strain energy, andstress path for each test. The even-numbered figures show the un-drained shearing results including the normalized shear stress vs. strain,normalized excess pore pressure and shear-induced pore pressure, nor-malized secant modulus, friction angle, and normalized stress path foreach test. The results of the consolidation and undrained shearing por-tions of the triaxial tests can be found in Tables T38, T39, T40, T41,T42, T43, T44, T45, T46, T47, T48, T49, T50, T51, T52, T53, T54, T55,T56, and T57. The first column of the table gives the time each mea-surement was made. The second, seventh, and eighth columns give theaxial strain (εa), volumetric strain (εvol), and void ratio (e), respectively.The third and fourth columns give the vertical effective stress (σ′v) andthe horizontal effective stress (σ′h), respectively. The fifth and sixth col-umns give the mean effective stress (p′) and shear stress (q), respec-tively. The following equations are used to define the mean effectivestress and shear stress:
p′ = (σ′v + σ′h)/2, and (6)
q = (σv – σh)/2. (7)
The ninth column gives the lateral stress ratio, which is defined as
K = σ′h/σ′v. (8)
The tenth column gives the work, which is used for the strain energymethod of calculating the preconsolidation pressure. Equation 5 givesthe equation used to calculate work. The eleventh column gives thearea of the specimen at midheight. The twelfth column gives the ap-plied backpressure (ub). The thirteenth, fourteenth, and fifteenth col-
T16. Clay-fraction XRD random powder sample, Section 204-1244C-13H-3, p. 83.
22212019181716151413121110987654
Inte
nsity
2θ CuKα (°)
204-1244B-3H-3WR204-1244B-4H-6WR204-1244B-6H-8WR
F9. XRD on clay-fraction random powder sample 2 = 4° to 22°, p. 27.
39383736353433323130292827262524232221
Inte
nsity
2θ CuKα (°)
204-1244B-3H-3WR204-1244B-4H-6WR204-1244B-6H-8WR
F10. XRD on clay-fraction ran-dom powder sample 2 = 21° to 39°, p. 28.
56555453525150494847464544434241403938
Inte
nsity
2θ CuKα (°)
204-1244B-3H-3WR204-1244B-4H-6WR204-1244B-6H-8WR
F11. XRD on clay-fraction ran-dom powder sample 2 = 38° to 56°, p. 29.
T17. CRSC test conditions and consolidation properties, p. 84.
1010.1
Ver
tical
str
ain,
ε (
%)
0
5
10
15
20
Coe
f. of
con
solid
atio
n, C
v (c
m2 /
s)
0.000
0.002
0.004
0.006
0.008
0.010
0.012
0.014
Exc
ess
pore
pre
ssur
e, Δ
U/σ
' v
0.04
2520151050
Tota
l wor
k
0.0
0.2
0.4
0.6
0.8
1.0
1.2
1.4
1E-71E-8
Voi
d R
atio
, e
1.0
1.1
1.2
1.3
1.4
1.5
Voi
d R
atio
, e
1.0
1.1
1.2
1.3
1.4
1.5
Vertical consolidation stress, σ'v (ksc)
Vertical consolidation stress, σ'v (ksc)
Vertical consolidation stress, σ'v (ksc)
Vertical consolidation stress, σ'v (ksc)
Vertical consolidation stress, σ'v (ksc)
0.02
0.00
-0.02
-0.041010.1
1010.1
Hydraulic conductivity, k (cm/s)
1010.1
F12. CRS 491 consolidation data, p. 30.

B. TAN ET AL.DATA REPORT: CONSOLIDATION AND STRENGTH CHARACTERISTICS 10
umns give the axial membrane correction, radial membrane correction,and axial drainage correction, respectively. Similar to the CRSC tests, allstresses are measured in ksc (kgf/cm2). The conversion of ksc to SI unitsis 1 kPa = 98.07 kPa.
ACKNOWLEDGMENTS
Graduate study was funded by the Arnold Schoettler Fellowship andthe MIT Presidential Fellowship. This research was funded by the OceanDrilling Program (ODP). This research used samples and data obtainedby ODP. ODP is sponsored by the U.S. National Science Foundation(NSF) and participating countries under management of Joint Oceano-graphic Institutions, Inc (JOI).
Ver
tical
str
ain,
ε (
%)
0
5
10
15
20
0.000
0.002
0.004
0.006
0.008
0.010
0.012
0.014
-0.02
-0.01
0.00
0.01
0.02
2520151050
Tota
l wor
k
0.0
0.2
0.4
0.6
0.8
1.0
1.2
1.4
Voi
d R
atio
, e
1.0
1.1
1.2
1.3
1.4
Voi
d R
atio
, e
1.0
1.1
1.2
1.3
1.4
1.5
1010.1
Vertical consolidation stress, σ'v (ksc)
1010.1
Vertical consolidation stress, σ'v (ksc)
1010.1
Vertical consolidation stress, σ'v (ksc)
Exc
ess
pore
pre
ssur
e, Δ
U/σ
' v
Vertical consolidation stress, σ'v (ksc)
1010.1
Vertical consolidation stress, σ'v (ksc)
Coe
f. of
con
solid
atio
n, C
v (c
m2 /
s)
Hydraulic conductivity, k (cm/s)
1E-71E-8
F13. CRS 493 consolidation data, p. 31.
1.010.1
0
5
10
15
20
1.010.10.0000
0.0005
0.0010
0.0015
0.0020
0.0025
0.0030
0.0035
0.0040
1.010.1-0.2
-0.1
0.0
0.1
0.2
25201510500.0
0.5
1.0
1.5
2.0
1E-71E-80.9
1.0
1.1
1.2
1.3
1.4
1.010.10.9
1.0
1.1
1.2
1.3
1.4
Ver
tical
str
ain,
ε (
%)
Tota
l wor
k
Voi
d R
atio
, eV
oid
Rat
io, e
Vertical consolidation stress, σ'v (ksc) Vertical consolidation stress, σ'v (ksc) Vertical consolidation stress, σ'v (ksc)
Exc
ess
pore
pre
ssur
e, Δ
U/σ
' v
Vertical consolidation stress, σ'v (ksc) Vertical consolidation stress, σ'v (ksc)
Coe
f. of
con
solid
atio
n, C
v (c
m2 /
s)
Hydraulic conductivity, k (cm/s)
F14. CRS 495 consolidation data, p. 32.
1.010.1
0
5
10
15
20
1.010.10.000
0.001
0.002
0.003
0.004
0.005
1.010.1-0.10
-0.05
0.00
0.05
0.10
864200.0
0.1
0.2
0.3
0.4
0.5
0.6
0.7
1E-71E-81.1
1.2
1.3
1.4
1.5
1.6
1.010.11.1
1.2
1.3
1.4
1.5
1.6
Ver
tical
str
ain,
ε (
%)
Tota
l wor
k
Voi
d R
atio
, eV
oid
Rat
io, e
Vertical consolidation stress, σ'v (ksc) Vertical consolidation stress, σ'v (ksc) Vertical consolidation stress, σ'v (ksc)
Exc
ess
pore
pre
ssur
e, Δ
U/σ
' v
Vertical consolidation stress, σ'v (ksc) Vertical consolidation stress, σ'v (ksc)
Coe
f. of
con
solid
atio
n, C
v (c
m2 /
s)
Hydraulic conductivity, k (cm/s)
F15. CRS 497 consolidation data, p. 33.
1.010.10.01
0
10
20
30
40
50
1010.10.010.0000
0.0005
0.0010
0.0015
0.0020
0.0025
0.0030
1010.10.01-0.2
-0.1
0.0
0.1
0.2
25201510500.0
0.2
0.4
0.6
0.8
1.0
1.2
1.4
1E-71E-80.8
1.0
1.2
1.4
1.6
1.8
2.0
2.2
2.4
2.6
1010.10.010.8
1.0
1.2
1.4
1.6
1.8
2.0
2.2
2.4
2.6
Ver
tical
str
ain,
ε (
%)
Tota
l wor
k
Voi
d R
atio
, eV
oid
Rat
io, e
Vertical consolidation stress, σ'v (ksc) Vertical consolidation stress, σ'v (ksc) Vertical consolidation stress, σ'v (ksc)
Exc
ess
pore
pre
ssur
e, Δ
U/σ
' v
Vertical consolidation stress, σ'v (ksc) Vertical consolidation stress, σ'v (ksc)
Coe
f. of
con
solid
atio
n, C
v (c
m2 /
s)
Hydraulic conductivity, k (cm/s)
F16. CRS 499 consolidation data, p. 34.
1010.1
0
5
10
15
20
25
1010.10.000
0.005
0.010
0.015
0.020
1010.1
-0.04
-0.02
0.00
0.02
0.04
25201510500.0
0.5
1.0
1.5
2.0
2.5
1E-71E-80.95
1.05
1.15
1.25
1.35
1.45
1.55
1010.10.95
1.05
1.15
1.25
1.35
1.45
1.55
Ver
tical
str
ain,
ε (
%)
Tota
l wor
k
Voi
d R
atio
, eV
oid
Rat
io, e
Vertical consolidation stress, σ'v (ksc) Vertical consolidation stress, σ'v (ksc) Vertical consolidation stress, σ'v (ksc)
Exc
ess
pore
pre
ssur
e, Δ
U/σ
' v
Vertical consolidation stress, σ'v (ksc) Vertical consolidation stress, σ'v (ksc)
Coe
f. of
con
solid
atio
n, C
v (c
m2 /
s)
Hydraulic conductivity, k (cm/s)
F17. CRS 504 consolidation data, p. 35.

B. TAN ET AL.DATA REPORT: CONSOLIDATION AND STRENGTH CHARACTERISTICS 11
1010.1
0
5
10
15
20
25
30
1010.10.000
0.001
0.002
0.003
0.004
0.005
0.006
1010.1-0.10
-0.05
0.00
0.05
0.10
201510500.0
0.5
1.0
1.5
2.0
1E-71E-80.9
1.0
1.1
1.2
1.3
1.4
1.5
1.6
1.7
1010.10.9
1.0
1.1
1.2
1.3
1.4
1.5
1.6
1.7
Ver
tical
str
ain,
ε (
%)
Tota
l wor
k
Voi
d R
atio
, eV
oid
Rat
io, e
Vertical consolidation stress, σ'v (ksc) Vertical consolidation stress, σ'v (ksc) Vertical consolidation stress, σ'v (ksc)
Exc
ess
pore
pre
ssur
e, Δ
U/σ
' v
Vertical consolidation stress, σ'v (ksc) Vertical consolidation stress, σ'v (ksc)
Coe
f. of
con
solid
atio
n, C
v (c
m2 /
s)
Hydraulic conductivity, k (cm/s)
F18. CRS 508 consolidation data, p. 36.
1010.10.01
0
10
20
30
40
50
1010.10.010.0000
0.0005
0.0010
0.0015
0.0020
0.0025
0.0030
1010.10.01-0.2
-0.1
0.0
0.1
0.2
25201510500.0
0.5
1.0
1.5
2.0
2.5
1E-61E-71E-8
1.0
1.5
2.0
2.5
3.0
1010.10.01
1.0
1.5
2.0
2.5
3.0
Ver
tical
str
ain,
ε (
%)
Tota
l wor
k
Voi
d R
atio
, eV
oid
Rat
io, e
Vertical consolidation stress, σ'v (ksc) Vertical consolidation stress, σ'v (ksc) Vertical consolidation stress, σ'v (ksc)
Exc
ess
pore
pre
ssur
e, Δ
U/σ
' v
Vertical consolidation stress, σ'v (ksc) Vertical consolidation stress, σ'v (ksc)
Coe
f. of
con
solid
atio
n, C
v (c
m2 /
s)
Hydraulic conductivity, k (cm/s)
F19. CRS 511 consolidation data, p. 37.
1001010.1
0
10
20
30
40
1001010.10.000
0.001
0.002
0.003
0.004
0.005
1001010.1-0.04
-0.02
0.00
0.02
0.04
4030201000
1
2
3
4
5
1E-71E-81E-90.7
0.8
0.9
1.0
1.1
1.2
1.3
1.4
1.5
1.6
1.7
1.8
1001010.10.7
0.8
0.9
1.0
1.1
1.2
1.3
1.4
1.5
1.6
1.7
1.8
Ver
tical
str
ain,
ε (
%)
Tota
l wor
k
Voi
d R
atio
, eV
oid
Rat
io, e
Vertical consolidation stress, σ'v (ksc) Vertical consolidation stress, σ'v (ksc) Vertical consolidation stress, σ'v (ksc)
Exc
ess
pore
pre
ssur
e, Δ
U/σ
' v
Vertical consolidation stress, σ'v (ksc) Vertical consolidation stress, σ'v (ksc)
Coe
f. of
con
solid
atio
n, C
v (c
m2 /
s)
Hydraulic conductivity, k (cm/s)
F20. CRS 563 consolidation data, p. 38.
1001010.1
0
5
10
15
20
25
30
1001010.10.0000
0.0005
0.0010
0.0015
0.0020
1001010.1-0.10
-0.05
0.00
0.05
0.10
8060402000
1
2
3
4
5
6
7
8
1E-71E-81E-90.5
0.6
0.7
0.8
0.9
1.0
1.1
1.2
1.3
1001010.10.5
0.6
0.7
0.8
0.9
1.0
1.1
1.2
1.3
Ver
tical
str
ain,
ε (
%)
Tota
l wor
k
Voi
d R
atio
, eV
oid
Rat
io, e
Vertical consolidation stress, σ'v (ksc) Vertical consolidation stress, σ'v (ksc) Vertical consolidation stress, σ'v (ksc)
Exc
ess
pore
pre
ssur
e, Δ
U/σ
' v
Vertical consolidation stress, σ'v (ksc) Vertical consolidation stress, σ'v (ksc)
Coe
f. of
con
solid
atio
n, C
v (c
m2 /
s)
Hydraulic conductivity, k (cm/s)
F21. CRS 564 consolidation data, p. 39.
1001010.1
0
5
10
15
20
25
30
1001010.10.000
0.001
0.002
0.003
0.004
0.005
0.006
1001010.1-0.02
-0.01
0.00
0.01
0.02
60402000
1
2
3
4
5
6
7
8
1E-71E-81E-90.65
0.75
0.85
0.95
1.05
1.15
1.25
1.35
1001010.10.65
0.75
0.85
0.95
1.05
1.15
1.25
1.35
Ver
tical
str
ain,
ε (
%)
Tota
l wor
k
Voi
d R
atio
, eV
oid
Rat
io, e
Vertical consolidation stress, σ'v (ksc) Vertical consolidation stress, σ'v (ksc) Vertical consolidation stress, σ'v (ksc)
Exc
ess
pore
pre
ssur
e, Δ
U/σ
' v
Vertical consolidation stress, σ'v (ksc) Vertical consolidation stress, σ'v (ksc)
Coe
f. of
con
solid
atio
n, C
v (c
m2 /
s)
Hydraulic conductivity, k (cm/s)
F22. CRS 567 consolidation data, p. 40.
1001010.1
0
10
20
30
0.000
0.002
0.004
0.006
0.008
0.010
1001010.1-0.02
-0.01
0.00
0.01
0.02
0
2
4
6
8
10
0.65
0.75
0.85
0.95
1.05
1.15
1.25
1.35
1.45
1.55
1001010.10.65
0.75
0.85
0.95
1.05
1.15
1.25
1.35
1.45
1.55
Ver
tical
str
ain,
ε (
%)
Tota
l wor
k
Voi
d R
atio
, eV
oid
Rat
io, e
Vertical consolidation stress, σ'v (ksc) Vertical consolidation stress, σ'v (ksc) Vertical consolidation stress, σ'v (ksc)
Exc
ess
pore
pre
ssur
e, Δ
U/σ
' v
Vertical consolidation stress, σ'v (ksc) Vertical consolidation stress, σ'v (ksc)
Coe
f. of
con
solid
atio
n, C
v (c
m2 /
s)
Hydraulic conductivity, k (cm/s)
1001010.1806040200 1E-71E-81E-9
F23. CRS 569 consolidation data, p. 41.
1010.1
0
5
10
15
20
25
1010.10.0000
0.0005
0.0010
0.0015
0.0020
0.0025
0.0030
0.0035
0.0040
1010.1-0.4
-0.2
0.0
0.2
0.4
25201510500.0
0.5
1.0
1.5
2.0
1E-71E-81E-90.75
0.85
0.95
1.05
1.15
1.25
1.35
1010.10.75
0.85
0.95
1.05
1.15
1.25
1.35
Ver
tical
str
ain,
ε (
%)
Tota
l wor
k
Voi
d R
atio
, eV
oid
Rat
io, e
Vertical consolidation stress, σ'v (ksc) Vertical consolidation stress, σ'v (ksc) Vertical consolidation stress, σ'v (ksc)
Exc
ess
pore
pre
ssur
e, Δ
U/σ
' v
Vertical consolidation stress, σ'v (ksc) Vertical consolidation stress, σ'v (ksc)C
oef.
of c
onso
lidat
ion,
Cv
(cm
2 /s)
Hydraulic conductivity, k (cm/s)
F24. CRS 577 consolidation data, p. 42.
1001010.1
0
10
20
30
40
1001010.10.0000
0.0005
0.0010
0.0015
0.0020
0.0025
0.0030
0.0035
0.0040
1001010.1-0.06
-0.04
-0.02
0.00
0.02
0.04
0.06
3025201510500.0
0.5
1.0
1.5
2.0
2.5
3.0
1E-71E-81E-90.6
0.7
0.8
0.9
1.0
1.1
1.2
1.3
1.4
1.5
1.6
1001010.10.6
0.7
0.8
0.9
1.0
1.1
1.2
1.3
1.4
1.5
1.6
Ver
tical
str
ain,
ε (
%)
Tota
l wor
k
Voi
d R
atio
, eV
oid
Rat
io, e
Vertical consolidation stress, σ'v (ksc) Vertical consolidation stress, σ'v (ksc) Vertical consolidation stress, σ'v (ksc)
Exc
ess
pore
pre
ssur
e, Δ
U/σ
' v
Vertical consolidation stress, σ'v (ksc) Vertical consolidation stress, σ'v (ksc)
Coe
f. of
con
solid
atio
n, C
v (c
m2 /
s)
Hydraulic conductivity, k (cm/s)
F25. CRS 578 consolidation data, p. 43.
1001010.1
0
10
20
30
40
1001010.10.0000
0.0005
0.0010
0.0015
0.0020
0.0025
0.0030
0.0035
0.0040
1001010.1-0.04
-0.02
0.00
0.02
0.04
201510500.0
0.5
1.0
1.5
2.0
1E-71E-81E-90.5
0.6
0.7
0.8
0.9
1.0
1.1
1.2
1.3
1.4
1.5
1.6
1001010.10.5
0.6
0.7
0.8
0.9
1.0
1.1
1.2
1.3
1.4
1.5
1.6
Ver
tical
str
ain,
ε (
%)
Tota
l wor
k
Voi
d R
atio
, eV
oid
Rat
io, e
Vertical consolidation stress, σ'v (ksc) Vertical consolidation stress, σ'v (ksc) Vertical consolidation stress, σ'v (ksc)
Exc
ess
pore
pre
ssur
e, Δ
U/σ
' v
Vertical consolidation stress, σ'v (ksc) Vertical consolidation stress, σ'v (ksc)
Coe
f. of
con
solid
atio
n, C
v (c
m2 /
s)
Hydraulic conductivity, k (cm/s)
F26. CRS 580 consolidation data, p. 44.
1001010.1
0
10
20
30
40
1001010.10.0000
0.0005
0.0010
0.0015
0.0020
0.0025
0.0030
0.0035
0.0040
1001010.1-0.04
-0.02
0.00
0.02
0.04
201510500.0
0.5
1.0
1.5
2.0
1E-71E-81E90.6
0.7
0.8
0.9
1.0
1.1
1.2
1.3
1.4
1.5
1.6
1.7
1001010.10.6
0.7
0.8
0.9
1.0
1.1
1.2
1.3
1.4
1.5
1.6
1.7
Ver
tical
str
ain,
ε (
%)
Tota
l wor
k
Voi
d R
atio
, eV
oid
Rat
io, e
Vertical consolidation stress, σ'v (ksc) Vertical consolidation stress, σ'v (ksc) Vertical consolidation stress, σ'v (ksc)
Exc
ess
pore
pre
ssur
e, Δ
U/σ
' v
Vertical consolidation stress, σ'v (ksc) Vertical consolidation stress, σ'v (ksc)
Coe
f. of
con
solid
atio
n, C
v (c
m2 /
s)
Hydraulic conductivity, k (cm/s)
F27. CRS 584 consolidation data, p. 45.
1001010.1
0
10
20
30
1001010.10.000
0.001
0.002
0.003
0.004
0.005
0.006
1001010.1-0.04
-0.02
0.00
0.02
0.04
201510500.0
0.5
1.0
1.5
2.0
1E-71E-81E-90.5
0.6
0.7
0.8
0.9
1.0
1.1
1.2
1.3
1.4
1.5
1001010.10.5
0.6
0.7
0.8
0.9
1.0
1.1
1.2
1.3
1.4
1.5
Ver
tical
str
ain,
ε (
%)
Tota
l wor
k
Voi
d R
atio
, eV
oid
Rat
io, e
Vertical consolidation stress, σ'v (ksc) Vertical consolidation stress, σ'v (ksc) Vertical consolidation stress, σ'v (ksc)
Exc
ess
pore
pre
ssur
e, Δ
U/σ
' v
Vertical consolidation stress, σ'v (ksc) Vertical consolidation stress, σ'v (ksc)
Coe
f. of
con
solid
atio
n, C
v (c
m2 /
s)
Hydraulic conductivity, k (cm/s)
F28. CRS 585 consolidation data, p. 46.
1001010.1
0
10
20
30
40
0.0000
0.0005
0.0010
0.0015
0.0020
0.0025
0.0030
0.0035
0.0040
-0.04
-0.02
0.00
0.02
0.04
8060402000
2
4
6
8
10
1E-71E-81E-90.5
0.6
0.7
0.8
0.9
1.0
1.1
1.2
1.3
1.4
1.5
0.5
0.6
0.7
0.8
0.9
1.0
1.1
1.2
1.3
1.4
1.5
1001010.1 1001010.1
1001010.1
Ver
tical
str
ain,
ε (
%)
Tota
l wor
k
Voi
d R
atio
, eV
oid
Rat
io, e
Vertical consolidation stress, σ'v (ksc) Vertical consolidation stress, σ'v (ksc) Vertical consolidation stress, σ'v (ksc)
Exc
ess
pore
pre
ssur
e, Δ
U/σ
' v
Vertical consolidation stress, σ'v (ksc) Vertical consolidation stress, σ'v (ksc)
Coe
f. of
con
solid
atio
n, C
v (c
m2 /
s)
Hydraulic conductivity, k (cm/s)
F29. CRS 608 consolidation data, p. 47.
T18. CRS 491 consolidation data, Sample 204-1244C-13H-3, 144–147 cm, p. 85.
T19. CRS 493 consolidation data, Sample 204-1244C-13H-3, 139–142 cm, p. 86.
T20. CRS 495 consolidation data, Sample 204-1244C-17H-3, 97–100 cm, p. 87.
T21. CRS 497 consolidation data, Sample 204-1244B-3H-3, 145–148 cm, p. 88.
T22. CRS 499 consolidation data, resedimented sample, p. 89.
T23. CRS 504 consolidation data, Sample 204-1244C-8H-7, 71–74 cm, p. 90.
T24. CRS 508 consolidation data, Sample 204-1244B-4H-6, 120–125 cm, p. 91.
T25. CRS 511 consolidation data, resedimented Sample 204-1244B-6H-8, 24–29 cm, p. 92.

B. TAN ET AL.DATA REPORT: CONSOLIDATION AND STRENGTH CHARACTERISTICS 12
T26. CRS 563 consolidation data, Sample 204-1244B-4H-6, 134–137 cm, p. 93.
T27. CRS 564 consolidation data, Sample 204-1244C-17H-3, 88–91 cm, p. 94.
T28. CRS 567 consolidation data, Sample 204-1244C-13H-3, 120–123 cm, p. 95.
T29. CRS 569 consolidation data, Sample 204-1244C-9H-5, 105–108 cm, p. 96.
T30. CRS 577 consolidation data, remolded sample, p. 97.
T31. CRS 578 consolidation data, Sample 204-1244C-8H-7, 45–48 cm, p. 98.
T32. CRS 580 consolidation data, Sample 204-1244B-1H-4, 125–128 cm, p. 99.
T33. CRS 584 consolidation data, Sample 204-1244B-6H-8, 6–9 cm, p. 100.
T34. CRS 585 consolidation data, Sample 204-1244B-3H-3, 120–123 cm, p. 101.
T35. CRS 608 consolidation data, Sample 204-1244B-1H-4, 126-129 cm, p. 102.
T36. CKoU test conditions and re-sults for consolidation stage, p. 103.
T37. CKoU test conditions and re-sults for undrained shearing stage, p. 104.
101
Str
ain,
ε (
%)
02468
1012141618202224
2520151050
Tota
l wor
k
0.0
0.5
1.0
1.5
2.0
2.5
3.0
101
Late
ral s
tres
s ra
tio, K
0
0.4
0.5
0.6
0.7
0.8
0.9
1.0
201510500
5
10
15
101
Voi
d ra
tio, e
1.001.051.101.151.201.251.301.351.401.451.501.551.601.65
Vertical consolidation stress, σ'v (ksc) Vertical consolidation stress, σ'v (ksc) Vertical consolidation stress, σ'v (ksc)
Vertical consolidation stress, σ'v (ksc) Mean stress, (σ'a + σ'r)/2 (ksc)
She
ar s
tres
s, (
σ a –
σr)
/2 (
ksc)
F30. TX 635 consolidation data, p. 48.
864200.20
0.22
0.24
0.26
0.28
0.30
0.32
86420-0.1
0.0
0.1
0.2
0.3
0.4
86420
Inte
rnal
fric
tion
angl
e, φ
(°)
15
20
25
30
35
1.00.80.60.40.20.00.0
0.2
0.4
0.6
1010.10.010.0011
10
100
1000
Axial strain, εa (%)N
orm
aliz
ed s
hear
str
ess,
q/σ
' vc
Axial strain, εa (%) Axial strain, εa (%)
Axial strain, εa (%)
Nor
mal
ized
por
e pr
essu
re, Δ
U/σ
' vc
Nor
mal
ized
she
ar s
tres
s, q
/σ' v
c
Normalized mean stress, p'/σ'vc
Nor
mal
ized
und
rain
ed m
odul
us, E
u/σ'
vc
Excess: ue/σ'vcShear induced: us/σ'vc
F31. TX 635 undrained shearing data, p. 49.
101
0
2
46
810
1214
1618
2022
24
4030201000
1
2
3
4
1010.4
0.5
0.6
0.7
0.8
0.9
1.0
4030201000
10
20
30
1010.60
0.65
0.70
0.75
0.80
0.85
0.90
0.95
1.00
1.05
1.10
1.15
1.20
Str
ain,
ε (
%)
Tota
l wor
k
Late
ral s
tres
s ra
tio, K
0
Voi
d ra
tio, e
Vertical consolidation stress, σ'v (ksc) Vertical consolidation stress, σ'v (ksc) Vertical consolidation stress, σ'v (ksc)
Vertical consolidation stress, σ'v (ksc) Mean stress, (σ'a + σ'r)/2 (ksc)
She
ar s
tres
s, (
σ a –
σr)
/2 (
ksc)
F32. TX 636 consolidation data, p. 50.
864200.20
0.22
0.24
0.26
0.28
0.30
86420-0.1
0.0
0.1
0.2
0.3
0.4
8642015
20
25
30
1.00.80.60.40.20.00.0
0.2
0.4
0.6
1010.10.010.0011
10
100
1000
Inte
rnal
fric
tion
angl
e, φ
(°)
Axial strain, εa (%)
Nor
mal
ized
she
ar s
tres
s, q
/σ' v
c
Axial strain, εa (%) Axial strain, εa (%)
Axial strain, εa (%)
Nor
mal
ized
por
e pr
essu
re, Δ
U/σ
' vc
Nor
mal
ized
she
ar s
tres
s, q
/σ' v
c
Normalized mean stress, p'/σ'vc
Nor
mal
ized
und
rain
ed m
odul
us, E
u/σ'
vc
Excess: ue/σ'vcShear induced: us/σ'vc
F33. TX 636 undrained shearing data, p. 51.
1010.1
0
2
4
6
8
10
12
10864200.0
0.1
0.2
0.3
0.4
0.5
1010.10.4
0.5
0.6
0.7
0.8
0.9
1.0
10864200
2
4
6
1010.10.70
0.75
0.80
0.85
0.90
0.95
Str
ain,
ε (
%)
Tota
l wor
k
Late
ral s
tres
s ra
tio, K
0
Voi
d ra
tio, e
Vertical consolidation stress, σ'v (ksc) Vertical consolidation stress, σ'v (ksc) Vertical consolidation stress, σ'v (ksc)
Vertical consolidation stress, σ'v (ksc) Mean stress, (σ'a + σ'r)/2 (ksc)
She
ar s
tres
s, (
σ a –
σr)
/2 (
ksc)
F34. TX 641 consolidation data, p. 52.
864200.20
0.25
0.30
0.35
0.40
0.45
0.50
86420-0.1
0.0
0.1
0.2
0.3
0.4
8642015
20
25
30
35
1.00.80.60.40.20.00.0
0.2
0.4
0.6
1010.10.010.0011
10
100
1000
Inte
rnal
fric
tion
angl
e, φ
(°)
Axial strain, εa (%)
Nor
mal
ized
she
ar s
tres
s, q
/σ' v
c
Axial strain, εa (%) Axial strain, εa (%)
Axial strain, εa (%)
Nor
mal
ized
por
e pr
essu
re, Δ
U/σ
' vc
Nor
mal
ized
she
ar s
tres
s, q
/σ' v
c
Normalized mean stress, p'/σ'vc
Nor
mal
ized
und
rain
ed m
odul
us, E
u/σ'
vc
Excess: ue/σ'vcShear induced: us/σ'vc
F35. TX 641 undrained shearing data, p. 53.
1010.1
0
2
4
6
8
10
12
5432100.0
0.1
0.2
0.3
0.4
1010.10.4
0.5
0.6
0.7
0.8
0.9
1.0
432100
1
2
3
1010.11.30
1.35
1.40
1.45
1.50
1.55
1.60
Str
ain,
ε (
%)
Tota
l wor
k
Late
ral s
tres
s ra
tio, K
0
Voi
d ra
tio, e
Vertical consolidation stress, σ'v (ksc) Vertical consolidation stress, σ'v (ksc) Vertical consolidation stress, σ'v (ksc)
Vertical consolidation stress, σ'v (ksc) Mean stress, (σ'a + σ'r)/2 (ksc)
She
ar s
tres
s, (
σ a –
σr)
/2 (
ksc)
F36. TX 642 consolidation data, p. 54.
864200.26
0.28
0.30
0.32
0.34
0.36
86420-0.1
0.0
0.1
0.2
0.3
0.4
8642020
25
30
35
40
1.00.80.60.40.20.00.0
0.2
0.4
0.6
1010.10.010.0011
10
100
1000
Inte
rnal
fric
tion
angl
e, φ
(°)
Axial strain, εa (%)
Nor
mal
ized
she
ar s
tres
s, q
/σ' v
c
Axial strain, εa (%) Axial strain, εa (%)
Axial strain, εa (%)
Nor
mal
ized
por
e pr
essu
re, Δ
U/σ
' vc
Nor
mal
ized
she
ar s
tres
s, q
/σ' v
c
Normalized mean stress, p'/σ'vc
Nor
mal
ized
und
rain
ed m
odul
us, E
u/σ'
vc
Excess: ue/σ'vcShear induced: us/σ'vc
F37. TX 642 undrained shearing data, p. 55.
1010.1
0
2
4
6
8
10
12
432100.00
0.05
0.10
0.15
0.20
1010.10.4
0.5
0.6
0.7
0.8
0.9
1.0
432100
1
2
3
1010.11.20
1.25
1.30
1.35
1.40
1.45
1.50
Str
ain,
ε (
%)
Tota
l wor
k
Late
ral s
tres
s ra
tio, K
0
Voi
d ra
tio, e
Vertical consolidation stress, σ'v (ksc) Vertical consolidation stress, σ'v (ksc) Vertical consolidation stress, σ'v (ksc)
Vertical consolidation stress, σ'v (ksc) Mean stress, (σ'a + σ'r)/2 (ksc)
She
ar s
tres
s, (
σ a –
σr)
/2 (
ksc)
F38. TX 643 consolidation data, p. 56.
86420-2-4-6-0.2
-0.1
0.0
0.1
0.2
0.3
0.4
-0.1
0.0
0.1
0.2
0.3
0.4
0.5
8642020
25
30
35
40
1.00.80.60.40.20.0-0.2
0.0
0.2
0.4
1010.10.010.0011
10
100
1000
86420-2-4-6
Inte
rnal
fric
tion
angl
e, φ
(°)
Axial strain, εa (%)
Nor
mal
ized
she
ar s
tres
s, q
/σ' v
c
Axial strain, εa (%) Axial strain, εa (%)
Axial strain, εa (%)
Nor
mal
ized
por
e pr
essu
re, Δ
U/σ
' vc
Nor
mal
ized
she
ar s
tres
s, q
/σ' v
c
Normalized mean stress, p'/σ'vc
Nor
mal
ized
und
rain
ed m
odul
us, E
u/σ'
vc
Excess: ue/σ'vcShear induced: us/σ'vc
F39. TX 643 undrained shearing data, p. 57.

B. TAN ET AL.DATA REPORT: CONSOLIDATION AND STRENGTH CHARACTERISTICS 13
10.1
0
2
4
6
8
10
12
1.21.00.80.60.40.20.00.00
0.02
0.04
0.06
0.08
10.10.4
0.5
0.6
0.7
0.8
0.9
1.0
1.00.80.60.40.20.00.0
0.2
0.4
0.6
10.11.50
1.55
1.60
1.65
1.70
1.75
1.80
1.85
1.90
Str
ain,
ε (
%)
Tota
l wor
k
Late
ral s
tres
s ra
tio, K
0
Voi
d ra
tio, e
Vertical consolidation stress, σ'v (ksc) Vertical consolidation stress, σ'v (ksc) Vertical consolidation stress, σ'v (ksc)
Vertical consolidation stress, σ'v (ksc) Mean stress, (σ'a + σ'r)/2 (ksc)
She
ar s
tres
s, (
σ a –
σr)
/2 (
ksc)
F40. TX 644 consolidation data, p. 58.
6420-2-4-6-0.3
-0.2
-0.1
0.0
0.1
0.2
0.3
0.4
6420-2-4-6-0.1
0.0
0.1
0.2
0.3
0.4
0.5
642020
25
30
35
40
1.00.80.60.40.20.0
-0.2
0.0
0.2
0.4
1010.10.010.0011
10
100
1000
Inte
rnal
fric
tion
angl
e, φ
(°)
Axial strain, εa (%)
Nor
mal
ized
she
ar s
tres
s, q
/σ' v
c
Axial strain, εa (%) Axial strain, εa (%)
Axial strain, εa (%)
Nor
mal
ized
por
e pr
essu
re, Δ
U/σ
' vc
Nor
mal
ized
she
ar s
tres
s, q
/σ' v
c
Normalized mean stress, p'/σ'vc
Nor
mal
ized
und
rain
ed m
odul
us, E
u/σ'
vc
Excess: ue/σ'vcShear induced: us/σ'vc
F41. TX 644 undrained shearing data, p. 59
1010.1
0
2
4
6
8
10
12
14
16
10864200.0
0.2
0.4
0.6
0.8
1010.10.4
0.5
0.6
0.7
0.8
0.9
1.0
10864200
2
4
6
1010.11.25
1.30
1.35
1.40
1.45
1.50
1.55
1.60
1.65
1.70
Str
ain,
ε (
%)
Tota
l wor
k
Late
ral s
tres
s ra
tio, K
0
Voi
d ra
tio, e
Vertical consolidation stress, σ'v (ksc) Vertical consolidation stress, σ'v (ksc) Vertical consolidation stress, σ'v (ksc)
Vertical consolidation stress, σ'v (ksc) Mean stress, (σ'a + σ'r)/2 (ksc)
She
ar s
tres
s, (
σ a –
σr)
/2 (
ksc)
F42. TX 645 consolidation data, p. 60.
420-2-4-6-8-0.3
-0.2
-0.1
0.0
0.1
0.2
0.3
0.4
420-2-4-6-8-0.1
0.0
0.1
0.2
0.3
0.4
0.5
4321020
25
30
35
40
1.00.80.60.40.20.0-0.4
-0.2
0.0
0.2
0.4
1010.10.010.0011
10
100
1000
Inte
rnal
fric
tion
angl
e, φ
(°)
Axial strain, εa (%)
Nor
mal
ized
she
ar s
tres
s, q
/σ' v
c
Axial strain, εa (%) Axial strain, εa (%)
Axial strain, εa (%)
Nor
mal
ized
por
e pr
essu
re, Δ
U/σ
' vc
Nor
mal
ized
she
ar s
tres
s, q
/σ' v
c
Normalized mean stress, p'/σ'vc
Nor
mal
ized
und
rain
ed m
odul
us, E
u/σ'
vc
Excess: ue/σ'vcShear induced: us/σ'vc
F43. TX 645 undrained shearing data, p. 61.
1010.1
0
2
4
6
8
10
12
14
16
18
1816141210864200.0
0.2
0.4
0.6
0.8
1.0
1.2
1.4
1.6
1.8
1010.10.4
0.5
0.6
0.7
0.8
0.9
1.0
16141210864200
2
4
6
8
10
12
1010.11.00
1.05
1.10
1.15
1.20
1.25
1.30
1.35
1.40
1.45
1.50
Str
ain,
ε (
%)
Tota
l wor
k
Late
ral s
tres
s ra
tio, K
0
Voi
d ra
tio, e
Vertical consolidation stress, σ'v (ksc) Vertical consolidation stress, σ'v (ksc) Vertical consolidation stress, σ'v (ksc)
Vertical consolidation stress, σ'v (ksc) Mean stress, (σ'a + σ'r)/2 (ksc)
She
ar s
tres
s, (
σ a –
σr)
/2 (
ksc)
F44. TX 646 consolidation data, p. 62.
1086420-2-4-6-0.2
-0.1
0.0
0.1
0.2
0.3
0.4
1086420-2-4-6-0.1
0.0
0.1
0.2
0.3
0.4
0.5
108642015
20
25
30
35
1.00.80.60.40.20.0-0.2
0.0
0.2
0.4
1010.10.010.0011
10
100
1000
Inte
rnal
fric
tion
angl
e, φ
(°)
Axial strain, εa (%)
Nor
mal
ized
she
ar s
tres
s, q
/σ' v
c
Axial strain, εa (%) Axial strain, εa (%)
Axial strain, εa (%)
Nor
mal
ized
por
e pr
essu
re, Δ
U/σ
' vc
Nor
mal
ized
she
ar s
tres
s, q
/σ' v
c
Normalized mean stress, p'/σ'vc
Nor
mal
ized
und
rain
ed m
odul
us, E
u/σ'
vc
Excess: ue/σ'vcShear induced: us/σ'vc
F45. TX 646 undrained shearing data, p. 63.
10.1
0
2
4
6
8
10
12
2.01.51.00.50.00.00
0.02
0.04
0.06
0.08
0.10
0.12
10.10.4
0.5
0.6
0.7
0.8
0.9
1.0
2.01.51.00.50.00.0
0.5
1.0
1.5
10.11.30
1.35
1.40
1.45
1.50
1.55
1.60
1.65
Str
ain,
ε (
%)
Tota
l wor
k
Late
ral s
tres
s ra
tio, K
0
Voi
d ra
tio, e
Vertical consolidation stress, σ'v (ksc) Vertical consolidation stress, σ'v (ksc) Vertical consolidation stress, σ'v (ksc)
Vertical consolidation stress, σ'v (ksc) Mean stress, (σ'a + σ'r)/2 (ksc)
She
ar s
tres
s, (
σ a –
σr)
/2 (
ksc)
F46. TX 647 consolidation data, p. 64.
10864200.0
0.1
0.2
0.3
0.4
0.5
0.6
0.7
1086420-0.2
-0.1
0.0
0.1
0.2
0.3
108642020
25
30
35
40
1.00.80.60.40.20.00.0
0.2
0.4
0.6
1010.10.010.0011
10
100
1000
10000
Inte
rnal
fric
tion
angl
e, φ
(°)
Axial strain, εa (%)
Nor
mal
ized
she
ar s
tres
s, q
/σ' v
c
Axial strain, εa (%) Axial strain, εa (%)
Axial strain, εa (%)
Nor
mal
ized
por
e pr
essu
re, Δ
U/σ
' vc
Nor
mal
ized
she
ar s
tres
s, q
/σ' v
c
Normalized mean stress, p'/σ'vc
Nor
mal
ized
und
rain
ed m
odul
us, E
u/σ'
vc
Excess: ue/σ'vcShear induced: us/σ'vc
F47. TX 647 undrained shearing data, p. 65.
10.1
0
2
4
6
8
10
12
1.21.00.80.60.40.20.00.00
0.02
0.04
0.06
0.08
10.10.4
0.5
0.6
0.7
0.8
0.9
1.0
1.00.80.60.40.20.00.0
0.2
0.4
0.6
10.11.55
1.60
1.65
1.70
1.75
1.80
1.85
1.90
1.95
Str
ain,
ε (
%)
Tota
l wor
k
Late
ral s
tres
s ra
tio, K
0
Voi
d ra
tio, e
Vertical consolidation stress, σ'v (ksc) Vertical consolidation stress, σ'v (ksc) Vertical consolidation stress, σ'v (ksc)
Vertical consolidation stress, σ'v (ksc) Mean stress, (σ'a + σ'r)/2 (ksc)
She
ar s
tres
s, (
σ a –
σr)
/2 (
ksc)
F48. TX 650 consolidation data, p. 66.
-12-10-8-6-4-20-0.3
-0.2
-0.1
0.0
0.1
0.2
0.3
-12-10-8-6-4-20-0.1
0.0
0.1
0.2
0.3
0.4
-12-10-8-6-4-20-80
-60
-40
-20
0
20
1.00.80.60.40.20.0-0.2
0.0
0.2
0.4
1010.10.010.0011
10
100
1000
10000
Inte
rnal
fric
tion
angl
e, φ
(°)
Axial strain, εa (%)
Nor
mal
ized
she
ar s
tres
s, q
/σ' v
c
Axial strain, εa (%) Axial strain, εa (%)
Axial strain, εa (%)
Nor
mal
ized
por
e pr
essu
re, Δ
U/σ
' vc
Nor
mal
ized
she
ar s
tres
s, q
/σ' v
c
Normalized mean stress, p'/σ'vc
Nor
mal
ized
und
rain
ed m
odul
us, E
u/σ'
vc
Excess: ue/σ'vcShear induced: us/σ'vc
F49. TX 650 undrained shear data, p. 67.
T38. TX 635 consolidation data, Sample 204-1244B-4H-6, 135–145 cm, p. 105.
T39. TX 635 undrained shearing data, Sample 204-1244B-4H-6, 135–145 cm, p. 106.
T40. TX 636 consolidation data, Sample 204-1244C-17H-3, 80–90 cm, p. 107.
T41. TX 636 undrained shear data, Sample 204-1244C-17H-3, 80–90 cm, p. 108.
T42. TX 641 consolidation data, remolded sample, p. 109.
T43. TX 641 undrained shearing data, remolded sample, p. 110.
T44. TX 642 consolidation data, Sample 204-1244B-3H-3, 128–138 cm, p. 111.
T45. TX 642 undrained shearing data, Sample 204-1244B-3H-3, 128–138 cm, p. 112.
T46. TX 643 consolidation data, Sample 204-1244B-1H-4, 138–148 cm, p. 113.
T47. TX 643 undrained shearing data, Sample 204-1244B-1H-4, 138–148 cm, p. 114.
T48. TX 644 consolidation data, resedimented sample, p. 115.
T49. TX 644 undrained shearing data, resedimented sample, p. 116.
T50. TX 645 consolidation data, Sample 204-1244B-3H-3, 125–135 cm, p. 117.
B. TAN ET AL.DATA REPORT: CONSOLIDATION AND STRENGTH CHARACTERISTICS 14
T52. TX 646 consolidation data, Sample 204-1244C-9H-5, 115–125 cm, p. 119.
T51. TX 645 undrained shearing data, Sample 204-1244B-3H-3, 125–135 cm, p. 118.
T53. TX 646 undrained shearing data, Sample 204-1244C-9H-5, 115–125 cm, p. 120.
T54. TX 647 consolidation data, resedimented sample, p. 121.
T55. TX 647 undrained shearing data, resedimented sample, p. 122.
T56. TX 650 consolidation data, resedimented sample, p. 123.
T57. TX 650 undrained shearing data, resedimented sample, p. 124.

B. TAN ET AL.DATA REPORT: CONSOLIDATION AND STRENGTH CHARACTERISTICS 15
REFERENCES
ASTM International, 2003a. Standard test method for consolidated undrained triaxialcompression test for cohesive soils (Standard D4767-02). In Annual Book of ASTMStandards (Vol. 04.08): Soil and Rock (I): West Conshohocken, PA (Am. Soc. Testingand Mater.), 911–934.
ASTM International, 2003b. Standard test method for liquid limit, plastic limit, andplasticity index of soils (Standard D4318-00). In Annual Book of ASTM Standards(Vol. 04.08): Soil and Rock (I): West Conshohocken, PA (Am. Soc. Testing andMater.), 582–595.
ASTM International, 2003c. Standard test method for one-dimensional consolidationproperties of soils using controlled-strain loading (Standard D4186-89[1998]). InAnnual Book of ASTM Standards (Vol. 04.08): Soil and Rock (I): West Conshohocken,PA (Am. Soc. Testing and Mater.), 530–535.
ASTM International, 2003d. Standard test method for particle-size analysis of soils(Standard D422-63[2002]). In Annual Book of ASTM Standards (Vol. 04.08): Soil andRock (I): West Conshohocken, PA (Am. Soc. Testing and Mater.), 10–17.
ASTM International, 2003e. Standard test methods for moisture, ash, and organicmatter of peat and other organic soils (Standard D2974-00). In Annual Book ofASTM Standards (Vol. 04.08): Soil and Rock (I): West Conshohocken, PA (Am. Soc.Testing and Mater.), 330–333.
ASTM International, 2003f. Standard test methods for X-ray radiography of soil sam-ples (Standard D4452-85[2002]). In Annual Book of ASTM Standards (Vol. 04.08):Soil and Rock (I): West Conshohocken, PA (Am. Soc. Testing and Mater.), 686–699.
ASTM International, 2004a. Standard test methods for unified soil classification sys-tem (Standard D2487-00). In Annual Book of ASTM Standards (Vol. 04.08): Soil andRock (I): West Conshohocken, PA (Am. Soc. Testing and Mater.), 249–260.
ASTM International, 2004b. Standard test methods for rapid determination of car-bonate content of soils (Standard D4347-02). In Annual Book of ASTM Standards(Vol. 04.08): Soil and Rock (I): West Conshohocken, PA (Am. Soc. Testing andMater.), 249–260.
Germaine, J T., 1982. Development of the directional shear cell for measuring cross-anisotropic clay properties [Sc.D. thesis]. MIT, Cambridge, MA.
Korchaiyapruk, A., 2000. Development of framework for soil model input parameterselection procedures [M.S. thesis]. MIT, Cambridge, MA.
Ladd, C.C., 1991. Stability evaluation during staged construction: twenty-second KarlTerzaghi lecture. J. Geotech. Eng., 117(4):537–615.
Tan, B.B., 2004. Geotechnical characterization of sediment from hydrate ridge, Casca-dia continental margin [S.M. thesis]. MIT, Cambridge, MA.
Tréhu, A.M., Bohrmann, G., Rack, F.R., Torres, M.E., et al., 2003. Proc. ODP, Init. Repts.,204 [CD-ROM]. Available from: Ocean Drilling Program, Texas A&M University,College Station TX 77845-9547, USA. [HTML]
Whittle, A.J., 1987. A constitutive model for overconsolidated clays with applicationto the cyclic loading of friction piles [Ph.D. thesis]. MIT, Cambridge, MA.
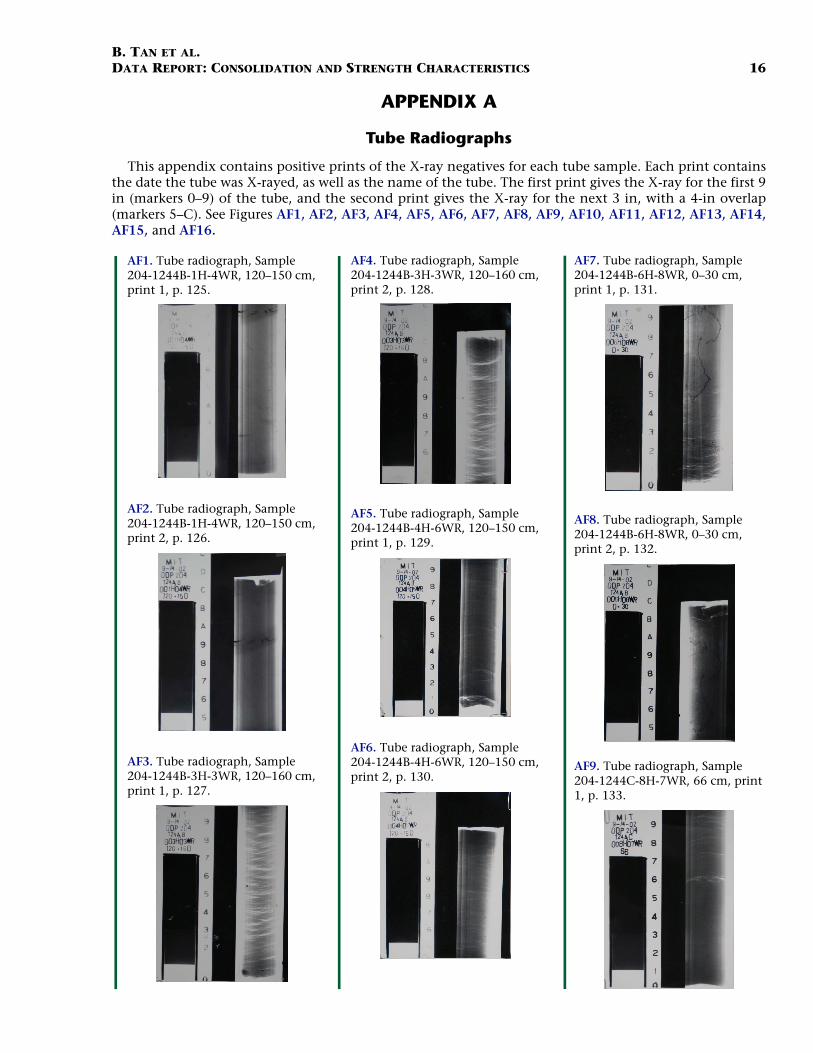
B. TAN ET AL.DATA REPORT: CONSOLIDATION AND STRENGTH CHARACTERISTICS 16
AF1. Tube radiograph, Sample 204-1244B-1H-4WR, 120–150 cm, print 1, p. 125.
AF2. Tube radiograph, Sample 204-1244B-1H-4WR, 120–150 cm, print 2, p. 126.
AF3. Tube radiograph, Sample 204-1244B-3H-3WR, 120–160 cm, print 1, p. 127.
AF4. Tube radiograph, Sample 204-1244B-3H-3WR, 120–160 cm, print 2, p. 128.
AF5. Tube radiograph, Sample 204-1244B-4H-6WR, 120–150 cm, print 1, p. 129.
AF6. Tube radiograph, Sample 204-1244B-4H-6WR, 120–150 cm, print 2, p. 130.
AF7. Tube radiograph, Sample 204-1244B-6H-8WR, 0–30 cm, print 1, p. 131.
AF8. Tube radiograph, Sample 204-1244B-6H-8WR, 0–30 cm, print 2, p. 132.
AF9. Tube radiograph, Sample 204-1244C-8H-7WR, 66 cm, print 1, p. 133.
APPENDIX A
Tube Radiographs
This appendix contains positive prints of the X-ray negatives for each tube sample. Each print containsthe date the tube was X-rayed, as well as the name of the tube. The first print gives the X-ray for the first 9in (markers 0–9) of the tube, and the second print gives the X-ray for the next 3 in, with a 4-in overlap(markers 5–C). See Figures AF1, AF2, AF3, AF4, AF5, AF6, AF7, AF8, AF9, AF10, AF11, AF12, AF13, AF14,AF15, and AF16.

B. TAN ET AL.DATA REPORT: CONSOLIDATION AND STRENGTH CHARACTERISTICS 17
AF10. Tube radiograph, Sample 204-1244C-8H-7WR, 66 cm, print 2, p. 134.
AF11. Tube radiograph, Sample 204-1244C-9H-5WR, 105 cm, print 1, p. 135.
AF12. Tube radiograph, Sample 204-1244C-9H-5WR, 105 cm, print 2, p. 136.
AF13. Tube radiograph, Sample 204-1244B-13H-3WR, 120 cm, print 1, p. 137.
AF14. Tube radiograph, Sample 204-1244B-13H-3WR, 120 cm, print 2, p. 138.
AF15. Tube radiograph, Sample 204-1244C-17H-3WR, 65 cm, print 1, p. 139.
AF16. Tube radiograph, Sample 204-1244C-17H-3WR, 65 cm, print 2, p. 140.

B. TAN ET AL.DATA REPORT: CONSOLIDATION AND STRENGTH CHARACTERISTICS 18
AF17. Radiography log, Sample 204-1244B-1H-4WR, 120–150 cm, p. 141.
AF18. Radiography log, Sample 204-1244B-3H-3WR, 120–150 cm, p. 142.
AF19. Radiography log, Sample 204-1244B-4H-6WR, 120–150 cm, p. 143.
AF20. Radiography log, Sample 204-1244B-6H-8WR, 0–30 cm, p. 144.
AF21. Radiography log, Sample 204-1244C-8H-7WR, 66 cm, p. 145.
AF22. Radiography log, Sample 204-1244C-9H-5WR, 105 cm, p. 146.
AF23. Radiography log, Sample 204-1244C-13H-3WR, 120 cm, p. 147.
AF24. Radiography log, Sample 204-1244C-17H-3WR, 65 cm, p. 148.
APPENDIX B
Radiography Logs
This appendix contains the radiography logs for each sampling tube. The top of the log contains thename of each tube, as well as the location of the top portion of the tube within the coring section. Theright-hand side of each log marks the specimen locations of the consolidation and triaxial tests performedon each tube. The left-hand side shows a brief description of the soil from the tube X-rays. See FiguresAF17, AF18, AF19, AF20, AF21, AF22, AF23, and AF24.

B. TAN ET AL.DATA REPORT: CONSOLIDATION AND STRENGTH CHARACTERISTICS 19
Figure F1. Plasticity chart showing results of Atterberg limits on undisturbed and oven-dried samples (datafrom Table T4, p. 71). CL = low-plasticity clay, CH = high-plasticity clay, ML = low-plasticity silt, MH =high-plasticity silt, OH = high-plasticity organic soil.
Liquid limit (%)
0
20
40
60
80
Oven-dried sampleUndisturbed samples
CL
CH
ML
MH, OH
U-Line
A-Line
Pla
stic
ity in
dex
(%)
0 20 40 60 80 100

B. TAN ET AL.DATA REPORT: CONSOLIDATION AND STRENGTH CHARACTERISTICS 20
Figure F2. Particle size distribution curve for Hydrate Ridge soil (Section 204-1244C-13H-3).
Particle diameter (mm)
0.00010.0010.010.10
20
40
60
80
100
Silt Clay
Per
cent
fine
r (%
)

B. TAN ET AL.DATA REPORT: CONSOLIDATION AND STRENGTH CHARACTERISTICS 21
Figure F3. X-ray diffraction on random powder sample 2 = 6° to 23°2θ (data from Tables T5, p. 72, T6,p. 73, and T7, p. 74).
23222120191817161514131211109876
Inte
nsity
2θ CuKα (°)
204-1244C-13H-3WR204-1244C-8H-7WR204-1244B-4H-6WR

B. TAN ET AL.DATA REPORT: CONSOLIDATION AND STRENGTH CHARACTERISTICS 22
Figure F4. X-ray diffraction on random powder sample 2 = 22° to 39°2θ (data from Tables T5, p. 72, T6,p. 73, and T7, p. 74).
393837363534333231302928272625242322
Inte
nsity
2θ CuKα (°)
204-1244C-13H-3WR204-1244C-8H-7WR204-1244B-4H-6WR
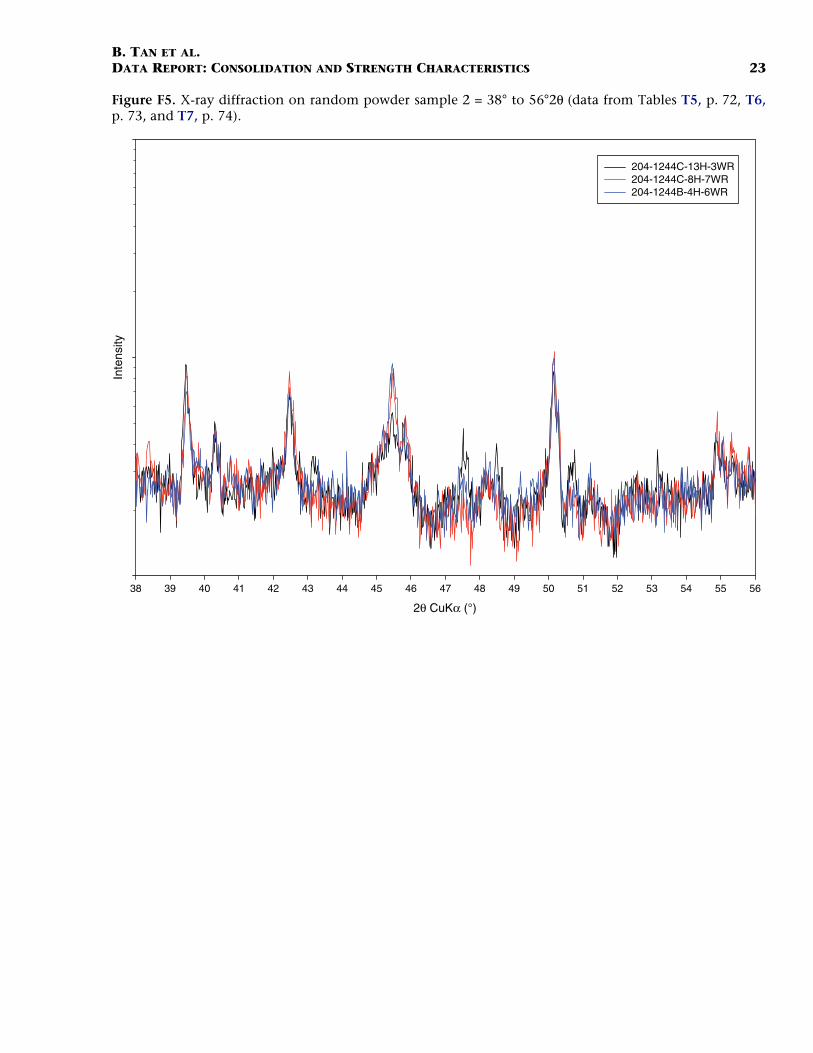
B. TAN ET AL.DATA REPORT: CONSOLIDATION AND STRENGTH CHARACTERISTICS 23
Figure F5. X-ray diffraction on random powder sample 2 = 38° to 56°2θ (data from Tables T5, p. 72, T6,p. 73, and T7, p. 74).
56555453525150494847464544434241403938
Inte
nsity
2θ CuKα (°)
204-1244C-13H-3WR204-1244C-8H-7WR204-1244B-4H-6WR
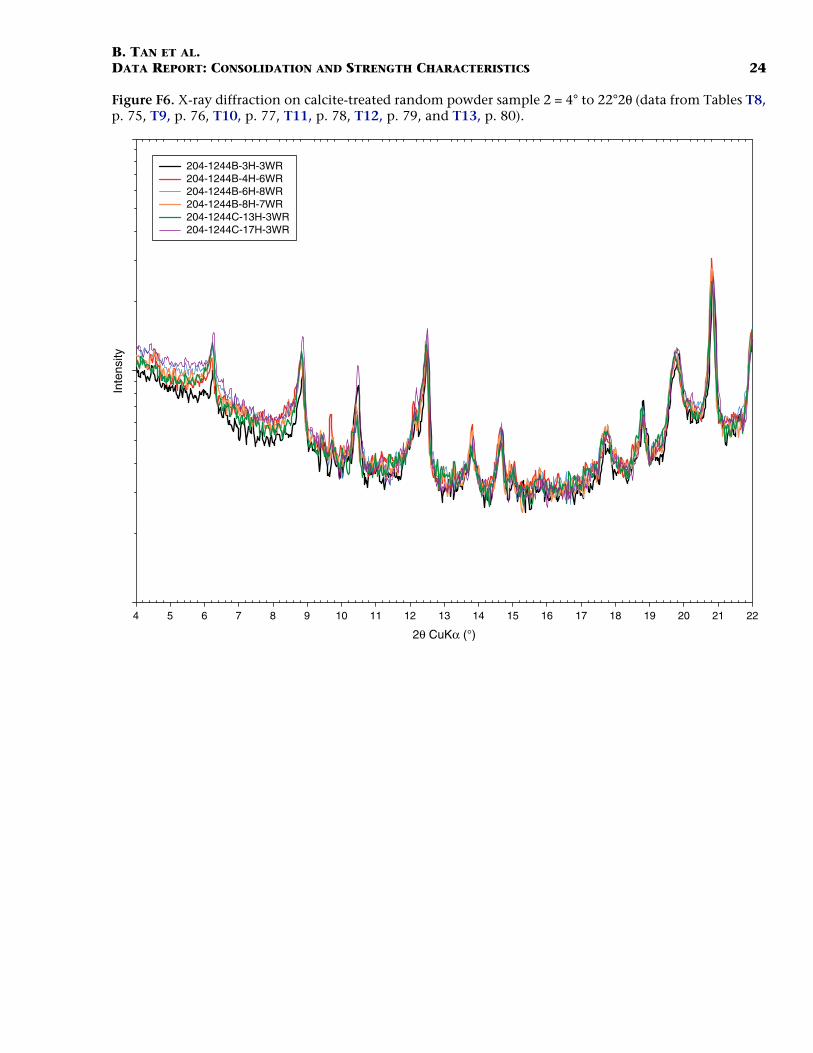
B. TAN ET AL.DATA REPORT: CONSOLIDATION AND STRENGTH CHARACTERISTICS 24
Figure F6. X-ray diffraction on calcite-treated random powder sample 2 = 4° to 22°2θ (data from Tables T8,p. 75, T9, p. 76, T10, p. 77, T11, p. 78, T12, p. 79, and T13, p. 80).
22212019181716151413121110987654
Inte
nsity
2θ CuKα (°)
204-1244B-3H-3WR204-1244B-4H-6WR204-1244B-6H-8WR204-1244B-8H-7WR204-1244C-13H-3WR204-1244C-17H-3WR

B. TAN ET AL.DATA REPORT: CONSOLIDATION AND STRENGTH CHARACTERISTICS 25
Figure F7. X-ray diffraction on calcite-treated random powder sample 2 = 21° to 39°2θ (data from TablesT8, p. 75, T9, p. 76, T10, p. 77, T11, p. 78, T12, p. 79, and T13, p. 80).
39383736353433323130292827262524232221
Inte
nsity
204-1244B-3H-3WR204-1244B-4H-6WR204-1244B-6H-8WR204-1244B-8H-7WR204-1244C-13H-3WR204-1244C-17H-3WR
2θ CuKα (°)

B. TAN ET AL.DATA REPORT: CONSOLIDATION AND STRENGTH CHARACTERISTICS 26
Figure F8. X-ray diffraction on calcite-treated random powder sample 2 = 38° to 56°2θ (data from TablesT8, p. 75, T9, p. 76, T10, p. 77, T11, p. 78, T12, p. 79, and T13, p. 80).
56555453525150494847464544434241403938
Inte
nsity
2θ CuKα (°)
204-1244B-3H-3WR204-1244B-4H-6WR204-1244B-6H-8WR204-1244B-8H-7WR204-1244C-13H-3WR204-1244C-17H-3WR

B. TAN ET AL.DATA REPORT: CONSOLIDATION AND STRENGTH CHARACTERISTICS 27
Figure F9. X-ray diffraction on clay-fraction random powder sample 2 = 4° to 22°2θ (data from Tables T14,p. 81, T15, p. 82, and T16, p. 83).
22212019181716151413121110987654
Inte
nsity
2θ CuKα (°)
204-1244B-3H-3WR204-1244B-4H-6WR204-1244B-6H-8WR

B. TAN ET AL.DATA REPORT: CONSOLIDATION AND STRENGTH CHARACTERISTICS 28
Figure F10. X-ray diffraction on clay-fraction random powder sample 2 = 21° to 39°2θ (data from TablesT14, p. 81, T15, p. 82, and T16, p. 83).
39383736353433323130292827262524232221
Inte
nsity
2θ CuKα (°)
204-1244B-3H-3WR204-1244B-4H-6WR204-1244B-6H-8WR

B. TAN ET AL.DATA REPORT: CONSOLIDATION AND STRENGTH CHARACTERISTICS 29
Figure F11. X-ray diffraction on clay-fraction random powder sample 2 = 38° to 56°2θ (data from TablesT14, p. 81, T15, p. 82, and T16, p. 83).
56555453525150494847464544434241403938
Inte
nsity
2θ CuKα (°)
204-1244B-3H-3WR204-1244B-4H-6WR204-1244B-6H-8WR

B. T
AN
ET A
L.D
AT
A R
EP
OR
T: CO
NSO
LID
AT
ION
AN
D S
TR
EN
GT
H C
HA
RA
CT
ER
ISTIC
S3
0
Figure Table T18, p. 85). Coef. = coefficient.
0
Ver
tical
str
ain,
ε (
%)
0
5
10
15
20
Tota
l wor
k
0.0
0.2
0.4
0.6
0.8
1.0
1.2
1.4
1E-7
rtical consolidation stress, σ'v (ksc)
Hydraulic conductivity, k (cm/s)
101
F12. CRS 491 consolidation data for Sample 204-1244C-13H-3, 144–147 cm (data from
101.1
Coe
f. of
con
solid
atio
n, C
v (c
m2 /
s)
0.000
0.002
0.004
0.006
0.008
0.010
0.012
0.014
Exc
ess
pore
pre
ssur
e, Δ
U/σ
' v
0.04
2520151050 1E-8V
oid
Rat
io, e
1.0
1.1
1.2
1.3
1.4
1.5
Voi
d R
atio
, e
1.0
1.1
1.2
1.3
1.4
1.5
Vertical consolidation stress, σ'v (ksc)
Vertical consolidation stress, σ'v (ksc)
Vertical consolidation stress, σ'v (ksc)
Vertical consolidation stress, σ'v (ksc)
Ve
0.02
0.00
-0.02
-0.041010.1
1010.1
0.1
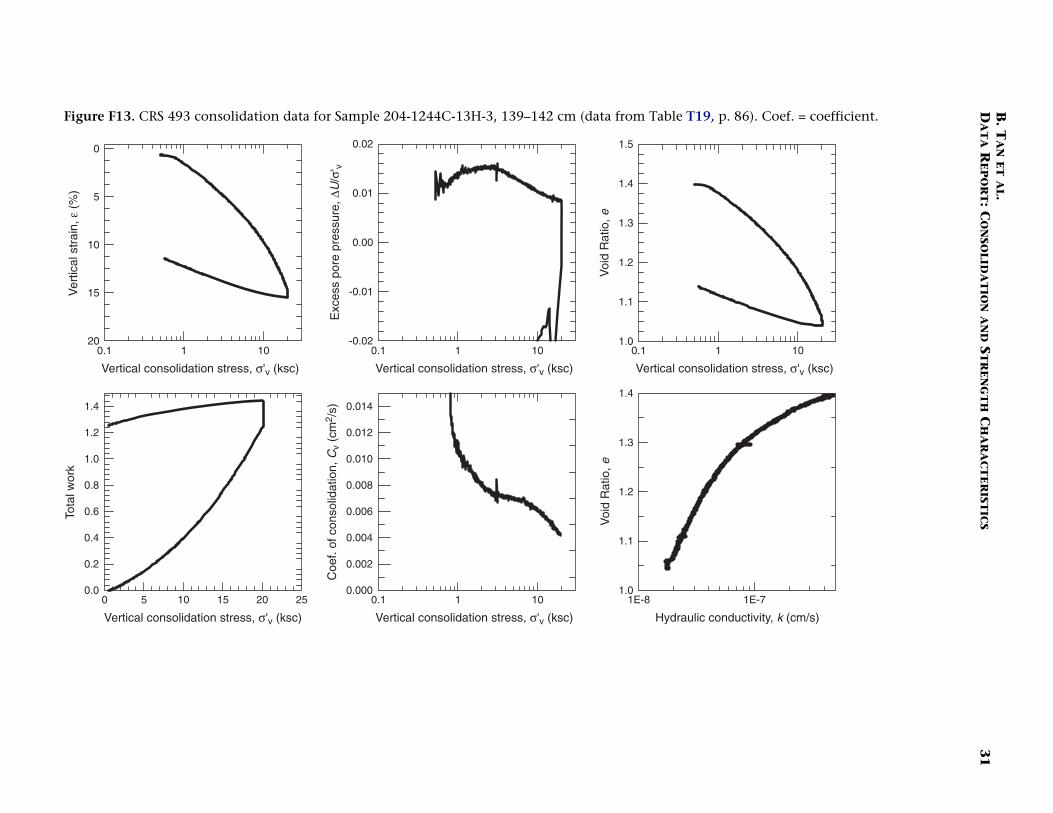
B. T
AN
ET A
L.D
AT
A R
EP
OR
T: CO
NSO
LID
AT
ION
AN
D S
TR
EN
GT
H C
HA
RA
CT
ER
ISTIC
S3
1
Figure Table T19, p. 86). Coef. = coefficient.
Ver
tical
str
ain,
ε (
%)
0
5
10
15
20
Tota
l wor
k
0.0
0.2
0.4
0.6
0.8
1.0
1.2
1.4
0 1011
ertical consolidation stress, σ'v (ksc)
Hydraulic conductivity, k (cm/s)
1E-7-8
F13. CRS 493 consolidation data for Sample 204-1244C-13H-3, 139–142 cm (data from
0.000
0.002
0.004
0.006
0.008
0.010
0.012
0.014
-0.02
-0.01
0.00
0.01
0.02
2520151050V
oid
Rat
io, e
1.0
1.1
1.2
1.3
1.4
Voi
d R
atio
, e
1.0
1.1
1.2
1.3
1.4
1.5
101.1
Vertical consolidation stress, σ'v (ksc)
1010.1
Vertical consolidation stress, σ'v (ksc)
0.
V
Exc
ess
pore
pre
ssur
e, Δ
U/σ
' v
Vertical consolidation stress, σ'v (ksc)
1010.1
Vertical consolidation stress, σ'v (ksc)
Coe
f. of
con
solid
atio
n, C
v (c
m2 /
s)
1E

B. T
AN
ET A
L.D
AT
A R
EP
OR
T: CO
NSO
LID
AT
ION
AN
D S
TR
EN
GT
H C
HA
RA
CT
ER
ISTIC
S3
2
Figure Table T20, p. 87). Coef. = coefficient.
0
5
10
15
20
0.0
0.5
1.0
1.5
2.0
1E-71E-8
1.010.1
Ver
tical
str
ain,
ε (
%)
Tota
l wor
k
Vertical consolidation stress, σ'v (ksc)
Hydraulic conductivity, k (cm/s)
F14. CRS 495 consolidation data for Sample 204-1244C-17H-3, 97–100 cm (data from
1.010.1
1.010.10.0000
0.0005
0.0010
0.0015
0.0020
0.0025
0.0030
0.0035
0.0040
1.010.1-0.2
-0.1
0.0
0.1
0.2
25201510500.9
1.0
1.1
1.2
1.3
1.4
0.9
1.0
1.1
1.2
1.3
1.4
Voi
d R
atio
, eV
oid
Rat
io, e
Vertical consolidation stress, σ'v (ksc) Vertical consolidation stress, σ'v (ksc)
Exc
ess
pore
pre
ssur
e, Δ
U/σ
' v
Vertical consolidation stress, σ'v (ksc) Vertical consolidation stress, σ'v (ksc)
Coe
f. of
con
solid
atio
n, C
v (c
m2 /
s)

B. T
AN
ET A
L.D
AT
A R
EP
OR
T: CO
NSO
LID
AT
ION
AN
D S
TR
EN
GT
H C
HA
RA
CT
ER
ISTIC
S3
3
Figure Table T21, p. 88). Coef. = coefficient.
0
5
10
15
20
0.0
0.1
0.2
0.3
0.4
0.5
0.6
0.7
1E-78
1.010.1
Ver
tical
str
ain,
ε (
%)
Tota
l wor
k
ertical consolidation stress, σ'v (ksc)
Hydraulic conductivity, k (cm/s)
F15. CRS 497 consolidation data for Sample 204-1244B-3H-3, 145–148 cm (data from
1.010.1
1.010.10.000
0.001
0.002
0.003
0.004
0.005
1.010.1-0.10
-0.05
0.00
0.05
0.10
86420 1E-1.1
1.2
1.3
1.4
1.5
1.6
1.1
1.2
1.3
1.4
1.5
1.6
Voi
d R
atio
, eV
oid
Rat
io, e
Vertical consolidation stress, σ'v (ksc) Vertical consolidation stress, σ'v (ksc) V
Exc
ess
pore
pre
ssur
e, Δ
U/σ
' v
Vertical consolidation stress, σ'v (ksc) Vertical consolidation stress, σ'v (ksc)
Coe
f. of
con
solid
atio
n, C
v (c
m2 /
s)

B. T
AN
ET A
L.D
AT
A R
EP
OR
T: CO
NSO
LID
AT
ION
AN
D S
TR
EN
GT
H C
HA
RA
CT
ER
ISTIC
S3
4
Figure . Coef. = coefficient.
0
0
10
20
30
40
50
0.0
0.2
0.4
0.6
0.8
1.0
1.2
1.4
1E-71E-8
1010.101
Ver
tical
str
ain,
ε (
%)
Tota
l wor
k
Vertical consolidation stress, σ'v (ksc)
Hydraulic conductivity, k (cm/s)
F16. CRS 499 consolidation data for resedimented sample (data from Table T22, p. 89)
1.010.1.01
1010.10.010.0000
0.0005
0.0010
0.0015
0.0020
0.0025
0.0030
1010.10.01-0.2
-0.1
0.0
0.1
0.2
25201510500.8
1.0
1.2
1.4
1.6
1.8
2.0
2.2
2.4
2.6
0.0.8
1.0
1.2
1.4
1.6
1.8
2.0
2.2
2.4
2.6
Voi
d R
atio
, eV
oid
Rat
io, e
Vertical consolidation stress, σ'v (ksc) Vertical consolidation stress, σ'v (ksc)
Exc
ess
pore
pre
ssur
e, Δ
U/σ
' v
Vertical consolidation stress, σ'v (ksc) Vertical consolidation stress, σ'v (ksc)
Coe
f. of
con
solid
atio
n, C
v (c
m2 /
s)

B. T
AN
ET A
L.D
AT
A R
EP
OR
T: CO
NSO
LID
AT
ION
AN
D S
TR
EN
GT
H C
HA
RA
CT
ER
ISTIC
S3
5
Figure ble T23, p. 90). Coef. = coefficient.
0
5
10
15
20
25
0.0
0.5
1.0
1.5
2.0
2.5
1E-7-8
1010.1
Ver
tical
str
ain,
ε (
%)
Tota
l wor
k
Vertical consolidation stress, σ'v (ksc)
Hydraulic conductivity, k (cm/s)
F17. CRS 504 consolidation data for Sample 204-1244C-8H-7, 71–74 cm (data from Ta
1010.1
1010.10.000
0.005
0.010
0.015
0.020
1010.1
-0.04
-0.02
0.00
0.02
0.04
2520151050 1E0.95
1.05
1.15
1.25
1.35
1.45
1.55
0.95
1.05
1.15
1.25
1.35
1.45
1.55
Voi
d R
atio
, eV
oid
Rat
io, e
Vertical consolidation stress, σ'v (ksc) Vertical consolidation stress, σ'v (ksc)
Exc
ess
pore
pre
ssur
e, Δ
U/σ
' v
Vertical consolidation stress, σ'v (ksc) Vertical consolidation stress, σ'v (ksc)
Coe
f. of
con
solid
atio
n, C
v (c
m2 /
s)

B. T
AN
ET A
L.D
AT
A R
EP
OR
T: CO
NSO
LID
AT
ION
AN
D S
TR
EN
GT
H C
HA
RA
CT
ER
ISTIC
S3
6
Figure able T24, p. 91). Coef. = coefficient.
0
5
10
15
20
25
30
0.0
0.5
1.0
1.5
2.0
1E-7
1010.1
Ver
tical
str
ain,
ε (
%)
Tota
l wor
k
rtical consolidation stress, σ'v (ksc)
Hydraulic conductivity, k (cm/s)
F18. CRS 508 consolidation data for Sample 204-1244B-4H-6, 120–125 cm (data from T
1010.1
1010.10.000
0.001
0.002
0.003
0.004
0.005
0.006
1010.1-0.10
-0.05
0.00
0.05
0.10
20151050 1E-80.9
1.0
1.1
1.2
1.3
1.4
1.5
1.6
1.7
0.9
1.0
1.1
1.2
1.3
1.4
1.5
1.6
1.7
Voi
d R
atio
, eV
oid
Rat
io, e
Vertical consolidation stress, σ'v (ksc) Vertical consolidation stress, σ'v (ksc) Ve
Exc
ess
pore
pre
ssur
e, Δ
U/σ
' v
Vertical consolidation stress, σ'v (ksc) Vertical consolidation stress, σ'v (ksc)
Coe
f. of
con
solid
atio
n, C
v (c
m2 /
s)

B. T
AN
ET A
L.D
AT
A R
EP
OR
T: CO
NSO
LID
AT
ION
AN
D S
TR
EN
GT
H C
HA
RA
CT
ER
ISTIC
S3
7
Figure data from Table T25, p. 92). Coef. = coefficient.
0
0
10
20
30
40
50
0.0
0.5
1.0
1.5
2.0
2.5
1E-61E-71E-8
1010.101
Ver
tical
str
ain,
ε (
%)
Tota
l wor
k
Vertical consolidation stress, σ'v (ksc)
Hydraulic conductivity, k (cm/s)
F19. CRS 511 consolidation data for resedimented Sample 204-1244B-6H-8, 24–29 cm (
1010.1.01
1010.10.010.0000
0.0005
0.0010
0.0015
0.0020
0.0025
0.0030
1010.10.01-0.2
-0.1
0.0
0.1
0.2
2520151050
1.0
1.5
2.0
2.5
3.0
0.
1.0
1.5
2.0
2.5
3.0
Voi
d R
atio
, eV
oid
Rat
io, e
Vertical consolidation stress, σ'v (ksc) Vertical consolidation stress, σ'v (ksc)
Exc
ess
pore
pre
ssur
e, Δ
U/σ
' v
Vertical consolidation stress, σ'v (ksc) Vertical consolidation stress, σ'v (ksc)
Coe
f. of
con
solid
atio
n, C
v (c
m2 /
s)

B. T
AN
ET A
L.D
AT
A R
EP
OR
T: CO
NSO
LID
AT
ION
AN
D S
TR
EN
GT
H C
HA
RA
CT
ER
ISTIC
S3
8
Figure able T26, p. 93). Coef. = coefficient.
0
0
10
20
30
40
00
1
2
3
4
5
1E-71E-8
100101
Ver
tical
str
ain,
ε (
%)
Tota
l wor
k
tical consolidation stress, σ'v (ksc)
Hydraulic conductivity, k (cm/s)
F20. CRS 563 consolidation data for Sample 204-1244B-4H-6, 134–137 cm (data from T
100101.1
1001010.10.000
0.001
0.002
0.003
0.004
0.005
1001010.1-0.04
-0.02
0.00
0.02
0.04
40302010 1E-90.7
0.8
0.9
1.0
1.1
1.2
1.3
1.4
1.5
1.6
1.7
1.8
0.10.7
0.8
0.9
1.0
1.1
1.2
1.3
1.4
1.5
1.6
1.7
1.8
Voi
d R
atio
, eV
oid
Rat
io, e
Vertical consolidation stress, σ'v (ksc) Vertical consolidation stress, σ'v (ksc) Ver
Exc
ess
pore
pre
ssur
e, Δ
U/σ
' v
Vertical consolidation stress, σ'v (ksc) Vertical consolidation stress, σ'v (ksc)
Coe
f. of
con
solid
atio
n, C
v (c
m2 /
s)

B. T
AN
ET A
L.D
AT
A R
EP
OR
T: CO
NSO
LID
AT
ION
AN
D S
TR
EN
GT
H C
HA
RA
CT
ER
ISTIC
S3
9
Figure ble T27, p. 94). Coef. = coefficient.
0
0
5
10
15
20
25
30
00
1
2
3
4
5
6
7
8
1E-71E-81E-9
100101
Ver
tical
str
ain,
ε (
%)
Tota
l wor
k
ertical consolidation stress, σ'v (ksc)
Hydraulic conductivity, k (cm/s)
F21. CRS 564 consolidation data for Sample 204-1244C-17H-3, 88–91 cm (data from Ta
100101.1
1001010.10.0000
0.0005
0.0010
0.0015
0.0020
1001010.1-0.10
-0.05
0.00
0.05
0.10
806040200.5
0.6
0.7
0.8
0.9
1.0
1.1
1.2
1.3
0.10.5
0.6
0.7
0.8
0.9
1.0
1.1
1.2
1.3
Voi
d R
atio
, eV
oid
Rat
io, e
Vertical consolidation stress, σ'v (ksc) Vertical consolidation stress, σ'v (ksc) V
Exc
ess
pore
pre
ssur
e, Δ
U/σ
' v
Vertical consolidation stress, σ'v (ksc) Vertical consolidation stress, σ'v (ksc)
Coe
f. of
con
solid
atio
n, C
v (c
m2 /
s)

B. T
AN
ET A
L.D
AT
A R
EP
OR
T: CO
NSO
LID
AT
ION
AN
D S
TR
EN
GT
H C
HA
RA
CT
ER
ISTIC
S4
0
Figure Table T28, p. 95). Coef. = coefficient.
0
0
5
10
15
20
25
30
00
1
2
3
4
5
6
7
8
1E-71E-8
100101
Ver
tical
str
ain,
ε (
%)
Tota
l wor
k
rtical consolidation stress, σ'v (ksc)
Hydraulic conductivity, k (cm/s)
F22. CRS 567 consolidation data for Sample 204-1244C-13H-3, 120–123 cm (data from
100101.1
1001010.10.000
0.001
0.002
0.003
0.004
0.005
0.006
1001010.1-0.02
-0.01
0.00
0.01
0.02
604020 1E-90.65
0.75
0.85
0.95
1.05
1.15
1.25
1.35
0.10.65
0.75
0.85
0.95
1.05
1.15
1.25
1.35
Voi
d R
atio
, eV
oid
Rat
io, e
Vertical consolidation stress, σ'v (ksc) Vertical consolidation stress, σ'v (ksc) Ve
Exc
ess
pore
pre
ssur
e, Δ
U/σ
' v
Vertical consolidation stress, σ'v (ksc) Vertical consolidation stress, σ'v (ksc)
Coe
f. of
con
solid
atio
n, C
v (c
m2 /
s)

B. T
AN
ET A
L.D
AT
A R
EP
OR
T: CO
NSO
LID
AT
ION
AN
D S
TR
EN
GT
H C
HA
RA
CT
ER
ISTIC
S4
1
Figure able T29, p. 96). Coef. = coefficient.
0
0
10
20
30
0
2
4
6
8
10
100101
Ver
tical
str
ain,
ε (
%)
Tota
l wor
k
ertical consolidation stress, σ'v (ksc)
Hydraulic conductivity, k (cm/s)
0 1E-71E-89
F23. CRS 569 consolidation data for Sample 204-1244C-9H-5, 105–108 cm (data from T
100101.1
0.000
0.002
0.004
0.006
0.008
0.010
1001010.1-0.02
-0.01
0.00
0.01
0.02
0.65
0.75
0.85
0.95
1.05
1.15
1.25
1.35
1.45
1.55
0.10.65
0.75
0.85
0.95
1.05
1.15
1.25
1.35
1.45
1.55
Voi
d R
atio
, eV
oid
Rat
io, e
Vertical consolidation stress, σ'v (ksc) Vertical consolidation stress, σ'v (ksc) V
Exc
ess
pore
pre
ssur
e, Δ
U/σ
' v
Vertical consolidation stress, σ'v (ksc) Vertical consolidation stress, σ'v (ksc)
Coe
f. of
con
solid
atio
n, C
v (c
m2 /
s)
1001010.180604020 1E-

B. T
AN
ET A
L.D
AT
A R
EP
OR
T: CO
NSO
LID
AT
ION
AN
D S
TR
EN
GT
H C
HA
RA
CT
ER
ISTIC
S4
2
Figure ef. = coefficient.
0
5
10
15
20
25
0.0
0.5
1.0
1.5
2.0
1E-71E-8E-9
1010.1
Ver
tical
str
ain,
ε (
%)
Tota
l wor
k
Vertical consolidation stress, σ'v (ksc)
Hydraulic conductivity, k (cm/s)
F24. CRS 577 consolidation data for remolded sample (data from Table T30, p. 97). Co
1010.1
1010.10.0000
0.0005
0.0010
0.0015
0.0020
0.0025
0.0030
0.0035
0.0040
1010.1-0.4
-0.2
0.0
0.2
0.4
2520151050 10.75
0.85
0.95
1.05
1.15
1.25
1.35
0.75
0.85
0.95
1.05
1.15
1.25
1.35
Voi
d R
atio
, eV
oid
Rat
io, e
Vertical consolidation stress, σ'v (ksc) Vertical consolidation stress, σ'v (ksc)
Exc
ess
pore
pre
ssur
e, Δ
U/σ
' v
Vertical consolidation stress, σ'v (ksc) Vertical consolidation stress, σ'v (ksc)
Coe
f. of
con
solid
atio
n, C
v (c
m2 /
s)
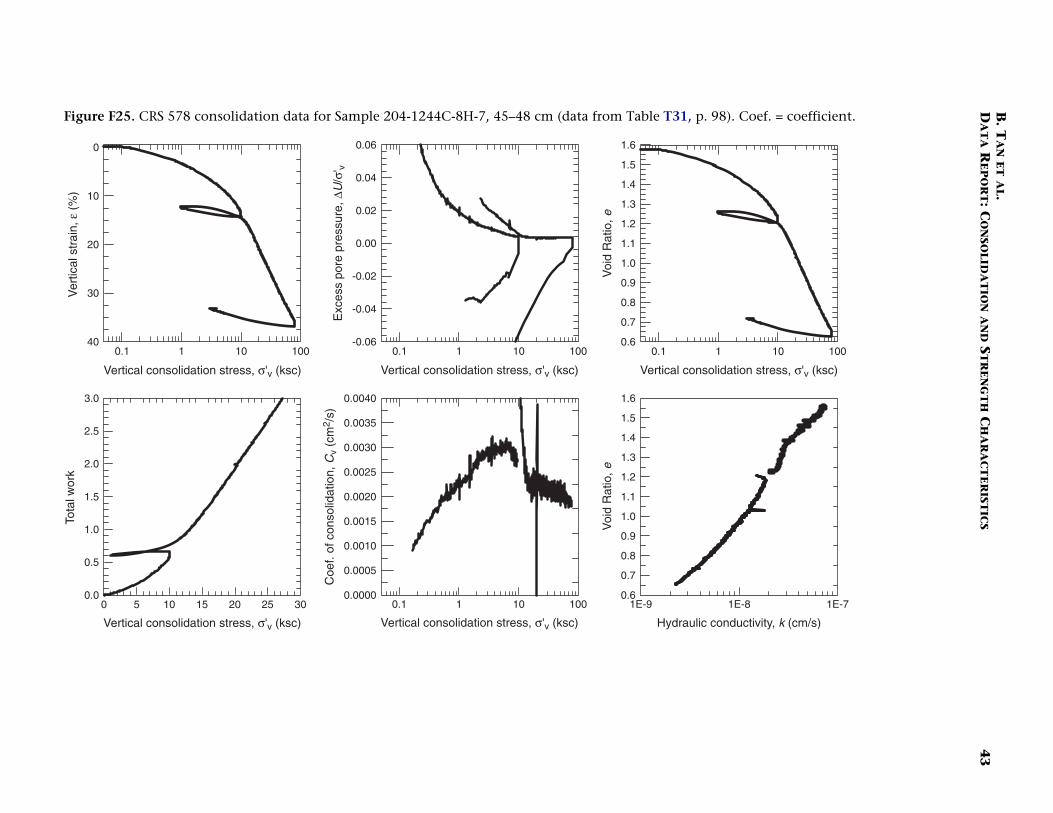
B. T
AN
ET A
L.D
AT
A R
EP
OR
T: CO
NSO
LID
AT
ION
AN
D S
TR
EN
GT
H C
HA
RA
CT
ER
ISTIC
S4
3
Figure le T31, p. 98). Coef. = coefficient.
0
10
20
30
40
0.0
0.5
1.0
1.5
2.0
2.5
3.0
1E-71E-8-9
1001010.1
Ver
tical
str
ain,
ε (
%)
Tota
l wor
k
ertical consolidation stress, σ'v (ksc)
Hydraulic conductivity, k (cm/s)
F25. CRS 578 consolidation data for Sample 204-1244C-8H-7, 45–48 cm (data from Tab
1001010.1
1001010.10.0000
0.0005
0.0010
0.0015
0.0020
0.0025
0.0030
0.0035
0.0040
1001010.1-0.06
-0.04
-0.02
0.00
0.02
0.04
0.06
302520151050 1E0.6
0.7
0.8
0.9
1.0
1.1
1.2
1.3
1.4
1.5
1.6
0.6
0.7
0.8
0.9
1.0
1.1
1.2
1.3
1.4
1.5
1.6
Voi
d R
atio
, eV
oid
Rat
io, e
Vertical consolidation stress, σ'v (ksc) Vertical consolidation stress, σ'v (ksc) V
Exc
ess
pore
pre
ssur
e, Δ
U/σ
' v
Vertical consolidation stress, σ'v (ksc) Vertical consolidation stress, σ'v (ksc)
Coe
f. of
con
solid
atio
n, C
v (c
m2 /
s)

B. T
AN
ET A
L.D
AT
A R
EP
OR
T: CO
NSO
LID
AT
ION
AN
D S
TR
EN
GT
H C
HA
RA
CT
ER
ISTIC
S4
4
Figure able T32, p. 99). Coef. = coefficient.
0
0
10
20
30
40
0.0
0.5
1.0
1.5
2.0
1E-71E-8-9
1001011
Ver
tical
str
ain,
ε (
%)
Tota
l wor
k
ertical consolidation stress, σ'v (ksc)
Hydraulic conductivity, k (cm/s)
F26. CRS 580 consolidation data for Sample 204-1244B-1H-4, 125–128 cm (data from T
100101.1
1001010.10.0000
0.0005
0.0010
0.0015
0.0020
0.0025
0.0030
0.0035
0.0040
1001010.1-0.04
-0.02
0.00
0.02
0.04
20151050 1E0.5
0.6
0.7
0.8
0.9
1.0
1.1
1.2
1.3
1.4
1.5
1.6
0.0.5
0.6
0.7
0.8
0.9
1.0
1.1
1.2
1.3
1.4
1.5
1.6
Voi
d R
atio
, eV
oid
Rat
io, e
Vertical consolidation stress, σ'v (ksc) Vertical consolidation stress, σ'v (ksc) V
Exc
ess
pore
pre
ssur
e, Δ
U/σ
' v
Vertical consolidation stress, σ'v (ksc) Vertical consolidation stress, σ'v (ksc)
Coe
f. of
con
solid
atio
n, C
v (c
m2 /
s)

B. T
AN
ET A
L.D
AT
A R
EP
OR
T: CO
NSO
LID
AT
ION
AN
D S
TR
EN
GT
H C
HA
RA
CT
ER
ISTIC
S4
5
Figure T33, p. 100). Coef. = coefficient.
0
0
10
20
30
40
0.0
0.5
1.0
1.5
2.0
1E-71E-89
1001011
Ver
tical
str
ain,
ε (
%)
Tota
l wor
k
ertical consolidation stress, σ'v (ksc)
Hydraulic conductivity, k (cm/s)
F27. CRS 584 consolidation data for Sample 204-1244B-6H-8, 6–9 cm (data from Table
100101.1
1001010.10.0000
0.0005
0.0010
0.0015
0.0020
0.0025
0.0030
0.0035
0.0040
1001010.1-0.04
-0.02
0.00
0.02
0.04
20151050 1E0.6
0.7
0.8
0.9
1.0
1.1
1.2
1.3
1.4
1.5
1.6
1.7
0.0.6
0.7
0.8
0.9
1.0
1.1
1.2
1.3
1.4
1.5
1.6
1.7
Voi
d R
atio
, eV
oid
Rat
io, e
Vertical consolidation stress, σ'v (ksc) Vertical consolidation stress, σ'v (ksc) V
Exc
ess
pore
pre
ssur
e, Δ
U/σ
' v
Vertical consolidation stress, σ'v (ksc) Vertical consolidation stress, σ'v (ksc)
Coe
f. of
con
solid
atio
n, C
v (c
m2 /
s)

B. T
AN
ET A
L.D
AT
A R
EP
OR
T: CO
NSO
LID
AT
ION
AN
D S
TR
EN
GT
H C
HA
RA
CT
ER
ISTIC
S4
6
Figure Table T34, p. 101). Coef. = coefficient.
0
0
10
20
30
0.0
0.5
1.0
1.5
2.0
1E-71E-8
100101
Ver
tical
str
ain,
ε (
%)
Tota
l wor
k
rtical consolidation stress, σ'v (ksc)
Hydraulic conductivity, k (cm/s)
F28. CRS 585 consolidation data for Sample 204-1244B-3H-3, 120–123 cm (data from
100101.1
1001010.10.000
0.001
0.002
0.003
0.004
0.005
0.006
1001010.1-0.04
-0.02
0.00
0.02
0.04
20151050 1E-90.5
0.6
0.7
0.8
0.9
1.0
1.1
1.2
1.3
1.4
1.5
0.10.5
0.6
0.7
0.8
0.9
1.0
1.1
1.2
1.3
1.4
1.5
Voi
d R
atio
, eV
oid
Rat
io, e
Vertical consolidation stress, σ'v (ksc) Vertical consolidation stress, σ'v (ksc) Ve
Exc
ess
pore
pre
ssur
e, Δ
U/σ
' v
Vertical consolidation stress, σ'v (ksc) Vertical consolidation stress, σ'v (ksc)
Coe
f. of
con
solid
atio
n, C
v (c
m2 /
s)

B. T
AN
ET A
L.D
AT
A R
EP
OR
T: CO
NSO
LID
AT
ION
AN
D S
TR
EN
GT
H C
HA
RA
CT
ER
ISTIC
S4
7
Figure able T35, p. 102). Coef. = coefficient.
0
0
10
20
30
40
00
2
4
6
8
10
1E-71E-8
100101
Ver
tical
str
ain,
ε (
%)
Tota
l wor
k
ertical consolidation stress, σ'v (ksc)
Hydraulic conductivity, k (cm/s)
F29. CRS 608 consolidation data for Sample 204-1244B-1H-4, 126–129 cm (data from T
100101.1
0.0000
0.0005
0.0010
0.0015
0.0020
0.0025
0.0030
0.0035
0.0040
-0.04
-0.02
0.00
0.02
0.04
80604020 1E-90.5
0.6
0.7
0.8
0.9
1.0
1.1
1.2
1.3
1.4
1.5
0.5
0.6
0.7
0.8
0.9
1.0
1.1
1.2
1.3
1.4
1.5
1001010.1 0.1
1001010.1V
oid
Rat
io, e
Voi
d R
atio
, e
Vertical consolidation stress, σ'v (ksc) Vertical consolidation stress, σ'v (ksc) V
Exc
ess
pore
pre
ssur
e, Δ
U/σ
' v
Vertical consolidation stress, σ'v (ksc) Vertical consolidation stress, σ'v (ksc)
Coe
f. of
con
solid
atio
n, C
v (c
m2 /
s)
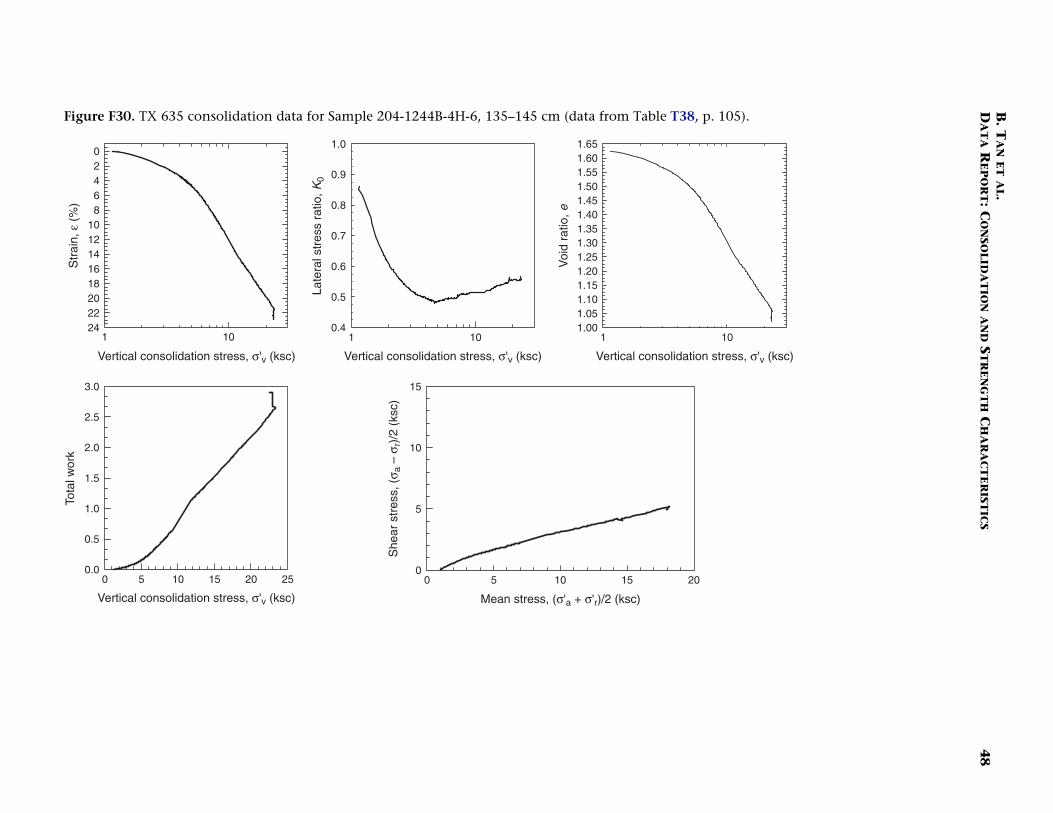
B. T
AN
ET A
L.D
AT
A R
EP
OR
T: CO
NSO
LID
AT
ION
AN
D S
TR
EN
GT
H C
HA
RA
CT
ER
ISTIC
S4
8
Figure Table T38, p. 105).
Str
ain,
ε (
%)
02468
1012141618202224
Tota
l wor
k
0.0
0.5
1.0
1.5
2.0
2.5
3.0
2015
10
V ical consolidation stress, σ'v (ksc)
V ksc)
F30. TX 635 consolidation data for Sample 204-1244B-4H-6, 135–145 cm (data from
101
2520151050
101
Late
ral s
tres
s ra
tio, K
00.4
0.5
0.6
0.7
0.8
0.9
1.0
10500
5
10
15
1
Voi
d ra
tio, e
1.001.051.101.151.201.251.301.351.401.451.501.551.601.65
ertical consolidation stress, σ'v (ksc) Vertical consolidation stress, σ'v (ksc) Vert
ertical consolidation stress, σ'v (ksc) Mean stress, (σ'a + σ'r)/2 (
She
ar s
tres
s, (
σ a –
σr)
/2 (
ksc)

B. T
AN
ET A
L.D
AT
A R
EP
OR
T: CO
NSO
LID
AT
ION
AN
D S
TR
EN
GT
H C
HA
RA
CT
ER
ISTIC
S4
9
Figure rom Table T39, p. 106).
0.20
0.22
0.24
0.26
0.28
0.30
0.32
-0.1
0.0
0.1
0.2
0.3
0.4
1.00.8
1010.10.01
Nor
mal
ized
she
ar s
tres
s, q
/σ' v
c
Axial strain, εa (%)
Nor
mal
ized
por
e pr
essu
re, Δ
U/σ
' vc
p'/σ'vc
F31. TX 635 undrained shearing data for Sample 204-1244B-4H-6, 135–145 cm (data f
86420
86420
86420
Inte
rnal
fric
tion
angl
e, φ
(°)
15
20
25
30
35
0.60.40.20.00.0
0.2
0.4
0.6
0.0011
10
100
1000
Axial strain, εa (%) Axial strain, εa (%)
Axial strain, εa (%)
Nor
mal
ized
she
ar s
tres
s, q
/σ' v
c
Normalized mean stress,
Nor
mal
ized
und
rain
ed m
odul
us, E
u/σ'
vc
Excess: ue/σ'vcShear induced: us/σ'vc

B. T
AN
ET A
L.D
AT
A R
EP
OR
T: CO
NSO
LID
AT
ION
AN
D S
TR
EN
GT
H C
HA
RA
CT
ER
ISTIC
S5
0
Figure ble T40, p. 107).
1
0
2
46
810
1214
1618
2022
24
00
1
2
3
4
4030
10
Str
ain,
ε (
%)
Tota
l wor
k
V al consolidation stress, σ'v (ksc)
V ksc)
F32. TX 636 consolidation data for Sample 204-1244C-17H-3, 80–90 cm (data from Ta
10
40302010
1010.4
0.5
0.6
0.7
0.8
0.9
1.0
201000
10
20
30
10.60
0.65
0.70
0.75
0.80
0.85
0.90
0.95
1.00
1.05
1.10
1.15
1.20
Late
ral s
tres
s ra
tio, K
0
Voi
d ra
tio, e
ertical consolidation stress, σ'v (ksc) Vertical consolidation stress, σ'v (ksc) Vertic
ertical consolidation stress, σ'v (ksc) Mean stress, (σ'a + σ'r)/2 (
She
ar s
tres
s, (
σ a –
σr)
/2 (
ksc)

B. T
AN
ET A
L.D
AT
A R
EP
OR
T: CO
NSO
LID
AT
ION
AN
D S
TR
EN
GT
H C
HA
RA
CT
ER
ISTIC
S5
1
Figure m Table T41, p. 108).
0.20
0.22
0.24
0.26
0.28
0.30
-0.1
0.0
0.1
0.2
0.3
0.4
1.00.8
1010.10.01
Nor
mal
ized
she
ar s
tres
s, q
/σ' v
c
Axial strain, εa (%)
Nor
mal
ized
por
e pr
essu
re, Δ
U/σ
' vc
, p'/σ'vc
F33. TX 636 undrained shearing data for Sample 204-1244C-17H-3, 80–90 cm (data fro
86420
86420
8642015
20
25
30
0.60.40.20.00.0
0.2
0.4
0.6
0.0011
10
100
1000
Inte
rnal
fric
tion
angl
e, φ
(°)
Axial strain, εa (%) Axial strain, εa (%)
Axial strain, εa (%)
Nor
mal
ized
she
ar s
tres
s, q
/σ' v
c
Normalized mean stress
Nor
mal
ized
und
rain
ed m
odul
us, E
u/σ'
vc
Excess: ue/σ'vcShear induced: us/σ'vc

B. T
AN
ET A
L.D
AT
A R
EP
OR
T: CO
NSO
LID
AT
ION
AN
D S
TR
EN
GT
H C
HA
RA
CT
ER
ISTIC
S5
2
Figure
0
0
2
4
6
8
10
12
0.0
0.1
0.2
0.3
0.4
0.5
108
101
Str
ain,
ε (
%)
Tota
l wor
k
tical consolidation stress, σ'v (ksc)
ksc)
F34. TX 641 consolidation data for remolded sample (data from Table T42, p. 109).
101.1
1086420
1010.10.4
0.5
0.6
0.7
0.8
0.9
1.0
64200
2
4
6
0.10.70
0.75
0.80
0.85
0.90
0.95
Late
ral s
tres
s ra
tio, K
0
Voi
d ra
tio, e
Vertical consolidation stress, σ'v (ksc) Vertical consolidation stress, σ'v (ksc) Ver
Vertical consolidation stress, σ'v (ksc) Mean stress, (σ'a + σ'r)/2 (
She
ar s
tres
s, (
σ a –
σr)
/2 (
ksc)

B. T
AN
ET A
L.D
AT
A R
EP
OR
T: CO
NSO
LID
AT
ION
AN
D S
TR
EN
GT
H C
HA
RA
CT
ER
ISTIC
S5
3
Figure 0).
0.20
0.25
0.30
0.35
0.40
0.45
0.50
-0.1
0.0
0.1
0.2
0.3
0.4
1.00.8
1010.10.011
Nor
mal
ized
she
ar s
tres
s, q
/σ' v
c
Axial strain, εa (%)
Nor
mal
ized
por
e pr
essu
re, Δ
U/σ
' vc
, p'/σ'vc
F35. TX 641 undrained shearing data for remolded sample (data from Table T43, p. 11
86420
86420
8642015
20
25
30
35
0.60.40.20.00.0
0.2
0.4
0.6
0.001
10
100
1000
Inte
rnal
fric
tion
angl
e, φ
(°)
Axial strain, εa (%) Axial strain, εa (%)
Axial strain, εa (%)
Nor
mal
ized
she
ar s
tres
s, q
/σ' v
c
Normalized mean stress
Nor
mal
ized
und
rain
ed m
odul
us, E
u/σ'
vc
Excess: ue/σ'vcShear induced: us/σ'vc
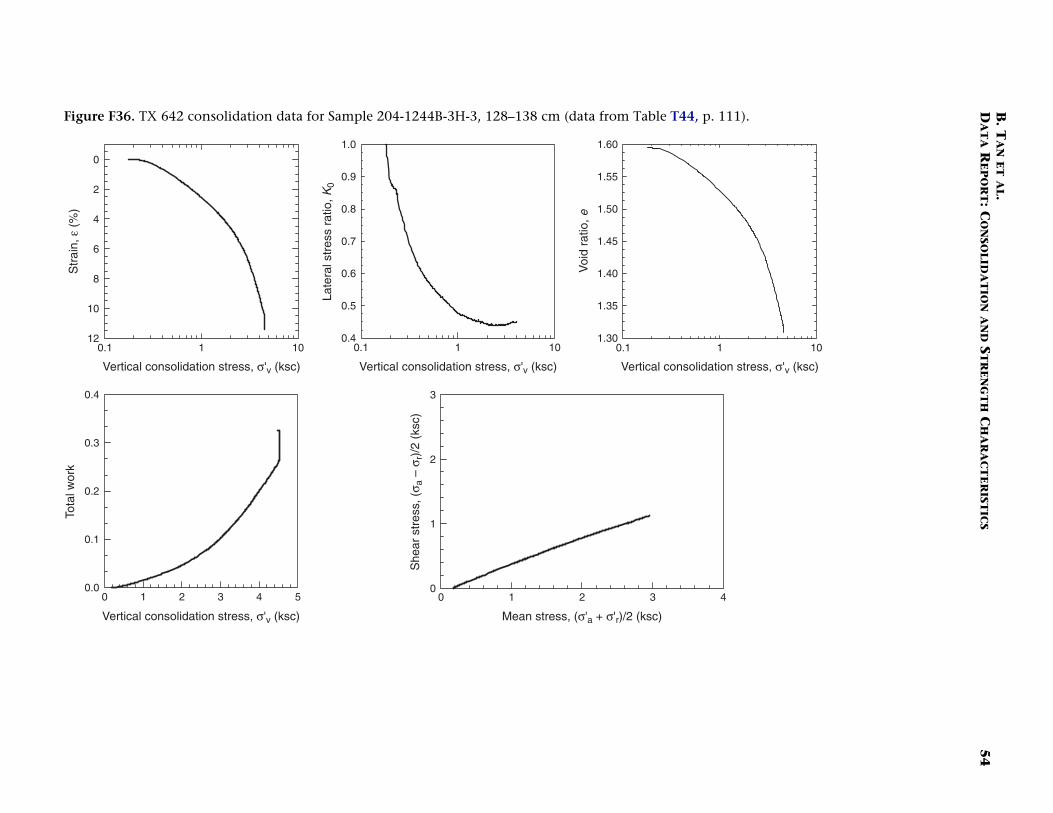
B. T
AN
ET A
L.D
AT
A R
EP
OR
T: CO
NSO
LID
AT
ION
AN
D S
TR
EN
GT
H C
HA
RA
CT
ER
ISTIC
S5
4
Figure able T44, p. 111).
0
0
2
4
6
8
10
12
0.0
0.1
0.2
0.3
0.4
43
101
Str
ain,
ε (
%)
Tota
l wor
k
tical consolidation stress, σ'v (ksc)
ksc)
F36. TX 642 consolidation data for Sample 204-1244B-3H-3, 128–138 cm (data from T
101.1
543210
1010.10.4
0.5
0.6
0.7
0.8
0.9
1.0
2100
1
2
3
0.11.30
1.35
1.40
1.45
1.50
1.55
1.60
Late
ral s
tres
s ra
tio, K
0
Voi
d ra
tio, e
Vertical consolidation stress, σ'v (ksc) Vertical consolidation stress, σ'v (ksc) Ver
Vertical consolidation stress, σ'v (ksc) Mean stress, (σ'a + σ'r)/2 (
She
ar s
tres
s, (
σ a –
σr)
/2 (
ksc)

B. T
AN
ET A
L.D
AT
A R
EP
OR
T: CO
NSO
LID
AT
ION
AN
D S
TR
EN
GT
H C
HA
RA
CT
ER
ISTIC
S5
5
Figure om Table T45, p. 112).
0.26
0.28
0.30
0.32
0.34
0.36
-0.1
0.0
0.1
0.2
0.3
0.4
1.00.8
1010.10.01
Nor
mal
ized
she
ar s
tres
s, q
/σ' v
c
Axial strain, εa (%)
Nor
mal
ized
por
e pr
essu
re, Δ
U/σ
' vc
p'/σ'vc
F37. TX 642 undrained shearing data for Sample 204-1244B-3H-3, 128–138 cm (data fr
86420
86420
8642020
25
30
35
40
0.60.40.20.00.0
0.2
0.4
0.6
0.0011
10
100
1000
Inte
rnal
fric
tion
angl
e, φ
(°)
Axial strain, εa (%) Axial strain, εa (%)
Axial strain, εa (%)
Nor
mal
ized
she
ar s
tres
s, q
/σ' v
c
Normalized mean stress,
Nor
mal
ized
und
rain
ed m
odul
us, E
u/σ'
vc
Excess: ue/σ'vcShear induced: us/σ'vc

B. T
AN
ET A
L.D
AT
A R
EP
OR
T: CO
NSO
LID
AT
ION
AN
D S
TR
EN
GT
H C
HA
RA
CT
ER
ISTIC
S5
6
Figure Table T46, p. 113).
0
2
4
6
8
10
12
0.00
0.05
0.10
0.15
0.20
43
101
Str
ain,
ε (
%)
Tota
l wor
k
tical consolidation stress, σ'v (ksc)
(ksc)
F38. TX 643 consolidation data for Sample 204-1244B-1H-4, 138–148 cm (data from
1010.1
43210
1010.10.4
0.5
0.6
0.7
0.8
0.9
1.0
2100
1
2
3
0.11.20
1.25
1.30
1.35
1.40
1.45
1.50
Late
ral s
tres
s ra
tio, K
0
Voi
d ra
tio, e
Vertical consolidation stress, σ'v (ksc) Vertical consolidation stress, σ'v (ksc) Ver
Vertical consolidation stress, σ'v (ksc) Mean stress, (σ'a + σ'r)/2
She
ar s
tres
s, (
σ a –
σr)
/2 (
ksc)
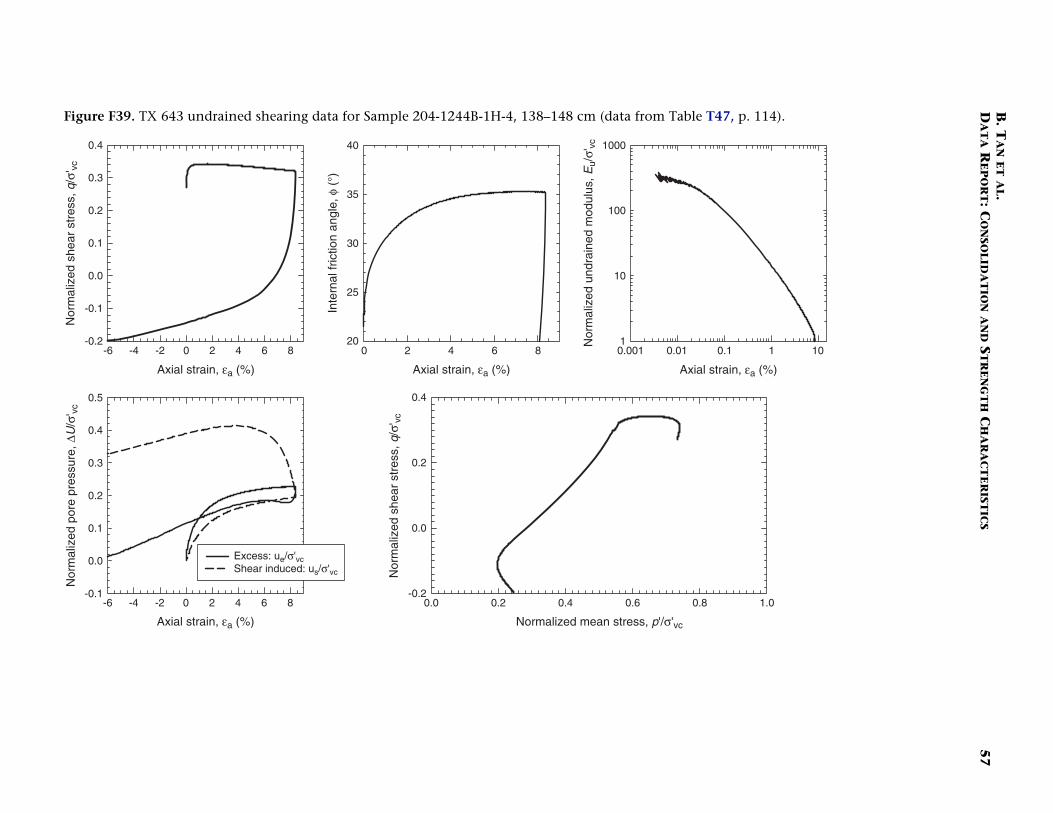
B. T
AN
ET A
L.D
AT
A R
EP
OR
T: CO
NSO
LID
AT
ION
AN
D S
TR
EN
GT
H C
HA
RA
CT
ER
ISTIC
S5
7
Figure rom Table T47, p. 114).
-0.2
-0.1
0.0
0.1
0.2
0.3
0.4
-0.1
0.0
0.1
0.2
0.3
0.4
0.5
1.00.8
1010.10.01
Nor
mal
ized
she
ar s
tres
s, q
/σ' v
c
Axial strain, εa (%)
Nor
mal
ized
por
e pr
essu
re, Δ
U/σ
' vc
s, p'/σ'vc
F39. TX 643 undrained shearing data for Sample 204-1244B-1H-4, 138–148 cm (data f
86420-2-4-6 8642020
25
30
35
40
0.60.40.20.0-0.2
0.0
0.2
0.4
0.0011
10
100
1000
86420-2-4-6
Inte
rnal
fric
tion
angl
e, φ
(°)
Axial strain, εa (%) Axial strain, εa (%)
Axial strain, εa (%)
Nor
mal
ized
she
ar s
tres
s, q
/σ' v
c
Normalized mean stres
Nor
mal
ized
und
rain
ed m
odul
us, E
u/σ'
vc
Excess: ue/σ'vcShear induced: us/σ'vc
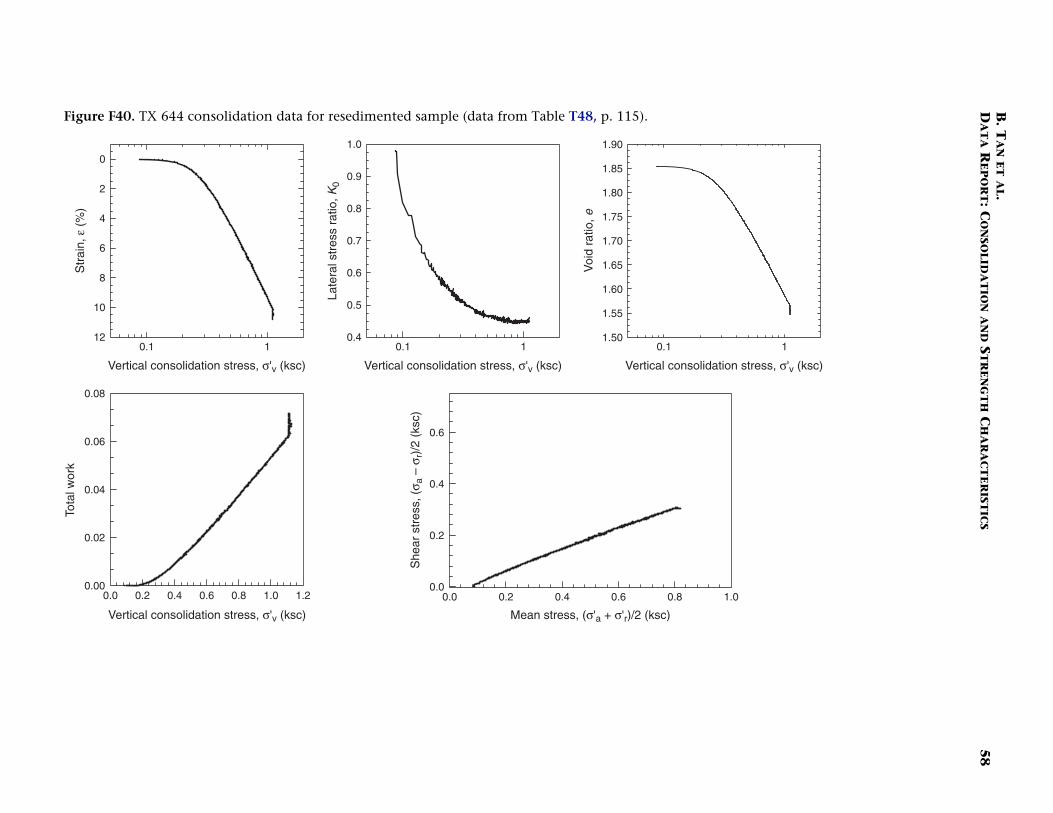
B. T
AN
ET A
L.D
AT
A R
EP
OR
T: CO
NSO
LID
AT
ION
AN
D S
TR
EN
GT
H C
HA
RA
CT
ER
ISTIC
S5
8
Figure ).
0
2
4
6
8
10
12
0.00
0.02
0.04
0.06
0.08
1.00.8
10.1
Str
ain,
ε (
%)
Tota
l wor
k
rtical consolidation stress, σ'v (ksc)
2 (ksc)
F40. TX 644 consolidation data for resedimented sample (data from Table T48, p. 115
10.1
1.21.00.80.60.40.20.0
10.10.4
0.5
0.6
0.7
0.8
0.9
1.0
0.60.40.20.00.0
0.2
0.4
0.6
1.50
1.55
1.60
1.65
1.70
1.75
1.80
1.85
1.90
Late
ral s
tres
s ra
tio, K
0
Voi
d ra
tio, e
Vertical consolidation stress, σ'v (ksc) Vertical consolidation stress, σ'v (ksc) Ve
Vertical consolidation stress, σ'v (ksc) Mean stress, (σ'a + σ'r)/
She
ar s
tres
s, (
σ a –
σr)
/2 (
ksc)
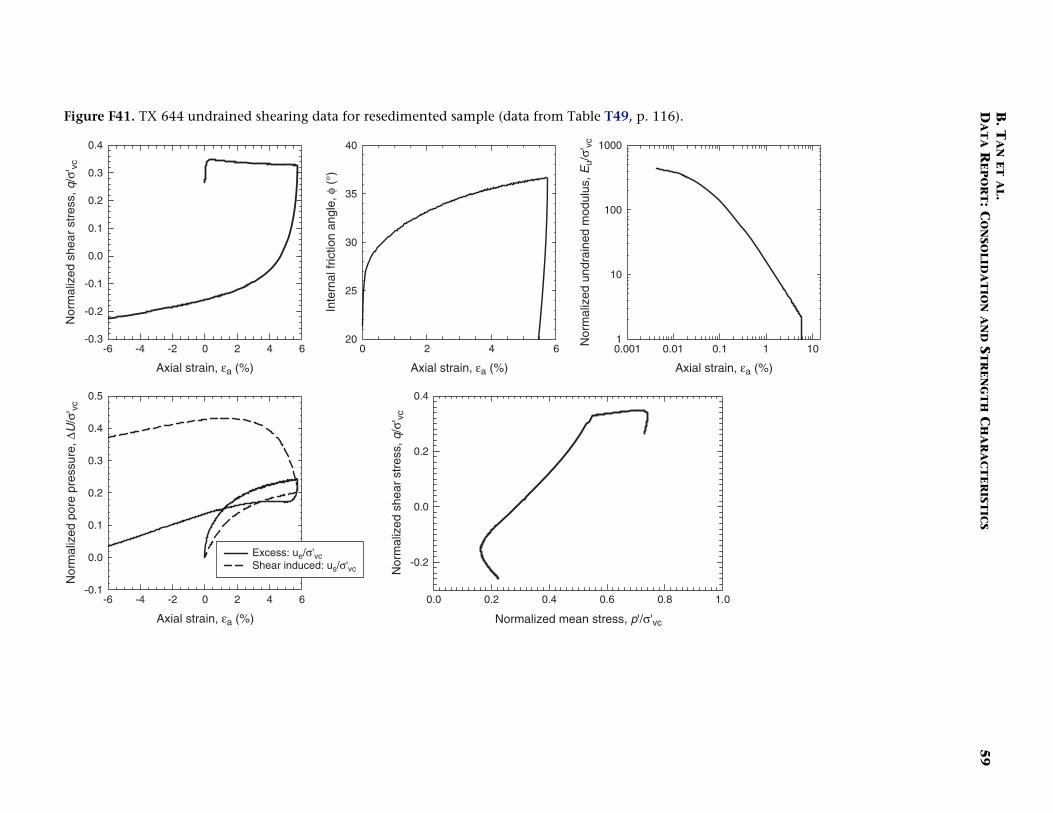
B. T
AN
ET A
L.D
AT
A R
EP
OR
T: CO
NSO
LID
AT
ION
AN
D S
TR
EN
GT
H C
HA
RA
CT
ER
ISTIC
S5
9
Figure . 116).
-0.3
-0.2
-0.1
0.0
0.1
0.2
0.3
0.4
-0.1
0.0
0.1
0.2
0.3
0.4
0.5
1.00.8
1010.10.01
Nor
mal
ized
she
ar s
tres
s, q
/σ' v
c
Axial strain, εa (%)
Nor
mal
ized
por
e pr
essu
re, Δ
U/σ
' vc
'/σ'vc
F41. TX 644 undrained shearing data for resedimented sample (data from Table T49, p
6420-2-4-6
6420-2-4-6
642020
25
30
35
40
0.60.40.20.0
-0.2
0.0
0.2
0.4
0.0011
10
100
1000
Inte
rnal
fric
tion
angl
e, φ
(°)
Axial strain, εa (%) Axial strain, εa (%)
Axial strain, εa (%)
Nor
mal
ized
she
ar s
tres
s, q
/σ' v
c
Normalized mean stress, p
Nor
mal
ized
und
rain
ed m
odul
us, E
u/σ'
vc
Excess: ue/σ'vcShear induced: us/σ'vc

B. T
AN
ET A
L.D
AT
A R
EP
OR
T: CO
NSO
LID
AT
ION
AN
D S
TR
EN
GT
H C
HA
RA
CT
ER
ISTIC
S6
0
Figure Table T50, p. 117).
0
0
2
4
6
8
10
12
14
16
0.0
0.2
0.4
0.6
0.8
108
101
Str
ain,
ε (
%)
Tota
l wor
k
ical consolidation stress, σ'v (ksc)
ksc)
F42. TX 645 consolidation data for Sample 204-1244B-4H-6, 125–135 cm (data from
101.1
1086420
1010.10.4
0.5
0.6
0.7
0.8
0.9
1.0
64200
2
4
6
0.11.25
1.30
1.35
1.40
1.45
1.50
1.55
1.60
1.65
1.70
Late
ral s
tres
s ra
tio, K
0
Voi
d ra
tio, e
Vertical consolidation stress, σ'v (ksc) Vertical consolidation stress, σ'v (ksc) Vert
Vertical consolidation stress, σ'v (ksc) Mean stress, (σ'a + σ'r)/2 (
She
ar s
tres
s, (
σ a –
σr)
/2 (
ksc)

B. T
AN
ET A
L.D
AT
A R
EP
OR
T: CO
NSO
LID
AT
ION
AN
D S
TR
EN
GT
H C
HA
RA
CT
ER
ISTIC
S6
1
Figure om Table T51, p. 118).
-0.3
-0.2
-0.1
0.0
0.1
0.2
0.3
0.4
-0.1
0.0
0.1
0.2
0.3
0.4
0.5
1.00.8
1010.10.01
Nor
mal
ized
she
ar s
tres
s, q
/σ' v
c
Axial strain, εa (%)
Nor
mal
ized
por
e pr
essu
re, Δ
U/σ
' vc
'/σ'vc
F43. TX 645 undrained shearing data for Sample 204-1244B-4H-6, 125–135 cm (data fr
420-2-4-6-8
420-2-4-6-8
4321020
25
30
35
40
0.60.40.20.0-0.4
-0.2
0.0
0.2
0.4
0.0011
10
100
1000
Inte
rnal
fric
tion
angl
e, φ
(°)
Axial strain, εa (%) Axial strain, εa (%)
Axial strain, εa (%)
Nor
mal
ized
she
ar s
tres
s, q
/σ' v
c
Normalized mean stress, p
Nor
mal
ized
und
rain
ed m
odul
us, E
u/σ'
vc
Excess: ue/σ'vcShear induced: us/σ'vc

B. T
AN
ET A
L.D
AT
A R
EP
OR
T: CO
NSO
LID
AT
ION
AN
D S
TR
EN
GT
H C
HA
RA
CT
ER
ISTIC
S6
2
Figure able T52, p. 119).
0
0
2
4
6
8
10
12
14
16
18
0.0
0.2
0.4
0.6
0.8
1.0
1.2
1.4
1.6
1.8
161412
101
Str
ain,
ε (
%)
Tota
l wor
k
tical consolidation stress, σ'v (ksc)
ksc)
F44. TX 646 consolidation data for Sample 204-1244C-9H-5, 115–125 cm (data from T
101.1
181614121086420
1010.10.4
0.5
0.6
0.7
0.8
0.9
1.0
10864200
2
4
6
8
10
12
0.11.00
1.05
1.10
1.15
1.20
1.25
1.30
1.35
1.40
1.45
1.50
Late
ral s
tres
s ra
tio, K
0
Voi
d ra
tio, e
Vertical consolidation stress, σ'v (ksc) Vertical consolidation stress, σ'v (ksc) Ver
Vertical consolidation stress, σ'v (ksc) Mean stress, (σ'a + σ'r)/2 (
She
ar s
tres
s, (
σ a –
σr)
/2 (
ksc)

B. T
AN
ET A
L.D
AT
A R
EP
OR
T: CO
NSO
LID
AT
ION
AN
D S
TR
EN
GT
H C
HA
RA
CT
ER
ISTIC
S6
3
Figure rom Table T53, p. 120).
-0.2
-0.1
0.0
0.1
0.2
0.3
0.4
-0.1
0.0
0.1
0.2
0.3
0.4
0.5
1.00.8
1010.10.01
Nor
mal
ized
she
ar s
tres
s, q
/σ' v
c
Axial strain, εa (%)
Nor
mal
ized
por
e pr
essu
re, Δ
U/σ
' vc
'/σ'vc
F45. TX 646 undrained shearing data for Sample 204-1244C-9H-5, 115–125 cm (data f
1086420-2-4-6
1086420-2-4-6
108642015
20
25
30
35
0.60.40.20.0-0.2
0.0
0.2
0.4
0.0011
10
100
1000
Inte
rnal
fric
tion
angl
e, φ
(°)
Axial strain, εa (%) Axial strain, εa (%)
Axial strain, εa (%)
Nor
mal
ized
she
ar s
tres
s, q
/σ' v
c
Normalized mean stress, p
Nor
mal
ized
und
rain
ed m
odul
us, E
u/σ'
vc
Excess: ue/σ'vcShear induced: us/σ'vc

B. T
AN
ET A
L.D
AT
A R
EP
OR
T: CO
NSO
LID
AT
ION
AN
D S
TR
EN
GT
H C
HA
RA
CT
ER
ISTIC
S6
4
Figure .
0
2
4
6
8
10
12
0.00
0.02
0.04
0.06
0.08
0.10
0.12
2.01.5
1
Str
ain,
ε (
%)
Tota
l wor
k
rtical consolidation stress, σ'v (ksc)
(ksc)
F46. TX 647 consolidation data for resedimented sample (data from Table T54, p. 121)
10.1
2.01.51.00.50.0
10.10.4
0.5
0.6
0.7
0.8
0.9
1.0
1.00.50.00.0
0.5
1.0
1.5
0.11.30
1.35
1.40
1.45
1.50
1.55
1.60
1.65
Late
ral s
tres
s ra
tio, K
0
Voi
d ra
tio, e
Vertical consolidation stress, σ'v (ksc) Vertical consolidation stress, σ'v (ksc) Ve
Vertical consolidation stress, σ'v (ksc) Mean stress, (σ'a + σ'r)/2
She
ar s
tres
s, (
σ a –
σr)
/2 (
ksc)

B. T
AN
ET A
L.D
AT
A R
EP
OR
T: CO
NSO
LID
AT
ION
AN
D S
TR
EN
GT
H C
HA
RA
CT
ER
ISTIC
S6
5
Figure . 122).
0.0
0.1
0.2
0.3
0.4
0.5
0.6
0.7
-0.2
-0.1
0.0
0.1
0.2
0.3
1.00.8
1010.10.011
Nor
mal
ized
she
ar s
tres
s, q
/σ' v
c
Axial strain, εa (%)
Nor
mal
ized
por
e pr
essu
re, Δ
U/σ
' vc
p'/σ'vc
F47. TX 647 undrained shearing data for resedimented sample (data from Table T55, p
1086420
1086420
108642020
25
30
35
40
0.60.40.20.00.0
0.2
0.4
0.6
0.001
10
100
1000
10000
Inte
rnal
fric
tion
angl
e, φ
(°)
Axial strain, εa (%) Axial strain, εa (%)
Axial strain, εa (%)
Nor
mal
ized
she
ar s
tres
s, q
/σ' v
c
Normalized mean stress,
Nor
mal
ized
und
rain
ed m
odul
us, E
u/σ'
vc
Excess: ue/σ'vcShear induced: us/σ'vc

B. T
AN
ET A
L.D
AT
A R
EP
OR
T: CO
NSO
LID
AT
ION
AN
D S
TR
EN
GT
H C
HA
RA
CT
ER
ISTIC
S6
6
Figure .
0
2
4
6
8
10
12
0.00
0.02
0.04
0.06
0.08
1.00.8
10.1
Str
ain,
ε (
%)
Tota
l wor
k
rtical consolidation stress, σ'v (ksc)
2 (ksc)
F48. TX 650 consolidation data for resedimented sample (data from Table T56, p. 123)
10.1
1.21.00.80.60.40.20.0
10.10.4
0.5
0.6
0.7
0.8
0.9
1.0
0.60.40.20.00.0
0.2
0.4
0.6
1.55
1.60
1.65
1.70
1.75
1.80
1.85
1.90
1.95
Late
ral s
tres
s ra
tio, K
0
Voi
d ra
tio, e
Vertical consolidation stress, σ'v (ksc) Vertical consolidation stress, σ'v (ksc) Ve
Vertical consolidation stress, σ'v (ksc) Mean stress, (σ'a + σ'r)/
She
ar s
tres
s, (
σ a –
σr)
/2 (
ksc)

B. T
AN
ET A
L.D
AT
A R
EP
OR
T: CO
NSO
LID
AT
ION
AN
D S
TR
EN
GT
H C
HA
RA
CT
ER
ISTIC
S6
7
Figure 24).
-0.3
-0.2
-0.1
0.0
0.1
0.2
0.3
-0.1
0.0
0.1
0.2
0.3
0.4
1.00.8
1010.10.0101
Nor
mal
ized
she
ar s
tres
s, q
/σ' v
c
Axial strain, εa (%)
Nor
mal
ized
por
e pr
essu
re, Δ
U/σ
' vc
s, p'/σ'vc
F49. TX 650 undrained shear data for resedimented sample (data from Table T57, p. 1
-12-10-8-6-4-20
-12-10-8-6-4-20
-12-10-8-6-4-20-80
-60
-40
-20
0
20
0.60.40.20.0-0.2
0.0
0.2
0.4
0.01
10
100
1000
10000
Inte
rnal
fric
tion
angl
e, φ
(°)
Axial strain, εa (%) Axial strain, εa (%)
Axial strain, εa (%)
Nor
mal
ized
she
ar s
tres
s, q
/σ' v
c
Normalized mean stres
Nor
mal
ized
und
rain
ed m
odul
us, E
u/σ'
vc
Excess: ue/σ'vcShear induced: us/σ'vc

B. TAN ET AL.DATA REPORT: CONSOLIDATION AND STRENGTH CHARACTERISTICS 68
Table T1. Whole core sections provided to MIT for consolidation andstrength testing.
Notes: GSHZ = gas hydrate stability zone, FGZ = free gas zone. * = mixed sample, † = resedi-mented sample, ‡ = remolded sample.
SectionInterval
(cm)
Depth to top of section
(mbsf)
CRSC testing CKoU testing
Hydrate zone
Sample number
Interval (cm)
Sample number
Interval (cm)
204-1244B-1H-4WR 120–150 5.7 CRS 580 125–128 TX 643 138–148 GSHZCRS 608 126–129
204-1244B-3H-3WR 120–150 20.3 CRS 497 145–148 TX 642 128–138 GSHZCRS 585 120–123
204-1244B-4H-6WR 120–150 32.98 CRS 508 120–125 TX 635 135–145 GSHZCRS 563 134–137 TX 645 125–135
204-1244B-6H-8WR 0–30 52.81 CRS 511 24–29 GSHZCRS 584 6–9
204-1244C-8H-7WR 45–75 70.88 CRS 504 71–74 GSHZCRS 578 45–48
204-1244C-9H-5WR 105–135 79.05 CRS 569 105–108 TX 646 115–125 GSHZ204-1244C-13H-3WR 120–150 114.2 CRS 491 144–147 GSHZ
CRS 493 139–142CRS 567 120–123
204-1244C-17H-3WR 65–109 135.55 CRS 495 97–100 TX 636 80–90 FGZCRS 499CRS 564 88–91
Other CRS 577* TX 641‡
TX 644†
TX 647†
TX 650‡

B. TAN ET AL.DATA REPORT: CONSOLIDATION AND STRENGTH CHARACTERISTICS 69
Table T2. Summary table of all tests conducted on Hydrate Ridge soil.
Notes: CRSC = constant rate of strain consolidation. NC = normally consolidated, OC = overconsolidated. AL = Atterberglimits, LOI = loss on ignition, PSA = particle size analysis. RP = random powder, CT = calcite treated, CF = clay fraction.St = standard diameter, Sm = small diameter. CKoUC = Ko-consolidated undrained compression, CKoUE = Ko-consoli-dated undrained extension. * = compression then extension. † = high-pressure cell.
SectionDepth (mbsf)
Triaxial shear
Index tests X-ray diffraction CRSC NC OC
AL LOI PSA RP CT CF St Sm CKoUC CKoUE CKoUC
204-1244B-1H-4WR 5.70 1 1 1 1*3H-3WR 20.30 1 1 1 1 1 14H-6WR 32.98 1 1 1 1 1 1 1 2*†
6H-8WR 52.81 1 1 1 1 1
204-1244C-8H-7WR 70.88 1 1 1 1 1 1 19H-5WR 79.05 1 1 1 1*13H-3WR 114.20 1 1 1 1 1 1 2 117H-3WR 135.55 1 1 1 1 1 1†
Remolded 1 1 1Resedimented 2 1 1 1

B. TAN ET AL.DATA REPORT: CONSOLIDATION AND STRENGTH CHARACTERISTICS 70
Table T3. Nomenclature.
Variable Definition Dimensions SI units
A A-parameter Dimensionless —B B-value Dimensionless —Cc Compression index Dimensionless —Cr Recompression index Dimensionless —cv Coefficient of consolidation L2/T cm2/sGs Specific gravity Dimensionless —ec Consolidation void ratio Dimensionless —ei Initial void ratio Dimensionless —Il Liquidity index Dimensionless —Ip Plasticity index Dimensionless —Kc Consolidation lateral stress ratio Dimensionless —Ko In situ lateral stress ratio Dimensionless —K Lateral stress ratio Dimensionless —ko In situ hydraulic conductivity L/T cm/sk Hydraulic conductivity L/T cm/sLOI Loss on ignition Dimensionless —OCR Overconsolidation ratio Dimensionless —p′ Mean stress M/LT2 kgf/cm2
q Shear stress M/LT2 kgf/cm2
Si Initial saturation Dimensionless %ts Time for secondary compression T secub Back pressure M/LT2 kgf/cm2
wc Water content Dimensionless %wl Liquid limit Dimensionless —wn Natural water content Dimensionless %wp Plastic limit Dimensionless —Δue Excess pore pressure M/LT2 kgf/cm2
Δus Shear induced pore pressure M/LT2 kgf/cm2
δε/δt Strain rate 1/T %/hrεa Axial strain Dimensionless —εvol Volumetric strain Dimensionless —ρt Total density M/L3 g/cm3
f Friction angle Degrees degreesσ′i Initial effective stress M/LT2 kgf/cm2

B. TAN ET AL.DATA REPORT: CONSOLIDATION AND STRENGTH CHARACTERISTICS 71
Table T4. Summary of atterberg limits, organic matter content, and calcite contenttests.
Notes: LOI = loss on ignition. See Table T3, p. 70, for definitions of headers.
SectionDepth(mbsf)
wn(%)
wl(%)
wp(%)
Ip(%)
Il(%)
LOI(%)
CaCO3 content (wt%)
204-1244B-1H-4WR 5.70 59.90 71.00 32.00 39.00 72.00 5.893H-3WR 20.30 63.80 82.00 37.00 45.00 60.00 4.55 1.2974H-6WR 32.98 62.70 87.00 42.00 45.00 46.00 5.18 1.2536H-8WR 52.81 60.05 85.00 38.00 47.00 47.00 4.93 2.357
204-1244C-8H-7WR 70.88 58.10 86.00 40.00 46.00 39.00 5.87 2.0909H-5WR 79.05 54.40 83.00 38.00 45.00 36.00 7.2713H-3WR 114.20 47.27 81.00 39.00 42.00 20.00 5.19 5.81213H-3WR 114.20 Oven-dried 64.00 39.00 25.0017H-3WR 135.55 48.85 77.00 35.00 42.00 33.00 4.68 2.928

B. TAN ET AL.DATA REPORT: CONSOLIDATION AND STRENGTH CHARACTERISTICS 72
Table T5. XRD random powder sample for Section204-1244B-4H-6WR.
2θ (°) Intensity
6.00 8376.02 7836.04 7836.06 7586.08 8426.10 8586.12 7626.14 9176.16 10216.18 9796.20 10176.22 12586.24 12966.26 13046.28 13716.30 11586.32 10296.34 7046.36 7586.38 7586.40 5796.42 6256.44 6626.46 6086.48 6006.50 6086.52 6676.54 6126.56 6046.58 5876.60 6926.62 6426.64 5546.66 5126.68 5876.70 5006.72 6466.74 571

B. TAN ET AL.DATA REPORT: CONSOLIDATION AND STRENGTH CHARACTERISTICS 73
Table T6. XRD random powder sample for Section204-1244C-8H-7WR.
2θ (°) Intensity
6.00 6716.02 6756.04 7216.06 7006.08 7296.10 7336.12 7426.14 8626.16 8586.18 8626.20 9086.22 10876.24 10506.26 12426.28 10546.30 9216.32 7466.34 7426.36 6796.38 6376.40 6756.42 6546.44 5546.46 5796.48 6216.50 6046.52 6426.54 6006.56 6126.58 6546.60 5796.62 5426.64 5376.66 5586.68 5426.70 5256.72 5796.74 608

B. TAN ET AL.DATA REPORT: CONSOLIDATION AND STRENGTH CHARACTERISTICS 74
Table T7. XRD random powder sample for Section204-1244C-13H-3WR.
2θ (°) Intensity
6.00 7256.02 7506.04 7506.06 8836.08 7716.10 8926.12 8586.14 10216.16 9336.18 9466.20 11296.22 12046.24 13626.26 13676.28 13086.30 11046.32 8796.34 8676.36 8086.38 8046.40 6506.42 5926.44 7466.46 7876.48 5966.50 6126.52 6796.54 7126.56 6836.58 6046.60 6126.62 5836.64 5466.66 5296.68 6676.70 6546.72 6466.74 600

B. TAN ET AL.DATA REPORT: CONSOLIDATION AND STRENGTH CHARACTERISTICS 75
Table T8. Calcite-treated XRD random powder sam-ple for Section 204-1244B-3H-3WR.
2θ (°) Intensity
4.00 11124.02 9624.04 10374.06 9624.08 10004.10 8834.12 9424.14 9924.16 9834.18 9674.20 10084.22 9964.24 9044.26 11124.28 8964.30 8374.32 9624.34 9584.36 9254.38 8874.40 9254.42 9384.44 9754.46 11084.48 10714.50 9584.52 10544.54 9004.56 9464.58 8924.60 9214.62 8834.64 9124.66 9794.68 9464.70 9044.72 8374.74 858

B. TAN ET AL.DATA REPORT: CONSOLIDATION AND STRENGTH CHARACTERISTICS 76
Table T9. Calcite-treated XRD random powder sam-ple for Section 204-1244B-4H-6WR.
2θ (°) Intensity
4.00 10924.02 11964.04 10834.06 10504.08 10504.10 10424.12 10754.14 11084.16 10504.18 11504.20 10424.22 11674.24 10964.26 10084.28 11674.30 10924.32 10174.34 11004.36 9124.38 10504.40 12754.42 10674.44 11834.46 10674.48 11544.50 10504.52 12714.54 11754.56 11084.58 11464.60 9624.62 11714.64 10174.66 10254.68 11004.70 10334.72 9424.74 879

B. TAN ET AL.DATA REPORT: CONSOLIDATION AND STRENGTH CHARACTERISTICS 77
Table T10. Calcite-treated XRD random powdersample for Section 204-1244B-6H-8WR.
2θ (°) Intensity
4.00 13294.02 12544.04 12874.06 12084.08 12754.10 12924.12 13044.14 11714.16 11874.18 11124.20 11544.22 13084.24 12254.26 12424.28 12084.30 12924.32 11174.34 12374.36 12254.38 11794.40 11714.42 11334.44 11964.46 11044.48 12424.50 11044.52 13084.54 12714.56 11624.58 11794.60 12714.62 11624.64 11174.66 10754.68 11214.70 10834.72 10254.74 1142

B. TAN ET AL.DATA REPORT: CONSOLIDATION AND STRENGTH CHARACTERISTICS 78
Table T11. Calcite-treated XRD random powdersample for Section 204-1244C-8H-7WR.
2θ (°) Intensity
4.00 11964.02 11874.04 11174.06 11584.08 11924.10 11464.12 11374.14 10584.16 10544.18 11124.20 10504.22 11424.24 10834.26 10964.28 11424.30 10754.32 10874.34 10334.36 9674.38 11924.40 10124.42 11794.44 11754.46 10924.48 11674.50 11874.52 11214.54 12004.56 12754.58 12374.60 10504.62 11084.64 11674.66 11334.68 12714.70 11214.72 8714.74 1158

B. TAN ET AL.DATA REPORT: CONSOLIDATION AND STRENGTH CHARACTERISTICS 79
Table T12. Calcite-treated XRD random powdersample for Section 204-1244C-13H-3WR.
2θ (°) Intensity
4.00 11044.02 10334.04 10464.06 12004.08 9294.10 10424.12 11124.14 10924.16 12714.18 10674.20 10674.22 10624.24 12174.26 9924.28 10124.30 10924.32 10794.34 10424.36 10924.38 10214.40 10464.42 10334.44 9464.46 10834.48 9084.50 10254.52 10374.54 10294.56 10874.58 9674.60 11424.62 9504.64 10174.66 8544.68 9794.70 9874.72 10584.74 887

B. TAN ET AL.DATA REPORT: CONSOLIDATION AND STRENGTH CHARACTERISTICS 80
Table T13. Calcite-treated XRD random powdersample for Section 204-1244C-17H-3WR.
2θ (°) Intensity
4.00 13424.02 12004.04 12674.06 12754.08 13254.10 11084.12 12424.14 12794.16 11374.18 12624.20 10874.22 11674.24 11794.26 12834.28 11584.30 12294.32 12424.34 12004.36 11294.38 13044.40 12544.42 13464.44 12924.46 12964.48 11334.50 12464.52 13214.54 11714.56 12084.58 12874.60 10834.62 12294.64 11964.66 11294.68 10624.70 11254.72 11794.74 1033

B. TAN ET AL.DATA REPORT: CONSOLIDATION AND STRENGTH CHARACTERISTICS 81
Table T14. Clay-fraction XRD random powder sam-ple for Section 204-1244B-4H-6WR.
2θ (°) Intensity
4.00 6544.02 7504.04 7294.06 6624.08 6964.10 5964.12 6794.14 7124.16 6584.18 7424.20 6084.22 6924.24 6334.26 7174.28 6754.30 6624.32 8674.34 7214.36 6294.38 7714.40 7624.42 6624.44 7754.46 7124.48 6214.50 8174.52 8004.54 6924.56 7174.58 7424.60 6544.62 7214.64 5544.66 6674.68 7754.70 6334.72 6714.74 650

B. TAN ET AL.DATA REPORT: CONSOLIDATION AND STRENGTH CHARACTERISTICS 82
Table T15. Clay-fraction XRD random powder sam-ple for Section 204-1244C-8H-7WR.
2θ (°) Intensity
4.00 7504.02 7794.04 8124.06 6924.08 7874.10 8584.12 7174.14 8174.16 8174.18 7584.20 7044.22 7624.24 7544.26 7334.28 7374.30 8504.32 6924.34 6504.36 8084.38 8374.40 9174.42 7464.44 7754.46 8584.48 8334.50 8044.52 8214.54 9504.56 7834.58 8004.60 8294.62 7874.64 7834.66 7334.68 6874.70 6874.72 6214.74 683

B. TAN ET AL.DATA REPORT: CONSOLIDATION AND STRENGTH CHARACTERISTICS 83
Table T16. Clay-fraction XRD random powder sam-ple for Section 204-1244C-13H-3WR.
2θ (°) Intensity
4.00 6004.02 5794.04 5874.06 6834.08 6504.10 6294.12 5924.14 6254.16 6294.18 5584.20 6174.22 5874.24 5874.26 6964.28 6504.30 6794.32 6584.34 7674.36 7004.38 7424.40 6674.42 6964.44 6794.46 7714.48 7504.50 6334.52 6714.54 7124.56 6674.58 6084.60 7504.62 6084.64 5714.66 6214.68 5794.70 5714.72 5584.74 567

B. T
AN
ET A
L.D
AT
A R
EP
OR
T: CO
NSO
LID
AT
ION
AN
D S
TR
EN
GT
H C
HA
RA
CT
ER
ISTIC
S8
4
Table .
Notes: S
Testnumbe
Test conditions
Remarksub (ksc)δε/δt
(%/hr)
Consolidation properties
(%) Gs Cc Cr ko (cm/s)
CRS 58 4.8 2.58 4.00 0.5 0.544 0.047 1.50E–07 Small diameterCRS 60 5.6 2.58 4.00 0.5 0.476 0.035 Small diameter, horizontal specCRS 49 2.5 2.58 4.00 0.5 0.646 0.044 9.50E–08CRS 58 4.7 2.58 4.00 0.5 0.534 0.059 1.00E–07 Small diameterCRS 50 0.8 2.62 4.00 0.5 0.693 0.053 8.50E–08CRS 56 1.9 2.62 4.00 0.5 0.704 0.063 1.00E–07 Small diameterCRS 51 2.9 2.59 4.00 0.5 0.566 0.050 ResedimentedCRS 58 3.5 2.59 4.00 0.5 0.599 0.062 1.40E–07 Small diameterCRS 50 9.4 2.61 4.00 0.5 0.633 0.043 6.50E–08CRS 57 1.3 2.61 4.00 0.5 0.672 0.049 8.50E–08 Small diameterCRS 56 0.0 2.64 4.00 0.5 0.658 0.058 1.30E–07 Small diameterCRS 49 5.3 2.63 4.00 0.5 0.560 0.037 7.00E–08CRS 49 5.6 2.63 4.00 0.5 0.535 0.064 1.00E–07CRS 56 0.0 2.64 4.00 0.5 0.658 0.058 1.30E–07 Small diameterCRS 49 8.8 2.69 4.00 0.5 0.435 0.051 7.00E–08CRS 49 1.7 2.69 4.00 0.5 0.519 0.057 ResedimentedCRS 56 2.2 2.69 5.00 0.5 0.453 0.060 3.00E–08 Small diameterCRS 57 1.6 2.69 4.00 0.5 0.340 0.041 Remolded
T17. CRSC test conditions and consolidation properties
ee Table T3, p. 70, for explanation of headings. 1 kg/cm2 = 98.06 kPa.
r
Index tests Specimen data
wc (%) wp (%) wl (%) wn (%) Ip ρt (g/cm3) ei Si
0 59.9 32 71 63.56 39 1.646 1.566 108 56.1 32 71 58.00 39 1.688 1.418 107 63.8 37 82 64.00 45 1.619 1.608 105 60.0 37 82 59.32 45 1.668 1.459 108 63.3 42 87 63.78 45 1.615 1.659 103 62.1 42 87 66.69 45 1.609 1.715 101 38 85 47 1.400 3.214 104 63.1 38 85 66.53 47 1.620 1.667 104 58.1 40 86 58.32 46 1.632 1.532 98 57.4 40 86 61.05 46 1.634 1.573 109 54.4 38 83 57.24 45 1.653 1.510 101 49.9 39 81 50.75 42 1.652 1.402 93 47.8 39 81 51.34 42 1.651 1.414 97 54.4 39 81 57.24 42 1.653 1.510 105 49.8 35 77 50.52 43 1.704 1.377 99 35 77 43 1.464 2.744 104 47.9 35 77 46.68 43 1.771 1.229 107 49.2 1.724 1.364 10

B. TAN ET AL.DATA REPORT: CONSOLIDATION AND STRENGTH CHARACTERISTICS 85
Table T18. CRS 491 consolidation data for Sample 204-1244C-13H-3WR, 144–147 cm.
Note: See Table T3, p. 70, for definitions of headers.
Time (s) ε (%) σv (ksc) u (ksc) σcell (ksc) σ’v (ksc) e dU (ksc) k (cm/s) cv (cm2/s) dU/σv Work
330 –0.1678 0.1259 3.9726 3.97237 0.12574 1.40613 2.33E–04 1.85E–03 2.88E–06340 –0.1666 0.12578 3.9729 3.97328 0.12604 1.40611 –3.78E–04 –3.01E–03 4.39E–06350 –0.1676 0.12589 3.9729 3.97315 0.12605 1.40613 –2.49E–04 –1.98E–03 3.08E–06360 –0.1665 0.12589 3.97274 3.97279 0.12592 1.40611 –4.77E–05 –3.79E–04 4.41E–06370 –0.1669 0.12561 3.97252 3.97263 0.12568 1.40611 –1.13E–04 –9.00E–04 3.95E–06380 –0.1673 0.12419 3.97243 3.97237 0.12415 1.40612 6.15E–05 4.95E–04 3.46E–06390 –0.1737 0.12554 3.97273 3.9725 0.12539 1.40628 2.31E–04 1.84E–03 –4.56E–06400 –0.1739 0.12628 3.97311 3.97341 0.12648 1.40628 –2.94E–04 –2.33E–03 –4.78E–06410 –0.1782 0.12549 3.97303 3.97354 0.12583 1.40638 –5.10E–04 –4.07E–03 –1.02E–05421 –0.1824 0.12386 3.97381 3.97396 0.12396 1.40649 –1.50E–04 –1.21E–03 –1.54E–05430 –0.1883 0.13203 3.97641 3.97344 0.13005 1.40663 2.97E–03 2.25E–02 –2.29E–05441 –0.1927 0.14207 3.98161 3.9737 0.1368 1.40673 7.92E–03 5.57E–02 –2.87E–05458 –0.1969 0.15793 3.99209 3.97548 0.14686 1.40683 1.66E–02 1.05E–01 –3.47E–05578 –0.1653 0.23811 3.99377 3.98084 0.22949 1.40607 1.29E–02 5.43E–02 2.47E–05698 –0.1326 0.23806 3.99081 3.98094 0.23148 1.40529 9.88E–03 4.15E–02 9.98E–05818 –0.1256 0.22771 3.98335 3.97847 0.22445 1.40512 4.88E–03 2.14E–02 1.16E–04938 –0.1237 0.2424 3.9854 3.97834 0.2377 1.40508 7.06E–03 2.91E–02 1.20E–04
1058 –0.1067 0.2688 3.98732 3.98081 0.26446 1.40467 6.51E–03 2.42E–02 1.63E–041178 –0.0831 0.26926 3.98715 3.98055 0.26486 1.4041 6.60E–03 2.45E–02 2.25E–041298 –0.0716 0.2714 3.9857 3.98055 0.26796 1.40382 5.15E–03 1.90E–02 2.56E–041418 –0.0603 0.28517 3.98476 3.98094 0.28263 1.40355 3.82E–03 1.34E–02 2.87E–041538 –0.0343 0.27616 3.98514 3.98068 0.27318 1.40293 4.46E–03 1.62E–02 3.59E–041658 –0.026 0.28777 3.98553 3.98068 0.28453 1.40273 4.85E–03 1.68E–02 3.82E–041778 –0.0126 0.30596 3.98787 3.9812 0.30151 1.40241 6.67E–03 5.17E–07 3.14E–02 2.18E–02 4.22E–041898 0.0042 0.31767 3.98872 3.98107 0.31257 1.402 7.66E–03 4.52E–07 2.76E–02 2.41E–02 4.73E–042018 0.0193 0.32486 3.98834 3.98094 0.31992 1.40164 7.40E–03 4.75E–07 2.93E–02 2.28E–02 5.21E–042138 0.0342 0.33423 3.98855 3.98042 0.3288 1.40128 8.13E–03 4.33E–07 2.65E–02 2.43E–02 5.69E–042258 0.0498 0.34539 3.98907 3.9812 0.34015 1.40091 7.87E–03 4.46E–07 2.84E–02 2.28E–02 6.22E–042378 0.0654 0.35619 3.98954 3.98081 0.35038 1.40053 8.73E–03 4.03E–07 2.57E–02 2.45E–02 6.76E–04

B. TAN ET AL.DATA REPORT: CONSOLIDATION AND STRENGTH CHARACTERISTICS 86
Table T19. CRS 493 consolidation data for Sample 204-1244C-13H-3WR, 139–142 cm.
Note: See Table T3, p. 70, for definitions of headers.
Time (s) ε (%) σv (ksc) u (ksc) σcell (ksc) σ’v (ksc) e dU (ksc) k (cm/s) cv (cm2/s) dU/σv Work
210 0.6445 0.52849 3.98065 3.97492 0.52467 1.3982 5.73E–03 1.08E–02 1.59E–05220 0.6456 0.53465 3.98082 3.97544 0.53107 1.39817 5.38E–03 1.01E–02 2.15E–05230 0.6455 0.53641 3.98112 3.9757 0.5328 1.39817 5.42E–03 1.01E–02 2.11E–05232 0.6468 0.53681 3.98372 3.97596 0.53163 1.39814 7.76E–03 1.45E–02 2.80E–05352 0.6562 0.57533 3.98693 3.98144 0.57168 1.39792 5.49E–03 9.54E–03 8.02E–05472 0.6741 0.60815 3.98966 3.98118 0.6025 1.39748 8.48E–03 1.39E–02 1.86E–04592 0.6915 0.62274 3.98938 3.98225 0.61799 1.39706 7.12E–03 1.14E–02 2.93E–04712 0.7047 0.63468 3.98932 3.98209 0.62986 1.39675 7.23E–03 1.14E–02 3.76E–04832 0.72 0.65104 3.99052 3.98235 0.6456 1.39638 8.16E–03 1.25E–02 4.74E–04952 0.7375 0.66402 3.99098 3.9843 0.65957 1.39595 6.68E–03 1.01E–02 5.89E–04
1072 0.7528 0.67312 3.99073 3.98261 0.66771 1.39558 8.12E–03 1.21E–02 6.91E–041192 0.7688 0.68246 3.98996 3.98235 0.67739 1.3952 7.61E–03 1.11E–02 8.00E–041312 0.7839 0.69379 3.9903 3.98183 0.68815 1.39483 8.47E–03 1.22E–02 9.04E–041432 0.8002 0.70498 3.99073 3.98248 0.69949 1.39444 8.24E–03 4.46E–07 2.82E–02 1.17E–02 1.02E–031552 0.816 0.71347 3.99073 3.98222 0.7078 1.39406 8.50E–03 4.32E–07 2.54E–02 1.19E–02 1.13E–031672 0.8321 0.72081 3.99052 3.98222 0.71528 1.39367 8.29E–03 4.44E–07 2.50E–02 1.15E–02 1.25E–031792 0.8484 0.72885 3.99064 3.98209 0.72315 1.39328 8.55E–03 4.33E–07 2.33E–02 1.17E–02 1.36E–031912 0.8662 0.73777 3.99069 3.98248 0.7323 1.39285 8.20E–03 4.52E–07 2.33E–02 1.11E–02 1.49E–032032 0.8815 0.74456 3.99099 3.98209 0.73864 1.39248 8.89E–03 4.17E–07 2.08E–02 1.19E–02 1.61E–032152 0.8973 0.75346 3.99103 3.98261 0.74785 1.39209 8.41E–03 4.41E–07 2.14E–02 1.12E–02 1.73E–032272 0.9137 0.76147 3.99116 3.98209 0.75543 1.3917 9.06E–03 4.10E–07 1.93E–02 1.19E–02 1.85E–032392 0.9308 0.76829 3.99114 3.98193 0.76215 1.39129 9.21E–03 4.03E–07 1.84E–02 1.20E–02 1.98E–032512 0.9464 0.77519 3.99114 3.98206 0.76914 1.39091 9.08E–03 4.09E–07 1.83E–02 1.17E–02 2.10E–032632 0.9622 0.78318 3.99161 3.98167 0.77655 1.39053 9.94E–03 3.74E–07 1.64E–02 1.27E–02 2.23E–032752 0.9787 0.79136 3.99178 3.98245 0.78514 1.39013 9.33E–03 3.99E–07 1.71E–02 1.18E–02 2.36E–032872 0.996 0.79737 3.99187 3.98219 0.79092 1.38971 9.68E–03 3.84E–07 1.61E–02 1.21E–02 2.49E–032992 1.0108 0.80296 3.99191 3.98193 0.7963 1.38936 9.98E–03 3.73E–07 1.53E–02 1.24E–02 2.61E–033112 1.0267 0.81038 3.99191 3.98193 0.80373 1.38897 9.98E–03 3.73E–07 1.50E–02 1.23E–02 2.74E–033232 1.0437 0.8157 3.99207 3.98151 0.80867 1.38856 1.06E–02 3.53E–07 1.38E–02 1.29E–02 2.88E–03

B. TAN ET AL.DATA REPORT: CONSOLIDATION AND STRENGTH CHARACTERISTICS 87
Table T20. CRS 495 consolidation data for Sample 204-1244C-17H-3WR, 97–100 cm.
Note: See Table T3, p. 70, for definitions of headers.
Time (s) ε (%) σv (ksc) u (ksc) σcell (ksc) σ’v (ksc) e dU (ksc) k (cm/s) cv (cm2/s) dU/σv Work
1895 0.1497 0.18947 4.02171 3.9873 0.16653 1.37303 3.44E–02 0.1815926 2.17E–042015 0.1689 0.18545 4.01895 3.98564 0.16325 1.37258 3.33E–02 0.1795801 2.48E–042135 0.1803 0.18548 4.01684 3.98639 0.16518 1.37231 3.04E–02 0.1641722 2.67E–042255 0.192 0.19826 4.01885 3.9873 0.17723 1.37203 3.15E–02 0.1591203 2.87E–042375 0.2097 0.20707 4.02074 3.98681 0.18445 1.37161 3.39E–02 0.163836 3.19E–042495 0.2274 0.20743 4.0195 3.98668 0.18555 1.37119 3.28E–02 0.1582153 3.52E–042615 0.2408 0.20936 4.0189 3.98694 0.18805 1.37087 3.20E–02 0.152659 3.77E–042735 0.2629 0.22215 4.0192 3.98707 0.20073 1.37034 3.21E–02 0.1446329 4.20E–042855 0.2802 0.22489 4.01959 3.98694 0.20313 1.36993 3.26E–02 0.145149 4.55E–042975 0.2956 0.22647 4.01869 3.98733 0.20556 1.36956 3.14E–02 0.1384646 4.87E–043095 0.3103 0.23162 4.01886 3.98642 0.20999 1.36922 3.24E–02 0.1400475 5.17E–043215 0.3269 0.23645 4.01917 3.98697 0.21499 1.36882 3.22E–02 0.1361683 5.53E–043335 0.3427 0.23903 4.01904 3.98684 0.21757 1.36844 3.22E–02 0.1347079 5.87E–043455 0.3577 0.24229 4.01887 3.98671 0.22085 1.36809 3.22E–02 0.132728 6.20E–043575 0.3734 0.2476 4.01917 3.98658 0.22588 1.36772 3.26E–02 0.1316134 6.55E–043695 0.3897 0.25095 4.01904 3.98645 0.22922 1.36733 3.26E–02 0.1298661 6.93E–043815 0.4067 0.2513 4.01862 3.98632 0.22978 1.36692 3.23E–02 1.14E–07 2.63E–03 0.1284971 7.32E–043935 0.4212 0.25438 4.0184 3.98762 0.23386 1.36658 3.08E–02 1.20E–07 2.80E–03 0.1210007 7.66E–044055 0.4371 0.26102 4.01917 3.9858 0.23877 1.3662 3.34E–02 1.11E–07 2.59E–03 0.1278328 8.03E–044175 0.4534 0.26536 4.01943 3.98658 0.24346 1.36581 3.28E–02 1.13E–07 2.58E–03 0.1237714 8.43E–044295 0.4698 0.26737 4.01921 3.98684 0.24579 1.36543 3.24E–02 1.14E–07 2.58E–03 0.1210674 8.83E–044415 0.4845 0.27027 4.01916 3.98655 0.24854 1.36508 3.26E–02 1.14E–07 2.55E–03 0.1206438 9.20E–044535 0.5002 0.27572 4.01967 3.98668 0.25373 1.3647 3.30E–02 1.13E–07 2.48E–03 0.119644 9.59E–044655 0.5163 0.281 4.02006 3.98681 0.25883 1.36432 3.32E–02 1.12E–07 2.39E–03 0.1183037 1.00E–034775 0.5319 0.28294 4.01984 3.98694 0.26101 1.36395 3.29E–02 1.13E–07 2.37E–03 0.1162763 1.04E–034895 0.5477 0.28625 4.0199 3.98606 0.2637 1.36357 3.38E–02 1.10E–07 2.28E–03 0.1181915 1.08E–035015 0.5631 0.29197 4.02027 3.98642 0.26941 1.36321 3.38E–02 1.10E–07 2.22E–03 0.1159205 1.12E–035135 0.5811 0.29351 4.0201 3.98707 0.2715 1.36278 3.30E–02 1.13E–07 2.22E–03 0.1125182 1.17E–035255 0.5971 0.29435 4.01959 3.98655 0.27232 1.3624 3.30E–02 1.13E–07 2.20E–03 0.1122252 1.22E–03

B. TAN ET AL.DATA REPORT: CONSOLIDATION AND STRENGTH CHARACTERISTICS 88
Table T21. CRS 497 consolidation data for Sample 204-1244B-3H-3WR, 145–148 cm.
Note: See Table T3, p. 70, for definitions of headers.
Time (s) ε (%) σv (ksc) u (ksc) σcell (ksc) σ’v (ksc) e dU (ksc) k (cm/s) cv (cm2/s) dU/σv Work
1895 0.1497 0.18947 4.02171 3.9873 0.16653 1.37303 3.44E–02 0.1815926 2.17E–042015 0.1689 0.18545 4.01895 3.98564 0.16325 1.37258 3.33E–02 0.1795801 2.48E–042135 0.1803 0.18548 4.01684 3.98639 0.16518 1.37231 3.05E–02 0.1641722 2.67E–042255 0.192 0.19826 4.01885 3.9873 0.17723 1.37203 3.15E–02 0.1591203 2.87E–042375 0.2097 0.20707 4.02074 3.98681 0.18445 1.37161 3.39E–02 0.163836 3.19E–042495 0.2274 0.20743 4.0195 3.98668 0.18555 1.37119 3.28E–02 0.1582153 3.52E–042615 0.2408 0.20936 4.0189 3.98694 0.18805 1.37087 3.20E–02 0.152659 3.77E–042735 0.2629 0.22215 4.0192 3.98707 0.20073 1.37034 3.21E–02 0.1446329 4.20E–042855 0.2802 0.22489 4.01959 3.98694 0.20313 1.36993 3.26E–02 0.145149 4.55E–042975 0.2956 0.22647 4.01869 3.98733 0.20556 1.36956 3.14E–02 0.1384646 4.87E–043095 0.3103 0.23162 4.01886 3.98642 0.20999 1.36922 3.24E–02 0.1400475 5.17E–043215 0.3269 0.23645 4.01917 3.98697 0.21499 1.36882 3.22E–02 0.1361683 5.53E–043335 0.3427 0.23903 4.01904 3.98684 0.21757 1.36844 3.22E–02 0.1347079 5.87E–043455 0.3577 0.24229 4.01887 3.98671 0.22085 1.36809 3.22E–02 0.132728 6.20E–043575 0.3734 0.2476 4.01917 3.98658 0.22588 1.36772 3.26E–02 0.1316134 6.55E–043695 0.3897 0.25095 4.01904 3.98645 0.22922 1.36733 3.26E–02 0.1298661 6.93E–043815 0.4067 0.2513 4.01862 3.98632 0.22978 1.36692 3.23E–02 1.14E–07 2.63E–03 0.1284971 7.32E–043935 0.4212 0.25438 4.0184 3.98762 0.23386 1.36658 3.08E–02 1.20E–07 2.80E–03 0.1210007 7.66E–044055 0.4371 0.26102 4.01917 3.9858 0.23877 1.3662 3.34E–02 1.11E–07 2.59E–03 0.1278328 8.03E–044175 0.4534 0.26536 4.01943 3.98658 0.24346 1.36581 3.28E–02 1.13E–07 2.58E–03 0.1237714 8.43E–044295 0.4698 0.26737 4.01921 3.98684 0.24579 1.36543 3.24E–02 1.14E–07 2.58E–03 0.1210674 8.83E–044415 0.4845 0.27027 4.01916 3.98655 0.24854 1.36508 3.26E–02 1.14E–07 2.55E–03 0.1206438 9.20E–044535 0.5002 0.27572 4.01967 3.98668 0.25373 1.3647 3.30E–02 1.13E–07 2.48E–03 0.119644 9.59E–044655 0.5163 0.281 4.02006 3.98681 0.25883 1.36432 3.32E–02 1.12E–07 2.39E–03 0.1183037 1.00E–034775 0.5319 0.28294 4.01984 3.98694 0.26101 1.36395 3.29E–02 1.13E–07 2.37E–03 0.1162763 1.04E–034895 0.5477 0.28625 4.0199 3.98606 0.2637 1.36357 3.38E–02 1.10E–07 2.28E–03 0.1181915 1.08E–035015 0.5631 0.29197 4.02027 3.98642 0.26941 1.36321 3.38E–02 1.10E–07 2.22E–03 0.1159205 1.12E–035135 0.5811 0.29351 4.0201 3.98707 0.2715 1.36278 3.30E–02 1.13E–07 2.22E–03 0.1125182 1.17E–035255 0.5971 0.29435 4.01959 3.98655 0.27232 1.3624 3.30E–02 1.13E–07 2.20E–03 0.1122252 1.22E–03

B. TAN ET AL.DATA REPORT: CONSOLIDATION AND STRENGTH CHARACTERISTICS 89
Table T22. CRS 499 consolidation data run on resedimented sample.
Note: See Table T3, p. 70, for definitions of headers.
Time (s) ε (%) σv (ksc) u (ksc) σcell (ksc) σ’v (ksc) e dU (ksc) k (cm/s) cv (cm2/s) dU/σv Work
62893 5.1908 0.0287 3.99248 3.98326 0.0225 2.49624 9.22E–03 0.3219531 0.000418263073 5.2163 0.0281 3.99253 3.98261 0.0214 2.4953 9.92E–03 0.3535204 0.000423863253 5.2406 0.0284 3.99265 3.98339 0.0222 2.4944 9.27E–03 0.3265005 0.000429163433 5.2655 0.0286 3.99282 3.98378 0.0226 2.49349 9.05E–03 0.3164654 0.000434763613 5.2901 0.0286 3.99287 3.98274 0.02188 2.49258 1.01E–02 0.3537456 0.000440163793 5.3156 0.02877 3.99251 3.98336 0.0227 2.49164 9.16E–03 0.318307 0.000445863973 5.339 0.0286 3.99278 3.98313 0.0221 2.49077 9.65E–03 0.3377247 0.00045164153 5.3657 0.02924 3.99281 3.98362 0.02311 2.48979 9.19E–03 0.3144151 0.000457164333 5.391 0.0286 3.99287 3.98378 0.02253 2.48886 9.09E–03 0.3179668 0.000462964513 5.4149 0.0291 3.99274 3.98274 0.0224 2.48797 1.00E–02 0.3441537 0.000468264693 5.4409 0.0287 3.99291 3.98339 0.0224 2.48702 9.52E–03 0.3315344 0.000474164873 5.4652 0.029 3.99308 3.98326 0.0224 2.48612 9.82E–03 0.3387529 0.000479565053 5.4913 0.0292 3.99076 3.9831 0.0241 2.48516 7.67E–03 0.2623374 0.000485665233 5.518 0.0283 3.99044 3.97677 0.0192 2.48417 1.37E–02 0.4833763 0.000491365413 5.5395 0.0293 3.99042 3.98258 0.0241 2.48338 7.85E–03 0.2678432 0.00049665593 5.567 0.0292 3.9927 3.98274 0.0226 2.48237 9.96E–03 0.340679 0.000502465773 5.588 0.0299 3.99311 3.98271 0.0229 2.48159 1.04E–02 0.3482466 0.000507265953 5.613 0.0305 3.99324 3.98297 0.0237 2.48067 1.03E–02 3.45E–07 3.60E–04 0.3365106 0.00051366133 5.6394 0.03 3.99367 3.98336 0.0232 2.4797 1.03E–02 3.43E–07 3.86E–04 0.3430808 0.000519266313 5.6622 0.03098 3.99362 3.98336 0.0241 2.47886 1.03E–02 3.44E–07 4.23E–04 0.3312962 0.000524666493 5.6899 0.0306 3.99392 3.98284 0.0232 2.47783 1.11E–02 3.20E–07 3.45E–04 0.361926 0.000531266673 5.7128 0.0308 3.99389 3.98365 0.024 2.47699 1.02E–02 3.45E–07 3.93E–04 0.3323342 0.000536666853 5.737 0.0319 3.99418 3.98323 0.0246 2.4761 1.09E–02 3.24E–07 3.50E–04 0.3437376 0.000542467033 5.7624 0.0316 3.99385 3.98339 0.0246 2.47516 1.05E–02 3.39E–07 3.53E–04 0.3307756 0.000548767213 5.7864 0.032 3.99388 3.98271 0.0246 2.47428 1.12E–02 3.17E–07 3.34E–04 0.3490125 0.000554667393 5.8127 0.032 3.99363 3.98313 0.025 2.47331 1.05E–02 3.37E–07 3.13E–04 0.3283577 0.000561167573 5.8357 0.03248 3.99396 3.98297 0.0252 2.47246 1.10E–02 3.22E–07 2.93E–04 0.3384947 0.000566967753 5.8597 0.0332 3.9938 3.98326 0.0261 2.47157 1.05E–02 3.37E–07 2.83E–04 0.3179165 0.00057367933 5.8859 0.03304 3.99393 3.983 0.0257 2.47061 1.09E–02 3.26E–07 1.89E–04 0.3309944 0.0005798

B. TAN ET AL.DATA REPORT: CONSOLIDATION AND STRENGTH CHARACTERISTICS 90
Table T23. CRS 504 consolidation data for Sample 204-1244C-8H-7WR, 71–74 cm.
Note: See Table T3, p. 70, for definitions of headers.
Time (s) ε (%) σv (ksc) u (ksc) σcell (ksc) σ’v (ksc) e dU (ksc) k (cm/s) cv (cm2/s) dU/σv Work
7943 0.772 0.43772 4.0104 3.99655 0.42849 1.51286 1.38E–02 3.16E–02 0.0026918063 0.7889 0.44286 4.01074 3.99707 0.43375 1.51244 1.37E–02 3.09E–02 0.00276438183 0.8036 0.44913 4.0112 3.99717 0.43977 1.51206 1.40E–02 3.12E–02 0.00282928303 0.8215 0.45353 4.01128 3.99743 0.44429 1.51161 1.39E–02 3.05E–02 0.0029098423 0.8376 0.45839 4.01107 3.99678 0.44886 1.5112 1.43E–02 3.12E–02 0.00298138543 0.8536 0.46304 4.01086 3.99704 0.45383 1.5108 1.38E–02 2.98E–02 0.00305418663 0.8693 0.46793 4.01104 3.99642 0.45819 1.5104 1.46E–02 3.12E–02 0.00312648783 0.8854 0.47377 4.01132 3.99717 0.46434 1.50999 1.42E–02 2.99E–02 0.00320138903 0.9016 0.47923 4.01167 3.99652 0.46913 1.50958 1.51E–02 3.16E–02 0.00327759023 0.9178 0.48357 4.01171 3.9973 0.47396 1.50917 1.44E–02 2.98E–02 0.00335449143 0.9344 0.48808 4.01185 3.99694 0.47814 1.50875 1.49E–02 3.05E–02 0.00343429263 0.9499 0.4938 4.01213 3.99665 0.48348 1.50836 1.55E–02 3.13E–02 0.00350989383 0.9665 0.49992 4.01248 3.99613 0.48902 1.50794 1.63E–02 3.27E–02 0.00359099503 0.983 0.50407 4.01256 3.99704 0.49372 1.50752 1.55E–02 3.08E–02 0.00367289623 0.999 0.50868 4.01269 3.99704 0.49824 1.50711 1.56E–02 3.08E–02 0.00375329743 1.0146 0.51519 4.01294 3.99613 0.50398 1.50672 1.68E–02 3.26E–02 0.00383219863 1.032 0.51992 4.01329 3.99717 0.50917 1.50628 1.61E–02 3.10E–02 0.00392119983 1.0472 0.525 4.01367 3.99678 0.51374 1.50589 1.69E–02 3.22E–02 0.0039995
10103 1.0636 0.53057 4.01359 3.99681 0.51938 1.50548 1.68E–02 2.20E–07 7.19E–03 3.16E–02 0.004085410223 1.0798 0.53628 4.01368 3.99616 0.5246 1.50507 1.75E–02 2.11E–07 6.89E–03 3.27E–02 0.004170910343 1.0965 0.54115 4.01389 3.99616 0.52932 1.50465 1.77E–02 2.08E–07 6.82E–03 3.28E–02 0.004259710463 1.113 0.54656 4.0144 3.9972 0.53509 1.50423 1.72E–02 2.15E–07 7.06E–03 3.15E–02 0.004348410583 1.1294 0.55282 4.01483 3.99694 0.54089 1.50381 1.79E–02 2.07E–07 6.83E–03 3.24E–02 0.004437710703 1.1449 0.55805 4.01475 3.99668 0.54601 1.50342 1.81E–02 2.05E–07 6.81E–03 3.24E–02 0.004522810823 1.162 0.56155 4.01463 3.99697 0.54977 1.50299 1.77E–02 2.09E–07 7.00E–03 3.14E–02 0.004617510943 1.177 0.5673 4.01504 3.99707 0.55532 1.50261 1.80E–02 2.05E–07 6.92E–03 3.17E–02 0.004701911063 1.1943 0.57444 4.01556 3.99655 0.56177 1.50217 1.90E–02 1.94E–07 6.62E–03 3.31E–02 0.004799611183 1.2106 0.57888 4.01568 3.9972 0.56656 1.50176 1.85E–02 2.00E–07 6.89E–03 3.19E–02 0.004892511303 1.2268 0.58352 4.01573 3.99694 0.571 1.50134 1.88E–02 1.96E–07 6.83E–03 3.22E–02 0.004986

B. TAN ET AL.DATA REPORT: CONSOLIDATION AND STRENGTH CHARACTERISTICS 91
Table T24. CRS 508 consolidation data for Sample 204-1244B-4H-6WR, 120–125 cm.
Note: See Table T3, p. 70, for definitions of headers.
Time (s) ε (%) σv (ksc) u (ksc) σcell (ksc) σ’v (ksc) e dU (ksc) k (cm/s) cv (cm2/s) dU/σv Work
2365 0.0511 0.17141 4.01809 3.98787 0.15126 1.65718 3.02E–02 0.1762724 1.01E–042485 0.0694 0.1785 4.02008 3.9881 0.15718 1.65669 3.20E–02 0.1791397 1.29E–042605 0.0868 0.17838 4.01823 3.98765 0.15799 1.65623 3.06E–02 0.1714446 1.56E–042725 0.0991 0.18325 4.01719 3.98723 0.16327 1.65591 3.00E–02 0.163534 1.76E–042845 0.1135 0.19201 4.01783 3.98736 0.17169 1.65552 3.05E–02 0.1587251 2.00E–042965 0.1302 0.19782 4.01839 3.98723 0.17705 1.65508 3.12E–02 0.1575145 2.29E–043085 0.1452 0.20067 4.0183 3.98761 0.18021 1.65468 3.07E–02 0.1529169 2.56E–043205 0.1605 0.20582 4.01753 3.988 0.18614 1.65427 2.95E–02 0.1434737 2.84E–043325 0.1744 0.21191 4.01738 3.98531 0.19054 1.6539 3.21E–02 0.1513079 3.11E–043445 0.191 0.21832 4.01784 3.98453 0.19611 1.65346 3.33E–02 0.1525777 3.43E–043565 0.2087 0.22166 4.01834 3.98813 0.20152 1.65299 3.02E–02 0.1362921 3.78E–043685 0.2234 0.22462 4.01894 3.98761 0.20374 1.6526 3.13E–02 0.1394568 4.08E–043805 0.2377 0.22975 4.01861 3.98777 0.2092 1.65222 3.08E–02 0.1342124 4.37E–043925 0.2549 0.23391 4.01847 3.98761 0.21334 1.65176 3.09E–02 0.1319166 4.74E–044045 0.2719 0.23562 4.01792 3.98761 0.21542 1.65131 3.03E–02 0.1286103 5.10E–044165 0.2859 0.23998 4.01772 3.98777 0.22002 1.65094 2.99E–02 0.1247631 5.41E–044285 0.3015 0.24612 4.01816 3.98784 0.22591 1.65053 3.03E–02 1.19E–07 3.26E–03 0.1231862 5.76E–044405 0.3148 0.24915 4.01838 3.9881 0.22897 1.65017 3.03E–02 1.19E–07 3.28E–03 0.1214978 6.06E–044525 0.3335 0.25282 4.01856 3.98774 0.23228 1.64967 3.08E–02 1.17E–07 3.26E–03 0.1218739 6.49E–044645 0.3495 0.25917 4.0189 3.98736 0.23815 1.64925 3.15E–02 1.14E–07 3.26E–03 0.1217017 6.87E–044765 0.3651 0.26308 4.01949 3.98749 0.24174 1.64883 3.20E–02 1.13E–07 3.27E–03 0.1216683 7.25E–044885 0.3806 0.26712 4.01945 3.98787 0.24607 1.64842 3.16E–02 1.15E–07 3.35E–03 0.1182129 7.63E–045005 0.3982 0.26981 4.01944 3.98784 0.24875 1.64795 3.16E–02 1.14E–07 3.40E–03 0.1171026 8.06E–045125 0.413 0.27526 4.02001 3.98684 0.25315 1.64756 3.32E–02 1.09E–07 3.29E–03 0.1204988 8.44E–045245 0.4273 0.28229 4.02167 3.98787 0.25976 1.64718 3.38E–02 1.07E–07 3.24E–03 0.1197077 8.80E–045365 0.444 0.28942 4.0231 3.98784 0.26591 1.64674 3.53E–02 1.03E–07 3.11E–03 0.1218292 9.25E–045485 0.4618 0.29243 4.02324 3.98787 0.26885 1.64626 3.54E–02 1.03E–07 3.14E–03 0.1209466 9.72E–045605 0.4757 0.29627 4.02315 3.98758 0.27256 1.64589 3.56E–02 1.02E–07 3.13E–03 0.1200331 1.01E–035725 0.4915 0.30269 4.02356 3.98768 0.27878 1.64547 3.59E–02 1.01E–07 3.10E–03 0.1185256 1.05E–03
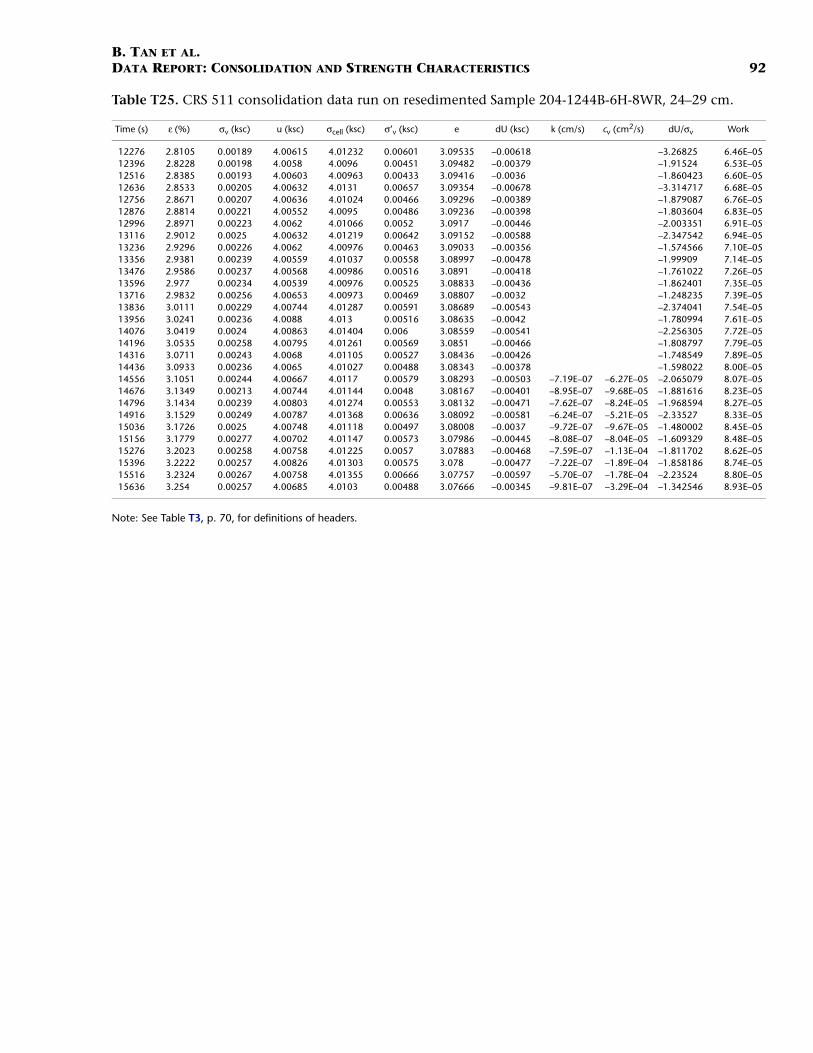
B. TAN ET AL.DATA REPORT: CONSOLIDATION AND STRENGTH CHARACTERISTICS 92
Table T25. CRS 511 consolidation data run on resedimented Sample 204-1244B-6H-8WR, 24–29 cm.
Note: See Table T3, p. 70, for definitions of headers.
Time (s) ε (%) σv (ksc) u (ksc) σcell (ksc) σ’v (ksc) e dU (ksc) k (cm/s) cv (cm2/s) dU/σv Work
12276 2.8105 0.00189 4.00615 4.01232 0.00601 3.09535 –0.00618 –3.26825 6.46E–0512396 2.8228 0.00198 4.0058 4.0096 0.00451 3.09482 –0.00379 –1.91524 6.53E–0512516 2.8385 0.00193 4.00603 4.00963 0.00433 3.09416 –0.0036 –1.860423 6.60E–0512636 2.8533 0.00205 4.00632 4.0131 0.00657 3.09354 –0.00678 –3.314717 6.68E–0512756 2.8671 0.00207 4.00636 4.01024 0.00466 3.09296 –0.00389 –1.879087 6.76E–0512876 2.8814 0.00221 4.00552 4.0095 0.00486 3.09236 –0.00398 –1.803604 6.83E–0512996 2.8971 0.00223 4.0062 4.01066 0.0052 3.0917 –0.00446 –2.003351 6.91E–0513116 2.9012 0.0025 4.00632 4.01219 0.00642 3.09152 –0.00588 –2.347542 6.94E–0513236 2.9296 0.00226 4.0062 4.00976 0.00463 3.09033 –0.00356 –1.574566 7.10E–0513356 2.9381 0.00239 4.00559 4.01037 0.00558 3.08997 –0.00478 –1.99909 7.14E–0513476 2.9586 0.00237 4.00568 4.00986 0.00516 3.0891 –0.00418 –1.761022 7.26E–0513596 2.977 0.00234 4.00539 4.00976 0.00525 3.08833 –0.00436 –1.862401 7.35E–0513716 2.9832 0.00256 4.00653 4.00973 0.00469 3.08807 –0.0032 –1.248235 7.39E–0513836 3.0111 0.00229 4.00744 4.01287 0.00591 3.08689 –0.00543 –2.374041 7.54E–0513956 3.0241 0.00236 4.0088 4.013 0.00516 3.08635 –0.0042 –1.780994 7.61E–0514076 3.0419 0.0024 4.00863 4.01404 0.006 3.08559 –0.00541 –2.256305 7.72E–0514196 3.0535 0.00258 4.00795 4.01261 0.00569 3.0851 –0.00466 –1.808797 7.79E–0514316 3.0711 0.00243 4.0068 4.01105 0.00527 3.08436 –0.00426 –1.748549 7.89E–0514436 3.0933 0.00236 4.0065 4.01027 0.00488 3.08343 –0.00378 –1.598022 8.00E–0514556 3.1051 0.00244 4.00667 4.0117 0.00579 3.08293 –0.00503 –7.19E–07 –6.27E–05 –2.065079 8.07E–0514676 3.1349 0.00213 4.00744 4.01144 0.0048 3.08167 –0.00401 –8.95E–07 –9.68E–05 –1.881616 8.23E–0514796 3.1434 0.00239 4.00803 4.01274 0.00553 3.08132 –0.00471 –7.62E–07 –8.24E–05 –1.968594 8.27E–0514916 3.1529 0.00249 4.00787 4.01368 0.00636 3.08092 –0.00581 –6.24E–07 –5.21E–05 –2.33527 8.33E–0515036 3.1726 0.0025 4.00748 4.01118 0.00497 3.08008 –0.0037 –9.72E–07 –9.67E–05 –1.480002 8.45E–0515156 3.1779 0.00277 4.00702 4.01147 0.00573 3.07986 –0.00445 –8.08E–07 –8.04E–05 –1.609329 8.48E–0515276 3.2023 0.00258 4.00758 4.01225 0.0057 3.07883 –0.00468 –7.59E–07 –1.13E–04 –1.811702 8.62E–0515396 3.2222 0.00257 4.00826 4.01303 0.00575 3.078 –0.00477 –7.22E–07 –1.89E–04 –1.858186 8.74E–0515516 3.2324 0.00267 4.00758 4.01355 0.00666 3.07757 –0.00597 –5.70E–07 –1.78E–04 –2.23524 8.80E–0515636 3.254 0.00257 4.00685 4.0103 0.00488 3.07666 –0.00345 –9.81E–07 –3.29E–04 –1.342546 8.93E–05

B. TAN ET AL.DATA REPORT: CONSOLIDATION AND STRENGTH CHARACTERISTICS 93
Table T26. CRS 563 consolidation data for Sample 204-1244B-4H-6WR, 134–137 cm.
Note: See Table T3, p. 70, for definitions of headers.
Time (s) ε (%) σv (ksc) u (ksc) σcell (ksc) σ’v (ksc) e dU (ksc) k (cm/s) cv (cm2/s) dU/σv Work
1634 0.121 0.55408 4.01031 3.9988 0.5464 1.7123 1.15E–02 2.08E–02 0.00082911754 0.1377 0.56074 4.0106 3.99854 0.5527 1.71184 1.21E–02 2.15E–02 0.00092111874 0.1544 0.5696 4.01077 3.99828 0.56127 1.71139 1.25E–02 2.19E–02 0.00101451994 0.1686 0.57676 4.01039 3.99816 0.5686 1.71101 1.22E–02 2.12E–02 0.00109452114 0.1883 0.57991 4.01052 3.99854 0.57192 1.71047 1.20E–02 2.07E–02 0.00120732234 0.1991 0.59086 4.01048 3.99854 0.5829 1.71018 1.19E–02 2.02E–02 0.00126972354 0.2148 0.59533 4.01056 3.99828 0.58715 1.70975 1.23E–02 2.06E–02 0.0013622474 0.2345 0.60021 4.01056 3.99841 0.59211 1.70921 1.21E–02 2.02E–02 0.00147822594 0.245 0.60998 4.01048 3.99867 0.6021 1.70893 1.18E–02 1.94E–02 0.00154092714 0.2657 0.61454 4.01103 3.99816 0.60596 1.70837 1.29E–02 2.09E–02 0.00166612834 0.2768 0.62366 4.0112 3.99867 0.61531 1.70807 1.25E–02 2.01E–02 0.00173442954 0.2942 0.62809 4.0112 3.99854 0.61966 1.70759 1.27E–02 2.01E–02 0.00184213074 0.313 0.63407 4.01124 3.99867 0.62569 1.70708 1.26E–02 1.98E–02 0.00195983194 0.3243 0.64402 4.0112 3.99841 0.6355 1.70678 1.28E–02 1.98E–02 0.00203113314 0.3441 0.64785 4.01149 3.99841 0.63913 1.70624 1.31E–02 2.02E–02 0.00215743434 0.3551 0.65643 4.01149 3.99893 0.64805 1.70594 1.26E–02 1.91E–02 0.00222853554 0.3727 0.66159 4.01124 3.99828 0.65295 1.70546 1.30E–02 1.96E–02 0.00234373674 0.3898 0.66583 4.01154 3.99867 0.65725 1.705 1.29E–02 8.00E–08 3.35E–03 1.93E–02 0.00245633794 0.4031 0.67801 4.01132 3.99828 0.66932 1.70464 1.30E–02 7.89E–08 3.31E–03 1.92E–02 0.00254463914 0.4229 0.68016 4.01145 3.99841 0.67147 1.7041 1.30E–02 7.91E–08 3.30E–03 1.92E–02 0.0026784034 0.4331 0.68778 4.01137 3.99854 0.67923 1.70382 1.28E–02 8.04E–08 3.36E–03 1.86E–02 0.00274724154 0.4499 0.69558 4.01175 3.99816 0.68652 1.70336 1.36E–02 7.58E–08 3.17E–03 1.95E–02 0.00286244274 0.4698 0.70137 4.01196 3.9988 0.6926 1.70283 1.32E–02 7.84E–08 3.25E–03 1.88E–02 0.0034394 0.4816 0.7079 4.01196 3.99893 0.69921 1.70251 1.30E–02 7.93E–08 3.30E–03 1.84E–02 0.00308244514 0.5016 0.71465 4.01196 3.99841 0.70562 1.70196 1.35E–02 7.63E–08 3.16E–03 1.90E–02 0.00322374634 0.5136 0.72182 4.012 3.99828 0.71268 1.70164 1.37E–02 7.54E–08 3.14E–03 1.90E–02 0.00330924754 0.5285 0.72665 4.012 3.99854 0.71768 1.70123 1.35E–02 7.68E–08 3.20E–03 1.85E–02 0.00341654874 0.5484 0.73437 4.01179 3.99841 0.72545 1.70069 1.34E–02 7.73E–08 3.18E–03 1.82E–02 0.00356114994 0.5615 0.73975 4.01187 3.99867 0.73095 1.70034 1.32E–02 7.85E–08 3.25E–03 1.78E–02 0.0036564
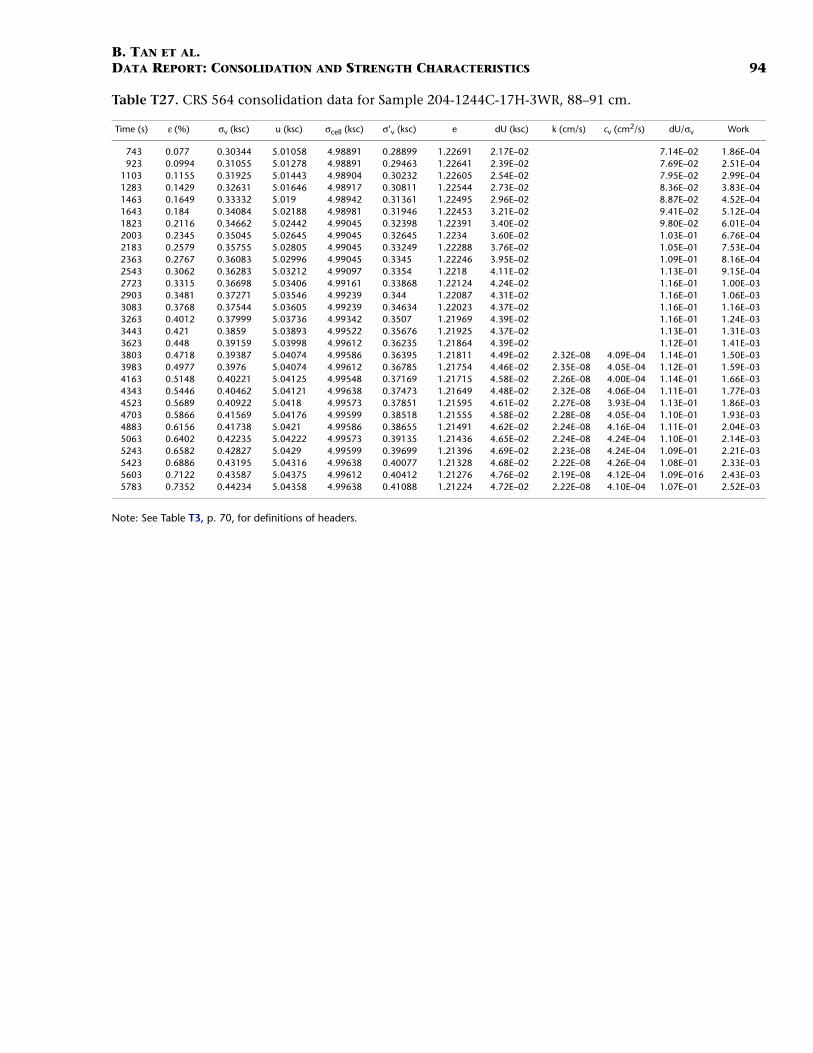
B. TAN ET AL.DATA REPORT: CONSOLIDATION AND STRENGTH CHARACTERISTICS 94
Table T27. CRS 564 consolidation data for Sample 204-1244C-17H-3WR, 88–91 cm.
Note: See Table T3, p. 70, for definitions of headers.
Time (s) ε (%) σv (ksc) u (ksc) σcell (ksc) σ’v (ksc) e dU (ksc) k (cm/s) cv (cm2/s) dU/σv Work
743 0.077 0.30344 5.01058 4.98891 0.28899 1.22691 2.17E–02 7.14E–02 1.86E–04923 0.0994 0.31055 5.01278 4.98891 0.29463 1.22641 2.39E–02 7.69E–02 2.51E–04
1103 0.1155 0.31925 5.01443 4.98904 0.30232 1.22605 2.54E–02 7.95E–02 2.99E–041283 0.1429 0.32631 5.01646 4.98917 0.30811 1.22544 2.73E–02 8.36E–02 3.83E–041463 0.1649 0.33332 5.019 4.98942 0.31361 1.22495 2.96E–02 8.87E–02 4.52E–041643 0.184 0.34084 5.02188 4.98981 0.31946 1.22453 3.21E–02 9.41E–02 5.12E–041823 0.2116 0.34662 5.02442 4.99045 0.32398 1.22391 3.40E–02 9.80E–02 6.01E–042003 0.2345 0.35045 5.02645 4.99045 0.32645 1.2234 3.60E–02 1.03E–01 6.76E–042183 0.2579 0.35755 5.02805 4.99045 0.33249 1.22288 3.76E–02 1.05E–01 7.53E–042363 0.2767 0.36083 5.02996 4.99045 0.3345 1.22246 3.95E–02 1.09E–01 8.16E–042543 0.3062 0.36283 5.03212 4.99097 0.3354 1.2218 4.11E–02 1.13E–01 9.15E–042723 0.3315 0.36698 5.03406 4.99161 0.33868 1.22124 4.24E–02 1.16E–01 1.00E–032903 0.3481 0.37271 5.03546 4.99239 0.344 1.22087 4.31E–02 1.16E–01 1.06E–033083 0.3768 0.37544 5.03605 4.99239 0.34634 1.22023 4.37E–02 1.16E–01 1.16E–033263 0.4012 0.37999 5.03736 4.99342 0.3507 1.21969 4.39E–02 1.16E–01 1.24E–033443 0.421 0.3859 5.03893 4.99522 0.35676 1.21925 4.37E–02 1.13E–01 1.31E–033623 0.448 0.39159 5.03998 4.99612 0.36235 1.21864 4.39E–02 1.12E–01 1.41E–033803 0.4718 0.39387 5.04074 4.99586 0.36395 1.21811 4.49E–02 2.32E–08 4.09E–04 1.14E–01 1.50E–033983 0.4977 0.3976 5.04074 4.99612 0.36785 1.21754 4.46E–02 2.35E–08 4.05E–04 1.12E–01 1.59E–034163 0.5148 0.40221 5.04125 4.99548 0.37169 1.21715 4.58E–02 2.26E–08 4.00E–04 1.14E–01 1.66E–034343 0.5446 0.40462 5.04121 4.99638 0.37473 1.21649 4.48E–02 2.32E–08 4.06E–04 1.11E–01 1.77E–034523 0.5689 0.40922 5.0418 4.99573 0.37851 1.21595 4.61E–02 2.27E–08 3.93E–04 1.13E–01 1.86E–034703 0.5866 0.41569 5.04176 4.99599 0.38518 1.21555 4.58E–02 2.28E–08 4.05E–04 1.10E–01 1.93E–034883 0.6156 0.41738 5.0421 4.99586 0.38655 1.21491 4.62E–02 2.24E–08 4.16E–04 1.11E–01 2.04E–035063 0.6402 0.42235 5.04222 4.99573 0.39135 1.21436 4.65E–02 2.24E–08 4.24E–04 1.10E–01 2.14E–035243 0.6582 0.42827 5.0429 4.99599 0.39699 1.21396 4.69E–02 2.23E–08 4.24E–04 1.09E–01 2.21E–035423 0.6886 0.43195 5.04316 4.99638 0.40077 1.21328 4.68E–02 2.22E–08 4.26E–04 1.08E–01 2.33E–035603 0.7122 0.43587 5.04375 4.99612 0.40412 1.21276 4.76E–02 2.19E–08 4.12E–04 1.09E–016 2.43E–035783 0.7352 0.44234 5.04358 4.99638 0.41088 1.21224 4.72E–02 2.22E–08 4.10E–04 1.07E–01 2.52E–03

B. TAN ET AL.DATA REPORT: CONSOLIDATION AND STRENGTH CHARACTERISTICS 95
Table T28. CRS 567 consolidation data for Sample 204-1244C-13H-3WR, 120–123 cm.
Note: See Table T3, p. 70, for definitions of headers.
Time (s) ε (%) σv (ksc) u (ksc) σcell (ksc) σ’v (ksc) e dU (ksc) k (cm/s) cv (cm2/s) dU/σv Work
75490 10.1836 14.2238 4.10356 3.99213 14.14951 1.0965 1.11E–01 7.83E–03 0.603018675790 10.225 14.29067 4.10432 3.99316 14.21656 1.09553 1.11E–01 7.78E–03 0.60956476090 10.2656 14.37876 4.10368 4.00049 14.30997 1.09458 1.03E–01 7.18E–03 0.616019176390 10.3086 14.44915 4.10377 3.99483 14.37652 1.09358 1.09E–01 7.54E–03 0.622885976690 10.3497 14.54936 4.10385 4.00191 14.4814 1.09262 1.02E–01 7.01E–03 0.629508976990 10.3912 14.64494 4.10495 3.99612 14.57239 1.09165 1.09E–01 7.43E–03 0.63622777290 10.4344 14.7348 4.10487 4.00011 14.66496 1.09064 1.04E–01 7.11E–03 0.643276377590 10.4743 14.79945 4.10567 4.01028 14.73586 1.08971 9.54E–02 6.45E–03 0.649831577890 10.5157 14.92899 4.08985 3.9047 14.80556 1.08874 1.85E–01 1.24E–02 0.656666978190 10.557 14.98098 4.07187 4.00114 14.93382 1.08778 7.07E–02 4.72E–03 0.66353378490 10.5973 15.05542 4.05276 4.00088 15.02084 1.08684 5.19E–02 3.45E–03 0.670284578790 10.6398 15.17515 4.04853 4.00088 15.14338 1.08585 4.76E–02 3.14E–03 0.677449179090 10.6809 15.2248 4.04777 4.00114 15.19372 1.08489 4.66E–02 3.06E–03 0.684423979390 10.7222 15.33715 4.04727 4.00104 15.30633 1.08392 4.62E–02 2.09E–08 4.67E–03 3.01E–03 0.691471879690 10.7631 15.4432 4.0482 4.00104 15.41176 1.08297 4.72E–02 2.06E–08 4.59E–03 3.05E–03 0.698511579990 10.8038 15.52424 4.04724 4.00133 15.49363 1.08202 4.59E–02 2.11E–08 4.83E–03 2.96E–03 0.705562680290 10.8444 15.60623 4.04635 3.99682 15.57321 1.08107 4.95E–02 1.97E–08 4.34E–03 3.17E–03 0.712645180590 10.8896 15.71925 4.04512 3.99721 15.68731 1.08002 4.79E–02 2.04E–08 4.22E–03 3.05E–03 0.720562680890 10.9288 15.79842 4.04533 3.99747 15.76651 1.0791 4.79E–02 2.03E–08 4.41E–03 3.03E–03 0.727482481190 10.9703 15.89222 4.04449 3.99811 15.8613 1.07813 4.64E–02 2.08E–08 4.27E–03 2.92E–03 0.734850481490 11.0118 15.93742 4.04555 3.99708 15.90511 1.07716 4.85E–02 1.99E–08 4.19E–03 3.04E–03 0.742268381790 11.0529 16.08716 4.04462 3.99721 16.05556 1.07621 4.74E–02 2.05E–08 4.44E–03 2.95E–03 0.749634582090 11.0938 16.10334 4.04618 3.99631 16.07009 1.07525 4.99E–02 1.94E–08 4.46E–03 3.10E–03 0.757031382390 11.1372 16.25922 4.04614 3.9976 16.22686 1.07424 4.85E–02 1.99E–08 4.33E–03 2.99E–03 0.764921782690 11.178 16.33727 4.04787 3.99644 16.30298 1.07328 5.14E–02 1.87E–08 3.96E–03 3.15E–03 0.772378382990 11.2181 16.45469 4.04593 3.99373 16.41989 1.07235 5.22E–02 1.85E–08 4.04E–03 3.17E–03 0.779775883290 11.2579 16.45224 4.04529 3.99296 16.41735 1.07142 5.23E–02 1.84E–08 3.90E–03 3.18E–03 0.787135983590 11.3015 16.60366 4.04436 3.99296 16.56939 1.0704 5.14E–02 1.88E–08 4.21E–03 3.09E–03 0.795237683890 11.3426 16.67682 4.04622 3.99322 16.64149 1.06944 5.30E–02 1.83E–08 4.08E–03 3.18E–03 0.802945

B. TAN ET AL.DATA REPORT: CONSOLIDATION AND STRENGTH CHARACTERISTICS 96
Table T29. CRS 569 consolidation data for Sample 204-1244C-9H-5WR, 105–108 cm.
Note: See Table T3, p. 70, for definitions of headers.
Time (s) ε (%) σv (ksc) u (ksc) σcell (ksc) σ’v (ksc) e dU (ksc) k (cm/s) cv (cm2/s) dU/σv Work
570 0.0779 0.31732 4.00207 3.99467 0.31239 1.50753 7.40E–03 2.33E–02 5.67E–05750 0.0997 0.33646 4.00164 3.99477 0.33188 1.50698 6.87E–03 2.04E–02 1.27E–04930 0.1188 0.35286 4.00199 3.99467 0.34798 1.50651 7.31E–03 2.07E–02 1.92E–04
1110 0.1407 0.36721 4.00207 3.99429 0.36202 1.50596 7.78E–03 2.12E–02 2.70E–041290 0.1608 0.38183 4.00211 3.99467 0.37687 1.50545 7.44E–03 1.95E–02 3.44E–041470 0.1834 0.39628 4.00231 3.99413 0.39082 1.50489 8.19E–03 2.07E–02 4.31E–041650 0.2012 0.41154 4.00186 3.99416 0.4064 1.50444 7.70E–03 1.87E–02 5.02E–041830 0.2268 0.42112 4.00231 3.99348 0.41523 1.5038 8.83E–03 2.10E–02 6.07E–042010 0.2446 0.44201 4.0019 3.99454 0.43711 1.50335 7.36E–03 1.66E–02 6.84E–042190 0.2689 0.44835 4.00254 3.99364 0.44243 1.50274 8.89E–03 1.98E–02 7.91E–042370 0.2901 0.4678 4.00224 3.99429 0.4625 1.50221 7.95E–03 1.70E–02 8.87E–042550 0.3121 0.47914 4.00258 3.99467 0.47387 1.50166 7.91E–03 1.65E–02 9.90E–042730 0.3328 0.49414 4.00279 3.99403 0.4883 1.50114 8.76E–03 1.77E–02 1.09E–032910 0.3565 0.50967 4.00321 3.99493 0.50414 1.50054 8.28E–03 1.63E–02 1.21E–033090 0.3753 0.52438 4.00397 3.99506 0.51844 1.50007 8.91E–03 1.70E–02 1.30E–033270 0.3998 0.53827 4.00472 3.99606 0.5325 1.49945 8.67E–03 1.61E–02 1.43E–033450 0.4208 0.55275 4.00575 3.99673 0.54674 1.49893 9.02E–03 1.63E–02 1.55E–033630 0.4448 0.5706 4.00672 3.99725 0.56429 1.49833 9.48E–03 1.66E–02 1.68E–033810 0.4651 0.5839 4.00723 3.99828 0.57793 1.49782 8.95E–03 1.09E–07 7.25E–03 1.53E–02 1.80E–033990 0.4892 0.59556 4.00765 3.99776 0.58897 1.49721 9.89E–03 9.90E–08 6.59E–03 1.66E–02 1.94E–034170 0.5116 0.6147 4.00778 3.99776 0.60802 1.49665 1.00E–02 9.81E–08 6.51E–03 1.63E–02 2.07E–034350 0.5337 0.62673 4.00837 3.99776 0.61965 1.49609 1.06E–02 9.27E–08 6.15E–03 1.69E–02 2.21E–034530 0.556 0.64289 4.00867 3.99841 0.63605 1.49553 1.03E–02 9.58E–08 6.39E–03 1.60E–02 2.35E–034710 0.5788 0.65806 4.00913 3.99879 0.65117 1.49496 1.03E–02 9.52E–08 6.39E–03 1.57E–02 2.50E–034890 0.6018 0.67332 4.00939 3.99892 0.66634 1.49439 1.05E–02 9.44E–08 6.40E–03 1.55E–02 2.65E–035070 0.6238 0.68968 4.0093 3.99905 0.68284 1.49383 1.03E–02 9.63E–08 6.55E–03 1.49E–02 2.80E–035250 0.6465 0.70234 4.00935 3.99879 0.69531 1.49326 1.06E–02 9.39E–08 6.36E–03 1.50E–02 2.96E–035430 0.6706 0.7177 4.00943 3.99866 0.71052 1.49266 1.08E–02 9.24E–08 6.29E–03 1.50E–02 3.13E–035610 0.6903 0.73569 4.01019 3.99879 0.72809 1.49216 1.14E–02 8.73E–08 5.99E–03 1.55E–02 3.27E–03

B. TAN ET AL.DATA REPORT: CONSOLIDATION AND STRENGTH CHARACTERISTICS 97
Table T30. CRS 577 consolidation data run on remolded sample.
Note: See Table T3, p. 70, for definitions of headers.
Time (s) ε (%) σv (ksc) u (ksc) σcell (ksc) σ’v (ksc) e dU (ksc) k (cm/s) cv (cm2/s) dU/σv Work
440 0.1291 0.0811 4.0358 4.00028 0.0574 1.32483 3.55E–02 0.4380359 –3.50E–06450 0.1303 0.0803 4.03482 3.99989 0.057 1.3248 3.49E–02 0.4350578 –2.78E–06460 0.1318 0.0795 4.03396 3.99963 0.0566 1.32476 3.43E–02 0.4320686 –1.93E–06463 0.1323 0.0791 4.03767 3.99937 0.0536 1.32475 3.83E–02 0.4839084 –1.65E–06703 0.1406 0.0957 4.04548 4.00208 0.06679 1.32456 4.34E–02 0.4533932 3.35E–06943 0.1757 0.11173 4.05499 4.00079 0.0756 1.32374 5.42E–02 0.485107 2.84E–05
1183 0.1986 0.11944 4.06348 4.00195 0.0784 1.32321 6.15E–02 0.5151413 4.60E–051423 0.2304 0.13422 4.06813 4.00092 0.0894 1.32247 6.72E–02 0.5007232 7.28E–051663 0.2594 0.13715 4.07269 4.00066 0.0891 1.32179 7.20E–02 0.5251867 9.88E–051903 0.2902 0.14895 4.07593 3.99731 0.0965 1.32108 7.86E–02 0.5278154 1.27E–042143 0.3201 0.1539 4.08092 4.00182 0.10117 1.32038 7.91E–02 0.5139831 1.57E–042383 0.3518 0.16294 4.08395 4.00182 0.10818 1.31964 8.21E–02 0.5040604 1.90E–042623 0.3827 0.16674 4.0877 3.99989 0.10819 1.31892 8.78E–02 0.5266714 2.24E–042863 0.4136 0.17657 4.08924 4.00195 0.11837 1.3182 8.73E–02 0.4943836 2.59E–043103 0.4464 0.17886 4.09248 4.00131 0.11807 1.31744 9.12E–02 0.5097782 2.98E–043343 0.4775 0.18694 4.09338 4.00066 0.12513 1.31672 9.27E–02 0.4959612 3.36E–043583 0.509 0.19022 4.09577 4.00182 0.12759 1.31598 9.39E–02 3.70E–08 6.24E–04 0.4938708 3.76E–043823 0.5418 0.19727 4.09692 4.00131 0.13353 1.31522 9.56E–02 3.65E–08 5.98E–04 0.4846725 4.19E–044063 0.5729 0.20081 4.09803 4.00169 0.13659 1.3145 9.63E–02 3.62E–08 5.82E–04 0.4797325 4.61E–044303 0.6058 0.20564 4.09901 4.00118 0.14042 1.31373 9.78E–02 3.58E–08 5.63E–04 0.4757345 5.07E–044543 0.6356 0.21157 4.10093 4.00156 0.14532 1.31304 9.94E–02 3.54E–08 5.34E–04 0.4696605 5.50E–044783 0.67 0.21839 4.10169 4.00156 0.15163 1.31224 1.00E–01 3.51E–08 5.30E–04 0.458505 6.01E–045023 0.701 0.21925 4.10323 4.00143 0.15139 1.31152 1.02E–01 3.46E–08 5.09E–04 0.4642795 6.49E–045263 0.7342 0.22738 4.10259 4.00195 0.16029 1.31074 1.01E–01 3.50E–08 5.21E–04 0.4426086 7.01E–045503 0.766 0.22798 4.10464 4.00118 0.15901 1.31 1.03E–01 3.42E–08 4.75E–04 0.4538157 7.52E–045743 0.7978 0.2368 4.10417 4.00156 0.1684 1.30926 1.03E–01 3.43E–08 4.91E–04 0.4332937 8.04E–045983 0.831 0.23808 4.10626 4.00079 0.16777 1.30849 1.05E–01 3.35E–08 4.70E–04 0.4429874 8.61E–046223 0.8622 0.24625 4.10587 4.00092 0.17628 1.30776 1.05E–01 3.36E–08 4.72E–04 0.426208 9.15E–046463 0.8957 0.24631 4.10784 4.00195 0.17572 1.30698 1.06E–01 3.34E–08 4.64E–04 0.429897 9.74E–04

B. TAN ET AL.DATA REPORT: CONSOLIDATION AND STRENGTH CHARACTERISTICS 98
Table T31. CRS 578 consolidation data for Sample 204-1244C-8H-7WR, 45–48 cm.
Note: See Table T3, p. 70, for definitions of headers.
Time (s) ε (%) σv (ksc) u (ksc) σcell (ksc) σ’v (ksc) e dU (ksc) k (cm/s) cv (cm2/s) dU/σv Work
1765 0.0155 0.1315 4.0126 3.99921 0.12257 1.57281 1.34E–02 0.101845 9.42E–052005 0.0448 0.13526 4.01299 4.00089 0.1272 1.57206 1.21E–02 8.95E–02 1.31E–042245 0.0747 0.13859 4.01388 4.00076 0.12984 1.57129 1.31E–02 9.47E–02 1.69E–042485 0.1054 0.14329 4.01431 3.99986 0.13366 1.5705 1.45E–02 1.01E–01 2.10E–042725 0.1343 0.14761 4.01478 4.00153 0.13878 1.56976 1.32E–02 8.98E–02 2.49E–042965 0.1636 0.15158 4.01482 4.00114 0.14246 1.569 1.37E–02 9.02E–02 2.90E–043205 0.1938 0.15491 4.01469 4.00101 0.14579 1.56823 1.37E–02 8.83E–02 3.34E–043445 0.2244 0.15983 4.01461 4.00101 0.15077 1.56744 1.36E–02 8.51E–02 3.79E–043685 0.2597 0.16092 4.01478 4.00101 0.15175 1.56653 1.38E–02 8.55E–02 4.33E–043925 0.2851 0.16867 4.01486 4.00076 0.15927 1.56588 1.41E–02 8.36E–02 4.72E–044165 0.3154 0.17122 4.01486 4.00127 0.16216 1.5651 1.36E–02 7.93E–02 5.21E–044405 0.3448 0.17537 4.01465 4.00037 0.16585 1.56434 1.43E–02 6.97E–08 9.13E–04 8.14E–02 5.70E–044645 0.3763 0.17925 4.01444 4.00024 0.16979 1.56353 1.42E–02 7.00E–08 9.55E–04 7.92E–02 6.23E–044885 0.4081 0.1817 4.01452 4.00101 0.1727 1.56271 1.35E–02 7.36E–08 1.02E–03 7.43E–02 6.77E–045125 0.4377 0.18731 4.01448 4.00063 0.17808 1.56195 1.39E–02 7.24E–08 1.02E–03 7.40E–02 7.30E–045365 0.4694 0.19119 4.01482 4.0005 0.18164 1.56113 1.43E–02 6.98E–08 1.01E–03 7.49E–02 7.87E–045605 0.4991 0.19647 4.01478 4.00101 0.18729 1.56037 1.38E–02 7.22E–08 1.10E–03 7.01E–02 8.42E–045845 0.5295 0.20103 4.01499 4.0005 0.19137 1.55959 1.45E–02 6.85E–08 1.06E–03 7.21E–02 9.00E–046085 0.5597 0.20541 4.01499 4.0005 0.19575 1.55881 1.45E–02 6.86E–08 1.05E–03 7.06E–02 9.59E–046325 0.5896 0.21014 4.01529 4.00101 0.20063 1.55804 1.43E–02 6.96E–08 1.12E–03 6.79E–02 1.02E–036565 0.6197 0.21557 4.01525 4.00114 0.20616 1.55727 1.41E–02 7.05E–08 1.15E–03 6.54E–02 1.08E–036805 0.6516 0.21916 4.01512 4.00179 0.21027 1.55645 1.33E–02 7.47E–08 1.25E–03 6.08E–02 1.15E–037045 0.6818 0.2246 4.01521 4.00037 0.21471 1.55567 1.48E–02 6.75E–08 1.14E–03 6.61E–02 1.21E–037285 0.7121 0.23152 4.01533 4.00089 0.22189 1.55489 1.44E–02 6.93E–08 1.20E–03 6.24E–02 1.28E–037525 0.742 0.23649 4.01546 4.00076 0.22668 1.55412 1.47E–02 6.79E–08 1.21E–03 6.22E–02 1.35E–037765 0.7735 0.24118 4.01542 4.0014 0.23183 1.55331 1.40E–02 7.09E–08 1.29E–03 5.81E–02 1.42E–038005 0.8052 0.24655 4.01538 4.00166 0.23741 1.55249 1.37E–02 7.26E–08 1.32E–03 5.56E–02 1.49E–038245 0.8346 0.25225 4.01546 4.00101 0.24262 1.55174 1.44E–02 6.91E–08 1.23E–03 5.73E–02 1.56E–038485 0.8641 0.25882 4.01515 4.00111 0.24946 1.55098 1.40E–02 7.12E–08 1.31E–03 5.42E–02 1.64E–03

B. TAN ET AL.DATA REPORT: CONSOLIDATION AND STRENGTH CHARACTERISTICS 99
Table T32. CRS 580 consolidation data for Sample 204-1244B-1H-4WR, 125–128 cm.
Note: See Table T3, p. 70, for definitions of headers.
Time (s) ε (%) σv (ksc) u (ksc) σcell (ksc) σ’v (ksc) e dU (ksc) k (cm/s) cv (cm2/s) dU/σv Work
547 0.1584 0.169 4.00776 3.99976 0.16366 1.50461 8.01E–03 4.74E–02 2.85E–05847 0.1896 0.18431 4.00845 3.99976 0.17852 1.50382 8.69E–03 4.71E–02 8.20E–05
1147 0.2232 0.19625 4.00896 4.00002 0.19029 1.50298 8.94E–03 4.56E–02 1.44E–041447 0.2591 0.20745 4.00909 4.00079 0.20192 1.50208 8.30E–03 4.00E–02 2.15E–041747 0.2955 0.21684 4.00921 4.00053 0.21105 1.50117 8.68E–03 4.00E–02 2.90E–042047 0.3334 0.22669 4.00887 4.00053 0.22112 1.50022 8.34E–03 3.68E–02 3.72E–042347 0.3697 0.23512 4.00845 3.99989 0.22942 1.4993 8.56E–03 3.64E–02 4.54E–042647 0.4108 0.23909 4.00806 3.9995 0.23338 1.49827 8.56E–03 3.58E–02 5.50E–042947 0.4449 0.25122 4.00764 3.99924 0.24562 1.49742 8.39E–03 3.34E–02 6.32E–043247 0.4842 0.25915 4.00759 3.99847 0.25307 1.49643 9.12E–03 3.52E–02 7.30E–043547 0.5219 0.2679 4.00708 3.99847 0.26216 1.49549 8.61E–03 3.21E–02 8.28E–043847 0.5605 0.27634 4.00704 3.99783 0.2702 1.49452 9.21E–03 3.33E–02 9.31E–044147 0.5969 0.28714 4.00734 3.99821 0.28105 1.49361 9.12E–03 3.18E–02 1.03E–034447 0.6351 0.29775 4.00806 3.99912 0.29178 1.49265 8.95E–03 3.01E–02 1.14E–034747 0.6729 0.30795 4.00845 3.99963 0.30207 1.4917 8.82E–03 2.86E–02 1.25E–035047 0.7106 0.31725 4.00866 3.99963 0.31123 1.49075 9.03E–03 2.85E–02 1.37E–035347 0.7499 0.32577 4.00875 4.00027 0.32012 1.48977 8.47E–03 1.14E–07 2.86E–03 2.60E–02 1.50E–035647 0.7885 0.33516 4.0093 4.00002 0.32897 1.4888 9.28E–03 1.04E–07 2.71E–03 2.77E–02 1.62E–035947 0.8276 0.34581 4.00994 4.00079 0.33971 1.48782 9.15E–03 1.05E–07 2.87E–03 2.65E–02 1.75E–036247 0.8657 0.35716 4.01032 4.00118 0.35106 1.48686 9.15E–03 1.04E–07 3.00E–03 2.56E–02 1.89E–036547 0.9036 0.36892 4.01062 4.0004 0.36211 1.48591 1.02E–02 9.36E–08 2.67E–03 2.77E–02 2.02E–036847 0.9427 0.37958 4.01062 4.00118 0.37328 1.48493 9.45E–03 1.02E–07 2.81E–03 2.49E–02 2.17E–037147 0.9796 0.39111 4.01071 4.00105 0.38467 1.48401 9.66E–03 1.00E–07 2.55E–03 2.47E–02 2.31E–037447 1.02 0.39986 4.01066 4.00105 0.39345 1.48299 9.62E–03 1.01E–07 2.44E–03 2.41E–02 2.47E–037747 1.0601 0.40957 4.01011 4.00143 0.40378 1.48199 8.68E–03 1.13E–07 2.62E–03 2.12E–02 2.63E–038047 1.0988 0.41582 4.01011 4.00079 0.4096 1.48102 9.32E–03 1.06E–07 2.43E–03 2.24E–02 2.79E–038347 1.1378 0.42657 4.00998 4.00131 0.42078 1.48004 8.68E–03 1.13E–07 2.76E–03 2.03E–02 2.95E–038647 1.1788 0.43582 4.01045 4.00143 0.42981 1.47901 9.02E–03 1.09E–07 2.80E–03 2.07E–02 3.13E–038947 1.2181 0.44644 4.01066 4.00079 0.43986 1.47802 9.88E–03 9.88E–08 2.73E–03 2.21E–02 3.30E–03

B. TAN ET AL.DATA REPORT: CONSOLIDATION AND STRENGTH CHARACTERISTICS 100
Table T33. CRS 584 consolidation data for Sample 204-1244B-6H-8WR, 6–9 cm.
Note: See Table T3, p. 70, for definitions of headers.
Time (s) ε (%) σv (ksc) u (ksc) σcell (ksc) σ’v (ksc) e dU (ksc) k (cm/s) cv (cm2/s) dU/σv Work
300 0.161 0.33695 4.00299 3.9968 0.33283 1.61455 6.19E–03 1.84E–02 3.31E–05310 0.1614 0.33859 4.00316 3.9968 0.33435 1.61454 6.36E–03 1.88E–02 3.46E–05320 0.1613 0.34083 4.00334 3.99668 0.33639 1.61454 6.66E–03 1.95E–02 3.40E–05330 0.1614 0.34297 4.00359 3.9968 0.33845 1.61454 6.79E–03 1.98E–02 3.46E–05340 0.1622 0.34516 4.00393 3.9968 0.34041 1.61452 7.13E–03 2.07E–02 3.74E–05350 0.1633 0.34735 4.0044 3.9968 0.34228 1.61449 7.60E–03 2.19E–02 4.11E–05360 0.163 0.35003 4.00491 3.99693 0.34471 1.6145 7.98E–03 2.28E–02 4.00E–05370 0.1645 0.35267 4.00551 3.99719 0.34713 1.61446 8.32E–03 2.36E–02 4.51E–05380 0.1645 0.35536 4.00611 3.99732 0.3495 1.61446 8.79E–03 2.47E–02 4.53E–05390 0.1658 0.3581 4.00666 3.99732 0.35187 1.61442 9.34E–03 2.61E–02 4.96E–05400 0.1676 0.36069 4.00722 3.99771 0.35435 1.61438 9.51E–03 2.64E–02 5.61E–05410 0.1689 0.36279 4.00781 3.99796 0.35622 1.61434 9.85E–03 2.72E–02 6.07E–05420 0.1705 0.36488 4.00841 3.99822 0.35809 1.6143 1.02E–02 2.79E–02 6.66E–05430 0.1719 0.36643 4.00905 3.99848 0.35938 1.61426 1.06E–02 2.89E–02 7.15E–05443 0.1738 0.36843 4.00995 3.99899 0.36113 1.61421 1.10E–02 2.97E–02 7.83E–05743 0.2079 0.38901 4.01076 4.00106 0.38254 1.61332 9.70E–03 2.49E–02 2.05E–04
1043 0.2459 0.4072 4.00999 4.00067 0.40099 1.61233 9.32E–03 2.29E–02 3.55E–041343 0.2847 0.42118 4.00868 3.99671 0.4132 1.61131 1.20E–02 2.84E–02 5.13E–041643 0.3221 0.43535 4.00798 3.99693 0.42799 1.61033 1.11E–02 2.54E–02 6.71E–041943 0.3591 0.45042 4.00914 3.99912 0.44375 1.60936 1.00E–02 2.22E–02 8.33E–042243 0.3986 0.46339 4.01043 4.00096 0.45708 1.60833 9.47E–03 1.01E–07 3.55E–03 2.04E–02 1.01E–032543 0.437 0.47716 4.01068 4.0007 0.4705 1.60732 9.98E–03 9.56E–08 3.32E–03 2.09E–02 1.19E–032843 0.4768 0.48911 4.01064 3.99941 0.48162 1.60628 1.12E–02 8.52E–08 2.85E–03 2.30E–02 1.38E–033143 0.5099 0.50324 4.0106 3.99967 0.49595 1.60541 1.09E–02 8.77E–08 2.83E–03 2.17E–02 1.54E–033443 0.5482 0.51394 4.01094 4.00031 0.50686 1.60441 1.06E–02 9.07E–08 2.90E–03 2.07E–02 1.74E–033743 0.589 0.52616 4.01131 3.9999 0.51855 1.60334 1.14E–02 8.58E–08 2.63E–03 2.17E–02 1.95E–034043 0.6278 0.53668 4.01128 4.00096 0.5298 1.60232 1.03E–02 9.70E–08 2.89E–03 1.92E–02 2.15E–034343 0.6672 0.55008 4.01175 4.00018 0.54237 1.60129 1.16E–02 8.67E–08 2.60E–03 2.10E–02 2.36E–034643 0.7078 0.56124 4.01081 4.00109 0.55476 1.60023 9.73E–03 1.03E–07 3.07E–03 1.73E–02 2.59E–03

B. TAN ET AL.DATA REPORT: CONSOLIDATION AND STRENGTH CHARACTERISTICS 101
Table T34. CRS 585 consolidation data for Sample 204-1244B-3H-3WR, 120–123 cm.
Note: See Table T3, p. 70, for definitions of headers.
Time (s) ε (%) σv (ksc) u (ksc) σcell (ksc) σ’v (ksc) e dU (ksc) k (cm/s) cv (cm2/s) dU/σv Work
390 0.1107 0.14941 3.99723 3.99346 0.14689 1.43007 3.78E–03 2.53E–02 –4.58E–05400 0.1067 0.15369 3.99881 3.99372 0.15029 1.43017 5.10E–03 3.32E–02 –5.18E–05410 0.1078 0.15738 4.00026 3.9941 0.15327 1.43014 6.16E–03 3.91E–02 –5.01E–05420 0.1063 0.1613 4.00167 3.99385 0.15608 1.43018 7.82E–03 4.85E–02 –5.23E–05430 0.1013 0.16499 4.00316 3.99423 0.15903 1.4303 8.93E–03 5.41E–02 –6.03E–05440 0.1086 0.16679 4.00478 3.99681 0.16147 1.43012 7.98E–03 4.78E–02 –4.85E–05450 0.1083 0.17034 4.00641 3.99758 0.16445 1.43013 8.82E–03 5.18E–02 –4.92E–05460 0.1079 0.17248 4.0079 3.99771 0.16569 1.43014 1.02E–02 5.91E–02 –4.97E–05470 0.1085 0.17484 4.00926 3.99874 0.16782 1.43013 1.05E–02 6.02E–02 –4.87E–05480 0.1109 0.17651 4.01071 4.00016 0.16948 1.43007 1.06E–02 5.98E–02 –4.48E–05494 0.1106 0.17892 4.01276 4.00106 0.17112 1.43007 1.17E–02 6.54E–02 –4.51E–05794 0.1347 0.20275 4.01502 4.0017 0.19387 1.42949 1.33E–02 6.57E–02 –1.11E–06
1094 0.1651 0.2234 4.01639 4.00209 0.21386 1.42875 1.43E–02 6.40E–02 6.08E–051394 0.1985 0.23735 4.01622 4.00132 0.22742 1.42794 1.49E–02 6.28E–02 1.35E–041694 0.2327 0.24831 4.01579 3.99823 0.2366 1.4271 1.76E–02 7.07E–02 2.14E–041994 0.2791 0.26191 4.016 4.00145 0.25221 1.42598 1.46E–02 5.56E–02 3.28E–042294 0.3165 0.27431 4.01673 4.00196 0.26446 1.42507 1.48E–02 6.71E–08 1.96E–03 5.38E–02 4.25E–042594 0.3543 0.28599 4.01707 3.9999 0.27455 1.42415 1.72E–02 5.76E–08 1.66E–03 6.00E–02 5.27E–042894 0.3917 0.29646 4.01711 4.00119 0.28585 1.42324 1.59E–02 6.08E–08 1.70E–03 5.37E–02 6.32E–043194 0.4307 0.30608 4.01651 4.00183 0.29629 1.42229 1.47E–02 6.63E–08 1.79E–03 4.80E–02 7.46E–043494 0.4664 0.31489 4.01651 4.00016 0.30398 1.42142 1.64E–02 5.97E–08 1.61E–03 5.19E–02 8.54E–043794 0.5061 0.32695 4.01639 4.00157 0.31708 1.42045 1.48E–02 6.63E–08 1.82E–03 4.53E–02 9.78E–044094 0.545 0.33644 4.0169 4.00106 0.32588 1.41951 1.58E–02 6.20E–08 1.70E–03 4.71E–02 1.10E–034394 0.5834 0.34692 4.01737 4.0008 0.33588 1.41857 1.66E–02 5.96E–08 1.62E–03 4.78E–02 1.23E–034694 0.6215 0.36011 4.01754 3.99913 0.34783 1.41765 1.84E–02 5.35E–08 1.41E–03 5.11E–02 1.36E–034994 0.6596 0.36747 4.01775 4.00145 0.3566 1.41672 1.63E–02 6.04E–08 1.60E–03 4.44E–02 1.50E–035294 0.6989 0.37755 4.01737 4.0008 0.36651 1.41576 1.66E–02 5.96E–08 1.56E–03 4.39E–02 1.64E–035594 0.7374 0.38752 4.01745 4.00196 0.37719 1.41483 1.55E–02 6.39E–08 1.64E–03 4.00E–02 1.78E–035894 0.7759 0.39865 4.01724 4.00145 0.38812 1.41389 1.58E–02 6.30E–08 1.64E–03 3.96E–02 1.93E–03

B. TAN ET AL.DATA REPORT: CONSOLIDATION AND STRENGTH CHARACTERISTICS 102
Table T35. CRS 608 consolidation data for Sample 204-1244B-1H-4WR, 126–129 cm.
Note: See Table T3, p. 70, for definitions of headers.
Time (s) ε (%) σv (ksc) u (ksc) σcell (ksc) σ’v (ksc) e dU (ksc) k (cm/s) cv (cm2/s) dU/σv Work
160 0.122 0.0327 4.00199 3.99936 0.03094 1.41526 2.63E–03 8.05E–02 –2.64E–05166 0.115 0.0346 4.00272 4.00013 0.0329 1.41543 2.58E–03 7.47E–02 –2.87E–05466 0.1214 0.0449 4.00345 4.00039 0.0429 1.41527 3.05E–03 6.80E–02 –2.62E–05766 0.1408 0.0558 4.00468 4.00052 0.053 1.4148 4.16E–03 7.46E–02 –1.69E–05
1066 0.1625 0.0667 4.00686 4.00052 0.0625 1.41428 6.34E–03 9.50E–02 –4.39E–061366 0.1891 0.0755 4.00899 4.00052 0.0698 1.41363 8.47E–03 1.12E–01 1.33E–051666 0.2184 0.08287 4.01023 4.00129 0.0769 1.41293 8.93E–03 1.08E–01 3.48E–051966 0.2487 0.0896 4.011 4.00091 0.08285 1.41219 1.01E–02 1.13E–01 5.90E–052266 0.2837 0.0949 4.01095 4.00117 0.0884 1.41135 9.79E–03 1.03E–01 8.92E–052566 0.3163 0.10042 4.01074 4.00117 0.094 1.41056 9.57E–03 9.53E–02 1.19E–042866 0.3515 0.10608 4.00848 4.00065 0.10086 1.40971 7.83E–03 7.38E–02 1.53E–043166 0.383 0.11432 4.00835 3.98996 0.10206 1.40894 1.84E–02 1.61E–01 1.85E–043466 0.423 0.11834 4.00831 4.00001 0.11281 1.40798 8.30E–03 7.01E–02 2.29E–043766 0.4582 0.12427 4.01027 4.00026 0.1176 1.40713 1.00E–02 8.05E–02 2.69E–044066 0.495 0.1296 4.0101 4.00065 0.1233 1.40624 9.45E–03 1.04E–07 1.56E–03 7.29E–02 3.14E–044366 0.5442 0.13461 4.01006 4.00039 0.12817 1.40505 9.66E–03 1.00E–07 1.53E–03 7.18E–02 3.76E–044666 0.5683 0.14113 4.00997 4.00052 0.13483 1.40446 9.45E–03 1.03E–07 1.56E–03 6.70E–02 4.08E–044966 0.6166 0.1461 4.01027 4.00039 0.13952 1.4033 9.88E–03 9.63E–08 1.53E–03 6.76E–02 4.75E–045266 0.6435 0.15253 4.01031 4.00078 0.14617 1.40265 9.53E–03 1.02E–07 1.66E–03 6.25E–02 5.13E–045566 0.6802 0.1579 4.01027 4.00104 0.15175 1.40176 9.23E–03 1.04E–07 1.74E–03 5.85E–02 5.68E–045866 0.7187 0.16411 4.01014 4.00052 0.15769 1.40083 9.62E–03 1.01E–07 1.82E–03 5.86E–02 6.28E–046166 0.7675 0.17053 4.01031 4.00091 0.16426 1.39965 9.41E–03 1.04E–07 1.90E–03 5.52E–02 7.07E–046466 0.7928 0.17883 4.01061 4.00065 0.17219 1.39903 9.96E–03 9.84E–08 1.79E–03 5.57E–02 7.50E–046766 0.839 0.18594 4.01083 4.00065 0.17916 1.39792 1.02E–02 9.39E–08 1.82E–03 5.47E–02 8.32E–047066 0.8668 0.19291 4.01061 4.00104 0.18653 1.39725 9.58E–03 1.03E–07 1.91E–03 4.96E–02 8.83E–047366 0.9056 0.19907 4.01044 4.00065 0.19254 1.39631 9.79E–03 9.90E–08 1.87E–03 4.92E–02 9.58E–047666 0.9437 0.20663 4.01014 4.00091 0.20048 1.39539 9.23E–03 1.09E–07 2.02E–03 4.47E–02 1.03E–037966 0.9932 0.21284 4.01031 4.00039 0.20622 1.39419 9.92E–03 9.99E–08 1.96E–03 4.66E–02 1.13E–038266 1.0202 0.2209 4.0107 4.00078 0.21429 1.39354 9.92E–03 9.88E–08 2.00E–03 4.49E–02 1.19E–03

B. TAN ET AL.DATA REPORT: CONSOLIDATION AND STRENGTH CHARACTERISTICS 103
Table T36. CKoU test conditions and results for consolidation stage.
Notes: See Table T3, p. 70, for explanation of headings. Marker = location in tube. 1 kg/cm2 = 98.06 kPa.
Table T36 (continued).
Test number
Index tests Specimen data Conditions
wc (%) wp (%) wl (%) wn Ip ρt ei Si (%) Gs σ′i εa (%) ub B (%) εvol (%)
TX 643 58.0 32 71 58.99 39 1.671 1.458 104.52 2.58 0.19 0.32 3.32 99 –1.12TX 642 63.6 37 82 64.52 45 1.633 1.595 104.19 2.58 0.18 0.23 3.5 98 –1TX 635 64.5 42 87 65.22 45 1.651 1.624 105.3 2.62 1.17 0.33 7 103 –6.08TX 645 61.8 42 87 63.8 45 1.598 1.686 99.17 2.62 0.21 0.45 3.3 99 –3.01TX 646 49.7 38 83 54.18 45 1.642 1.477 96.76 2.64 0.25 0.42 2.96 98 –4.78TX 636 49.1 35 77 49.34 43 1.814 1.181 110.71 2.65 1.29 –3.4 7.84 98 –0.92TX 641 34.0 34.0 1.855 0.914 98.54 2.65 0.32 0.33 3.18 99 –3.35TX 644 70.1 70.2 1.605 1.853 101.94 2.69 0.09 0.44 3.5 98 –1.15TX 647 58.1 58.81 1.625 1.631 97.06 2.69 0.14 0.58 2.86 105 –0.5TX 650 71.2 70.56 1.573 1.918 99 2.69 0.12 0.26 3.31 98 –0.26
Test number
Consolidation results
General At maximum stress At preshear
σ′p δε/δt Cc εa (%) εvol (%) σ′vm Kc ts εa (%) εvol (%) Kc σ′vc OCR ts
TX 643 1.73 0.20 0.496 10.45 10.50 3.34 0.464 ~24 10.45 10.50 0.464 3.34 1.00 ~24TX 642 2.78 0.20 0.601 11.72 11.90 4.61 0.454 ~34 11.72 11.90 0.454 4.61 1.00 ~34TX 635 5.02 0.20 0.691 22.63 22.79 22.95 0.566 ~51 22.63 22.79 0.566 22.95 1.00 ~51TX 645 4.35 0.20 0.712 15.91 16.12 8.56 0.503 ~23 15.91 16.12 0.503 8.56 1.00 ~23TX 646 8.04 0.20 0.698 16.95 17.13 16.3 0.506 ~28 16.95 17.13 0.506 16.3 1.00 ~28TX 636 — 0.20 0.448 23.12 23.55 42.2 0.52 ~31 23.12 23.55 0.52 42.2 1.00 ~31TX 641 — 0.20 0.2 8.88 9.07 10.4 0.454 ~37 8.88 9.07 0.454 10.4 1.00 ~37TX 644 — 0.20 0.462 10.81 10.86 1.11 0.457 ~24 10.81 10.86 0.457 1.11 1.00 ~24TX 647 — 0.20 0.384 10.93 11.00 1.73 0.491 ~25 10.54 10.64 0.666 0.86 2.00 ~24TX 650 — 0.20 0.469 10.93 11.06 0.58 0.514 ~40 10.93 11.06 0.514 0.58 1.00 ~40

B. TAN ET AL.DATA REPORT: CONSOLIDATION AND STRENGTH CHARACTERISTICS 104
Table T37. CKoU test conditions and results for undrained shearing stage.
Note: See Table T3, p. 70, for explanation of headings.
Table T37 (continued).
Test number
Specimen data Conditions
wn Ip ρt ei Si (%) Gs δε/δt ec Kc σ′vc OCR
TX 643 58.99 39 1.671 1.458 104.5 2.58 0.5 1.20 0.464 3.34 1.00TX 643 58.99 39 1.671 1.458 104.5 2.58 0.5 1.20 0.464 3.34 1.00TX 642 64.52 45 1.633 1.595 104.2 2.58 0.5 1.29 0.454 4.61 1.00TX 635 65.22 45 1.651 1.624 105.3 2.62 0.5 1.02 0.566 22.95 1.00TX 645 63.80 45 1.598 1.686 99.2 2.62 0.5 1.25 0.503 8.56 1.00TX 645 63.80 45 1.598 1.686 99.2 2.62 0.5 1.25 0.503 8.56 1.00TX 646 54.18 45 1.642 1.477 96.8 2.64 0.5 1.05 0.506 16.3 1.00
Test number
Consolidation results
At maximum shear At maximum obliquity
εa q/σ′vc Δue/σ′vc Δus/σ′vc p′/σ′vc q/p′ (%) f′ A εa q/σ′vc Δue/σ′vc Δus/σ′vc p′/σ′vc q/p′ f′ A
TX 643 1.63 0.343 0.160 0.111 0.647 0.530 32.0 1.091 7.44 0.325 0.226 0.190 0.563 0.577 35.3 2.03TX 643 –6.44 –0.201 0.010 0.325 0.252 –0.798 –53.1 –6.44 –0.201 0.010 0.325 0.252 –0.798 –53.1TX 642 0.86 0.347 0.124 0.075 0.676 0.513 30.9 0.837 7.18 0.314 0.234 0.207 0.533 0.589 36.1 2.85TX 635 1.56 0.314 0.201 0.137 0.673 0.467 27.8 1.060 10.39 0.282 0.333 0.290 0.509 0.554 33.6 2.63TX 645 1.25 0.319 0.171 0.123 0.000 0.490 29.4 1.190 4.03 0.307 0.254 0.215 0.555 0.553 33.6 2.15TX 645 –12.15 0.232 –0.052 0.267 0.324 –0.716 –45.3 –12.15 –0.232 –0.052 0.267 0.324 –0.716 –45.3TX 646 0.97 0.309 0.132 0.091 0.681 0.454 27.0 1.070 8.88 0.267 0.273 0.260 0.498 0.536 32.4 6.72

B. T
AN
ET A
L.D
AT
A R
EP
OR
T: CO
NSO
LID
AT
ION
AN
D S
TR
EN
GT
H C
HA
RA
CT
ER
ISTIC
S1
05
Table cm.
Note: Se
Time (s) (cm2) ub (ksc)
Axial membrane correction
Radial membrane correction
Axial drainage
correction
0 .191 7.074 0.000 0.000 0.000300 .192 7.069 0.000 0.000 0.000600 .192 7.085 0.001 0.000 0.000900 .192 7.081 0.001 0.000 0.000
1200 .192 7.076 0.002 0.000 0.0001463 .192 7.077 0.002 0.000 0.0001943 .192 7.078 0.003 0.000 0.0002423 .192 7.073 0.003 0.001 0.0002903 .192 7.077 0.004 0.001 0.0003383 .192 7.080 0.005 0.001 0.0003863 .192 7.079 0.005 0.001 0.0004343 .192 7.077 0.006 0.001 0.0004823 .192 7.080 0.007 0.001 0.0005303 .192 7.076 0.007 0.001 0.0005783 .192 7.073 0.008 0.002 0.0006263 .192 7.078 0.009 0.002 0.0006743 .192 7.076 0.009 0.002 0.0007223 .192 7.076 0.010 0.002 0.0007703 .192 7.073 0.011 0.002 0.0008183 .192 7.077 0.011 0.002 0.0008663 .192 7.079 0.012 0.002 0.0009143 .192 7.077 0.013 0.002 0.0009623 .192 7.078 0.013 0.003 0.000
10103 .192 7.077 0.014 0.003 0.00010583 .192 7.080 0.015 0.003 0.00011063 .192 7.076 0.015 0.003 0.00011543 .192 7.076 0.016 0.003 0.000
T38. TX 635 consolidation data for Sample 204-1244B-4H-6WR, 135–145
e Table T3, p. 70, for explanation of headings.
εa (%) σ’v (ksc) σ’h (ksc) p’ (ksc) q (ksc) εv (%) e K Work Area
0.010 1.175 1.011 1.093 0.082 0.001 1.624 0.860 0.000 100.019 1.152 0.980 1.066 0.086 0.004 1.623 0.851 0.000 100.032 1.205 1.012 1.109 0.097 0.011 1.623 0.839 0.000 100.044 1.230 1.024 1.127 0.103 0.027 1.623 0.833 0.000 100.057 1.250 1.031 1.140 0.110 0.040 1.622 0.824 0.000 100.069 1.266 1.034 1.150 0.116 0.051 1.622 0.817 0.001 100.089 1.290 1.041 1.165 0.125 0.071 1.622 0.807 0.001 100.110 1.314 1.049 1.182 0.132 0.093 1.621 0.798 0.001 100.131 1.334 1.054 1.194 0.140 0.113 1.621 0.790 0.001 100.151 1.357 1.064 1.211 0.146 0.134 1.620 0.785 0.002 100.172 1.373 1.067 1.220 0.153 0.154 1.619 0.777 0.002 100.192 1.392 1.073 1.233 0.160 0.174 1.619 0.771 0.002 100.213 1.415 1.084 1.249 0.165 0.194 1.618 0.767 0.003 100.233 1.432 1.088 1.260 0.172 0.216 1.618 0.760 0.003 100.254 1.453 1.094 1.273 0.179 0.237 1.617 0.753 0.003 100.275 1.470 1.093 1.281 0.189 0.257 1.617 0.743 0.003 100.295 1.493 1.097 1.295 0.198 0.277 1.616 0.734 0.004 100.315 1.511 1.099 1.305 0.206 0.298 1.616 0.727 0.004 100.335 1.529 1.101 1.315 0.214 0.318 1.615 0.720 0.004 100.355 1.543 1.101 1.322 0.221 0.338 1.615 0.714 0.005 100.375 1.563 1.104 1.333 0.230 0.358 1.614 0.706 0.005 100.394 1.580 1.109 1.344 0.236 0.378 1.614 0.702 0.005 100.416 1.593 1.105 1.349 0.244 0.398 1.613 0.693 0.006 100.436 1.613 1.113 1.363 0.250 0.419 1.613 0.690 0.006 100.457 1.630 1.117 1.374 0.257 0.440 1.612 0.685 0.006 100.477 1.644 1.116 1.380 0.264 0.460 1.611 0.679 0.007 100.496 1.662 1.121 1.391 0.271 0.480 1.611 0.674 0.007 10

B. T
AN
ET A
L.D
AT
A R
EP
OR
T: CO
NSO
LID
AT
ION
AN
D S
TR
EN
GT
H C
HA
RA
CT
ER
ISTIC
S1
06
Table 5–145 cm.
Note: Se
Time (s) Area (cm2)
Axial membrane correction
Radial membrane correction
Axial drain correction
30 10.152 0.732 0.148 0.00032 10.152 0.732 0.148 0.00034 10.152 0.732 0.148 0.00036 10.152 0.732 0.148 0.00038 10.152 0.732 0.148 0.00040 10.152 0.732 0.148 0.00042 10.152 0.732 0.148 0.00044 10.152 0.732 0.148 0.00046 10.152 0.732 0.148 0.00048 10.152 0.732 0.148 0.00050 10.152 0.732 0.148 0.00052 10.152 0.732 0.148 0.00054 10.152 0.732 0.148 0.00056 10.152 0.732 0.148 0.00058 10.152 0.732 0.148 0.00060 10.152 0.732 0.148 0.00062 10.152 0.732 0.148 0.00064 10.152 0.732 0.148 0.00066 10.152 0.732 0.148 0.00068 10.152 0.732 0.148 0.00070 10.152 0.732 0.148 0.00072 10.152 0.732 0.148 0.00074 10.152 0.732 0.148 0.00076 10.152 0.732 0.148 0.00078 10.152 0.732 0.148 0.00080 10.152 0.732 0.148 0.00082 10.152 0.732 0.148 0.000
T39. TX 635 undrained shearing data for Sample 204-1244B-4H-6WR, 13
e Table T3, p. 70, for explanation of headings.
εa (%) q/σvc p’/σvc Δue/σvc Δus/σvc Δq/qmax E’/σvc A φ (°)
0 0.219 0.778 0 0 0 0 0 16.3229.75E–04 0.219 0.778 1.19E–04 –1.32E–04 3.73E–03 72.666 0.147 16.3441.36E–03 0.219 0.778 3.88E–04 1.41E–04 5.02E–03 70.264 0.481 16.3592.13E–03 0.219 0.778 5.57E–04 1.52E–04 7.52E–03 66.96 0.44 16.3755.79E–04 0.22 0.778 7.26E–04 1.59E–04 1.01E–02 330.068 0.416 16.3922.51E–03 0.22 0.778 8.83E–04 2.66E–04 1.13E–02 85.536 0.457 16.4031.94E–03 0.22 0.778 1.00E–03 2.15E–04 1.29E–02 126.412 0.421 16.4122.51E–03 0.22 0.778 1.11E–03 2.37E–04 1.45E–02 109.299 0.419 16.423
–3.94E–04 0.22 0.778 1.28E–03 2.98E–04 1.52E–02 –730.144 0.437 16.4294.65E–03 0.22 0.779 1.38E–03 1.59E–04 1.85E–02 75.687 0.378 16.4483.67E–03 0.22 0.778 1.60E–03 3.34E–04 1.86E–02 95.955 0.428 16.4522.90E–03 0.221 0.779 1.66E–03 2.50E–04 2.08E–02 136.253 0.397 16.4652.70E–03 0.221 0.778 1.82E–03 3.11E–04 2.18E–02 153.054 0.409 16.4732.32E–03 0.221 0.778 1.95E–03 4.40E–04 2.30E–02 188.312 0.434 16.4842.90E–03 0.221 0.778 2.00E–03 5.00E–04 2.39E–02 156.871 0.443 16.4913.48E–03 0.221 0.779 2.05E–03 3.70E–04 2.61E–02 142.778 0.408 16.5033.48E–03 0.221 0.778 2.16E–03 4.42E–04 2.68E–02 146.215 0.42 16.5093.28E–03 0.221 0.778 2.21E–03 4.82E–04 2.81E–02 162.467 0.424 16.5184.83E–03 0.221 0.778 2.27E–03 6.52E–04 2.80E–02 110.107 0.456 16.5212.70E–03 0.221 0.779 2.33E–03 4.71E–04 2.90E–02 203.95 0.419 16.5243.28E–03 0.222 0.779 2.43E–03 4.92E–04 3.06E–02 177.042 0.418 16.5355.03E–03 0.222 0.778 2.55E–03 6.16E–04 3.11E–02 117.56 0.438 16.5413.48E–03 0.222 0.779 2.61E–03 5.74E–04 3.18E–02 173.703 0.428 16.5453.86E–03 0.222 0.778 2.71E–03 6.43E–04 3.28E–02 161.314 0.437 16.5533.66E–03 0.222 0.779 2.70E–03 5.35E–04 3.38E–02 175.055 0.417 16.5573.46E–03 0.222 0.779 2.87E–03 6.31E–04 3.50E–02 192.097 0.428 16.5675.59E–03 0.222 0.779 2.92E–03 5.82E–04 3.59E–02 121.974 0.419 16.572

B. T
AN
ET A
L.D
AT
A R
EP
OR
T: CO
NSO
LID
AT
ION
AN
D S
TR
EN
GT
H C
HA
RA
CT
ER
ISTIC
S1
07
Table m.
Note: Se
Time (s) cm2) ub (ksc)
Axial membrane correction
Radial membrane correction
Axial drain correction
0 43 7.838 0.000 0.000 0.00010 39 7.836 –0.001 0.000 0.00020 39 7.826 –0.001 0.000 0.00030 39 7.818 –0.001 0.000 0.00040 39 7.805 –0.001 0.000 0.00050 39 7.796 –0.001 0.000 0.00060 39 7.794 –0.001 0.000 0.00070 39 7.792 –0.001 0.000 0.00080 39 7.801 –0.001 0.000 0.00090 39 7.813 –0.001 0.000 0.000
104 39 7.812 –0.001 0.000 0.000404 44 7.827 0.000 0.000 0.000704 45 7.831 0.000 0.000 0.000
1004 45 7.834 0.000 0.000 0.0001304 45 7.849 0.000 0.000 0.0001604 44 7.84 0.000 0.000 0.0001904 45 7.84 0.000 0.000 0.0002204 45 7.851 0.000 0.000 0.0002504 45 7.85 0.001 0.000 0.0002804 45 7.848 0.001 0.000 0.0003104 44 7.847 0.002 0.000 0.0003404 44 7.848 0.002 0.000 0.0003704 44 7.843 0.003 0.000 0.000
0 43 7.838 0.000 0.000 0.00010 39 7.836 –0.001 0.000 0.00020 39 7.826 –0.001 0.000 0.00030 39 7.818 –0.001 0.000 0.000
T40. TX 636 consolidation data for Sample 204-1244C-17H-3WR, 80–90 c
e Table T3, p. 70, for explanation of headings.
εa (%) σ’v (ksc) σ’h (ksc) p’ (ksc) q (ksc) εv (%) e K Work Area (
–0.007 1.289 0.79 1.039 0.249 –0.011 1.193 0.613 0.000 10.2–0.047 1.289 0.791 1.04 0.249 –0.011 1.193 0.614 0.000 10.2–0.047 1.298 0.802 1.05 0.248 –0.01 1.193 0.618 0.000 10.2–0.048 1.301 0.806 1.053 0.248 –0.009 1.193 0.619 0.000 10.2–0.048 1.309 0.813 1.061 0.248 –0.008 1.193 0.622 0.000 10.2–0.047 1.312 0.819 1.065 0.247 –0.007 1.193 0.624 0.000 10.2–0.048 1.309 0.814 1.061 0.248 –0.007 1.193 0.622 0.000 10.2–0.047 1.305 0.808 1.057 0.248 –0.007 1.193 0.62 0.000 10.2–0.048 1.287 0.793 1.04 0.247 –0.007 1.193 0.616 0.000 10.2–0.047 1.27 0.776 1.023 0.247 –0.008 1.193 0.611 0.000 10.2–0.047 1.264 0.77 1.017 0.247 –0.009 1.193 0.609 0.000 10.2–0.007 1.221 0.724 0.973 0.249 –0.021 1.193 0.592 0.000 10.2–0.008 1.237 0.736 0.987 0.25 –0.024 1.193 0.596 0.000 10.2–0.007 1.239 0.739 0.989 0.25 –0.024 1.193 0.596 0.000 10.20.001 1.261 0.761 1.011 0.25 –0.023 1.193 0.603 0.000 10.20.001 1.294 0.796 1.045 0.249 –0.013 1.193 0.615 0.000 10.20.008 1.284 0.784 1.034 0.25 –0.009 1.193 0.61 0.000 10.20.02 1.327 0.824 1.076 0.251 0.001 1.192 0.621 0.000 10.20.033 1.364 0.86 1.112 0.252 0.016 1.192 0.631 0.000 10.20.046 1.365 0.863 1.114 0.251 0.031 1.192 0.632 0.001 10.20.059 1.375 0.874 1.125 0.251 0.044 1.192 0.636 0.001 10.20.071 1.381 0.883 1.132 0.249 0.058 1.191 0.639 0.001 10.20.083 1.394 0.889 1.142 0.252 0.071 1.191 0.638 0.001 10.2
–0.007 1.289 0.79 1.039 0.249 –0.011 1.193 0.613 0.000 10.2–0.047 1.289 0.791 1.04 0.249 –0.011 1.193 0.614 0.000 10.2–0.047 1.298 0.802 1.05 0.248 –0.01 1.193 0.618 0.000 10.2–0.048 1.301 0.806 1.053 0.248 –0.009 1.193 0.619 0.000 10.2
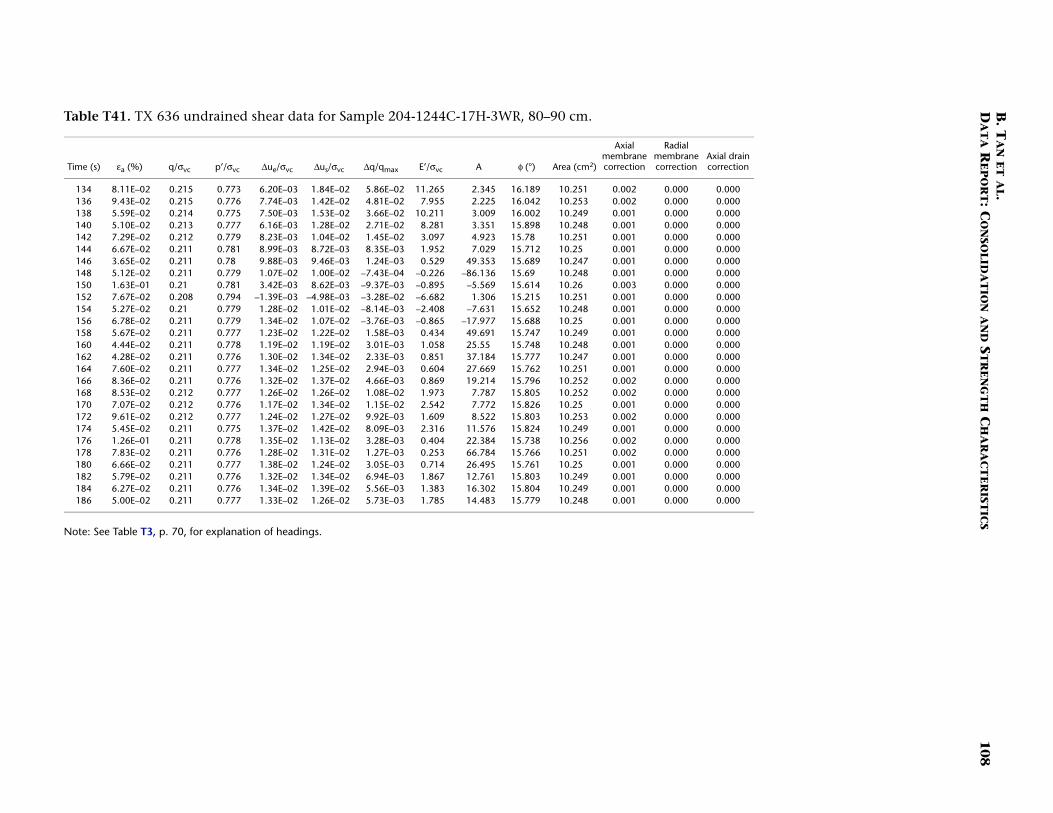
B. T
AN
ET A
L.D
AT
A R
EP
OR
T: CO
NSO
LID
AT
ION
AN
D S
TR
EN
GT
H C
HA
RA
CT
ER
ISTIC
S1
08
Table 90 cm.
Note: Se
Time (s) Area (cm2)
Axial membrane correction
Radial membrane correction
Axial drain correction
134 10.251 0.002 0.000 0.000136 10.253 0.002 0.000 0.000138 10.249 0.001 0.000 0.000140 10.248 0.001 0.000 0.000142 10.251 0.001 0.000 0.000144 10.25 0.001 0.000 0.000146 10.247 0.001 0.000 0.000148 10.248 0.001 0.000 0.000150 10.26 0.003 0.000 0.000152 10.251 0.001 0.000 0.000154 10.248 0.001 0.000 0.000156 10.25 0.001 0.000 0.000158 10.249 0.001 0.000 0.000160 10.248 0.001 0.000 0.000162 10.247 0.001 0.000 0.000164 10.251 0.001 0.000 0.000166 10.252 0.002 0.000 0.000168 10.252 0.002 0.000 0.000170 10.25 0.001 0.000 0.000172 10.253 0.002 0.000 0.000174 10.249 0.001 0.000 0.000176 10.256 0.002 0.000 0.000178 10.251 0.002 0.000 0.000180 10.25 0.001 0.000 0.000182 10.249 0.001 0.000 0.000184 10.249 0.001 0.000 0.000186 10.248 0.001 0.000 0.000
T41. TX 636 undrained shear data for Sample 204-1244C-17H-3WR, 80–
e Table T3, p. 70, for explanation of headings.
εa (%) q/σvc p’/σvc Δue/σvc Δus/σvc Δq/qmax E’/σvc A φ (°)
8.11E–02 0.215 0.773 6.20E–03 1.84E–02 5.86E–02 11.265 2.345 16.1899.43E–02 0.215 0.776 7.74E–03 1.42E–02 4.81E–02 7.955 2.225 16.0425.59E–02 0.214 0.775 7.50E–03 1.53E–02 3.66E–02 10.211 3.009 16.0025.10E–02 0.213 0.777 6.16E–03 1.28E–02 2.71E–02 8.281 3.351 15.8987.29E–02 0.212 0.779 8.23E–03 1.04E–02 1.45E–02 3.097 4.923 15.786.67E–02 0.211 0.781 8.99E–03 8.72E–03 8.35E–03 1.952 7.029 15.7123.65E–02 0.211 0.78 9.88E–03 9.46E–03 1.24E–03 0.529 49.353 15.6895.12E–02 0.211 0.779 1.07E–02 1.00E–02 –7.43E–04 –0.226 –86.136 15.691.63E–01 0.21 0.781 3.42E–03 8.62E–03 –9.37E–03 –0.895 –5.569 15.6147.67E–02 0.208 0.794 –1.39E–03 –4.98E–03 –3.28E–02 –6.682 1.306 15.2155.27E–02 0.21 0.779 1.28E–02 1.01E–02 –8.14E–03 –2.408 –7.631 15.6526.78E–02 0.211 0.779 1.34E–02 1.07E–02 –3.76E–03 –0.865 –17.977 15.6885.67E–02 0.211 0.777 1.23E–02 1.22E–02 1.58E–03 0.434 49.691 15.7474.44E–02 0.211 0.778 1.19E–02 1.19E–02 3.01E–03 1.058 25.55 15.7484.28E–02 0.211 0.776 1.30E–02 1.34E–02 2.33E–03 0.851 37.184 15.7777.60E–02 0.211 0.777 1.34E–02 1.25E–02 2.94E–03 0.604 27.669 15.7628.36E–02 0.211 0.776 1.32E–02 1.37E–02 4.66E–03 0.869 19.214 15.7968.53E–02 0.212 0.777 1.26E–02 1.26E–02 1.08E–02 1.973 7.787 15.8057.07E–02 0.212 0.776 1.17E–02 1.34E–02 1.15E–02 2.542 7.772 15.8269.61E–02 0.212 0.777 1.24E–02 1.27E–02 9.92E–03 1.609 8.522 15.8035.45E–02 0.211 0.775 1.37E–02 1.42E–02 8.09E–03 2.316 11.576 15.8241.26E–01 0.211 0.778 1.35E–02 1.13E–02 3.28E–03 0.404 22.384 15.7387.83E–02 0.211 0.776 1.28E–02 1.31E–02 1.27E–03 0.253 66.784 15.7666.66E–02 0.211 0.777 1.38E–02 1.24E–02 3.05E–03 0.714 26.495 15.7615.79E–02 0.211 0.776 1.32E–02 1.34E–02 6.94E–03 1.867 12.761 15.8036.27E–02 0.211 0.776 1.34E–02 1.39E–02 5.56E–03 1.383 16.302 15.8045.00E–02 0.211 0.777 1.33E–02 1.26E–02 5.73E–03 1.785 14.483 15.779
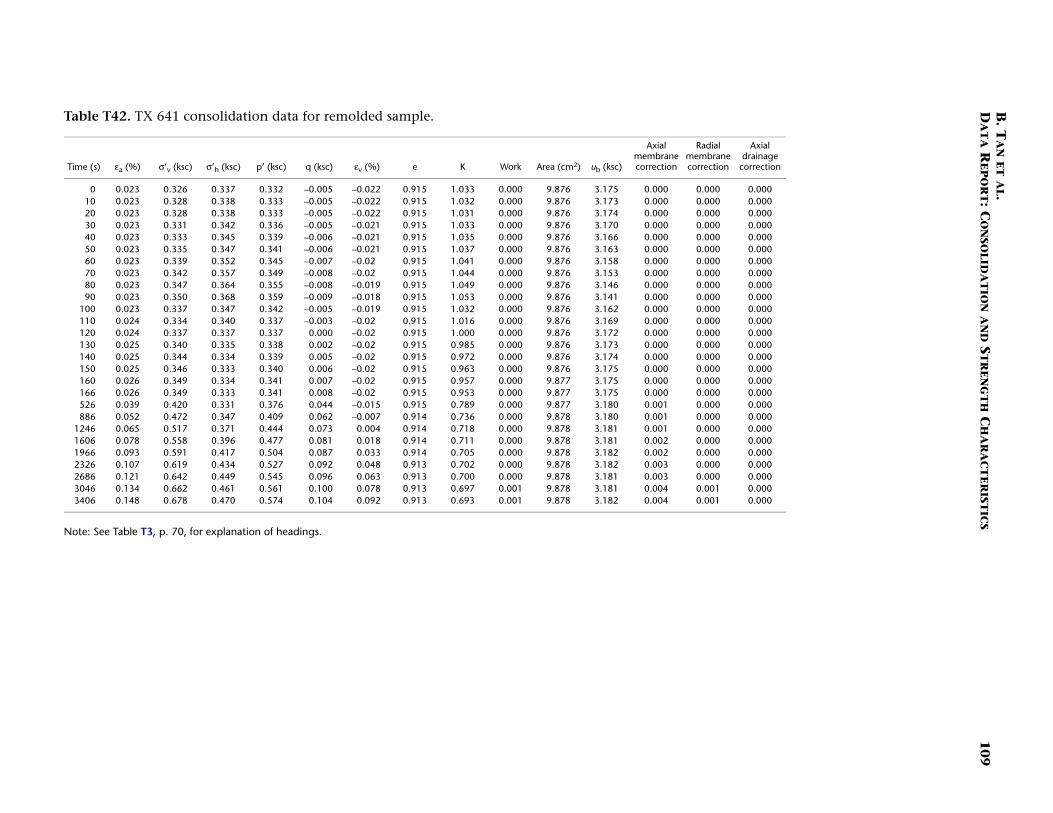
B. T
AN
ET A
L.D
AT
A R
EP
OR
T: CO
NSO
LID
AT
ION
AN
D S
TR
EN
GT
H C
HA
RA
CT
ER
ISTIC
S1
09
Table
Note: Se
Time (s) a (cm2) ub (ksc)
Axial membrane correction
Radial membrane correction
Axial drainage
correction
0 .876 3.175 0.000 0.000 0.00010 .876 3.173 0.000 0.000 0.00020 .876 3.174 0.000 0.000 0.00030 .876 3.170 0.000 0.000 0.00040 .876 3.166 0.000 0.000 0.00050 .876 3.163 0.000 0.000 0.00060 .876 3.158 0.000 0.000 0.00070 .876 3.153 0.000 0.000 0.00080 .876 3.146 0.000 0.000 0.00090 .876 3.141 0.000 0.000 0.000
100 .876 3.162 0.000 0.000 0.000110 .876 3.169 0.000 0.000 0.000120 .876 3.172 0.000 0.000 0.000130 .876 3.173 0.000 0.000 0.000140 .876 3.174 0.000 0.000 0.000150 .876 3.175 0.000 0.000 0.000160 .877 3.175 0.000 0.000 0.000166 .877 3.175 0.000 0.000 0.000526 .877 3.180 0.001 0.000 0.000886 .878 3.180 0.001 0.000 0.000
1246 .878 3.181 0.001 0.000 0.0001606 .878 3.181 0.002 0.000 0.0001966 .878 3.182 0.002 0.000 0.0002326 .878 3.182 0.003 0.000 0.0002686 .878 3.181 0.003 0.000 0.0003046 .878 3.181 0.004 0.001 0.0003406 .878 3.182 0.004 0.001 0.000
T42. TX 641 consolidation data for remolded sample.
e Table T3, p. 70, for explanation of headings.
εa (%) σ’v (ksc) σ’h (ksc) p’ (ksc) q (ksc) εv (%) e K Work Are
0.023 0.326 0.337 0.332 –0.005 –0.022 0.915 1.033 0.000 90.023 0.328 0.338 0.333 –0.005 –0.022 0.915 1.032 0.000 90.023 0.328 0.338 0.333 –0.005 –0.022 0.915 1.031 0.000 90.023 0.331 0.342 0.336 –0.005 –0.021 0.915 1.033 0.000 90.023 0.333 0.345 0.339 –0.006 –0.021 0.915 1.035 0.000 90.023 0.335 0.347 0.341 –0.006 –0.021 0.915 1.037 0.000 90.023 0.339 0.352 0.345 –0.007 –0.02 0.915 1.041 0.000 90.023 0.342 0.357 0.349 –0.008 –0.02 0.915 1.044 0.000 90.023 0.347 0.364 0.355 –0.008 –0.019 0.915 1.049 0.000 90.023 0.350 0.368 0.359 –0.009 –0.018 0.915 1.053 0.000 90.023 0.337 0.347 0.342 –0.005 –0.019 0.915 1.032 0.000 90.024 0.334 0.340 0.337 –0.003 –0.02 0.915 1.016 0.000 90.024 0.337 0.337 0.337 0.000 –0.02 0.915 1.000 0.000 90.025 0.340 0.335 0.338 0.002 –0.02 0.915 0.985 0.000 90.025 0.344 0.334 0.339 0.005 –0.02 0.915 0.972 0.000 90.025 0.346 0.333 0.340 0.006 –0.02 0.915 0.963 0.000 90.026 0.349 0.334 0.341 0.007 –0.02 0.915 0.957 0.000 90.026 0.349 0.333 0.341 0.008 –0.02 0.915 0.953 0.000 90.039 0.420 0.331 0.376 0.044 –0.015 0.915 0.789 0.000 90.052 0.472 0.347 0.409 0.062 –0.007 0.914 0.736 0.000 90.065 0.517 0.371 0.444 0.073 0.004 0.914 0.718 0.000 90.078 0.558 0.396 0.477 0.081 0.018 0.914 0.711 0.000 90.093 0.591 0.417 0.504 0.087 0.033 0.914 0.705 0.000 90.107 0.619 0.434 0.527 0.092 0.048 0.913 0.702 0.000 90.121 0.642 0.449 0.545 0.096 0.063 0.913 0.700 0.000 90.134 0.662 0.461 0.561 0.100 0.078 0.913 0.697 0.001 90.148 0.678 0.470 0.574 0.104 0.092 0.913 0.693 0.001 9

B. T
AN
ET A
L.D
AT
A R
EP
OR
T: CO
NSO
LID
AT
ION
AN
D S
TR
EN
GT
H C
HA
RA
CT
ER
ISTIC
S1
10
Table
Note: Se
Time (s) a (cm2)
Axial membrane correction
Radial membrane correction
Axial drain correction
26 9.857 0.291 0.059 0.00028 9.857 0.291 0.059 0.00030 9.857 0.291 0.059 0.00032 9.857 0.291 0.059 0.00034 9.857 0.291 0.059 0.00036 9.857 0.291 0.059 0.00038 9.857 0.291 0.059 0.00040 9.857 0.291 0.059 0.00042 9.857 0.291 0.059 0.00044 9.857 0.291 0.059 0.00046 9.857 0.291 0.059 0.00048 9.857 0.291 0.059 0.00050 9.857 0.291 0.059 0.00052 9.857 0.291 0.059 0.00054 9.857 0.291 0.059 0.00056 9.857 0.291 0.059 0.00058 9.857 0.291 0.059 0.00060 9.857 0.291 0.059 0.00062 9.857 0.291 0.059 0.00064 9.857 0.291 0.059 0.00066 9.857 0.291 0.059 0.00068 9.857 0.291 0.059 0.00070 9.857 0.291 0.059 0.00072 9.857 0.291 0.059 0.00074 9.857 0.291 0.059 0.00076 9.857 0.291 0.059 0.00078 9.857 0.291 0.059 0.000
T43. TX 641 undrained shearing data for remolded sample.
e Table T3, p. 70, for explanation of headings.
εa (%) q/σvc p’/σvc Δue/σvc Δus/σvc Δq/qmax E’/σvc A φ (°) Are
5.55E–05 0.241 0.756 1.24E–04 2.93E–05 5.61E–04 376.388 0.474 18.5665.55E–05 0.241 0.756 1.36E–04 1.99E–05 7.37E–04 494.273 0.406 18.5680 0.241 0.756 1.61E–04 1.40E–05 9.84E–04 0.000 0.372 18.5715.55E–05 0.241 0.756 1.98E–04 1.64E–05 1.26E–03 847.762 0.368 18.5750 0.241 0.756 2.60E–04 3.38E–05 1.72E–03 0.000 0.386 18.5810 0.241 0.756 3.34E–04 2.08E–05 2.43E–03 0.000 0.356 18.591.11E–04 0.241 0.756 4.33E–04 –6.33E–06 3.44E–03 1154.296 0.328 18.6032.23E–04 0.241 0.756 5.32E–04 –1.17E–05 4.28E–03 715.449 0.326 18.6142.79E–04 0.242 0.756 6.31E–04 2.49E–05 4.99E–03 664.613 0.347 18.6242.79E–04 0.242 0.756 7.17E–04 2.07E–05 5.62E–03 748.945 0.343 18.6333.91E–04 0.242 0.756 8.04E–04 4.21E–05 6.14E–03 584.695 0.352 18.644.46E–04 0.242 0.756 8.78E–04 5.03E–05 6.77E–03 564.673 0.353 18.6493.91E–04 0.242 0.756 9.40E–04 4.67E–05 7.30E–03 695.085 0.351 18.6564.46E–04 0.242 0.757 1.01E–03 4.33E–05 7.83E–03 652.569 0.348 18.6635.02E–04 0.242 0.757 1.08E–03 4.42E–05 8.32E–03 616.83 0.348 18.6695.58E–04 0.242 0.757 1.14E–03 4.52E–05 8.81E–03 587.298 0.347 18.6765.02E–04 0.242 0.757 1.22E–03 6.19E–05 9.37E–03 695.000 0.351 18.6845.58E–04 0.242 0.757 1.31E–03 8.76E–05 9.87E–03 657.58 0.357 18.6917.25E–04 0.243 0.757 1.36E–03 6.77E–05 1.04E–02 534.625 0.351 18.6987.81E–04 0.243 0.757 1.42E–03 6.87E–05 1.09E–02 520.037 0.35 18.7048.37E–04 0.243 0.757 1.48E–03 4.85E–05 1.15E–02 509.983 0.345 18.7118.37E–04 0.243 0.757 1.55E–03 3.70E–05 1.20E–02 531.855 0.342 18.7189.49E–04 0.243 0.757 1.61E–03 2.94E–05 1.25E–02 491.152 0.34 18.7259.49E–04 0.243 0.757 1.67E–03 3.82E–05 1.31E–02 511.824 0.341 18.7321.00E–03 0.243 0.757 1.74E–03 3.48E–05 1.36E–02 503.044 0.34 18.7391.06E–03 0.243 0.757 1.79E–03 1.90E–05 1.41E–02 494.788 0.337 18.7451.12E–03 0.243 0.757 1.88E–03 5.71E–05 1.46E–02 486.559 0.344 18.753

B. T
AN
ET A
L.D
AT
A R
EP
OR
T: CO
NSO
LID
AT
ION
AN
D S
TR
EN
GT
H C
HA
RA
CT
ER
ISTIC
S1
11
Table cm.
Note: Se
Time (s) a (cm2) ub (ksc)
Axial membrane correction
Radial membrane correction
Axial drainage
correction
0 .866 3.333 0.000 0.000 0.00010 .866 3.333 0.000 0.000 0.00020 .866 3.332 0.000 0.000 0.00030 .866 3.332 0.000 0.000 0.00040 .866 3.333 0.000 0.000 0.00050 .866 3.332 0.000 0.000 0.00060 .866 3.332 0.000 0.000 0.00070 .866 3.332 0.000 0.000 0.00080 .866 3.332 0.000 0.000 0.00090 .866 3.332 0.000 0.000 0.000
100 .866 3.331 0.000 0.000 0.000110 .866 3.331 0.000 0.000 0.000120 .866 3.33 0.000 0.000 0.000130 .866 3.329 0.000 0.000 0.000140 .866 3.329 0.000 0.000 0.000150 .866 3.329 0.000 0.000 0.000160 .866 3.329 0.000 0.000 0.000170 .866 3.328 0.000 0.000 0.000180 .866 3.328 0.000 0.000 0.000190 .866 3.328 0.000 0.000 0.000200 .866 3.328 0.000 0.000 0.000210 .866 3.328 0.000 0.000 0.000220 .866 3.328 0.000 0.000 0.000230 .866 3.328 0.000 0.000 0.000240 .866 3.328 0.000 0.000 0.000250 .866 3.328 0.000 0.000 0.000260 .866 3.328 0.000 0.000 0.000
T44. TX 642 consolidation data for Sample 204-1244B-3H-3WR, 128–138
e Table T3, p. 70, for explanation of headings.
εa (%) σ’v (ksc) σ’h (ksc) p’ (ksc) q (ksc) εv (%) e K Work Are
–0.005 0.178 0.181 0.18 –0.002 –0.004 1.595 1.018 0.000 9–0.005 0.179 0.182 0.18 –0.002 –0.004 1.595 1.017 0.000 9–0.005 0.179 0.182 0.18 –0.002 –0.004 1.595 1.017 0.000 9–0.005 0.179 0.182 0.18 –0.002 –0.004 1.595 1.017 0.000 9–0.005 0.178 0.181 0.18 –0.002 –0.004 1.595 1.017 0.000 9–0.005 0.178 0.181 0.18 –0.002 –0.004 1.595 1.017 0.000 9–0.005 0.178 0.181 0.18 –0.002 –0.004 1.595 1.017 0.000 9–0.005 0.178 0.181 0.18 –0.001 –0.004 1.595 1.016 0.000 9–0.005 0.178 0.181 0.18 –0.002 –0.004 1.595 1.017 0.000 9–0.005 0.178 0.181 0.18 –0.002 –0.004 1.595 1.017 0.000 9–0.005 0.178 0.181 0.18 –0.002 –0.004 1.595 1.017 0.000 9–0.005 0.179 0.181 0.18 –0.001 –0.004 1.595 1.016 0.000 9–0.006 0.179 0.182 0.18 –0.002 –0.004 1.595 1.017 0.000 9–0.006 0.179 0.182 0.18 –0.002 –0.004 1.595 1.018 0.000 9–0.005 0.179 0.182 0.18 –0.002 –0.004 1.595 1.018 0.000 9–0.006 0.179 0.182 0.181 –0.002 –0.004 1.595 1.017 0.000 9–0.005 0.179 0.182 0.18 –0.002 –0.003 1.595 1.018 0.000 9–0.006 0.179 0.182 0.181 –0.002 –0.003 1.595 1.018 0.000 9–0.005 0.179 0.182 0.181 –0.002 –0.003 1.595 1.017 0.000 9–0.006 0.179 0.182 0.181 –0.001 –0.003 1.595 1.015 0.000 9–0.006 0.179 0.182 0.181 –0.001 –0.003 1.595 1.012 0.000 9–0.005 0.18 0.181 0.181 –0.001 –0.003 1.595 1.008 0.000 9–0.005 0.18 0.181 0.181 0 –0.003 1.595 1.003 0.000 9–0.005 0.181 0.181 0.181 0 –0.003 1.595 0.999 0.000 9–0.004 0.182 0.181 0.181 0.001 –0.003 1.595 0.992 0.000 9–0.003 0.183 0.18 0.181 0.001 –0.003 1.595 0.987 0.000 9–0.003 0.183 0.18 0.181 0.002 –0.003 1.595 0.982 0.000 9

B. T
AN
ET A
L.D
AT
A R
EP
OR
T: CO
NSO
LID
AT
ION
AN
D S
TR
EN
GT
H C
HA
RA
CT
ER
ISTIC
S1
12
Table 8–138 cm.
Note: Se
Time (s) Area (cm2)
Axial membrane correction
Radial membrane correction
Axial drain correction
22 9.847 0.382 0.077 0.00024 9.847 0.382 0.077 0.00026 9.847 0.382 0.077 0.00028 9.847 0.382 0.077 0.00030 9.847 0.382 0.077 0.00032 9.847 0.382 0.077 0.00034 9.847 0.382 0.077 0.00036 9.847 0.382 0.077 0.00038 9.847 0.382 0.077 0.00040 9.847 0.382 0.077 0.00042 9.847 0.382 0.077 0.00044 9.847 0.382 0.077 0.00046 9.847 0.382 0.077 0.00048 9.847 0.382 0.077 0.00050 9.847 0.382 0.077 0.00052 9.847 0.382 0.077 0.00054 9.847 0.382 0.077 0.00056 9.847 0.382 0.077 0.00058 9.847 0.382 0.077 0.00060 9.847 0.382 0.077 0.00062 9.847 0.382 0.077 0.00064 9.847 0.382 0.077 0.00066 9.847 0.382 0.077 0.00068 9.847 0.382 0.077 0.00070 9.847 0.382 0.077 0.00072 9.847 0.382 0.077 0.00074 9.847 0.382 0.077 0.000
T45. TX 642 undrained shearing data for Sample 204-1244B-3H-3WR, 12
e Table T3, p. 70, for explanation of headings.
εa (%) q/σvc p’/σvc Δue/σvc Δus/σvc Δq/qmax E’/σvc A φ (°)
3.88E–04 0.274 0.725 1.42E–03 1.04E–03 9.53E–03 363.526 1.068 22.165.18E–04 0.274 0.725 1.56E–03 1.15E–03 1.01E–02 289.705 1.099 22.1675.83E–04 0.274 0.725 1.65E–03 1.17E–03 1.09E–02 278.251 1.053 22.1727.12E–04 0.274 0.725 1.82E–03 1.28E–03 1.22E–02 252.76 1.043 22.1825.83E–04 0.274 0.725 1.91E–03 1.32E–03 1.30E–02 329.952 1.021 22.1886.48E–04 0.274 0.725 2.02E–03 1.38E–03 1.42E–02 324.438 0.988 22.1976.48E–04 0.274 0.725 2.13E–03 1.43E–03 1.54E–02 352.328 0.96 22.2057.12E–04 0.274 0.725 2.30E–03 1.54E–03 1.66E–02 345.756 0.959 22.2168.42E–04 0.274 0.725 2.42E–03 1.60E–03 1.76E–02 310.214 0.947 22.2237.12E–04 0.274 0.725 2.50E–03 1.69E–03 1.89E–02 392.258 0.937 22.2337.77E–04 0.274 0.725 2.65E–03 1.74E–03 2.01E–02 382.92 0.918 22.2417.77E–04 0.274 0.725 2.70E–03 1.76E–03 2.13E–02 406.192 0.893 22.2499.72E–04 0.275 0.725 2.84E–03 1.84E–03 2.27E–02 346.13 0.879 22.2599.72E–04 0.275 0.725 2.96E–03 1.88E–03 2.41E–02 367.806 0.859 22.2681.10E–03 0.275 0.725 3.13E–03 2.01E–03 2.55E–02 343.513 0.864 22.281.04E–03 0.275 0.725 3.21E–03 2.04E–03 2.68E–02 382.676 0.847 22.2881.17E–03 0.275 0.725 3.30E–03 2.06E–03 2.80E–02 355.477 0.83 22.2951.29E–03 0.275 0.725 3.44E–03 2.14E–03 2.92E–02 333.986 0.829 22.3051.23E–03 0.275 0.725 3.56E–03 2.21E–03 3.02E–02 363.454 0.826 22.3121.36E–03 0.275 0.725 3.64E–03 2.24E–03 3.12E–02 340.022 0.818 22.3191.49E–03 0.275 0.725 3.78E–03 2.34E–03 3.20E–02 318.417 0.827 22.3271.42E–03 0.275 0.725 3.84E–03 2.31E–03 3.32E–02 345.756 0.803 22.3331.55E–03 0.275 0.725 3.93E–03 2.38E–03 3.43E–02 326.498 0.802 22.341.68E–03 0.275 0.724 4.07E–03 2.50E–03 3.53E–02 310.21 0.811 22.351.68E–03 0.276 0.724 4.13E–03 2.50E–03 3.63E–02 319.152 0.799 22.3561.75E–03 0.276 0.724 4.21E–03 2.55E–03 3.71E–02 314.077 0.797 22.3611.81E–03 0.276 0.725 4.24E–03 2.54E–03 3.79E–02 309.533 0.785 22.366

B. T
AN
ET A
L.D
AT
A R
EP
OR
T: CO
NSO
LID
AT
ION
AN
D S
TR
EN
GT
H C
HA
RA
CT
ER
ISTIC
S1
13
Table cm.
Note: Se
Time (s) a (cm2) ub (ksc)
Axial membrane correction
Radial membrane correction
Axial drainage
correction
0 .07 3.326 0.000 0.000 0.00010 .07 3.325 0.000 0.000 0.00020 .07 3.324 0.000 0.000 0.00030 .07 3.324 0.000 0.000 0.00040 .07 3.323 0.000 0.000 0.00050 .07 3.322 0.000 0.000 0.00060 .07 3.322 0.000 0.000 0.00070 .07 3.32 0.000 0.000 0.00080 .07 3.319 0.000 0.000 0.00090 .07 3.319 0.000 0.000 0.000
100 .07 3.319 0.000 0.000 0.000110 .07 3.318 0.000 0.000 0.000120 .07 3.319 0.000 0.000 0.000130 .07 3.319 0.000 0.000 0.000140 .07 3.319 0.000 0.000 0.000150 .07 3.319 0.000 0.000 0.000160 .07 3.319 0.000 0.000 0.000170 .07 3.319 0.000 0.000 0.000180 .07 3.32 0.000 0.000 0.000186 .07 3.32 0.000 0.000 0.000546 .072 3.339 0.000 0.000 0.000906 .071 3.347 0.001 0.000 0.000
1266 .071 3.345 0.001 0.000 0.0001626 .07 3.34 0.002 0.000 0.0001986 .071 3.34 0.002 0.000 0.0002346 .071 3.349 0.002 0.000 0.0002706 .071 3.343 0.003 0.001 0.000
T46. TX 643 consolidation data for Sample 204-1244B-1H-4WR, 138–148
e Table T3, p. 70, for explanation of headings.
εa (%) σ’v (ksc) σ’h (ksc) p’ (ksc) q (ksc) εv (%) e K Work Are
–0.007 0.186 0.18 0.183 0.003 –0.007 1.458 0.971 0.000 10–0.008 0.187 0.181 0.184 0.003 –0.007 1.458 0.97 0.000 10–0.008 0.187 0.181 0.184 0.003 –0.007 1.458 0.97 0.000 10–0.008 0.187 0.181 0.184 0.003 –0.007 1.458 0.97 0.000 10–0.008 0.186 0.181 0.184 0.003 –0.007 1.458 0.973 0.000 10–0.008 0.186 0.181 0.184 0.002 –0.007 1.458 0.973 0.000 10–0.008 0.186 0.181 0.184 0.003 –0.007 1.458 0.973 0.000 10–0.008 0.186 0.181 0.184 0.003 –0.007 1.458 0.973 0.000 10–0.008 0.186 0.181 0.184 0.003 –0.007 1.458 0.972 0.000 10–0.008 0.187 0.181 0.184 0.003 –0.007 1.458 0.971 0.000 10–0.008 0.187 0.181 0.184 0.003 –0.007 1.458 0.968 0.000 10–0.008 0.187 0.18 0.184 0.003 –0.007 1.458 0.963 0.000 10–0.007 0.188 0.18 0.184 0.004 –0.007 1.458 0.957 0.000 10–0.007 0.189 0.179 0.184 0.005 –0.007 1.458 0.95 0.000 10–0.006 0.19 0.179 0.184 0.005 –0.007 1.458 0.943 0.000 10–0.006 0.19 0.179 0.184 0.006 –0.007 1.458 0.94 0.000 10–0.005 0.191 0.178 0.184 0.006 –0.007 1.458 0.936 0.000 10–0.005 0.191 0.178 0.184 0.007 –0.007 1.458 0.931 0.000 10–0.005 0.191 0.178 0.185 0.007 –0.007 1.458 0.928 0.000 10–0.004 0.192 0.178 0.185 0.007 –0.007 1.458 0.925 0.000 100.011 0.208 0.174 0.191 0.017 –0.007 1.458 0.836 0.000 100.024 0.237 0.199 0.218 0.019 0.009 1.458 0.842 0.000 100.038 0.251 0.211 0.231 0.02 0.031 1.457 0.843 0.000 100.051 0.253 0.208 0.23 0.023 0.047 1.457 0.821 0.000 100.065 0.256 0.203 0.229 0.026 0.057 1.456 0.794 0.000 100.078 0.258 0.199 0.229 0.03 0.066 1.456 0.772 0.000 100.092 0.271 0.211 0.241 0.03 0.083 1.456 0.776 0.000 10

B. T
AN
ET A
L.D
AT
A R
EP
OR
T: CO
NSO
LID
AT
ION
AN
D S
TR
EN
GT
H C
HA
RA
CT
ER
ISTIC
S1
14
Table 8–148 cm.
Note: Se
Time (s) Area (cm2)
Axial membrane correction
Radial membrane correction
Axial drain correction
18 10.065 0.339 0.068 0.00020 10.065 0.339 0.068 0.00022 10.065 0.339 0.068 0.00024 10.065 0.339 0.068 0.00026 10.065 0.339 0.068 0.00028 10.065 0.339 0.068 0.00030 10.065 0.339 0.068 0.00032 10.065 0.339 0.068 0.00034 10.065 0.339 0.068 0.00036 10.065 0.339 0.068 0.00038 10.065 0.339 0.068 0.00040 10.065 0.339 0.068 0.00042 10.065 0.339 0.068 0.00044 10.065 0.339 0.068 0.00046 10.065 0.339 0.068 0.00048 10.065 0.339 0.068 0.00050 10.065 0.339 0.068 0.00052 10.065 0.339 0.068 0.00054 10.065 0.339 0.068 0.00056 10.065 0.339 0.068 0.00058 10.065 0.339 0.068 0.00060 10.065 0.339 0.068 0.00062 10.065 0.339 0.068 0.00064 10.065 0.339 0.068 0.00066 10.065 0.339 0.068 0.00068 10.065 0.339 0.068 0.00070 10.065 0.339 0.068 0.000
T47. TX 643 undrained shearing data for Sample 204-1244B-1H-4WR, 13
e Table T3, p. 70, for explanation of headings.
εa (%) q/σvc p’/σvc Δue/σvc Δus/σvc Δq/qmax E’/σvc A φ (°)
0 0.269 0.734 0 0 0 0 0 21.5391.11E–03 0.27 0.734 1.27E–03 6.49E–04 1.27E–02 167.982 0.682 21.6271.55E–03 0.271 0.734 1.39E–03 5.67E–04 1.68E–02 158.566 0.564 21.6472.16E–03 0.271 0.734 1.66E–03 5.97E–04 2.25E–02 152.04 0.515 21.6786.19E–04 0.271 0.734 1.77E–03 6.15E–04 2.45E–02 578.983 0.505 21.698.48E–04 0.271 0.734 1.89E–03 5.85E–04 2.75E–02 473.922 0.479 21.7051.10E–03 0.272 0.734 1.96E–03 6.48E–04 2.85E–02 378.088 0.489 21.7122.29E–03 0.272 0.734 2.04E–03 6.75E–04 2.95E–02 189.23 0.489 21.7191.58E–03 0.272 0.734 2.12E–03 6.97E–04 3.07E–02 283.603 0.489 21.7261.22E–03 0.272 0.734 2.16E–03 7.20E–04 3.18E–02 382.903 0.488 21.7321.23E–03 0.272 0.734 2.27E–03 7.56E–04 3.34E–02 397.004 0.488 21.7421.43E–03 0.272 0.734 2.35E–03 7.67E–04 3.48E–02 356.566 0.484 21.752.04E–03 0.272 0.734 2.43E–03 7.79E–04 3.61E–02 258.881 0.481 21.7572.05E–03 0.272 0.734 2.54E–03 8.15E–04 3.77E–02 269.13 0.481 21.7671.46E–03 0.272 0.734 2.62E–03 8.24E–04 3.91E–02 393.477 0.477 21.7751.67E–03 0.272 0.734 2.70E–03 8.35E–04 4.05E–02 355.436 0.474 21.7831.54E–03 0.272 0.734 2.81E–03 8.32E–04 4.21E–02 399.239 0.468 21.7912.01E–03 0.273 0.734 2.89E–03 8.96E–04 4.32E–02 314.927 0.475 21.7993.23E–03 0.273 0.734 3.00E–03 9.48E–04 4.45E–02 201.264 0.479 21.8082.27E–03 0.273 0.734 3.04E–03 9.56E–04 4.59E–02 295.301 0.476 21.8162.08E–03 0.273 0.734 3.16E–03 9.91E–04 4.75E–02 334.599 0.476 21.8261.58E–03 0.273 0.734 3.20E–03 1.00E–03 4.89E–02 453.738 0.473 21.8332.54E–03 0.273 0.734 3.35E–03 1.08E–03 5.05E–02 291.367 0.479 21.8442.83E–03 0.273 0.734 3.47E–03 1.09E–03 5.27E–02 272.116 0.474 21.8562.90E–03 0.273 0.734 3.58E–03 1.16E–03 5.43E–02 274.107 0.48 21.8672.67E–03 0.274 0.734 3.66E–03 1.09E–03 5.65E–02 309.558 0.466 21.8772.00E–03 0.274 0.734 3.81E–03 1.15E–03 5.84E–02 428.521 0.468 21.889
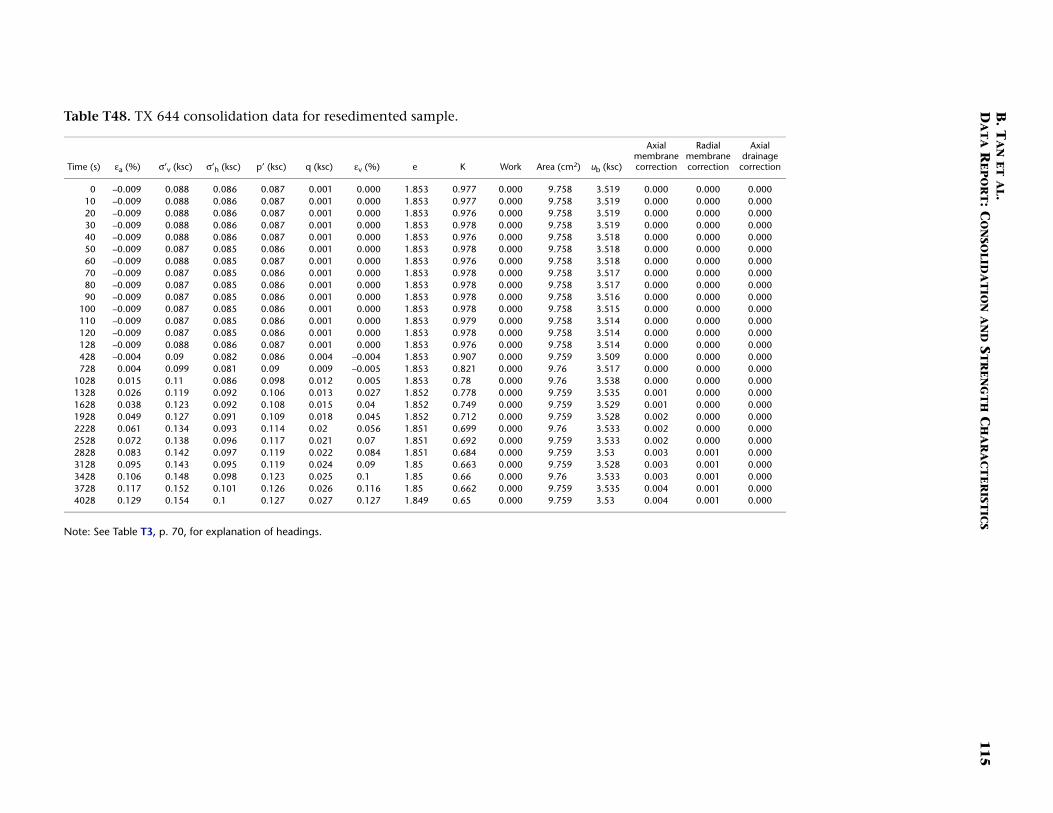
B. T
AN
ET A
L.D
AT
A R
EP
OR
T: CO
NSO
LID
AT
ION
AN
D S
TR
EN
GT
H C
HA
RA
CT
ER
ISTIC
S1
15
Table
Note: Se
Time (s) (cm2) ub (ksc)
Axial membrane correction
Radial membrane correction
Axial drainage
correction
0 .758 3.519 0.000 0.000 0.00010 .758 3.519 0.000 0.000 0.00020 .758 3.519 0.000 0.000 0.00030 .758 3.519 0.000 0.000 0.00040 .758 3.518 0.000 0.000 0.00050 .758 3.518 0.000 0.000 0.00060 .758 3.518 0.000 0.000 0.00070 .758 3.517 0.000 0.000 0.00080 .758 3.517 0.000 0.000 0.00090 .758 3.516 0.000 0.000 0.000
100 .758 3.515 0.000 0.000 0.000110 .758 3.514 0.000 0.000 0.000120 .758 3.514 0.000 0.000 0.000128 .758 3.514 0.000 0.000 0.000428 .759 3.509 0.000 0.000 0.000728 .76 3.517 0.000 0.000 0.000
1028 .76 3.538 0.000 0.000 0.0001328 .759 3.535 0.001 0.000 0.0001628 .759 3.529 0.001 0.000 0.0001928 .759 3.528 0.002 0.000 0.0002228 .76 3.533 0.002 0.000 0.0002528 .759 3.533 0.002 0.000 0.0002828 .759 3.53 0.003 0.001 0.0003128 .759 3.528 0.003 0.001 0.0003428 .76 3.533 0.003 0.001 0.0003728 .759 3.535 0.004 0.001 0.0004028 .759 3.53 0.004 0.001 0.000
T48. TX 644 consolidation data for resedimented sample.
e Table T3, p. 70, for explanation of headings.
εa (%) σ’v (ksc) σ’h (ksc) p’ (ksc) q (ksc) εv (%) e K Work Area
–0.009 0.088 0.086 0.087 0.001 0.000 1.853 0.977 0.000 9–0.009 0.088 0.086 0.087 0.001 0.000 1.853 0.977 0.000 9–0.009 0.088 0.086 0.087 0.001 0.000 1.853 0.976 0.000 9–0.009 0.088 0.086 0.087 0.001 0.000 1.853 0.978 0.000 9–0.009 0.088 0.086 0.087 0.001 0.000 1.853 0.976 0.000 9–0.009 0.087 0.085 0.086 0.001 0.000 1.853 0.978 0.000 9–0.009 0.088 0.085 0.087 0.001 0.000 1.853 0.976 0.000 9–0.009 0.087 0.085 0.086 0.001 0.000 1.853 0.978 0.000 9–0.009 0.087 0.085 0.086 0.001 0.000 1.853 0.978 0.000 9–0.009 0.087 0.085 0.086 0.001 0.000 1.853 0.978 0.000 9–0.009 0.087 0.085 0.086 0.001 0.000 1.853 0.978 0.000 9–0.009 0.087 0.085 0.086 0.001 0.000 1.853 0.979 0.000 9–0.009 0.087 0.085 0.086 0.001 0.000 1.853 0.978 0.000 9–0.009 0.088 0.086 0.087 0.001 0.000 1.853 0.976 0.000 9–0.004 0.09 0.082 0.086 0.004 –0.004 1.853 0.907 0.000 90.004 0.099 0.081 0.09 0.009 –0.005 1.853 0.821 0.000 90.015 0.11 0.086 0.098 0.012 0.005 1.853 0.78 0.000 90.026 0.119 0.092 0.106 0.013 0.027 1.852 0.778 0.000 90.038 0.123 0.092 0.108 0.015 0.04 1.852 0.749 0.000 90.049 0.127 0.091 0.109 0.018 0.045 1.852 0.712 0.000 90.061 0.134 0.093 0.114 0.02 0.056 1.851 0.699 0.000 90.072 0.138 0.096 0.117 0.021 0.07 1.851 0.692 0.000 90.083 0.142 0.097 0.119 0.022 0.084 1.851 0.684 0.000 90.095 0.143 0.095 0.119 0.024 0.09 1.85 0.663 0.000 90.106 0.148 0.098 0.123 0.025 0.1 1.85 0.66 0.000 90.117 0.152 0.101 0.126 0.026 0.116 1.85 0.662 0.000 90.129 0.154 0.1 0.127 0.027 0.127 1.849 0.65 0.000 9

B. T
AN
ET A
L.D
AT
A R
EP
OR
T: CO
NSO
LID
AT
ION
AN
D S
TR
EN
GT
H C
HA
RA
CT
ER
ISTIC
S1
16
Table
Note: Se
Time (s) Area (cm2)
Axial membrane correction
Radial membrane correction
Axial drain correction
0 9.929 0.389 0.072 0.0002 9.929 0.389 0.072 0.0004 9.929 0.389 0.072 0.0006 9.929 0.389 0.072 0.0008 9.929 0.389 0.072 0.000
10 9.929 0.389 0.072 0.00012 9.929 0.389 0.072 0.00014 9.929 0.389 0.072 0.00016 9.929 0.389 0.072 0.00018 9.929 0.389 0.072 0.00020 9.929 0.389 0.072 0.00022 9.929 0.389 0.072 0.00024 9.929 0.389 0.072 0.00026 9.929 0.389 0.072 0.00028 9.929 0.389 0.072 0.00030 9.929 0.389 0.072 0.00032 9.929 0.389 0.072 0.00034 9.929 0.389 0.072 0.00036 9.929 0.389 0.072 0.00038 9.929 0.389 0.072 0.00040 9.929 0.389 0.072 0.00042 9.929 0.389 0.072 0.00044 9.929 0.389 0.072 0.00046 9.929 0.389 0.072 0.00048 9.929 0.389 0.072 0.00050 9.929 0.389 0.072 0.00052 9.929 0.389 0.072 0.000
T49. TX 644 undrained shearing data for resedimented sample.
e Table T3, p. 70, for explanation of headings.
εa (%) q/σvc p’σ/vc Δue/σvc Δus/σvc Δq/qmax E’/σvc A φ (°)
0 0.266 0.731 0 0 0 0 0 21.3271.74E–04 0.266 0.731 1.16E–04 8.05E–07 –1.04E–05 –0.987 –0.125 21.3271.74E–04 0.266 0.731 3.48E–04 4.15E–05 –7.48E–04 –70.83 –0.003 21.3242.33E–04 0.266 0.731 3.48E–04 1.17E–04 –1.37E–05 –0.969 –51.429 21.332.33E–04 0.266 0.731 3.48E–04 1.18E–06 –1.37E–05 –0.969 –0.19 21.3273.48E–04 0.266 0.731 5.79E–04 2.33E–04 –2.02E–05 –0.956 –69.742 21.3342.33E–04 0.266 0.731 5.79E–04 2.73E–04 –7.51E–04 –53.218 –1.875 21.3312.90E–04 0.266 0.731 5.79E–04 2.74E–04 –7.55E–04 –42.824 –1.867 21.3312.33E–04 0.266 0.731 8.11E–04 5.05E–04 –7.51E–04 –53.218 –3.747 21.3382.33E–04 0.266 0.731 8.11E–04 5.05E–04 –7.51E–04 –53.218 –3.747 21.3382.90E–04 0.266 0.731 8.11E–04 5.46E–04 –1.49E–03 –84.687 –1.886 21.3342.90E–04 0.266 0.731 9.27E–04 6.21E–04 –7.55E–04 –42.824 –4.661 21.3412.90E–04 0.266 0.731 9.27E–04 6.62E–04 –1.49E–03 –84.687 –2.357 21.3382.90E–04 0.266 0.731 9.27E–04 6.62E–04 –1.49E–03 –84.687 –2.357 21.3383.48E–04 0.266 0.731 9.27E–04 6.62E–04 –1.50E–03 –70.799 –2.352 21.338
–1.74E–03 0.266 0.729 2.20E–03 1.85E–03 1.00E–04 –0.949 112.117 21.3843.48E–04 0.266 0.73 2.32E–03 1.80E–03 5.14E–03 243.585 2.459 21.4143.48E–04 0.266 0.73 2.32E–03 1.76E–03 5.88E–03 278.506 2.151 21.4173.48E–04 0.267 0.73 2.43E–03 1.76E–03 8.10E–03 383.3 1.65 21.433.48E–04 0.267 0.73 2.55E–03 1.87E–03 1.03E–02 488.095 1.432 21.4474.07E–04 0.267 0.73 2.90E–03 2.05E–03 1.33E–02 537.208 1.273 21.4715.23E–04 0.267 0.73 3.01E–03 1.97E–03 1.69E–02 533.748 1.038 21.4916.97E–04 0.268 0.73 3.24E–03 2.11E–03 2.06E–02 487.473 0.955 21.5188.13E–04 0.268 0.73 3.36E–03 1.98E–03 2.50E–02 507.319 0.814 21.5419.30E–04 0.268 0.73 3.82E–03 2.20E–03 2.95E–02 522.199 0.787 21.5741.10E–03 0.269 0.73 3.94E–03 2.08E–03 3.39E–02 505.798 0.705 21.5971.39E–03 0.269 0.73 4.29E–03 2.14E–03 3.90E–02 461.3 0.666 21.631

B. T
AN
ET A
L.D
AT
A R
EP
OR
T: CO
NSO
LID
AT
ION
AN
D S
TR
EN
GT
H C
HA
RA
CT
ER
ISTIC
S1
17
Table cm.
Note: Se
Time (s) (cm2) ub (ksc)
Axial membrane correction
Radial membrane correction
Axial drainage
correction
0 .273 3.305 0.000 0.000 0.00010 .273 3.303 0.000 0.000 0.00020 .273 3.303 0.000 0.000 0.00030 .273 3.303 0.000 0.000 0.00040 .273 3.302 0.000 0.000 0.00050 .273 3.301 0.000 0.000 0.00060 .273 3.301 0.000 0.000 0.00070 .273 3.3 0.000 0.000 0.00080 .273 3.3 0.000 0.000 0.00090 .273 3.299 0.000 0.000 0.000
100 .273 3.299 0.000 0.000 0.000110 .273 3.298 0.000 0.000 0.000120 .273 3.298 0.000 0.000 0.000122 .273 3.298 0.000 0.000 0.000422 .274 3.304 0.000 0.000 0.000722 .276 3.306 0.000 0.000 0.000
1022 .275 3.323 0.001 0.000 0.0001322 .275 3.318 0.001 0.000 0.0001622 .275 3.311 0.002 0.000 0.0001922 .275 3.313 0.002 0.000 0.0002222 .275 3.316 0.002 0.000 0.0002522 .274 3.313 0.003 0.001 0.0002822 .275 3.315 0.003 0.001 0.0003122 .275 3.312 0.004 0.001 0.0003422 .275 3.312 0.004 0.001 0.0003722 .275 3.313 0.004 0.001 0.0004022 .275 3.317 0.005 0.001 0.000
T50. TX 645 consolidation data for Sample 204-1244B-3H-3WR, 125–135
e Table T3, p. 70, for explanation of headings.
εa (%) σ’v (ksc) σ’h (ksc) p’ (ksc) q (ksc) εv (%) e K Work Area
–0.006 0.214 0.213 0.213 0.001 –0.001 1.686 0.993 0.000 10–0.006 0.214 0.213 0.213 0.001 –0.001 1.686 0.993 0.000 10–0.006 0.215 0.213 0.214 0.001 –0.001 1.686 0.992 0.000 10–0.006 0.215 0.213 0.214 0.001 –0.001 1.686 0.993 0.000 10–0.006 0.215 0.212 0.214 0.001 –0.001 1.686 0.989 0.000 10–0.005 0.215 0.212 0.214 0.002 –0.001 1.686 0.984 0.000 10–0.005 0.216 0.211 0.213 0.002 –0.001 1.686 0.978 0.000 10–0.005 0.216 0.211 0.213 0.003 –0.001 1.686 0.974 0.000 10–0.004 0.217 0.210 0.213 0.003 –0.001 1.686 0.969 0.000 10–0.004 0.217 0.209 0.213 0.004 –0.001 1.686 0.964 0.000 10–0.003 0.218 0.209 0.213 0.004 –0.001 1.686 0.959 0.000 10–0.003 0.218 0.208 0.213 0.005 –0.001 1.686 0.954 0.000 10–0.002 0.218 0.207 0.213 0.005 –0.001 1.686 0.95 0.000 10–0.002 0.219 0.208 0.213 0.006 –0.001 1.686 0.949 0.000 100.010 0.228 0.196 0.212 0.016 –0.001 1.686 0.86 0.000 100.022 0.234 0.190 0.212 0.022 –0.001 1.686 0.812 0.000 100.034 0.257 0.216 0.236 0.021 0.012 1.686 0.838 0.000 100.045 0.269 0.233 0.251 0.018 0.032 1.685 0.869 0.000 100.057 0.269 0.229 0.249 0.020 0.044 1.685 0.849 0.000 100.069 0.273 0.226 0.249 0.023 0.053 1.685 0.83 0.000 100.080 0.281 0.234 0.258 0.023 0.066 1.684 0.834 0.000 100.092 0.284 0.237 0.26 0.024 0.079 1.684 0.833 0.000 100.104 0.289 0.238 0.263 0.026 0.09 1.684 0.824 0.000 100.115 0.293 0.241 0.267 0.026 0.102 1.683 0.822 0.000 100.127 0.295 0.240 0.268 0.028 0.112 1.683 0.812 0.000 100.139 0.3 0.242 0.271 0.029 0.123 1.683 0.808 0.000 100.151 0.308 0.253 0.281 0.028 0.138 1.682 0.821 0.000 10

B. T
AN
ET A
L.D
AT
A R
EP
OR
T: CO
NSO
LID
AT
ION
AN
D S
TR
EN
GT
H C
HA
RA
CT
ER
ISTIC
S1
18
Table 5–135 cm.
Note: Se
Time (s) Area (cm2)
Axial membrane correction
Radial membrane correction
Axial drain correction
0 10.270 0.516 0.103 0.0002 10.270 0.516 0.103 0.0004 10.270 0.516 0.103 0.0006 10.270 0.516 0.103 0.0008 10.270 0.516 0.103 0.000
10 10.270 0.516 0.103 0.00012 10.270 0.516 0.103 0.00014 10.270 0.516 0.103 0.00016 10.270 0.516 0.103 0.00018 10.270 0.516 0.103 0.00020 10.270 0.516 0.103 0.00022 10.270 0.516 0.103 0.00024 10.270 0.516 0.103 0.00026 10.270 0.516 0.103 0.00028 10.270 0.516 0.103 0.00030 10.270 0.516 0.103 0.00032 10.270 0.516 0.103 0.00034 10.270 0.516 0.103 0.00036 10.270 0.516 0.103 0.00038 10.270 0.516 0.103 0.00040 10.270 0.516 0.103 0.00042 10.270 0.516 0.103 0.00044 10.270 0.516 0.103 0.00046 10.270 0.516 0.103 0.00048 10.270 0.516 0.103 0.00050 10.270 0.516 0.103 0.00052 10.270 0.516 0.103 0.000
T51. TX 645 undrained shearing data for Sample 204-1244B-3H-3WR, 12
e Table T3, p. 70, for explanation of headings.
εa (%) q/σvc p’/σvc Δue/σvc Δus/σvc Δq/qmax E’/σvc A φ (°)
0 0.248 0.751 0 0 0 0.000 0.000 19.2545.96E–04 0.248 0.751 –9.01E–05 –1.19E–04 2.87E–04 6.914 –2.551 19.2525.96E–04 0.248 0.751 –1.80E–04 –1.99E–04 3.94E–04 9.474 –3.191 19.2505.96E–04 0.248 0.751 –3.00E–04 –3.29E–04 6.05E–04 14.576 –3.458 19.2485.96E–04 0.248 0.751 –4.06E–04 –4.24E–04 3.94E–04 9.474 –7.181 19.2445.96E–04 0.248 0.751 –5.11E–04 –5.09E–04 –3.10E–05 –0.747 114.625 19.2405.96E–04 0.248 0.751 –6.01E–04 –5.59E–04 –5.62E–04 –13.539 7.260 19.2365.96E–04 0.248 0.751 –7.06E–04 –6.74E–04 –9.87E–04 –23.77 5.089 19.2315.96E–04 0.247 0.752 –7.96E–04 –7.34E–04 –1.62E–03 –39.111 3.479 19.2265.96E–04 0.247 0.752 –8.86E–04 –8.08E–04 –2.26E–03 –54.462 2.822 19.2205.96E–04 0.247 0.752 –9.62E–04 –8.58E–04 –2.79E–03 –67.253 2.473 19.2165.96E–04 0.247 0.752 –1.07E–03 –9.38E–04 –3.32E–03 –80.035 2.298 19.2115.96E–04 0.247 0.752 –1.16E–03 –9.82E–04 –3.96E–03 –95.368 2.061 19.2075.96E–04 0.247 0.752 –1.25E–03 –1.07E–03 –4.39E–03 –105.599 2.028 19.2035.96E–04 0.247 0.752 –1.35E–03 –1.14E–03 –5.02E–03 –120.959 1.917 19.1971.19E–03 0.248 0.751 –3.91E–04 –5.09E–04 1.53E–03 18.416 –1.984 19.2482.38E–03 0.248 0.752 –7.51E–04 –1.14E–03 6.56E–03 39.513 –0.877 19.2572.38E–03 0.248 0.752 –2.25E–04 –6.14E–04 6.56E–03 39.513 –0.319 19.2712.38E–03 0.248 0.751 1.65E–04 –2.59E–04 6.99E–03 42.073 0.075 19.2832.38E–03 0.248 0.751 4.81E–04 5.68E–06 7.73E–03 46.546 0.338 19.2942.38E–03 0.248 0.751 7.51E–04 2.61E–04 8.37E–03 50.382 0.550 19.3042.38E–03 0.248 0.751 9.77E–04 4.35E–04 9.11E–03 54.86 0.666 19.3122.38E–03 0.248 0.75 1.22E–03 6.45E–04 9.75E–03 58.693 0.794 19.3212.38E–03 0.248 0.75 1.43E–03 8.20E–04 1.05E–02 63.168 0.878 19.3302.98E–03 0.248 0.75 1.65E–03 1.03E–03 1.12E–02 53.96 0.971 19.3392.98E–03 0.248 0.75 1.82E–03 1.16E–03 1.23E–02 59.076 0.990 19.3482.38E–03 0.249 0.75 2.01E–03 1.31E–03 1.35E–02 81.072 1.010 19.358

B. T
AN
ET A
L.D
AT
A R
EP
OR
T: CO
NSO
LID
AT
ION
AN
D S
TR
EN
GT
H C
HA
RA
CT
ER
ISTIC
S1
19
Table cm.
Note: Se
Time (s) (cm2) ub (ksc)
Axial membrane correction
Radial membrane correction
Axial drainage
correction
0 .892 2.958 0.000 0.000 0.00010 .892 2.958 0.000 0.000 0.00020 .892 2.956 0.000 0.000 0.00030 .892 2.954 0.000 0.000 0.00040 .892 2.952 0.000 0.000 0.00050 .892 2.951 0.000 0.000 0.00060 .892 2.950 0.000 0.000 0.00070 .892 2.950 0.000 0.000 0.00080 .892 2.949 0.000 0.000 0.00090 .892 2.948 0.000 0.000 0.000
100 .892 2.947 0.000 0.000 0.000110 .892 2.947 0.000 0.000 0.000120 .892 2.946 0.000 0.000 0.000130 .892 2.945 0.000 0.000 0.000140 .892 2.945 0.000 0.000 0.000149 .892 2.944 0.000 0.000 0.000449 .893 2.949 0.000 0.000 0.000749 .893 2.954 0.001 0.000 0.000
1049 .893 2.970 0.001 0.000 0.0001349 .893 2.970 0.001 0.000 0.0001649 .893 2.967 0.002 0.000 0.0001949 .893 2.968 0.002 0.000 0.0002249 .893 2.968 0.002 0.000 0.0002549 .893 2.968 0.003 0.001 0.0002849 .893 2.968 0.003 0.001 0.0003149 .893 2.972 0.004 0.001 0.0003449 .893 2.966 0.004 0.001 0.000
T52. TX 646 consolidation data for Sample 204-1244C-9H-5WR, 115–125
e Table T3, p. 70, for explanation of headings.
εa (%) σ’v (ksc) σ’h (ksc) p’ (ksc) q (ksc) εv (%) e K Work Area
–0.004 0.247 0.245 0.246 0.001 0.001 1.477 0.991 0.000 9–0.004 0.247 0.245 0.246 0.001 0 1.477 0.993 0.000 9–0.004 0.248 0.247 0.247 0.000 0.001 1.477 0.996 0.000 9–0.004 0.248 0.248 0.248 0.000 0.001 1.477 0.999 0.000 9–0.004 0.248 0.248 0.248 0.000 0.001 1.477 1.002 0.000 9–0.004 0.247 0.247 0.247 0.000 0.001 1.477 1.002 0.000 9–0.004 0.247 0.247 0.247 0.000 0.001 1.477 0.998 0.000 9–0.004 0.248 0.246 0.247 0.001 0.001 1.477 0.993 0.000 9–0.004 0.249 0.245 0.247 0.002 0.001 1.477 0.986 0.000 9–0.003 0.249 0.244 0.247 0.003 0.001 1.477 0.979 0.000 9–0.003 0.250 0.243 0.247 0.004 0.001 1.477 0.972 0.000 9–0.002 0.251 0.242 0.247 0.004 0.001 1.477 0.965 0.000 9–0.002 0.252 0.241 0.246 0.005 0.002 1.477 0.959 0.000 9–0.002 0.252 0.240 0.246 0.006 0.002 1.477 0.952 0.000 9–0.002 0.253 0.239 0.246 0.007 0.002 1.477 0.946 0.000 9–0.001 0.254 0.239 0.246 0.008 0.002 1.477 0.940 0.000 90.009 0.276 0.224 0.250 0.026 0.002 1.477 0.811 0.000 90.021 0.322 0.266 0.294 0.028 0.011 1.477 0.824 0.000 90.032 0.326 0.269 0.298 0.029 0.027 1.477 0.824 0.000 90.044 0.335 0.269 0.302 0.033 0.037 1.476 0.803 0.000 90.056 0.344 0.273 0.308 0.035 0.049 1.476 0.795 0.000 90.067 0.352 0.278 0.315 0.037 0.06 1.476 0.791 0.000 90.078 0.359 0.283 0.321 0.038 0.071 1.475 0.787 0.000 90.089 0.367 0.289 0.328 0.039 0.084 1.475 0.788 0.000 90.101 0.372 0.290 0.331 0.041 0.094 1.475 0.779 0.000 90.113 0.384 0.301 0.342 0.041 0.107 1.475 0.785 0.000 90.125 0.386 0.301 0.343 0.042 0.12 1.474 0.780 0.000 9

B. T
AN
ET A
L.D
AT
A R
EP
OR
T: CO
NSO
LID
AT
ION
AN
D S
TR
EN
GT
H C
HA
RA
CT
ER
ISTIC
S1
20
Table 5–125 cm.
Note: Se
Time (s) Area (cm2)
Axial membrane correction
Radial membrane correction
Axial drain correction
98 9.874 0.551 0.111 0.000100 9.874 0.551 0.111 0.000102 9.874 0.551 0.111 0.000104 9.874 0.551 0.111 0.000106 9.874 0.551 0.111 0.000108 9.874 0.551 0.111 0.000110 9.874 0.551 0.111 0.000112 9.874 0.551 0.111 0.000114 9.874 0.551 0.111 0.000116 9.874 0.551 0.111 0.000118 9.874 0.551 0.111 0.000120 9.874 0.551 0.111 0.000122 9.874 0.551 0.111 0.000124 9.874 0.551 0.111 0.000126 9.874 0.551 0.111 0.000128 9.874 0.551 0.111 0.000130 9.874 0.551 0.111 0.000132 9.874 0.551 0.111 0.000134 9.874 0.551 0.111 0.000136 9.874 0.551 0.111 0.000138 9.874 0.551 0.111 0.000140 9.874 0.551 0.111 0.000142 9.874 0.551 0.111 0.000144 9.875 0.551 0.111 0.000146 9.875 0.551 0.111 0.000148 9.875 0.551 0.111 0.000150 9.875 0.551 0.111 0.000
T53. TX 646 undrained shearing data for Sample 204-1244C-9H-5WR, 11
e Table T3, p. 70, for explanation of headings.
εa (%) q/σvc p’/σvc Δue/σvc Δus/σvc Δq/qmax E’/σvc A φ (°)
0 0.247 0.751 7.97E–04 7.28E–04 7.40E–03 0.000 1.128 19.2310 0.248 0.751 9.31E–04 7.07E–04 1.12E–02 0.000 0.844 19.2470 0.248 0.751 1.10E–03 6.74E–04 1.52E–02 0.000 0.692 19.2650 0.248 0.752 1.25E–03 6.50E–04 1.92E–02 0.000 0.606 19.2820 0.248 0.752 1.43E–03 6.44E–04 2.32E–02 0.000 0.557 19.2996.16E–04 0.249 0.752 1.60E–03 7.03E–04 2.67E–02 537.412 0.546 19.3176.16E–04 0.249 0.752 1.78E–03 7.50E–04 3.08E–02 618.549 0.530 19.3366.16E–04 0.249 0.752 1.96E–03 8.04E–04 3.48E–02 699.685 0.520 19.3551.23E–03 0.249 0.752 2.13E–03 8.15E–04 3.87E–02 389.352 0.503 19.3731.23E–03 0.250 0.752 2.32E–03 8.52E–04 4.26E–02 428.571 0.495 19.3911.23E–03 0.250 0.752 2.51E–03 8.48E–04 4.65E–02 467.785 0.481 19.4091.85E–03 0.250 0.752 2.70E–03 8.96E–04 5.05E–02 338.646 0.477 19.4281.85E–03 0.250 0.752 2.89E–03 9.43E–04 5.46E–02 365.685 0.473 19.4471.85E–03 0.251 0.752 3.08E–03 9.50E–04 5.86E–02 392.728 0.464 19.4651.85E–03 0.251 0.752 3.27E–03 9.17E–04 6.28E–02 421.129 0.451 19.4832.46E–03 0.251 0.752 3.46E–03 9.85E–04 6.73E–02 338.302 0.452 19.5052.46E–03 0.251 0.752 3.66E–03 1.02E–03 7.16E–02 359.935 0.448 19.5253.08E–03 0.252 0.752 3.87E–03 1.01E–03 7.59E–02 305.189 0.440 19.5443.08E–03 0.252 0.752 4.06E–03 9.95E–04 8.04E–02 323.294 0.433 19.5633.08E–03 0.252 0.753 4.26E–03 9.86E–04 8.47E–02 340.323 0.427 19.5823.70E–03 0.252 0.753 4.46E–03 1.04E–03 8.86E–02 296.793 0.428 19.6013.70E–03 0.253 0.753 4.65E–03 1.13E–03 9.26E–02 310.081 0.432 19.6213.70E–03 0.253 0.753 4.84E–03 1.17E–03 9.66E–02 323.597 0.431 19.6404.31E–03 0.253 0.753 5.03E–03 1.23E–03 1.00E–01 288.604 0.432 19.6594.31E–03 0.253 0.753 5.21E–03 1.17E–03 1.04E–01 299.808 0.424 19.6754.93E–03 0.254 0.753 5.39E–03 1.13E–03 1.08E–01 271.933 0.417 19.6904.93E–03 0.254 0.753 5.57E–03 1.13E–03 1.12E–01 281.058 0.415 19.707
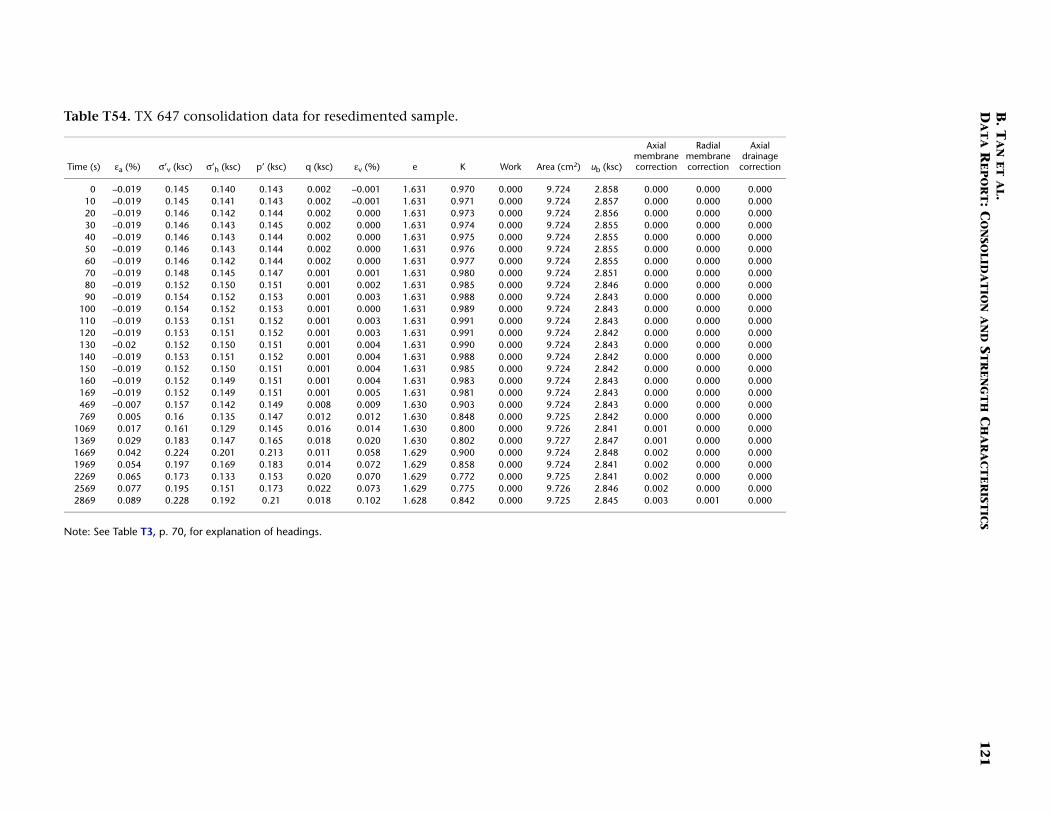
B. T
AN
ET A
L.D
AT
A R
EP
OR
T: CO
NSO
LID
AT
ION
AN
D S
TR
EN
GT
H C
HA
RA
CT
ER
ISTIC
S1
21
Table
Note: Se
Time (s) (cm2) ub (ksc)
Axial membrane correction
Radial membrane correction
Axial drainage
correction
0 724 2.858 0.000 0.000 0.00010 724 2.857 0.000 0.000 0.00020 724 2.856 0.000 0.000 0.00030 724 2.855 0.000 0.000 0.00040 724 2.855 0.000 0.000 0.00050 724 2.855 0.000 0.000 0.00060 724 2.855 0.000 0.000 0.00070 724 2.851 0.000 0.000 0.00080 724 2.846 0.000 0.000 0.00090 724 2.843 0.000 0.000 0.000
100 724 2.843 0.000 0.000 0.000110 724 2.843 0.000 0.000 0.000120 724 2.842 0.000 0.000 0.000130 724 2.843 0.000 0.000 0.000140 724 2.842 0.000 0.000 0.000150 724 2.842 0.000 0.000 0.000160 724 2.843 0.000 0.000 0.000169 724 2.843 0.000 0.000 0.000469 724 2.843 0.000 0.000 0.000769 725 2.842 0.000 0.000 0.000
1069 726 2.841 0.001 0.000 0.0001369 727 2.847 0.001 0.000 0.0001669 724 2.848 0.002 0.000 0.0001969 724 2.841 0.002 0.000 0.0002269 725 2.841 0.002 0.000 0.0002569 726 2.846 0.002 0.000 0.0002869 725 2.845 0.003 0.001 0.000
T54. TX 647 consolidation data for resedimented sample.
e Table T3, p. 70, for explanation of headings.
εa (%) σ’v (ksc) σ’h (ksc) p’ (ksc) q (ksc) εv (%) e K Work Area
–0.019 0.145 0.140 0.143 0.002 –0.001 1.631 0.970 0.000 9.–0.019 0.145 0.141 0.143 0.002 –0.001 1.631 0.971 0.000 9.–0.019 0.146 0.142 0.144 0.002 0.000 1.631 0.973 0.000 9.–0.019 0.146 0.143 0.145 0.002 0.000 1.631 0.974 0.000 9.–0.019 0.146 0.143 0.144 0.002 0.000 1.631 0.975 0.000 9.–0.019 0.146 0.143 0.144 0.002 0.000 1.631 0.976 0.000 9.–0.019 0.146 0.142 0.144 0.002 0.000 1.631 0.977 0.000 9.–0.019 0.148 0.145 0.147 0.001 0.001 1.631 0.980 0.000 9.–0.019 0.152 0.150 0.151 0.001 0.002 1.631 0.985 0.000 9.–0.019 0.154 0.152 0.153 0.001 0.003 1.631 0.988 0.000 9.–0.019 0.154 0.152 0.153 0.001 0.000 1.631 0.989 0.000 9.–0.019 0.153 0.151 0.152 0.001 0.003 1.631 0.991 0.000 9.–0.019 0.153 0.151 0.152 0.001 0.003 1.631 0.991 0.000 9.–0.02 0.152 0.150 0.151 0.001 0.004 1.631 0.990 0.000 9.–0.019 0.153 0.151 0.152 0.001 0.004 1.631 0.988 0.000 9.–0.019 0.152 0.150 0.151 0.001 0.004 1.631 0.985 0.000 9.–0.019 0.152 0.149 0.151 0.001 0.004 1.631 0.983 0.000 9.–0.019 0.152 0.149 0.151 0.001 0.005 1.631 0.981 0.000 9.–0.007 0.157 0.142 0.149 0.008 0.009 1.630 0.903 0.000 9.0.005 0.16 0.135 0.147 0.012 0.012 1.630 0.848 0.000 9.0.017 0.161 0.129 0.145 0.016 0.014 1.630 0.800 0.000 9.0.029 0.183 0.147 0.165 0.018 0.020 1.630 0.802 0.000 9.0.042 0.224 0.201 0.213 0.011 0.058 1.629 0.900 0.000 9.0.054 0.197 0.169 0.183 0.014 0.072 1.629 0.858 0.000 9.0.065 0.173 0.133 0.153 0.020 0.070 1.629 0.772 0.000 9.0.077 0.195 0.151 0.173 0.022 0.073 1.629 0.775 0.000 9.0.089 0.228 0.192 0.21 0.018 0.102 1.628 0.842 0.000 9.

B. T
AN
ET A
L.D
AT
A R
EP
OR
T: CO
NSO
LID
AT
ION
AN
D S
TR
EN
GT
H C
HA
RA
CT
ER
ISTIC
S1
22
Table
Note: Se
Time (s) Area (cm2)
Axial membrane correction
Radial membrane correction
Axial drain correction
38 9.715 0.342 0.069 0.00040 9.715 0.342 0.069 0.00042 9.715 0.342 0.069 0.00044 9.715 0.342 0.069 0.00046 9.715 0.342 0.069 0.00048 9.715 0.342 0.069 0.00050 9.715 0.342 0.069 0.00052 9.715 0.342 0.069 0.00054 9.715 0.342 0.069 0.00056 9.715 0.342 0.069 0.00058 9.715 0.342 0.069 0.00060 9.715 0.342 0.069 0.00062 9.715 0.342 0.069 0.00064 9.715 0.342 0.069 0.00066 9.715 0.342 0.069 0.00068 9.715 0.342 0.069 0.00070 9.715 0.342 0.069 0.00072 9.715 0.342 0.069 0.00074 9.715 0.342 0.069 0.00076 9.715 0.342 0.069 0.00078 9.715 0.342 0.069 0.00080 9.715 0.342 0.069 0.00082 9.715 0.342 0.069 0.00084 9.715 0.342 0.069 0.00086 9.715 0.342 0.069 0.00088 9.715 0.342 0.069 0.00090 9.715 0.342 0.069 0.000
T55. TX 647 undrained shearing data for resedimented sample.
e Table T3, p. 70, for explanation of headings.
εa (%) q/σvc p’/vc Δue/σvc Δus/σvc Δq/qmax E’/vc A φ (°)
0 0.166 0.82 0 0 0 0.000 0.000 11.651–5.81E–05 0.166 0.818 1.49E–04 1.59E–03 1.62E–04 –276.761 10.213 11.6790 0.166 0.817 1.49E–04 2.78E–03 1.61E–04 0.000 17.685 11.6970 0.166 0.816 2.99E–04 3.53E–03 1.61E–04 0.000 22.340 11.707
–5.81E–05 0.166 0.819 1.49E–04 6.40E–04 3.23E–04 –552.688 2.325 11.6710.166 0.826 1.49E–04 –6.62E–03 1.61E–04 0.000 –40.95 11.5620.166 0.832 0 –1.26E–02 1.61E–04 0.000 –78.181 11.477
5.72E–05 0.166 0.836 0 –1.66E–02 1.61E–04 279.566 –103.577 11.4215.72E–05 0.166 0.84 0 –2.01E–02 1.61E–04 279.566 –125.039 11.3740 0.166 0.841 0 –2.13E–02 1.61E–04 0.000 –132.161 11.3585.72E–05 0.166 0.839 0 –1.99E–02 1.61E–04 279.566 –124.107 11.376
–1.15E–04 0.166 0.836 –1.50E–04 –1.59E–02 3.23E–04 –278.814 –49.212 11.436–5.81E–05 0.166 0.832 0 –1.26E–02 1.62E–04 –276.761 –77.978 11.477–5.81E–05 0.166 0.829 –1.50E–04 –9.46E–03 1.62E–04 –276.761 –58.487 11.5215.72E–05 0.166 0.827 –1.50E–04 –7.82E–03 1.61E–04 279.566 –48.525 11.5450 0.166 0.828 –1.50E–04 –8.62E–03 3.22E–04 0.000 –26.532 11.5395.72E–05 0.166 0.83 –1.50E–04 –1.04E–02 1.61E–04 279.566 –64.388 11.5090 0.166 0.831 –2.99E–04 –1.18E–02 0 0.000 0.000 11.4835.72E–05 0.166 0.832 –2.99E–04 –1.21E–02 1.61E–04 279.566 –75.588 11.4840 0.166 0.831 –2.99E–04 –1.19E–02 1.61E–04 0.000 –73.529 11.4880 0.166 0.829 –2.99E–04 –9.76E–03 1.61E–04 0.000 –60.499 11.5170 0.166 0.826 –2.99E–04 –6.57E–03 0 0.000 0.000 11.557
–5.81E–05 0.166 0.824 –2.99E–04 –4.33E–03 4.18E–07 –0.715 –10414.67 11.5890 0.166 0.824 –4.49E–04 –4.59E–03 3.22E–04 0.000 –13.965 11.596
–5.81E–05 0.166 0.824 –2.99E–04 –4.41E–03 1.13E–03 –1932.439 –3.59 11.6250 0.167 0.824 –1.50E–04 –4.33E–03 2.26E–03 0.000 –1.596 11.663
–1.15E–04 0.167 0.825 1.49E–04 –4.60E–03 3.06E–03 –2642.392 –1.176 11.686

B. T
AN
ET A
L.D
AT
A R
EP
OR
T: CO
NSO
LID
AT
ION
AN
D S
TR
EN
GT
H C
HA
RA
CT
ER
ISTIC
S1
23
Table
Note: Se
Time (s) (cm2) ub (ksc)
Axial membrane correction
Radial membrane correction
Axial drainage
correction
0 836 3.313 0.000 0.000 0.00010 836 3.313 0.000 0.000 0.00020 836 3.305 0.000 0.000 0.00030 836 3.302 0.000 0.000 0.00040 836 3.309 0.000 0.000 0.00050 836 3.311 0.000 0.000 0.00060 836 3.310 0.000 0.000 0.00070 836 3.310 0.000 0.000 0.00080 836 3.310 0.000 0.000 0.000
260 838 3.306 0.000 0.000 0.000440 839 3.317 0.000 0.000 0.000620 838 3.316 0.000 0.000 0.000800 838 3.314 0.000 0.000 0.000980 838 3.317 0.001 0.000 0.000
1160 838 3.315 0.001 0.000 0.0001340 838 3.315 0.001 0.000 0.0001520 838 3.315 0.001 0.000 0.0001700 838 3.315 0.001 0.000 0.0001880 838 3.315 0.001 0.000 0.0002060 838 3.316 0.002 0.000 0.0002240 838 3.315 0.002 0.000 0.0002420 838 3.315 0.002 0.000 0.0002600 838 3.315 0.002 0.000 0.0002780 838 3.316 0.003 0.000 0.0002960 838 3.316 0.003 0.001 0.0003140 838 3.315 0.003 0.001 0.0003320 838 3.316 0.003 0.001 0.000
T56. TX 650 consolidation data for resedimented sample.
e Table T3, p. 70, for explanation of headings.
εa (%) σ’v (ksc) σ’h (ksc) p’ (ksc) q (ksc) εv (%) e K Work Area
–0.003 0.116 0.135 0.126 –0.009 0.005 1.918 1.159 0.000 9.–0.003 0.117 0.135 0.126 –0.009 0.005 1.918 1.159 0.000 9.–0.003 0.122 0.142 0.132 –0.01 0.007 1.918 1.160 0.000 9.–0.003 0.124 0.143 0.134 –0.01 0.008 1.918 1.156 0.000 9.–0.003 0.116 0.136 0.126 –0.01 0.007 1.918 1.169 0.000 9.–0.003 0.113 0.132 0.122 –0.01 0.006 1.918 1.171 0.000 9.–0.003 0.112 0.131 0.121 –0.009 0.006 1.918 1.170 0.000 9.–0.002 0.110 0.129 0.119 –0.009 0.006 1.918 1.167 0.000 9.–0.002 0.107 0.125 0.116 –0.009 0.005 1.918 1.169 0.000 9.0.001 0.087 0.096 0.092 –0.004 –0.012 1.918 1.097 0.000 9.0.004 0.107 0.115 0.111 –0.004 –0.013 1.918 1.075 0.000 9.0.009 0.129 0.139 0.134 –0.005 0.001 1.918 1.078 0.000 9.0.014 0.129 0.136 0.132 –0.003 0.007 1.918 1.052 0.000 9.0.020 0.129 0.132 0.130 –0.002 0.010 1.918 1.025 0.000 9.0.026 0.139 0.141 0.140 –0.001 0.016 1.917 1.012 0.000 9.0.032 0.145 0.144 0.144 0.000 0.023 1.917 0.997 0.000 9.0.038 0.147 0.143 0.145 0.002 0.029 1.917 0.976 0.000 9.0.043 0.147 0.143 0.145 0.002 0.034 1.917 0.969 0.000 9.0.049 0.152 0.145 0.148 0.004 0.040 1.917 0.953 0.000 9.0.056 0.156 0.148 0.152 0.004 0.048 1.917 0.946 0.000 9.0.062 0.157 0.147 0.152 0.005 0.054 1.916 0.933 0.000 9.0.068 0.157 0.145 0.151 0.006 0.060 1.916 0.922 0.000 9.0.075 0.160 0.146 0.153 0.007 0.065 1.916 0.910 0.000 9.0.081 0.165 0.149 0.157 0.008 0.073 1.916 0.907 0.000 9.0.088 0.165 0.149 0.157 0.008 0.080 1.916 0.900 0.000 9.0.095 0.166 0.147 0.156 0.009 0.085 1.915 0.887 0.000 9.0.102 0.170 0.150 0.160 0.010 0.092 1.915 0.883 0.000 9.

B. T
AN
ET A
L.D
AT
A R
EP
OR
T: CO
NSO
LID
AT
ION
AN
D S
TR
EN
GT
H C
HA
RA
CT
ER
ISTIC
S1
24
Table
Note: Se
Time (s) Area (cm2)
Axial membrane correction
Radial membrane correction
Axial drain correction
0 9.822 0.356 0.072 0.0002 9.822 0.356 0.072 0.0004 9.822 0.356 0.072 0.0006 9.822 0.356 0.072 0.0008 9.822 0.356 0.072 0.000
10 9.822 0.356 0.072 0.00012 9.822 0.356 0.072 0.00014 9.822 0.356 0.072 0.00016 9.822 0.356 0.072 0.00018 9.822 0.356 0.072 0.00020 9.822 0.356 0.072 0.00022 9.822 0.356 0.072 0.00024 9.822 0.356 0.072 0.00026 9.822 0.356 0.072 0.00028 9.822 0.356 0.072 0.00030 9.822 0.356 0.072 0.00032 9.822 0.356 0.072 0.00034 9.822 0.356 0.072 0.00036 9.822 0.356 0.072 0.00038 9.822 0.356 0.072 0.00040 9.822 0.356 0.072 0.00042 9.822 0.356 0.072 0.00044 9.822 0.356 0.072 0.00046 9.822 0.356 0.072 0.00048 9.822 0.356 0.072 0.00050 9.822 0.356 0.072 0.00052 9.822 0.356 0.072 0.000
T57. TX 650 undrained shearing data for resedimented sample.
e Table T3, p. 70, for explanation of headings.
εa (%) q/σvc p’/vc Δue/σvc Δus/σvc Δq/qmax E’/vc A φ (°)
0 0.238 0.754 0 0 0 0 0 18.4391.01E–03 0.238 0.754 –1.13E–04 –7.02E–05 1.23E–04 –12.861 0.876 18.4321.02E–03 0.238 0.754 0 1.57E–04 1.23E–04 –12.731 –0.879 18.4382.45E–04 0.239 0.754 2.27E–04 1.41E–04 –5.73E–04 244.9 0.568 18.4645.48E–04 0.239 0.754 2.27E–04 2.80E–05 –5.70E–04 109.17 0.38 18.4611.60E–03 0.239 0.754 3.41E–04 2.99E–04 –4.47E–04 29.307 0.971 18.4638.38E–04 0.239 0.754 3.41E–04 2.56E–04 –5.68E–04 71.032 0.764 18.4671.95E–04 0.239 0.753 3.41E–04 6.35E–04 –4.58E–04 246.64 1.655 18.472
–1.71E–05 0.239 0.753 3.41E–04 1.13E–03 –3.45E–04 –2117.092 3.452 18.481.28E–03 0.239 0.752 2.27E–04 1.46E–03 –6.79E–04 55.671 2.391 18.5011.04E–03 0.239 0.752 3.41E–04 2.15E–03 –6.81E–04 68.346 3.337 18.5193.96E–04 0.239 0.751 3.41E–04 2.86E–03 –5.71E–04 151.16 5.113 18.5336.66E–05 0.239 0.751 3.41E–04 3.28E–03 –3.44E–04 541.738 9.43 18.5351.10E–03 0.239 0.75 3.41E–04 3.55E–03 –2.21E–04 21.144 15.68 18.5381.92E–03 0.239 0.751 –2.27E–04 3.10E–03 –2.14E–04 11.711 14.154 18.5269.66E–04 0.239 0.751 5.68E–04 3.49E–03 –1.37E–03 148.813 2.762 18.5793.84E–05 0.239 0.751 6.82E–04 3.49E–03 –1.38E–03 3761.253 2.747 18.589.16E–04 0.239 0.751 6.82E–04 3.23E–03 –1.49E–03 170.215 2.402 18.5771.61E–03 0.239 0.751 6.82E–04 3.15E–03 –1.37E–03 89.036 2.535 18.5711.21E–03 0.239 0.751 6.82E–04 3.01E–03 –1.14E–03 99.04 2.85 18.5584.69E–04 0.239 0.751 6.82E–04 2.96E–03 –1.26E–03 281.805 2.576 18.5628.27E–04 0.239 0.751 6.82E–04 2.85E–03 –1.26E–03 159.443 2.496 18.5591.24E–03 0.239 0.751 6.82E–04 2.81E–03 –1.37E–03 115.719 2.293 18.5621.84E–03 0.239 0.751 7.95E–04 3.04E–03 –1.36E–03 77.575 2.46 18.5688.27E–04 0.239 0.751 5.68E–04 2.74E–03 –1.26E–03 159.443 2.41 18.5563.13E–04 0.239 0.751 6.82E–04 2.58E–03 –1.38E–03 461.675 2.123 18.5561.36E–03 0.239 0.751 6.82E–04 2.70E–03 –1.37E–03 105.664 2.215 18.559
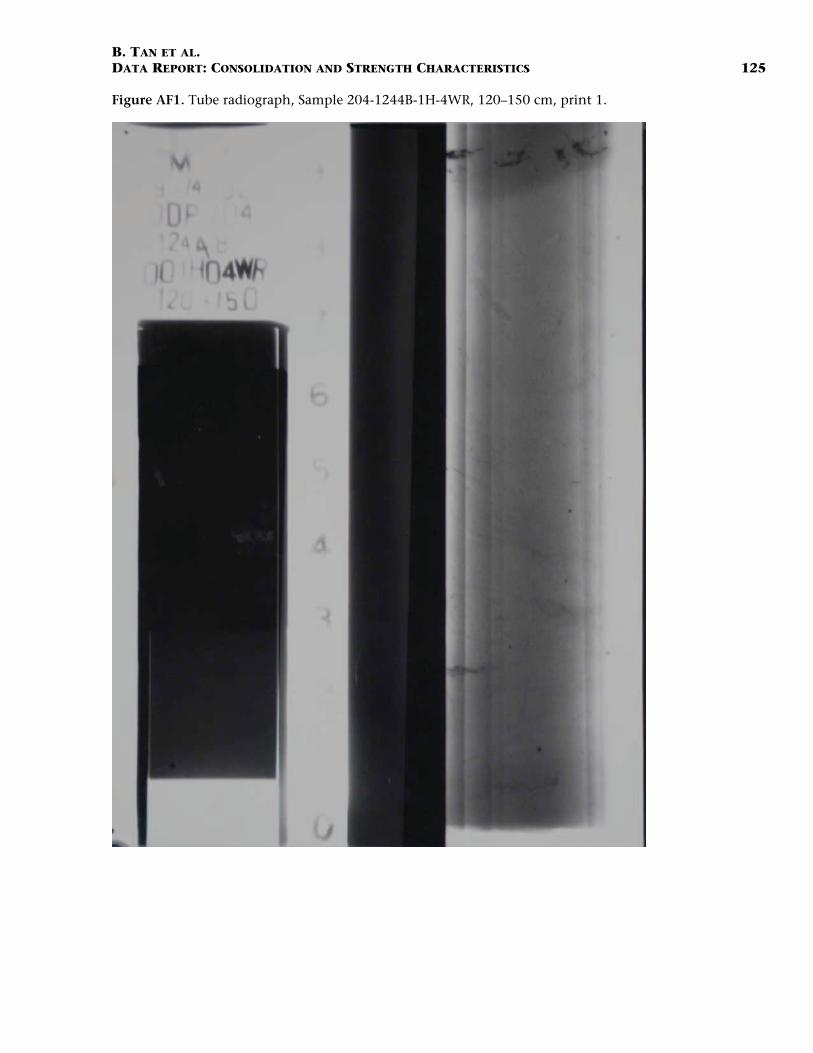
B. TAN ET AL.DATA REPORT: CONSOLIDATION AND STRENGTH CHARACTERISTICS 125
Figure AF1. Tube radiograph, Sample 204-1244B-1H-4WR, 120–150 cm, print 1.

B. TAN ET AL.DATA REPORT: CONSOLIDATION AND STRENGTH CHARACTERISTICS 126
Figure AF2. Tube radiograph, Sample 204-1244B-1H-4WR, 120–150 cm, print 2.

B. TAN ET AL.DATA REPORT: CONSOLIDATION AND STRENGTH CHARACTERISTICS 127
Figure AF3. Tube radiograph, Sample 204-1244B-3H-3WR, 120–160 cm, print 1.

B. TAN ET AL.DATA REPORT: CONSOLIDATION AND STRENGTH CHARACTERISTICS 128
Figure AF4. Tube radiograph, Sample 204-1244B-3H-3WR, 120–160 cm, print 2.

B. TAN ET AL.DATA REPORT: CONSOLIDATION AND STRENGTH CHARACTERISTICS 129
Figure AF5. Tube radiograph, Sample 204-1244B-4H-6WR, 120–150 cm, print 1.

B. TAN ET AL.DATA REPORT: CONSOLIDATION AND STRENGTH CHARACTERISTICS 130
Figure AF6. Tube radiograph, Sample 204-1244B-4H-6WR, 120–150 cm, print 2.

B. TAN ET AL.DATA REPORT: CONSOLIDATION AND STRENGTH CHARACTERISTICS 131
Figure AF7. Tube radiograph, Sample 204-1244B-6H-8WR, 0–30 cm, print 1.

B. TAN ET AL.DATA REPORT: CONSOLIDATION AND STRENGTH CHARACTERISTICS 132
Figure AF8. Tube radiograph, Sample 204-1244B-6H-8WR, 0–30 cm, print 2.

B. TAN ET AL.DATA REPORT: CONSOLIDATION AND STRENGTH CHARACTERISTICS 133
Figure AF9. Tube radiograph, Sample 204-1244C-8H-7WR, 66 cm, print 1.

B. TAN ET AL.DATA REPORT: CONSOLIDATION AND STRENGTH CHARACTERISTICS 134
Figure AF10. Tube radiograph, Sample 204-1244C-8H-7WR, 66 cm, print 2.
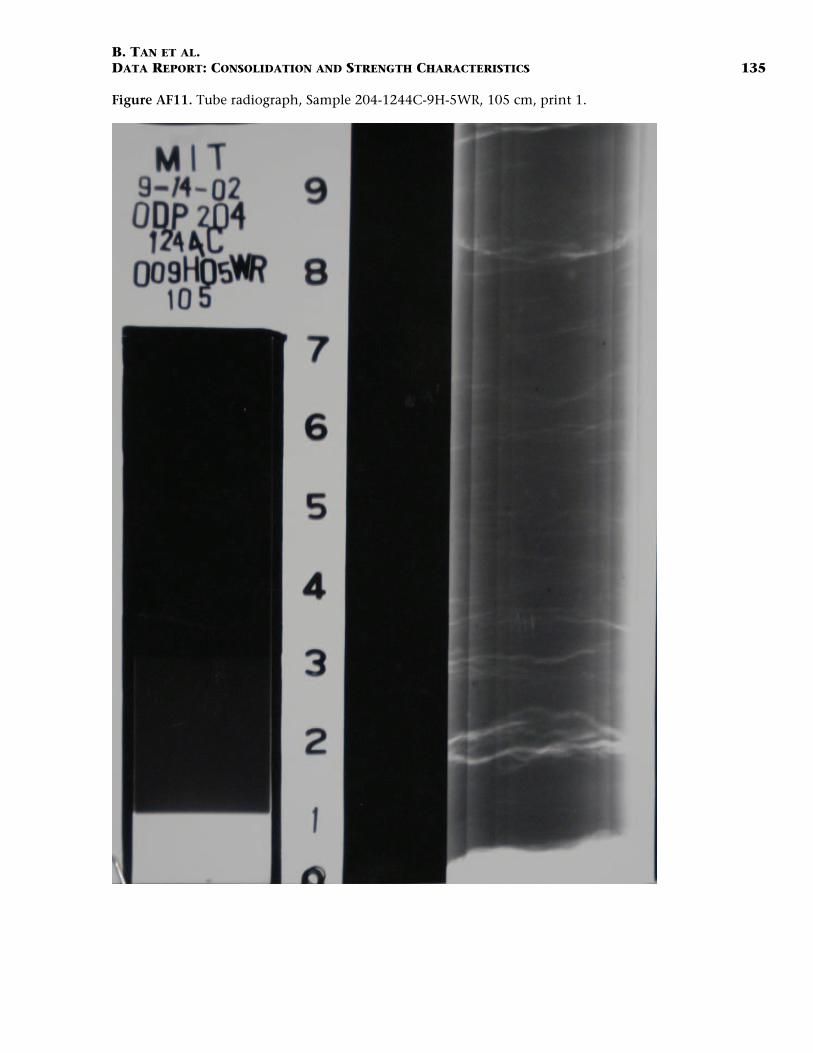
B. TAN ET AL.DATA REPORT: CONSOLIDATION AND STRENGTH CHARACTERISTICS 135
Figure AF11. Tube radiograph, Sample 204-1244C-9H-5WR, 105 cm, print 1.
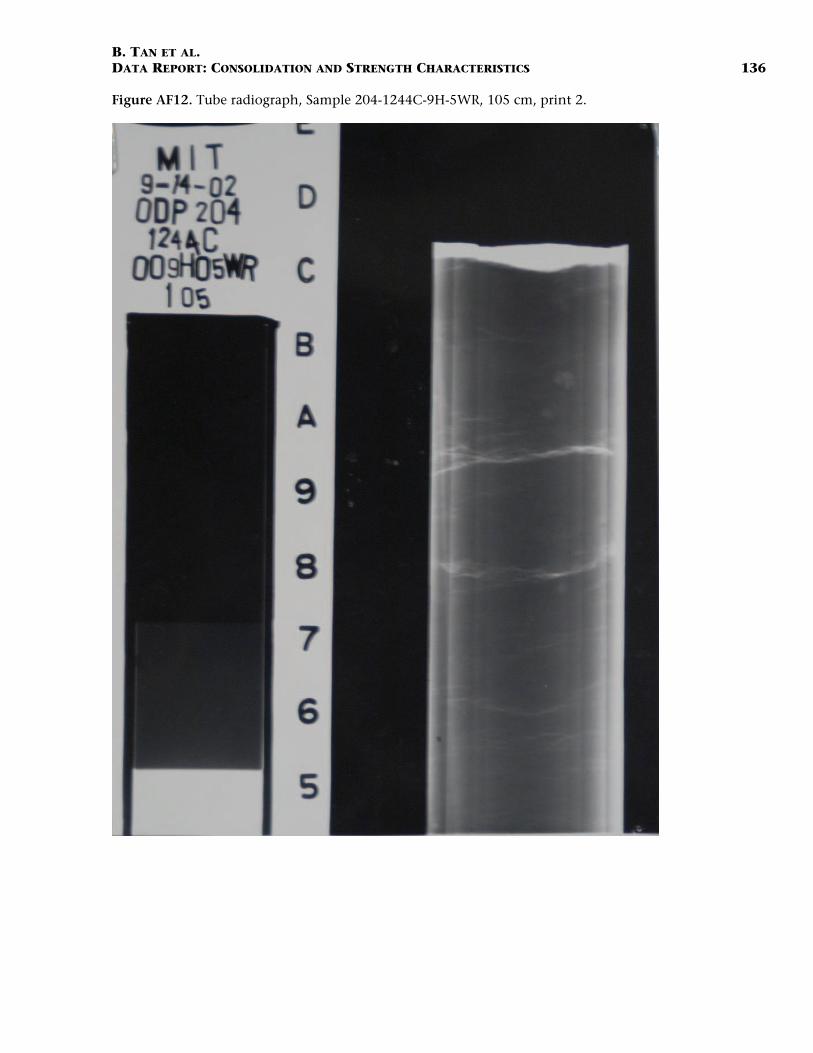
B. TAN ET AL.DATA REPORT: CONSOLIDATION AND STRENGTH CHARACTERISTICS 136
Figure AF12. Tube radiograph, Sample 204-1244C-9H-5WR, 105 cm, print 2.

B. TAN ET AL.DATA REPORT: CONSOLIDATION AND STRENGTH CHARACTERISTICS 137
Figure AF13. Tube radiograph, Sample 204-1244B-13H-3WR, 120 cm, print 1.

B. TAN ET AL.DATA REPORT: CONSOLIDATION AND STRENGTH CHARACTERISTICS 138
Figure AF14. Tube radiograph, Sample 204-1244B-13H-3WR, 120 cm, print 2.

B. TAN ET AL.DATA REPORT: CONSOLIDATION AND STRENGTH CHARACTERISTICS 139
Figure AF15. Tube radiograph, Sample 204-1244C-17H-3WR, 65 cm, print 1.

B. TAN ET AL.DATA REPORT: CONSOLIDATION AND STRENGTH CHARACTERISTICS 140
Figure AF16. Tube radiograph, Sample 204-1244C-17H-3WR, 65 cm, print 2.

B. TAN ET AL.DATA REPORT: CONSOLIDATION AND STRENGTH CHARACTERISTICS 141
Figure AF17. Radiography log, Sample 204-1244B-1H-4WR, 120–150 cm.
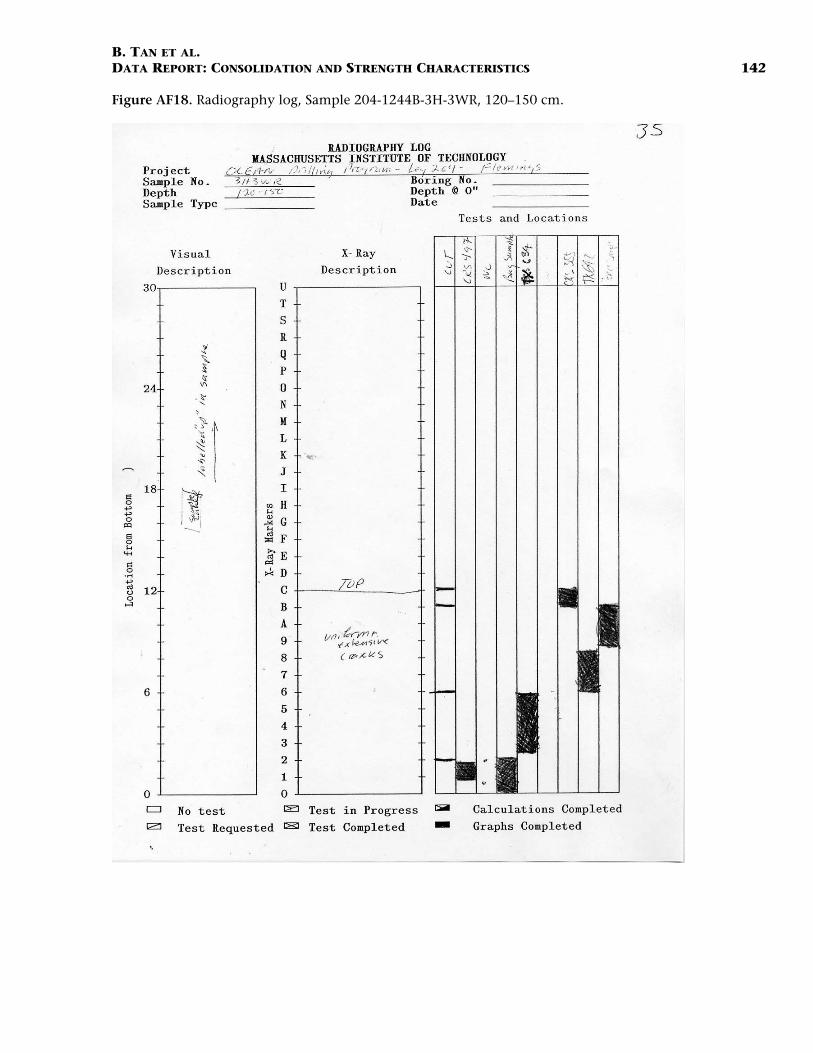
B. TAN ET AL.DATA REPORT: CONSOLIDATION AND STRENGTH CHARACTERISTICS 142
Figure AF18. Radiography log, Sample 204-1244B-3H-3WR, 120–150 cm.

B. TAN ET AL.DATA REPORT: CONSOLIDATION AND STRENGTH CHARACTERISTICS 143
Figure AF19. Radiography log, Sample 204-1244B-4H-6WR, 120–150 cm.

B. TAN ET AL.DATA REPORT: CONSOLIDATION AND STRENGTH CHARACTERISTICS 144
Figure AF20. Radiography log, Sample 204-1244B-6H-8WR, 0–30 cm.

B. TAN ET AL.DATA REPORT: CONSOLIDATION AND STRENGTH CHARACTERISTICS 145
Figure AF21. Radiography log, Sample 204-1244C-8H-7WR, 66 cm.

B. TAN ET AL.DATA REPORT: CONSOLIDATION AND STRENGTH CHARACTERISTICS 146
Figure AF22. Radiography log, Sample 204-1244C-9H-5WR, 105 cm.

B. TAN ET AL.DATA REPORT: CONSOLIDATION AND STRENGTH CHARACTERISTICS 147
Figure AF23. Radiography log, Sample 204-1244C-13H-3WR, 120 cm.

B. TAN ET AL.DATA REPORT: CONSOLIDATION AND STRENGTH CHARACTERISTICS 148
Figure AF24. Radiography log, Sample 204-1244C-17H-3WR, 65 cm.
Related Documents


