1 Competitive Market Competitive Market Hall and Lieberman, 3 Hall and Lieberman, 3 rd rd edition, edition, Thomson South Thomson South- -Western, Chapter 8 Western, Chapter 8

Welcome message from author
This document is posted to help you gain knowledge. Please leave a comment to let me know what you think about it! Share it to your friends and learn new things together.
Transcript

8/7/2019 12 competitive market
http://slidepdf.com/reader/full/12-competitive-market 1/35
1
Competitive MarketCompetitive MarketHall and Lieberman, 3Hall and Lieberman, 3rdrd edition,edition,
Thomson South Thomson South--Western, Chapter 8 Western, Chapter 8

8/7/2019 12 competitive market
http://slidepdf.com/reader/full/12-competitive-market 2/35
2
O verview O verview
What you will learn in this lecture What you will learn in this lecture
1.1. Short run equilibriumShort run equilibrium
Profit or lossProfit or loss
2.2. Long run equilibriumLong run equilibrium
Zero profitsZero profits
3.3. Perfect competition and plant size in the long runPerfect competition and plant size in the long run
4.4. What happens when things change? What happens when things change?

8/7/2019 12 competitive market
http://slidepdf.com/reader/full/12-competitive-market 3/35
3
Figure 1: Perfect CompetitionFigure 1: Perfect Competition
Quantity
Demanded at
Different Prices
Quantity
Supplied at
Different Prices
Quantity Supplied
by Each Firm
Quantity
Demanded by
Each Consumer
IndividualDemand
Curve
IndividualSupplyCurve
Quantity Demanded
by All Consumers at
Different Prices
Quantity Supplied by
All Firms at Different
Prices
MarketDemand
Curve
MarketSupplyCurve
P S
D
Q
Market Equilibrium
Added together Added together

8/7/2019 12 competitive market
http://slidepdf.com/reader/full/12-competitive-market 4/35
4
Part I. ShortPart I. Short--Run EquilibriumRun Equilibrium
InIn perfect competition, market sums buying perfect competition, market sums buying and selling preferences of individualand selling preferences of individualconsumers and producers, and determinesconsumers and producers, and determines
market pricemarket price Each buyer and seller then takes marketEach buyer and seller then takes market
price as givenprice as given
Each is able to buy or sell desired quantity Each is able to buy or sell desired quantity
Competitive firmsCompetitive firms can earncan earn an economic profit oran economic profit orsuffer an economic losssuffer an economic loss
Example: Figure 2Example: Figure 2

8/7/2019 12 competitive market
http://slidepdf.com/reader/full/12-competitive-market 5/35
Figure 2Figure 2 ShortShort--run Profit Maximizationrun Profit Maximization
10 firms each producing 100 units10 firms each producing 100 units
ShortShort--run equilibrium conditions met (K fixed)run equilibrium conditions met (K fixed)FirmFirm Industry Industry
P P
q Q
D
S
MC ATC
P0P0
1000100
8/7/2019 12 competitive market
http://slidepdf.com/reader/full/12-competitive-market 6/35
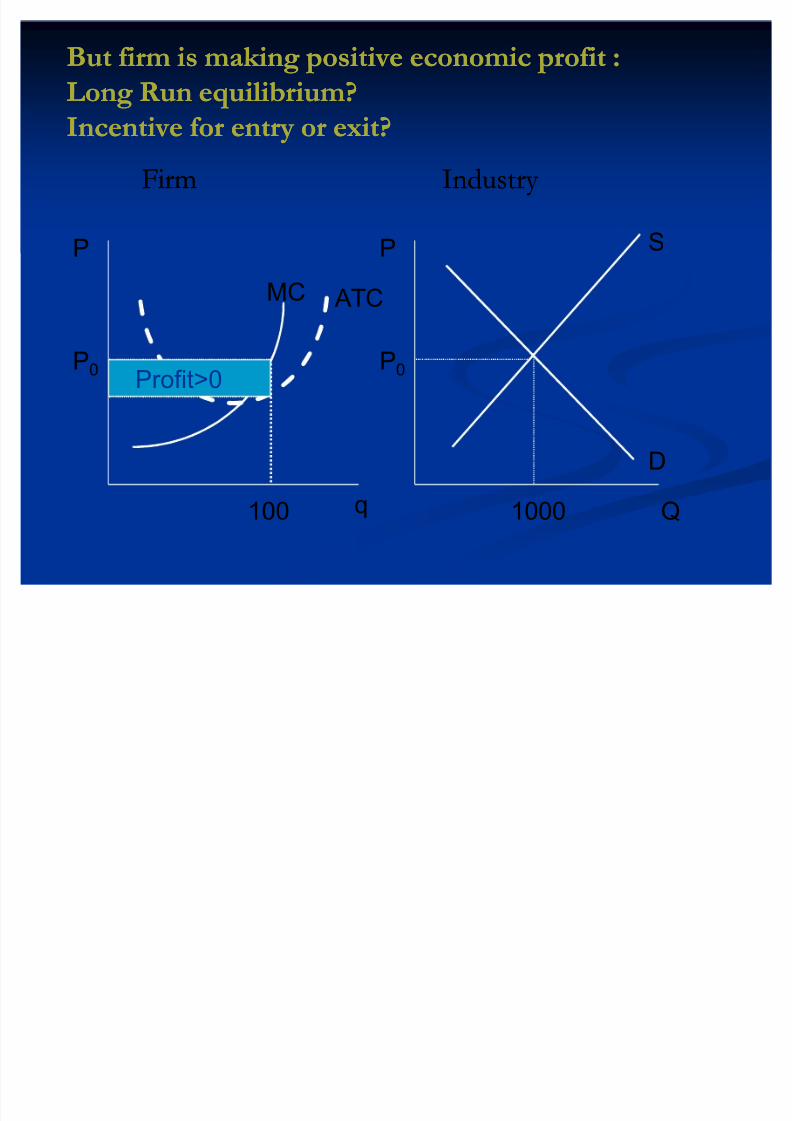
But firm is making positive economic profit :But firm is making positive economic profit :
Long Run equilibrium?Long Run equilibrium?
Incentive for entry or exit?Incentive for entry or exit?FirmFirm Industry Industry
P P
q Q
D
S
MC ATC
P0P0
1000100
Profit>0
8/7/2019 12 competitive market
http://slidepdf.com/reader/full/12-competitive-market 7/35
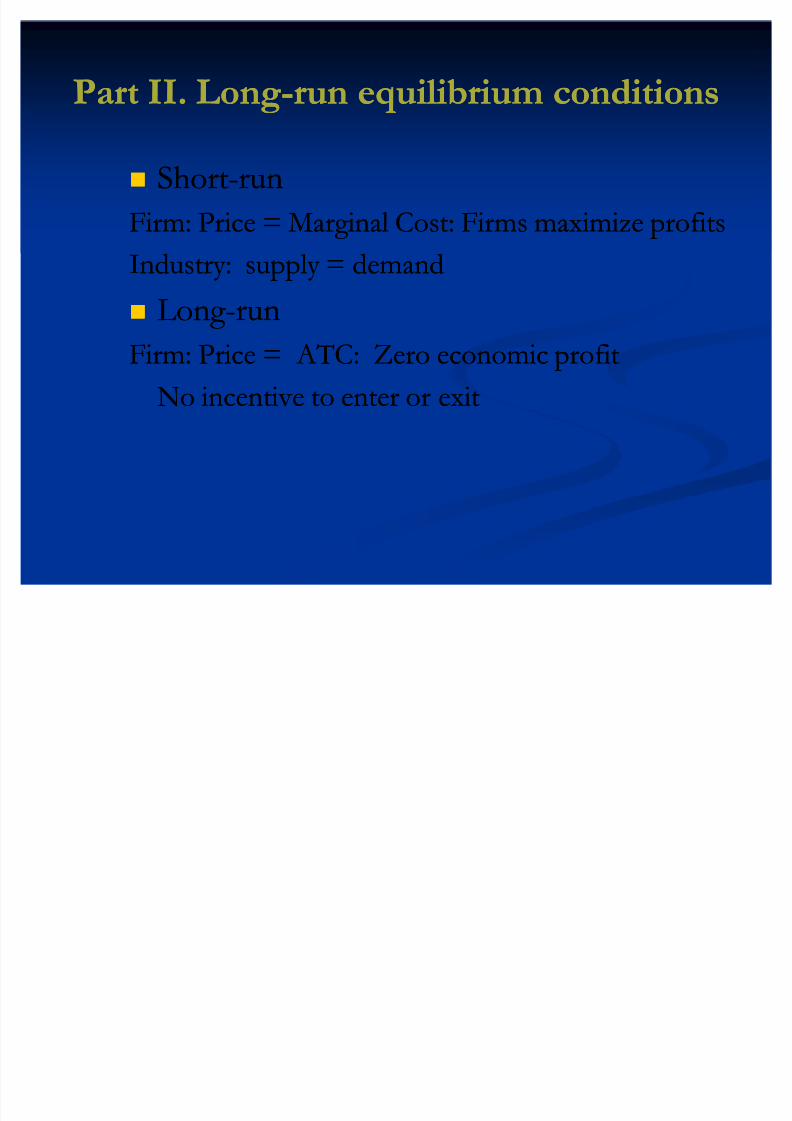
Part II. LongPart II. Long--run equilibrium conditionsrun equilibrium conditions
ShortShort--runrun
Firm: Price = Marginal Cost: Firms maximize profitsFirm: Price = Marginal Cost: Firms maximize profits
Industry: supply = demandIndustry: supply = demand Long Long--runrun
Firm: Price = ATC: Zero economic profitFirm: Price = ATC: Zero economic profit
No incentive to enter or exitNo incentive to enter or exit

8/7/2019 12 competitive market
http://slidepdf.com/reader/full/12-competitive-market 8/35
8
Profit and Loss in the Long RunProfit and Loss in the Long Run
Economic profit and loss are the forces driving long Economic profit and loss are the forces driving long--run changerun change
Entry of outsiders if expecting continued economic profitEntry of outsiders if expecting continued economic profit
Exit of insiders if expecting lossesExit of insiders if expecting losses
In real world entry and exit occur literally every day In real world entry and exit occur literally every day
In some cases, we see entry occur through formation of In some cases, we see entry occur through formation of an entirely new firm or occur when an existing firman entirely new firm or occur when an existing firmadds a new product to its lineadds a new product to its line
Exit can occur in different waysExit can occur in different ways Selling off its assets and freeing itself once and for all from allSelling off its assets and freeing itself once and for all from all
costscosts
Switches out of a particular product line, even as it continuesSwitches out of a particular product line, even as it continuesto produce other thingsto produce other things

8/7/2019 12 competitive market
http://slidepdf.com/reader/full/12-competitive-market 9/35
Figure 3 Positive Economic Profit Invites Entry in theFigure 3 Positive Economic Profit Invites Entry in the
LongLong--run and Causes Industry Supply to Riserun and Causes Industry Supply to RiseFirmFirm Industry Industry
P P
q Q
D
S
MC ATC
P0P0
1000100
P1 P1
S
90 1080

8/7/2019 12 competitive market
http://slidepdf.com/reader/full/12-competitive-market 10/35
LongLong--run equilibriumrun equilibrium
Number of firms rises to12 firms = 1080/90Number of firms rises to12 firms = 1080/90
P = ATCP = ATCFirmFirm Industry Industry
P P
q Q
D
S
MC ATC
P0P0
1000100
P1 P1
S
90 1080

8/7/2019 12 competitive market
http://slidepdf.com/reader/full/12-competitive-market 11/35
11
From ShortFrom Short--Run Profit to LongRun Profit to Long--Run EquilibriumRun Equilibrium
---- start with profit in the short runstart with profit in the short run Positive economic profit will attract new entrantsPositive economic profit will attract new entrants
Increasing number of firms in marketIncreasing number of firms in market
As number of firms increases, market supply curve will As number of firms increases, market supply curve will
shift rightward causing several things to happenshift rightward causing several things to happen
1.1. Market price fallsMarket price falls
2.2. Then demand curve facing each firm shifts Then demand curve facing each firm shifts
downwarddownward
3.3. Each then slide down its marginal cost curve,Each then slide down its marginal cost curve,
decreasing outputdecreasing output

8/7/2019 12 competitive market
http://slidepdf.com/reader/full/12-competitive-market 12/35
12
From ShortFrom Short--Run Profit to LongRun Profit to Long--Run EquilibriumRun Equilibrium
---- start with profit in the short runstart with profit in the short run This process of adjustment continues, requiring This process of adjustment continues, requiring
market supply curve to shift rightward enough,market supply curve to shift rightward enough,and the price to fall enoughand the price to fall enough
Until when the reason for entry Until when the reason for entry ²²positivepositiveprofitprofit²²no longer exitsno longer exits
So that each existing firm is earning So that each existing firm is earning zerozeroeconomic profiteconomic profit
In sum, in a competitive market, positiveIn sum, in a competitive market, positiveeconomic profit continues to attract new economic profit continues to attract new entrants until economic profit is reduced to zeroentrants until economic profit is reduced to zero

8/7/2019 12 competitive market
http://slidepdf.com/reader/full/12-competitive-market 13/35
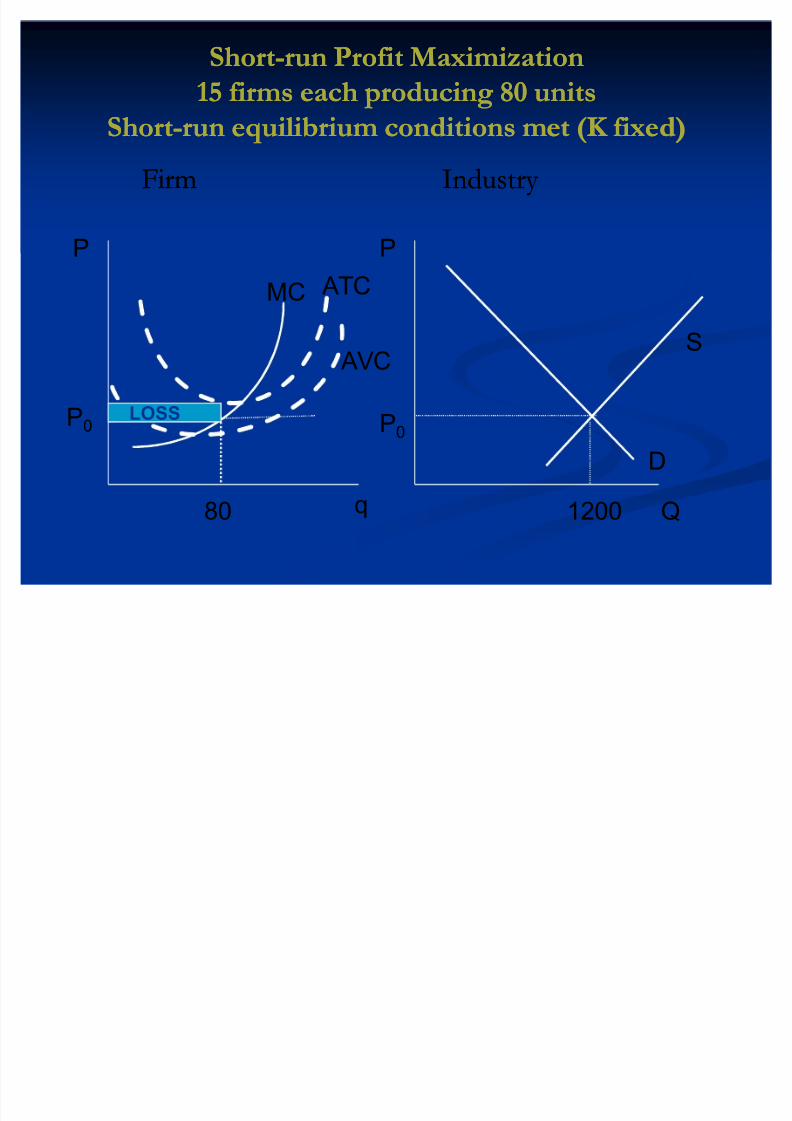
Figure 4 : ShortFigure 4 : Short--run Profit Maximizationrun Profit Maximization
15 firms each producing 80 units15 firms each producing 80 units
ShortShort--run equilibrium conditions met (K fixed)run equilibrium conditions met (K fixed)FirmFirm Industry Industry
P P
q Q
D
S
MC ATC
P0P0
120080
AVC
8/7/2019 12 competitive market
http://slidepdf.com/reader/full/12-competitive-market 14/35
ShortShort--run Profit Maximizationrun Profit Maximization
15 firms each producing 80 units15 firms each producing 80 units
ShortShort--run equilibrium conditions met (K fixed)run equilibrium conditions met (K fixed)FirmFirm Industry Industry
P P
q Q
D
S
MC ATC
P0P0
120080
AVC
LOSS
8/7/2019 12 competitive market
http://slidepdf.com/reader/full/12-competitive-market 15/35
FirmFirm Industry Industry
P P
q Q
D
S
MC ATC
P0P0
120080
AVC
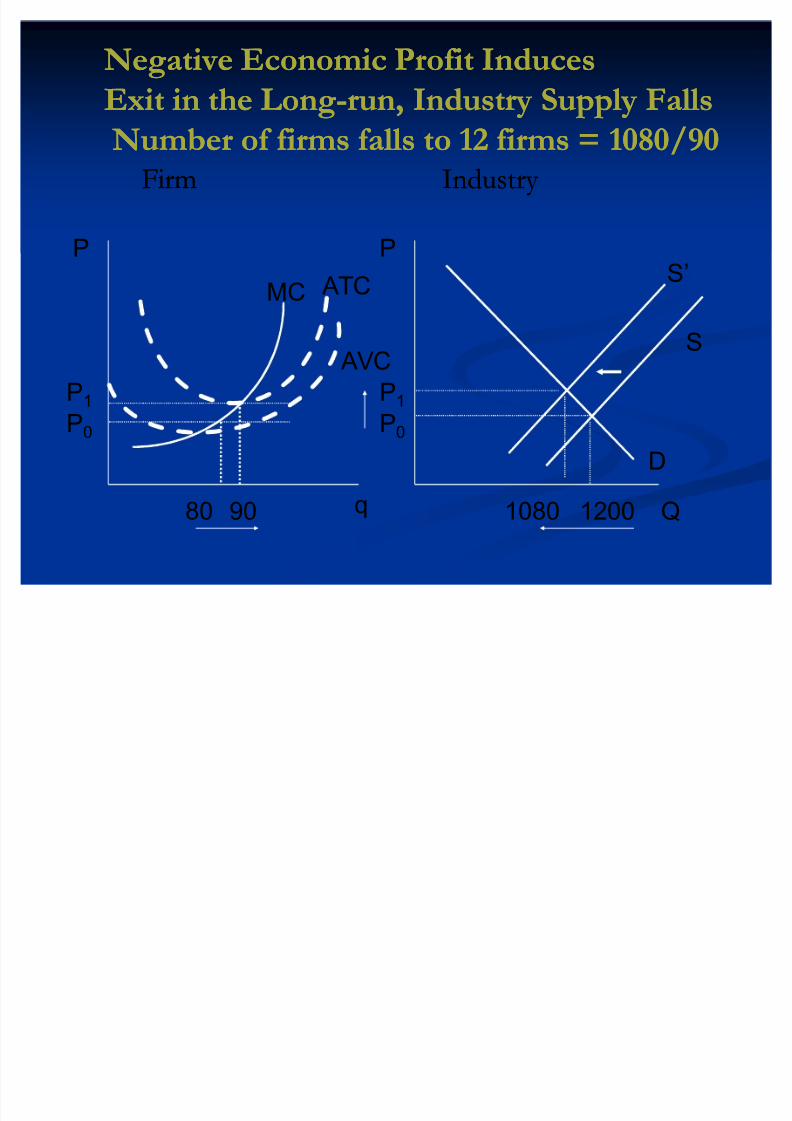
Negative Economic Profit InducesNegative Economic Profit Induces
Exit in the LongExit in the Long--run, Industry Supply Fallsrun, Industry Supply Falls
Number of firms falls to 12 firms = 1080/90Number of firms falls to 12 firms = 1080/90
P1 P1
S
90 1080

8/7/2019 12 competitive market
http://slidepdf.com/reader/full/12-competitive-market 16/35
16
From ShortFrom Short--Run Profit to LongRun Profit to Long--Run EquilibriumRun Equilibrium
---- start with loss in the short runstart with loss in the short run
In a competitive market, economic lossesIn a competitive market, economic losses
continue to cause exit until losses arecontinue to cause exit until losses are
reduced to zeroreduced to zero
Raising market price until typical firmRaising market price until typical firm
breaks even againbreaks even again
8/7/2019 12 competitive market
http://slidepdf.com/reader/full/12-competitive-market 17/35
17
Distinguishing ShortDistinguishing Short--Run fromRun from
LongLong--RunO
utcomesRunO
utcomes In shortIn short--run equilibrium, competitiverun equilibrium, competitive
firms can earn profitsfirms can earn profits or or suffer lossessuffer losses
In long In long--run equilibrium, after entry orrun equilibrium, after entry orexit has occurred, economic profit isexit has occurred, economic profit isalwaysalways ze roze ro
When economists look at a market, they When economists look at a market, they choose the period more appropriate forchoose the period more appropriate forquestion at handquestion at hand

8/7/2019 12 competitive market
http://slidepdf.com/reader/full/12-competitive-market 18/35
18
Figure 5a/b: From ShortFigure 5a/b: From Short--Run Profit ToRun Profit To
LongLong--Run EquilibriumRun Equilibrium
S 1
d 1 ATC
MC
$4.50
With initial supplycurve S 1, marketprice is $4.50«$4.50
900,000 9,000
So each firmearns an
economic profit. A A
Price per Bushel
Market
Bushelsper Year
Dollars
Firm
Bushelsper Year
D

8/7/2019 12 competitive market
http://slidepdf.com/reader/full/12-competitive-market 19/35
19
Figure 5c/d: From ShortFigure 5c/d: From Short--Run Profit ToRun Profit To
LongLong--Run EquilibriumRun Equilibrium
S 1
d 1 ATC
MC
$4.50
Profit attracts entry, shiftingthe supply curve rightward«
$4.50
900,000 9,0005,000
until market price falls to$2.50 and each firm earnszero economic profit.
S 2
d 1
A A
2.502.50EE
Market Firm
Price per Bushel
Bushelsper Year
Dollars
Bushelsper Year
D
1,200,000

8/7/2019 12 competitive market
http://slidepdf.com/reader/full/12-competitive-market 20/35
20
Part III. The Notion of Zero Profit inPart III. The Notion of Zero Profit in
Perfect CompetitionPerfect Competition
The same forces The same forces²²entry and exitentry and exit²²thatthatcause all firms to earn zero economiccause all firms to earn zero economic
profit also ensureprofit also ensure in long in long--run equilibrium, every run equilibrium, every
competitive firm will select its plantcompetitive firm will select its plant
size and output level so that itsize and output level so that itoperates atoperates at minimum point of itsminimum point of itsLRATC curveLRATC curve
8/7/2019 12 competitive market
http://slidepdf.com/reader/full/12-competitive-market 21/35
21
Perfect Competition and Plant SizePerfect Competition and Plant Size
Figure 6 illustrates a firm in a perfectly competitive marketFigure 6 illustrates a firm in a perfectly competitive market
Left panel does not show a true long Left panel does not show a true long--run equilibriumrun equilibrium
In long In long--run typical firm will want to expand by sliding run typical firm will want to expand by sliding down its LRATC curve and produce more output at adown its LRATC curve and produce more output at a
lower cost per unitlower cost per unit potentially earn an economic profitpotentially earn an economic profit
Same opportunity to earn positive economic profitSame opportunity to earn positive economic profit will attract new entrants that will establish larger will attract new entrants that will establish largerplants from the outsetplants from the outset
Entry and expansion must continue in this market untilEntry and expansion must continue in this market untilthe price falls to Pthe price falls to P* where each firm earn zero economic* where each firm earn zero economicprofitprofit
8/7/2019 12 competitive market
http://slidepdf.com/reader/full/12-competitive-market 22/35
22
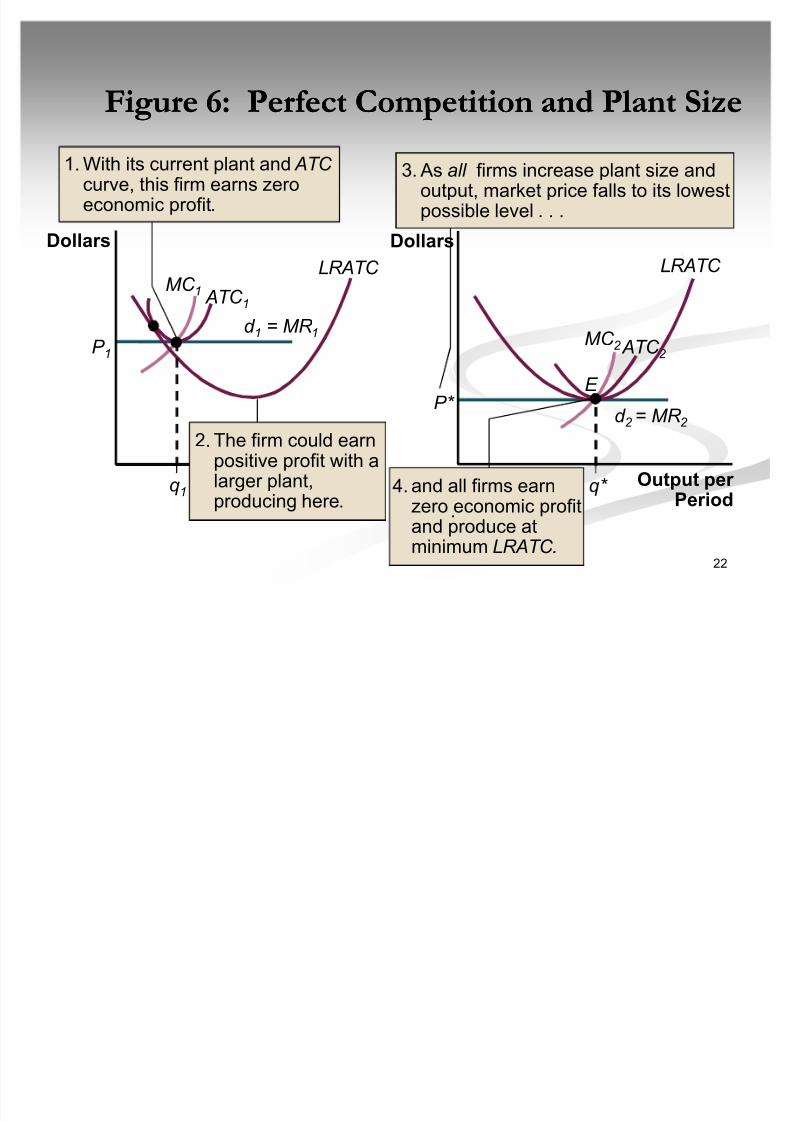
Figure 6: Perfect Competition and Plant SizeFigure 6: Perfect Competition and Plant Size
P 1
q1
d 1 = MR 1
LRATC MC 1 ATC 1
E
d 2 = MR 2
LRATC
MC 2 ATC 2
P*
q* 4.and all firms earnzero economic profitand produce at
minimum LRATC.
.
Dollars Dollars
Output per Period
Output per Period
3. As all firms increase plant size andoutput, market price falls to its lowestpossible level . . .
1.With its current plant and ATC curve, this firm earns zeroeconomic profit.
2.The firm could earnpositive profit with alarger plant,producing here.

8/7/2019 12 competitive market
http://slidepdf.com/reader/full/12-competitive-market 23/35
23
A Summary of the Competitive Firm in A Summary of the Competitive Firm in
the Longthe Long--RunRun At each competitive firm in long At each competitive firm in long--runrun
equilibriumequilibrium
P = MC = minimum ATC = minimumP = MC = minimum ATC = minimum
LRATCLRATC This equality is satisfied when the typical firm This equality is satisfied when the typical firm
produces at point E in figure 6produces at point E in figure 6
Where its demand, marginal cost, ATC, and Where its demand, marginal cost, ATC, and
LRATC curves all intersectLRATC curves all intersect In perfect competition, consumers are getting In perfect competition, consumers are getting
the best deal they could possibly getthe best deal they could possibly get
8/7/2019 12 competitive market
http://slidepdf.com/reader/full/12-competitive-market 24/35
24
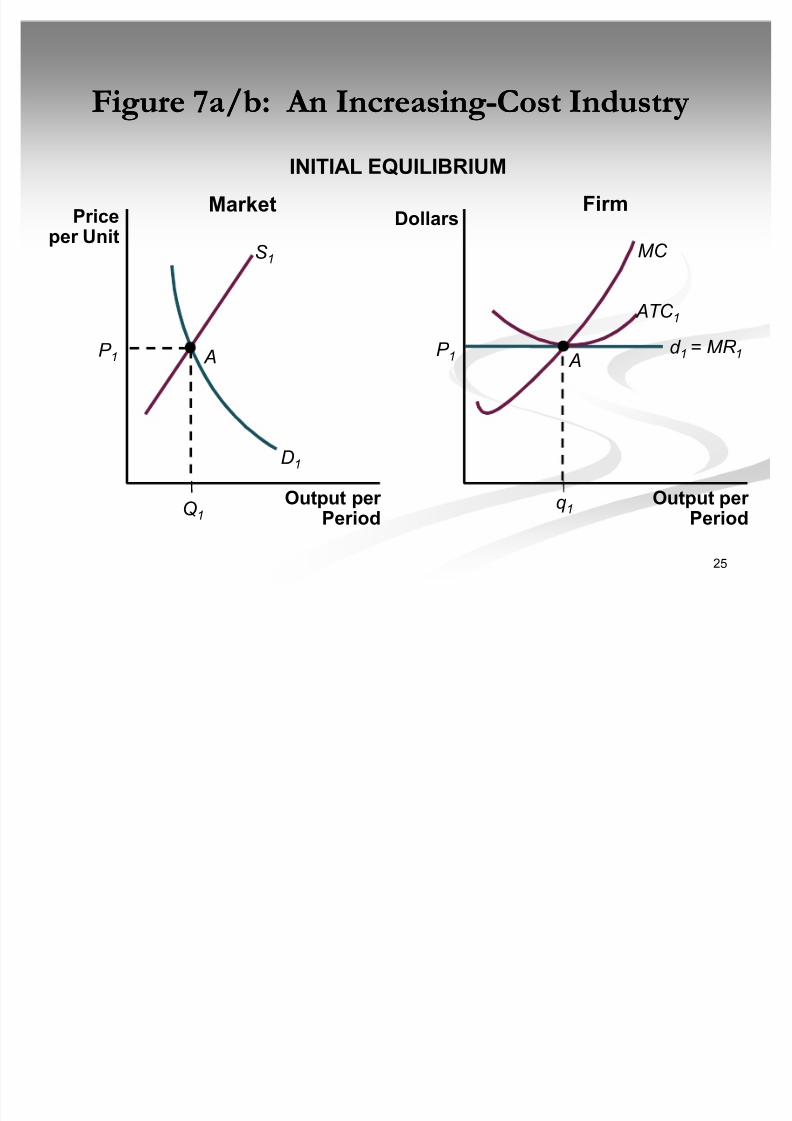
Part IV. What Happens When Things Change?Part IV. What Happens When Things Change?
---- 1. A Change in Demand1. A Change in Demand
ShortShort--run impact of an increase in demand isrun impact of an increase in demand is
Rise in market priceRise in market price
Rise in market quantity Rise in market quantity
Economic profitsEconomic profits This will cause: This will cause:
More entrants and higher market supply More entrants and higher market supply
Market equilibrium will move from point A to point CMarket equilibrium will move from point A to point C
Long Long--run supply curverun supply curve indicating quantity of output that all sellers in a market willindicating quantity of output that all sellers in a market will
produce at different prices after all long produce at different prices after all long--run adjustmentsrun adjustments
have taken placehave taken place
8/7/2019 12 competitive market
http://slidepdf.com/reader/full/12-competitive-market 25/35
25
Figure 7a/b: An IncreasingFigure 7a/b: An Increasing--Cost IndustryCost Industry
INITIAL EQUILIBRIUM
D1
S 1
AP 1
Q1
P 1
q1
MC
A
ATC 1
d 1 = MR 1
Output per Period
MarketDollars
Firm
Output per Period
Priceper Unit
8/7/2019 12 competitive market
http://slidepdf.com/reader/full/12-competitive-market 26/35
26
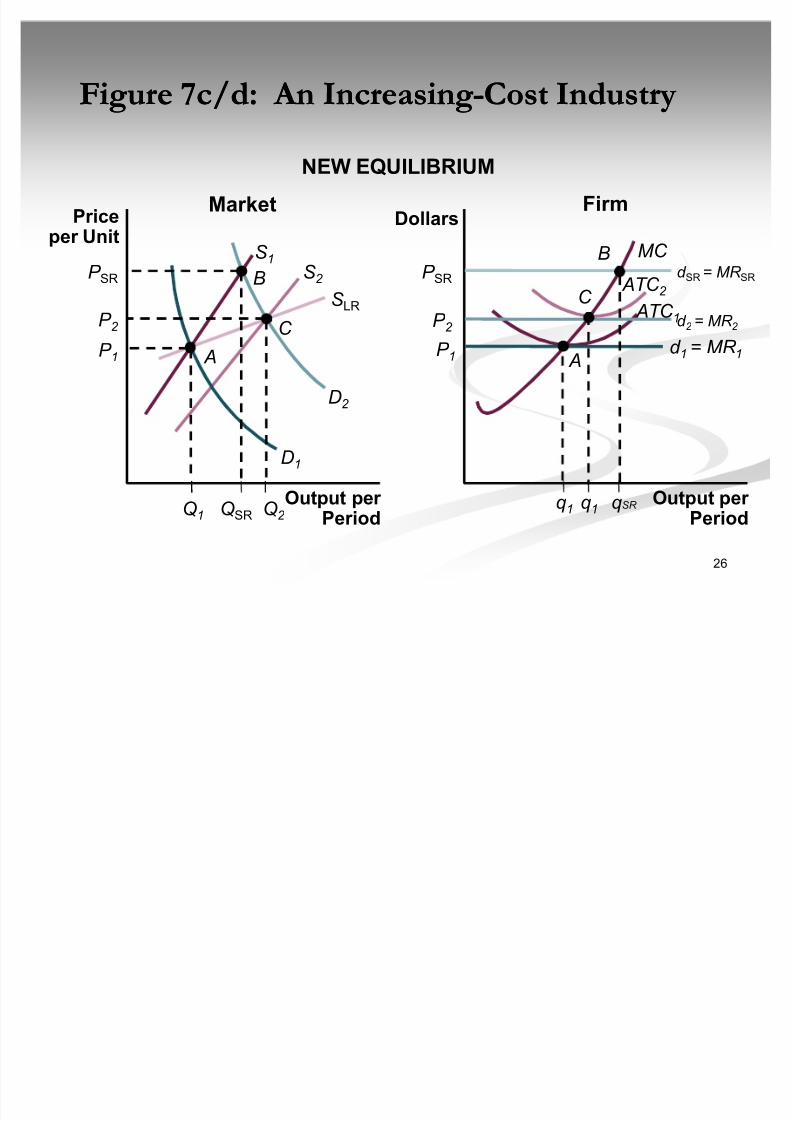
Figure 7c/d: An IncreasingFigure 7c/d: An Increasing--Cost IndustryCost Industry
NEW EQUILIBRIUM
MC
ATC 1
DollarsFirm
P 1
q1
Ad 1 = MR 1
Output per Period
Market
S 1
Output per Period
Priceper Unit
D1
AP 1
Q1
d SR = MR SR
d 2 = MR 2 P 2
P SR
P 2
P SR ATC 2 C
B
B
C
QSR Q2 q1 qSR
S 2
S LR
D2

8/7/2019 12 competitive market
http://slidepdf.com/reader/full/12-competitive-market 27/35
27
Increasing Cost IndustryIncreasing Cost Industry
This type of industry (which is the most common) This type of industry (which is the most common)
is calledis called an inc r e asing c ost indust ry an inc r e asing c ost indust ry
Entry Entry Increase in demand for inputsIncrease in demand for inputs prprice of ice of
those inputs increasesthose inputs increases
Shifts up typical firmShifts up typical firm¶¶s ATC curves ATC curve
Raises market price at which firms earn zeroRaises market price at which firms earn zero
economic profiteconomic profit
As a result, long As a result, long--run supply curve slopes upwardrun supply curve slopes upward

8/7/2019 12 competitive market
http://slidepdf.com/reader/full/12-competitive-market 28/35
28
Decreasing and Constant Cost IndustriesDecreasing and Constant Cost Industries
A c onstant c ost indust ry A c onstant c ost indust ry -- -- entry has no effect on input pricesentry has no effect on input prices Industry might use such a small percentage of total inputs thatIndustry might use such a small percentage of total inputs that
there is no noticeable effect on input pricesthere is no noticeable effect on input prices
Typical firm Typical firm¶¶s ATC curve stays puts ATC curve stays put
Market price at which firms earn zero economic profit does notMarket price at which firms earn zero economic profit does notchangechange
Long Long--run supply curve is horizontalrun supply curve is horizontal
De c r e asing c ost indust ry De c r e asing c ost indust ry ---- entry by new firmsentry by new firmsactually actually decreases input pricesdecreases input prices
Causes typical firmCauses typical firm¶¶s ATC curve to shift downwards ATC curve to shift downward Lowers market price at which firms earn zero economic profitLowers market price at which firms earn zero economic profit
Long Long--run supply curve slopes downwardrun supply curve slopes downward

8/7/2019 12 competitive market
http://slidepdf.com/reader/full/12-competitive-market 29/35
29
Small SummarySmall Summary
IncreasingIncreasing
Cost IndustryCost Industry
Constant CostConstant Cost
IndustryIndustry
DecreasingDecreasing
Cost IndustryCost Industry
Entry effect onEntry effect on
input pricesinput prices
UpUp No effectNo effect DownDown
ATC curve ATC curve Shifts upShifts up StaysStays Shifts downShifts down
Zero profitZero profit
market Pricemarket Price
UpUp Not changeNot change DownDown
Long Long--runrun
supply curvesupply curve
Slope upwardSlope upward HorizontalHorizontal SlopeSlope
downwarddownward

8/7/2019 12 competitive market
http://slidepdf.com/reader/full/12-competitive-market 30/35
30
Part V. Using the Theory: Changes inPart V. Using the Theory: Changes in
Technology Technology
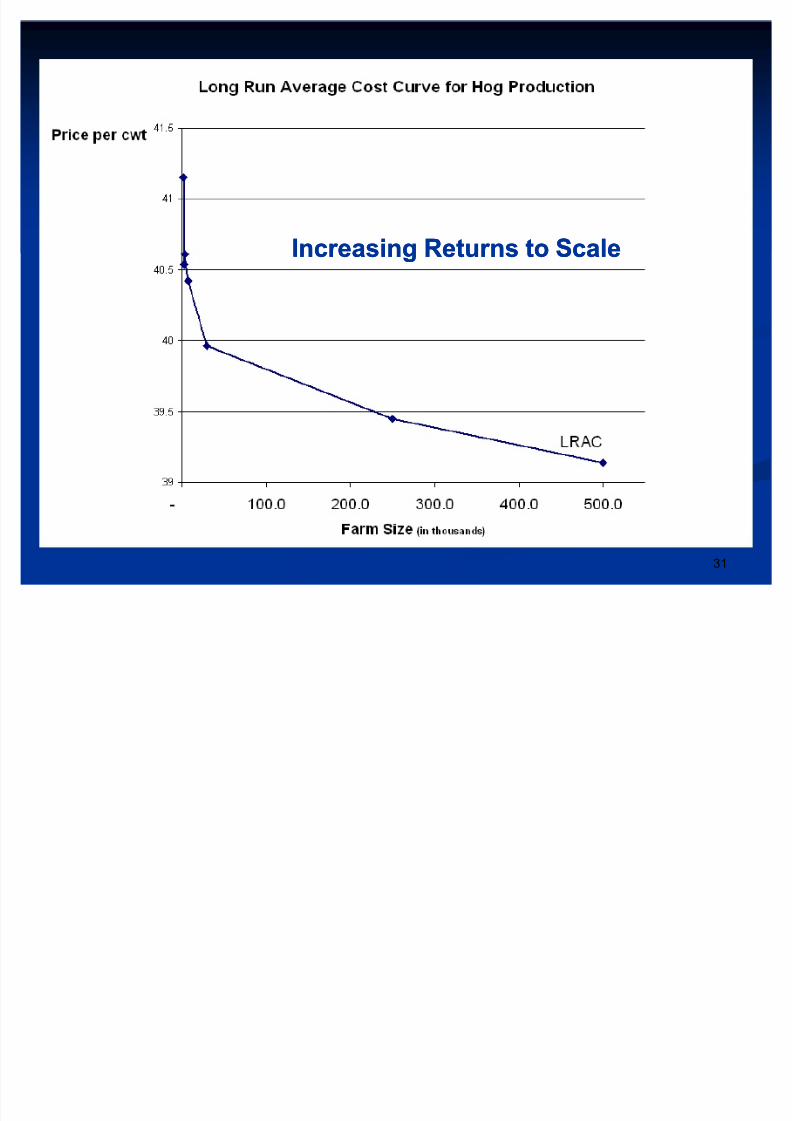
Technological advance that results in increasing returns to scale Technological advance that results in increasing returns to scale will will
Induce some firms to change technologies and produce moreInduce some firms to change technologies and produce more
lead to a rightward shift of market supply curve, decreasing lead to a rightward shift of market supply curve, decreasing market pricemarket price
In shortIn short--run, early adopters may enjoy economic profitrun, early adopters may enjoy economic profit
in long in long--run, more will adopt, economic profit falls to zerorun, more will adopt, economic profit falls to zero
Firms that refuse to use the new technology will not surviveFirms that refuse to use the new technology will not survive
Some technologies are biased toward large firms, othersSome technologies are biased toward large firms, otherstoward smaller firms. If technologies lower minimumtoward smaller firms. If technologies lower minimumefficient scale, more firms will enter as industry price fallsefficient scale, more firms will enter as industry price falls
8/7/2019 12 competitive market
http://slidepdf.com/reader/full/12-competitive-market 31/35
31
Increasing Returns to ScaleIncreasing Returns to Scale
8/7/2019 12 competitive market
http://slidepdf.com/reader/full/12-competitive-market 32/35
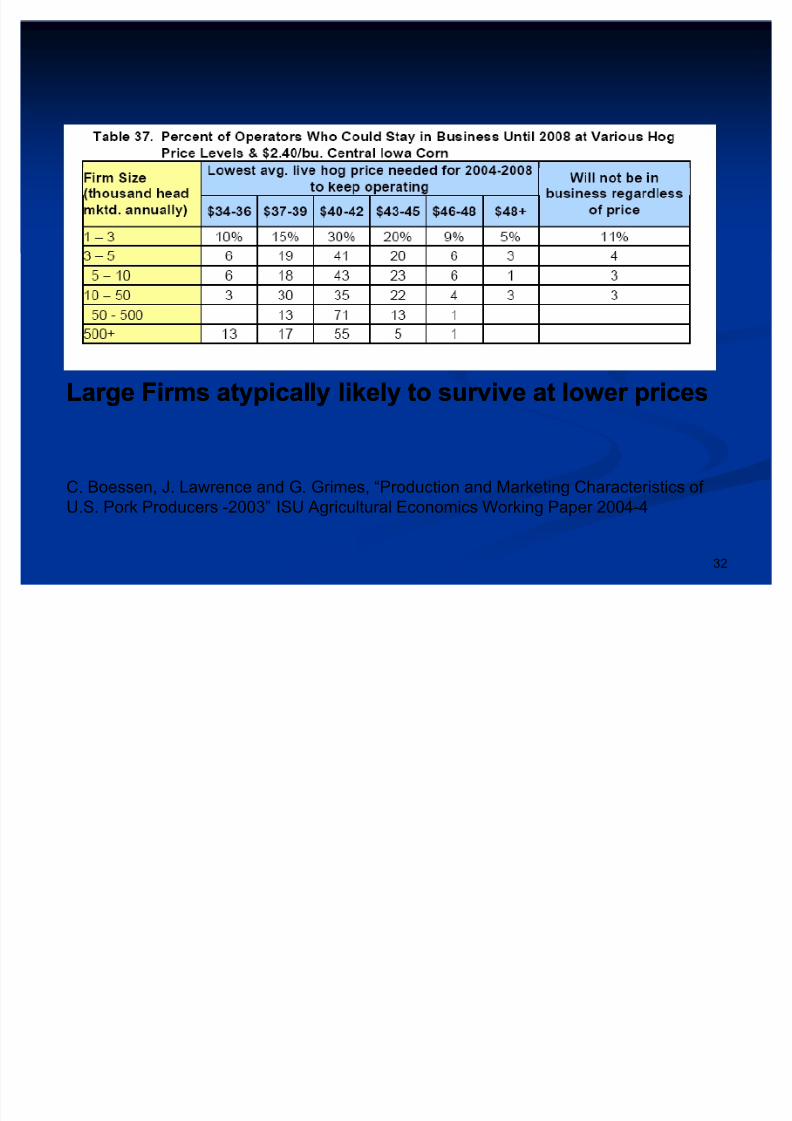
32
C. Boessen, J. Lawrence and G. Grimes, ³Production and Marketing Characteristics of
U.S. Pork Producers -2003´ ISU Agricultural Economics Working Paper 2004-4
Large Firms atypically likely to survive at lower pricesLarge Firms atypically likely to survive at lower prices

8/7/2019 12 competitive market
http://slidepdf.com/reader/full/12-competitive-market 33/35
33
http://www.ers.usda.gov/publications/aer 818/aer 818d.pdf
Number of hogNumber of hogfarms hasfarms hasdeclined 71%declined 71%
Number of Number of hogs per farmhogs per farm
has tripledhas tripled
8/7/2019 12 competitive market
http://slidepdf.com/reader/full/12-competitive-market 34/35
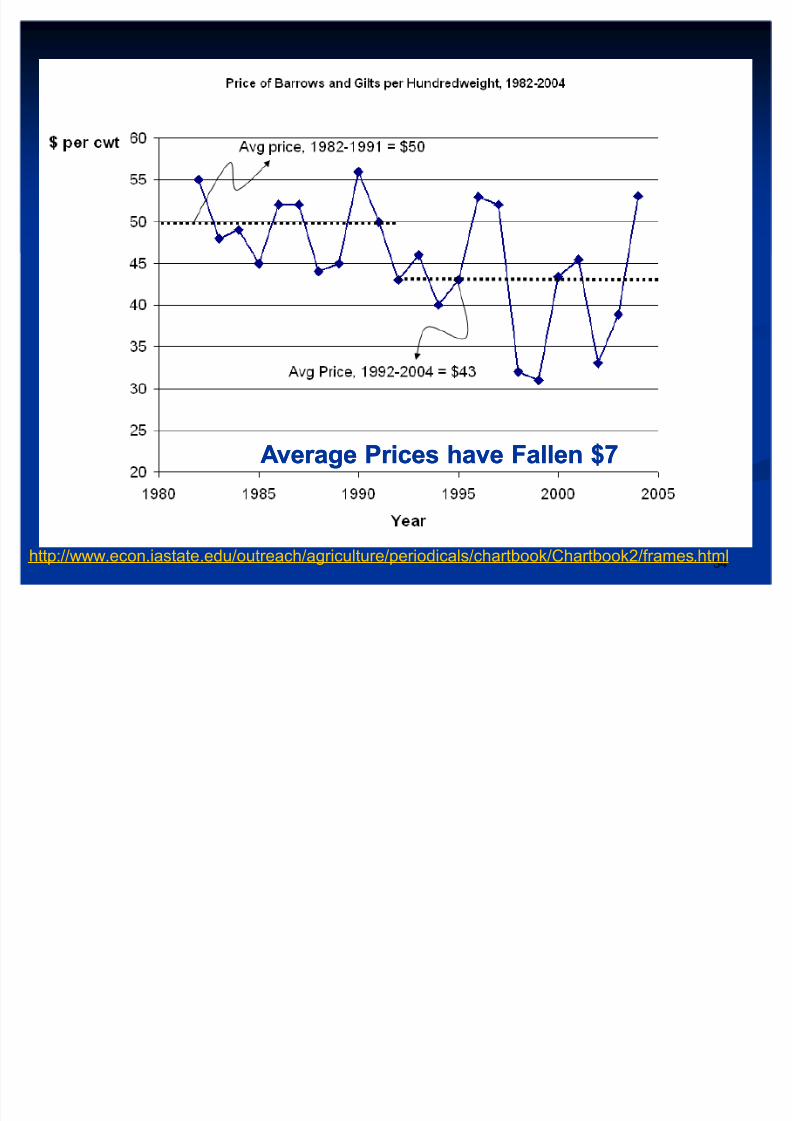
34http://www.econ.iastate.edu/outreach/agriculture/periodicals/chartbook/Chartbook2/frames.html
Average Prices have Fallen $7Average Prices have Fallen $7

8/7/2019 12 competitive market
http://slidepdf.com/reader/full/12-competitive-market 35/35
35
C. Boessen, J. Lawrence and G. Grimes, ³Production and Marketing Characteristics of U.S.
Pork Producers -2003´ ISU Agricultural Economics Working Paper 2004-4
MarketS
hare of MarketS
hare of Farms >10K rose from 20% to 80%Farms >10K rose from 20% to 80%
Farms < 3K fell from 62% to 10%Farms < 3K fell from 62% to 10%
Related Documents