AIR QUALITY HOMEWOOD MOUNTAIN RESORT SKI AREA MASTER PLAN EIR/EIS JANUARY 20, 2011 HAUGE BRUECK ASSOCIATES PAGE 12-1 12 AIR QUALITY 12.1 ENVIRONMENTAL SETTING The Homewood Mountain Resort (HMR) Ski Area Master Plan (Project) is located within the Placer County portion of the Lake Tahoe Air Basin (LTAB). This chapter describes the climate and topography of the LTAB and offers an overview of conditions affecting pollutant ambient air concentrations in the basin. Following this, the chapter summarizes relevant air quality standards, pollutant characteristics, and criteria pollution monitoring data measured near the Project. The chapter discusses existing emission sources and estimates air pollutant emissions that would be caused directly or indirectly by the Project, determines whether those emissions are significant in relation to applicable air quality standards, and identifies mitigation measures addressing those impacts. Finally, the chapter provides an analysis of cumulative air quality impacts. Please see to Chapter 19 – Climate Change for a discussion of greenhouse gases and global climate change. 12.1.1 Climate and Topography The primary factors that determine air quality are the locations of air pollutant sources and the amount of pollutants emitted from those sources. Meteorological and topographical conditions are also important— atmospheric conditions, such as wind speed, wind direction, and air temperature gradients, interact with the physical features of the landscape to determine the movement and dispersal of air pollutants. In winter, the meteorology of the LTAB is typified by large amounts of precipitation from Pacific storms that fall mainly as snow, accompanied by below freezing temperatures, winds, cloudiness, and lake and valley fog. Winter days can be cool and brilliantly clear between storms. Thermal inversions are a dominant feature of winter weather within the LTAB. In summer, days are often mild and sunny, with high temperatures in the upper 70s and low 80s (degrees Fahrenheit), with southern flows of moisture bringing an occasional thunderstorm. During winter, thermal inversions trap pollutants near the ground, leading to high winter concentrations of carbon monoxide (CO) in the more congested and populated areas of the basin. South Lake Tahoe is particularly prone to elevated levels of CO during thermal inversions due to the high traffic volumes and number of residential wood stoves and fireplaces in the area. Please refer to Appendix B of the TMPO RTP. No exceedances of the 8-hour have occurred since 1992. Also please note that traffic volumes have decreased significantly at the project area and throughout the Region over the past eight years (Mobility 2030 p 14-17). During summer, some transport of ozone (O 3 ) from the west occurs, but the California Air Resources Board (ARB) has not yet officially recognized this as a transport route. 1 Given the decrease in traffic volumes over the last seven years and that ozone is increasing it certainly appears that transport into the Lake Tahoe Region is a significant factor. 12.1.2 Air Quality Standards and Existing Concentrations Air quality within Placer County is managed by the Placer County Air Pollution Control District (PCAPCD). The PCAPCD administers air quality regulations developed at the federal, State, and local levels. Placer County’s Environmental Review Ordinance (County Ordinance Chapter 18) provides guidance regarding assessment air quality impacts under CEQA. 1 Note that it has been suggested (T. Cahill, UC Davis) that under typical conditions, ozone in the Tahoe Region is caused by pollutant transport from outside sources

Welcome message from author
This document is posted to help you gain knowledge. Please leave a comment to let me know what you think about it! Share it to your friends and learn new things together.
Transcript
AIR QUALITY H O M E W O O D M O U N T A I N R E S O R T S K I A R E A M A S T E R P L A N E I R / E I S
J A N U A R Y 2 0 , 2 0 1 1 H A U G E B R U E C K A S S O C I A T E S P A G E 1 2 - 1
12 AIR QUALITY
12.1 ENVIRONMENTAL SETTING
The Homewood Mountain Resort (HMR) Ski Area Master Plan (Project) is located within the Placer County portion of the Lake Tahoe Air Basin (LTAB). This chapter describes the climate and topography of the LTAB and offers an overview of conditions affecting pollutant ambient air concentrations in the basin. Following this, the chapter summarizes relevant air quality standards, pollutant characteristics, and criteria pollution monitoring data measured near the Project. The chapter discusses existing emission sources and estimates air pollutant emissions that would be caused directly or indirectly by the Project, determines whether those emissions are significant in relation to applicable air quality standards, and identifies mitigation measures addressing those impacts. Finally, the chapter provides an analysis of cumulative air quality impacts. Please see to Chapter 19 – Climate Change for a discussion of greenhouse gases and global climate change.
12.1.1 Climate and Topography
The primary factors that determine air quality are the locations of air pollutant sources and the amount of pollutants emitted from those sources. Meteorological and topographical conditions are also important—atmospheric conditions, such as wind speed, wind direction, and air temperature gradients, interact with the physical features of the landscape to determine the movement and dispersal of air pollutants.
In winter, the meteorology of the LTAB is typified by large amounts of precipitation from Pacific storms that fall mainly as snow, accompanied by below freezing temperatures, winds, cloudiness, and lake and valley fog. Winter days can be cool and brilliantly clear between storms. Thermal inversions are a dominant feature of winter weather within the LTAB. In summer, days are often mild and sunny, with high temperatures in the upper 70s and low 80s (degrees Fahrenheit), with southern flows of moisture bringing an occasional thunderstorm.
During winter, thermal inversions trap pollutants near the ground, leading to high winter concentrations of carbon monoxide (CO) in the more congested and populated areas of the basin. South Lake Tahoe is particularly prone to elevated levels of CO during thermal inversions due to the high traffic volumes and number of residential wood stoves and fireplaces in the area. Please refer to Appendix B of the TMPO RTP. No exceedances of the 8-hour have occurred since 1992. Also please note that traffic volumes have decreased significantly at the project area and throughout the Region over the past eight years (Mobility 2030 p 14-17). During summer, some transport of ozone (O3) from the west occurs, but the California Air Resources Board (ARB) has not yet officially recognized this as a transport route.1 Given the decrease in traffic volumes over the last seven years and that ozone is increasing it certainly appears that transport into the Lake Tahoe Region is a significant factor.
12.1.2 Air Quality Standards and Existing Concentrations
Air quality within Placer County is managed by the Placer County Air Pollution Control District (PCAPCD). The PCAPCD administers air quality regulations developed at the federal, State, and local levels. Placer County’s Environmental Review Ordinance (County Ordinance Chapter 18) provides guidance regarding assessment air quality impacts under CEQA. 1 Note that it has been suggested (T. Cahill, UC Davis) that under typical conditions, ozone in the Tahoe Region is caused by pollutant transport from outside sources
AIR QUALITY H O M E W O O D M O U N T A I N R E S O R T S K I A R E A M A S T E R P L A N E I R / E I S
P A G E 1 2 - 2 H A U G E B R U E C K A S S O C I A T E S J A N U A R Y 2 0 , 2 0 1 1
The Tahoe Regional Planning Agency (TRPA) has authority for overseeing and managing overall air quality within the LTAB. The TRPA has bi-state regulatory authority over new development projects and has established its own set of air quality standards and ordinances.
The U.S. Environmental Protection Agency (EPA) and ARB have established ambient air quality standards for seven criteria pollutants, all of which occur in the LTAB: O3, CO, nitrogen dioxide (NO2), sulfur dioxide (SO2), particulate matter less than or equal to 10 microns in diameter (PM10), particulate matter less than 2.5 microns in diameter (PM2.5 ), and lead (Pb). The EPA and ARB have adopted standards applicable to other air pollutant emissions, including hydrogen sulfide, vinyl chloride, and sulfates. The Project is not expected to emit these pollutants and as such, they are not discussed further.
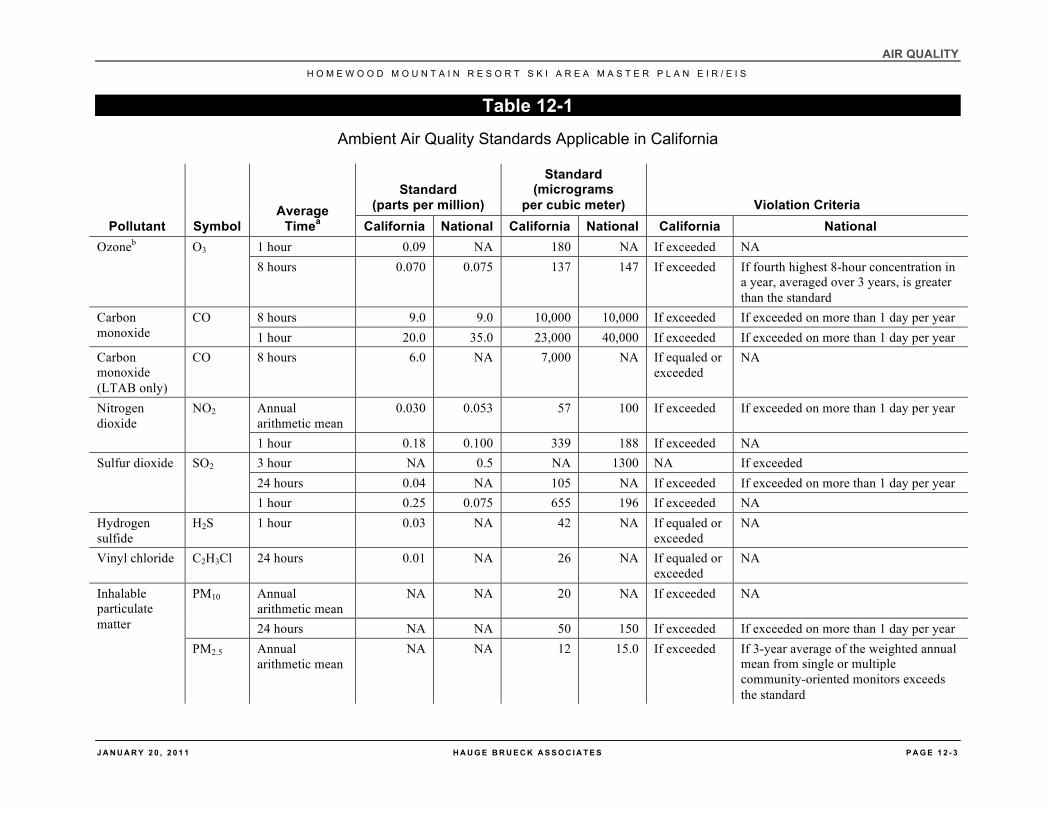
National and California ambient air quality standards (NAAQS and CAAQS, respectively) are shown in Table 12-1. The table also specifies the TRPA 8-hour CO standard, which is more stringent than the California or national standard.
O3 and NO2 (an O3 precursor) are considered regional pollutants because they affect air quality on a regional scale; oxides of nitrogen (NOX), including NO2, react photochemically with reactive organic gases (ROG) to form O3 some distance downwind of the source of pollutants. Pollutants such as CO, PM10, and PM2.5 are considered local pollutants because they tend to disperse rapidly with distance from the source. PM10 and PM2.5 are also considered regional pollutants that travel and impact downwind areas. The health effects of these pollutants are discussed below.
Ozone
O3 is a severe eye, nose, and throat irritant that increases susceptibility to respiratory infections. O3 causes extensive damage to plants through leaf discoloration and cell damage. O3 degrades synthetic rubber, textiles, and other materials. O3 is not emitted directly into the air, but formed by a photochemical reaction of O3 precursors (ROG and NOX) in the atmosphere. These O3 precursors react in the atmosphere in the presence of sunlight to form O3. Because photochemical reaction rates depend on the intensity of ultraviolet light and air temperature, O3 is primarily a summer air pollution problem.
Mobile sources (and to a lesser extent stationary combustion equipment) are the primary sources of O3 precursors (ROG and NOXB). Air quality improvement plans within the LTAB and larger Sacramento Metropolitan Area have focused on reducing vehicle travel and the formation of O3. Vehicle use in the Project area has decreased by approximately 1% to 2.3% from 1999 to 2008 (Table 11-4). Because the automobile is the primary source of O3 precursors, reduced vehicle trips directly correlates to reductions in O3levels.
Carbon Monoxide
CO is a gas that is essentially inert to plants, but can have adverse effects on human health. CO combines with hemoglobin to reduce the amount of oxygen transported in the bloodstream. Effects on humans range from slight headaches to nausea to death. Motor vehicles are the dominant source of CO emissions in most areas. High CO levels develop primarily during winter when periods of light winds combine with the formation of ground-level temperature inversions (typically from the evening through early morning). These conditions result in reduced dispersion of vehicle emissions, which can cause CO “hotspots” typical of the South Lake Tahoe area. Motor vehicles also exhibit increased CO emission rates at low air temperatures.
AIR QUALITY H O M E W O O D M O U N T A I N R E S O R T S K I A R E A M A S T E R P L A N E I R / E I S
J A N U A R Y 2 0 , 2 0 1 1 H A U G E B R U E C K A S S O C I A T E S P A G E 1 2 - 3
Table 12-1 Ambient Air Quality Standards Applicable in California
Pollutant Symbol Average
Timea
Standard (parts per million)
Standard (micrograms
per cubic meter) Violation Criteria California National California National California National
Ozoneb O3 1 hour 0.09 NA 180 NA If exceeded NA 8 hours 0.070 0.075 137 147 If exceeded If fourth highest 8-hour concentration in
a year, averaged over 3 years, is greater than the standard
Carbon monoxide
CO 8 hours 9.0 9.0 10,000 10,000 If exceeded If exceeded on more than 1 day per year 1 hour 20.0 35.0 23,000 40,000 If exceeded If exceeded on more than 1 day per year
Carbon monoxide (LTAB only)
CO 8 hours 6.0 NA 7,000 NA If equaled or exceeded
NA
Nitrogen dioxide
NO2 Annual arithmetic mean
0.030 0.053 57 100 If exceeded If exceeded on more than 1 day per year
1 hour 0.18 0.100 339 188 If exceeded NA Sulfur dioxide SO2 3 hour NA 0.5 NA 1300 NA If exceeded
24 hours 0.04 NA 105 NA If exceeded If exceeded on more than 1 day per year 1 hour 0.25 0.075 655 196 If exceeded NA
Hydrogen sulfide
H2S 1 hour 0.03 NA 42 NA If equaled or exceeded
NA
Vinyl chloride C2H3Cl 24 hours 0.01 NA 26 NA If equaled or exceeded
NA
Inhalable particulate matter
PM10 Annual arithmetic mean
NA NA 20 NA If exceeded NA
24 hours NA NA 50 150 If exceeded If exceeded on more than 1 day per year PM2.5 Annual
arithmetic mean NA NA 12 15.0 If exceeded If 3-year average of the weighted annual
mean from single or multiple community-oriented monitors exceeds the standard
AIR QUALITY H O M E W O O D M O U N T A I N R E S O R T S K I A R E A M A S T E R P L A N E I R / E I S
P A G E 1 2 - 4 H A U G E B R U E C K A S S O C I A T E S J A N U A R Y 2 0 , 2 0 1 1
Pollutant Symbol Average
Timea
Standard (parts per million)
Standard (micrograms
per cubic meter) Violation Criteria California National California National California National
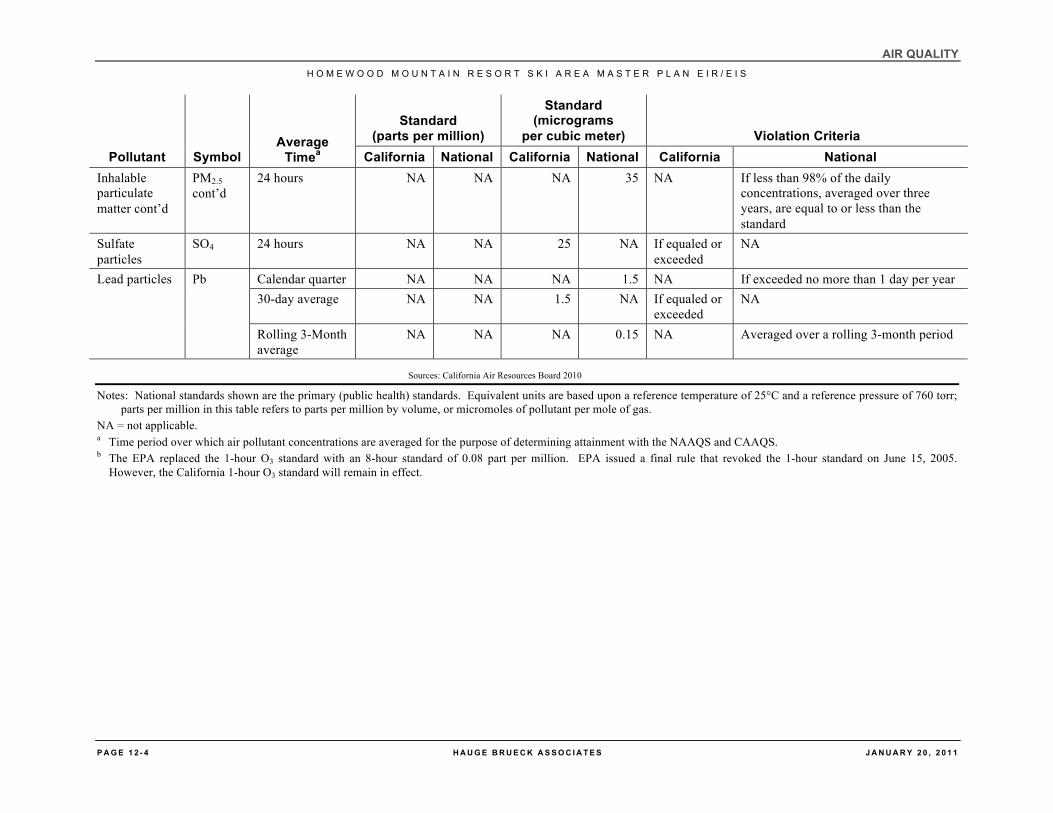
Inhalable particulate matter cont’d
PM2.5 cont’d
24 hours NA NA NA 35 NA If less than 98% of the daily concentrations, averaged over three years, are equal to or less than the standard
Sulfate particles
SO4 24 hours NA NA 25 NA If equaled or exceeded
NA
Lead particles Pb Calendar quarter NA NA NA 1.5 NA If exceeded no more than 1 day per year 30-day average NA NA 1.5 NA If equaled or
exceeded NA
Rolling 3-Month average
NA NA NA 0.15 NA Averaged over a rolling 3-month period
Sources: California Air Resources Board 2010
Notes: National standards shown are the primary (public health) standards. Equivalent units are based upon a reference temperature of 25°C and a reference pressure of 760 torr; parts per million in this table refers to parts per million by volume, or micromoles of pollutant per mole of gas.
NA = not applicable. a Time period over which air pollutant concentrations are averaged for the purpose of determining attainment with the NAAQS and CAAQS. b The EPA replaced the 1-hour O3 standard with an 8-hour standard of 0.08 part per million. EPA issued a final rule that revoked the 1-hour standard on June 15, 2005.
However, the California 1-hour O3 standard will remain in effect.
AIR QUALITY H O M E W O O D M O U N T A I N R E S O R T S K I A R E A M A S T E R P L A N E I R / E I S
J A N U A R Y 2 0 , 2 0 1 1 H A U G E B R U E C K A S S O C I A T E S P A G E 1 2 - 5
Inhalable Particulate Matter
State and federal ambient air quality standards for particulate matter apply to two classes of particulates: PM2.5 and PM10. These particulates can damage human health and retard plant growth. Health concerns associated with suspended particulate matter focus on those particles small enough to reach the lungs when inhaled, such as PM2.5 and PM10. Particulates also reduce visibility and corrode materials. In the LTAB, there are additional concerns regarding particulate matter because particles are deposited into Lake Tahoe and reduce lake clarity.
Sulfur Oxides
Sulfur oxide (SOx) gases are a family of colorless, pungent gases (including SO2) formed primarily by combustion of sulfur-containing fossil fuels (mainly coal and oil), metal smelting, and other industrial processes. Because SOX are regional pollutants, they can travel to the LTAB from upwind sources. SOx can react to form sulfates, which significantly reduce visibility. The major health concerns associated with exposure to high concentrations of sulfur oxides include effects on breathing, respiratory illness, alterations in pulmonary defenses, and aggravation of existing cardiovascular disease. Emissions of SOx can also damage tree foliage and agricultural crops. Together, SOx and NOx are the major precursors to acid rain, which is associated with the acidification of lakes and streams and the accelerated corrosion of buildings and monuments.
Lead
Lead (Pb) is a metal that is a natural constituent of air, water, and the biosphere. Pb is neither created nor destroyed in the environment, so it essentially persists forever. Lead was used several decades ago to increase the octane rating in gasoline, thereby making gasoline-powered automobile engines a major source of airborne lead. Ambient concentrations of lead have dropped dramatically with the phasing out of leaded fuel. Short-term exposure to high levels of lead can cause vomiting, diarrhea, convulsions, coma, or even death, but even small amounts of lead can be harmful, especially to infants, young children, and pregnant women.
Toxic Air Contaminants
Toxic air contaminants (TACs) are pollutants that may result in an increase in mortality or serious illness, or that may pose a present or potential hazard to human health. Health effects of TACs include cancer, birth defects, neurological damage, damage to the body’s natural defense system, and diseases that lead to death. Particulate matter from diesel-fueled engines are classified as a TAC. Compared to other air toxics that the ARB has identified and controlled, diesel particulate matter emissions are estimated to be responsible for about 70% of the total ambient air toxics risk (California Air Resources Board 2000).
Existing Criteria Pollutant Concentrations
Existing air quality conditions are characterized by criteria pollutant monitoring data collected in the region. Monitoring stations are not located in the immediate Project vicinity. The closest monitoring station is the Truckee Monitoring Station on 10046 Donner Pass Road, Truckee, CA 96161, located 21 miles north of the Project in the Mountain Counties Air Basin. The next closest stations are the Echo Summit Monitoring Station (21200 US 50, Little Norway, CA 95721); the South Lake Tahoe-Airport Monitoring Station (1901 Airport Road, South Lake Tahoe, CA 96150); and the South Lake Tahoe-Sandy Way Monitoring Station (3337 Sandy Way,
AIR QUALITY H O M E W O O D M O U N T A I N R E S O R T S K I A R E A M A S T E R P L A N E I R / E I S
P A G E 1 2 - 6 H A U G E B R U E C K A S S O C I A T E S J A N U A R Y 2 0 , 2 0 1 1
South Lake Tahoe, CA 96150). These stations are located approximately 30, 35, and 24 miles to the south, respectively.
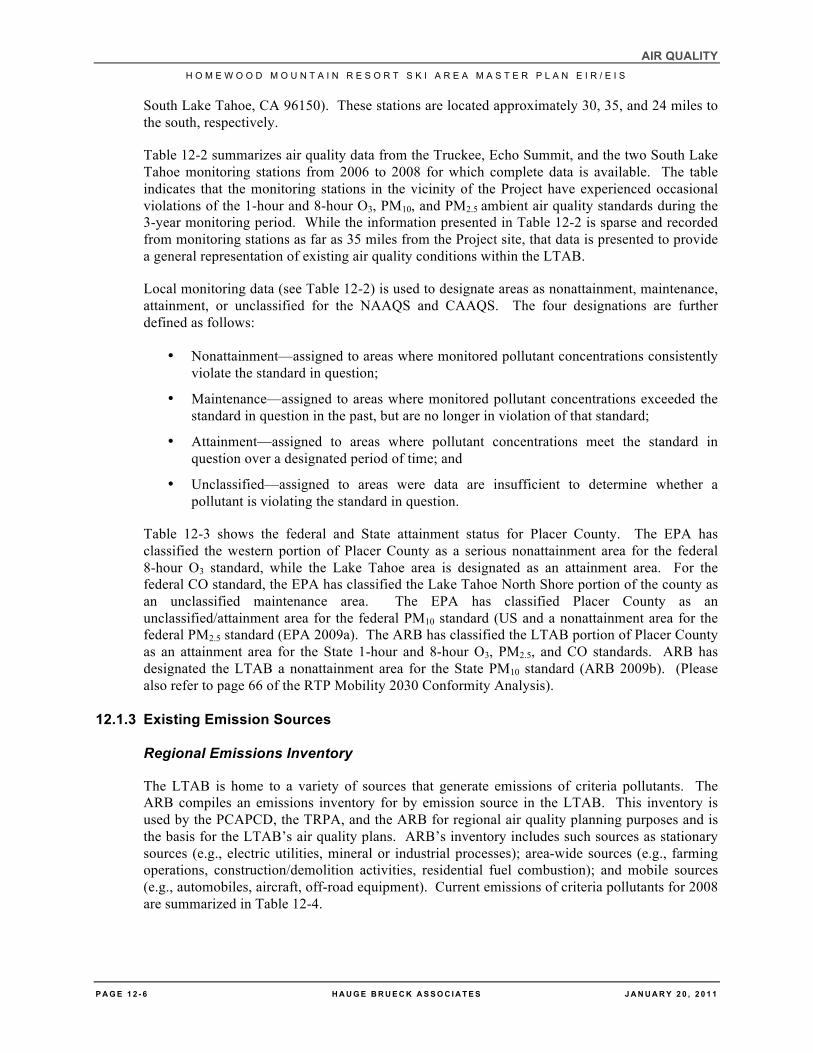
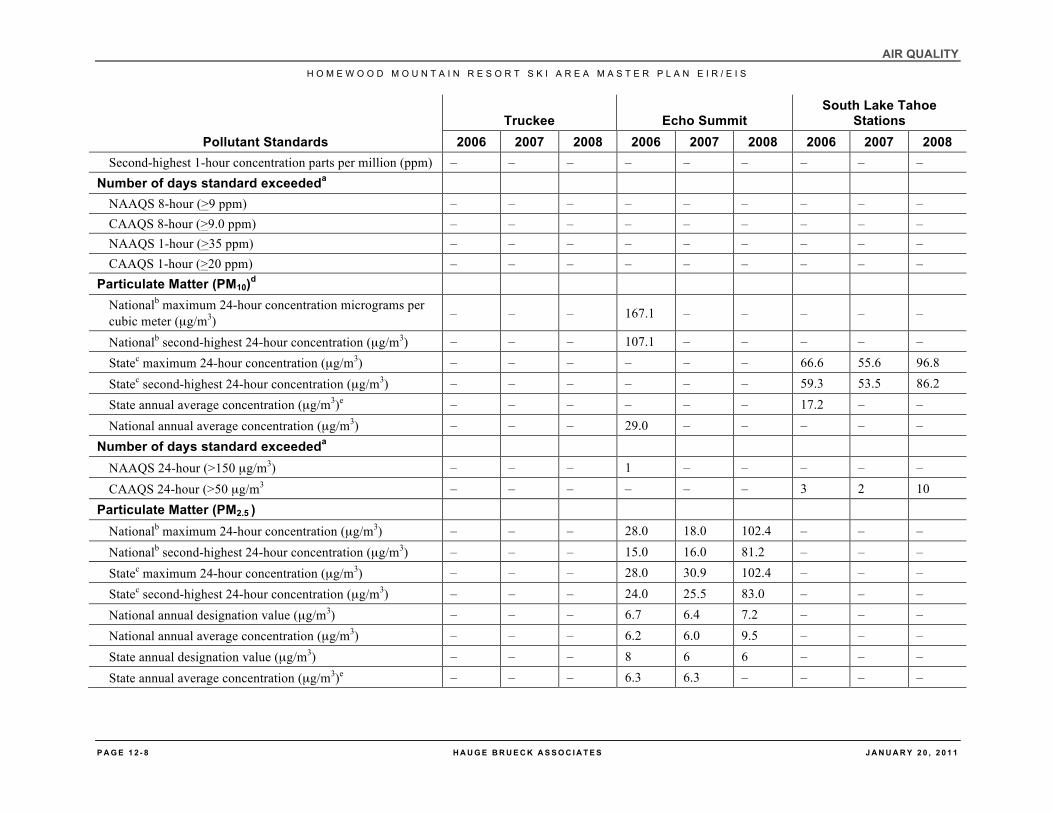
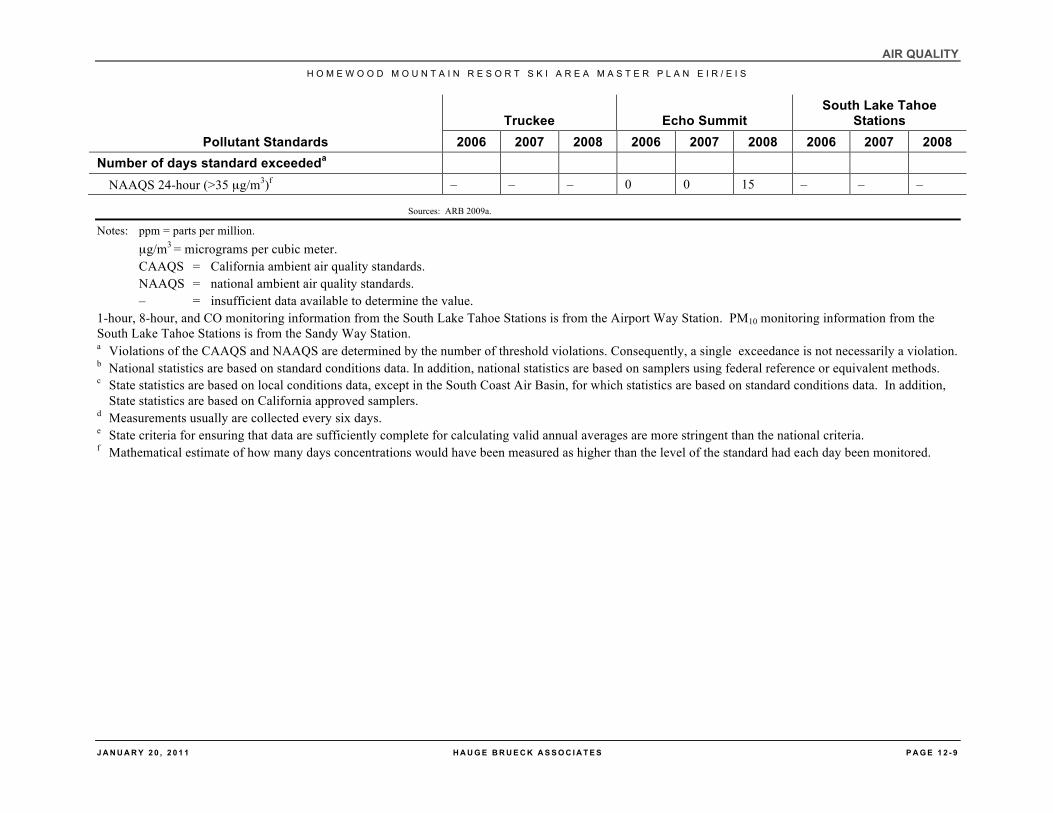
Table 12-2 summarizes air quality data from the Truckee, Echo Summit, and the two South Lake Tahoe monitoring stations from 2006 to 2008 for which complete data is available. The table indicates that the monitoring stations in the vicinity of the Project have experienced occasional violations of the 1-hour and 8-hour O3, PM10, and PM2.5 ambient air quality standards during the 3-year monitoring period. While the information presented in Table 12-2 is sparse and recorded from monitoring stations as far as 35 miles from the Project site, that data is presented to provide a general representation of existing air quality conditions within the LTAB.
Local monitoring data (see Table 12-2) is used to designate areas as nonattainment, maintenance, attainment, or unclassified for the NAAQS and CAAQS. The four designations are further defined as follows:
• Nonattainment—assigned to areas where monitored pollutant concentrations consistently violate the standard in question;
• Maintenance—assigned to areas where monitored pollutant concentrations exceeded the standard in question in the past, but are no longer in violation of that standard;
• Attainment—assigned to areas where pollutant concentrations meet the standard in question over a designated period of time; and
• Unclassified—assigned to areas were data are insufficient to determine whether a pollutant is violating the standard in question.
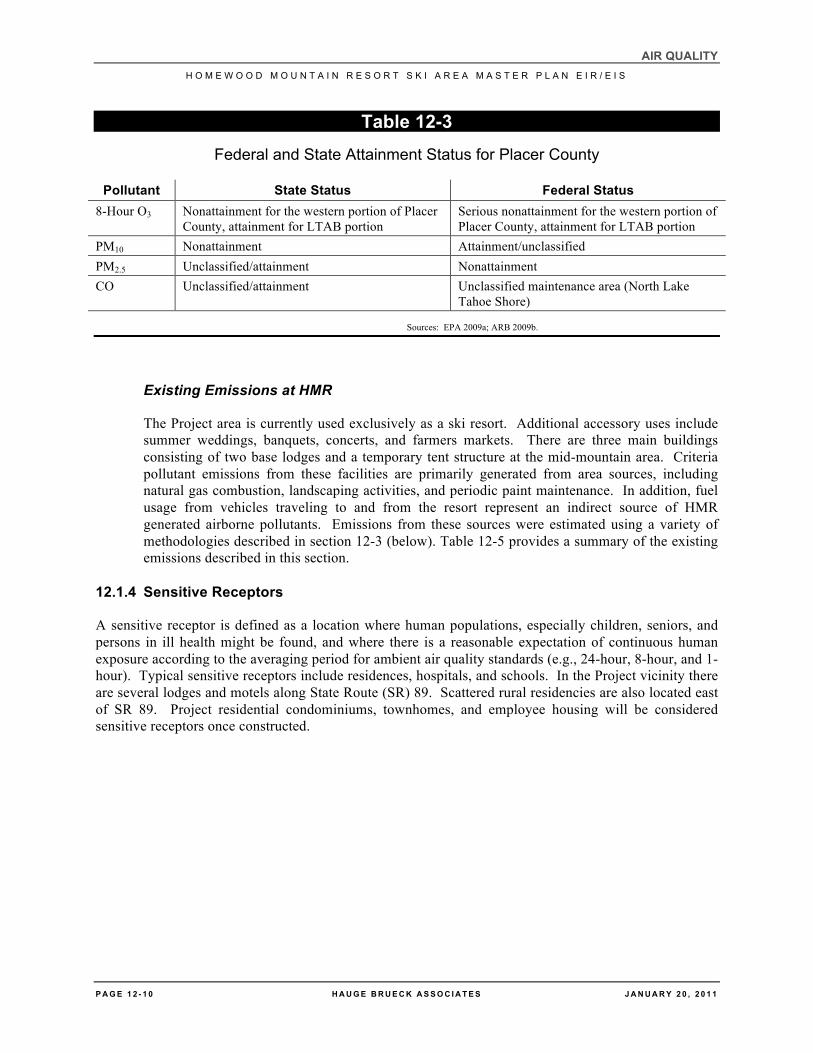
Table 12-3 shows the federal and State attainment status for Placer County. The EPA has classified the western portion of Placer County as a serious nonattainment area for the federal 8-hour O3 standard, while the Lake Tahoe area is designated as an attainment area. For the federal CO standard, the EPA has classified the Lake Tahoe North Shore portion of the county as an unclassified maintenance area. The EPA has classified Placer County as an unclassified/attainment area for the federal PM10 standard (US and a nonattainment area for the federal PM2.5 standard (EPA 2009a). The ARB has classified the LTAB portion of Placer County as an attainment area for the State 1-hour and 8-hour O3, PM2.5, and CO standards. ARB has designated the LTAB a nonattainment area for the State PM10 standard (ARB 2009b). (Please also refer to page 66 of the RTP Mobility 2030 Conformity Analysis).
12.1.3 Existing Emission Sources
Regional Emissions Inventory
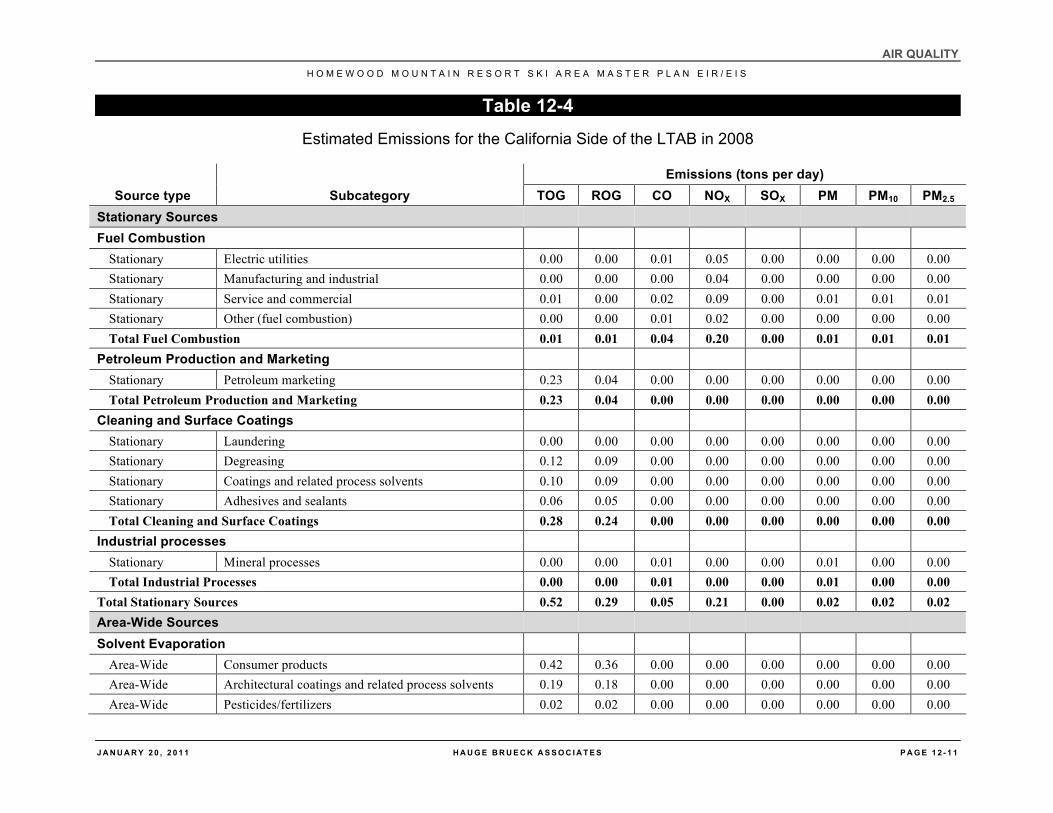
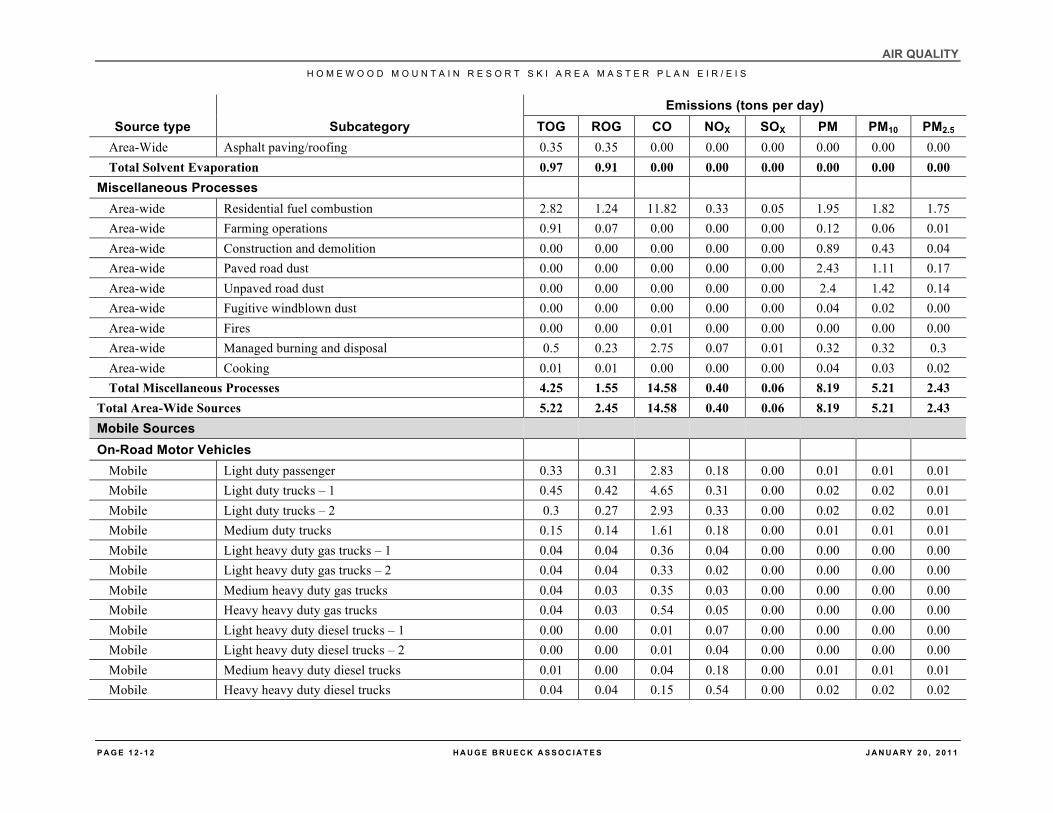
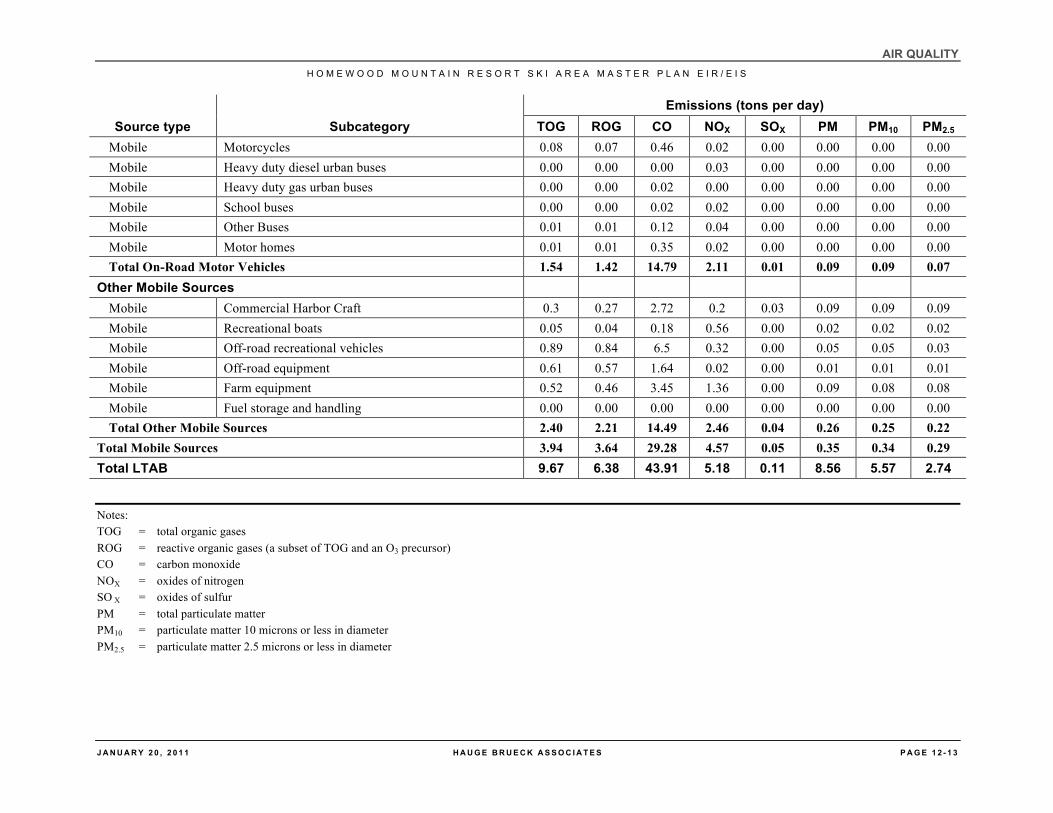
The LTAB is home to a variety of sources that generate emissions of criteria pollutants. The ARB compiles an emissions inventory for by emission source in the LTAB. This inventory is used by the PCAPCD, the TRPA, and the ARB for regional air quality planning purposes and is the basis for the LTAB’s air quality plans. ARB’s inventory includes such sources as stationary sources (e.g., electric utilities, mineral or industrial processes); area-wide sources (e.g., farming operations, construction/demolition activities, residential fuel combustion); and mobile sources (e.g., automobiles, aircraft, off-road equipment). Current emissions of criteria pollutants for 2008 are summarized in Table 12-4.
AIR QUALITY H O M E W O O D M O U N T A I N R E S O R T S K I A R E A M A S T E R P L A N E I R / E I S
J A N U A R Y 2 0 , 2 0 1 1 H A U G E B R U E C K A S S O C I A T E S P A G E 1 2 - 7
Table 12-2 Ambient Air Quality Monitoring Data Measured at the Truckee, Echo Summit, South Lake Tahoe-Airport, and South Lake
Tahoe-Sandy Way Monitoring Stations
Pollutant Standards Truckee Echo Summit
South Lake Tahoe Stations
2006 2007 2008 2006 2007 2008 2006 2007 2008 1-Hour O3
Maximum 1-hour concentration (ppm) 0.096 0.082 0.096 0.092 0.081 0.077 0.086 0.090 0.091 1-hour California designation value 0.10 0.10 0.10 0.09 0.09 0.09 0.09 0.08 0.09 1-hour expected peak day concentration – – – – – – – 0.080 0.086
Number of days standard exceededa CAAQS 1-hour (>0.09 ppm) 1 0 1 0 0 0 0 0 0
8-Hour O3 National maximum 8-hour concentration (ppm) 0.083 0.079 0.081 0.079 0.074 0.068 0.075 0.073 0.077 National second-highest 8-hour concentration (ppm) 0.083 0.078 0.078 0.079 0.074 0.066 0.073 0.071 0.075 State maximum 8-hour concentration (ppm) 0.084 0.079 0.082 0.080 0.074 0.068 0.075 0.073 0.077 State second-highest 8-hour concentration (ppm) 0.084 0.078 0.079 0.079 0.074 0.066 0.073 0.071 0.076 8-hour national designation value 0.072 0.073 0.076 0.067 0.071 0.070 – 0.067 0.070 8-hour California designation value 0.084 0.084 0.084 0.080 0.077 0.077 0.075 0.075 0.077 8-hour expected peak day concentration – – – – 0.078 0.078 – 0.075 0.078
Number of days standard exceededa NAAQS 8-hour (>0.075 ppm) 3 3 5 4 0 0 0 0 1 CAAQS 8-hour (>0.070 ppm) 12 9 9 7 5 0 2 5 5
Carbon Monoxide (CO) Nationalb maximum 8-hour concentration (ppm) – – – – – – – – – Nationalb second-highest 8-hour concentration (ppm) – – – – – – – – – Californiac maximum 8-hour concentration (ppm) – – – – – – – – – Californiac second-highest 8-hour concentration (ppm) – – – – – – – – – Maximum 1-hour concentration (ppm) – – – – – – – – –
AIR QUALITY H O M E W O O D M O U N T A I N R E S O R T S K I A R E A M A S T E R P L A N E I R / E I S
P A G E 1 2 - 8 H A U G E B R U E C K A S S O C I A T E S J A N U A R Y 2 0 , 2 0 1 1
Pollutant Standards Truckee Echo Summit
South Lake Tahoe Stations
2006 2007 2008 2006 2007 2008 2006 2007 2008 Second-highest 1-hour concentration parts per million (ppm) – – – – – – – – –
Number of days standard exceededa NAAQS 8-hour (>9 ppm) – – – – – – – – – CAAQS 8-hour (>9.0 ppm) – – – – – – – – – NAAQS 1-hour (>35 ppm) – – – – – – – – – CAAQS 1-hour (>20 ppm) – – – – – – – – –
Particulate Matter (PM10)d Nationalb maximum 24-hour concentration micrograms per cubic meter (µg/m3) – – – 167.1 – – – – –
Nationalb second-highest 24-hour concentration (µg/m3) – – – 107.1 – – – – –
Statec maximum 24-hour concentration (µg/m3) – – – – – – 66.6 55.6 96.8
Statec second-highest 24-hour concentration (µg/m3) – – – – – – 59.3 53.5 86.2
State annual average concentration (µg/m3)e – – – – – – 17.2 – –
National annual average concentration (µg/m3) – – – 29.0 – – – – –
Number of days standard exceededa NAAQS 24-hour (>150 µg/m3) – – – 1 – – – – –
CAAQS 24-hour (>50 µg/m3 – – – – – – 3 2 10
Particulate Matter (PM2.5 ) Nationalb maximum 24-hour concentration (µg/m3) – – – 28.0 18.0 102.4 – – –
Nationalb second-highest 24-hour concentration (µg/m3) – – – 15.0 16.0 81.2 – – –
Statec maximum 24-hour concentration (µg/m3) – – – 28.0 30.9 102.4 – – –
Statec second-highest 24-hour concentration (µg/m3) – – – 24.0 25.5 83.0 – – –
National annual designation value (µg/m3) – – – 6.7 6.4 7.2 – – –
National annual average concentration (µg/m3) – – – 6.2 6.0 9.5 – – –
State annual designation value (µg/m3) – – – 8 6 6 – – –
State annual average concentration (µg/m3)e – – – 6.3 6.3 – – – –
AIR QUALITY H O M E W O O D M O U N T A I N R E S O R T S K I A R E A M A S T E R P L A N E I R / E I S
J A N U A R Y 2 0 , 2 0 1 1 H A U G E B R U E C K A S S O C I A T E S P A G E 1 2 - 9
Pollutant Standards Truckee Echo Summit
South Lake Tahoe Stations
2006 2007 2008 2006 2007 2008 2006 2007 2008 Number of days standard exceededa
NAAQS 24-hour (>35 µg/m3)f – – – 0 0 15 – – –
Sources: ARB 2009a.
Notes: ppm = parts per million. µg/m3 = micrograms per cubic meter. CAAQS = California ambient air quality standards. NAAQS = national ambient air quality standards. – = insufficient data available to determine the value. 1-hour, 8-hour, and CO monitoring information from the South Lake Tahoe Stations is from the Airport Way Station. PM10 monitoring information from the South Lake Tahoe Stations is from the Sandy Way Station. a Violations of the CAAQS and NAAQS are determined by the number of threshold violations. Consequently, a single exceedance is not necessarily a violation. b National statistics are based on standard conditions data. In addition, national statistics are based on samplers using federal reference or equivalent methods. c State statistics are based on local conditions data, except in the South Coast Air Basin, for which statistics are based on standard conditions data. In addition,
State statistics are based on California approved samplers. d Measurements usually are collected every six days. e State criteria for ensuring that data are sufficiently complete for calculating valid annual averages are more stringent than the national criteria. f Mathematical estimate of how many days concentrations would have been measured as higher than the level of the standard had each day been monitored.
AIR QUALITY H O M E W O O D M O U N T A I N R E S O R T S K I A R E A M A S T E R P L A N E I R / E I S
P A G E 1 2 - 1 0 H A U G E B R U E C K A S S O C I A T E S J A N U A R Y 2 0 , 2 0 1 1
Table 12-3 Federal and State Attainment Status for Placer County
Pollutant State Status Federal Status 8-Hour O3 Nonattainment for the western portion of Placer
County, attainment for LTAB portion Serious nonattainment for the western portion of Placer County, attainment for LTAB portion
PM10 Nonattainment Attainment/unclassified PM2.5 Unclassified/attainment Nonattainment CO Unclassified/attainment Unclassified maintenance area (North Lake
Tahoe Shore)
Sources: EPA 2009a; ARB 2009b.
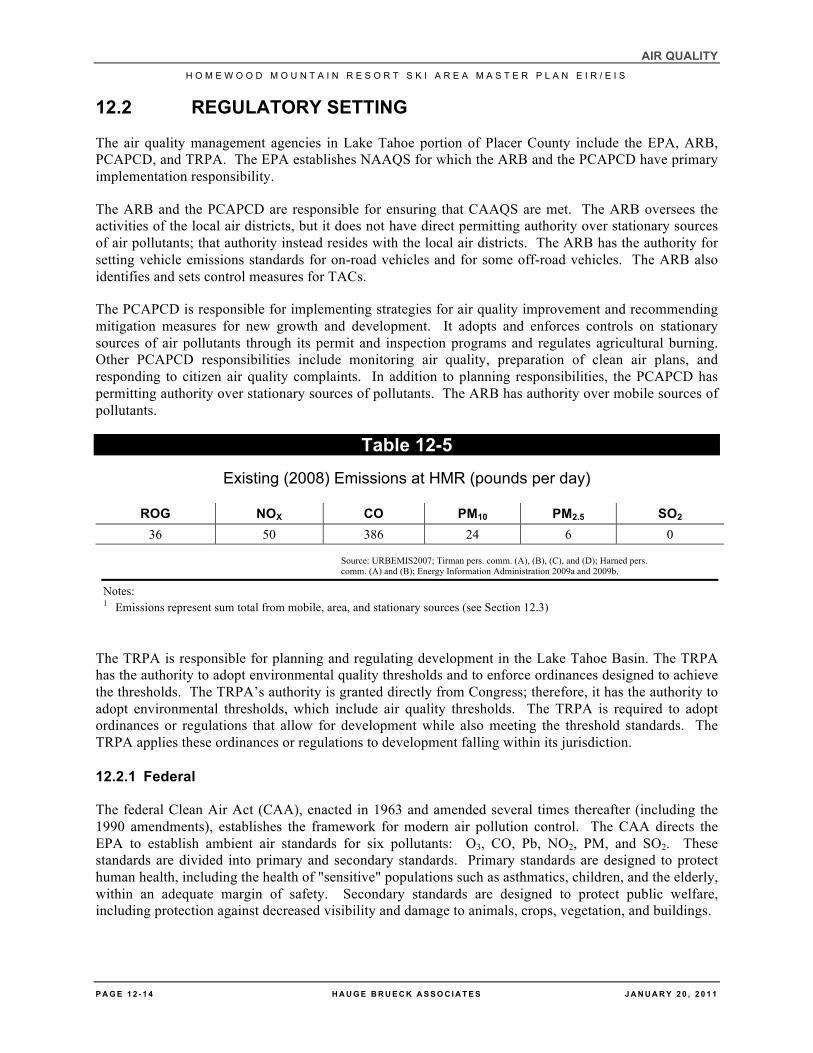
Existing Emissions at HMR
The Project area is currently used exclusively as a ski resort. Additional accessory uses include summer weddings, banquets, concerts, and farmers markets. There are three main buildings consisting of two base lodges and a temporary tent structure at the mid-mountain area. Criteria pollutant emissions from these facilities are primarily generated from area sources, including natural gas combustion, landscaping activities, and periodic paint maintenance. In addition, fuel usage from vehicles traveling to and from the resort represent an indirect source of HMR generated airborne pollutants. Emissions from these sources were estimated using a variety of methodologies described in section 12-3 (below). Table 12-5 provides a summary of the existing emissions described in this section.
12.1.4 Sensitive Receptors
A sensitive receptor is defined as a location where human populations, especially children, seniors, and persons in ill health might be found, and where there is a reasonable expectation of continuous human exposure according to the averaging period for ambient air quality standards (e.g., 24-hour, 8-hour, and 1-hour). Typical sensitive receptors include residences, hospitals, and schools. In the Project vicinity there are several lodges and motels along State Route (SR) 89. Scattered rural residencies are also located east of SR 89. Project residential condominiums, townhomes, and employee housing will be considered sensitive receptors once constructed.
AIR QUALITY H O M E W O O D M O U N T A I N R E S O R T S K I A R E A M A S T E R P L A N E I R / E I S
J A N U A R Y 2 0 , 2 0 1 1 H A U G E B R U E C K A S S O C I A T E S P A G E 1 2 - 1 1
Table 12-4 Estimated Emissions for the California Side of the LTAB in 2008
Source type Subcategory Emissions (tons per day)
TOG ROG CO NOX SOX PM PM10 PM2.5 Stationary Sources Fuel Combustion
Stationary Electric utilities 0.00 0.00 0.01 0.05 0.00 0.00 0.00 0.00 Stationary Manufacturing and industrial 0.00 0.00 0.00 0.04 0.00 0.00 0.00 0.00 Stationary Service and commercial 0.01 0.00 0.02 0.09 0.00 0.01 0.01 0.01 Stationary Other (fuel combustion) 0.00 0.00 0.01 0.02 0.00 0.00 0.00 0.00 Total Fuel Combustion 0.01 0.01 0.04 0.20 0.00 0.01 0.01 0.01
Petroleum Production and Marketing Stationary Petroleum marketing 0.23 0.04 0.00 0.00 0.00 0.00 0.00 0.00 Total Petroleum Production and Marketing 0.23 0.04 0.00 0.00 0.00 0.00 0.00 0.00
Cleaning and Surface Coatings Stationary Laundering 0.00 0.00 0.00 0.00 0.00 0.00 0.00 0.00 Stationary Degreasing 0.12 0.09 0.00 0.00 0.00 0.00 0.00 0.00 Stationary Coatings and related process solvents 0.10 0.09 0.00 0.00 0.00 0.00 0.00 0.00 Stationary Adhesives and sealants 0.06 0.05 0.00 0.00 0.00 0.00 0.00 0.00 Total Cleaning and Surface Coatings 0.28 0.24 0.00 0.00 0.00 0.00 0.00 0.00
Industrial processes Stationary Mineral processes 0.00 0.00 0.01 0.00 0.00 0.01 0.00 0.00 Total Industrial Processes 0.00 0.00 0.01 0.00 0.00 0.01 0.00 0.00
Total Stationary Sources 0.52 0.29 0.05 0.21 0.00 0.02 0.02 0.02 Area-Wide Sources Solvent Evaporation
Area-Wide Consumer products 0.42 0.36 0.00 0.00 0.00 0.00 0.00 0.00 Area-Wide Architectural coatings and related process solvents 0.19 0.18 0.00 0.00 0.00 0.00 0.00 0.00 Area-Wide Pesticides/fertilizers 0.02 0.02 0.00 0.00 0.00 0.00 0.00 0.00
AIR QUALITY H O M E W O O D M O U N T A I N R E S O R T S K I A R E A M A S T E R P L A N E I R / E I S
P A G E 1 2 - 1 2 H A U G E B R U E C K A S S O C I A T E S J A N U A R Y 2 0 , 2 0 1 1
Source type Subcategory Emissions (tons per day)
TOG ROG CO NOX SOX PM PM10 PM2.5 Area-Wide Asphalt paving/roofing 0.35 0.35 0.00 0.00 0.00 0.00 0.00 0.00 Total Solvent Evaporation 0.97 0.91 0.00 0.00 0.00 0.00 0.00 0.00
Miscellaneous Processes Area-wide Residential fuel combustion 2.82 1.24 11.82 0.33 0.05 1.95 1.82 1.75 Area-wide Farming operations 0.91 0.07 0.00 0.00 0.00 0.12 0.06 0.01 Area-wide Construction and demolition 0.00 0.00 0.00 0.00 0.00 0.89 0.43 0.04 Area-wide Paved road dust 0.00 0.00 0.00 0.00 0.00 2.43 1.11 0.17 Area-wide Unpaved road dust 0.00 0.00 0.00 0.00 0.00 2.4 1.42 0.14 Area-wide Fugitive windblown dust 0.00 0.00 0.00 0.00 0.00 0.04 0.02 0.00 Area-wide Fires 0.00 0.00 0.01 0.00 0.00 0.00 0.00 0.00 Area-wide Managed burning and disposal 0.5 0.23 2.75 0.07 0.01 0.32 0.32 0.3 Area-wide Cooking 0.01 0.01 0.00 0.00 0.00 0.04 0.03 0.02 Total Miscellaneous Processes 4.25 1.55 14.58 0.40 0.06 8.19 5.21 2.43
Total Area-Wide Sources 5.22 2.45 14.58 0.40 0.06 8.19 5.21 2.43 Mobile Sources On-Road Motor Vehicles
Mobile Light duty passenger 0.33 0.31 2.83 0.18 0.00 0.01 0.01 0.01 Mobile Light duty trucks – 1 0.45 0.42 4.65 0.31 0.00 0.02 0.02 0.01 Mobile Light duty trucks – 2 0.3 0.27 2.93 0.33 0.00 0.02 0.02 0.01 Mobile Medium duty trucks 0.15 0.14 1.61 0.18 0.00 0.01 0.01 0.01 Mobile Light heavy duty gas trucks – 1 0.04 0.04 0.36 0.04 0.00 0.00 0.00 0.00 Mobile Light heavy duty gas trucks – 2 0.04 0.04 0.33 0.02 0.00 0.00 0.00 0.00 Mobile Medium heavy duty gas trucks 0.04 0.03 0.35 0.03 0.00 0.00 0.00 0.00 Mobile Heavy heavy duty gas trucks 0.04 0.03 0.54 0.05 0.00 0.00 0.00 0.00 Mobile Light heavy duty diesel trucks – 1 0.00 0.00 0.01 0.07 0.00 0.00 0.00 0.00 Mobile Light heavy duty diesel trucks – 2 0.00 0.00 0.01 0.04 0.00 0.00 0.00 0.00 Mobile Medium heavy duty diesel trucks 0.01 0.00 0.04 0.18 0.00 0.01 0.01 0.01 Mobile Heavy heavy duty diesel trucks 0.04 0.04 0.15 0.54 0.00 0.02 0.02 0.02
AIR QUALITY H O M E W O O D M O U N T A I N R E S O R T S K I A R E A M A S T E R P L A N E I R / E I S
J A N U A R Y 2 0 , 2 0 1 1 H A U G E B R U E C K A S S O C I A T E S P A G E 1 2 - 1 3
Source type Subcategory Emissions (tons per day)
TOG ROG CO NOX SOX PM PM10 PM2.5 Mobile Motorcycles 0.08 0.07 0.46 0.02 0.00 0.00 0.00 0.00 Mobile Heavy duty diesel urban buses 0.00 0.00 0.00 0.03 0.00 0.00 0.00 0.00 Mobile Heavy duty gas urban buses 0.00 0.00 0.02 0.00 0.00 0.00 0.00 0.00 Mobile School buses 0.00 0.00 0.02 0.02 0.00 0.00 0.00 0.00 Mobile Other Buses 0.01 0.01 0.12 0.04 0.00 0.00 0.00 0.00 Mobile Motor homes 0.01 0.01 0.35 0.02 0.00 0.00 0.00 0.00 Total On-Road Motor Vehicles 1.54 1.42 14.79 2.11 0.01 0.09 0.09 0.07
Other Mobile Sources Mobile Commercial Harbor Craft 0.3 0.27 2.72 0.2 0.03 0.09 0.09 0.09 Mobile Recreational boats 0.05 0.04 0.18 0.56 0.00 0.02 0.02 0.02 Mobile Off-road recreational vehicles 0.89 0.84 6.5 0.32 0.00 0.05 0.05 0.03 Mobile Off-road equipment 0.61 0.57 1.64 0.02 0.00 0.01 0.01 0.01 Mobile Farm equipment 0.52 0.46 3.45 1.36 0.00 0.09 0.08 0.08 Mobile Fuel storage and handling 0.00 0.00 0.00 0.00 0.00 0.00 0.00 0.00 Total Other Mobile Sources 2.40 2.21 14.49 2.46 0.04 0.26 0.25 0.22
Total Mobile Sources 3.94 3.64 29.28 4.57 0.05 0.35 0.34 0.29 Total LTAB 9.67 6.38 43.91 5.18 0.11 8.56 5.57 2.74
Notes: TOG = total organic gases ROG = reactive organic gases (a subset of TOG and an O3 precursor) CO = carbon monoxide NOX = oxides of nitrogen SO X = oxides of sulfur PM = total particulate matter PM10 = particulate matter 10 microns or less in diameter PM2.5 = particulate matter 2.5 microns or less in diameter
AIR QUALITY H O M E W O O D M O U N T A I N R E S O R T S K I A R E A M A S T E R P L A N E I R / E I S
P A G E 1 2 - 1 4 H A U G E B R U E C K A S S O C I A T E S J A N U A R Y 2 0 , 2 0 1 1
12.2 REGULATORY SETTING
The air quality management agencies in Lake Tahoe portion of Placer County include the EPA, ARB, PCAPCD, and TRPA. The EPA establishes NAAQS for which the ARB and the PCAPCD have primary implementation responsibility.
The ARB and the PCAPCD are responsible for ensuring that CAAQS are met. The ARB oversees the activities of the local air districts, but it does not have direct permitting authority over stationary sources of air pollutants; that authority instead resides with the local air districts. The ARB has the authority for setting vehicle emissions standards for on-road vehicles and for some off-road vehicles. The ARB also identifies and sets control measures for TACs.
The PCAPCD is responsible for implementing strategies for air quality improvement and recommending mitigation measures for new growth and development. It adopts and enforces controls on stationary sources of air pollutants through its permit and inspection programs and regulates agricultural burning. Other PCAPCD responsibilities include monitoring air quality, preparation of clean air plans, and responding to citizen air quality complaints. In addition to planning responsibilities, the PCAPCD has permitting authority over stationary sources of pollutants. The ARB has authority over mobile sources of pollutants.
Table 12-5 Existing (2008) Emissions at HMR (pounds per day)
ROG NOX CO PM10 PM2.5 SO2 36 50 386 24 6 0
Source: URBEMIS2007; Tirman pers. comm. (A), (B), (C), and (D); Harned pers. comm. (A) and (B); Energy Information Administration 2009a and 2009b.
Notes: 1 Emissions represent sum total from mobile, area, and stationary sources (see Section 12.3)
The TRPA is responsible for planning and regulating development in the Lake Tahoe Basin. The TRPA has the authority to adopt environmental quality thresholds and to enforce ordinances designed to achieve the thresholds. The TRPA’s authority is granted directly from Congress; therefore, it has the authority to adopt environmental thresholds, which include air quality thresholds. The TRPA is required to adopt ordinances or regulations that allow for development while also meeting the threshold standards. The TRPA applies these ordinances or regulations to development falling within its jurisdiction.
12.2.1 Federal
The federal Clean Air Act (CAA), enacted in 1963 and amended several times thereafter (including the 1990 amendments), establishes the framework for modern air pollution control. The CAA directs the EPA to establish ambient air standards for six pollutants: O3, CO, Pb, NO2, PM, and SO2. These standards are divided into primary and secondary standards. Primary standards are designed to protect human health, including the health of "sensitive" populations such as asthmatics, children, and the elderly, within an adequate margin of safety. Secondary standards are designed to protect public welfare, including protection against decreased visibility and damage to animals, crops, vegetation, and buildings.
AIR QUALITY H O M E W O O D M O U N T A I N R E S O R T S K I A R E A M A S T E R P L A N E I R / E I S
J A N U A R Y 2 0 , 2 0 1 1 H A U G E B R U E C K A S S O C I A T E S P A G E 1 2 - 1 5
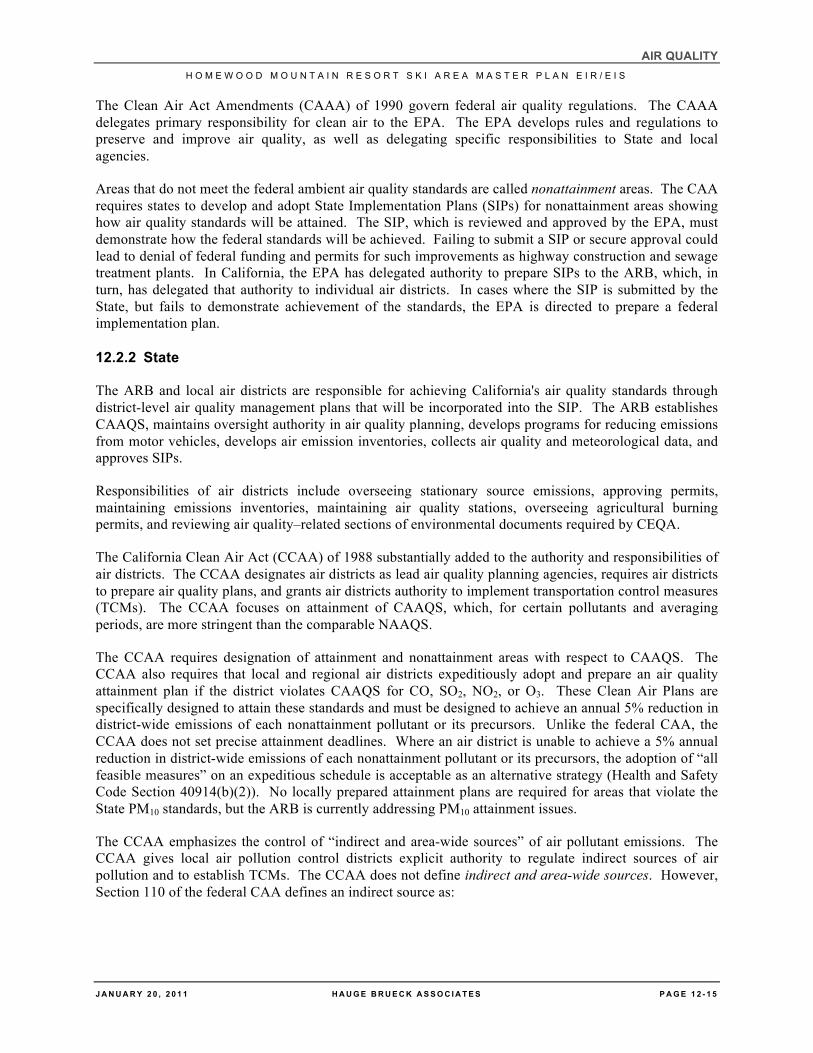
The Clean Air Act Amendments (CAAA) of 1990 govern federal air quality regulations. The CAAA delegates primary responsibility for clean air to the EPA. The EPA develops rules and regulations to preserve and improve air quality, as well as delegating specific responsibilities to State and local agencies.
Areas that do not meet the federal ambient air quality standards are called nonattainment areas. The CAA requires states to develop and adopt State Implementation Plans (SIPs) for nonattainment areas showing how air quality standards will be attained. The SIP, which is reviewed and approved by the EPA, must demonstrate how the federal standards will be achieved. Failing to submit a SIP or secure approval could lead to denial of federal funding and permits for such improvements as highway construction and sewage treatment plants. In California, the EPA has delegated authority to prepare SIPs to the ARB, which, in turn, has delegated that authority to individual air districts. In cases where the SIP is submitted by the State, but fails to demonstrate achievement of the standards, the EPA is directed to prepare a federal implementation plan.
12.2.2 State
The ARB and local air districts are responsible for achieving California's air quality standards through district-level air quality management plans that will be incorporated into the SIP. The ARB establishes CAAQS, maintains oversight authority in air quality planning, develops programs for reducing emissions from motor vehicles, develops air emission inventories, collects air quality and meteorological data, and approves SIPs.
Responsibilities of air districts include overseeing stationary source emissions, approving permits, maintaining emissions inventories, maintaining air quality stations, overseeing agricultural burning permits, and reviewing air quality–related sections of environmental documents required by CEQA.
The California Clean Air Act (CCAA) of 1988 substantially added to the authority and responsibilities of air districts. The CCAA designates air districts as lead air quality planning agencies, requires air districts to prepare air quality plans, and grants air districts authority to implement transportation control measures (TCMs). The CCAA focuses on attainment of CAAQS, which, for certain pollutants and averaging periods, are more stringent than the comparable NAAQS.
The CCAA requires designation of attainment and nonattainment areas with respect to CAAQS. The CCAA also requires that local and regional air districts expeditiously adopt and prepare an air quality attainment plan if the district violates CAAQS for CO, SO2, NO2, or O3. These Clean Air Plans are specifically designed to attain these standards and must be designed to achieve an annual 5% reduction in district-wide emissions of each nonattainment pollutant or its precursors. Unlike the federal CAA, the CCAA does not set precise attainment deadlines. Where an air district is unable to achieve a 5% annual reduction in district-wide emissions of each nonattainment pollutant or its precursors, the adoption of “all feasible measures” on an expeditious schedule is acceptable as an alternative strategy (Health and Safety Code Section 40914(b)(2)). No locally prepared attainment plans are required for areas that violate the State PM10 standards, but the ARB is currently addressing PM10 attainment issues.
The CCAA emphasizes the control of “indirect and area-wide sources” of air pollutant emissions. The CCAA gives local air pollution control districts explicit authority to regulate indirect sources of air pollution and to establish TCMs. The CCAA does not define indirect and area-wide sources. However, Section 110 of the federal CAA defines an indirect source as:
AIR QUALITY H O M E W O O D M O U N T A I N R E S O R T S K I A R E A M A S T E R P L A N E I R / E I S
P A G E 1 2 - 1 6 H A U G E B R U E C K A S S O C I A T E S J A N U A R Y 2 0 , 2 0 1 1
a facility, building, structure, installation, real property, road, or highway, which attracts, or may attract, mobile sources of pollution. Such a term includes parking lots, parking garages, and other facilities subject to any measure for management of parking supply.
TCMs are defined in the CCAA as “any strategy to reduce trips, vehicle use, vehicle miles traveled, vehicle idling, or traffic congestion for the purpose of reducing vehicle emissions.”
12.2.3 Local
Placer County Air Pollution Control District
As discussed above, under the California CAA, the PCAPCD is required to develop an air quality plan for nonattainment criteria pollutants within the air district. As part of a state-wide effort to attain the CO CAAQS, PCAPCD adopted the 2004 Maintenance Plan for CO. This plan demonstrates ten statewide areas (including the north and south Lake Tahoe Shores) have achieved attainment with the CO standard between 1992 and 1995, and outlines how these areas will continue to maintain compliance with the standard. Please also refer to the Conformity Analysis contained on page 66 of the TMPO RTP.
The PCAPCD has also specified significance thresholds for daily emissions resulting from construction and Project operations. If emissions exceed the following thresholds, they have the potential to result in a significant air quality impact: 82 pounds per day for ROG, NOX, PM10, and SOX; and 550 pounds per day for CO (Chang pers. comm. (A)). The Project may also be subject to the following PCAPCD rules, which have been adopted to reduce emissions throughout Placer County:
• Rule 202: Visible Emissions. Establishes limits regarding the opacity of emissions.
• Rule 205: Nuisance. Limits emissions of substances that cause a nuisance to the public.
• Rule 207: Particulate Matter. Prohibits particulate emissions in excess of 0.2 grain per cubic foot of gas.
• Rule 210: Specific Containments. Establishes limits regarding the emissions of sulfur compounds and other combustion containments.
• Rule 212: Storage of Organic Liquids. Limits emissions from storage tanks for organic liquids. It applies to any facility that stores organic liquids having a vapor pressure greater than 25.8 millimeters of mercury (mm Hg) (0.5 pound-force per square inch absolute [psia]) are held in a stationary container.
• Rule 213: Gasoline Transfer into Stationary Storage Containers. Limits gasoline vapors and spills associated with the transfer of gasoline into stationary containers.
• Rule 217: Cutback and Emulsified Asphalt Paving Materials. Reduces the amount of VOCs caused by asphalt paving. It establishes restrictions on the type of asphalt that can be sold or manufactured in Placer County.
• Rule 218: Architectural Coatings. Limits VOC emissions in architectural coatings. It applies to anyone who manufactures, supplies, or applies architectural coatings.
AIR QUALITY H O M E W O O D M O U N T A I N R E S O R T S K I A R E A M A S T E R P L A N E I R / E I S
J A N U A R Y 2 0 , 2 0 1 1 H A U G E B R U E C K A S S O C I A T E S P A G E 1 2 - 1 7
• Rule 226: Sulfur Content of Fuels. Limits sulfur emissions from the combustion of fossil fuels, natural gas, and liquid fuel in the LTAB.
• Rule 228: Fugitive Dust. Reduces the amount of particulate matter entrained and discharged into the air by requiring actions to prevent, reduce, or minimize fugitive dust emissions. This rule also applies to construction activities.
• Rule 242: Stationary Internal Combustion Engines. Limits NOX and CO emissions from stationary internal combustion engines rated at more than 50 brake horsepower operating more than 200 hours per year. This rule would apply to construction activities that occur for more than 200 hours per year.
• Rule 246: Natural Gas Fired Water Heaters. Limits NOx emissions from natural-gas water heaters with a rated heat input capacity less than 75,000 British thermal units (Btu) per hour.
• Rule 501: General Permit Requirements. Provides an orderly procedure for the review of new sources of air pollution and the orderly review of the modification and operation of existing sources through the issuance of permits. This rule does not apply to internal combustion engines with a manufacturer’s maximum continuous rating of 50 brake horsepower or less or to gas turbine engines with a maximum heat input rate of 3 million Btu per hour or less at ISO [International Organization for Standardization] standard day conditions (288 degrees Kelvin, 60% relative humidity, 101.3 kilopascals pressure).
• Rule 502: New Source Review. Provides for the review of new and modified existing sources and outlines mechanisms, such as emissions offsets, that can be implemented by stationary source projects to avoid interference with the attainment of air quality standards. The rule applies to all new stationary sources and to modifications of existing stationary sources that after construction may emit ROG, NOx, SOx, PM10, CO, Pb, vinyl chloride, sulfuric acid mist, hydrogen sulfide (H2S), and reduced sulfur compounds. Rule 502 requires the implementation of best available control technology (BACT).
The Project may be subject to the Asbestos Airborne Toxic Control Measure for Construction, Grading, Quarrying, and Surface Mining Operations (ATCM). According to California Department of Conservation’s geological survey maps, the Project is not in an area known to contain naturally occurring asbestos (NOA) (Department of Conservation 2006). However, if NOA is found within the Project area, an Asbestos Dust Mitigation Plan must be submitted to the district.
Tahoe Regional Planning Agency
The TRPA has the following eight air quality standards and indicators with the goal of protecting the air quality in the LTAB:
• AQ-1: Carbon Monoxide. Do not meet or exceed the TRPA 8-hour 6.0-ppm CO standard, the federal 8-hour 9.0-ppm standard, the California 1-hour 20-ppm standard, or the federal and Nevada 1-hour 35 ppm standard. The indicator for attainment of this standard is the second-highest CO concentration read at the Stateline, Nevada, station (ppm). The Tahoe Basin is classified a maintenance-nonattainment for this threshold (See also Mobility 2030, Conformity Section).
AIR QUALITY H O M E W O O D M O U N T A I N R E S O R T S K I A R E A M A S T E R P L A N E I R / E I S
P A G E 1 2 - 1 8 H A U G E B R U E C K A S S O C I A T E S J A N U A R Y 2 0 , 2 0 1 1
• AQ-2: Ozone. Do not exceed the TRPA 1-hour 0.08-ppm O3 standard, the federal 1-hour 0.12-ppm standard, the California 1-hour 0.09-ppm, or the Nevada 1-hour 0.10-ppm standards. Attainment is based on the number of 1-hour periods, which equal or exceed the federal, Nevada, or TRPA standard at any of the permanent monitoring sites (unit less), and the number of 1-hour periods that exceed the California standard. The TRPA is in nonattainment for this threshold.
• AQ-3: Particulate Matter. Do not exceed the California and federal standards for 24-hour concentrations (50 and 150 micrograms per cubic meter [!g/m3], respectively) and the annual average (20 and 50 !g/m3) for particulate matter. Attainment is based on the number of 24-hour periods exceeding the applicable NAAQS or NAAQS at any permanent monitoring station (unit less) and the annual average PM10 concentration at any monitoring station (!g/m3). The TRPA is in nonattainment for this threshold.
• AQ-4: Visibility. Do not violate TRPA regional and subregional visibility standards. For regional and subregional visibility, reduce wood smoke concentrations 15% below the 1981 levels. Reduce suspended soil particles 30% below 1981 levels. For regional visibility, the standard is achievement of an extinction coefficient of 25 Mm-1 at least 50% of the time as calculated from aerosol species concentrations measured at the Bliss State Park monitoring site (visual range of 156 km, 97 miles); and achievement of an extinction coefficient of 34 Mm-1 at least 90% of the time as calculated from aerosol species concentrations measured at the Bliss State Park monitoring site (visual range of 115 km, 71 miles). Calculations will be made on three year running periods using the existing 1991-1993 monitoring data as the performance standards to be met or exceeded. For subregional visibility, the standard is achievement an extinction coefficient of 50 Mm-1 at least 50% of the time as calculated from aerosol species concentrations measured at the South Lake Tahoe monitoring site (visual range of 78 km, 48 miles); and achievement of an extinction coefficient of 125 Mm-1 at least 90% of the time as calculated from aerosol species concentrations measured at the South Lake Tahoe monitoring site (visual range of 31 km, 19 miles). For State visibility standards, visual range is calculated from nephelometer data collected at Bliss State Park and Lake Tahoe Boulevard for periods in which relative humidity is less than 70%. The TRPA is in attainment for this threshold.
• AQ-5: Traffic Volume. Reduce traffic volume on US 50 (U.S. 50) by 7% from the 1981 values. The standard uses the average traffic volume from 4:00 PM to midnight. Traffic volumes on US 50, recorded at a site immediately west of the intersection of Park Avenue in the City of South Lake Tahoe, include a count of both directions during an average day. The TRPA selected this indicator because of the timing of the highest CO concentrations, which generally occur during these times. The TRPA is in attainment with this threshold.
• AQ-6: Wood Smoke. Reduce annual wood smoke emissions from 15% from 1981 levels. Aerosol samples analyzed for organic and light-absorbing carbon collected in South Lake Tahoe and Bliss State Park are indirect indicators of wood smoke. The TRPA lacks sufficient data to evaluate whether they are in attainment for this threshold.
• AQ-7: Vehicle Miles Traveled. Reduce vehicle miles traveled (VMT) 10% below the 1981 levels. Typically, VMT is calculated directly from a traffic model. However, in 1988, TRPA adopted interim performance targets for the VMT threshold standard, as follows: VMT calculated for peak summer day using QRS (Quick Response System)
AIR QUALITY H O M E W O O D M O U N T A I N R E S O R T S K I A R E A M A S T E R P L A N E I R / E I S
J A N U A R Y 2 0 , 2 0 1 1 H A U G E B R U E C K A S S O C I A T E S P A G E 1 2 - 1 9
transportation model or equivalent model. Based on the the recent decrease in traffic volumes over the past seven years, the TRPA is in attainment for this threshold. (see RTP for current monitoring, modeling and attainment status).
• AQ-8: Atmospheric Deposition. Reduce dissolved inorganic nitrogen load on Lake Tahoe from atmospheric sources 20% from 1973–1981 levels using the annual average concentration of particulate NO3B at the Lake Tahoe Boulevard air quality monitoring station. The TRPA lacks sufficient data to evaluate whether it is in attainment for this threshold.
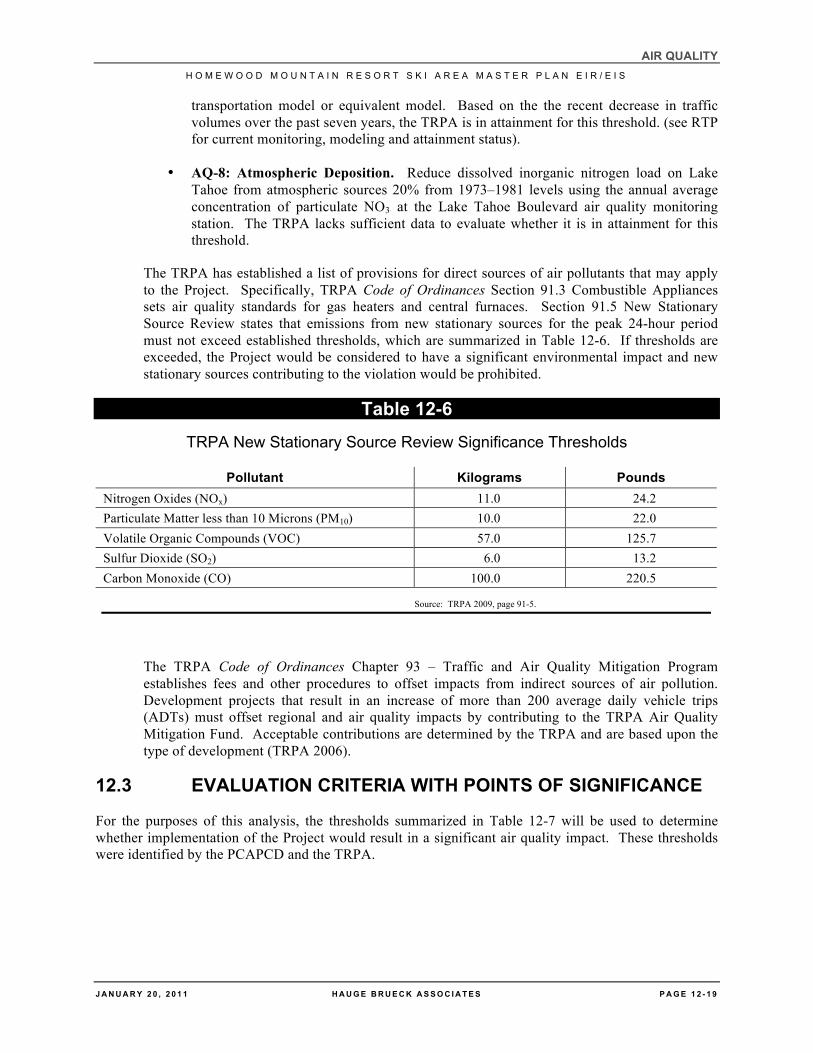
The TRPA has established a list of provisions for direct sources of air pollutants that may apply to the Project. Specifically, TRPA Code of Ordinances Section 91.3 Combustible Appliances sets air quality standards for gas heaters and central furnaces. Section 91.5 New Stationary Source Review states that emissions from new stationary sources for the peak 24-hour period must not exceed established thresholds, which are summarized in Table 12-6. If thresholds are exceeded, the Project would be considered to have a significant environmental impact and new stationary sources contributing to the violation would be prohibited.
Table 12-6 TRPA New Stationary Source Review Significance Thresholds
Pollutant Kilograms Pounds Nitrogen Oxides (NOx) 11.0 24.2 Particulate Matter less than 10 Microns (PM10) 10.0 22.0 Volatile Organic Compounds (VOC) 57.0 125.7 Sulfur Dioxide (SO2) 6.0 13.2 Carbon Monoxide (CO) 100.0 220.5
Source: TRPA 2009, page 91-5.
The TRPA Code of Ordinances Chapter 93 – Traffic and Air Quality Mitigation Program establishes fees and other procedures to offset impacts from indirect sources of air pollution. Development projects that result in an increase of more than 200 average daily vehicle trips (ADTs) must offset regional and air quality impacts by contributing to the TRPA Air Quality Mitigation Fund. Acceptable contributions are determined by the TRPA and are based upon the type of development (TRPA 2006).
12.3 EVALUATION CRITERIA WITH POINTS OF SIGNIFICANCE
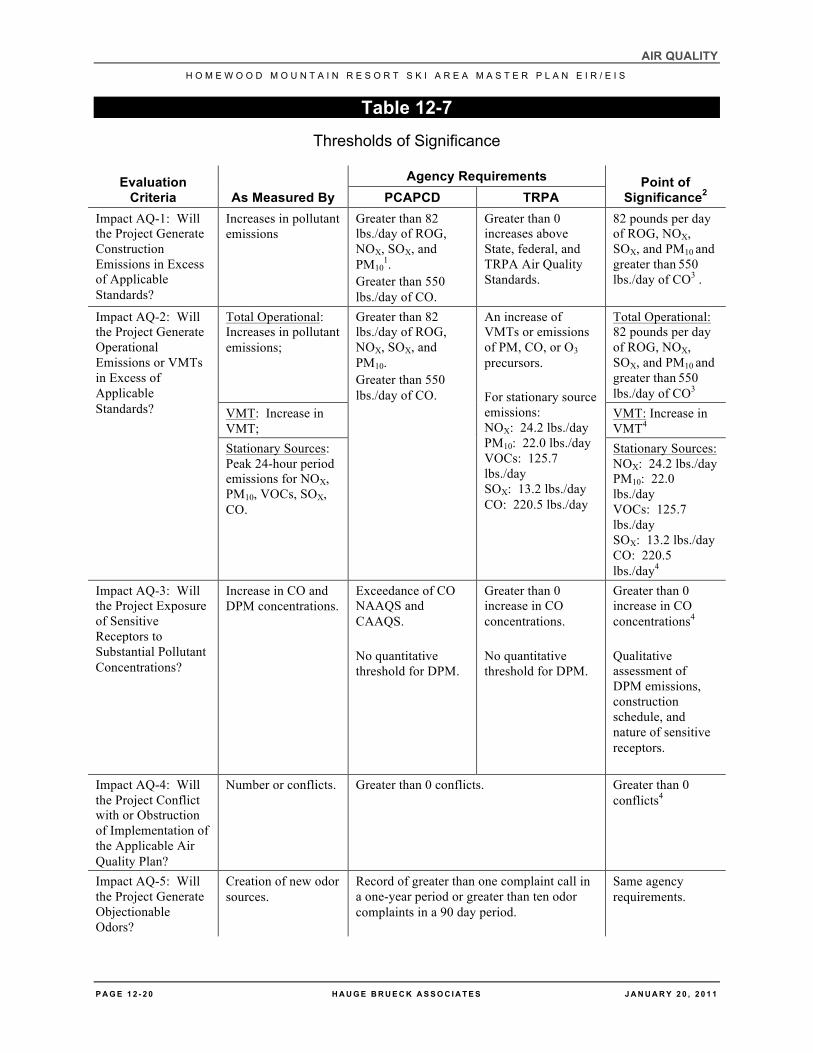
For the purposes of this analysis, the thresholds summarized in Table 12-7 will be used to determine whether implementation of the Project would result in a significant air quality impact. These thresholds were identified by the PCAPCD and the TRPA.
AIR QUALITY H O M E W O O D M O U N T A I N R E S O R T S K I A R E A M A S T E R P L A N E I R / E I S
P A G E 1 2 - 2 0 H A U G E B R U E C K A S S O C I A T E S J A N U A R Y 2 0 , 2 0 1 1
Table 12-7 Thresholds of Significance
Evaluation Criteria As Measured By
Agency Requirements Point of Significance2 PCAPCD TRPA
Impact AQ-1: Will the Project Generate Construction Emissions in Excess of Applicable Standards?
Increases in pollutant emissions
Greater than 82 lbs./day of ROG, NOX, SOX, and PM10
1. Greater than 550 lbs./day of CO.
Greater than 0 increases above State, federal, and TRPA Air Quality Standards.
82 pounds per day of ROG, NOX, SOX, and PM10 and greater than 550 lbs./day of CO3 .
Impact AQ-2: Will the Project Generate Operational Emissions or VMTs in Excess of Applicable Standards?
Total Operational: Increases in pollutant emissions;
Greater than 82 lbs./day of ROG, NOX, SOX, and PM10. Greater than 550 lbs./day of CO.
An increase of VMTs or emissions of PM, CO, or O3 precursors. For stationary source emissions: NOX: 24.2 lbs./day PM10: 22.0 lbs./day VOCs: 125.7 lbs./day SOX: 13.2 lbs./day CO: 220.5 lbs./day
Total Operational: 82 pounds per day of ROG, NOX, SOX, and PM10 and greater than 550 lbs./day of CO3
VMT: Increase in VMT;
VMT: Increase in VMT4
Stationary Sources: Peak 24-hour period emissions for NOX, PM10, VOCs, SOX, CO.
Stationary Sources: NOX: 24.2 lbs./day PM10: 22.0 lbs./day VOCs: 125.7 lbs./day SOX: 13.2 lbs./day CO: 220.5 lbs./day4
Impact AQ-3: Will the Project Exposure of Sensitive Receptors to Substantial Pollutant Concentrations?
Increase in CO and DPM concentrations.
Exceedance of CO NAAQS and CAAQS. No quantitative threshold for DPM.
Greater than 0 increase in CO concentrations. No quantitative threshold for DPM.
Greater than 0 increase in CO concentrations4 Qualitative assessment of DPM emissions, construction schedule, and nature of sensitive receptors.
Impact AQ-4: Will the Project Conflict with or Obstruction of Implementation of the Applicable Air Quality Plan?
Number or conflicts. Greater than 0 conflicts. Greater than 0 conflicts4
Impact AQ-5: Will the Project Generate Objectionable Odors?
Creation of new odor sources.
Record of greater than one complaint call in a one-year period or greater than ten odor complaints in a 90 day period.
Same agency requirements.
AIR QUALITY H O M E W O O D M O U N T A I N R E S O R T S K I A R E A M A S T E R P L A N E I R / E I S
J A N U A R Y 2 0 , 2 0 1 1 H A U G E B R U E C K A S S O C I A T E S P A G E 1 2 - 2 1
Evaluation Criteria As Measured By
Agency Requirements Point of Significance2 PCAPCD TRPA
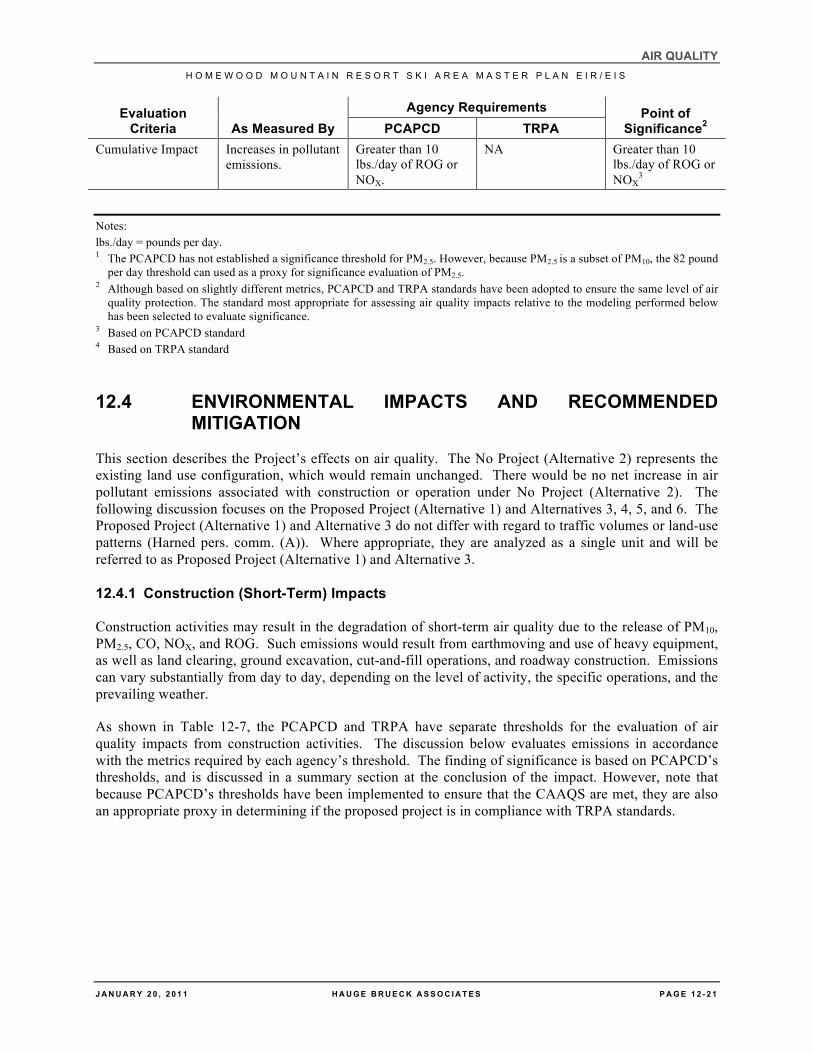
Cumulative Impact Increases in pollutant emissions.
Greater than 10 lbs./day of ROG or NOX.
NA Greater than 10 lbs./day of ROG or NOX
3
Notes: lbs./day = pounds per day. 1 The PCAPCD has not established a significance threshold for PM2.5. However, because PM2.5 is a subset of PM10, the 82 pound
per day threshold can used as a proxy for significance evaluation of PM2.5. 2 Although based on slightly different metrics, PCAPCD and TRPA standards have been adopted to ensure the same level of air
quality protection. The standard most appropriate for assessing air quality impacts relative to the modeling performed below has been selected to evaluate significance.
3 Based on PCAPCD standard 4 Based on TRPA standard
12.4 ENVIRONMENTAL IMPACTS AND RECOMMENDED MITIGATION
This section describes the Project’s effects on air quality. The No Project (Alternative 2) represents the existing land use configuration, which would remain unchanged. There would be no net increase in air pollutant emissions associated with construction or operation under No Project (Alternative 2). The following discussion focuses on the Proposed Project (Alternative 1) and Alternatives 3, 4, 5, and 6. The Proposed Project (Alternative 1) and Alternative 3 do not differ with regard to traffic volumes or land-use patterns (Harned pers. comm. (A)). Where appropriate, they are analyzed as a single unit and will be referred to as Proposed Project (Alternative 1) and Alternative 3.
12.4.1 Construction (Short-Term) Impacts
Construction activities may result in the degradation of short-term air quality due to the release of PM10, PM2.5, CO, NOX, and ROG. Such emissions would result from earthmoving and use of heavy equipment, as well as land clearing, ground excavation, cut-and-fill operations, and roadway construction. Emissions can vary substantially from day to day, depending on the level of activity, the specific operations, and the prevailing weather.
As shown in Table 12-7, the PCAPCD and TRPA have separate thresholds for the evaluation of air quality impacts from construction activities. The discussion below evaluates emissions in accordance with the metrics required by each agency’s threshold. The finding of significance is based on PCAPCD’s thresholds, and is discussed in a summary section at the conclusion of the impact. However, note that because PCAPCD’s thresholds have been implemented to ensure that the CAAQS are met, they are also an appropriate proxy in determining if the proposed project is in compliance with TRPA standards.
AIR QUALITY H O M E W O O D M O U N T A I N R E S O R T S K I A R E A M A S T E R P L A N E I R / E I S
P A G E 1 2 - 2 2 H A U G E B R U E C K A S S O C I A T E S J A N U A R Y 2 0 , 2 0 1 1
Impact: AQ-1. Will the Project Generate Construction Emissions in Excess of Applicable Standards?
Analysis: No Impact; No Project (Alternative 2)
The No Project (Alternative 2) will not include any changes to the existing HMR site or structures. Therefore, No Project (Alternative 2) will have no construction emissions.
Mitigation: No mitigation is required.
Analysis: Significant Impact; Proposed Project (Alternative 1) and Alternatives 3, 5, and 6
PCAPCD Requirements
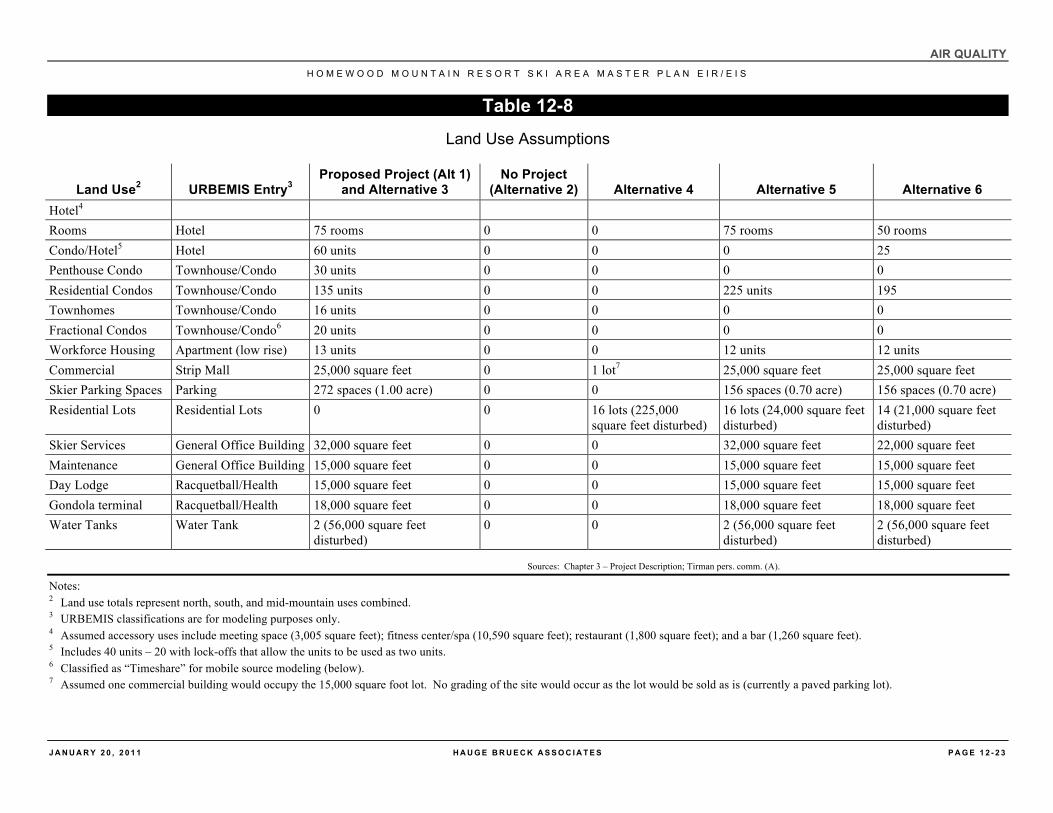
Construction emissions of ROG, NOX, CO, PM10, and PM2.5, were estimated using the URBEMIS2007 (version 9.2.4) model. To estimate construction emissions, URBEMIS2007 analyzes the type of construction equipment used and the duration of the construction period associated with construction of each of the land uses. Land use assumptions are presented in Table 12-8 and are based on information presented in Chapter 3 and provided by JMA Ventures, LLC (Tirman pers. comm. (A)). A detailed inventory of construction equipment was not provided. Therefore, equipment inventories, load factors, and horsepower (Hp) were based on default values generated by URBEMIS2007 for the specified land uses. Appendix M summarizes the equipment assumptions used in the modeling.
Construction of the Proposed Project (Alternative 1) and Alternatives 3, 5, and 6 will occur in four phases over a ten-year period (2011 through 2020) (Tirman pers. comm. (A)). The number of residential dwellings and square feet of nonresidential facilities under construction varies by year. The Mid-Mountain Base area and the North Base area will be completed during Phase 1a and Phase 1b/c, while South Base area construction will occur during Phases 2a and 2b. Appendix N summarizes the construction schedule and land-use assumptions used in the modeling. Complete URBEMIS2007 model outputs are provided in Appendix O.
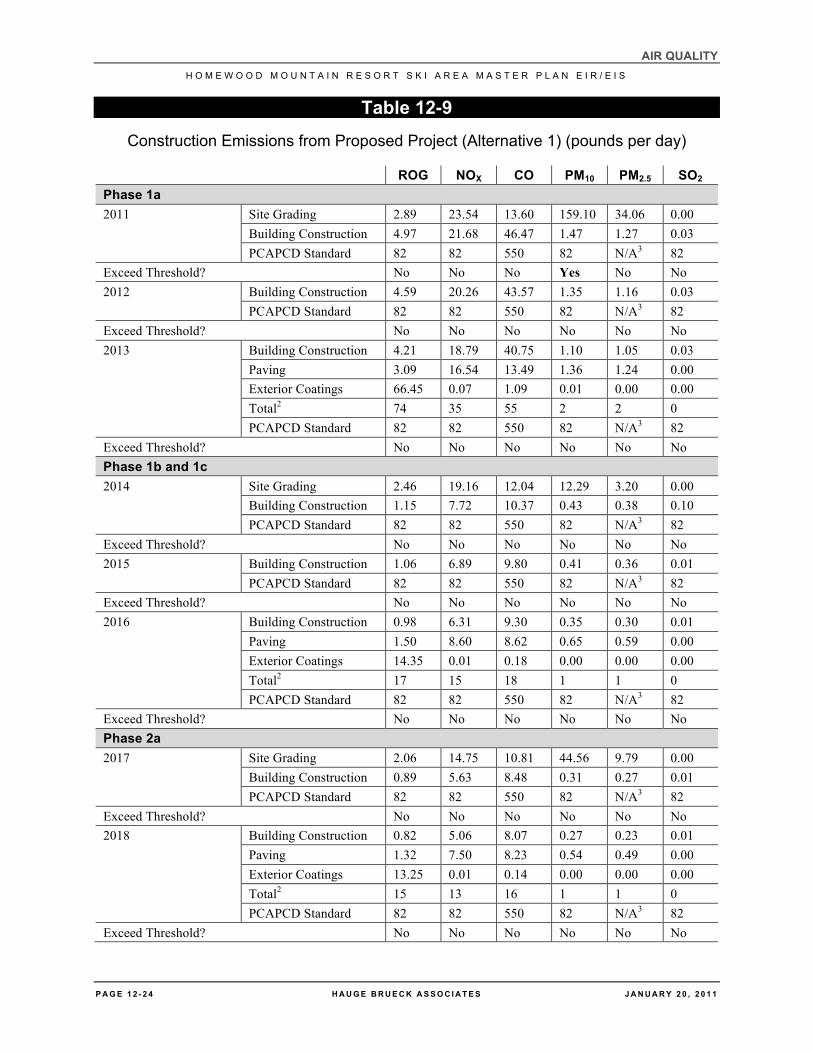
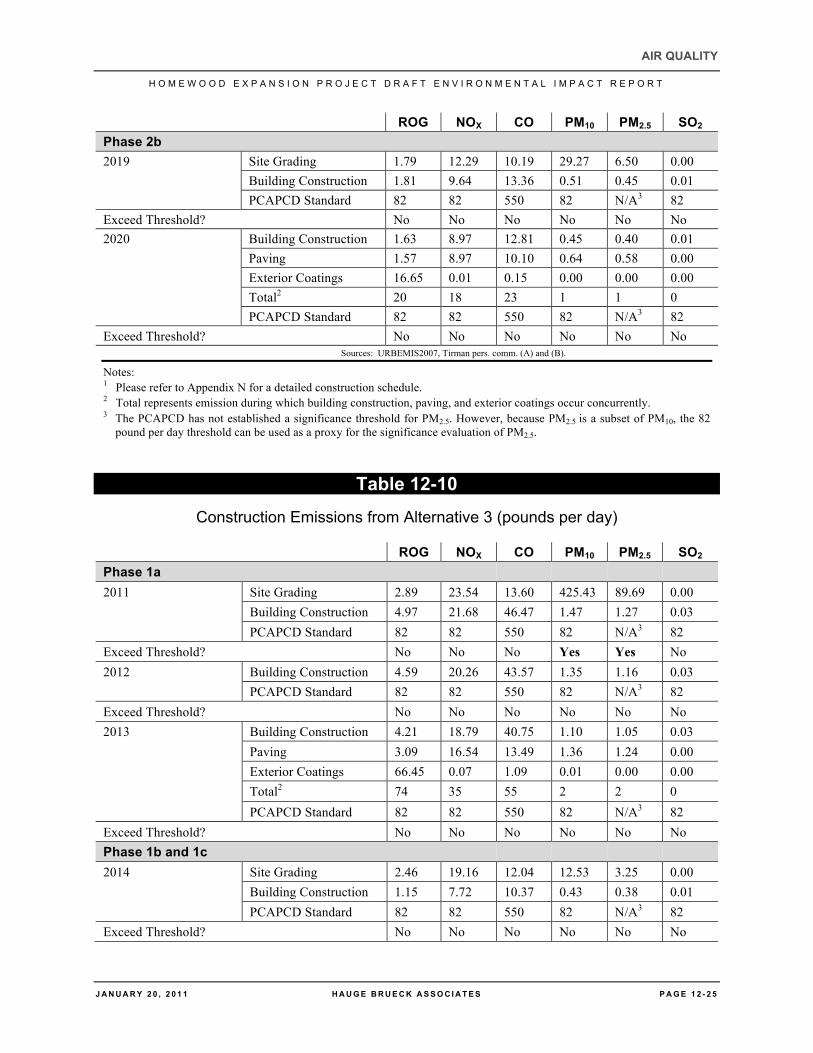
Tables 12-9 through 12-13 present construction emissions. As shown in these tables, implementation of the Proposed Project (Alternative 1) and Alternatives 3, 5, and 6 will generate a significant amount of PM10 and PM2.5during the first year of Phase 1a.
AIR QUALITY H O M E W O O D M O U N T A I N R E S O R T S K I A R E A M A S T E R P L A N E I R / E I S
J A N U A R Y 2 0 , 2 0 1 1 H A U G E B R U E C K A S S O C I A T E S P A G E 1 2 - 2 3
Table 12-8 Land Use Assumptions
Land Use2 URBEMIS Entry3 Proposed Project (Alt 1)
and Alternative 3 No Project
(Alternative 2) Alternative 4 Alternative 5 Alternative 6 Hotel4 Rooms Hotel 75 rooms 0 0 75 rooms 50 rooms Condo/Hotel5 Hotel 60 units 0 0 0 25 Penthouse Condo Townhouse/Condo 30 units 0 0 0 0 Residential Condos Townhouse/Condo 135 units 0 0 225 units 195 Townhomes Townhouse/Condo 16 units 0 0 0 0 Fractional Condos Townhouse/Condo6 20 units 0 0 0 0 Workforce Housing Apartment (low rise) 13 units 0 0 12 units 12 units Commercial Strip Mall 25,000 square feet 0 1 lot7 25,000 square feet 25,000 square feet Skier Parking Spaces Parking 272 spaces (1.00 acre) 0 0 156 spaces (0.70 acre) 156 spaces (0.70 acre) Residential Lots Residential Lots 0 0 16 lots (225,000
square feet disturbed) 16 lots (24,000 square feet disturbed)
14 (21,000 square feet disturbed)
Skier Services General Office Building 32,000 square feet 0 0 32,000 square feet 22,000 square feet Maintenance General Office Building 15,000 square feet 0 0 15,000 square feet 15,000 square feet Day Lodge Racquetball/Health 15,000 square feet 0 0 15,000 square feet 15,000 square feet Gondola terminal Racquetball/Health 18,000 square feet 0 0 18,000 square feet 18,000 square feet Water Tanks Water Tank 2 (56,000 square feet
disturbed) 0 0 2 (56,000 square feet
disturbed) 2 (56,000 square feet disturbed)
Sources: Chapter 3 – Project Description; Tirman pers. comm. (A).
Notes: 2 Land use totals represent north, south, and mid-mountain uses combined. 3 URBEMIS classifications are for modeling purposes only. 4 Assumed accessory uses include meeting space (3,005 square feet); fitness center/spa (10,590 square feet); restaurant (1,800 square feet); and a bar (1,260 square feet). 5 Includes 40 units – 20 with lock-offs that allow the units to be used as two units. 6 Classified as “Timeshare” for mobile source modeling (below). 7 Assumed one commercial building would occupy the 15,000 square foot lot. No grading of the site would occur as the lot would be sold as is (currently a paved parking lot).
AIR QUALITY H O M E W O O D M O U N T A I N R E S O R T S K I A R E A M A S T E R P L A N E I R / E I S
P A G E 1 2 - 2 4 H A U G E B R U E C K A S S O C I A T E S J A N U A R Y 2 0 , 2 0 1 1
Table 12-9 Construction Emissions from Proposed Project (Alternative 1) (pounds per day)
ROG NOX CO PM10 PM2.5 SO2 Phase 1a 2011 Site Grading 2.89 23.54 13.60 159.10 34.06 0.00
Building Construction 4.97 21.68 46.47 1.47 1.27 0.03 PCAPCD Standard 82 82 550 82 N/A3 82
Exceed Threshold? No No No Yes No No 2012 Building Construction 4.59 20.26 43.57 1.35 1.16 0.03
PCAPCD Standard 82 82 550 82 N/A3 82 Exceed Threshold? No No No No No No 2013 Building Construction 4.21 18.79 40.75 1.10 1.05 0.03
Paving 3.09 16.54 13.49 1.36 1.24 0.00 Exterior Coatings 66.45 0.07 1.09 0.01 0.00 0.00 Total2 74 35 55 2 2 0 PCAPCD Standard 82 82 550 82 N/A3 82
Exceed Threshold? No No No No No No Phase 1b and 1c 2014 Site Grading 2.46 19.16 12.04 12.29 3.20 0.00
Building Construction 1.15 7.72 10.37 0.43 0.38 0.10 PCAPCD Standard 82 82 550 82 N/A3 82
Exceed Threshold? No No No No No No 2015 Building Construction 1.06 6.89 9.80 0.41 0.36 0.01
PCAPCD Standard 82 82 550 82 N/A3 82 Exceed Threshold? No No No No No No 2016 Building Construction 0.98 6.31 9.30 0.35 0.30 0.01
Paving 1.50 8.60 8.62 0.65 0.59 0.00 Exterior Coatings 14.35 0.01 0.18 0.00 0.00 0.00 Total2 17 15 18 1 1 0 PCAPCD Standard 82 82 550 82 N/A3 82
Exceed Threshold? No No No No No No Phase 2a 2017 Site Grading 2.06 14.75 10.81 44.56 9.79 0.00
Building Construction 0.89 5.63 8.48 0.31 0.27 0.01 PCAPCD Standard 82 82 550 82 N/A3 82
Exceed Threshold? No No No No No No 2018 Building Construction 0.82 5.06 8.07 0.27 0.23 0.01
Paving 1.32 7.50 8.23 0.54 0.49 0.00 Exterior Coatings 13.25 0.01 0.14 0.00 0.00 0.00 Total2 15 13 16 1 1 0 PCAPCD Standard 82 82 550 82 N/A3 82
Exceed Threshold? No No No No No No
AIR QUALITY H O M E W O O D E X P A N S I O N P R O J E C T D R A F T E N V I R O N M E N T A L I M P A C T R E P O R T
J A N U A R Y 2 0 , 2 0 1 1 H A U G E B R U E C K A S S O C I A T E S P A G E 1 2 - 2 5
ROG NOX CO PM10 PM2.5 SO2 Phase 2b 2019 Site Grading 1.79 12.29 10.19 29.27 6.50 0.00
Building Construction 1.81 9.64 13.36 0.51 0.45 0.01 PCAPCD Standard 82 82 550 82 N/A3 82
Exceed Threshold? No No No No No No 2020 Building Construction 1.63 8.97 12.81 0.45 0.40 0.01
Paving 1.57 8.97 10.10 0.64 0.58 0.00 Exterior Coatings 16.65 0.01 0.15 0.00 0.00 0.00 Total2 20 18 23 1 1 0 PCAPCD Standard 82 82 550 82 N/A3 82
Exceed Threshold? No No No No No No Sources: URBEMIS2007, Tirman pers. comm. (A) and (B).
Notes: 1 Please refer to Appendix N for a detailed construction schedule. 2 Total represents emission during which building construction, paving, and exterior coatings occur concurrently. 3 The PCAPCD has not established a significance threshold for PM2.5. However, because PM2.5 is a subset of PM10, the 82
pound per day threshold can be used as a proxy for the significance evaluation of PM2.5.
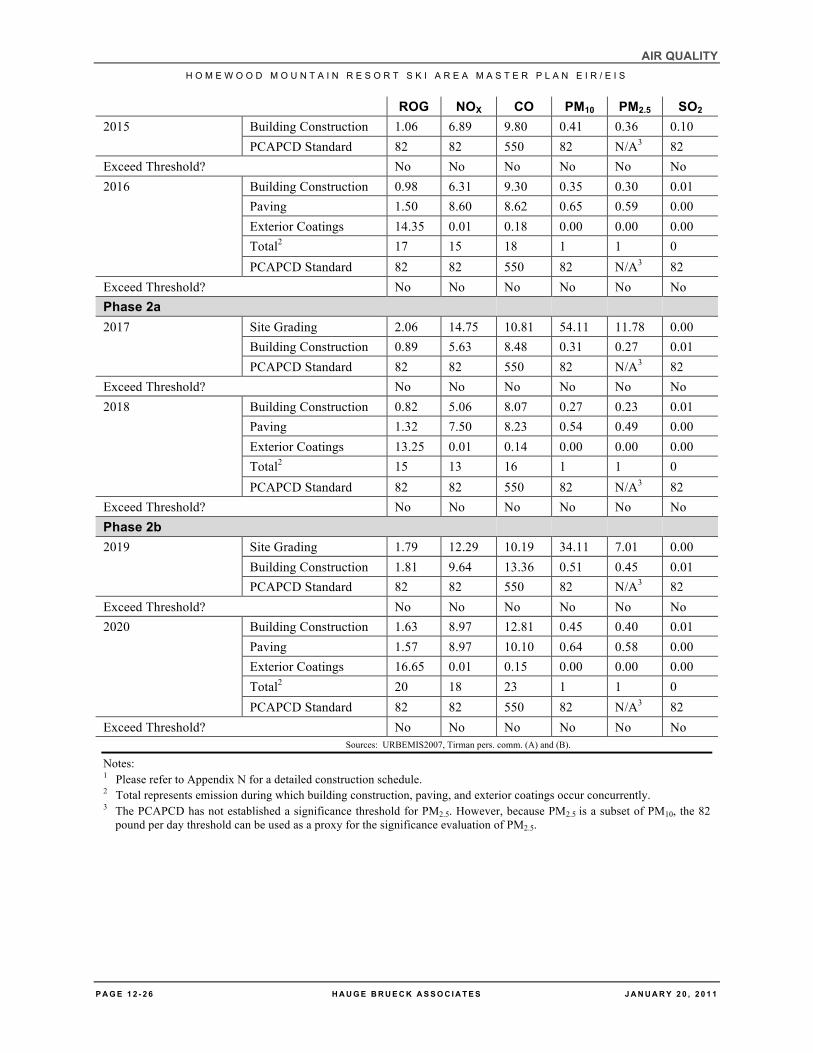
Table 12-10 Construction Emissions from Alternative 3 (pounds per day)
ROG NOX CO PM10 PM2.5 SO2 Phase 1a 2011 Site Grading 2.89 23.54 13.60 425.43 89.69 0.00
Building Construction 4.97 21.68 46.47 1.47 1.27 0.03 PCAPCD Standard 82 82 550 82 N/A3 82
Exceed Threshold? No No No Yes Yes No 2012 Building Construction 4.59 20.26 43.57 1.35 1.16 0.03
PCAPCD Standard 82 82 550 82 N/A3 82 Exceed Threshold? No No No No No No 2013 Building Construction 4.21 18.79 40.75 1.10 1.05 0.03
Paving 3.09 16.54 13.49 1.36 1.24 0.00 Exterior Coatings 66.45 0.07 1.09 0.01 0.00 0.00 Total2 74 35 55 2 2 0 PCAPCD Standard 82 82 550 82 N/A3 82
Exceed Threshold? No No No No No No Phase 1b and 1c 2014 Site Grading 2.46 19.16 12.04 12.53 3.25 0.00
Building Construction 1.15 7.72 10.37 0.43 0.38 0.01 PCAPCD Standard 82 82 550 82 N/A3 82
Exceed Threshold? No No No No No No
AIR QUALITY H O M E W O O D M O U N T A I N R E S O R T S K I A R E A M A S T E R P L A N E I R / E I S
P A G E 1 2 - 2 6 H A U G E B R U E C K A S S O C I A T E S J A N U A R Y 2 0 , 2 0 1 1
ROG NOX CO PM10 PM2.5 SO2 2015 Building Construction 1.06 6.89 9.80 0.41 0.36 0.10
PCAPCD Standard 82 82 550 82 N/A3 82 Exceed Threshold? No No No No No No 2016 Building Construction 0.98 6.31 9.30 0.35 0.30 0.01
Paving 1.50 8.60 8.62 0.65 0.59 0.00 Exterior Coatings 14.35 0.01 0.18 0.00 0.00 0.00 Total2 17 15 18 1 1 0 PCAPCD Standard 82 82 550 82 N/A3 82
Exceed Threshold? No No No No No No Phase 2a 2017 Site Grading 2.06 14.75 10.81 54.11 11.78 0.00
Building Construction 0.89 5.63 8.48 0.31 0.27 0.01 PCAPCD Standard 82 82 550 82 N/A3 82
Exceed Threshold? No No No No No No 2018 Building Construction 0.82 5.06 8.07 0.27 0.23 0.01
Paving 1.32 7.50 8.23 0.54 0.49 0.00 Exterior Coatings 13.25 0.01 0.14 0.00 0.00 0.00 Total2 15 13 16 1 1 0 PCAPCD Standard 82 82 550 82 N/A3 82
Exceed Threshold? No No No No No No Phase 2b 2019 Site Grading 1.79 12.29 10.19 34.11 7.01 0.00
Building Construction 1.81 9.64 13.36 0.51 0.45 0.01 PCAPCD Standard 82 82 550 82 N/A3 82
Exceed Threshold? No No No No No No 2020 Building Construction 1.63 8.97 12.81 0.45 0.40 0.01
Paving 1.57 8.97 10.10 0.64 0.58 0.00 Exterior Coatings 16.65 0.01 0.15 0.00 0.00 0.00 Total2 20 18 23 1 1 0 PCAPCD Standard 82 82 550 82 N/A3 82
Exceed Threshold? No No No No No No Sources: URBEMIS2007, Tirman pers. comm. (A) and (B).
Notes: 1 Please refer to Appendix N for a detailed construction schedule. 2 Total represents emission during which building construction, paving, and exterior coatings occur concurrently. 3 The PCAPCD has not established a significance threshold for PM2.5. However, because PM2.5 is a subset of PM10, the 82
pound per day threshold can be used as a proxy for the significance evaluation of PM2.5.
AIR QUALITY H O M E W O O D E X P A N S I O N P R O J E C T D R A F T E N V I R O N M E N T A L I M P A C T R E P O R T
J A N U A R Y 2 0 , 2 0 1 1 H A U G E B R U E C K A S S O C I A T E S P A G E 1 2 - 2 7
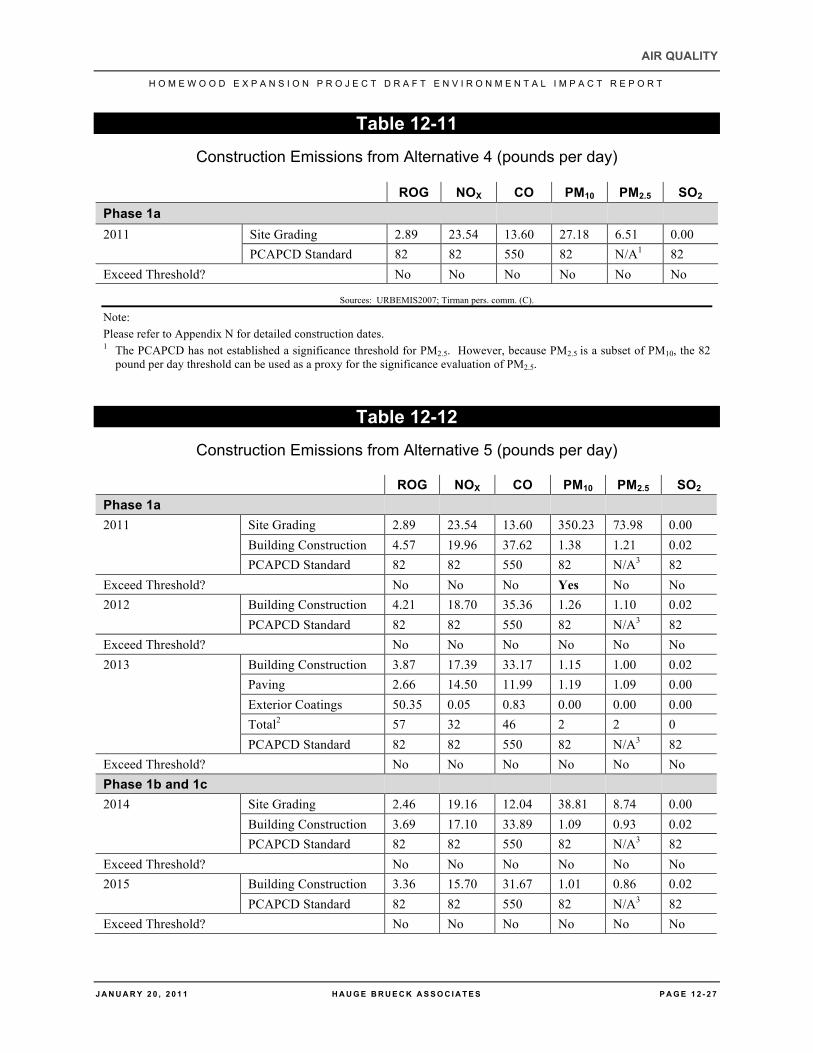
Table 12-11 Construction Emissions from Alternative 4 (pounds per day)
ROG NOX CO PM10 PM2.5 SO2 Phase 1a 2011 Site Grading 2.89 23.54 13.60 27.18 6.51 0.00
PCAPCD Standard 82 82 550 82 N/A1 82 Exceed Threshold? No No No No No No
Sources: URBEMIS2007; Tirman pers. comm. (C).
Note: Please refer to Appendix N for detailed construction dates. 1 The PCAPCD has not established a significance threshold for PM2.5. However, because PM2.5 is a subset of PM10, the 82
pound per day threshold can be used as a proxy for the significance evaluation of PM2.5.
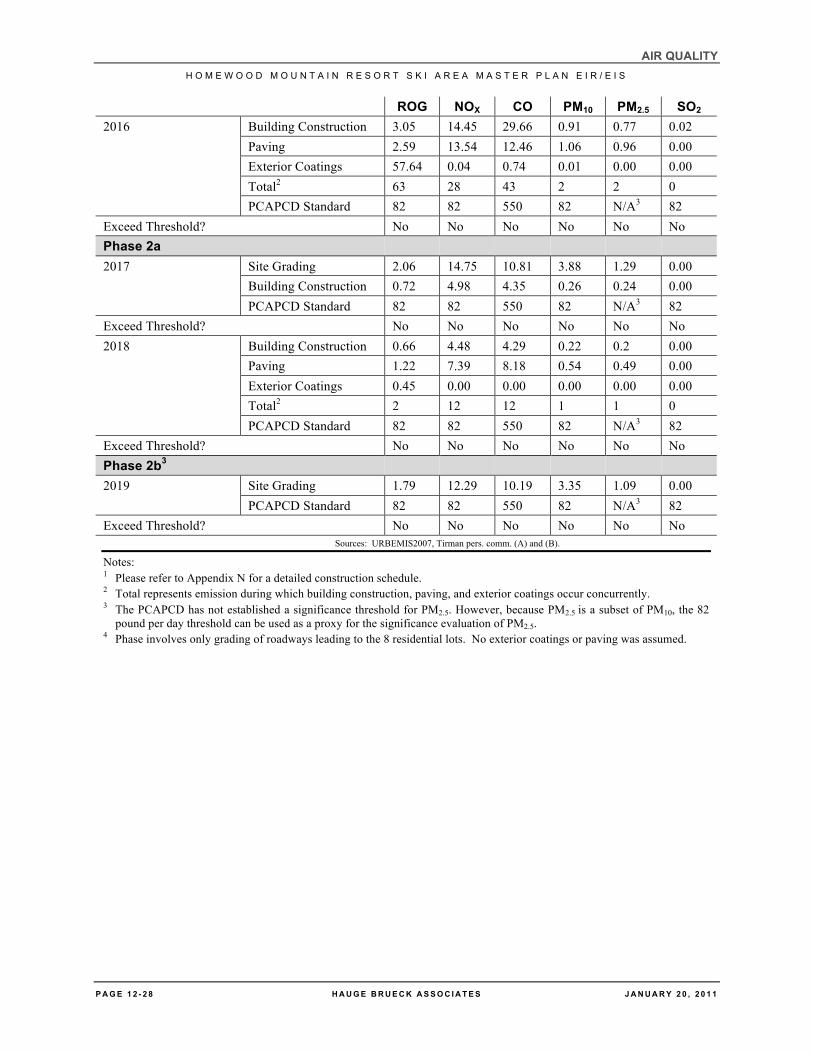
Table 12-12 Construction Emissions from Alternative 5 (pounds per day)
ROG NOX CO PM10 PM2.5 SO2 Phase 1a 2011 Site Grading 2.89 23.54 13.60 350.23 73.98 0.00
Building Construction 4.57 19.96 37.62 1.38 1.21 0.02 PCAPCD Standard 82 82 550 82 N/A3 82
Exceed Threshold? No No No Yes No No 2012 Building Construction 4.21 18.70 35.36 1.26 1.10 0.02
PCAPCD Standard 82 82 550 82 N/A3 82 Exceed Threshold? No No No No No No 2013 Building Construction 3.87 17.39 33.17 1.15 1.00 0.02
Paving 2.66 14.50 11.99 1.19 1.09 0.00 Exterior Coatings 50.35 0.05 0.83 0.00 0.00 0.00 Total2 57 32 46 2 2 0 PCAPCD Standard 82 82 550 82 N/A3 82
Exceed Threshold? No No No No No No Phase 1b and 1c 2014 Site Grading 2.46 19.16 12.04 38.81 8.74 0.00
Building Construction 3.69 17.10 33.89 1.09 0.93 0.02 PCAPCD Standard 82 82 550 82 N/A3 82
Exceed Threshold? No No No No No No 2015 Building Construction 3.36 15.70 31.67 1.01 0.86 0.02
PCAPCD Standard 82 82 550 82 N/A3 82 Exceed Threshold? No No No No No No
AIR QUALITY H O M E W O O D M O U N T A I N R E S O R T S K I A R E A M A S T E R P L A N E I R / E I S
P A G E 1 2 - 2 8 H A U G E B R U E C K A S S O C I A T E S J A N U A R Y 2 0 , 2 0 1 1
ROG NOX CO PM10 PM2.5 SO2 2016 Building Construction 3.05 14.45 29.66 0.91 0.77 0.02
Paving 2.59 13.54 12.46 1.06 0.96 0.00 Exterior Coatings 57.64 0.04 0.74 0.01 0.00 0.00 Total2 63 28 43 2 2 0 PCAPCD Standard 82 82 550 82 N/A3 82
Exceed Threshold? No No No No No No Phase 2a 2017 Site Grading 2.06 14.75 10.81 3.88 1.29 0.00
Building Construction 0.72 4.98 4.35 0.26 0.24 0.00 PCAPCD Standard 82 82 550 82 N/A3 82
Exceed Threshold? No No No No No No 2018 Building Construction 0.66 4.48 4.29 0.22 0.2 0.00
Paving 1.22 7.39 8.18 0.54 0.49 0.00 Exterior Coatings 0.45 0.00 0.00 0.00 0.00 0.00 Total2 2 12 12 1 1 0 PCAPCD Standard 82 82 550 82 N/A3 82
Exceed Threshold? No No No No No No Phase 2b3 2019 Site Grading 1.79 12.29 10.19 3.35 1.09 0.00
PCAPCD Standard 82 82 550 82 N/A3 82 Exceed Threshold? No No No No No No
Sources: URBEMIS2007, Tirman pers. comm. (A) and (B).
Notes: 1 Please refer to Appendix N for a detailed construction schedule. 2 Total represents emission during which building construction, paving, and exterior coatings occur concurrently. 3 The PCAPCD has not established a significance threshold for PM2.5. However, because PM2.5 is a subset of PM10, the 82
pound per day threshold can be used as a proxy for the significance evaluation of PM2.5. 4 Phase involves only grading of roadways leading to the 8 residential lots. No exterior coatings or paving was assumed.
AIR QUALITY H O M E W O O D E X P A N S I O N P R O J E C T D R A F T E N V I R O N M E N T A L I M P A C T R E P O R T
J A N U A R Y 2 0 , 2 0 1 1 H A U G E B R U E C K A S S O C I A T E S P A G E 1 2 - 2 9
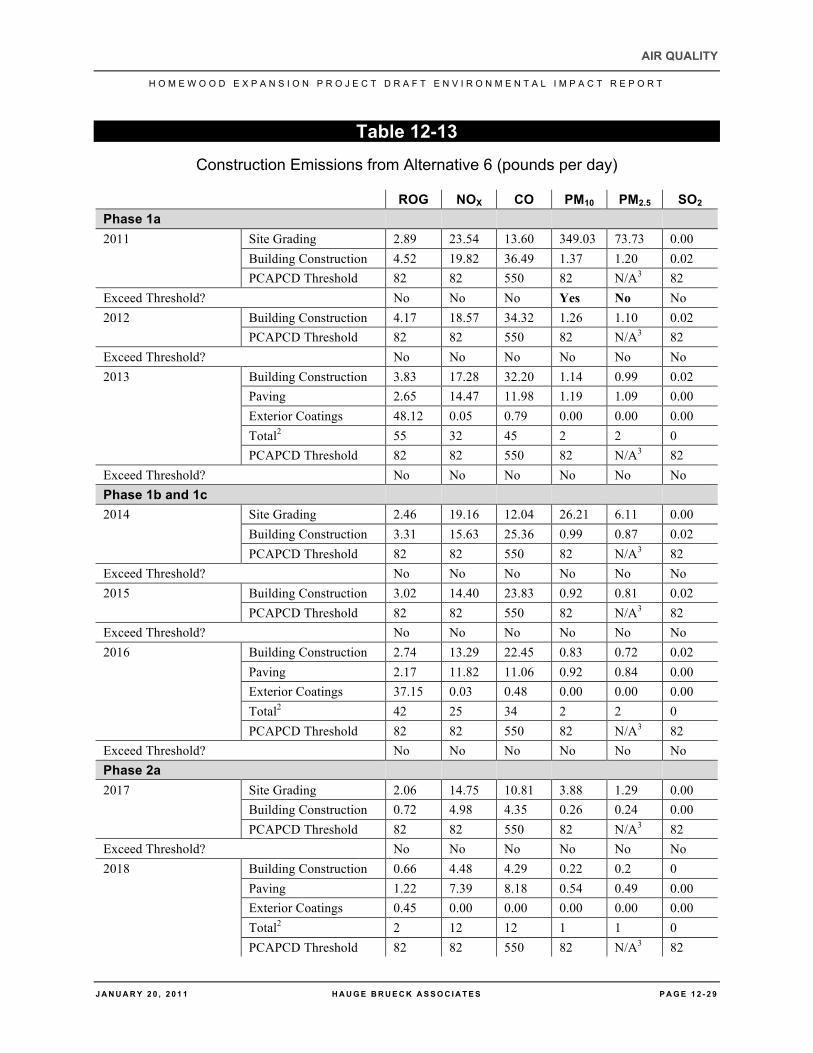
Table 12-13 Construction Emissions from Alternative 6 (pounds per day)
ROG NOX CO PM10 PM2.5 SO2 Phase 1a 2011 Site Grading 2.89 23.54 13.60 349.03 73.73 0.00
Building Construction 4.52 19.82 36.49 1.37 1.20 0.02 PCAPCD Threshold 82 82 550 82 N/A3 82
Exceed Threshold? No No No Yes No No 2012 Building Construction 4.17 18.57 34.32 1.26 1.10 0.02
PCAPCD Threshold 82 82 550 82 N/A3 82 Exceed Threshold? No No No No No No 2013 Building Construction 3.83 17.28 32.20 1.14 0.99 0.02
Paving 2.65 14.47 11.98 1.19 1.09 0.00 Exterior Coatings 48.12 0.05 0.79 0.00 0.00 0.00 Total2 55 32 45 2 2 0 PCAPCD Threshold 82 82 550 82 N/A3 82
Exceed Threshold? No No No No No No Phase 1b and 1c 2014 Site Grading 2.46 19.16 12.04 26.21 6.11 0.00
Building Construction 3.31 15.63 25.36 0.99 0.87 0.02 PCAPCD Threshold 82 82 550 82 N/A3 82
Exceed Threshold? No No No No No No 2015 Building Construction 3.02 14.40 23.83 0.92 0.81 0.02
PCAPCD Threshold 82 82 550 82 N/A3 82 Exceed Threshold? No No No No No No 2016 Building Construction 2.74 13.29 22.45 0.83 0.72 0.02
Paving 2.17 11.82 11.06 0.92 0.84 0.00 Exterior Coatings 37.15 0.03 0.48 0.00 0.00 0.00 Total2 42 25 34 2 2 0 PCAPCD Threshold 82 82 550 82 N/A3 82
Exceed Threshold? No No No No No No Phase 2a 2017 Site Grading 2.06 14.75 10.81 3.88 1.29 0.00
Building Construction 0.72 4.98 4.35 0.26 0.24 0.00 PCAPCD Threshold 82 82 550 82 N/A3 82
Exceed Threshold? No No No No No No 2018 Building Construction 0.66 4.48 4.29 0.22 0.2 0
Paving 1.22 7.39 8.18 0.54 0.49 0.00 Exterior Coatings 0.45 0.00 0.00 0.00 0.00 0.00 Total2 2 12 12 1 1 0 PCAPCD Threshold 82 82 550 82 N/A3 82
AIR QUALITY H O M E W O O D M O U N T A I N R E S O R T S K I A R E A M A S T E R P L A N E I R / E I S
P A G E 1 2 - 3 0 H A U G E B R U E C K A S S O C I A T E S J A N U A R Y 2 0 , 2 0 1 1
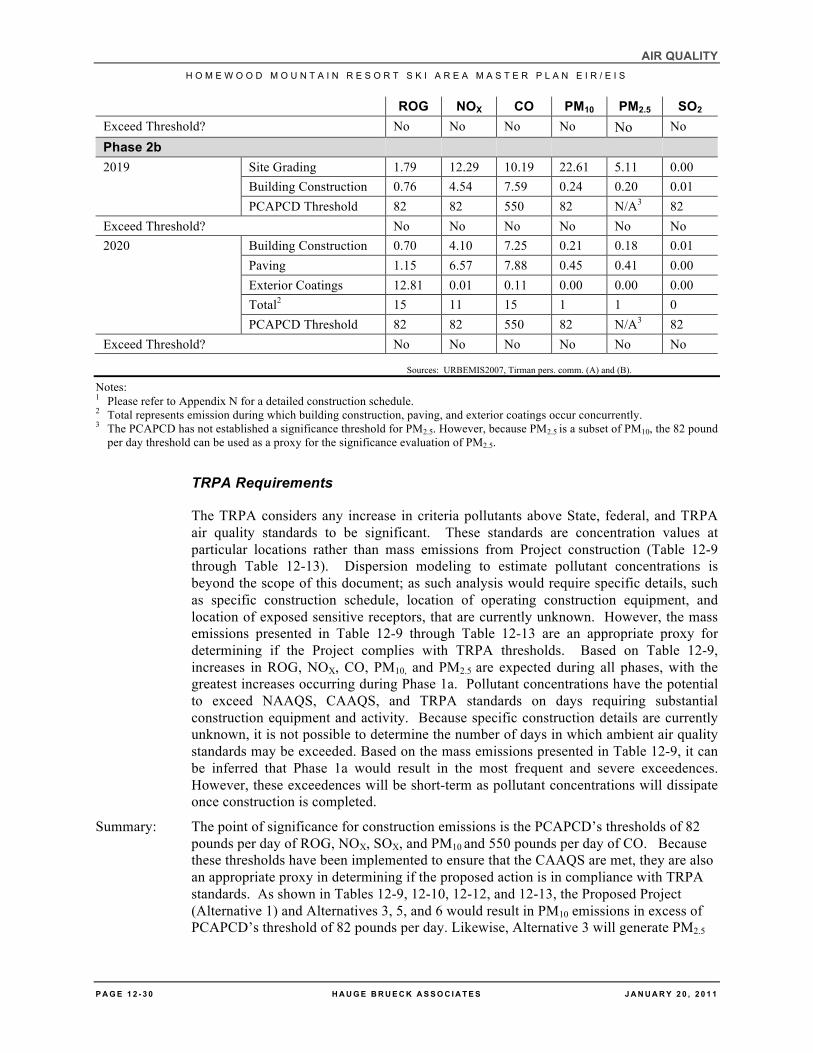
ROG NOX CO PM10 PM2.5 SO2 Exceed Threshold? No No No No No No Phase 2b 2019 Site Grading 1.79 12.29 10.19 22.61 5.11 0.00
Building Construction 0.76 4.54 7.59 0.24 0.20 0.01 PCAPCD Threshold 82 82 550 82 N/A3 82
Exceed Threshold? No No No No No No 2020 Building Construction 0.70 4.10 7.25 0.21 0.18 0.01
Paving 1.15 6.57 7.88 0.45 0.41 0.00 Exterior Coatings 12.81 0.01 0.11 0.00 0.00 0.00 Total2 15 11 15 1 1 0 PCAPCD Threshold 82 82 550 82 N/A3 82
Exceed Threshold? No No No No No No
Sources: URBEMIS2007, Tirman pers. comm. (A) and (B).
Notes: 1 Please refer to Appendix N for a detailed construction schedule. 2 Total represents emission during which building construction, paving, and exterior coatings occur concurrently. 3 The PCAPCD has not established a significance threshold for PM2.5. However, because PM2.5 is a subset of PM10, the 82 pound
per day threshold can be used as a proxy for the significance evaluation of PM2.5.
TRPA Requirements
The TRPA considers any increase in criteria pollutants above State, federal, and TRPA air quality standards to be significant. These standards are concentration values at particular locations rather than mass emissions from Project construction (Table 12-9 through Table 12-13). Dispersion modeling to estimate pollutant concentrations is beyond the scope of this document; as such analysis would require specific details, such as specific construction schedule, location of operating construction equipment, and location of exposed sensitive receptors, that are currently unknown. However, the mass emissions presented in Table 12-9 through Table 12-13 are an appropriate proxy for determining if the Project complies with TRPA thresholds. Based on Table 12-9, increases in ROG, NOX, CO, PM10, and PM2.5 are expected during all phases, with the greatest increases occurring during Phase 1a. Pollutant concentrations have the potential to exceed NAAQS, CAAQS, and TRPA standards on days requiring substantial construction equipment and activity. Because specific construction details are currently unknown, it is not possible to determine the number of days in which ambient air quality standards may be exceeded. Based on the mass emissions presented in Table 12-9, it can be inferred that Phase 1a would result in the most frequent and severe exceedences. However, these exceedences will be short-term as pollutant concentrations will dissipate once construction is completed.
Summary: The point of significance for construction emissions is the PCAPCD’s thresholds of 82 pounds per day of ROG, NOX, SOX, and PM10 and 550 pounds per day of CO. Because these thresholds have been implemented to ensure that the CAAQS are met, they are also an appropriate proxy in determining if the proposed action is in compliance with TRPA standards. As shown in Tables 12-9, 12-10, 12-12, and 12-13, the Proposed Project (Alternative 1) and Alternatives 3, 5, and 6 would result in PM10 emissions in excess of PCAPCD’s threshold of 82 pounds per day. Likewise, Alternative 3 will generate PM2.5
AIR QUALITY H O M E W O O D E X P A N S I O N P R O J E C T D R A F T E N V I R O N M E N T A L I M P A C T R E P O R T
J A N U A R Y 2 0 , 2 0 1 1 H A U G E B R U E C K A S S O C I A T E S P A G E 1 2 - 3 1
emissions in excess of 82 pounds per day.2 This is a significant impact. To reduce construction emissions, the PCAPCD recommends implementation of Mitigation Measures AQ-1.
Mitigation: Mitigation Measure AQ-1: Implement PCAPCD Best Management Practices (BMPs) to reduce pollutant emissions during construction.
The Project Applicant shall implement the following recommended mitigation measures, which were provided by the PCAPCD. These measures shall be implemented prior to and during the construction phase. In addition, construction of the Project is required to comply with PCAPCD rules and regulations (see section 12-2).
• Dust Control Plan: The applicant shall submit a Construction Emission/Dust Control Plan to the PCAPCD. This plan must address the minimum Administrative Requirements found in PCAPCD Rule 228, Fugitive Dust, Sections 300 and 400. The applicant shall not break ground prior to receiving PCAPCD approval of the Construction Emission/Dust Control Plan.
• Equipment Inventory: The Project Applicant shall submit a comprehensive inventory (i.e. make, model, year, emission rating) of heavy-duty off-road equipment (50 horsepower of greater) that will be used an aggregate of 40 or more hours for construction.
• Enforcement Plan: An enforcement plan shall be established and submitted to the PCAPCD for review, to evaluate weekly project-related on-and-off- road heavy-duty vehicle engine emission opacities, using standards as defined in California Code of Regulations, Title 13, Sections 2180 - 2194.
• Compliance with Rule 202: Construction equipment exhaust emissions shall not exceed District Rule 202, Visible Emission limitations.
• Compliance with Rule 228: Grading operations shall be suspended if fugitive dust exceeds PCAPCD Rule 228 (Fugitive Dust) limitations. Water shall be applied to control dust, as required by the rule, to prevent dust impacts off-site. Operational water truck(s) shall be on-site, at all times, to control fugitive dust. Construction vehicles leaving the site shall be cleaned to prevent dust, silt, mud, and dirt from being released or tracked off-site.
• Pre-Construction Meeting: If required by the Department of Engineering and Surveying and/or the Department of Public Works, the contractor shall have a pre-construction meeting for grading activities. The contractor shall invite the PCAPCD to the pre-construction meeting in order to discuss the construction emission/dust control plan with employees and/or contractors.
• Maintenance of Public Thoroughfares: The Project Applicant shall keep adjacent public thoroughfares clean of silt, dirt, mud, and debris, and shall “wet broom” the streets if silt, dirt, mud or debris is carried over to adjacent public thoroughfares. Dry mechanical sweeping is prohibited.
• Traffic Limits: Traffic speeds on unpaved surfaces shall be limited to 15 miles per hour or less.
2 The PCAPCD has not established a significance threshold for PM2.5. However, because PM2.5 is a subset of PM10,
the 82 pound per day threshold can be used as a proxy for the significance evaluation of PM2.5.
AIR QUALITY H O M E W O O D M O U N T A I N R E S O R T S K I A R E A M A S T E R P L A N E I R / E I S
P A G E 1 2 - 3 2 H A U G E B R U E C K A S S O C I A T E S J A N U A R Y 2 0 , 2 0 1 1
• Wind Restrictions: Grading operations shall be suspended when wind speeds (including instantaneous gusts) exceed 25 miles per hour and dust is impacting adjacent properties.
• Idling Restrictions: Idling time shall be limited to a maximum of five minutes for diesel-powered equipment.
• Open Burning Restrictions: No open burning of removed vegetation shall be allowed during construction. Removed vegetative material shall be either chipped on-site or taken to an appropriate disposal site.
• Ultra-Low Diesel Fuel: ARB ultra low diesel fuel shall be used for diesel–powered equipment and low sulfur fuel shall be utilized for stationary equipment.
• Clean Power Sources: Existing power sources (e.g., power poles) or clean fuel generators shall be used rather than temporary diesel power generators.
• Compliance with PCAPCD Permit Regulations: On-site stationary equipment which is classified as 50 horsepower or greater shall either obtain a State issued portable equipment permit or a PCAPCD issued portable equipment permit. Pursuant to PCAPCD Rule 501, General Permit Requirements, the Project may need a permit from the PCAPCD prior to construction. In general, any engine greater than 50 brake horsepower or any boiler with heat greater than 1,000,000 Btu per hour requires a PCAPCD permit.
• Compliance with NESHAPs: The demolition or remodeling of any structure may be subject to the National Emission Standard for Hazardous Air Pollutants (NESHAPs) for Asbestos. This may require that a structure to be demolished be inspected for the presence of asbestos by a certified asbestos inspector, and that asbestos materials are removed prior to demolition.
• Traffic Plans: If a Traffic Plan is required the PCAPCD shall be provided receive a copy for review. PCAPCD recommendations within the plan may include, but not be limited to: use of public transportation and satellite parking areas with a shuttle service.
• Landscaping Plan: The applicant shall provide a landscaping plan for review and approval by the Design/Site Review Committee. As required by the PCAPCD, landscaping shall include native drought-resistant species (plants, trees and bushes) and no more than 25% lawn area to reduce the demand for irrigation and gas powered landscape maintenance equipment. The Project Applicant shall include irrigation systems which efficiently utilize water (e.g., prohibit systems that apply water to non-vegetated surfaces and systems which create runoff), use applicant shall install water-efficient irrigation systems and devices, such as soil moisture-based irrigation controls, rain “shut off” valves, and other devices as reviewed and approved by the Design Site Review Committee.
• Limit Daily Construction Activities: Daily soil disturbance activities shall be limited to 15 acres per day.
After Mitigation: Less than Significant Impact, Alternative 1 (Proposed Project); Significant and
Unavoidable Impact; Alternatives 3, 5, and 6
PCAPCD staff indicates that compliance with Mitigation Measures AQ-1 can reduce construction PM10 and PM2.5 emissions by 50%. For the Proposed Project,
AIR QUALITY H O M E W O O D E X P A N S I O N P R O J E C T D R A F T E N V I R O N M E N T A L I M P A C T R E P O R T
J A N U A R Y 2 0 , 2 0 1 1 H A U G E B R U E C K A S S O C I A T E S P A G E 1 2 - 3 3
implementation of Mitigation Measure AQ-1 will reduce PM10 emissions to 79.55 pounds per day, which is below the PCAPCD’s significance threshold of 82. This impact is considered less than significant.
For Alternatives 3, 5, and 6, depending on the alternative selected, Mitigation Measure AQ-1 equates to an approximate reduction of 150 - 215 pounds per day in PM10 and 37 - 45 pound per day in PM2.5 during Phase 1a.3 Implementation of Mitigation Measure AQ-1 will therefore reduce PM2.5 emissions below 82 pounds per day. However, short-term project emissions of PM10 will still exceed PCAPCD’s significance threshold. This impact is therefore significant and unavoidable.
Analysis: Less Than Significant Impact; Alternative 4
As documented in Table 12-11, Alternative 4 will not exceed PCQPCD significance thresholds for construction emissions. Therefore, this impact is considered to be less than significant.
Mitigation: No mitigation is required.
12.4.2 Operational (Long-Term) Impacts
Project operation will generate long-term emissions of ROG, NOX, PM10, PM2.5, and CO from mobile, stationary, and area sources. Mobile sources include increased vehicle traffic (VMTs, ADTs) associated with the Project and water taxis. Stationary and area sources include natural gas combustion, consumer products, landscaping equipment, the application of architectural coatings, and the diesel back-up generators for the chairlifts.
This section analyzes operational emissions per guidance from the PCAPCD (Chang pers. comm. (A)). It was assumed that operational emissions would begin once a building is fully operational and continue each subsequent year. Building completion dates were based on the construction schedule summarized in Appendix N. Operational emissions from each year during the construction process are presented in Appendix S. To ensure a conservative analysis, the discussion below presents emissions at buildout and occupancy of the Project.
As shown in Table 12-7, the PCAPCD and TRPA have separate thresholds for the evaluation of air quality impacts from operational activities. The discussion below evaluates emissions in accordance with the metrics required by each agency’s threshold.
Impact: AQ-2. Will the Project Generate Operational Emissions or Vehicle Miles Traveled (VMT) in Excess of Applicable Standards?
Analysis: No Impact; No Project (Alternative 2)
No Project (Alternative 2) will not induce any changes to the existing land uses, densities, or roadway network. Emissions associated with existing operations at HMR, including natural gas consumption for No Project (Alternative 2) of 11,000 therms per year provided by JMA Ventures, LLC (Tirman pers. comm. (D)), would remain unchanged.
3 Note that implementation of Mitigation Measure AQ-1, specifically idling restrictions and traffic plans, will also
contribute to reductions of ozone precursors and CO.
AIR QUALITY H O M E W O O D M O U N T A I N R E S O R T S K I A R E A M A S T E R P L A N E I R / E I S
P A G E 1 2 - 3 4 H A U G E B R U E C K A S S O C I A T E S J A N U A R Y 2 0 , 2 0 1 1
Therefore, No Project (Alternative 2) will not result in any impacts. No further analysis is required.
Mitigation: No mitigation is required.
Analysis: Significant Impact; Proposed Project (Alternative 1) and Alternatives 3, 4, 5, and 6
PCAPCD Requirement
Mobile Source Emissions
Primary mobile sources are those emissions associated with vehicle trips and include employee, delivery, and maintenance activities. Off-road vehicles, such as the two water taxis, are also considered sources of mobile emissions. Operational emissions from these sources are O3 precursors (ROG and NOX), CO, PM10, PM2.5, and CO2 emitted as exhaust. Please refer to Chapter 19 for a discussion of global climate change and Project-related greenhouse gas emissions. (See conformity analysis RTP: Mobility 2030).
Trip generation information used in the analysis is based on data provided by the traffic engineers, Fehr & Peers (Harned pers. comm. (A) and (B)). Fehr & Peers provided daily trip rates for each land use (residential, commercial, etc.). To provide a conservative analysis, Fehr & Peers produced two trip rates for lodging activities—one rate accounts for 50% of the lodging guests arriving at the resort on Friday during the PM peak hour, while the other rate accounts for the remaining 50% of the guests arriving over a period from the late afternoon to evening (Fehr & Peers 2009). Daily trip rates were adjusted to account for internal trips completed by guests already at HMR and alternative modes of transportation. Data for the adjustment calculations were provided by Fehr & Peers (Harned pers. comm. (B)). Appendix P contains the trip generation rates used in the modeling.
Fehr & Peers provided daily VMTs for the winter and summer seasons. The traffic data indicated that there are currently no regular uses at the Project site during summer. The Lake Tahoe Music Festival holds a maximum of two concerns per summer at HMR. Since this event only occurs twice per summer, it was not included in analysis by Fehr & Peers and existing summer VMT was therefore assumed to be zero (Fehr & Peers 2009; Harned pers. comm. (A)). Consequently, the Project would result in increased trips and mobile emissions during the summer season.
During the winter ski season, existing VMT is currently higher than the VMT estimated with the Proposed Project (Alternative 1) and Alternatives 3, 5, and 6 (Harned pers. comm. (A)). This is because the residential units and hotel rooms would result in internalization between Project uses, reducing the external trips generated as compared to existing conditions. The existing site does not have internal capture of trips because day skiers must arrive at the beginning of each day and leave the site at the end of each day.!
Table 12-14 summarizes VMT provided by Fehr & Peers. Note that the VMT estimate for Alternative 5 does not include trips associated with the 12 workforce housing units. These units were added to the design concept following the originally modeling completed by Fehr & Peers. Addition of these 12 units is not expected to substantially increase summer or winter VMT above values presented in Table 12-14.
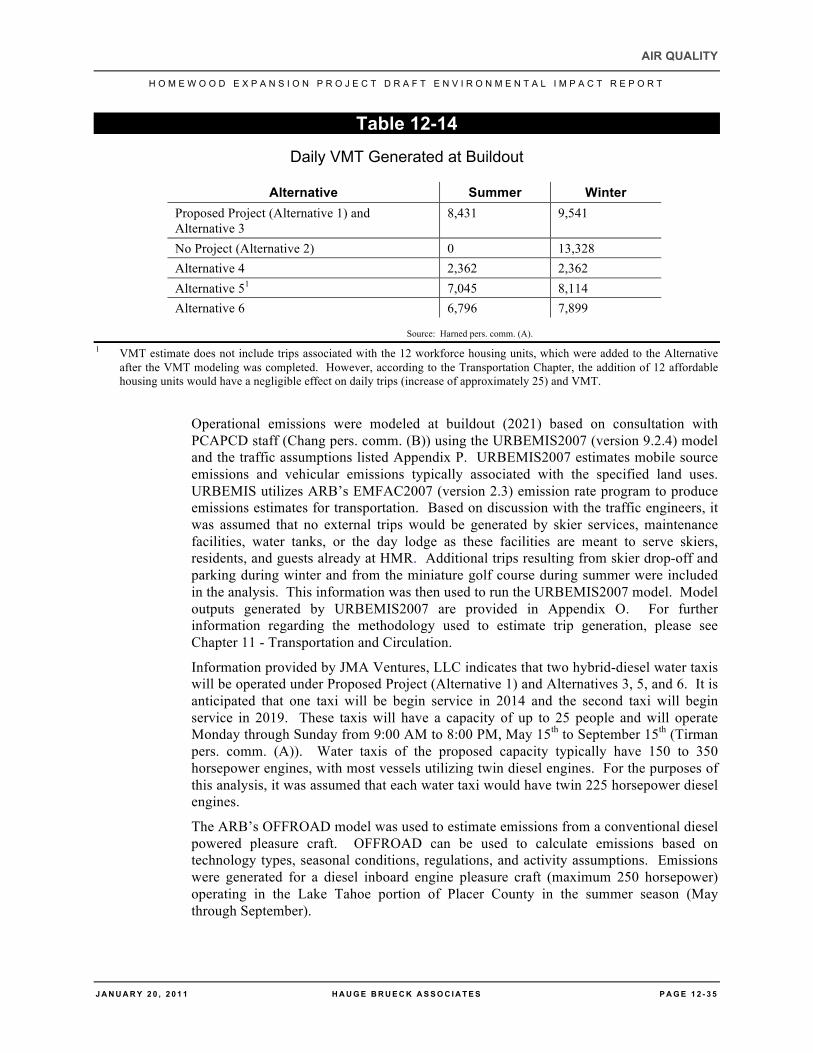
AIR QUALITY H O M E W O O D E X P A N S I O N P R O J E C T D R A F T E N V I R O N M E N T A L I M P A C T R E P O R T
J A N U A R Y 2 0 , 2 0 1 1 H A U G E B R U E C K A S S O C I A T E S P A G E 1 2 - 3 5
Table 12-14 Daily VMT Generated at Buildout
Alternative Summer Winter Proposed Project (Alternative 1) and Alternative 3
8,431 9,541
No Project (Alternative 2) 0 13,328 Alternative 4 2,362 2,362 Alternative 51 7,045 8,114 Alternative 6 6,796 7,899
Source: Harned pers. comm. (A). 1 VMT estimate does not include trips associated with the 12 workforce housing units, which were added to the Alternative
after the VMT modeling was completed. However, according to the Transportation Chapter, the addition of 12 affordable housing units would have a negligible effect on daily trips (increase of approximately 25) and VMT.
Operational emissions were modeled at buildout (2021) based on consultation with PCAPCD staff (Chang pers. comm. (B)) using the URBEMIS2007 (version 9.2.4) model and the traffic assumptions listed Appendix P. URBEMIS2007 estimates mobile source emissions and vehicular emissions typically associated with the specified land uses. URBEMIS utilizes ARB’s EMFAC2007 (version 2.3) emission rate program to produce emissions estimates for transportation. Based on discussion with the traffic engineers, it was assumed that no external trips would be generated by skier services, maintenance facilities, water tanks, or the day lodge as these facilities are meant to serve skiers, residents, and guests already at HMR. Additional trips resulting from skier drop-off and parking during winter and from the miniature golf course during summer were included in the analysis. This information was then used to run the URBEMIS2007 model. Model outputs generated by URBEMIS2007 are provided in Appendix O. For further information regarding the methodology used to estimate trip generation, please see Chapter 11 - Transportation and Circulation.
Information provided by JMA Ventures, LLC indicates that two hybrid-diesel water taxis will be operated under Proposed Project (Alternative 1) and Alternatives 3, 5, and 6. It is anticipated that one taxi will be begin service in 2014 and the second taxi will begin service in 2019. These taxis will have a capacity of up to 25 people and will operate Monday through Sunday from 9:00 AM to 8:00 PM, May 15th to September 15th (Tirman pers. comm. (A)). Water taxis of the proposed capacity typically have 150 to 350 horsepower engines, with most vessels utilizing twin diesel engines. For the purposes of this analysis, it was assumed that each water taxi would have twin 225 horsepower diesel engines.
The ARB’s OFFROAD model was used to estimate emissions from a conventional diesel powered pleasure craft. OFFROAD can be used to calculate emissions based on technology types, seasonal conditions, regulations, and activity assumptions. Emissions were generated for a diesel inboard engine pleasure craft (maximum 250 horsepower) operating in the Lake Tahoe portion of Placer County in the summer season (May through September).
AIR QUALITY H O M E W O O D M O U N T A I N R E S O R T S K I A R E A M A S T E R P L A N E I R / E I S
P A G E 1 2 - 3 6 H A U G E B R U E C K A S S O C I A T E S J A N U A R Y 2 0 , 2 0 1 1
The following equation was used to calculate emission factors for each criteria pollutant based on the OFFROAD emissions outputs. The resulting emission factors were then multiplied by the horsepower-hour for the water taxi (12 hours X 450 horsepower).
Emission factor = (tons/day) X (1/population) X (2,000 pounds/ton) X (1/horsepower) X (load factor). Where: Tons/day = OFFROAD output for each criteria pollutant in tons per day; Population = OFFROAD output for population; Horsepower = 250 horsepower (maximum horsepower calculated by OFFROAD); Load factor= 0.35 (OFFROAD default).
Hybrid water craft can have 70 to 80% fuel savings compared to typical diesel engines. It was therefore assumed that the hybrid water taxis would burn 70% less fuel than a diesel vessel, resulting in 70% fewer emissions. Emission estimates calculated using the above equation were therefore multiplied by 30% to account for a 70% reduction in emissions. Emissions calculations are presented in Appendix Q. Implementation of the Project may also increase use of recreational watercraft, such as jet skis and boats. Because use of these crafts is driven by several external factors (e.g. population, pricing, season), it is currently unknown by what factor watercraft usage will increase as a result of the Project. Consequently, this report does not quantity potential emissions associated with recreational watercraft because such analysis would be speculative. However, based on the emissions associated with the hybrid water taxi (Tables 12-16 through 12-19), potential emissions generated by these watercraft are likely to be small and not result in exceedences of the PCAPCD or TRPA thresholds.
Area Source Emissions
At the Project site, area sources include emissions from residential natural gas combustion for heating; landscaping activities; consumer products (i.e. household cleaners, personal care products); periodic paint emissions from facility maintenance; and back-up diesel generators for the chairlifts. As discussed in the project description, the two wood stoves currently operating at HMR would be removed under the Proposed Project (Alternative 1) and Alternatives 3, 5, and 6. Emissions from these area sources were estimated for buildout conditions (2021) based on consultation with PCAPCD staff (Chang pers. comm. (B)) using a variety of methods are described in this section.
Beaudin Ganze Inc. analyzed natural gas consumption from the Proposed Project (Alternative 1) at buildout to be approximately 1,604,000 therms per year (Beaudin Ganze 2007). Given the similar land uses, it was assumed that Alternatives 3, 5, and 6 would have a similar consumption rate (Tirman pers. comm. (B)).
Emissions from natural gas consumption was calculated using URBEMIS2007 default emission factors and land use assumptions summarized in the Beaudin Ganze energy report (Beaudin Ganze 2007). The URBEMIS2007 emission factors for NOX and CO are categorized into residential and non-residential land uses. To calculate a weighted emission factor for NOX and CO, assumptions provided by Beaudin Ganze regarding the number and square footage of each dwelling unit and hotel room were scaled to match the land use assumptions presented in Table 12-8. The default URBEMIS2007 natural gas usage rates for each land use type were then used to calculate percentage of natural gas consumption for each land use. These values were then used to calculate the weighted emission factor for NOX and CO, which was multiplied by the anticipated natural gas consumption estimates summarized above. Emission factors for other criteria
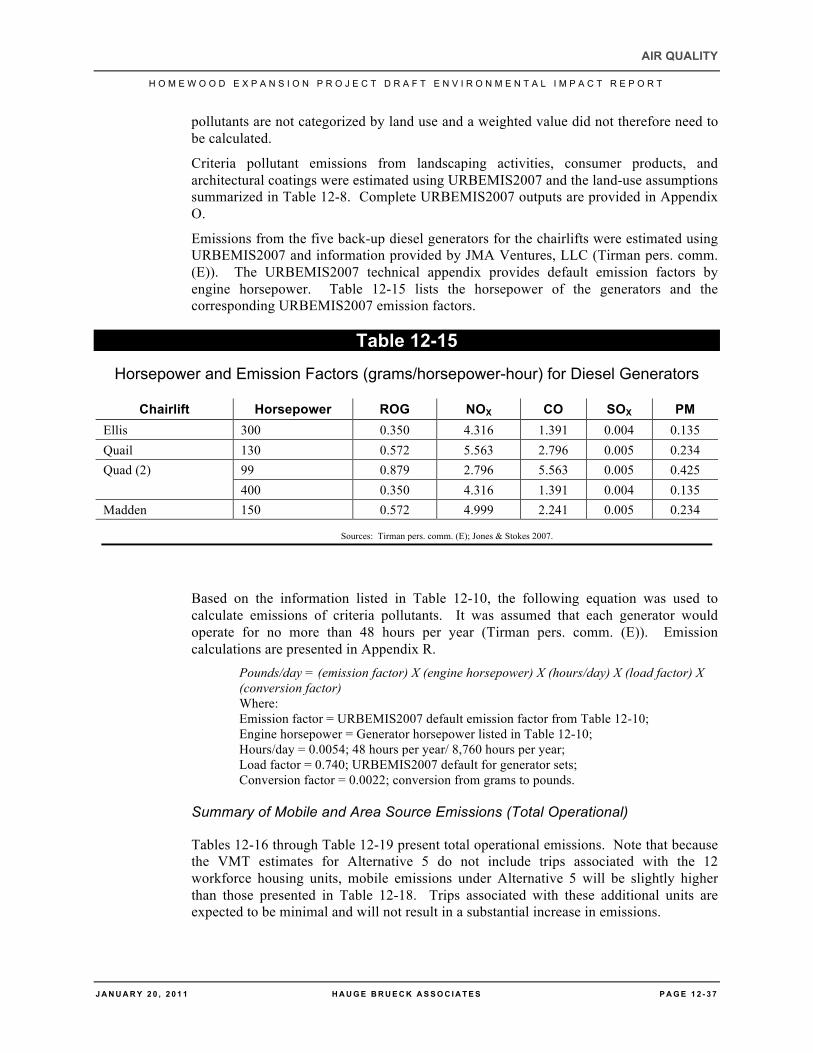
AIR QUALITY H O M E W O O D E X P A N S I O N P R O J E C T D R A F T E N V I R O N M E N T A L I M P A C T R E P O R T
J A N U A R Y 2 0 , 2 0 1 1 H A U G E B R U E C K A S S O C I A T E S P A G E 1 2 - 3 7
pollutants are not categorized by land use and a weighted value did not therefore need to be calculated.
Criteria pollutant emissions from landscaping activities, consumer products, and architectural coatings were estimated using URBEMIS2007 and the land-use assumptions summarized in Table 12-8. Complete URBEMIS2007 outputs are provided in Appendix O.
Emissions from the five back-up diesel generators for the chairlifts were estimated using URBEMIS2007 and information provided by JMA Ventures, LLC (Tirman pers. comm. (E)). The URBEMIS2007 technical appendix provides default emission factors by engine horsepower. Table 12-15 lists the horsepower of the generators and the corresponding URBEMIS2007 emission factors.
Table 12-15 Horsepower and Emission Factors (grams/horsepower-hour) for Diesel Generators
Chairlift Horsepower ROG NOX CO SOX PM Ellis 300 0.350 4.316 1.391 0.004 0.135 Quail 130 0.572 5.563 2.796 0.005 0.234 Quad (2) 99 0.879 2.796 5.563 0.005 0.425
400 0.350 4.316 1.391 0.004 0.135 Madden 150 0.572 4.999 2.241 0.005 0.234
Sources: Tirman pers. comm. (E); Jones & Stokes 2007.
Based on the information listed in Table 12-10, the following equation was used to calculate emissions of criteria pollutants. It was assumed that each generator would operate for no more than 48 hours per year (Tirman pers. comm. (E)). Emission calculations are presented in Appendix R.
Pounds/day = (emission factor) X (engine horsepower) X (hours/day) X (load factor) X (conversion factor) Where: Emission factor = URBEMIS2007 default emission factor from Table 12-10; Engine horsepower = Generator horsepower listed in Table 12-10; Hours/day = 0.0054; 48 hours per year/ 8,760 hours per year; Load factor = 0.740; URBEMIS2007 default for generator sets; Conversion factor = 0.0022; conversion from grams to pounds.
Summary of Mobile and Area Source Emissions (Total Operational)
Tables 12-16 through Table 12-19 present total operational emissions. Note that because the VMT estimates for Alternative 5 do not include trips associated with the 12 workforce housing units, mobile emissions under Alternative 5 will be slightly higher than those presented in Table 12-18. Trips associated with these additional units are expected to be minimal and will not result in a substantial increase in emissions.
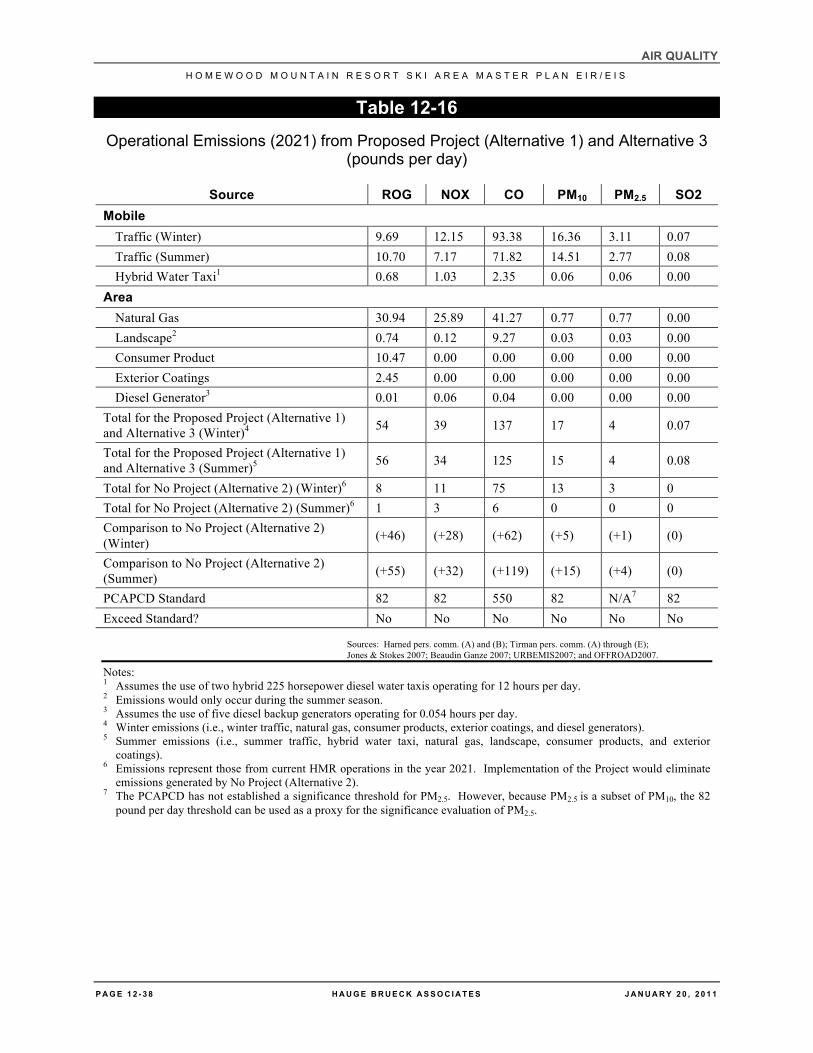
AIR QUALITY H O M E W O O D M O U N T A I N R E S O R T S K I A R E A M A S T E R P L A N E I R / E I S
P A G E 1 2 - 3 8 H A U G E B R U E C K A S S O C I A T E S J A N U A R Y 2 0 , 2 0 1 1
Table 12-16 Operational Emissions (2021) from Proposed Project (Alternative 1) and Alternative 3
(pounds per day)
Source ROG NOX CO PM10 PM2.5 SO2 Mobile
Traffic (Winter) 9.69 12.15 93.38 16.36 3.11 0.07 Traffic (Summer) 10.70 7.17 71.82 14.51 2.77 0.08 Hybrid Water Taxi1 0.68 1.03 2.35 0.06 0.06 0.00
Area Natural Gas 30.94 25.89 41.27 0.77 0.77 0.00 Landscape2 0.74 0.12 9.27 0.03 0.03 0.00 Consumer Product 10.47 0.00 0.00 0.00 0.00 0.00 Exterior Coatings 2.45 0.00 0.00 0.00 0.00 0.00 Diesel Generator3 0.01 0.06 0.04 0.00 0.00 0.00
Total for the Proposed Project (Alternative 1) and Alternative 3 (Winter)4 54 39 137 17 4 0.07
Total for the Proposed Project (Alternative 1) and Alternative 3 (Summer)5 56 34 125 15 4 0.08
Total for No Project (Alternative 2) (Winter)6 8 11 75 13 3 0 Total for No Project (Alternative 2) (Summer)6 1 3 6 0 0 0 Comparison to No Project (Alternative 2) (Winter) (+46) (+28) (+62) (+5) (+1) (0)
Comparison to No Project (Alternative 2) (Summer) (+55) (+32) (+119) (+15) (+4) (0)
PCAPCD Standard 82 82 550 82 N/A7 82 Exceed Standard? No No No No No No
Sources: Harned pers. comm. (A) and (B); Tirman pers. comm. (A) through (E); Jones & Stokes 2007; Beaudin Ganze 2007; URBEMIS2007; and OFFROAD2007.
Notes: 1 Assumes the use of two hybrid 225 horsepower diesel water taxis operating for 12 hours per day. 2 Emissions would only occur during the summer season. 3 Assumes the use of five diesel backup generators operating for 0.054 hours per day. 4 Winter emissions (i.e., winter traffic, natural gas, consumer products, exterior coatings, and diesel generators). 5 Summer emissions (i.e., summer traffic, hybrid water taxi, natural gas, landscape, consumer products, and exterior
coatings). 6 Emissions represent those from current HMR operations in the year 2021. Implementation of the Project would eliminate
emissions generated by No Project (Alternative 2). 7 The PCAPCD has not established a significance threshold for PM2.5. However, because PM2.5 is a subset of PM10, the 82
pound per day threshold can be used as a proxy for the significance evaluation of PM2.5.
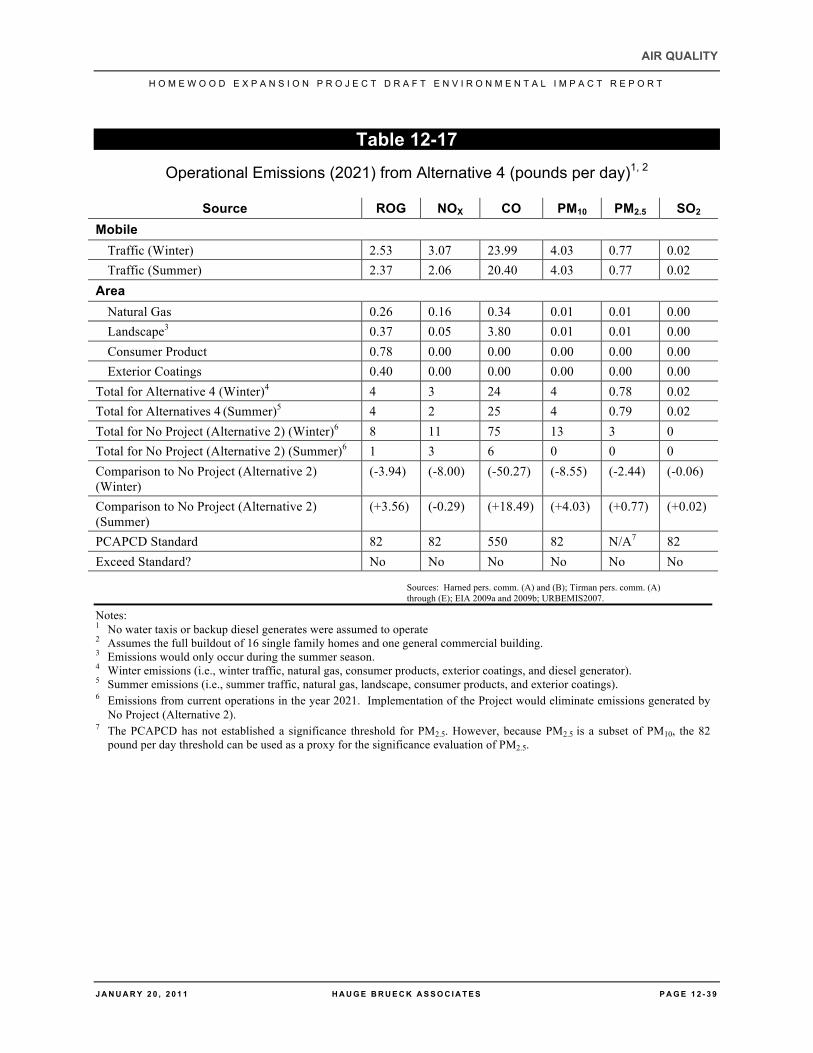
AIR QUALITY H O M E W O O D E X P A N S I O N P R O J E C T D R A F T E N V I R O N M E N T A L I M P A C T R E P O R T
J A N U A R Y 2 0 , 2 0 1 1 H A U G E B R U E C K A S S O C I A T E S P A G E 1 2 - 3 9
Table 12-17 Operational Emissions (2021) from Alternative 4 (pounds per day)1, 2
Source ROG NOX CO PM10 PM2.5 SO2 Mobile
Traffic (Winter) 2.53 3.07 23.99 4.03 0.77 0.02 Traffic (Summer) 2.37 2.06 20.40 4.03 0.77 0.02
Area Natural Gas 0.26 0.16 0.34 0.01 0.01 0.00 Landscape3 0.37 0.05 3.80 0.01 0.01 0.00 Consumer Product 0.78 0.00 0.00 0.00 0.00 0.00 Exterior Coatings 0.40 0.00 0.00 0.00 0.00 0.00
Total for Alternative 4 (Winter)4 4 3 24 4 0.78 0.02 Total for Alternatives 4 (Summer)5 4 2 25 4 0.79 0.02 Total for No Project (Alternative 2) (Winter)6 8 11 75 13 3 0 Total for No Project (Alternative 2) (Summer)6 1 3 6 0 0 0 Comparison to No Project (Alternative 2) (Winter)
(-3.94) (-8.00) (-50.27) (-8.55) (-2.44) (-0.06)
Comparison to No Project (Alternative 2) (Summer)
(+3.56) (-0.29) (+18.49) (+4.03) (+0.77) (+0.02)
PCAPCD Standard 82 82 550 82 N/A7 82 Exceed Standard? No No No No No No
Sources: Harned pers. comm. (A) and (B); Tirman pers. comm. (A) through (E); EIA 2009a and 2009b; URBEMIS2007.
Notes: 1 No water taxis or backup diesel generates were assumed to operate 2 Assumes the full buildout of 16 single family homes and one general commercial building. 3 Emissions would only occur during the summer season. 4 Winter emissions (i.e., winter traffic, natural gas, consumer products, exterior coatings, and diesel generator). 5 Summer emissions (i.e., summer traffic, natural gas, landscape, consumer products, and exterior coatings). 6 Emissions from current operations in the year 2021. Implementation of the Project would eliminate emissions generated by
No Project (Alternative 2). 7 The PCAPCD has not established a significance threshold for PM2.5. However, because PM2.5 is a subset of PM10, the 82
pound per day threshold can be used as a proxy for the significance evaluation of PM2.5.
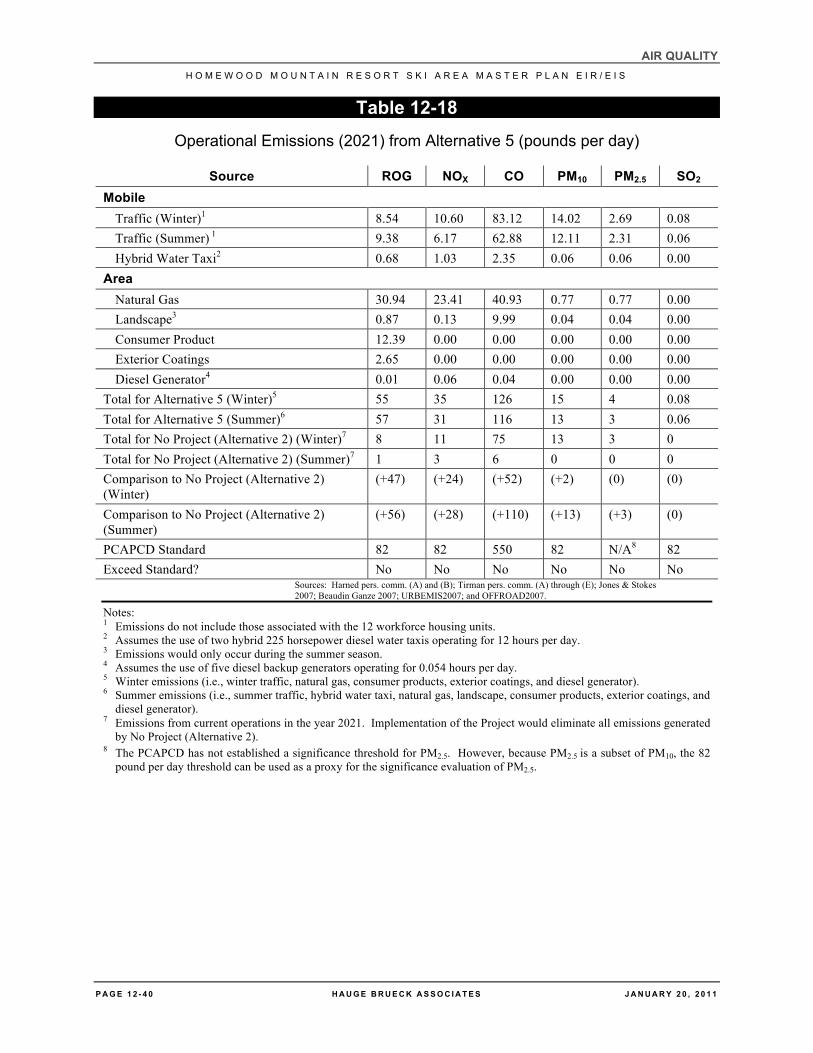
AIR QUALITY H O M E W O O D M O U N T A I N R E S O R T S K I A R E A M A S T E R P L A N E I R / E I S
P A G E 1 2 - 4 0 H A U G E B R U E C K A S S O C I A T E S J A N U A R Y 2 0 , 2 0 1 1
Table 12-18 Operational Emissions (2021) from Alternative 5 (pounds per day)
Source ROG NOX CO PM10 PM2.5 SO2 Mobile
Traffic (Winter)1 8.54 10.60 83.12 14.02 2.69 0.08 Traffic (Summer) 1 9.38 6.17 62.88 12.11 2.31 0.06 Hybrid Water Taxi2 0.68 1.03 2.35 0.06 0.06 0.00
Area Natural Gas 30.94 23.41 40.93 0.77 0.77 0.00 Landscape3 0.87 0.13 9.99 0.04 0.04 0.00 Consumer Product 12.39 0.00 0.00 0.00 0.00 0.00 Exterior Coatings 2.65 0.00 0.00 0.00 0.00 0.00 Diesel Generator4 0.01 0.06 0.04 0.00 0.00 0.00
Total for Alternative 5 (Winter)5 55 35 126 15 4 0.08 Total for Alternative 5 (Summer)6 57 31 116 13 3 0.06 Total for No Project (Alternative 2) (Winter)7 8 11 75 13 3 0 Total for No Project (Alternative 2) (Summer)7 1 3 6 0 0 0 Comparison to No Project (Alternative 2) (Winter)
(+47) (+24) (+52) (+2) (0) (0)
Comparison to No Project (Alternative 2) (Summer)
(+56) (+28) (+110) (+13) (+3) (0)
PCAPCD Standard 82 82 550 82 N/A8 82 Exceed Standard? No No No No No No
Sources: Harned pers. comm. (A) and (B); Tirman pers. comm. (A) through (E); Jones & Stokes 2007; Beaudin Ganze 2007; URBEMIS2007; and OFFROAD2007.
Notes: 1 Emissions do not include those associated with the 12 workforce housing units. 2 Assumes the use of two hybrid 225 horsepower diesel water taxis operating for 12 hours per day. 3 Emissions would only occur during the summer season. 4 Assumes the use of five diesel backup generators operating for 0.054 hours per day. 5 Winter emissions (i.e., winter traffic, natural gas, consumer products, exterior coatings, and diesel generator). 6 Summer emissions (i.e., summer traffic, hybrid water taxi, natural gas, landscape, consumer products, exterior coatings, and
diesel generator). 7 Emissions from current operations in the year 2021. Implementation of the Project would eliminate all emissions generated
by No Project (Alternative 2). 8 The PCAPCD has not established a significance threshold for PM2.5. However, because PM2.5 is a subset of PM10, the 82
pound per day threshold can be used as a proxy for the significance evaluation of PM2.5.
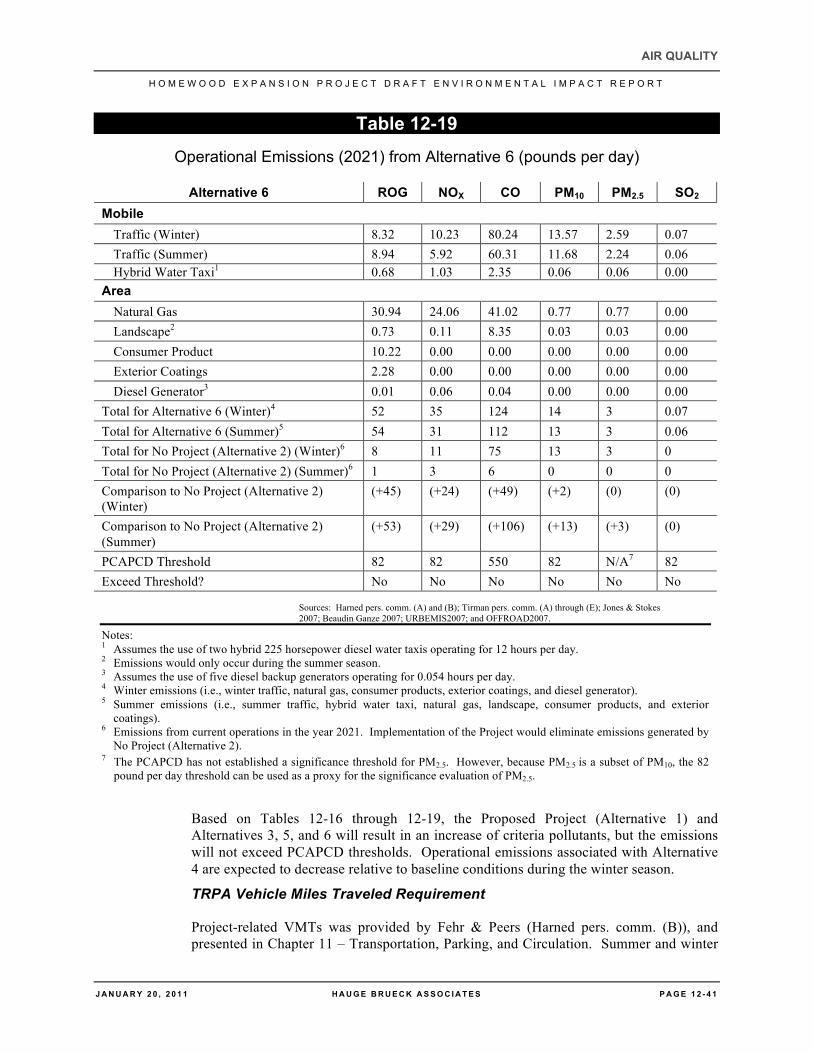
AIR QUALITY H O M E W O O D E X P A N S I O N P R O J E C T D R A F T E N V I R O N M E N T A L I M P A C T R E P O R T
J A N U A R Y 2 0 , 2 0 1 1 H A U G E B R U E C K A S S O C I A T E S P A G E 1 2 - 4 1
Table 12-19 Operational Emissions (2021) from Alternative 6 (pounds per day)
Alternative 6 ROG NOX CO PM10 PM2.5 SO2 Mobile
Traffic (Winter) 8.32 10.23 80.24 13.57 2.59 0.07 Traffic (Summer) 8.94 5.92 60.31 11.68 2.24 0.06 Hybrid Water Taxi1 0.68 1.03 2.35 0.06 0.06 0.00
Area Natural Gas 30.94 24.06 41.02 0.77 0.77 0.00 Landscape2 0.73 0.11 8.35 0.03 0.03 0.00 Consumer Product 10.22 0.00 0.00 0.00 0.00 0.00 Exterior Coatings 2.28 0.00 0.00 0.00 0.00 0.00 Diesel Generator3 0.01 0.06 0.04 0.00 0.00 0.00
Total for Alternative 6 (Winter)4 52 35 124 14 3 0.07 Total for Alternative 6 (Summer)5 54 31 112 13 3 0.06 Total for No Project (Alternative 2) (Winter)6 8 11 75 13 3 0 Total for No Project (Alternative 2) (Summer)6 1 3 6 0 0 0 Comparison to No Project (Alternative 2) (Winter)
(+45) (+24) (+49) (+2) (0) (0)
Comparison to No Project (Alternative 2) (Summer)
(+53) (+29) (+106) (+13) (+3) (0)
PCAPCD Threshold 82 82 550 82 N/A7 82 Exceed Threshold? No No No No No No
Sources: Harned pers. comm. (A) and (B); Tirman pers. comm. (A) through (E); Jones & Stokes 2007; Beaudin Ganze 2007; URBEMIS2007; and OFFROAD2007.
Notes: 1 Assumes the use of two hybrid 225 horsepower diesel water taxis operating for 12 hours per day. 2 Emissions would only occur during the summer season. 3 Assumes the use of five diesel backup generators operating for 0.054 hours per day. 4 Winter emissions (i.e., winter traffic, natural gas, consumer products, exterior coatings, and diesel generator). 5 Summer emissions (i.e., summer traffic, hybrid water taxi, natural gas, landscape, consumer products, and exterior
coatings). 6 Emissions from current operations in the year 2021. Implementation of the Project would eliminate emissions generated by
No Project (Alternative 2). 7 The PCAPCD has not established a significance threshold for PM2.5. However, because PM2.5 is a subset of PM10, the 82
pound per day threshold can be used as a proxy for the significance evaluation of PM2.5.
Based on Tables 12-16 through 12-19, the Proposed Project (Alternative 1) and Alternatives 3, 5, and 6 will result in an increase of criteria pollutants, but the emissions will not exceed PCAPCD thresholds. Operational emissions associated with Alternative 4 are expected to decrease relative to baseline conditions during the winter season.
TRPA Vehicle Miles Traveled Requirement
Project-related VMTs was provided by Fehr & Peers (Harned pers. comm. (B)), and presented in Chapter 11 – Transportation, Parking, and Circulation. Summer and winter
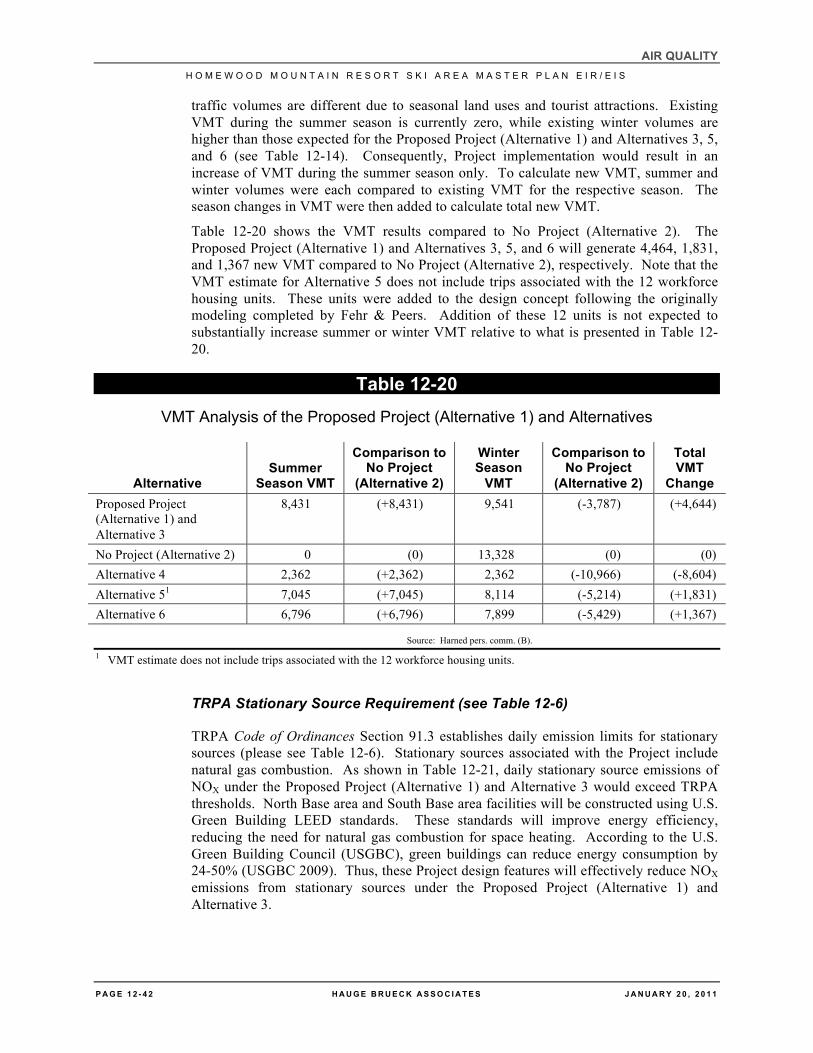
AIR QUALITY H O M E W O O D M O U N T A I N R E S O R T S K I A R E A M A S T E R P L A N E I R / E I S
P A G E 1 2 - 4 2 H A U G E B R U E C K A S S O C I A T E S J A N U A R Y 2 0 , 2 0 1 1
traffic volumes are different due to seasonal land uses and tourist attractions. Existing VMT during the summer season is currently zero, while existing winter volumes are higher than those expected for the Proposed Project (Alternative 1) and Alternatives 3, 5, and 6 (see Table 12-14). Consequently, Project implementation would result in an increase of VMT during the summer season only. To calculate new VMT, summer and winter volumes were each compared to existing VMT for the respective season. The season changes in VMT were then added to calculate total new VMT.
Table 12-20 shows the VMT results compared to No Project (Alternative 2). The Proposed Project (Alternative 1) and Alternatives 3, 5, and 6 will generate 4,464, 1,831, and 1,367 new VMT compared to No Project (Alternative 2), respectively. Note that the VMT estimate for Alternative 5 does not include trips associated with the 12 workforce housing units. These units were added to the design concept following the originally modeling completed by Fehr & Peers. Addition of these 12 units is not expected to substantially increase summer or winter VMT relative to what is presented in Table 12-20.
Table 12-20 VMT Analysis of the Proposed Project (Alternative 1) and Alternatives
Alternative Summer
Season VMT
Comparison to No Project
(Alternative 2)
Winter Season
VMT
Comparison to No Project
(Alternative 2)
Total VMT
Change Proposed Project (Alternative 1) and Alternative 3
8,431 (+8,431) 9,541 (-3,787) (+4,644)
No Project (Alternative 2) 0 (0) 13,328 (0) (0) Alternative 4 2,362 (+2,362) 2,362 (-10,966) (-8,604) Alternative 51 7,045 (+7,045) 8,114 (-5,214) (+1,831) Alternative 6 6,796 (+6,796) 7,899 (-5,429) (+1,367)
Source: Harned pers. comm. (B). 1 VMT estimate does not include trips associated with the 12 workforce housing units.
TRPA Stationary Source Requirement (see Table 12-6)
TRPA Code of Ordinances Section 91.3 establishes daily emission limits for stationary sources (please see Table 12-6). Stationary sources associated with the Project include natural gas combustion. As shown in Table 12-21, daily stationary source emissions of NOX under the Proposed Project (Alternative 1) and Alternative 3 would exceed TRPA thresholds. North Base area and South Base area facilities will be constructed using U.S. Green Building LEED standards. These standards will improve energy efficiency, reducing the need for natural gas combustion for space heating. According to the U.S. Green Building Council (USGBC), green buildings can reduce energy consumption by 24-50% (USGBC 2009). Thus, these Project design features will effectively reduce NOX emissions from stationary sources under the Proposed Project (Alternative 1) and Alternative 3.
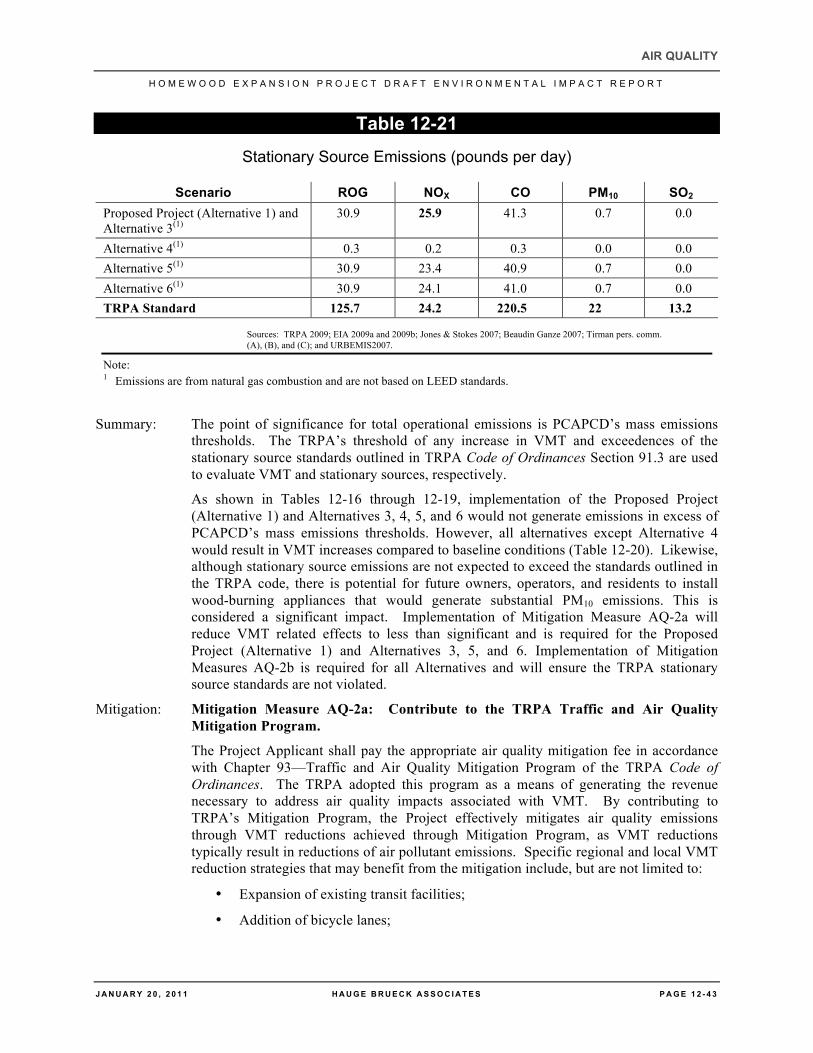
AIR QUALITY H O M E W O O D E X P A N S I O N P R O J E C T D R A F T E N V I R O N M E N T A L I M P A C T R E P O R T
J A N U A R Y 2 0 , 2 0 1 1 H A U G E B R U E C K A S S O C I A T E S P A G E 1 2 - 4 3
Table 12-21 Stationary Source Emissions (pounds per day)
Scenario ROG NOX CO PM10 SO2 Proposed Project (Alternative 1) and Alternative 3(1)
30.9 25.9 41.3 0.7 0.0
Alternative 4(1) 0.3 0.2 0.3 0.0 0.0 Alternative 5(1) 30.9 23.4 40.9 0.7 0.0 Alternative 6(1) 30.9 24.1 41.0 0.7 0.0 TRPA Standard 125.7 24.2 220.5 22 13.2
Sources: TRPA 2009; EIA 2009a and 2009b; Jones & Stokes 2007; Beaudin Ganze 2007; Tirman pers. comm. (A), (B), and (C); and URBEMIS2007.
Note: 1 Emissions are from natural gas combustion and are not based on LEED standards.
Summary: The point of significance for total operational emissions is PCAPCD’s mass emissions thresholds. The TRPA’s threshold of any increase in VMT and exceedences of the stationary source standards outlined in TRPA Code of Ordinances Section 91.3 are used to evaluate VMT and stationary sources, respectively.
As shown in Tables 12-16 through 12-19, implementation of the Proposed Project (Alternative 1) and Alternatives 3, 4, 5, and 6 would not generate emissions in excess of PCAPCD’s mass emissions thresholds. However, all alternatives except Alternative 4 would result in VMT increases compared to baseline conditions (Table 12-20). Likewise, although stationary source emissions are not expected to exceed the standards outlined in the TRPA code, there is potential for future owners, operators, and residents to install wood-burning appliances that would generate substantial PM10 emissions. This is considered a significant impact. Implementation of Mitigation Measure AQ-2a will reduce VMT related effects to less than significant and is required for the Proposed Project (Alternative 1) and Alternatives 3, 5, and 6. Implementation of Mitigation Measures AQ-2b is required for all Alternatives and will ensure the TRPA stationary source standards are not violated.
Mitigation: Mitigation Measure AQ-2a: Contribute to the TRPA Traffic and Air Quality Mitigation Program.
The Project Applicant shall pay the appropriate air quality mitigation fee in accordance with Chapter 93—Traffic and Air Quality Mitigation Program of the TRPA Code of Ordinances. The TRPA adopted this program as a means of generating the revenue necessary to address air quality impacts associated with VMT. By contributing to TRPA’s Mitigation Program, the Project effectively mitigates air quality emissions through VMT reductions achieved through Mitigation Program, as VMT reductions typically result in reductions of air pollutant emissions. Specific regional and local VMT reduction strategies that may benefit from the mitigation include, but are not limited to:
• Expansion of existing transit facilities;
• Addition of bicycle lanes;
AIR QUALITY H O M E W O O D M O U N T A I N R E S O R T S K I A R E A M A S T E R P L A N E I R / E I S
P A G E 1 2 - 4 4 H A U G E B R U E C K A S S O C I A T E S J A N U A R Y 2 0 , 2 0 1 1
• Transportation Systems Management measures such as bicycle facilities, pedestrian facilities, and use of alternative fuels in fleet vehicles; and
• Provision of connectivity between multi-use paths for bicycles and pedestrians.
Mitigation: Mitigation Measure AQ-2b: Prohibit Installation of Wood-Burning Appliances.
There are no new wood-burning appliances included in the Proposed Project (Alternative 1) or Alternatives 3, 4, 5, or 6. There is potential, however, for future owners, operators, and residents to install wood-burning appliances. However, no new wood burning appliances defined in District Rule 225 Wood-Burning Appliances shall be allowed in any residential or non-residential structures within the boundaries of the project. A standard note indicating this restriction shall be included on all building plans approved in association with this project.
After Mitigation: Less than Significant Impact; Proposed Project (Alternative 1) and Alts 3, 4, 5, and 6
Implementation of mitigation measure AQ-2a will reduce impacts associated with the Proposed Project (Alternative 1) and Alternatives 3, 5, and 6 to a less than significant level by providing the necessary funding to offset the project’s contribution to long-term criteria pollutant emissions resulting from increased traffic.
Implementation of mitigation measure AQ-2b will reduce potential impacts associated with the future owners, operators, or residents installing wood-burning appliances under the Proposed Project (Alternative 1) and Alternatives 3, 4, 5, and 6 to a less than significant level.
Impact: AQ-3. Will the Project Expose Sensitive Receptors to Substantial Pollutant Concentrations?
Analysis: Less than Significant Impact; Proposed Project (Alternative 1) and Alts 2, 3, 4, 5, and 6
PCAPCD Requirement
On-Road Carbon Monoxide
Localized increases in CO concentrations from vehicle congestion at intersections affected by development were modeled using the Caltrans CALINE4 line source dispersion model (Benson 1989). CALINE4 is a Gaussian dispersion model specifically designed to evaluate air quality impacts of roadway projects. Each roadway segment analyzed in the model is treated as a sequence of “links.” CALINE4 uses worst-case meteorological data to predict a concentration that would never be exceeded, thus producing a conservative estimate of a project’s potential effects. CO emissions and temperature are inversely related, so a winter low temperature and the highest peak-hour traffic counts were modeled to estimate the worst-case CO concentrations for the action.
Traffic volumes and operating conditions used in the modeling were obtained from the traffic analysis prepared by Fehr & Peers (Harned pers. comm. (D); Harned pers. comm. (E)). Ambient CO concentrations near the roadway for existing (2008) and future year (2030) Project conditions were modeled using CALINE4. The PM peak-hour traffic was modeled as the traffic data indicated that LOS and delays would be worse in the PM peak-hour than in the AM peak hour. The data included traffic volumes in the surrounding area, so traffic is highest during the summer season (Harned pers. comm. (C); Harned pers. comm. (D)). Consequently, the summer traffic volumes were modeled
AIR QUALITY H O M E W O O D E X P A N S I O N P R O J E C T D R A F T E N V I R O N M E N T A L I M P A C T R E P O R T
J A N U A R Y 2 0 , 2 0 1 1 H A U G E B R U E C K A S S O C I A T E S P A G E 1 2 - 4 5
along with winter temperatures to represent a worst-case scenario (see section “CALINE4”). CO modeling was conducted at the SR 89/SR 28 and SR 89/Granlibakken Road intersections, which have the greatest traffic volumes and worst LOS/delay.
Vehicle emission rates were determined using the ARB’s EMFAC2007 emission rate program. Free-flow traffic speeds were adjusted to a speed of 1.0 mph to represent a worst-case scenario. EMFAC2007 modeling procedures followed the guidelines recommended by Caltrans (California Department of Transportation 2003). The program assumed LTAB regional traffic data operating during the winter months. A winter temperature of 20° F and humidity of 30% were assumed.
CO concentrations were estimated at four receptor locations located at each intersection for a total of eight receptors. The receptors were placed 100 feet from the center of intersection diagonals, and 71 feet from roadway centerlines at the boundary of the mixing zone (142 feet from each other) to represent a worst-case scenario. Receptor heights were set at 5.9 feet.
Meteorological inputs to the CALINE4 model were determined using methodology recommended in CALINE4 Users Guide (Sonoma Technology and California Department of Transportation 1998). The meteorological conditions used represent a calm winter period. The worst-case wind angles option was used to determine a worst-case concentration for each receptor. The meteorological inputs include: wind speed of 0.5 meter per second, ground-level temperature inversion (atmospheric stability class G), wind direction standard deviation equal to 30 degrees, ambient temperature of 25°F (-3.89° Celsius), altitude above sea level of 1,900 meters (6,235 feet), and a mixing height of 1,000 meters.
A background concentration of 0.9 parts per million was added to the modeled 1-hour values to account for sources of CO not included in the modeling. Eight-hour modeled values were calculated from the 1-hour values using a persistence factor of 0.6. A background concentration of 0.5 parts per million was added to the modeled 8-hour values. Background concentration data were taken from the monitoring data provided by the EPA’s Air Data webpage (US Environmental Protection Agency 2009b) for the Tahoe City (Site ID 060610007) monitoring station. The Tahoe City monitoring station was installed as part of a short-term air quality study led by the ARB. The station is located approximately eight miles from the Project. Concentrations represent those in the year 2004 as this was the most recent year for CO monitoring at the station. Actual 1- and 8-hour background concentrations in future years would likely be lower than those used in the CO modeling analysis because the trend in CO emissions and concentrations is decreasing because of continuing improvements in engine technology and the retirement of older, higher-emitting vehicles.
Modeled CO concentrations plus background CO levels from the nearest monitoring station are presented in Table 12-22. CO concentrations would not exceed the federal or State 1- and 8-hour standards (PCAPCD).
AIR QUALITY H O M E W O O D M O U N T A I N R E S O R T S K I A R E A M A S T E R P L A N E I R / E I S
P A G E 1 2 - 4 6 H A U G E B R U E C K A S S O C I A T E S J A N U A R Y 2 0 , 2 0 1 1
Construction Related Diesel Particulate Matter
Diesel Particulate Matter (DPM) is a carcinogenic toxic air contaminate that will be emitted by heavy-duty equipment during construction. A number of site-specific factors, which are beyond the scope of this master plan evaluation, are required to calculate DPM concentrations caused by construction activity. For example, the specific construction schedule, location of operating construction equipment, and location of exposed sensitive receptors, are necessary to model pollutant dispersion and calculate relative DPM concentrations at receptor locations. In addition, information on the location of specific receptors is required to perform an HRA. Because a detailed construction schedule is currently unavailable, a quantitative analysis of health risks from construction is not possible.
The Office of Environmental Health Hazard Assessment (OEHHA) indicates that cancer health risks from DPM are typically associated with chronic exposure and recommends using a 70-year exposure period for the cancer risk analysis to represent a chronic exposure scenario. As discussed above, construction is anticipated to take a maximum of ten years. This is well below the recommended 70-year analysis period. Moreover, construction-related DPM emissions will be spread between the north and south bases, rather than concentrated in one location. Tourists visiting the HMR during construction will also be transient and only exposed to elevated DPM during their visit. The first condos constructed at the resort will be completed in December of 2016. Assuming these dwellings will be occupied immediately after construction, the potential exposure period of new residents to construction-related DPM would be no more than four years. It is therefore unlikely that construction activities will result in elevated health risks. In addition, Mitigation Measure AQ-1 will help to minimize concentrations of DPM at nearby sensitive receptors.
TRPA Requirement
As shown in Table 12-22, emissions of CO would not result in an increase in CO concentrations when compared to the existing conditions under future year conditions. Exposure of sensitive receptors to construction-related DPM is well below the 70 year recommended analysis period and is not anticipated to result in elevated health risks.
Summary: The point of significance for the exposure of sensitive receptors to CO concentrations is the TRPA threshold of any net increase in CO concentrations relative to existing conditions. The Proposed Project (Alternative 1) and Alternatives 2, 3, 4, 5, and 6 are not expected to result in increased CO concentrations. This impact is considered less than significant.
The evaluation of DPM is based on a qualitative assessment of the construction period and type of sensitive receptors. Based on the discussion above, construction is well below OEHHA 70-year analysis period. Moreover, the actual exposure period to sensitive receptors will be even shorter given the seasonal travel patterns and construction schedule for the new residential dwellings.
Mitigation: No mitigation is required.
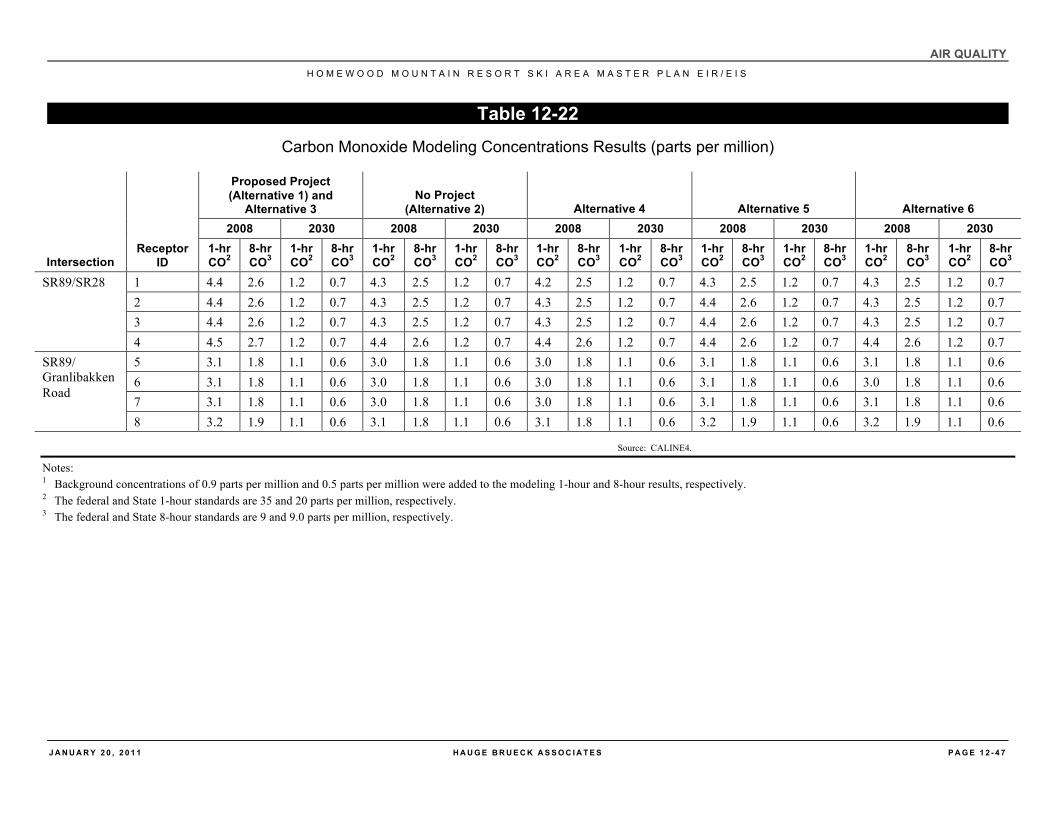
AIR QUALITY H O M E W O O D M O U N T A I N R E S O R T S K I A R E A M A S T E R P L A N E I R / E I S
J A N U A R Y 2 0 , 2 0 1 1 H A U G E B R U E C K A S S O C I A T E S P A G E 1 2 - 4 7
Table 12-22 Carbon Monoxide Modeling Concentrations Results (parts per million)
Intersection Receptor
ID
Proposed Project (Alternative 1) and
Alternative 3 No Project
(Alternative 2) Alternative 4 Alternative 5 Alternative 6 2008 2030 2008 2030 2008 2030 2008 2030 2008 2030
1-hr CO2
8-hr CO3
1-hr CO2
8-hr CO3
1-hr CO2
8-hr CO3
1-hr CO2
8-hr CO3
1-hr CO2
8-hr CO3
1-hr CO2
8-hr CO3
1-hr CO2
8-hr CO3
1-hr CO2
8-hr CO3
1-hr CO2
8-hr CO3
1-hr CO2
8-hr CO3
SR89/SR28 1 4.4 2.6 1.2 0.7 4.3 2.5 1.2 0.7 4.2 2.5 1.2 0.7 4.3 2.5 1.2 0.7 4.3 2.5 1.2 0.7 2 4.4 2.6 1.2 0.7 4.3 2.5 1.2 0.7 4.3 2.5 1.2 0.7 4.4 2.6 1.2 0.7 4.3 2.5 1.2 0.7 3 4.4 2.6 1.2 0.7 4.3 2.5 1.2 0.7 4.3 2.5 1.2 0.7 4.4 2.6 1.2 0.7 4.3 2.5 1.2 0.7 4 4.5 2.7 1.2 0.7 4.4 2.6 1.2 0.7 4.4 2.6 1.2 0.7 4.4 2.6 1.2 0.7 4.4 2.6 1.2 0.7
SR89/ Granlibakken Road
5 3.1 1.8 1.1 0.6 3.0 1.8 1.1 0.6 3.0 1.8 1.1 0.6 3.1 1.8 1.1 0.6 3.1 1.8 1.1 0.6 6 3.1 1.8 1.1 0.6 3.0 1.8 1.1 0.6 3.0 1.8 1.1 0.6 3.1 1.8 1.1 0.6 3.0 1.8 1.1 0.6 7 3.1 1.8 1.1 0.6 3.0 1.8 1.1 0.6 3.0 1.8 1.1 0.6 3.1 1.8 1.1 0.6 3.1 1.8 1.1 0.6 8 3.2 1.9 1.1 0.6 3.1 1.8 1.1 0.6 3.1 1.8 1.1 0.6 3.2 1.9 1.1 0.6 3.2 1.9 1.1 0.6
Source: CALINE4.
Notes: 1 Background concentrations of 0.9 parts per million and 0.5 parts per million were added to the modeling 1-hour and 8-hour results, respectively. 2 The federal and State 1-hour standards are 35 and 20 parts per million, respectively. 3 The federal and State 8-hour standards are 9 and 9.0 parts per million, respectively.
AIR QUALITY H O M E W O O D M O U N T A I N R E S O R T S K I A R E A M A S T E R P L A N E I R / E I S
P A G E 1 2 - 4 8 H A U G E B R U E C K A S S O C I A T E S J A N U A R Y 2 0 , 2 0 1 1
Impact: AQ-4. Will the Project Conflict with or Obstruction of Implementation of the Applicable Air Quality Plan?
Analysis: No Impact; No Project (Alternative 2).
The No Project (Alternative 2) will not change existing land uses, densities, the roadway network, population, or employment, and will not generate construction emissions. The No Project (Alternative 2) will therefore not conflict with or obstruct applicable air quality plans. There will be no impact and no further analysis is required.
Mitigation: No mitigation is required.
Analysis: Significant Impact; Proposed Project (Alternative 1) and Alternatives 3, 5, and 6
PCAPCD and TRPA Requirements
As discussed above, the ARB adopted a revised SIP for CO for the north and south shores of Lake Tahoe. The SIP demonstrates how these areas will continue to maintain compliance with the federal 8-hour CO standard. The TRPA adopted a Regional Plan to outline how the region will achieve and maintain air quality thresholds (see section 12.2.3).
A project is typically deemed inconsistent with air quality plans if it results in population and/or employment growth that exceeds growth estimates included in the applicable planning documents and therefore generates emissions not accounted for in the emissions budget. The Proposed Project (Alternative 1) and Alternative 3 would expand certain plan area uses beyond current TRPA and Placer County boundary lines and conflict with existing land use prescriptions. Boundary lines are established by the land use assumptions in the County General Plan and TRPA Code, so any boundary line violation could be inconsistent with the CO SIP and TRPA Regional Plan. An analysis of plan level-consistency was therefore conducted using the Project’s potential to violate the CAAQS and NAAQS.
Construction Emissions. Modeling presented in Impact AQ-1 indicates that the Proposed Project (Alternative 1) and Alternatives 3, 5, and 6 may result in construction emissions that exceed the CAAQS or NAAQS on days requiring sustainable construction equipment or activity. This is a significant impact.
Operational Emissions. The Proposed Project (Alternative 1) and Alternatives 3, 5, and 6 will increase VMTs (see Impact AQ-2), but will not violate CO standards, the pollutant of greatest concern in the LTAB (see impact AQ-3). The Project also incorporates traffic management strategies and LEED standards to reduce operation emissions. The Project Applicant will ensure HMR meets land use projections contained within TRPA and Placer County planning documents. Consequently, this impact is less than significant.
Mitigation: Mitigation Measure AQ-1: Implement PCAPCD Best Management Practices (BMPs) to reduce pollutant emissions during construction.
After Mitigation: Less than Significant Impact, Proposed Project (Alternative 1); Significant and
Unavoidable Impact, Alternatives 3, 5, and 6
Mitigation Measure AQ-1 will minimize construction related emissions generated by Alternative 1 to less than significant (see Impact AQ-1). Consequently, implementation of the Project will not conflict or obstruct with implementation of the applicable air quality plans, including the CO SIP and TRPA Regional Plan.
AIR QUALITY H O M E W O O D M O U N T A I N R E S O R T S K I A R E A M A S T E R P L A N E I R / E I S
J A N U A R Y 2 0 , 2 0 1 1 H A U G E B R U E C K A S S O C I A T E S P A G E 1 2 - 4 9
PM10 emissions generated by Alternatives 3, 5, and 6 will remain significant after implementation of Mitigation Measure AQ-1 (see Impact AQ-1). Therefore, construction of the project alternatives may conflict or obstruct with implementation of the applicable air quality plans, including the CO SIP and TRPA Regional Plan.
Analysis: Less Than Significant Impact; Alternative 4
Construction Emissions. Modeling presented in Impact AQ-1 indicates that the Alternative 4 will not result in construction emissions that exceed the CAAQS or NAAQS on days requiring sustainable construction equipment or activity. Therefore, Alternative 4 will not conflict with an air quality plan and this impact is less than significant.
Operational Emissions. Alternative 4 will not increase total VMTs (see Impact AQ-2), and will not violate CO standards, the pollutant of greatest concern in the LTAB (see impact AQ-3). Consequently, this impact is less than significant.
Mitigation: No mitigation is required.
Impact: AQ-5. Will the Project Generate Objectionable Odors?
Analysis: Less than Significant Impact; Proposed Project (Alternative 1) and No Project (Alternative 2), and Alternatives 3, 4, 5, and 6
PCAPCD and TRPA Requirements
The generation and severity of odors is dependent on a number of factors, including the nature, frequency, and intensity of the source; wind direction; and the location of the receptor(s). Odors rarely cause physical harm, but can cause discomfort, leading to complaints to regulatory agencies. Typical facilities known to produce odors include landfills, wastewater treatment plants, manufacturing plants, and certain agricultural activities.
The existing HMR is not known to include any major facilities that produce odors. According to the PCAPCD and the TRPA, there have been no odor complaints against HMR (Finnell pers. comm.; Emmett pers. comm.). Consequently, continuing operation is not anticipated to generate any objectionable odors that affect a substantial number of people.
Project implementation would not result in the addition of any major odor producing facilities. Since there have been no odor complaints against HMR, implementation of the Proposed Project (Alternative 1) and Alternatives 2, 3, 4, 5, and 6, which will not add new odor sources, is not anticipated to generate objectionable odors that affect a substantial number of people.
Diesel emissions from construction equipment and volatile organic compounds from paving activities may create odors during construction. These odors would be temporary and localized, and they would cease once construction activities have been completed. Thus, it is not anticipated that the operation or the construction of the Proposed Project (Alternative 1) and Alternatives 2 (No Project), 3, 4, 5, and 6 would result in odor complaints. This impact is considered less than significant.
Mitigation: No mitigation is required.
AIR QUALITY H O M E W O O D M O U N T A I N R E S O R T S K I A R E A M A S T E R P L A N E I R / E I S
P A G E 1 2 - 5 0 H A U G E B R U E C K A S S O C I A T E S J A N U A R Y 2 0 , 2 0 1 1
12.5 CUMULATIVE IMPACTS AND MITIGATION MEASURES
Impact: AQ-C1. Would the Project Result in a Cumulative Short-Term Impact on Air Quality?
Analysis: No Impact; No Project (Alternative 2).
There would be no construction under No Project (Alternative 2). Therefore, there will be no impacts. No further analysis is required.
Mitigation: No mitigation is required.
Analysis: Significant Impact, Proposed Project (Alternative 1) and Alternatives 3, 5, and 6
As discussed in Impact AQ-1, the Project would generate emissions of ROG, NOX, CO, PM10, and PM2.5 during construction. These emissions are primarily associated with fugitive dust during site grading and the use of heavy-duty equipment. Unmitigated construction activity under the Proposed Project (Alternative 1) and Alternatives 3, 5, and 6 would exceed the PCAPCD significance standard for PM10 during Phase 1a. This is a significant cumulative impact.
Mitigation: Mitigation Measure AQ-1: Implement PCAPCD Best Management Practices (BMPs) to reduce pollutant emissions during construction.
After Mitigation: Less than Significant Impact, Proposed Project (Alternative 1); Significant and
Unavoidable Impact, Alternatives 3, 5,and 6
Implementation Mitigation Measure AQ-1 will reduce PM10 emissions generated by the Proposed Project (Alternative 1) to less than significant. It is anticipated that similar projects in the LTAB, including those listed in Chapter 20 – Mandated Analysis, Table 20-1 would also be required to implement similar BMPs to reduce project-level construction-related emissions. Thus, the Proposed Project (Alternative 1) would not contribute to a cumulative impact.
Alternatives 3, 5, and 6 would result in a significant and unavoidable short-term construction related impact, even after implementation of Mitigation Measure AQ-1. Given the large scale and number of related projects within the region, emissions generated by Alternatives 3, 5 and 6 would contribute to a cumulative impact.
Analysis: Less Than Significant Impact; Alternative 4
As documented in Table 12-11, Alternative 4 will not exceed PCQPCD significance thresholds for construction emissions. Other projects in the area do not involve extensive earth moving activities. Therefore, Alternative 4 will not contribute to a cumulative impact.
Mitigation: No mitigation is required.
Impact: AQ-C2. Would the Project Result in a Cumulative Long-Term Regional Impact on Air Quality?
Analysis: Less than Significant Impact; No Project (Alternative 2) and Alternative 4
The No Project (Alternative 2) and Alternative 4 were found to have less than significant long-term impacts on air quality. The No Project (Alternative 2) is expected to have net, long-term reduction in emissions due to increasing technological efficiencies. Alternative 4 would have a net long-term reduction in air pollutant emissions. The No
AIR QUALITY H O M E W O O D M O U N T A I N R E S O R T S K I A R E A M A S T E R P L A N E I R / E I S
J A N U A R Y 2 0 , 2 0 1 1 H A U G E B R U E C K A S S O C I A T E S P A G E 1 2 - 5 1
Project (Alternative 2) and Alternative 4 will therefore not contribute to a cumulatively considerable impact on air quality.
Mitigation: No mitigation is required.
Analysis: Significant Impact; Proposed Project (Alternative 1) and Alternatives 3, 5, and 6
As shown in Impact AQ-2, implementation of the Proposed Project (Alternative 1) and Alternatives 3, 5, and 6 increase VMT in the Project area and vicinity relative to existing conditions. This increase in VMT may result in long-term increase in criteria pollutant emissions from traffic operations. When combined with emissions from area and stationary sources, the Proposed Project (Alternative 1) and Alternatives 3, 5, and 6 generate ROG and NOX emissions in excess of 10 pounds per day, which exceeds the PCAPCD’s cumulative significance threshold. This is considered a significant impact.
Mitigation: Mitigation Measure AQ-2a: Contribute to the TRPA Traffic and Air Quality Mitigation Program
After Mitigation: Less than Significant Impact; Proposed Project (Alternative 1) and Alts 3, 5, and 6
To mitigate cumulative operational impacts, the PCAPCD requires the payment of fees for each pound of pollutant in excess of 10 pounds per day. Based on consultation with the PCAPCD, payment of the TRPA off-site fee (Mitigation Measure AQ-2a) will satisfy this PCAPCD fee requirement (Rinker pers. comm.). Implementation of Mitigation Measure AQ-2a will therefore provide the necessary funding to offset the Project’s contribution to long-term criteria pollutant emissions. TRPA adopted the Traffic and Air Quality Mitigation Program as a means of generating the revenue necessary to implement programs to reduce VMT, resulting in improvements to both traffic and traffic-related air quality. The Proposed Project (Alternative 1) and Alternatives 3, 5, and 6 will therefore not contribute to a cumulatively considerable air quality impact.
Impact: AQ-C3. Would the Project Result in a Cumulative Long-Term Local Impact on Air Quality?
Analysis: Less than Significant Impact; Proposed Project (Alternative 1), No Project (Alternative 2) and Alternatives 3, 4, 5, and 6
CO modeling for the Proposed Project (Alternative 1) and Alternatives 2 (No Project), 3, 4, 5, and 6 showed that existing and future concentrations from idling would not exceed existing State, federal, and TRPA thresholds. This modeling is based on traffic volumes that assumed cumulative growth throughout the Lake Tahoe area. Because the Proposed Project (Alternative 1) and Alternatives 2 (No Project), 3, 4, 5, and 6 would not exceed State, federal, or TRPA thresholds, they would not contribute to a cumulative air quality violation.
Mitigation: No mitigation is required.
AIR QUALITY H O M E W O O D M O U N T A I N R E S O R T S K I A R E A M A S T E R P L A N E I R / E I S
P A G E 1 2 - 5 2 H A U G E B R U E C K A S S O C I A T E S J A N U A R Y 2 0 , 2 0 1 1
12.6 REFERENCES
12.6.1 Printed
Beaudin Ganze Consulting Engineers, Inc. 2007. Homewood Mountain Resort Development Water, Gas, and Electric Energy Use Project. Prepared for Homewood Mountain Resort. Homewood, CA. October.
Benson, Paul. 1984, revised 1989. CALINE4—A Dispersion Model for Predicting Air Pollutant Concentrations Near Roadways. Sacramento, CA: California Department of Transportation.
California Air Resources Board. 2000. Risk Reduction Plan to Reduce Particulate Matter Emissions from Diesel-Fueled Engines and Vehicles. Stationary Source Division, Mobile Source Control Division. Sacramento, CA. October.
California Air Resources Board. 2007. Final Regulation Order: Amendments to the Airborne Toxic Control Measure for Stationary Compression Ignition Engines. Page 20. Effective October 18, 2007.
California Air Resources Board. 2009a. ARB Databases: Aerometric Data Analysis and Management System (ADAM). Last Revised: May 7, 2009. Available: <http://www.arb.ca.gov/html/databases.htm>. Accessed: September 29, 2009.
California Air Resources Board. 2009b. 2006 State Area Designations. Last Revised: February 9, 2009. Available <http://www.arb.ca.gov/desig/adm/adm.htm> Accessed: September 29, 2009.
California Air Resources Board 2009c. Almanac Emissions Project Data (Published in 2009): 2008 Estimated Annual Average Emissions Lake Tahoe Air Basin. Available: <http://www.arb.ca.gov/app/emsinv/emssumcat_query.php?F_YR=2008&F_DIV=4&F_SEASON=A&SP=2009&F_AREA=AB&F_AB=LT#0>. Accessed: September 29, 2009.
California Air Resources Board. 2010. Ambient Air Quality Standards. Last Revised: September 8, 2010. Available: < http://www.arb.ca.gov/research/aaqs/aaqs2.pdf >. Accessed: November 1, 2010.
California Department of Transportation. 2003. Draft Use of EMFAC 2002 to Replace CT-EMFAC: A Users Guide. February 27.
Department of Conservation, California Geological Survey. 2006. Relative Likelihood for the Presence of Naturally Occurring Asbestos in Placer County California. Prepared by Chris T. Higgins and John P. Clinkenbeard.
Energy Information Administration. 2009a. Number of Natural Gas Consumers. Last Revised: October 30, 2009. Available: <http://tonto.eia.doe.gov/dnav/ng/ng_cons_num_dcu_SCA_a.htm>. Accessed: November 18, 2009.
Energy Information Administration. 2009b. Natural Gas Consumption by End Use. Last Revised: October 30, 2009. Available: <http://tonto.eia.doe.gov/dnav/ng/ng_cons_sum_dcu_SCA_a.htm>. Accessed: November 18, 2009.
Fehr & Peers. 2009. Memorandum: Homewood Mountain Resort Existing g Volumes and Trip Generation. Addressed to Rob Brueck, Hauge Brueck Associates, LLC. From Katy Cole and Marissa Harned, Fehr & Peers. October.
Jones & Stokes. 2007. Software User’s Guide: URBEMIS2007 for Windows, Appendix A and I. Prepared for South Coast Air Quality Management District. November.
Sonoma Technology Inc and California Department of Transportation. 1998. User’s Guide for CL4. Prepared for California Department of Transportation. June.
AIR QUALITY H O M E W O O D M O U N T A I N R E S O R T S K I A R E A M A S T E R P L A N E I R / E I S
J A N U A R Y 2 0 , 2 0 1 1 H A U G E B R U E C K A S S O C I A T E S P A G E 1 2 - 5 3
Tahoe Regional Planning Agency. 2006. 2006 Threshold Evaluation Report. May. Available: <http://www.trpa.org/default.aspx?tabindex=1&tabid=174>. Accessed: October 12, 2009.
Tahoe Regional Planning Agency. 2009. TRPA Code of Ordinances, Chapter 91: Air Quality Control. Available: < http://www.trpa.org/default.aspx?tabindex=2&tabid=172>. Accessed: November 23, 2009.
U.S. Environmental Protection Agency. 2009a. The Greenbook Nonattainment Areas for Criteria Pollutants. Last Revised: July11, 2009. Available <http://www.epa.gov/oar/oaqps/greenbk/> Accessed: September 29, 2009.
U.S. Environmental Protection Agency. 2009b. Air Data: Monitor Values Report- Criteria Air Pollutants. Last Revised: January 10, 2009. Available: <http://www.epa.gov/air/data/reports.html>. Accessed: November 9, 2009.
U.S. Green Building Council 2009. LEED for Neighborhood Development. PowerPoint Presentation. Available: <http://www.usgbc.org/DisplayPage.aspx?CMSPageID=148 >. Accessed: December 29, 2009.
12.6.2 Personal Communications Chang, Yu-Shuo A. Air Quality Planner. Placer County Air Pollution Control District, Auburn, CA.
August 10, 2009—Email message to Shannon Hatcher, ICF International.
Chang, Yu-Shuo B. Air Quality Planner. Placer County Air Pollution Control District, Auburn, CA. November 11, 2009—Telephone Conversation with Laura Smith, ICF International.
Emmett, Charles. Tahoe Regional Planning Agency, Tahoe, CA. January 6, 2010—Email Message to Laura Smith, ICF International.
Finnell, John. Senior Air Pollution Control Engineer. Placer County Air Pollution Control District, Auburn CA. November 9, 2009—email message to Laura Smith, ICF International.
Harned, Marissa A. Transportation Planner, Fehr & Peers, Reno, NV. October 28, 2009—Email message to Shannon Hatcher, ICF International.
Harned, Marissa B. Transportation Planner, Fehr & Peers, Reno, NV. November 3, 2009—Email message to Laura Smith, ICF International.
Harned, Marissa C. Transportation Planner, Fehr & Peers, Reno, NV. November 5, 2009—Email message to Laura Smith, ICF International.
Harned, Marissa D. Transportation Planner, Fehr & Peers, Reno, NV. November 19, 2009—Email message to Laura Smith and Shannon Hatcher, ICF International.
Rinker, Angel. Associate Planner. Placer County Air Pollution Control District, Auburn, CA. September 9, 2010—Email message to Laura Smith, ICF International.
Tirman, David A. Executive Vice President. JMA Ventures LLC, Truckee, CA. November 9, 2009—Email message to Laura Smith, ICF International.
Tirman, David B. Executive Vice President. JMA Ventures LLC, Truckee, CA. November 11, 2009—Email message to Laura Smith, ICF International.
Tirman, David C. Executive Vice President. JMA Ventures LLC, Truckee, CA. November 11, 2009—Email message to Laura Smith, ICF International, and Rob Brueck, Hauge Brueck & Associates.
Tirman, David D. Executive Vice President. JMA Ventures LLC, Truckee, CA. November 13, 2009—Email message to Laura Smith, ICF International, and Rob Brueck, Hauge Brueck & Associates.
AIR QUALITY H O M E W O O D M O U N T A I N R E S O R T S K I A R E A M A S T E R P L A N E I R / E I S
P A G E 1 2 - 5 4 H A U G E B R U E C K A S S O C I A T E S J A N U A R Y 2 0 , 2 0 1 1
Tirman, David E. Executive Vice President. JMA Ventures LLC, Truckee, CA. November 16, 2009—Email message to Laura Smith, ICF International, and Rob Brueck, Hauge Brueck & Associates.
Related Documents