1/12 School of Mechanical Aerospace & Civil Engineering, University of Manchester HMRC Marine Energy Economics Workshop 28 th Jan 2011 Tim Stallard School of Mechanical Aerospace and Civil Engineering, University of Manchester

1/12 School of Mechanical Aerospace & Civil Engineering, University of Manchester HMRC Marine Energy Economics Workshop 28 th Jan 2011 Tim Stallard School.
Dec 26, 2015
Welcome message from author
This document is posted to help you gain knowledge. Please leave a comment to let me know what you think about it! Share it to your friends and learn new things together.
Transcript

1/12 School of Mechanical Aerospace & Civil Engineering, University of Manchester
HMRC Marine Energy Economics Workshop
28th Jan 2011
Tim StallardSchool of Mechanical Aerospace and Civil Engineering,
University of Manchester

2/12 School of Mechanical Aerospace & Civil Engineering, University of Manchester
Background• 1996 – 2000: Civil & Structural Engineering MEng• 2000 – 2004: Fluid Dynamics DPhil – Extreme wave loading• 2004 – 2006: Supergen Marine
“Lifetime Economics of Marine Energy”
• 2006 – Present: University of Manchester
- Cost studies related to “Manchester Bobber”
- EQUIMAR: Equitable Appraisal of Marine Energy Systems“Economic Assessment of Large-Scale Marine Energy Deployment”
5 x 5 Array Interaction Experiments5 x 5 Array Interaction Experiments
2D 2D 2D
3/12 School of Mechanical Aerospace & Civil Engineering, University of Manchester
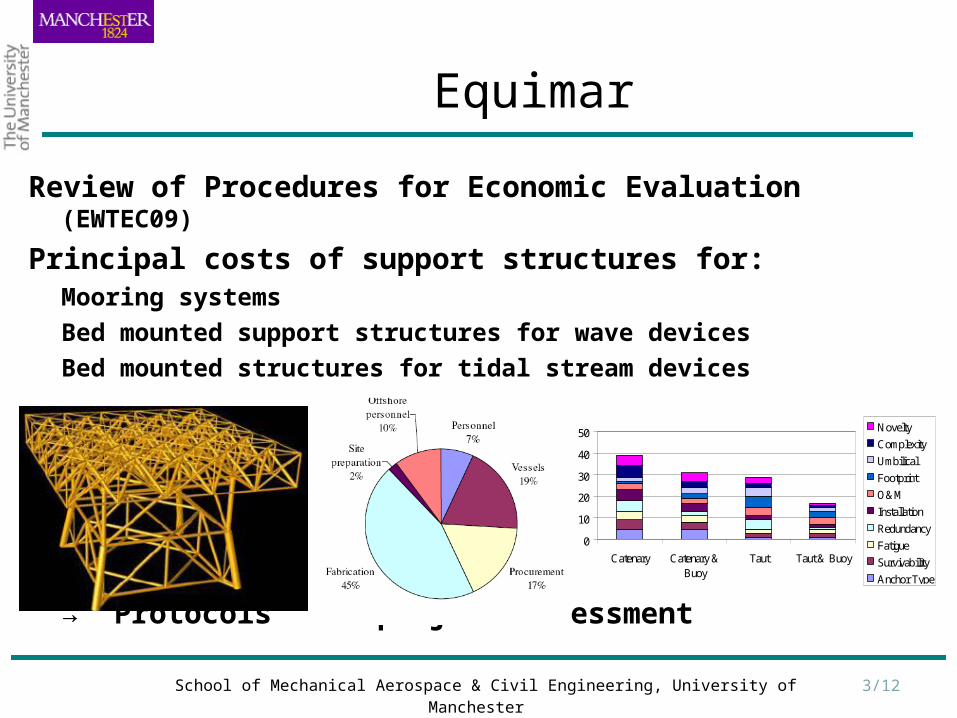
Equimar
Review of Procedures for Economic Evaluation (EWTEC09)
Principal costs of support structures for:Mooring systems
Bed mounted support structures for wave devices
Bed mounted structures for tidal stream devices
Influence of accessibility on scale of deployment
Influence of energy extraction limits on project economics
→ “Protocols” for project assessment
0
10
20
30
40
50
Catenary Catenary &Buoy
Taut Taut & Buoy
Novelty
Complexity
Umbilical
Footprint
O&M
Installation
Redundancy
Fatigue
Survivability
Anchor Type

4/12 School of Mechanical Aerospace & Civil Engineering, University of Manchester
Wave Site Access
0
5
10
15
20
25
30
0 0.5 1 1.5 2 2.5 3 3.5
Annual average Hs, m
Acc
essi
ble
cond
ition
s pe
r M
onth
48 hr 24 hr 24 hr summer
Average number of occurrences, per month, of 24hr and 48hr calm conditions (Hs < 2 m)
0
2
4
6
8
10
12
0 0.5 1 1.5 2 2.5 3 3.5
Annual average Hs, m
Av.
wai
ting,
day
s
48 hr 24 hr 24 hr summer
10 20 30 40 50Wave power density (very approx.) kW/m

5/12 School of Mechanical Aerospace & Civil Engineering, University of Manchester
Tidal Stream Deployment
0.0
1.0
2.0
3.0
4.0
5.0
6.0
Nu
mb
er
of
turb
ine
s i
ns
tall
ed
by
on
e v
es
se
l
0.0
1.0
2.0
Nu
mb
er
of
turb
ine
s i
ns
tall
ed
by
on
e v
es
se
lInstallation whilst Uc < 1.33 m/s
28 devices (~ 14 MW) in six months
100 MW capacity if install 7 devices per 24 hr window
Installation whilst Uc < 1.13 m/s
15 devices (~7.5 MW) in six months
100 MW capacity if install 14 devices per 24 hr window
Number of installations per Month
6/12 School of Mechanical Aerospace & Civil Engineering, University of Manchester
0%
10%
20%
30%
40%
50%
60%
70%
A
B
C
D
0%
10%
20%
30%
40%
50%
60%
70%
A
B
C
D
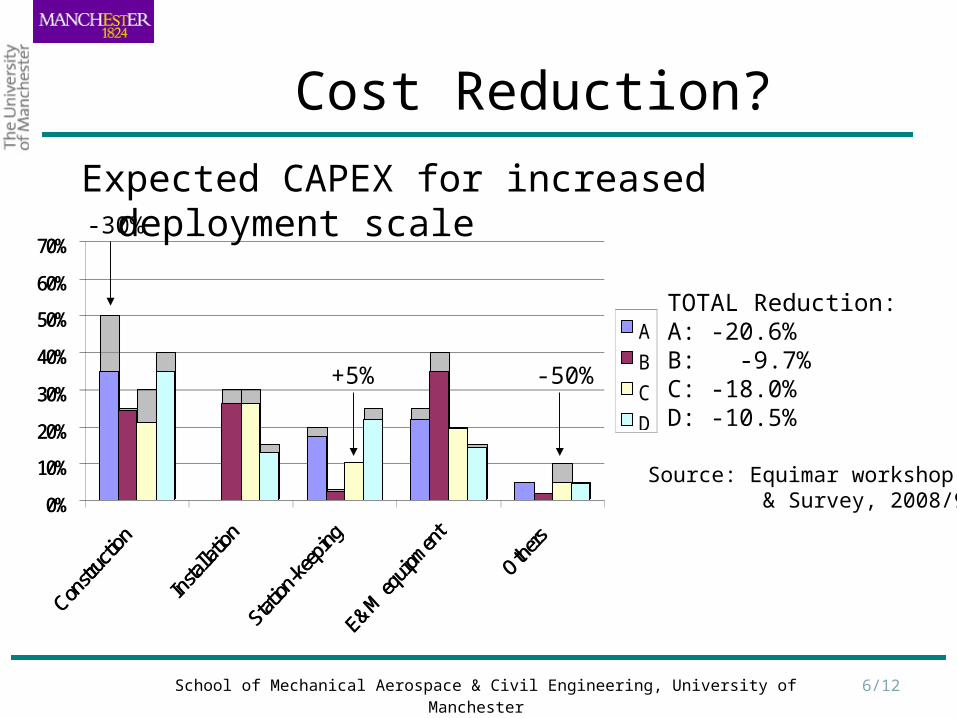
Cost Reduction?
Expected CAPEX for increased deployment scale
TOTAL Reduction:A: -20.6%B: -9.7%C: -18.0%D: -10.5%
-50%
-30%
+5%
Source: Equimar workshop & Survey, 2008/9
7/12 School of Mechanical Aerospace & Civil Engineering, University of Manchester
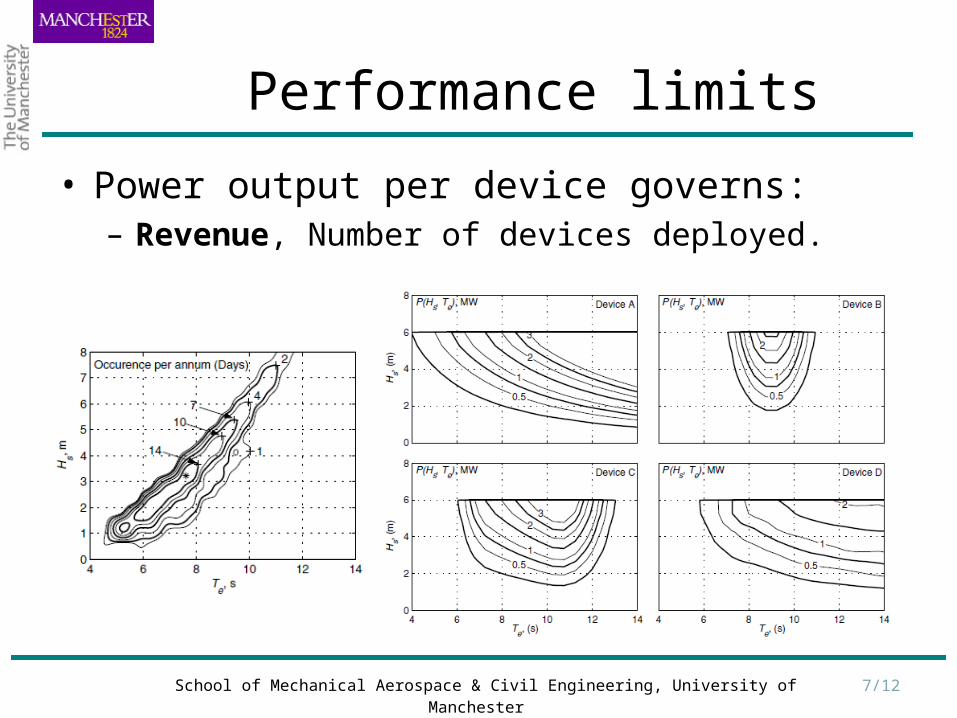
Performance limits
• Power output per device governs:– Revenue, Number of devices deployed.

8/12 School of Mechanical Aerospace & Civil Engineering, University of Manchester
0
500
1000
1500
2000
2500
3000
3500
4000
0 10 20 30 40 50 60
Average wave power at site (kW/m)
£k/M
W
.
NPV inc. OPEX inc. OPEX & cable
Performance Limits
0
500
1000
1500
2000
2500
3000
3500
4000
0 10 20 30 40 50 60
Average wave power at site (kW/m)
£k
pe
r D
EV
ICE
• Power output per device governs:– Revenue, Number of devices deployed.
Device: Optimal output at peak periodResource: HSE (2001), 8 sites
Revenue per unit: 3.5 p/kWhDiscount: 8%OPEX: 8% CAPEX assumed
Cable: site to shore transmission estimates based on distance & rated power (Boehme et al., 2006)
0100200300400500600700800900
1000
0 10 20 30 40 50 60
Average wave power at site (kW/m)
N. D
evic
es
Optimal at peak period Optimal in all conditions

9/12 School of Mechanical Aerospace & Civil Engineering, University of Manchester
Project Assessment “Protocol”
1. Capital Expenditures
4. Risk Assessment
2. Operating Expenditures
3. Revenue
5. Project Assessment
Conduct of an economic assessment should produce statements detailing:
- Economic indicators against which the project is assessed
- Major capital cost components
- Major contributions to annual expenditure
- Expected project revenue
- Risk assessment and mitigation

10/12 School of Mechanical Aerospace & Civil Engineering, University of Manchester
end
11/12 School of Mechanical Aerospace & Civil Engineering, University of Manchester
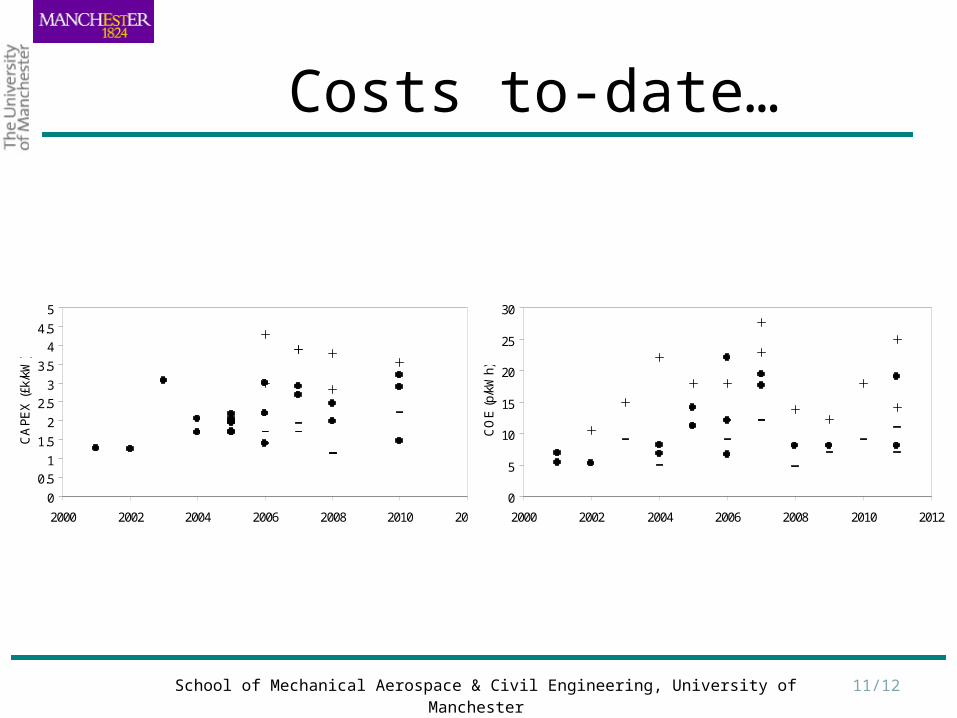
Costs to-date…
0
0.5
1
1.5
2
2.5
3
3.5
4
4.5
5
2000 2002 2004 2006 2008 2010 2012
CA
PE
X (
£k/k
W)
0
5
10
15
20
25
30
2000 2002 2004 2006 2008 2010 2012
CO
E (
p/kW
h)
12/12 School of Mechanical Aerospace & Civil Engineering, University of Manchester
‘Protocol’
Develop framework for evaluating long-term economic viability of marine energy technologies.
• Summarise main drivers of cost of electricity from marine energy farms
• Develop methods for quantifying long-term cost-reduction of alternative generating technologies – Evaluate cost drivers for types of civil engineering infrastructure– Explore relationship between performance limitations and long-
term revenue– Describe procedure to compare technologies in terms of potential
cost reduction
• Evaluate influence of technology selection and deployment scale on economic viability
Related Documents