Exchange Rates of Ethanol with Water in Water-Saturated Cement Pastes Probed by NMR Hans C. Gran* and Eddy W. Hansent *Norwegian Building Research Institute and Department of Chemistry, University of Oslo, and tSINTEF Oslo, Oslo, Norway DiffuSion of ethanol into wate r-satu rated white ceme nt pastes has been investigatedby ca rbon and proto n nuclearmagnetic resonance (NMR). TIl e diffusionofethanol W IlS shown to be Fi ckian , Il ssllming one-dimensional diffusion under perfect sink boundll ry conditions. Derived diffusion coefficients werefound to increllse with increasing water/cement (w/c) ratiof rom (2.7 :!: 0.5) 10- 8 ( 11I 2 /s at io/c = 0.30 to (59 :!: 5) 10 - 8 cm 2 /5 at wlc = 1.0. At the end of the exchange process, only II [raction of the total volume of water is exchanged with ethan ol, varying [rom 60% for samples containing mailll y micro- and me sopores to a bo llt 80% for samples where additiona! capillary pores are present. Tilli e needed to reach 90'% and 95% exchange of the total inirudable amount of ethano l ill cylindri cal samples with dill meter of 5.5 111m varied f rom 1 day to nearl y3 weeks. This has importance for exchange in larger samples with typical diameters of 10 mm or more (as used in mercllry intrusion po rosi metrv), which may require 011 the order of months for 90% exchange to take p lace . The molef rac tion of ethanol and water ill the pore system was determined from sail/ pled carbon and proton NMR spectra vs. excha llge time by comparillg H 20 -satll ra ted and 0 20 - saturated samples. At the end of tile exchange pro cess , water was [oun d to ocwpY the remaining volume not acces sible to ethan ol. In the tested wlc ra tio range, the water content ill all sa mples is below thevalue where damage to the pore structure normally occllrs due to internal tension when exposed to drying. An empiri ca l re lation ship between chemical shift of the peak and mole f raction of ethanol is derived, enabling the mole fraction of ethanol from the NMR peak to be estimated. ADVAN CED CEMENT BA SED MATERIALS 1998, 8, 108-11 7. © 1998 Elsevier Science Ltd. KEY WORDS: Nuclear magnetic resonance, Liquid ex- change, Diffusion, Cement paste T he excha nge or liquid replacement of water by ethanol in the porous structure of hydrated cement paste (HCP) a nd concre te is u sed where gen tle drying is required to preserve the porous Address correspondence to: Dr. Hans C. Gran. NorW 's hyggforskningsinslilutt. Postboks 123 Blindern, 0314, Oslo, Norway. Received Decembe r h. 1'1 '1f>; Accepted lanuarv 14, 1948 1998 by Elsev ier Sc ie nc e Ltd. 655 Avenu e of the Americas, New York, NY 10 0 10 structure and to red uce the danger of intr oducing microcracks. Appli cations are, among others, found in mercury intrusion porosimetry (MIP) [1] and optical microscopy [2]. The samp le is nor mally placed in a reservoir of ethanol or another alcohol for several days. After rep lacement, the ethanol is remove d by evapo ra- tion . One recent appli cation is in optical ultraviolet microscopy of concrete, where a combination of gentle dr ying and impregna tion of the concrete with a solution of e thanol and a fluorescent dye (fluorescent liquid replacem ent [FLR] technique) [3] is done to observe air voids, cracks, var iatio ns in density, and the wa ter- to-cement mix ratio (w/ c ratio) in very dense samples . The FLR tech nique is a qua ntitative app lication where the intensity of fluorescent light from the samples is used to determine the w / c ratio [3,4]. Determination of the w/ c ratio is depend ent on the amount of exchange of et hano l for wat er. To be accurate and reliable, the technique will require that a sufficient and known degree of excha nge be achieved. It is also import ant to know the time needed for sufficient exchange to take place. I H nuclear magnetic resonance (NMR) carried out on ethanol sur rounding samples (diameter 35 mm) of hydrated ce men t pas tes with a w / c ratio of 0.40 has shown tha t abo u t 60' 1,. to 70% of the pore water is excha nge d dur ing a period of a few days [3]. Most recently, the diffusion of ethano l into water sat ura ted HCPs (also w/ c = 0.40) has been monitored by observ- ing the J3C-NMR signal intensity of ethanol vs. time dur ing exchange with water [5]. A large difference in exchange rates between preheated and virgin samples wa s observed. Both wo rks demonstrate the cap ability of NMR as a quantitative and nond e structive experimen- tal technique in character ization of HCP. However, knowledge of the effect of w/c ratio on both excha nge rate and amount of exchange is still needed. Furt her more, the amount of water pre sent in the pore structure after an exchange process has taken place is im por tant. Water, through its surface tension, may set up des tructive forces within the pore structure ISSN 1065-7 YiS/98/$19 .00 Pli S1

Welcome message from author
This document is posted to help you gain knowledge. Please leave a comment to let me know what you think about it! Share it to your friends and learn new things together.
Transcript

Exchange Rates of Ethanol with Waterin Water-Saturated Cement PastesProbed by NMRHans C. Gran* and Eddy W. Hansent*Norwegian Building Research Institute and Department of Chemistry, University of Oslo, andtSINTEF Oslo, Oslo, Norway
DiffuSion of ethanol into water-satu rated white cement pastes hasbeen investigated by carbon and proton nuclearmagnetic resonance(NMR). TIle diffusionofethanol WIlS shown to be Fickian, Ilssllmingone-dimensional diffusion under perfect sink boundllry conditions.Deriveddiffusion coefficients werefound to increllse with increasingwater/cement (w/c) ratiofrom (2.7 :!: 0.5) 10- 8
( 11I2/s at io/c = 0.30
to (59 :!: 5) 10 - 8 cm2/ 5 at wlc = 1.0. At the end of the exchange
process, only II [raction of the total volume of water is exchangedwith ethanol, varying [rom 60% for samples containing mailllymicro- and mesopores to abollt 80% for samples where additiona!capillary pores are present. Tillie needed to reach 90'% and 95%exchange of the total inirudable amount of ethanol ill cylindricalsamples with dillmeter of 5.5 111m varied from 1 day to nearly 3weeks. This has importance for exchange in larger samples withtypical diameters of 10 mm or more (as used in mercllry intrusionporosimetrv), which may require 011 the order of months for 90%
exchange to take place. The molef raction of ethanoland water ill thepore system was determinedfro m sail/pled carbon and proton NMRspectra vs. exchallge time by comparillg H20 -satllrated and 0 20saturated samples. At the end of tile exchange process , water was[ound to ocwpY the remaining volume not accessible to ethanol. Inthe tested wlc ra tio range, the water content ill all sa mples is belowthevaluewhere damage to the pore structure normally occllrs due tointernal tension when exposed to drying. An empirical relationshipbetween chemical shift of the CH~CH20H/H20 peak and molefraction of ethanol is derived, enabling the mole fraction of ethanolfrom the NMR peak to be estimated. ADVAN CED CEMENT BA SED
MATERIALS 1998, 8, 108-11 7. © 1998 Elsevier Science Ltd.KEY W ORD S: Nuclear magnetic resonance, Liquid exchange, Diffusion, Cement paste
The exchange or liquid rep lacement of wa ter byethanol in the porous structure of hyd ratedcement paste (HCP) and concre te is used
where gentle drying is required to preserve the porous
Address correspondence to: Dr. Hans C. Gran. NorW's hyggforskningsinslilutt.Postboks 123 Blindern, 0314, Oslo, Norway.
Rece ived Decembe r h. 1'1'1f>; Accepted lanuarv 14, 1948
~) 1998 by Elsev ier Sc ie nc e Ltd.655 Avenu e of the Amer icas, New York, NY 100 10
structure and to reduce the dan ger of introducingmicrocracks. Applications are, amo ng others, found inmercury intrusio n porosimetry (MIP) [1] and opticalmicroscopy [2]. The sample is normall y placed in areservoir of ethanol or anothe r alcohol for several days.After replacement, the ethanol is removed by evaporation . One recent application is in op tical ultravioletmicroscopy of concrete, where a combi na tion of gentledrying and impregnation of the concrete with a solutionof ethanol and a fluorescent dye (fluorescent liquidreplacement [FLR] technique) [3] is done to obs erve airvo ids, cracks, variatio ns in density, and the wa terto-cement mix rat io (w / c ratio) in very dense samples.The FLR technique is a quantita tive application wherethe intensity of fluorescent ligh t from the samples isused to de termine the w / c ratio [3,4]. Determina tion ofthe w / c ratio is depen dent on the amo unt of exchangeof ethanol for water. To be accurate and reliable, thetechnique wi ll require that a sufficien t and knowndegree of excha nge be achieved. It is also important toknow the time needed for su fficient exchange to takeplace. I H nuclear magne tic resonance (NMR) carriedout on etha nol sur rounding samples (diame ter 35 mm)of hydrated cement pas tes wi th a w / c ra tio of 0.40 hasshown tha t abo ut 60'1,. to 70% of the p ore wa ter isexcha nged during a pe riod of a few da ys [3]. Mos trecently, the di ffusion of ethanol into water sat uratedHCPs (also w / c = 0.40) has been moni tored by observing the J3C-NMR signal in tensity of etha nol vs. timeduring exchange with water [5]. A large difference inexchange rates between preheated and virgin sampleswas observed . Both wo rks demonst rate the cap abil ity ofNMR as a quantitative and nondestructive experimental technique in characterization of HCP.
However, knowledge of the effect of w / c ratio onboth excha nge rate an d amo unt of excha nge is stillneeded. Furthermore, the amo un t of wa ter present inthe pore struc ture after an exchange process has takenplace is important. Water , throu gh its surface tension,may set up destructive forces wi thin the pore structur e
ISSN 1065-7Y i S/98/$ 19 .00Pli S106S -7.1 5 5 \(8 ) OO[) 1~-3

Advn Cem Bas Mat1998;8 :108-11 7
during the final drying that normally succeeds liquidexchange. HCPs are particularly vulnerable at relativehumidities between about 45% and 90% [6]. A relativehumidity of 45% corresponds to water contents occupying between 85% and 40% of the tot al pore space inthe w / c rat io range 0.30 to 1.0 [7]. As liquid exchange isnormally succeeded by drying to remove the alcohol, itis therefore important for an exchange process to reachwater contents below these values.
In light of this, we have first monitored the exchangeof ethanol for pore water in HCPs vs. w / c rati os byobserving the intensity (integrated area) of the 13C_NMR peaks from the ethanol entering the pore systemas a function of time. From this, diffusion coefficientshave been calculated. Second, as 13C-NMR alone doesnot give information about the amount of water stillpresent in the pore structu re, in a sepa rate series ofexperiments we monitored both IH-NMR and 13C_NMR intensities. In order to calculate the mole frac tionethanol/water in the pore sys tem, both IH-NMR and13C-NMR have been applied on a D20-saturated HCPwhere the contribution from water protons is notpresent. The amount of water and ethan ol derived fromthese NMR measurements is compared to the totalamount determined gra vimetrically.
Finally, a nonlinear least squares curve fitting analysis, or decon volution of the IH-NMR spectru m, isapplied in order to derive a possible corre lation between chemical shift and mol e fraction. Typical highresolution (HR) IH-NMR spectra from a mixture ofethanol and water contain three sepa rate peaks. Thethree peaks correspond to the methyl and methylenegroups of ethanol and-when fast exchange conditionis satisfied-one peak originating from the ethanol OHgroup and water. The amount of hydrogen bondingand thus the electronic surroundings of a proton depend critically on the relat ive concentrati ons of etha noland wa ter. The chemical shift of the OH/H20 protonpeak is expected to depend on the relati ve concentration of ethanol and water.
ExperimentalSample PreparationFour different samples of HCPs with w / c ratios of 0.30,0.40,0.60, and 1.0 were prepared for 13C-NMR measurements of the amount of exchange and diffusion ofethanol. The samples, which were prepared w ith d istilled water, were between 2 and 3 years old at the timeof analysis and are refe rred to as S03, S04, 506, and S10,res.pectively. Two sa mples, Sl and 52, we re prep ar edfor lH-NMR measurements. These were made from two3-month-old HCPs with w / c rati o of 0.40. Sample 52differed from 51 in being hydrated using 0 20 instead ofH20. To reduce influence of paramagnetic constituents,
Ethanol Diffusion in Hydrated Cement Pastes 109
all pastes were made from a Danish Super WhitePortland Cement certified as a British Standards Institution class 62.5N cement, with a Bogue composition of65.8% tricalcium silicate (C3S), 21.0% dicalcium silicate(C2S), 4.18% tricalcium aluminate (C3A), and 0.96%tetracalcium alumina ferrite (C4AF), and a Blaine surface of 4000 cm2/ g. The content of paramagnetic constituents Fe203 and Mn20 3 were 0.31% and 0.012% byweight of cement, respectively. All pastes were mixedunder vacuum, and molded and sealed in cylindricalpolytetraflu oroethane forms with d iameter of 20 mmand length of 120 mm. The pa stes were slowly rotatedduring the first 20 hou rs of hardening to avoid separation between water and cement. After demolding, theH20 pastes were stored in water at room temperatureuntil testing. The 0 20 paste was similarly stored in° 20. Samples S03, S04, 506, SIO, and SI were tested invirgin condition, i.e., without any pretreatment. Sample52 was preheated at 105°C for a period of 12 hours andresat urated with 0 20 prior to the test.
To fit into the NMR tubes and the radiofrequencyreceiver / transmitte r coil, the samples were cut to cylindric al shape with a d iameter of 5.5 mm and a len gth of20 mm (samples S03, S04, S06, and S10) and 3.5 mm,and a length of 10 mm (sam ples Sl and S2). To obtainqu antitative measurem ents the who le length of thesam ple was placed wi thin the receiver / tra nsmitter coil.The NMR tubes were closed with an airti ght cap andweighed before and after acquisition .
Four samples (R03, R04, R06, and RIO) of HCPscorrespond ing to w / c rat ios 0.30, 0.40, 0.60 and 1.0 weresatu ra ted with ethano l and served as refe rences fordetermination of the actual am ount of ethanol in samples S03, S04, S06, and 510 during the test s. Thesereference samples were first stored for 2 weeks ineth an ol to avoid development of microcracks, p reheated at 105°C until the we ight remained cons tan t,and then resaturated wi th reagent grade anhydrousethano l. The resaturation was done by first storing thereferen ce samples in ethanol vapor for 3 days and thenimmersing them in ethanol until cons tant we ight wasreached . The reference samples d iffered from the rest ofthe samp les in consisting of tw o thin slices. Each slicecut to a rectangular shape 5 mm X 20 mm and with athickness of 1 mm. This was done to ensure sufficientfilling of the pore structu re as, in particul ar , the sa mpleswith the lower w / c ratios showed cons iderably reduced resaturation rates. Initial weight, we ight loss atlOs oC, weight of etha nol, and degree of resa turationwi th ethanol (ass uming bu lk densi ties of the poreliquids, see later in the text ) is shown in Table 1. Tocheck the reproducibility of the resaturation process, aset of eight samples were additionally taken at w / cratio 0.30, preheated at 105°C, and tested gravimetri-

110 H.C. Gran and E.W. Hansen
TABLE 1. Weight of reference samples in saturated surfacedr y condition, mssv , weight loss at 105°C, nt h'''' and we ight ofeth anol that has entered the reference sample, m.,
'"lo ss
w/c ntS S D 1111oS$ (%) m et Fm a x
0.30 1.206 0.163 13.5 0.0715 56.20.40 1.056 0.194 18.4 0.106 69.50.60 1.032 0.286 27.7 0.196 87.71.0 0.797 0.343 43.0 0.254 94.2
Note: Maxim um degree of resaturation (F",,,xl with ethan ol in percent iscalculated (assuming bulk densit ies of the pore liquids) by correcting forethanol density (i.e.. volume of eva porated wa ter equals Ill,,,,, and V,., =
111•.,/ (0,.,111,,,,,).
cally for loss of evaporable water. Standard de viationwas calculated to be < 1.0%.
A drying temperature of 105°C was selected, as thi s isa commonly used conventional procedure for determination of the amount of evaporable water in a sample ofHCP. The difference in we ight befo re and after dryingis defined as the weight of evaporable water.
NMR MeasurementsThe experimen ts were performed on two differentNMR spectrometers. Samples S03, S04, S06, and 510were tested on a Bruker Avance DMX 200 NMR spectrometer, operating at 200-MHz proton resonance frequency using a 10-mm J3C-NMR broadband probeheadwithout proton decoupling. The bandwidth wa s set to100 kHz using an acquisition time of 0.041 s. Theapplied 90° pulse length was 8.0 us. The dead time was7.14 us. The total number of transients (radiofrequency[RF] pulses) was first set to 1024 for samples 504, 506,and 510 and 3072 for sample 503 to compensate for thelower content of ethanol. (Probably due to the application of prolonged high power pulsing and the fact thatthe reference samples were sliced, reference sample R03showed a tendency to lose weight during the earlyexperiments. The number of transients for this particular sample was in the end red uced to 1024, resulting inan inevitable reduction in signal-to-noise ratio.) Thespin-lattice rela xation time , T I , wa s measured in eachsample using a simple inversion recovery (180°-.-90°)pulse sequence. The longer T] of 189 ms wa s measuredin sample 510, which con tained the larger pore volume.The repetition time between RF pulses was set to 1 s,which is more tha n five times the spin-lattice relaxationtime, and assures quantitative sampling of the spectrum.
Samples S1 and 52 were tested on a Varian VXR 3005NMR spectrometer, operating at 300-MHz proton reso nance frequency using an HR 5-mm probehead. BothIH and 13C-NMR experiments were carried out. The l3Cexperiments were performed using a bandwidth of 20
Advn Cern Bas Mat1998 ;8:108-11 7
kHz, with an acquisition time of 0.30 s and an RF pulselength of 8.2 us. The number of accumulations was setto 1024. The IH-NMR experiments were performedusing a bandwidth of 25 kHz, with an acquisition timeof 1.3 s, an RF pulse length of 0.2 /-lS, and a dead time of10 us . Good signal-to-noise ratio was achieved withonly four accum ulations. The pulse repetition time wasset to 1 s for both IH and 13C-NMR acquisitions. The13C-NMR spectra were accumulated using gated decoupiing, i.e., decoupling of the protons during acquisitiontime only, to exclude differential nuclear Overhausereffects (NOE) [8). All NMR measurements were performed at room temperature of 25°C.
The experiments we re carried out by immersing thesamples of HCP in a reservoir of 10-ml 100% ethanol.The amount of ethanol entering the pore system of thesample as a function of tim e was measured by recording the proton and carbon NMR spectra at appropriatetime intervals during the exchange process. Before eachmeasurement, the samples were taken out of the ethanol, wiped dry with an absorbant tissue, weighed, andtransferred to a 5-mm NMR tube. The samples were putback into the ethanol immediately after recording of theNMR spectra. During the initial stage of the process, theethanol was chan ged between each experiment to avoidwater concentration building up in the ethanol.
The 13C-NMR spectra contained two peaks corresponding to the methylene and methyl carbons in theethanol. The peaks were easily separated, having a linewidth of about 2.5 ppm and situated about 12 ppmapart. The amount of ethanol was proportional to theaverage peak intensity (integrated areas) of the twopeaks and was normalized by setting the peak intensityof the reference sample with w / c ratio 1.0 to unity. Theintensity of the reference sample was measured between every fifth experiment. Within experimental error, no drift wa s observed during the time of theexperiments. In addition to the peaks from the ethanol,a broader peak from the 13C broadband probeheadcould be observed. This broad peak was removed bysubtraction usi ng a spectrum that was accumulatedwith identical acquisition parameters on a 13C-freehydrated cement sample.
The IH -NMR peaks we re broadened to several hundred Hertz due to a combined effect of suscep tibilityd ifferences (between the solid matrix and the poreliquid) and shortening of the spin-spin relaxation timedue to restricted motional freedom resu lting in severeoverlap ping be tween the OH, methyl, and methylenepeaks. As a consequence, the proton spectra had to bedeconvoluted by fitting them to a sum of three lineshape functions by a nonlinear least squares technique.The choice of line shape functions were either Lorentzian or Gaussian or a combination of the tw o.
Water confined in a pore system is normally consid-

Advn Cern Bas Mat1998;8:108-11 7
Ethano l Diffusion in Hydrated Cement Pastes 111
, 2 -
, .
oez-"iiie 06..E
0 <
0 2
C0 005 01 0 15 0 2 025
I
03
between NMR DC intensities and gravimetrically determined contents of ethanol shows a significant deviation from a straight line, sugges ting that fast exchangecondition is not satisfied . However, since in thi s workonly saturated samples are investiga ted, Figure 1 showsthat the fast exchange condition is sa tisfied .
A linear least squares fit to the data is shown as adotted line in Figure 1. The slope was determined to3.91 (~0.19) relat ive NMR peak area units / g (the relative 13C-NMR peak area un it of reference sample wi thw i c = 1.0 chosen as unity).
Amount of ExchangeCalculation of th e amount of ethanol, m el' that ha sentered the pore system at any time during the exchange p rocess is based on the empirical linear correlation in Figure 1 betw een lIIet and the intensity, IeI' (eq1):
let cor resp onds to th e sum of the integrated areas of themethylene and methyl peaks in the l3C spectra. Theamount of excha nge in percent, F(%), is calculated bycompar ing met to the mean volume of water released,VI" for the referen ce samples by drying at 105°C andcorrected for density difference between water andetha no l. F(%) is represented by eq 2:
where Pe l is the bulk density of ethanol. The assumptionthat ethanol in pores has the same density as bulkethanol is certainly valid if th e pore size is much largerthan the size of the molecules, but it might be erroneousif the pore size is of the same order of magnitude as themolecule itself. According to MIP investigations [10] ofwell-hydrated samples of cemen t paste, pores withradii <82 A, where a deviati on from bulk den sit y ma yexist (if any), con tribute only to 18.6% of the to tal porevolume . Althoug h not being an ignorable contribution,the measured amounts of excha nge are, as we shall seelater in this section, cons istent with earlier results.
F(%) vs . exchan ge time calculated for samples 503,504,506, and 510 is plotted in Figure 2 and su ggests thatthe exchan ge time varies with the wi c ratios. Sample510 (w I c = 1.0) reaches a constant etha nol con tent after1 to 2 days and S06 (wi c = 0.60) after 4 to 5 da ys.Samp les S04 (w / c = 0.40) and 503 (w /c = 0.30) reachesa cons tan t value of ethano l only after 20 to 50 days. Thefilling facto r, F(%), on the other hand, is about 90% inboth 510 and 506 and about 60% in both 504 and 503,
(2)
(1)
lIl et ' 100F(%)= - - ,
Pc/V/,
Amount 01ethan ol (9)
Results and DiscussionReferencesFigure 1 shows the average peak area of the methyleneand methyl l3C-NMR resonance from ethanol, Ie!' plotted vs , the gravimetrically determined am ount of ethanol, met. The plot shows a linear relationsh ip within theactua l wi c rat io ran ge investigated of samples fullysaturated w ith ethanol. For partially saturated samples(con taining different amoun ts of ethanol), the relation
ered to be separated into tw o different phases. Onecategory corresponds to water situated in th e bulkregions of the pore sys tem, which is cha racterized bylon g sp in-spi n relaxation times. The second phase consists of water close to the pore surfaces and is cha racteri zed by a significantly shorter sp in-spin relaxationtime and is rather d ifficult, if not impossible, to detectw ithout application of a spin-echo pulse sequence.However, since this work only deals w ith liquid-saturated pore sys tems, the interpretation of NMR data inthis work may therefore be based on the existence offast exchange between water near the pore surfaces andwa ter in the bulk pore regions. Fas t exchange on anNMR tim e scale causes an averaging of the sp in-spinrelaxation time. The existence of fast exchange in saturated hydrated cement pastes was shown by Bhattacharja et al. [9]. For this reason only a single RF pulsewas applied for data acquisition .
FIGURE 1. Measured 13C_NMR peak areas of methylene andmethyl peaks vs, amount of ethanol in the pore system of thereference samples. The dotted line represents a linear leastsquares fit to w/ c ratios 0.30, 0.40, 0.60, and 1.0 in fullyresaturated condition (e). Repeated experiments on the sample with w/ c = 1.0showed the uncertainty to be an absolutevalue of approximately 5%. At lower water contents (lowerw/ c ratios), the uncertainties are thus comparatively larger asindicated by the added error bars. 13e-NMR peak areasobserved in' a partially filled hydrated cement paste represented by w / c = 1.0 exposed to stepwise drying is alsopresented (0).

112 H.C. Gran and E.W. Hansen Advn Cern Bas Mat1998;8:108-117
100
90
eo
l 70~
{:'0c 40s~ 30
.0 o 0 0.v -~ 0
... ..o
• 0 •...
in the remaining pores not occupied by ethanol. Thisquestion cannot be resolved by 13C-NMR alone, butnecessitates use of IH-NMR.
The higher exchange rate observed in sample 504compared to 503 might be explained by a larger relativepore volume in 504, which will improve the transportcapacity compared to 503. Similar arguments may beapplied to 510 and 506 .
Exchange RatesTo calculate the diffusion coefficients it is necessary toestablish whether the diffusion process is Fickian or not.It has earlier been reported that diffusion into virginand preheated HCPs of wic ratio 0.40 could be fitted toPick's second law [5]. In the following, a model is usedto describe the diffusion process of ethanol into thesample in order to calculate the diffusion coefficientswithin the two samples. Ritger et al. [12] introduced asimple exponential relation:
10010
o.'
0 .1
0 "
I
001
• 0
o~-----+---------+----------<0001
10
FIGURE 2. The amount of exchange of ethanol with water vs.time during diffusion of ethanol into hydrated cement pastes,503 (L,), 504 (A), 506 (0), and S10 (e). The amount of exchangeor filling factor,F(%), is given in percent of the expected valuecalculated from the total amount of water released duringpreheating at 105°C.
to describe the general solute release behavior of controlled-release polymer devices, where IJIo is the fractional solute release, t is the release time, k is a constant,and n is the diffusional exponent characteristic of therelease mechanism. Here, we apply eq 3 in an analogous way to describe the fractional amount of solutediffusing into a porous material. It!10 then describes thefractional amount of ethanol exchanged with water attime t. Ritger et al. [12] have shown that in cases of pureFickian diffusion, the exponent n has a limiting value of0.46 for diffusion into a cylinder of infinite length.Depending on the ratio of length to diameter of thesample, Fickian diffusion mechanism is described by0.43 < n < 0.50. The dotted curves displayed in Figure3 are calculated by fitting eq 3 to the observed 13C-NMRpeak area data from samples 503, 504, 506, and 510 bya nonlinear least squares technique for ItlIa < 0.6. Thevalues determined for the exponent n was found toincrease with increasing wic ratio, i.e., n = 0.442(::1::0.060), 0.462 (::1::0.072), 0.647 (::1::0.147), and 0.620(::1::0.240) for samples 503, 504, 506, and 510, respectively, where numbers in brackets represent 90% confidence intervals. The results suggest that the diffusioncan be approximated by Fickian diffusion, which is inagreement with the results obtained by Feldman [13]from gravimetric measurements on replacement of water by propan-z-ol and methanol in hydrated cementpastes. Feldman found a linear behavior between theamount of water being replaced vs. the square root ofreaction time:
thus dividing the samples in two groups. A fillingfactor of 60% for wic = 0.40 is in agreement with earliermeasurements [3]. The difference in filling factors canbe rationalized in light of the difference in pore sizecharacteristics of the two groups. HCPs with wic ratiosless than about 0.40 have a pore system dominated bymicro- and mesopores that are intrinsic to the hydratedcement gel. At higher wic ratios, coarser capillarypores occur, due to excess water that does not take partin the hydration process. The results from liquid exchange indicate that ethanol easily enters the macropores, but has only partial accessibility to the microporestructure and finer part of the mesopore structure. Thereason for this, we believe, is connected to the size ofthe ethanol molecule, which is then the factor determining the maximum degree of filling of the pore system.As the filling factor is observed to be the same in 503and 504, it may be argued that the pore systems in thesesamples can be described by the same relative distribution of micro- and mesopores. This conclusion seems tocontradict the arguments presented by Mikhail et al.[11] using Brunauer, Emmzt, Teller (BET) measurements that the smaller pores (with diameters up to 80A) increase in width with increasing wic ratio. Apossible explanation for this discrepancy is that ethanolis larger and has potentially different surface chemistrytowards the pore walls compared to Nz (which wasused in the BET measurements). Work to clarify thesesubtle but significant differences is in progress in ourlaboratory by using probe molecules of different sizes.Another point of concern is the necessity of predryingthe specimens when using the BET technique, whichmight affect the pore size distribution.
A question of concern is whether water is still present
I~. = k· i"10
(3)

Advn Cern Bas Mat1998;8:108-11 7
Ethanol Diffusion in Hydrated Cement Pastes 11 3
..
18
1 6
14
.. 1 2
e....:Q.
O B
0,.
0 <
0 2 " .. .'. .
.. ,.' ..OtP¢90.
TABLE 2. Determination of 1= and D in eq 6 by a nonlinearleast squares fit to the data presented in Figure 2
Dtcm//s) Correl. Coef£.Sample 1
0010- 8 (r)
SlO 1.108 ::':: 0.015 59.0::':: 4.6 0.9927S06 0.676 ::':: 0.007 23.4::':: 1.4 0.9960S04 0.336 ::':: 0.004 4.92 ::':: 0.22 0.9967S03 0.217 ::':: 0.013 2.65 ::':: 0.46 0.9751Sl 0.991 ::':: 0.026 12.8::':: 0.14 0.9881S2 0.998 ::':: 0.023 43.8::':: 0.57 0.9978
N ote: Samples S1 and S2 are taken from reference 5 and included for comparison.
' 0 ' 00 1000
since the samp le is initiall y saturated w ith water andthus contains no ethanol.
where Co is the (constant) concen tra tion of ethanol atthe cement/etha nol surface at any time t. Th e ini tialcondi tio n sa tisf ies the equa tion:
(5)
(6)( ( )'I cc 1 tI~ = .1 - 4 "~l a~ Exp .-a ~D a2 ) ,
where C is the Laplace transform of C. Equation 5rep resents the Bessel d ifferential equa tion and can besolved analytically . By taking the inverse Laplace transform of C, the concentration C(r, t ) a t any time t an d anyposition r can be determined. The total concentra tion ofethanol in the sa mple at time t must be determined byin tegrating [15] C(r, t) wi th respect to r fro m r = 0 to r =
a:
The Lap lace tran sform of eq 4a under the specifiedconditions described by eqs 4b and 4c gives [14]:
wher e I", is the intensit y at equilib rium (infinite time).The terms a n are the positive roots of Jo(aa n) = 0, whe refo is the zero-order Bessel function of the first kind .Equ a tion 6 converges slowly, so it has been necessary touse eight terms in the model fit. The a" va lues are at =
2.405,02 = 5.520, 03 = 8.654, 0.. = ] 1.79, Os = 14.93, 06= 18.07, 07 = 21.21, and O il = 24.35. Thus, tw o ad jus table parameter s, 0 and I= (which is a relative factorconnected to the amoun t of pore liquid in the d ifferentsamples), are in volved in the curve fitting. The resultsof th is nonlinear least squares fit are summarized inTabl e 2 and represented by the solid curves in Figure 3.The d iffusion coeffi cients determined for the fou r sa mples S03, 504, 506, and 510 ar e, wi thi n a 95% confidenceinterval, significantly d ifferen t. An in teres ting observation is that the diffusion of ethanol in sa m ple 52(preheated) is almost th ree tim es faste r than SI (virgin) .This is in ag reemen t wi th earlier work [16,17] suggesting that d rying red uces the intern al microsurface areaof the HCr, im plying an opening of the p ore system onpreh eat ing.
The measured exchange rate in sa mp le SI is tw o to
(4a)
(4c)
(4b)
Time lsI
C( r = a, t) = Co,
C(r, t = 0) = 0,
FIGURE 3. Average 13C peak area of methylene and methylgroups in ethanol vs. time during diffusion of the ethanol intohydrated cement pastes, 503 (,0,.), 504 (.), 506 (0), and 510 (0).The dotted and solid lines are calculated by fitting eqs 3 and6, respectively, to the experimental data by a nonlinear leastsquares technique. See text for further details.
where WI and W= are the amounts of alcohol in thesam p le at time t and at infin ite time, respectively. 0 isthe d iffusivity and 2L is the thickness of the sam ple.
From these cons idera tions w e conclude that the diffusion can be exp ressed by Fick 's second law, wh ich incylind rica l coord ina tes can be w ritten [12]:
where 0 is the diffusion coefficient and r is the di stancefrom the center of the cylind rical sam p le. C is theconcentra tion of etha nol at time t at a d ist ance r fromthe center of the cylinder. In order to find a uniquesolu tion of eq 4a, bou ndary cond itions and in itialcondition s have to be specified . Since the cylindricalcement sam ple (a cylinder of ap proximate di am eter andheight of 5.5 mm and 20 mm, respectively) is confi nedin an infini te reservoir of eth anol, the boundary condition can be written as:
114 H.C. Gran and E.W. Hansen Advn Cem Bas Mat1998;8:108-117
where n, represents the number of moles of water (i =
H20) and ethanol(i = E), respectively. M; is the corresponding molecular weight of species and mT is thetotal amount of ethanol and water in the sample. Thetotal carbon and proton NMR intensities, If and I~, canbe expressed by eqs 7b and 7c:
The factors 2 and 6 in eq 7b originate from thenumber of protons of the water molecule and theethanol molecule, respectively.
The D20-saturated cement paste, 52, contains noobservable water protons and makes it possible todetermine the kH Ikc ratio by combining eqs 7b and 7c,with nH,O = 0:
(7c)
(7a)
(7b)
(7d)
2k H 6kH - [Hf1u ,o + f1E - T
1H- and 13C-NMRThe BC data only give information about the ethanolcontent. A direct measurement of the ethanol/waterratio requires observation of both IH_ and 13C-NMRintensities. If fast exchange conditions are valid, both]H and 13C signal intensities (area) are directly proportional to the number of molecules present. The numberof moles of any species can thus be determined if theproportionality constants are known. Sample 51 wassaturated with H20 and sample 52 was presaturatedwith D20. The proportionality factors were determinedsimply by combining the observed proton and carbonintensity vs. "reaction" time.
Equations 7a through 7c are generally valid andmake it possible to determine the proportionality factors 1(1 and kC relating the proton and carbon NMRintensity to the number of moles of protons and carbonsin the system, respectively:
200E-07
three times higher than in sample 504, although the wicratio is the same. This is rationalized as samples 51 and52 were only 3 months old against 3 years for samples510 to 503. The observed difference fits well with theobservation that the pore structure in cement pastebecomes finer and denser as the hydration processprogresses.
vdc- ratio
OOOE+OOL-.~~~~
o 01 0,2 0.3 0.4 05 0,6 0.7 0.8 0.9
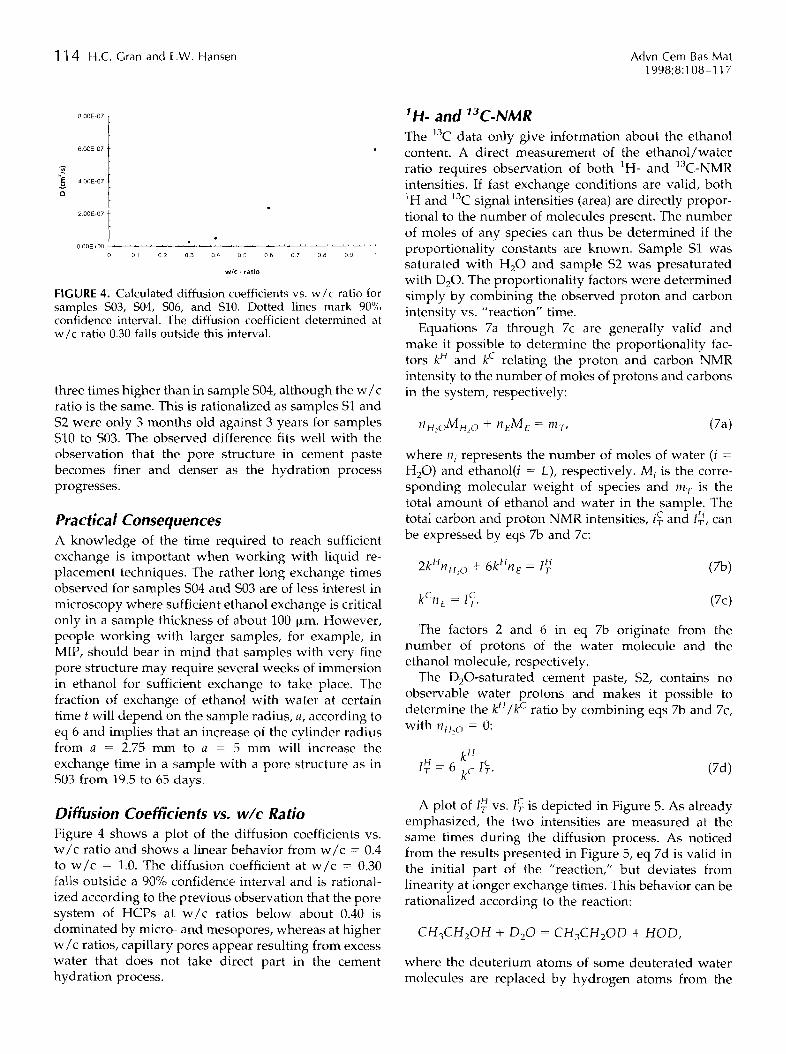
FIGURE 4. Calculated diffusion coefficients vs. w / c ratio forsamples 503, 504, 506, and 510. Dotted lines mark 900
;\,
confidence interval. The diffusion coefficient determined atw / c ratio 0.30 falls outside this interval.
~
~ 4.00E-07
"
fiOOE-O?
BODE-O?
Pracuca/ConsequencesA knowledge of the time required to reach sufficientexchange is important when working with liquid replacement techniques. The rather long exchange timesobserved for samples 504 and 503 are of less interest inmicroscopy where sufficient ethanol exchange is criticalonly in a sample thickness of about 100 urn. However,people working with larger samples, for example, inMIP, should bear in mind that samples with very finepore structure may require several weeks of immersionin ethanol for sufficient exchange to take place. Thefraction of exchange of ethanol with water at certaintime t will depend on the sample radius, a, according toeq 6 and implies that an increase of the cylinder radiusfrom a = 2.75 mm to a = 5 mm will increase theexchange time in a sample with a pore structure as in503 from 19.5 to 65 days.
Diffusion Coefficients vs. wlc RatioFigure 4 shows a plot of the diffusion coefficients vs.w / c ratio and shows a linear behavior from wic = 0.4to w / c = 1.0. The diffusion coefficient at wic = 0.30falls outside a 90% confidence interval and is rationalized according to the previous observation that the poresystem of HCPs at wic ratios below about 0.40 isdominated by micro- and mesopores, whereas at higherwic ratios, capillary pores appear resulting from excesswater that does not take direct part in the cementhydration process.
A plot of [~ vs. If is depicted in Figure 5. As alreadyemphasized, the two intensities are measured at thesame times during the diffusion process. As noticedfrom the results presented in Figure 5, eq 7d is valid inthe initial part of the "reaction," but deviates fromlinearity at longer exchange times. This behavior can berationalized according to the reaction:
where the deuterium atoms of some deuterated watermolecules are replaced by hydrogen atoms from the

Advn Cem Bas Mat1998;8:108-11 7
Ethanol Diffusion in Hydrated Cement Pastes 115
3.5
0 5
2 s
, 8161.4' .2oC 0 .4 0.6 0 ,8
o+--,--,--,---+---+---+---+--~--+----<
om(T)/ldT)
9<J
80
70
60
§' 0
40
30
>0
' 0
10 20 30 40 50 60 70
IdT)
FIGURE 5. Total proton intensity, [H(T), vs, total carbonintensity, [c(T) , as measured during the d iffusion of ethanolinto the D20-saturated cem ent paste 52. The straigh t line isdetermined by a linear least squares fit using eq 7d .
FIGURE 6. The plot shows [~ /[~ vs. mr/[~' From the linearleast squares fit, it is possible to determine kH
.
hydroxyl group in the ethanol molecule. Thus, some ofthe protons disappear as HOD, which diffuses out ofthe solution, and renders the proton intensity less thanwhat is predicted by eq 7b. Only the intensities observed during the first 3 hours are therefore used tocalculate kl-/ / kC in eq 7d. A linear least squares fit to theobserved data (covering the first 3 hours) is representedby the solid line in Figure 5. The slope is 1.264 ::'::: 0.051and the intercept with the Y-axis, 0.42 ::'::: 0.72. 90%confidence interv als are used to spec ify uncertainties .
In the case of ethanol d iffusing into a water-satura tedcement paste (51), all three equations (7a through 7c)must be combined, giving:
(7e)
Figu re 6 shows I~ /I~ vs . mT/I~, and makes it possible to determine 0 by a linear least squares fit. 2kH
/
MH,? rep resents the slope and (6 - 2 MdMH,O) kH / ke
the mtercept. The value of 0/kC, as previously deter
mined, was substituted in the second term of eq 7ebefore curve fitting . The results are summarized inTable 3.
The dataset from the deuterated sample 52 was usedto calculate 0 and kC
. Using the IH dataset from sample51 resulted in a considerably larger uncertainty in thedeterminat ion of kC (kc = 97.3 ± 42.3 area/mg).
Then, entering the equilibrium va lue of I~ and I~ for52 and using kC = 69.80, gives ffl T = 23.0 mg, which is8% lower than the gra vimetrically determined va lue of24.9 mg . This difference of 8% is acceptable within theexperimental uncertainty in NMR intensity, which isbetween 5% and 10%. It may thus be concluded that therem aining pore volume (not containing ethanol) is
occupied by water, which is approximately 40% (volume by volume) at w / c = 0.30 and 0.40 and approximately 10% at w / c = 0.60 and 1.0. These values are wellbelo w the water content [7] where damage can occur tothe pore structure through drying due to internal forcescreated by the water liquid meniscus. It thus shows thatsufficient exchange (using ethanol) to avoid damagemay be achieved in the w / c rati o rang e from 0.30 to 1.0.
In the next section an estimate of the mole fraction ofethanol, XE, from dec onvolution of the IH-NMR spectrawill be discussed .
Deconvolution of 1H-NMR SpectraIn this section, preliminary work to correlate IH-NMRchemical shifts to the mole fraction of ethanol is presented. The proton spectra sampled during the exchange of ethanol with water showed mainly a broadpeak with no obse rvable fine structure (Figur e 7). Inaddition to proton-proton dipolar interaction , thebroadening of the lines is cau sed by a combinat ion of:(1) field inhomogeneity, originating from magnetic susceptibility differences between the cement matrix andthe confined liquid; (2) exchange of protons betwe enwater molecules and hydroxyl protons of ethanol; and(3) a reduction in molecular mobility due to pore wallrestrictions. As mentioned earlier , the proton NMRspectrum is expected to be composed of onl y three
TABLE 3. Determination of calibration factors kH and kC fromobserv ed proton and carbon in tens ities vs . diffusion of ethanol into wa ter satu ra ted cement pastes (see eq 7e)
Calibration Factor Value
0.2151 :': 0.001515.01 :': 0.4269.80 :': 0.50

116 H.C. Gran and E.W. Hansen Advn Cern Bas Mat1998;8:108 -11 7
r,.:M'~~~0~~~ 43205
.~.~!~-
1\r:J bI . CH3
: Vb
.....~~1825 s
E 6]Co 1.!:..~ 5 5
5~Xo'0 4 .5~
:E.."fi's..s: 3 .5U
3 I
a a 1 0.2 0 .3 0.4 0 .5 0 .6 0.7 0.8 0 .9
Molefraction of ethanol in water
FIGURE 8. Chemical shift of the OH/H20 resonance vs. molefraction of ethanol /water mixtures within a cement paste (5]),as determined during the exchange of water with ethanol.
20 10 o -10 -20
CHEM ICAL SHIFT (ppm)
FIGURE 7. IH-NMR spectra at two different times dur ing thediffusion process, showing the peak shapes of the differentresonances, as determined by a nonlinear least squares technique. See text for further details.
lines, correspondi ng to methyl, methylene, and OHIH20 prot ons, respectively. The re are two common lineshape functions found in spectroscopy, th e Lorentzianline sha pe and the Gaussian line shape [18]. We have noreasonable arguments to believe that the line shape ofthe methyl and methylene peaks deviate significantlyfro m the purely Lorentzian line shape functions observe d in bulk liquids. The OH /H20 resonance peak,however, involves an exchan ge of OH protons andwater p rotons and might therefore not be adequatelydescribed by a purely Lorentzian line shape fun ction.Mo reover, since the distribut ion of ethano l and wa tervaries both in time and space, we believe-to a firstapproximation- that the overall line shape of thesep rotons can be better described by a Gaussian functionra ther than a Lorentzian fun ction . A preliminary fit ofthe obse rve d spectra usin g a sum of two Lorenzian andone Ga ussian line shape fun ctions suggested that thechemical shi ft difference between the methyl and themethylene protons to be constant and equal to 2.42ppm. Also, the linewidth (at half height) of the se peakswere found-within experimenta l error- to be cons tan tan d eq ua l to 5.44 ::!:: 0.50 ppm.
Based on these preliminary findings and th e constraint tha t the intensity ratio be tween the CH3 and theCH2 peaks must be 3:2, all the spectra were refittedunder th e previously mention ed constraints I conditions. This procedure enabled us to stabilize the com-
putations considerably and showed that the linew idthof the OH/HzO peak was nearly cons tant (7.7 ppm),and that the chemical shift increased with increasingetha no l concentration (Figure 8), which is also observedin wa terI ethanol bulk mixtures in our laboratory. Thisempi rically derived correlat ion between the chemicalshift an d ethanol concentration (Figure 8) makes itpossible to est imate the concentration of ethanol in thepore system of the cement paste by simply performinga curve fit of the obse rve d IH-NMR spectru m under thecondi tions outlined previously.
A more detailed and comprehensive analysis of theOH /HzO peak line shape is in progress using methanolinstead of ethanol.
ConclusionsA linear relationship betw een 13CNMR peak intensitiesand gravimetrically determined amount of ethanol inside the pore system of HCPs is observed for w Ic ratiofrom 0.30 to 1.0. Although cement pastes made withd ifferen t wic ratios exhibit different relative amountsof micropores and capillary pores resulting in a va ryingaverage environment expe rienced by the pore fluid , noobservable effects on 13C-NMR peak intensities resulting fro m such variations we re present in the wi c rati orange used. Quantitative 13C-NMR ma y therefore beapplied success fu lly for etha no l within the pore structure of HCPs.
The d iffusion of etha nol was shown to be describedby Fickian d iffusion, ass uming one-d imensiona l d iffusion under perfect sink bounda ry conditions.
The diffusion coefficients determined for the foursamples 503, 504, 506 , and 510 are significantly di fferentand vary between 2.65 X 10- 8 forw/c = 0.30 and 5.9 X10- 7 for wic = 1.0.

Advn Cem Bas Mat1998 ;8:108 -11 7
For the 5.5 X 10 mm cylindrical samples, the timeneeded to reach 90% (t90) and 95% (t9S) of maximumpossible exchange is between 1 to 2 da ys for the samplewith the higher w / c ratios and 2 to 3 weeks for the twodenser samples. This difference should be kept in mindwhen working with larger samples, for example, inMIP. Due to the exp( - Dt / /.2) correlation between thefraction of exchange, exchange tim e, and sample radius,an increase of sample radius to 5 mm will increase theexchan ge time in a sample with pore structure like 503from 19.5 to 65 days.
The maximum achievable filling factor, F(%), separates the samples into two groups . F(%) is calculated toapproximately 60% for samples dominated by microand mesopores (w / c = 0.30 and 0.40) and 90% forsamples that additionally contain capillary pores (w /c = 0.60 and 1.0). The pore size d istribution at the twow / c ratios 0.30 and 0.40 seems to be similar whenconsidering the rat io between the volume occupied byethanol and the remaining volume still occupied bywater.
There is a linear relationship between D and w / crati o in the w / c ratio range from 0.40 to 1.0. w / c ratio0.30 falls outside the 90% confiden ce interval.
The mole fraction of ethan ol wa s determined fromthe observed carbon and proton intensity vs . react iontime by comparing H20-saturated and D20-saturatedsamples. Water was found to occupy the remainingvolume not accessible to eth an ol. In the tested w / c ratioran ge and at the endjof the exchange process, the wa tercontent is below the values where damage to the p orestru cture normally occurs due to internal tension.
An empirical relation between chemical shift of theOH/HzO peak and mole fraction of ethanol is found
Ethanol Diffusion in Hydrated Cement Pastes 117
and makes it possible to estimate the mole fraction froma simple spectral analysis.
References1. Feldman, R.F.; Beaudoin, J.J. Celli. Cancr. Res. 1991, 21,
297- 308.2. Bager, D.H.; Sellevold , E.J. Cem. Callcr. Res. 1979, 9,
653-654.3. Gran, H.C Cem. Caner. Res. 1994, 25, 1063-1074.4. Sandstrom, M. Swedish National Testing Institute, Report
SP-AR 1988: 43, 1988, 31; or NORDTEST-Build No. , 677687.
5. Gran, H.C; Hansen, E.W. J. Magn. Reson. Imaging1996, 14,903-904.
6. Taylor, H.F.W. Cement Chemistry; Academic Press: NewYork, 1990.
7. Powers, T.C; Browneyard, T.L. Res. Labs. Portland CementAssociation, Bulletin 22 (March 1948).
8. Sanders, J.K.; Hunter, B.K. Modem NMR Spectroscopy: AGuide for Chemists; Oxford University Press: New York,1988.
9. Bhattacharja, S.; Moukawa, M.; D'Orazio, F.; [ehng, J.;Halp erin, W.P. Adv. Cenl. Based Mater. 1993, 1, 67-76.
10. Winslow, ON.; Diamond, S. ]. Mater. 1970, 5, 564-585.11. Mikhail, R.S.; Copeland, L.E.; Brunauer, S. Canad. J. Chern.
1964, 42, 426-437.12. Ritger, P.L.; et al. ]. Controlled Release 1987, 5, 23- 36.13. Feldman, R.F. Cenl. Caner. Res. 1987, 17, 602-612.14. Abramowitz, M.; Stegun, I.A. Handbook of Mathematical
Functions. Dover Publicat ions: New York, 1970.15. Wilson, A.H. Phil. Mag. 1948, 39, 48-58.16. Hun t, C M.; Tomes, L.A.; Blaine, R.L.J. Res. Nat. Bur. Std.
1960, 2, 163--169.17. Pow ers, T.C; Copeland, L.E.; Hayes, J.C; Mann, H.M.
ACI ]011 mal, 1954, November, 285-298 .18. Shaw, D. Fourier Transform NMR Spectroscopy; Elsevier
Science: New York, 1976.
Related Documents