Fan Testing at Malabar Odor Control Site, Sydney Roy Singh 7 th February, 2011

110207 Fan Testing at Malabar Odor Control Site Sydney
Jul 16, 2015
Welcome message from author
This document is posted to help you gain knowledge. Please leave a comment to let me know what you think about it! Share it to your friends and learn new things together.
Transcript
Fan Testing at Malabar Odor Control Site, Sydney
Roy Singh
7th February, 2011
Page 2 of 2
INTRODUCTION
The purpose of this report is to capture the knowledge, skills and lessons learnt when fan
tests were done to determine its performance at the Sydney Water Odour Control Site in
Malabar, Sydney. Often the data provided by the manufactures regarding the
performance can be misleading. This could be due to the way the test was done by the
supplier or the data provided was obsolete. Tests were required to be carried out to
determine the base line before and after the refurbishment and also to determine if the
current fan or a pump can be used when subjected to elevated duty points.
There are situations where the test rig set up in house is not possible due to the size of the
system. A good example is the Malabar Odour Control Project in Sydney. The fan
assemblies were just too large for a temporary test rig to be set up, however, tests were
carried out with the fans in its installed arrangement and the testing method applied,
provided results which were comparable with the factory data and decisions could be
made with high level of confidence.
It is also important to understand the balancing theory of rotating discs so that the balance
class of the impeller of a blower or a pump can be determined correctly. For example an
impellor balanced in a balancing machine on a short spindle due to machine size
constrains, will not maintain the same balance class if installed on a longer shaft where
the distance between the locating bearings and the impeller is greater. The moment acting
in such installed situation will be greater, proportional to the distance apart.
This report describes some basic theory on pumps, methods to measure flow and
pressures, basic theory on balancing of rotating discs and lessons learnt from Malabar
Odour project while conducting fan testing.
For further reading on pipe losses and balancing theory, literature can be obtained from
books mentioned in the Reference Section of this report.
Page 3 of 3
CHAPTER 1
FAN AND SYSTEM CHARACTERISTICS
1.1 Pressure Drop in Pipes (system resistance)
The term system resistance (graphically shown as system curve) is the sum of pressure
losses in a system of pipe work which transports fluid from point 1 to point 2. The
resistance is a function of the configuration of pipes and the fittings used such as elbows,
valves etc. and pipe elevations.
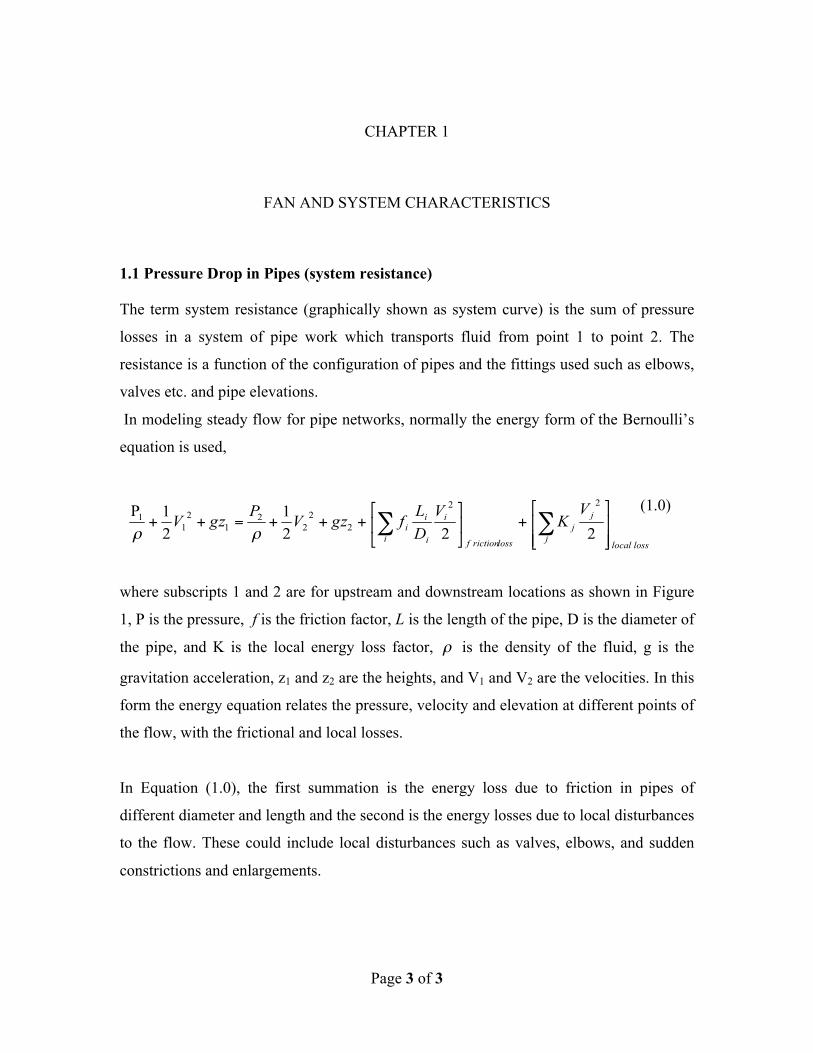
In modeling steady flow for pipe networks, normally the energy form of the Bernoulli’s
equation is used,
where subscripts 1 and 2 are for upstream and downstream locations as shown in Figure
1, P is the pressure, f is the friction factor, L is the length of the pipe, D is the diameter of
the pipe, and K is the local energy loss factor, is the density of the fluid, g is the
gravitation acceleration, z1 and z2 are the heights, and V1 and V2 are the velocities. In this
form the energy equation relates the pressure, velocity and elevation at different points of
the flow, with the frictional and local losses.
In Equation (1.0), the first summation is the energy loss due to friction in pipes of
different diameter and length and the second is the energy losses due to local disturbances
to the flow. These could include local disturbances such as valves, elbows, and sudden
constrictions and enlargements.
(1.0)

Page 4 of 4
Z 1
Z 2
1
2
Figure 1 Flow in pipe from point 1 to point 2
Page 5 of 5
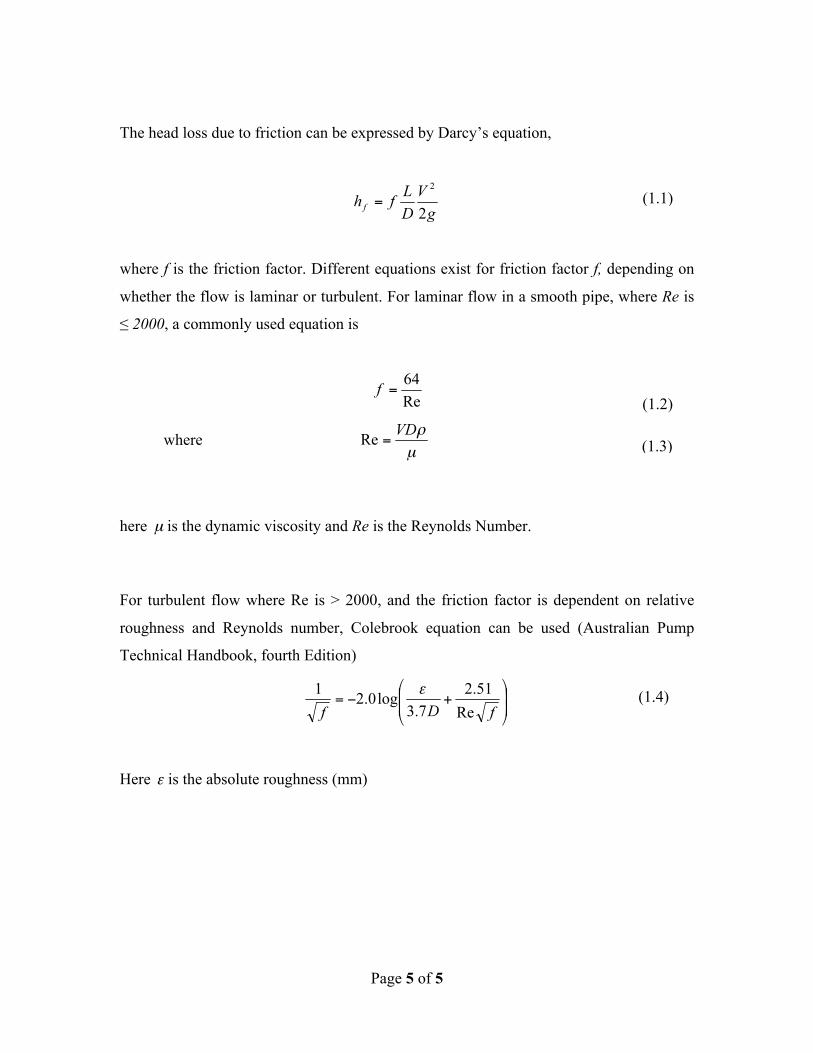
The head loss due to friction can be expressed by Darcy’s equation,
where f is the friction factor. Different equations exist for friction factor f, depending on
whether the flow is laminar or turbulent. For laminar flow in a smooth pipe, where Re is
≤ 2000, a commonly used equation is
where
here is the dynamic viscosity and Re is the Reynolds Number.
For turbulent flow where Re is > 2000, and the friction factor is dependent on relative
roughness and Reynolds number, Colebrook equation can be used (Australian Pump
Technical Handbook, fourth Edition)
Here is the absolute roughness (mm)
(2.7)
(1.1)
(1.3)
(1.2)
(1.4)
Page 6 of 6
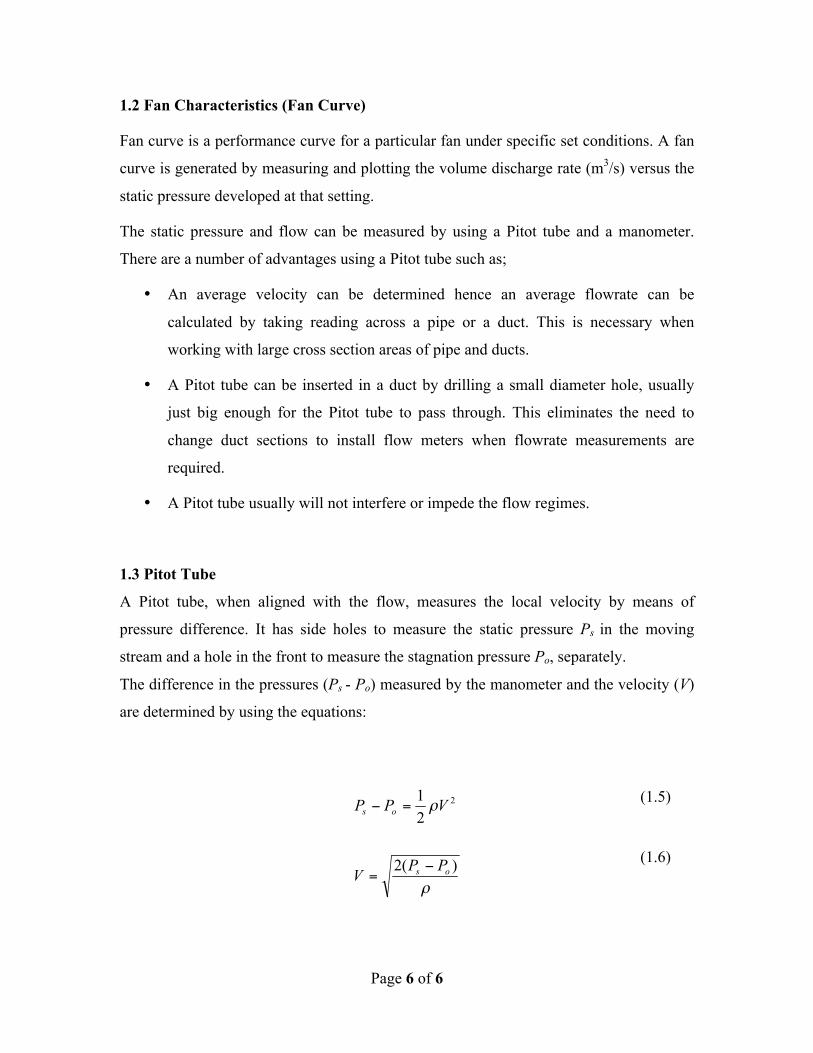
1.2 Fan Characteristics (Fan Curve)
Fan curve is a performance curve for a particular fan under specific set conditions. A fan
curve is generated by measuring and plotting the volume discharge rate (m3/s) versus the
static pressure developed at that setting.
The static pressure and flow can be measured by using a Pitot tube and a manometer.
There are a number of advantages using a Pitot tube such as;
• An average velocity can be determined hence an average flowrate can be
calculated by taking reading across a pipe or a duct. This is necessary when
working with large cross section areas of pipe and ducts.
• A Pitot tube can be inserted in a duct by drilling a small diameter hole, usually
just big enough for the Pitot tube to pass through. This eliminates the need to
change duct sections to install flow meters when flowrate measurements are
required.
• A Pitot tube usually will not interfere or impede the flow regimes.
1.3 Pitot Tube
A Pitot tube, when aligned with the flow, measures the local velocity by means of
pressure difference. It has side holes to measure the static pressure Ps in the moving
stream and a hole in the front to measure the stagnation pressure Po, separately.
The difference in the pressures (Ps - Po) measured by the manometer and the velocity (V)
are determined by using the equations:
(1.5)
(1.6)

Page 7 of 7
Flow rate is then calculated by the equation
Here Q is the flowrate and A is the cross section area of the duct or the pipe.
1.4 Flowrate and Pressure Reading
It is important to know where the flow rate and pressure reading needs to be taken or else
the fan curve generated will not represent the actual performance of the system.
Figure 2 below shows a typical setup.
Flow and pressure reading should be taken with damper positions at fully closed, fully
open and a few positions in between. The number of positions in between fully open and
fully close depends upon how accurate the fan curve needs to be. The damper positions
fully open and fully close are important; this is because the data collated (pressure and
flowrate) in these two positions will be same or very close to factory tests regardless of
the in situ test set up errors. However, care must be taken whilst taking readings when the
damper is in fully open position. There should be no obvious impedance to flow drown
stream of the damper.
It is also important be aware of the different terms used by the fan suppliers when asked
to supply the fan characteristics curve, especially the pressure values.
Quite often the fan curve values shown in the fan curve graphs do not mention whether
the pressure values are Total Static Pressure or Differential Pressure. The fan curves
differ considerably and can be misleading.
These phenomenon are discussed later in the chapters which discusses on lessons learnt
during testing and data gathering conducted at Malabar Odour Control System
(1.7)

Page 8 of 8
Fan discharge
Figure 2 showing typical set up to measure Static Pressure and Flowrate
Fan intake
Pressure measuring point
Fan
Flow rate measuring point
Damper
Page 9 of 9
CHAPTER 2
IMPELLER BALANCING
Balancing is the procedure of measuring vibration and adding or removing weight to
adjust the mass distribution. The goal is to reduce vibration.
Centrifugal force is the operative force that causes vibration due to unbalance. The
magnitude of the out of balance centrifugal force can be calculated by the equation
Here Fc = centrifugal force
M= mass
R = radius from the centre of rotation
= speed in rad/s
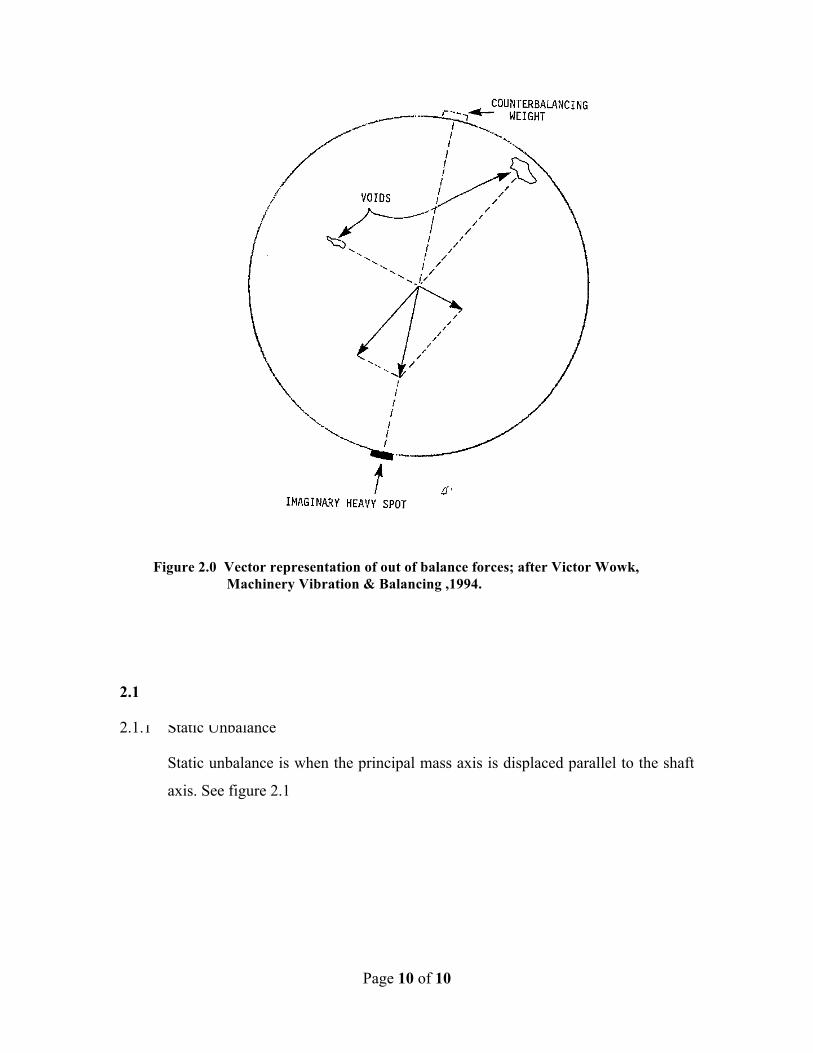
The out of balance centrifugal force can also be represented by a vector and its resultant
therefore can be calculated. The magnitude of the counter weight can thus be determined
and placed to have a counter effect and therefore cancel the effects of unbalance. This is
illustrated in figure 3.
(2.0)
Page 10 of 10
2.1 Terms of unbalance
2.1.1 Static Unbalance
Static unbalance is when the principal mass axis is displaced parallel to the shaft
axis. See figure 2.1
Figure 2.0 Vector representation of out of balance forces; after Victor Wowk, Machinery Vibration & Balancing ,1994.

Page 11 of 11
2.1.2 Quasi –static
Quasi – static is the condition for which the principal axis intersects the shaft axis
at a point other than the centre of gravity.
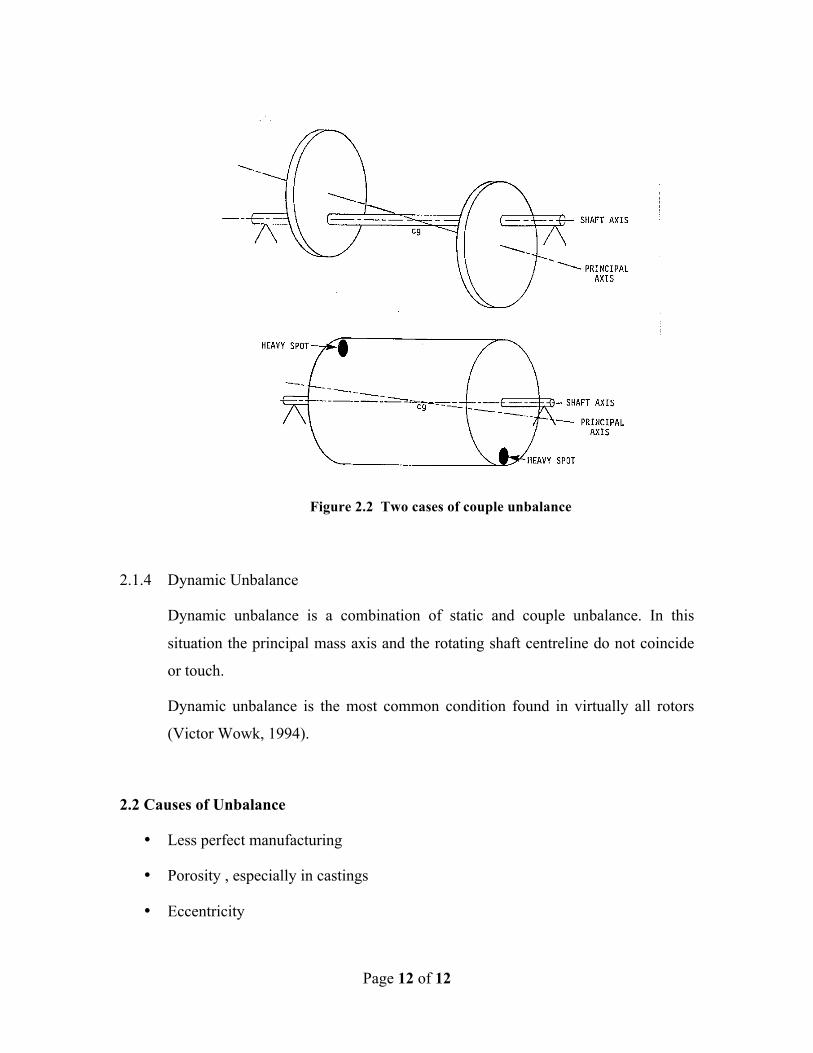
2.1.3 Couple Unbalance
Couple unbalance is when the principal mass axis intersects the shaft axis at the
centre of gravity. See figure 2.2
Figure 2.1 Static unbalance on a disk and on a drum
Page 12 of 12
2.1.4 Dynamic Unbalance
Dynamic unbalance is a combination of static and couple unbalance. In this
situation the principal mass axis and the rotating shaft centreline do not coincide
or touch.
Dynamic unbalance is the most common condition found in virtually all rotors
(Victor Wowk, 1994).
2.2 Causes of Unbalance
• Less perfect manufacturing
• Porosity , especially in castings
• Eccentricity
Figure 2.2 Two cases of couple unbalance

Page 13 of 13
• Keys and Keyways- different manufactures balance with no key, half key, or full
key. When parts are assembled, they could have a built-in unbalance.
• Distortion
• Deposit build-up
• Runout
2.3 Balance Class
The term "unbalance" is referred to two quantities. First is the balancing
acceptance limit of a rotor and is usually called permissible or allowable
unbalance. Second is the existing or residual unbalance in a rotor.
Unbalance amount is expressed as:
where,
U = unbalance amount
m = unbalance mass
e= distance from unbalance mass to shaft/rotor centreline
Balancing standard provides generalized grades for which rotor application, mass,
and speed can tailored for specific cases.
In general, the larger the rotor mass, the greater the permissible residual
unbalance.
To relate the value of the total permissible unbalance, U, to the rotor mass, M, the
term specific permissible unbalance value, u, is defined. It is the maximum limit
of unbalance amount per unit mass of the rotor.
u = (∆eper=) U/M
(2.1)
(2.2)
Page 14 of 14
The permissible unbalance can be determined based on :
1. History and/or experiments done on several similar machines (vibration limits can be
extracted from the history)
2. Pre-specified permissible bearing forces in the stage of bearing selection
3. Standards like 1940/1 (typically followed in industry)
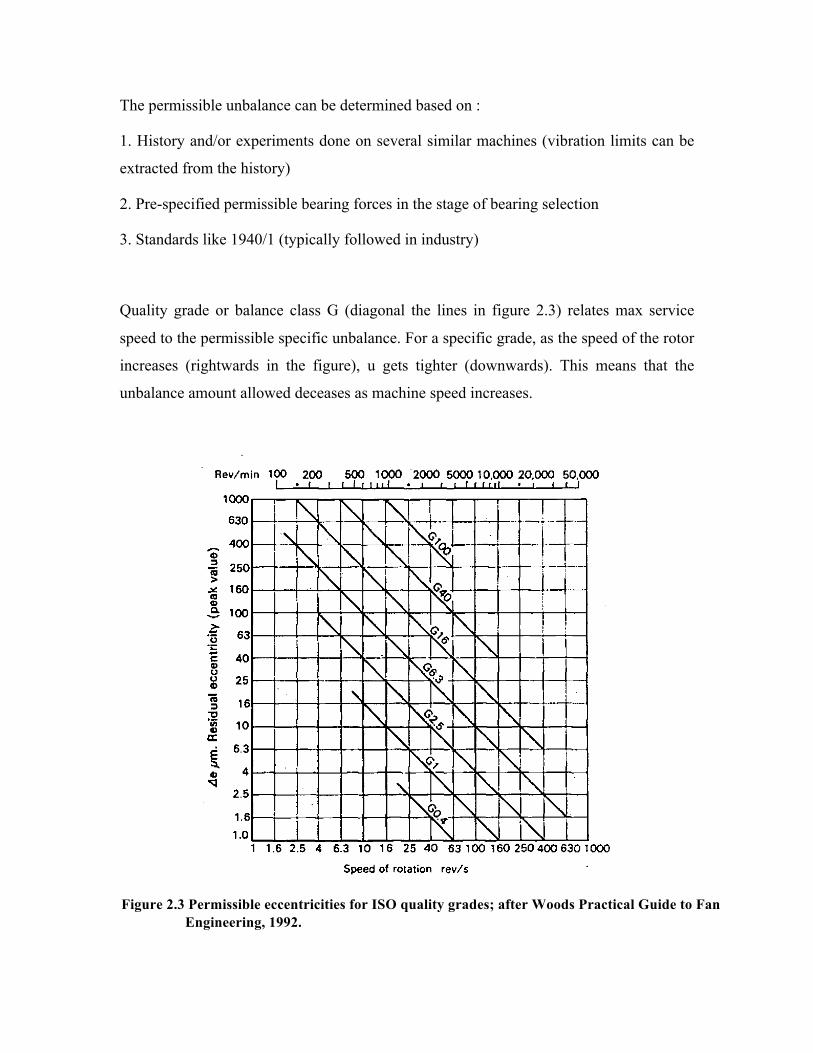
Quality grade or balance class G (diagonal the lines in figure 2.3) relates max service
speed to the permissible specific unbalance. For a specific grade, as the speed of the rotor
increases (rightwards in the figure), u gets tighter (downwards). This means that the
unbalance amount allowed deceases as machine speed increases.
Figure 2.3 Permissible eccentricities for ISO quality grades; after Woods Practical Guide to Fan Engineering, 1992.

Page 15 of 15
2.4 Balancing methods (Static and Dynamic)
Rotating components are balanced either statically or dynamically depending on the type
of out of balance exists as discussed in section 2.2.
Static Balancing is the process of checking a rotor’s balance by seeing if it stops in the
same position when rotated; if it does, a small weight is attached to the rim opposite the
heavy area (i.e. opposite the bottom of the rotor when it stops rotating). A rotor is in static
balance when the weight of the wheel is evenly distributed around the axis of rotation.
Dynamic Balancing is a method of balancing rotating components by using a balancing
machine which spins the component and detects any running -out of true which indicates
imbalance. This method may require balancing to be done on several planes of the
component to balance the effects of coupled unbalance.
2.5 Permissible forces on bearing
One of the contributing factors on bearing reaction forces is the centrifugal force. This
centrifugal force is exerted on the bearing will be proportional to residual unbalance (e).
Therefore the specific permissible unbalance (u) is determined accordingly to comply
with bearing loading criteria.
It must be understood that when the value of u is determined by selecting the class of
balance (G) on a rotor, (as shown in figure 2.3), the reaction forces on the bearings
should be within the limits of bearing specification when the rotor is assembled and run
at the maximum duty speed.
This phenomenon is often misunderstood especially when the rotor is in over hung
position. For this reason only the overhung arrangement is discussed here.

Page 16 of 16
2.6 Over hung Rotors
Figure 2.4 illustrates a vertical over hung rotor. This configuration is one where most of
the dynamic rotor force is increased by the factor proportional to the distance (moment)
from the rotor to the bearing. Mathematically expressed as;
L
Shaft
Bearing
Rotor
Figure 2.4 showing an overhung rotor arrangement

Page 17 of 17
Combining equations 2.0 and 2.2
Here Br = bearing reaction.
(2.3)
(2.4)

Page 18 of 18
CHAPTER 3
LESSONS LEARNT FROM MALABAR ODOUR CONTROL FAN
REFURBISHMENT
This chapter discusses the skills and lessons learnt when fan tests were done to determine
its performance at the Sydney Water Odour Control Site in Malabar, Sydney.
3.1 Malabar Sewerage Treatment Plant
Malabar STP is owned and operated by Sydney Water and is located in the Sydney
municipality of Randwick. The treatment plant provides high rate primary treatment of
sewage generated from a 1.7million equivalent person residential, commercial and
industrial catchment. The plant treats an average daily dry weather flow of approximately
456 ML/d and discharges to ocean through a 3.6 km deep water ocean outfall pipe.
Wastewater treatment facilities are predominately located underground. Sludge
processing, consisting of digestion and biosolids handling, is located above ground.
The existing main odour treatment facility at Malabar STP has poor odour removal
performance due to incoming loads exceeding treatment capacity, and is nearing the end
of its operational life.
The liquid stream odour scrubbing system at Malabar STP treats 180m3/s of foul air, in
six scrubbers, operating in parallel in a Duty/Duty /Duty/Duty/Standby/Standby
configuration. The total capacity of the treatment with all six scrubbers operating is
972,000m3/h of foul air (45m3/s per scrubber).
The scrubber discharge does not meet the requirements of the Department of
Environment Climate Change and Water (DECCW) with respect to odour levels at the
nearest sensitive receptor. A new arrangement to collect the treated air with scrubber
outlet ducts and a tall vent stack allow improved dispersion to the atmosphere.

Page 19 of 19
This upgrade is considered an interim step to extend the asset life of the facility, allowing
SWC to meet its (DECCW) requirements, yet deferring a full upgrade of the system. A
full replacement of the facility is planned to be undertaken at +10 years from this upgrade
(when the plant is at the end of its extended asset life), and is part of the overall Sydney
Water odour management plan for Malabar STP.
The six Odour Control Facility (OCF) wet chemical scrubbers at Malabar sewerage
Treatment Plant are equipped with individual fans. It was required to; (a) determine
whether the current fan were capable to perform at the elevated duty points and (b)
establish a baseline of the performance of the fans.
3.2 Fan Performance Test
The scrubber fans had to be tested in situ since a test rig could not be set up due to its
size. Setting up a test rig of such magnitude would impact the project for time and costs.
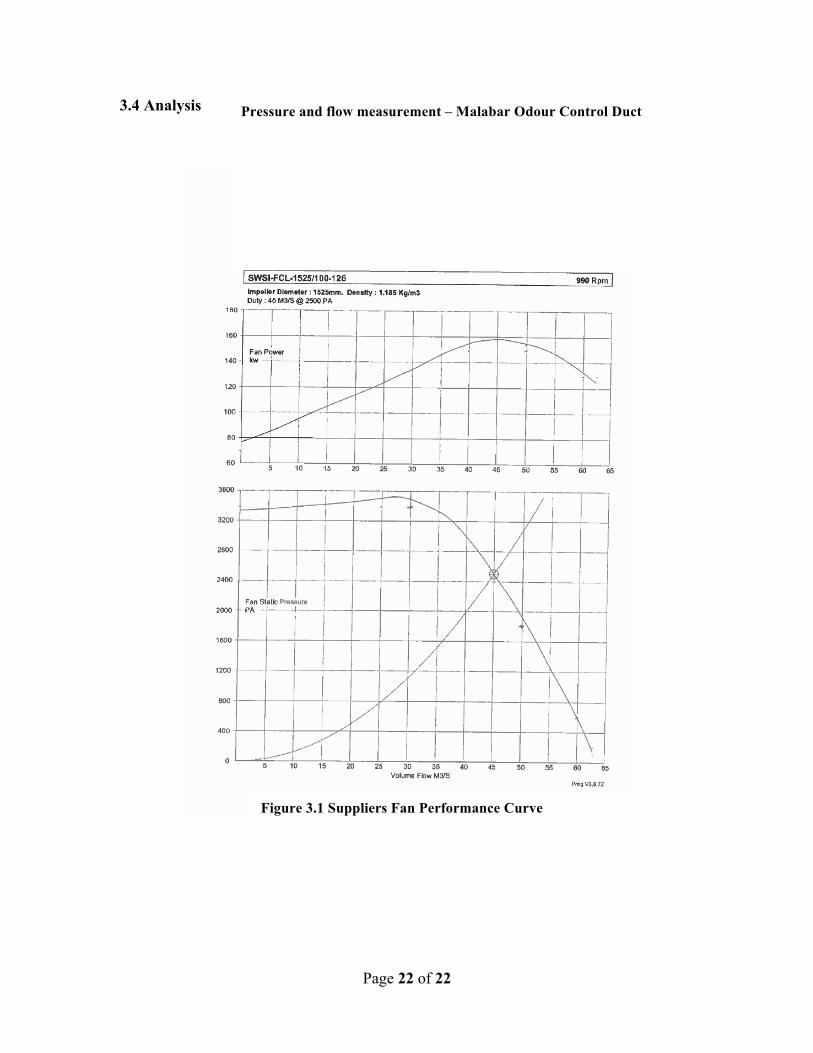
A copy of the manufacture’s performance curve (figure 3.1) of the same model was
requrested so that compassions could be made with the curve generated from test data. It
was realised that the data collated during the test will differ compared to data supplied by
the supplier due to test set up, therefore the tests had to be conducted in such a way so
that this difference was kept to the minimum.
3.3 Test Procedure
The details of the test procedure carried out on the day were:
1. 4 No. holes of 22mm diameter were drilled across the side face of the discharge
duct on one side. These holes were to allow a Pitot tube to be inserted into the
duct to measure the gas velocity in the duct. This allowed for the gas flowrate to
be calculated.
2. With the fan running at test speeds pressure drop across the scrubber was
measured. It was found the pressure drop was very small however this was kept in
mind to be considered when making comparisons with suppliers fan curve.

Page 20 of 20
3. Hydrogen sulphide monitoring instrumentation was removed from the flange on
the discharge ductwork from the fan. The removal of this instrumentation
allowed for the measurement of static pressure on the discharge of the fan without
drilling additional holes into the ductwork.
4. The fan was set to operate at a normal running speed of 900rpm and the
experiment was repeated at a speed of 960 rpm
5. Static pressure and velocity was measured with damper positions at fully open,
33% open, 66% open and fully closed.
6. Gas velocities were measured (along the width as shown in figure 3.0) at four
evenly spaced positions, including the centre of the duct. This was repeated in the
four holes across the face of the duct. The velocity readings were collated and
average value was calculated. The reason for this was that the flow in the duct
was very turbulent and therefore difficult to get an accurate reading.
7. Graphs were plotted, pressure vs flowrate.
Out of the six fans in operation, only two of the fans could be tested. The other fans
could not be shut down due to the duty requirements.
Normally all the fans should have been tested, however, in this instant the data
collated from the two fans showed significant discrepancies when compared to
suppliers data. This lead to a major investigation in order to justify the results
obtained.

Page 21 of 21
Figure 3.0 showing Pitot tube positions
Holes in the side face of the duct for the Pitot tube to go through
Pitot tube positions to determine velocity
Pitot Tube
Manometer Duct
Roy Singh
Page 22 of 22
3.4 Analysis
Figure 3.1 Suppliers Fan Performance Curve
Pressure and flow measurement – Malabar Odour Control Duct
Page 23 of 23
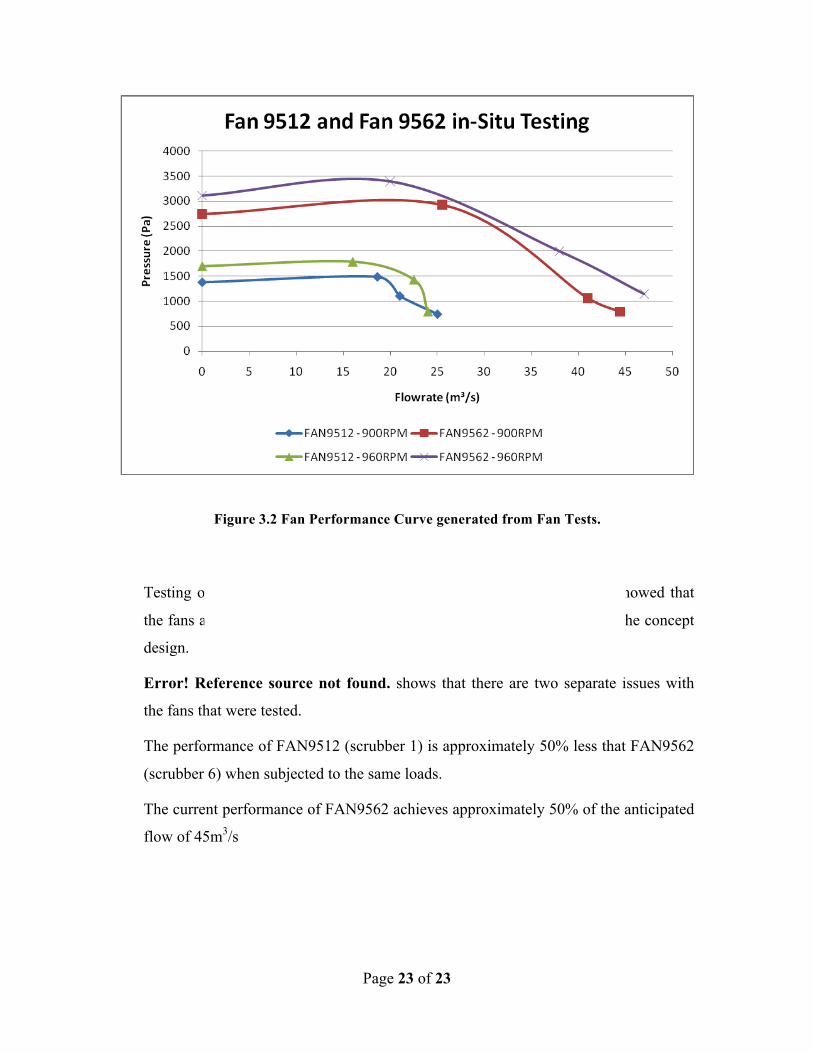
Testing on FAN 9512, and FAN9562 (scrubbers 1, and 6 respectively) showed that
the fans are not performing as the manufacturer’s curves supplied during the concept
design.
Error! Reference source not found. shows that there are two separate issues with
the fans that were tested.
The performance of FAN9512 (scrubber 1) is approximately 50% less that FAN9562
(scrubber 6) when subjected to the same loads.
The current performance of FAN9562 achieves approximately 50% of the anticipated
flow of 45m3/s
Figure 3.2 Fan Performance Curve generated from Fan Tests.

Page 24 of 24
3.5 Investigations and Findings
Further investigation was carried out to find the root causes of the lack of
performance of Fan 9512 . The following issues were identified.
• In inlet cone that directs the flow into the impeller is missing, as shown in
figure 3.3
Missing inlet cone
Figure 3.3 showing inlet cone missing

Page 25 of 25
• The width of the impellers of the fans tested (scrubbers 1 and 6) are
approximately 90mm narrower than the specification of the impeller that
Howden (supplier) provided fan curves for during concept design.
It is not known why these narrower impellers have been fitted or when. Of the 2 spare
fans on site, one impeller is as per the fan curve supplied during concept design, and
one is of the narrower type. The widths of the impellers on the fans for scrubbers 2 to
5 are unknown.
3.6 Impeller Balance Issues
ISO Standard 1940 states that the balance class of a motor rotor shall be within G 2.5 and
any system attached to the motor shaft shall not alter the balance class when subjected to
the working speed range.
Howden (Fan supplier) was questioned on the class of balance of the fan impeller.
Howden replied that all fan impellers were balanced within G 2.5. Howden was further
questioned whether the balance class was maintained when subjected to the speeds and
most importantly the way the impellers were installed, i.e. vertically over hung.
Howden agreed that it such case the system did not retain the G 2.5 balance class, due to
the reasons discussed in section 2.6.
This issue was mitigated by recommending the final balancing to be conducted in situ
with the fan running at its maximum duty speed of 990 rpm.
In situ balancing is a technique commonly used where an accelerometer is place on the
bearing housing and out of balance force thus detected. Further literature on the subject is
available in internet.

Page 26 of 26
CHAPTER 4
CONCLUSION
Fan performance tests were carried out on two Scrubber Fans of Malabar Odour
Control facility. The purpose was to establish a base line of the fan characteristics,
however, after analysing the data other issues were exposed such as critical parts
missing (inlet guide cone), and differences in impeller sizes. It was also realised that
the required speed for the elevated duty point needed to be increased. The speed
required to be increased to 990 rpm from the current speed of 900rpm.
The client (Sydney Water) was concerned when told about the increase in fan speeds.
Their concern was an increase in vibration as a consequence of increase of speed,
which already is a concern at the current speeds.
This is where the client lacked the knowledge in balancing theory. This was discussed
with the client as in chapter 2 of this report. The client was explained that the
vibration severity can be reduced, lower than current levels regardless of the speed.
The supplier was also consulted regarding the findings. It was agreed by the supplier
that the current system is inefficient and there are room for improvements, starting
from a new type of impeller.
The supplier supplied data on an aerofoil type impeller which are more efficient than
the current type by about 10%.
The supplier also agreed to final balance the system at G2.5 in situ.
Having analysed and discussed the findings of the tests it was possible to make a
decision as to which direction to take on the fans. The following decisions were
made;

Page 27 of 27
• Aerofoil type impeller to be used
• Fan speed to be at 990rpm
• Balance class to be maintained at class G2.5 when installed
• Balancing to achieve to G2.5 by final balancing carried out in situ
A Fan Specification was drafted with above statements included in the data sheet for
the project. The aim of the specification was to provide all the relevant technical
information to a supplier so that the supplier could price the works.
Page 28 of 28
REFERENCES
Benedict, R. (1980) Fundamentals of Pipe Flow, 3rd edition. A. Wiley – Inter
Sciences
Crowe, C. T., and Robertson, J.A.. (1985) Engineering Fluid Mechanics, 5th edition.
Houghton Mifflin Company.
Daly, B. B. (1992) Woods Practical Guide to Fan Engineering, 5th edition.
Woods of Colchester Limited.
ISO Standard, 1940, Mechanical Vibration- Balance Quality Requirements for
Motors
Singh, R. K. (2009) A Study of Air Flow in a Network of Pipes used in Aspirated
smoke Detectors, Master of Mechanical Engineering Thesis, Victoria University,
Australia
Wowk, Victor, (1994) Machinery Vibration and Balance Quality
McGraw Hill
Related Documents