1 OUR EMERGING DILEMMA IN LIQUEFIED NATURAL GAS Frank Clemente Ph.D. Senior Professor of Social Science & Energy Policy Penn State University [email protected] 814-237-0787

11 OUR EMERGING DILEMMA IN LIQUEFIED NATURAL GAS Frank Clemente Ph.D. Senior Professor of Social Science & Energy Policy Penn State University [email protected].
Dec 22, 2015
Welcome message from author
This document is posted to help you gain knowledge. Please leave a comment to let me know what you think about it! Share it to your friends and learn new things together.
Transcript
11
OUR EMERGING DILEMMA IN LIQUEFIED NATURAL GAS
Frank Clemente Ph.D.Senior Professor of Social Science & Energy PolicyPenn State [email protected]
2
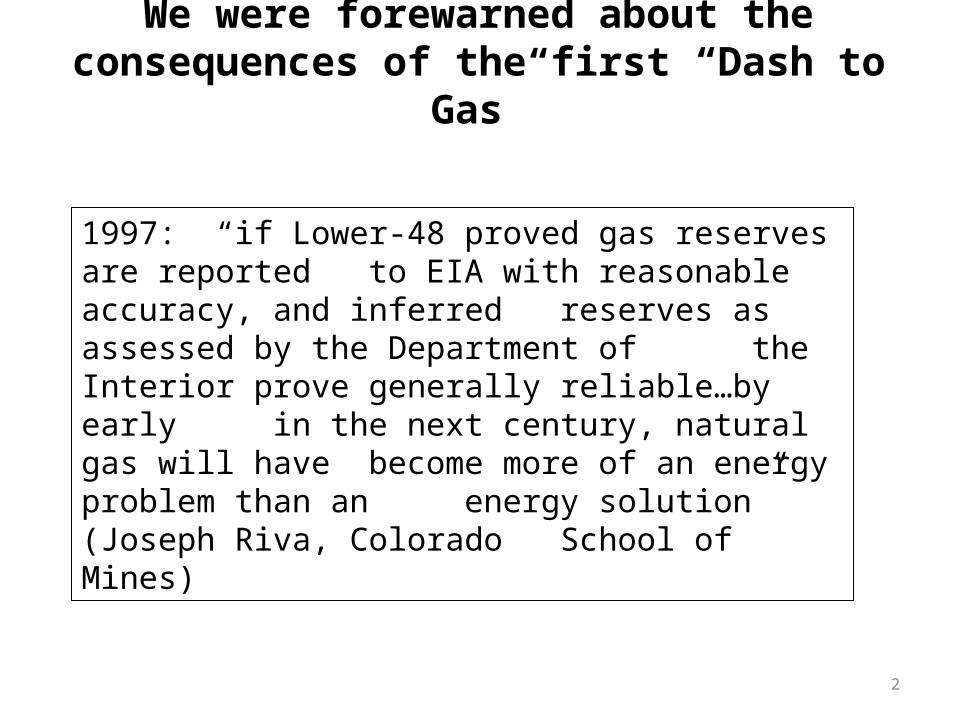
We were forewarned about the consequences of the first “Dash to Gas”
1997: “if Lower-48 proved gas reserves are reported to EIA with reasonable accuracy, and inferred reserves as assessed by the Department of the Interior prove generally reliable…by early in the next century, natural gas will have become more of an energy problem than an energy solution” (Joseph Riva, Colorado School of Mines)

3
Concerns about LNG are not misplaced
1. “U.S. gas productive capacity, like oil, is now in permanent decline”. (Daniel Yergin, CERA, 2005)
2. “The North American markets are now dependent on the growth of liquefied natural gas. If we don’t get LNG, we don’t have a plan B”. (Michael Zenker, CERA, 2005)
3. “Six wildcard nations will ultimately determine the size of world LNG markets – Russia, Iran, Nigeria, Venezuela, Algeria and Libya”. (LNG Express , 2007)
4. “pricing for LNG is being forced towards oil-price parity…China’s recent decision to contract for long term LNG at market prices… may be a turning point” (UBS,2007)
5. “the US is the market of last resort for LNG…we will get the gas Europe and Asia don’t need” (Goldman Sachs, 2008)

4
Our Emerging LNG Dilemma
1. Since 2000, the U.S. has built a vast fleet of natural gas (NG) power plants and over 5 million NG heated homes.
2. Production in the lower 48 states provides almost 85% of our NG but has declined since 2000.
3. Increased demand amidst declining supply has dramatically escalated NG prices for all consumers, including families and industry.
4. Thus, we have built a NG infrastructure where new demand must increasingly be met by sources of NG outside the lower 48.

5
Our Emerging LNG Dilemma (cont’)
5. Canada provides 13% of our NG but will be of little help. Canadian production peaked in 2004 and demand for NG in oil sands development is rapidly growing.
6. The Alaskan Pipeline may or may not be built, but flow is not projected before 2020 and prices will be high.
7. By default, we have made a risky bet on our ability to import Liquefied Natural Gas (LNG) to meet growing demand.
8. There are huge reserves of NG in the world (over 6,000 TCF) but much is “stranded” in remote areas away from existing infrastructure and will be expensive to extract and transport.

6
Our Emerging LNG Dilemma (cont’)
9. Further, much of the world’s NG is concentrated in risky or hostile nations – Russia, Iran and Venezuela have over 45%.
10. Actual LNG supply will fall short of optimistic expectations because liquefaction plants have been cancelled or delayed across the world.
11. And, since Europe and Asia are also increasingly dependent upon NG, the competition for the LNG that is available will be intense.

7
Our Emerging LNG Dilemma (cont’)
12. Prices will be higher than previously projected because major producers such as Qatar are linking new LNG contracts to the price of oil.
13. As the most distant market from virtually all major sources, the U.S. will be forced to pay the highest price.
14. In effect, for the first time in history, the reliability of our electric supply system will be dependent upon decisions made in foreign nations.

88
Reserves of NG are Just As Concentrated As Oil
Top 5 Countries Control 60% of the Resource
Rest of World36%
Russia27%
Iran15%
Qatar14%
Saudi Arabia4%
Syria4%
Rest of World41%
Iraq10%
Iran11%
Kuwait9%
Saudi Arabia22%
Venezuela7%
Oil NG
Source: BP

99
The Steady Drumbeat of Global Natural Gas Demand
•Source: EIA 2007
79
88
104
116
129
141
70
80
90
100
110
120
130
140
Tri
llio
n C
ub
ic F
ee
t (T
CF
) P
er
Ye
ar
1995 2000 2005 2010 2015 2020
“Global demand for LNG could outstrip supply by up to 20 million tonnes a year [by] 2015” Donald Voelte, CEO Woodside Petroleum.

1010
Competition for NG/LNG Will Intensify
Projected growth in NG consumption by region, 2004-2020
1.9
5.4
6.67.0
10.7
5.3
1
2
3
4
5
6
7
8
9
10
11
TC
F
Asia Europe NorthAmerica
EurAsia Asia MiddleEast
“Korea needs to prepare for global LNG war”, "Han Moon-Soo, Korean Gas Company"
OECD Non-OECD

1111
The U.S. Bets On A Brave New World
Where new NG supply came from 1993 - 2006
Where new supply is projected to come from
2006-2019
•Source: EIA
“North America is setting itself to import LNG in large quantities” (IEA, 2007)
Domestic Production, 26%
LNG From Foreign Nations, 74%
Canada, 60%Domestic
Production, 17%
LNG From Foreign Nations, 23%

1212
Draining Trinidad First
0.3%
70%
0.0
0.1
0.2
0.3
0.4
0.5
0.6
0.7
0.8%
Trinidad's share ofglobal NG reserves
Percentage of U.S.imports which were from
Trinidad last 5 years
Ryder Scott Petroleum Consultants recently indicated Trinidad’s proven and probable resources have declined 16% since 2004.
In 2007, National Petroleum Council reported Trinidad had the lowest R/D ratio of 17 exporting countries.

1313
We Will Look To Distant Sources and Pay a Premium
4
8
12
16
20
24
28
32
36
40
LN
G S
aili
ng
Da
ys
East Asia Europe U.S. Gulf U.S. East Coast U.S. West Coast
North Africa West Africa Middle East West Pacific
“The U.S. is the market of last resort for LNG” Credit Suisse Bank
Data adopted from Drewry Shipping and University of Texas
, 2007

1414
Three Nations Will Account for 62% of Global Incremental LNG Supply though 2015
Sources: Goldman Sachs; UBS
16% 20%26%
38%
0%
10%
20%
30%
40%
50%
60%
70%
80%
90%
100%
% O
f G
lob
al I
ncr
emen
tal
LN
G S
up
ply
T
hro
ug
h 2
015
Australia Nigeria Qatar Rest of World
“Qatar… is attempting to secure long term contracts that link pricing to be equal to or above crude prices” (Goldman Sachs, 2007)

15
The Risky Realities of LNG• “Once LNG cargoes hit the water, they’re going to the highest-price
market regardless of the type of contract you have in place”. (Bruce Williamson, CEO, Dynergy, 2007)
• “LNG importing countries in Asia and Europe rely on LNG imports…resulting in a willingness at times to pay prices exceeding those in the U.S. markets in order to have LNG cargoes diverted”. (EIA, 2008)
• “Molecules flow to dollars. Spain paid the equivalent of $14 last summer and the molecule went there and did not come here”. (James Duncan, Director, Conoco Phillips, 2006)
• “Turkey is paying record prices for liquefied natural gas cargoes after Iran slashed exports through a natural gas pipeline”. (Bloomberg News, 2008)

16
U.S. Will Pay the Market Price for LNG
• “The U.S. will have to compete with oil linked markets long term and U.S. prices are now expected to climb with oil.” (WoodMac, 2007)
• “U.S. prices will have to migrate to the top of the heating oil/resid band to keep USA netbacks competitive with western Europe”. (Tristone Capital, 2008)
• “ Korea Gas Corp and Qatar’s Ras Gas…20 year deal was signed in November for LNG at around $11…The price varies as oil prices rise or fall”. (Gulf Times, 2007)
• “if the North American market wants more LNG, prices will have to rise to closer to global levels” (First Energy Canada, 2008)

1717
EIA 2005 Outlook Set the Stage for Optimism
* Actual was only 631 BCF in 2005 and in 2007 was 774
750
1,300
1,800
2,670
3,555
4,330
500
1,000
1,500
2,000
2,500
3,000
3,500
4,000
4,500
Bill
ion
Cu
bic
Fe
et
(BC
F)
Pe
r Y
ea
r
2005 2007 2009 2011 2013 2015
“Strong growth in LNG is expected to continue… with LNG’s share of net imports growing from less than 5 percent in 2002 to 39 percent… in 2010” EIA, 2004
In 2005 EIA projected these increases through 2015.
Source: EIA

18
Cavalier Optimism is Contagious and Ongoing
• 2004: “A tsunami of LNG tankers is headed toward U.S. ports”. (Hill Huntington, Stanford Energy Modeling Forum)
• 2005: “6 Tcf per year … of liquefied gas is pointed toward U.S. markets at delivered prices under $4.50”. (AGA/EEA 2006)
• 2006: “by 2010, U.S. imports [of LNG] will exceed the requirements of either Europe or Asia”. (EPRI)
• 2007: “Florida: LNG to the Rescue”. (CERA)

1919
Optimism All Around: LNG Prices Would be low and stable
3.50 3.753.50 3.50
3.00
3.503.20
2.50
3.00
3.50
4.00
4.50
5.00
5.50
6.00
6.50
7.00
7.50
8.00
Pro
jec
ted
Co
st
Of
LN
G $
/MC
F
U of Texas2003
Exxon 2003 Wood Mac2003
GasTechnology
Institute2004
DeutscheBank 2004
U ofColumbia
2004
Harvard2005
Supply is not resource limited – for inland prices [of] $3.50. The supply curve is flat for a long way (David Nissen, Columbia Univ. 2003)
(7.19) Cost of LNG in 2006

2020
Optimistic Supply Projections to 2008 From as Recently as Three Years Ago Never Materialized
- - - Latest EIA estimates for 2008 is 784 BCF
1,070 1,075 1,124
1,496
1,760
1,984
500
700
900
1,100
1,300
1,500
1,700
1,900
2,100
TC
F/Y
EMF2005
Woodmac2006
PIRA 2006
Jeffries2005
EIA 2005
AGA2005
“The Atlantic liquefied natural gas market faces the risk of oversupply.” "P. Sauquet, VP, Total, 2005"

2121
Optimism Still Persists: Projected Global Supply of LNG in 2015
All projections made in 2007
- - - Current LNG Supply
13.8
14.8 15.0
15.7
16.817.3
18.9
9
10
11
12
13
14
15
16
17
18
19
TC
F/Y
IEA Woodmac EEA/ICF El Pasu GlobalInsight
UBS Rice

2222
Optimism Dominates: Projected North American LNG Imports in 2015
- - - 2007 LNG Import Level = 784 bcf/d
7 7
9
11
13
14
15
16
4
56
7
89
10
1112
1314
15
1617
BC
F/D
EIA IEA Rice EMF EEA/ICS Transcanada Woodm ac CERA
"Flordia: LNG to the rescue" (CERA, 2007)

23
Increasing recognition of supply constraints
• “…the global LNG market points to a future where the supply demand balance becomes increasingly tight as new liquefaction projects suffer continuing delays”. (UBS, 2007)
• “Unfortunately, the supply of LNG around the world is not as plentiful as one would have thought”. (Jim Mulva, Conoco Phillips, 2007)
• Current bottlenecks in upstream production and liquefaction capacity are tightening”. (IEA, 2007)
• Liquefaction capacity is not growing at the same rate as … regasification capacity or global natural gas demand growth”. (CIBC World Markets, 2008)
2424
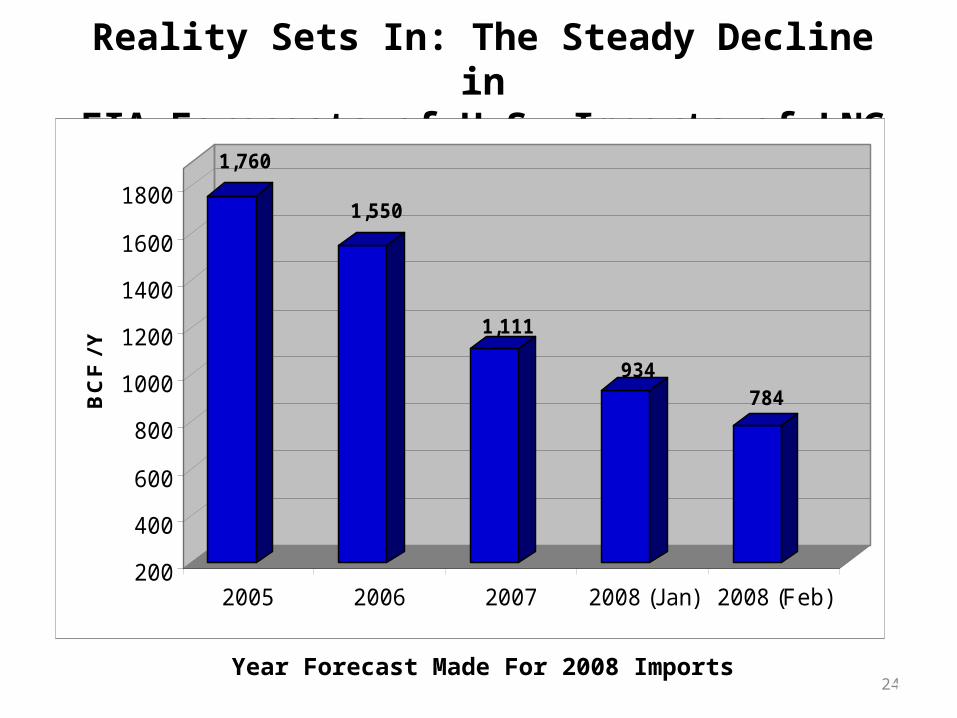
Reality Sets In: The Steady Decline inEIA Forecasts of U.S. Imports of LNG in 2008
Year Forecast Made For 2008 Imports
1,760
1,550
1,111
934784
200
400
600
800
1000
1200
1400
1600
1800
BC
F /
Y
2005 2006 2007 2008 (Jan) 2008 (Feb)

2525
The Sweep of Optimism Fades: EIA Forecasted Imports for 2015
0.83
4.33
2.51
0.00
0.50
1.00
1.50
2.00
2.50
3.00
3.50
4.00
4.50
5.00
2002 Forecast for 2015 2005 Forecast for 2015 2008 Forecast for 2015
LN
G I
mp
ort
s (T
CF
/Y)
42% reduction in forecast in 3 years420% increase in
forecast in 3 years

2626
Construction Costs of Liquefaction Plants are Rising Dramatically
Source: Jensen Associates, December 2007. Estimates by James Jensen
$275
$625
$1,110
100200300400500600700800900
1,0001,1001,2001,300
Co
st P
er T
on
of
Liq
uef
acti
on
Cap
acit
y in
Th
ou
san
ds
of
Do
llar
s
2000 2007 2012
Costs are increasing so rapidly that Jensen Associates have increased cost estimates twice since Dec 2007 (Sansom, 2008)

2727
Escalating Cost of Liquefaction Plants: Key Examples
$3.9B
$7.8B
$4.5B
$12B
$10B
$23B
2
4
6
8
10
12
14
16
18
20
22
24
Co
ns
tru
cti
on
Co
sts
in $
Bill
ion
s
Pluto (Australia) Pluto (Australia) South Pars (Iran)
Original Estimate Latest Estimate
“Costs are going up, and they are going up far faster than anyone expected” Andy Flower, former Senior Adviser to BP Global LNG
South Pars (Iran) Sakhalin II (Russia)
2828
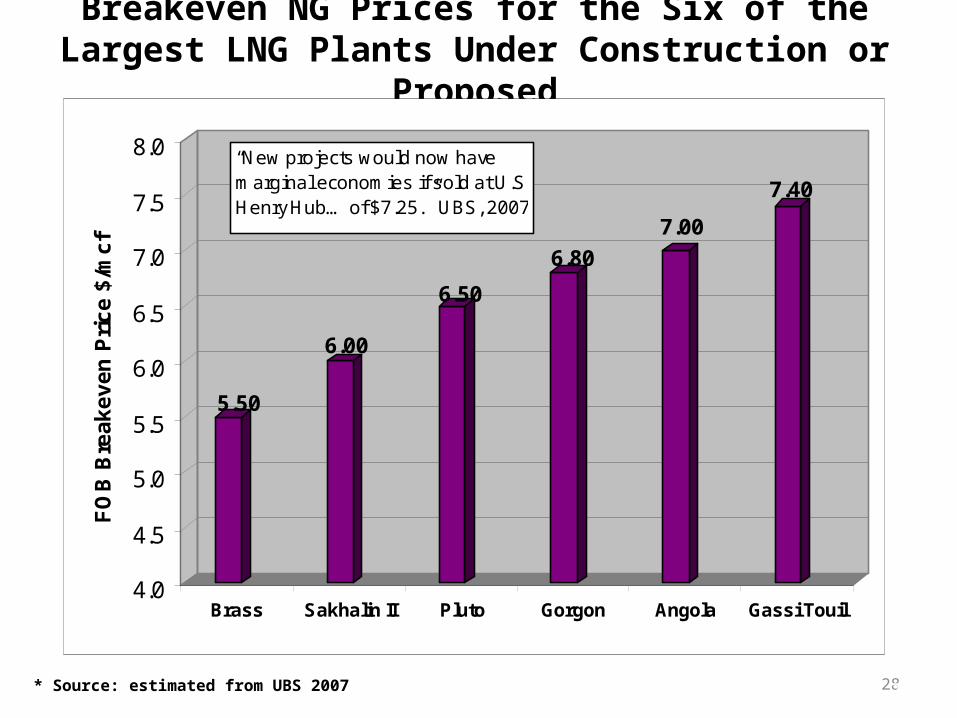
Breakeven NG Prices for the Six of the Largest LNG Plants Under Construction or Proposed
* Source: estimated from UBS 2007
5.50
6.00
6.50
6.80
7.00
7.40
4.0
4.5
5.0
5.5
6.0
6.5
7.0
7.5
8.0
FO
B B
rea
ke
ve
n P
ric
e $
/mc
f
Brass Sakhalin II Pluto Gorgon Angola Gassi Touil
“New projects would now have marginal economies if sold at U.S. Henry Hub… of $7.25.” UBS, 2007
Related Documents