11 March 2021 technicolor.com

Welcome message from author
This document is posted to help you gain knowledge. Please leave a comment to let me know what you think about it! Share it to your friends and learn new things together.
Transcript
11 March 2021
technicolor.com

contains certain statements that
constitute "forward-looking
statements”, including but not
limited to statements that are
predictions of or indicate future
events, trends, plans or objectives,
based on certain assumptions or
which do not directly relate to
historical or current facts.
are based on
management's current expectations
and beliefs and are subject to a
number of risks and uncertainties that
could cause actual results to differ
materially from the future results
expressed, forecasted or implied by
such forward-looking statements.
and description of such risks and uncertainties,
refer to Technicolor’s filings with the French
Autorité des Marchés Financiers.

C3 - Restricted Natixis
4
2020 AT A GLANCE
► As of December 31,
2020:
Liquidity of €432
million
Nominal net debt
reduced by €340
million following the
completion of the
financial restructuring
► Significant momentum in
improving operations,
profitability and cash
generation
► Management team
renewed
► Continuing FCF (before
financial results and tax)
of €(124) million, in line
with guidance
► Significant steps taken
to normalize working
capital
BALANCE SHEET STRENGTHENED THROUGH
FINANCIAL RESTRUCTURING AND MOMENTUM
IN ONGOING BUSINESS TRANSFORMATION
► Permanent cost
savings in excess of
€160 million
► Significant structural
changes combined
with further investment
to improve efficiency
THE GROUP IS LOOKING TO THE FUTURE WITH CONFIDENCE, AND WILL CONTINUE TO EXECUTE ITS
TRANSFORMATION PROGRAM TO IMPROVE OPERATIONAL AND FINANCIAL PERFORMANCE
DESPITE THE PROLONGED PANDEMIC,
TECHNICOLOR EXCEEDED ITS 2020 GUIDANCE
ON EBITDA, EBITA AND FCF

C3 - Restricted Natixis
5
KEY FIGURES FROM CONTINUING OPERATIONS
REVENUES of €3,006 million
demonstrating the resilience of the
Group’s activities to the Covid-19 crisis:
Second half ADJUSTED
EBITDA more than doubling
compared to first half leading
to an annual Adjusted IFRS 16
EBITDA of €167 million, down
(46)% at constant rate
ADJUSTED EBITA of
€(56) million, lower by
€(98)m at current rate as
a result of EBITDA
decrease mitigated by
lower D&A and reserves
FCF (before interest and tax) of €(124)
million was lower by €(116) million at current
rate, despite a significant improvement in
Connected Home operational performance,
and the ongoing implementation of our cost
transformation program
2020 RESULTS ARE A SIGNIFICANT ACHIEVEMENT IN THE CONTEXT OF THE SUCCESSIVE COVID-19 WAVES
➔ Strong consumer demand for better
broadband and WiFi drove the positive
Connected Home performance,
particularly in North America
➔ Better than expected levels of activity
in Advertising
➔ Continued strong back catalog
demand in DVD Services
➔ Slower than anticipated return to live
action shooting negatively impacted
Film and Episodic Visual Effects and
Post Production activities
➔ Lack of new film releases reduced
revenues in DVD services
In € million 2019 2020
Change YoY
at current
rate
Change YoY
at constant
rate
Revenues 3,800 3,006 (20.9)% (18.5)%
Adjusted EBITDA 324 167 (48.5)% (46.0)%
Adjusted EBITA 42 (56) ns ns
FCF before Financial &
Tax(8) (124) ns ns

C3 - Restricted Natixis
Film & TV - VFX Advertising Post Production Animation & Games
► Approximately 25
theatrical film projects
for the major studios
► Won the Oscar® for
Visual Effects for 1917
► 40+ TV and non-
theatrical projects
► 3,400+ commercials
► MPC won VFX Company of the Year
(Ad Age Creativity Awards 2020)
► Contributed to over 20 commercials
for this year’s Super Bowl LV
► 260+ TV/OTT series,
mini-series and/or pilots
(of which 80 are
streaming only)
► 115 theatrical projects
► Approximately 3,100
minutes of animation
delivered for TV and Film
6
PRODUCTION SERVICES
REVENUE HIGHLIGHTS:
REVENUE DOWN 41.4% YOY
AT CONSTANT RATE
Driven mainly by pandemic-
related impacts on production
around the world
The revenue decline was
partially mitigated by double-digit
revenue growth at Mikros
Animation and the launch of
MPC Episodic in early 2020
NEW APPOINTMENT of Christian Roberton as
President of Production Services, Josh Mandel has
become CEO of The Mill, and Andrea Miloro recently
joined the Group to lead Mikros Animation
➔ The strategic sale of Technicolor
Post is part of our long-term vision
for Production Services to focus on
VFX, Animation and Advertising
➔ Increasing level of bidding activity
for projects, particularly for
streaming/OTT distribution in
addition to large tentpole films
ADJ. EBITDA HIGHLIGHTS:
Reduction mainly related to
FEV VFX partially mitigated by
increased demand for
Animation and resilience in
Advertising
H2 84
H2 16
H1 79
H1 2
2019 2020
Adjusted EBITDA (in € million)@ Current rate
Revenues (in € million)@ Current rate
18.3%
3.6%
893
513
164
18
H2 465
H2 234
H1 428
H1 279
2019 2020

C3 - Restricted Natixis
7
CONNECTED HOME
REVENUE HIGHLIGHTS:
REVENUE DOWN 7.6% YOY AT
CONSTANT RATE
Revenues remained strong in
North America driven by increased
demand from cable customers for
upgrades to higher-power
broadband
Demand slowdown and supply
constraints in Eurasia and Latin
America
ADJ. EBITDA HIGHLIGHTS:
YOY IMPROVEMENTS:
Adjusted EBITDA of €110 million
improved by €31 million compared to
prior year at current rate as a result of
the significant cost efficiencies
achieved
CONNECTED HOME IS
MAINTAINING ITS
MARKET LEADERSHIP
in broadband and Android
TV-based solutions
RESTORING PROFITABILITY:
Significant profitability improvement
as the transformation plan launched
2 years ago is now contributing to
earnings, having improved the
division’s operational performance
➔ The division successfully completed the
transformation plan launched in 2018
➔ Connected Home has improved its margins and its
market share in recent years, despite facing many
challenges
H2 54 H2 56
H1 25
H1 54
2019 2020
1,764
Adjusted EBITDA (in € million)@ Current rate
Revenues (in € million)@ Current rate
4.0%
6.2%
79
110
H2 455 H2 375
H1 375H1 318
H2 575H2 549
H1 577
H1 522
2019 2020
Broadband
Video
1,152
830
1,071
693
1,983

C3 - Restricted Natixis
8
DVD SERVICES
(in million units) FY 2019 FY 2020YoY
Change
DVD 702 560 (20)%
Blu-ray™ 299 218 (27)%
CD 58 39 (33)%
DIVISION-WIDE INITIATIVES:
Restructuring of distribution and replication
operations, and renegotiation of related
customer contract agreements in response
to continued volume reductions
Successfully renegotiated several
contracts in 2020
Paramount replication/manufacturing
contract that will expire mid-2021 will not
be renewed, while the associated
distribution contract remains with
Technicolor
REVENUE HIGHLIGHTS:
VOLUME DOWN 22.9% YOY
Limited number of new
releases due to Covid-19
impacting volumes; existing
catalog showed resilience
REVENUE DOWN 18.6% YOY
AT CONSTANT RATE
ADJ. EBITDA HIGHLIGHTS:
AMOUNTED TO €54
MILLION AT CURRENT RATE
Beat expectations given
stronger than anticipated disc
volumes and acceleration of
cost saving actions
NEW APPOINTMENT of David Holliday as
President DVD Services
➔ The profitability margin also includes the benefit
of other ongoing cost savings and the positive
contribution from contracts renegotiated in 2019
and 2020
H2 508H2 404
H1 374
H1 302
2019 2020
H2 69
H2 52
H1 11
H1 1
2019 2020
Adjusted EBITDA (in € million)@ Current rate
Revenues (in € million)@ Current rate
9.1%
7.6%
882
706 81
54

C3 - Restricted Natixis
9
SHORT AND MEDIUM-TERM OUTLOOK
Adj. Continuing EBITDA
Adj. Continuing EBITA
Continuing FCF2
2021e
In € million, post IFRS 16
Continuing Operations
2022e42020a1
167 270 385
(56) 60 180
(124) c. 0 230
Technicolor will continue to improve its EBITDA,
EBITA and FCF throughout 2021 & 2022, given the
change in perimeter (sale of Post Production) and
the change in forex assumptions3, our guidance is
as follows:
► For 2021, revenues from continuing operations stable
vs. 2020, adjusted EBITDA of around €270 million,
adjusted EBITA of around €60 million, continuing FCF
before financial results and tax2 at around breakeven
and net debt to EBITDA covenant ratio below 4X level
at year end.
► For 2022, Adjusted EBITDA of €385 million, Adjusted
EBITA of €180 million, and Continuing FCF before
financial results and tax2 at around €230 million.
► Run-rate cost savings target increased by €25m to
€325m per annum by 2022
Outlook
(1) In the June 22nd press release. forecast costs related to Covid-19 were accounted as non-recurring (therefore not part of EBITDA &
EBITA), these costs have been reintegrated in the EBITDA and EBITA of the Group in 2020 and in coming years.
(2) Before financial results and tax. Free cash flow defined as: Adj. EBITDA – (net capex + restructuring cash expenses + change in
pension reserves + change in working capital and other assets & liabilities + cash impact of other non-current result)
Net debt to EBITDA covenant ratio should reduce to
below 4X level by December 2021
(3) Outlook based on constant exchange rates
(4) In 2022, the cumulated impacts of foreign exchange fluctuations and change in Group perimeter as a result of the sale of Post
Production are €(40) million on Adjusted EBITDA and €(23) million on Adjusted EBITA.


C3 - Restricted Natixis
11
PRODUCTION SERVICES: A WORLDWIDE LEADER IN THE CREATION OF EXTRAORDINARY ENTERTAINMENT EXPERIENCES
FILM & EPISODIC VFX ADVERTISING ANIMATION & GAMES
DESCRIPTION
CUSTOMERS
BRANDS
• With best-in-class brands, Technicolor
supports visionary storytellers with the
world’s best artists, cutting edge software,
and a globally efficient pipeline to make the
impossible possible
• From ideation to creative execution
• Campaigns from traditional TV ads to
branded experiences across all digital and
social media channels
• Immersive experiences
• VFX, animation, design, experiential and
interactive, color and finishing
• High-quality, end-to-end computer-generated
imagery (CGI), animation services from
concept art to final deliverables for theatrical,
streaming and TV clients
• A leading provider of art, animation and other
services to video game developers and
publishers
CONTENT
VISION: TECHNOLOGICAL CONVERGENCE IN THE MEDIA & ENTERTAINMENT INDUSTRY OFFERS MANY
OPPORTUNITIES FOR OUR DIGITAL PRODUCTION EXPERTISE, FROM INCREASING DEMAND FOR ORIGINAL
CONTENT TO IMMERSIVE EXPERIENCES TO REAL-TIME INTERACTIVE PRODUCTION

C3 - Restricted Natixis
12
PRODUCTION SERVICES: 2021 TO 2023 ROADMAP
► Unify Production Services both
culturally and structurally
► Implement a platform sharing strategy
to improve price competitiveness
► Develop data-driven sales strategies &
opportunities
► Anticipate strong level of pent-up
demand for original content
► Streamline processes and
modernize systems and tools to
improve efficiencies
► Improve real-time tracking
► Scale beyond pre-pandemic
expectations
► Expand into scalable markets within
Advertising and Games industries
beyond traditional Post/VFX &
Art/Animation services
2021 will be a pandemic “hangover”
year for the industry, driving Production
Services to take transformational steps
to improve operational efficiency
By 2022, we expect unprecedented
demand from clients for new content as
their COVID-impacted inventory is
finally released over 2021/22
In 2023, from a vastly improved position
of strength, Production Services to
selectively scale (organically and/or
inorganically) in key growth markets
2021STRUCTURE FOR
EFFICIENT GROWTH
2022ACCELERATE
ORGANIC GROWTH
2023SCALE FROM
STRENGTH
ACCELERATE GROWTH & IMPROVE MARGINS

C3 - Restricted Natixis
13
PRODUCTION SERVICES IMPERATIVES
FILM & EPISODIC VFX ADVERTISING ANIMATION & GAMES
► Scale Streaming/
Episodic VFX business
to capture highest
growth segment of the
market
► Service high-end local
content productions
► Expand number of, and
deepen, direct-to-brand
relationships
► Grow business in
experiential marketing
using creative technology
expertise (e.g.,
immersive experiences,
virtual avatars)
► Capture long-term
growth in Feature &
Episodic Animation
segment by broadening
customer base
► Expand offering in
Games to enlarge
addressable market and
move into more scalable
services
TECHNOLOGY
CONTINUE R&D INVESTMENTS TO:
► Improve efficiencies and optimize workflows, driving top- and bottom-line growth
► Stay ahead of the curve on the convergence of video game technology and digital production services
SCALE STREAMING/EPISODIC
VFX BUSINESSES
EXTEND UPSTREAM IN
ADVERTISING VALUE CHAIN
FURTHER DIVERSIFY REVENUE
MIX
➔ Production Services has been
awarded several new major projects,
already securing 75%+ of its expected
2021 sales pipeline for Film & Episodic
Visual Effects and Animation & Games
➔ Convergence of gaming technology
and digital production services is
driving the future of content production
- a transformation from traditional
linear workflows to interactive ones
that allow for a frictionless,
collaborative process at considerably
less cost and time
➔ Our extraordinary talent is increasingly
in high demand from technology
companies – focus on talent
recruitment and retention remain
critical factors to success
TRENDS IN 2021
AND 2022
C3 - Restricted Natixis
14
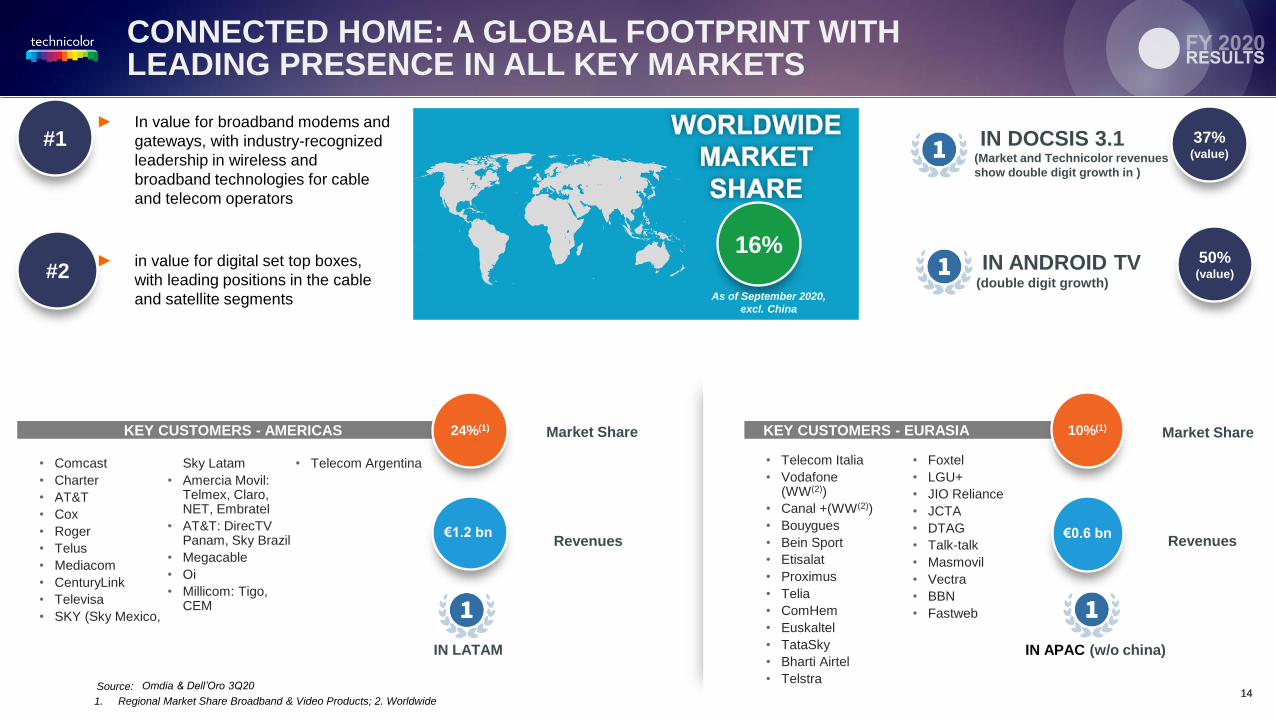
CONNECTED HOME: A GLOBAL FOOTPRINT WITH LEADING PRESENCE IN ALL KEY MARKETS
14
KEY CUSTOMERS - AMERICAS 24%(1)
€1.2 bn
Market Share
Revenues
1. Regional Market Share Broadband & Video Products; 2. Worldwide
Source: Omdia & Dell’Oro 3Q20
IN LATAM
• Telecom Italia
• Vodafone (WW(2))
• Canal +(WW(2))
• Bouygues
• Bein Sport
• Etisalat
• Proximus
• Telia
• ComHem
• Euskaltel
• TataSky
• Bharti Airtel
• Telstra
• Foxtel
• LGU+
• JIO Reliance
• JCTA
• DTAG
• Talk-talk
• Masmovil
• Vectra
• BBN
• Fastweb
KEY CUSTOMERS - EURASIA
IN APAC (w/o china)
10%(1)
€0.6 bn
• Comcast
• Charter
• AT&T
• Cox
• Roger
• Telus
• Mediacom
• CenturyLink
• Televisa
• SKY (Sky Mexico,
Sky Latam
• Amercia Movil: Telmex, Claro, NET, Embratel
• AT&T: DirecTV Panam, Sky Brazil
• Megacable
• Oi
• Millicom: Tigo, CEM
• Telecom Argentina
16%
As of September 2020,
excl. China
► In value for broadband modems and
gateways, with industry-recognized
leadership in wireless and
broadband technologies for cable
and telecom operators
► in value for digital set top boxes,
with leading positions in the cable
and satellite segments
#2
Market Share
Revenues
IN DOCSIS 3.1(Market and Technicolor revenues
show double digit growth in )
IN ANDROID TV(double digit growth)
37%(value)
50%(value)
#1
As of September 2020,
excl. China

C3 - Restricted Natixis
15
CONNECTED HOME: BUSINESS TRANSFORMATION TO DRIVE LEADERSHIP
1 CUSTOMERS
► Strong leadership with
cable operators in US
and Canada
► Leadership position in
APAC and LATAM
► Developing our
position in Europe with
new selected Tier 1
customers
2PORTFOLIO
STRATEGY
► Strong leadership in
broadband cable and
DSL
► #1 player in Android TV
with continuous
innovation
► Developing position in
broadband fiber 2.5G
and 10G
3DIVERSIFICATION(Verticals)
4LEAN AND
EFFICIENT
► Highly automated
operations
► Agile and collaborative
business processes
with teams close to
customers and
partners
► Efficient and resilient
supply ecosystem
management
► Platform-driven
development
organization
► An operator-class IOT open
platform is needed to enable
the automation of these
Industries
► Our technology, competence
and experience serving very
demanding service
providers will provide
a foundation to deliver high
performing solutions to
these new customers
➔ Demand will remain strong throughout
2021
➔ Connected Home will continue to work
with its partners and customers to
minimize supply disruptions
➔ The Covid global pandemic has
created global distortions in industry
impacting worldwide logistics
➔ The semiconductor crisis which
started in the second half of 2020 will
continue to impact 2021 supply

C3 - Restricted Natixis
COSTOPTIMIZATION
16
DVD SERVICES: MAXIMISING THE LONG TAIL
KEY LEVERS FOR FUTURE GROWTH AND MARGIN IMPROVEMENT
KEY CUSTOMER RELATIONSHIPS
► Continued optimization of
opex and operating platform
at a faster pace than volume/
revenue decline
– Incl major footprint rationalizations
► Reduce capex and contract
related cash outflows
► Capitalise on ongoing
consolidation of studio
operations for efficiency gains
► Robust YoY growth of
non-packaged media in
freight management &
D2C/B2B distribution
► Emerging opportunity in
production of precision
‘lab-on-chip’ devices for
high-growth diagnostic
and life science
applications
DIVERSIFICATION
► Further implementation of
activity based and volumetric
pricing mechanisms
► Deepening relationships with
multi-studio consolidation
activities
– (e.g. Warner/Universal JV, Disney Fox
acquisition)
► Volume mix shift to higher
value formats (Blu-ray/UHD)
COST-OPTIMIZATION, PRICING, AND DIVERSIFICATION MITIGATES VOLUMEDECLINE AND UNDERPINS SUSTAINABLE PROFITABILITY
Recovery fueled by:
➔ Continuing high
catalog demand, and
the gradual recovery of
cinema e.g. New York
movie theaters
opening at 25%
capacity in March (NYC
‘Arts and Entertainment’
03/21)
➔ Continued footprint
rationalization and
cost/scale optimization
➔ Diversification &
continued YoY growth
in non-disc business,
and Distribution
2021-22
TRENDS

C3 - Restricted Natixis
18
KEY FIGURES (YTD) – GROUP
(1) Including IT capacity use for rendering in Production Services of (2)m€ in 2020 and (31)m€ in 2019
(2) Risk, litigation and warranty reserves
Forex
impact
(b)
(in € million) Current rate LY rate LY rate
Revenues 3,006 3,096 3,800 (794) (20.9)% +90 (704) (18.5)%
Adjusted EBITDA 167 175 324 (157) (48.5)% +8 (149) (46.0)%
in % of Revenues 5.6% 5.7% 8.5%
D&A (1)
& Reserves (2)
w/o PPA
amortization(223) (229) (282) +59 +21.0% (6) +53 +18.9%
Adjusted EBITA (56) (53) 42 (98) na +2 (96) na
PPA amortization (40) (41) (54) +14 +25.4% (1) +13 +23.9%
Non-recurring items (168) (171) (109) (59) (54.4)% (4) (63) (57.6)%
EBIT (264) (266) (121) (144) ns (2) (146) ns
Net Result Continuing (193) (195) (208) +16 +7.5% (3) +13 +6.3%
Net Result Discontinued (15) (15) (22) +7 +31.4% +0 +7 +32.4%
Net Result Group (Group share) (207) (210) (230) +23 +9.8% (2) +20 +8.7%
Adjusted EBITDA 167 175 324 (157) (48.5)% +8 (149) (46.0)%
Capex (108) (111) (169) +61 +36.1% (3) +58 +34.4%
Non-recurring items (cash impact) (80) (81) (68) (12) (17.8)% (1) (13) (19.7)%
WC-OAL variation (103) (107) (96) (8) (7.9)% (4) (11) (11.6)%
FCF before Financial & Tax (124) (124) (8) (116) ns +0 (116) ns
FCF after Financial & Tax (190) (191) (98) (92) (94.1)% (1) (93) (95.1)%
Net Debt (IFRS) (812) (821) (1,233) +420 +34.1%
FULL YEAR
Current rate LY rate
2020 2019vs. LY
vs. LY
at constant rate
(a) (c=a+b)

C3 - Restricted Natixis
19
ADJUSTED EBITDA BRIDGE VS. LY (YTD)

C3 - Restricted Natixis
20
PRODUCTION SERVICES FULL YEAR 2020 PROFITABILITY
Production Services
in € million
Revenues 513 523 893 (380) (42.5)% +10 (370) (41.4)%
Ajusted EBITDA 18 20 164 (145) (88.8)% +1 (144) (88.0)%
in % of Revenues 3.6% 3.7% 18.3%
D&A(1)
& Reserves(2)
w/o PPA
amortization(97) (99) (136) +39 +29.0% (3) +37 +27.1%
Adjusted EBITA (78) (80) 28 (106) ns (1) (107) ns
PPA amortization (8) (8) (8) +0 +1.6% (0) +0 +0.0%
Non-recurring items (16) (17) (16) +0 +1.0% (1) (1) (3.8)%
EBIT (103) (105) 3 (106) ns (2) (108) ns
2020
FULL YEAR
Forex
impact
(b)
vs. LY
at constant rate
(c=a+b)
LY rate
2019vs. LY
(a)
LY rate LY rate Current rateCurrent rate
(1) Including IT capacity use for rendering in Production Services of (2)m€ in 2020 and (31)m€ in 2019
(2) Risk, litigation and warranty reserves

C3 - Restricted Natixis
(*) Risk, litigation and warranty reserves
21
CONNECTED HOME FULL YEAR 2020 PROFITABILITY
Connected Home
in € million
Revenues 1,764 1,831 1,983 (219) (11.0)% +67 (151) (7.6)%
Ajusted EBITDA 110 115 79 +31 +39.5% +6 +37 +46.7%
in % of Revenues 6.2% 6.3% 4.0%
D&A & Reserves (*)
w/o PPA
amortization(68) (70) (55) (13) (24.1)% (2) (15) (27.6)%
Adjusted EBITA 41 45 23 +18 +75.8% +4 +21 +91.8%
PPA amortization (24) (24) (36) +12 +33.8% (1) +12 +32.4%
Non-recurring items (39) (39) (12) (27) ns (1) (28) ns
EBIT (21) (19) (24) +3 +11.7% +3 +6 +22.8%
LY rate
FULL YEAR
Forex
impact
(b)
vs. LY
at constant rate
(c=a+b)
2019vs. LY
(a)
LY rate Current rateCurrent rate LY rate
2020

C3 - Restricted Natixis
(*) Risk, litigation and warranty reserves
22
DVD SERVICES FULL YEAR 2020 PROFITABILITY
DVD Services
in € million
Revenues 706 718 882 (176) (20.0)% +12 (164) (18.6)%
Ajusted EBITDA 54 55 81 (27) (33.6)% +1 (26) (32.3)%
in % of Revenues 7.6% 7.6% 9.1%
D&A & Reserves (*)
w/o PPA
amortization(54) (55) (87) +33 +38.1% (1) +32 +36.9%
Adjusted EBITA (0) (0) (6) +6 +95.0% (0) +6 +94.1%
PPA amortization (8) (9) (10) +2 +15.1% (0) +1 +13.3%
Non-recurring items (102) (105) (78) (25) (32.0)% (2) (27) (34.8)%
EBIT (111) (114) (94) (17) (18.4)% (2) (20) (20.9)%
FULL YEAR
Forex
impact
(b)
vs. LY
at constant rate
(c=a+b)
LY rate
2019vs. LY
(a)
LY rate LY rate Current rateCurrent rate
2020

C3 - Restricted Natixis
23
FROM ADJUSTED EBITDA TO EBIT IN SUMMARY
in € million Current rate LY rate LY rate Current rate LY rate
Adjusted EBITDA 167 175 324 (157) +8 (149)
D&A(1)
& Reserves(2)
w/o PPA amortization (223) (229) (282) +59 (6) +53
Adjusted EBITA (56) (53) 42 (98) +2 (96)
PPA amortization (40) (41) (54) +14 (1) +13
Impairments & write-off (75) (77) (63) (13) (2) (14)
Restructuring (100) (102) (31) (69) (2) (71)
Other Non Current 8 7 (15) +23 (0) +23
EBIT Continuing (264) (266) (121) (144) (2) (146)
FULL YEAR
2019Forex impact
(b)
vs. LY
at constant rate
(c=a+b)
vs. LY
(a)2020
(1) Including IT capacity use for rendering in Production Services of (2)m€ in 2020 and (31)m€ in 2019
(2) Risk, litigation and warranty reserves

C3 - Restricted Natixis
24
FROM EBIT TO NET RESULT GROUP (YTD)
in € million Current rate LY rate LY rate Current rate LY rate
EBIT Continuing (264) (266) (121) (144) (2) (146)
Net Interest Expense (78) (77) (69) (9) +1 (8)
Others Financial 155 153 (15) +170 (1) +169
Profit before Tax (188) (190) (205) +17 (2) +15
Tax (5) (6) (3) (2) (1) (3)
Net Result Continuing (193) (195) (208) +16 (3) +13
Net Result Discontinued (15) (15) (22) +7 +0 +7
Net Result Group (Group share) (207) (210) (230) +23 (2) +20
FULL YEAR
2020 2019vs. LY
(a) Forex impact
(b)
vs. LY
at constant rate
(c=a+b)

C3 - Restricted Natixis
25
FREE CASH FLOW FROM CONTINUING OPERATIONS
€(93)m
(98)
(191) (190)
(149)
+58
(12)
(35) +24
+23 (1) (1) +1
FCF FY 2019as published
EBITDAADJ
NetCapex
NetRestructuring
∆ WC/OAL Rendering Financial Tax Pensionsand Other
FCF FY 2020@LYR
Foreximpact
FCF FY 2020@CR
Free Cash Flow from continuing operations: FY 2020 vs FY 2019

C3 - Restricted Natixis
26
DEBT STRUCTURE
In million currency CurrencyNominal
Amount
IFRS
Amount
Type of
rate
Nominal
rate (1)
Repayment
TypeFinal maturity
Moodys /
S&P rating
New Money notes EUR 350 363 Floating 12.00%(2) Bullet Jun. 30, 2024 Caa1/B
New Money Term loans USD 98 101 Floating 12.34%(3) Bullet Jun. 30, 2024 Caa1/B
Reinstated Term Loans EUR 453 372 Floating 6.00%(4) Bullet Dec. 31, 2024 Ca/CCC
Reinstated Term Loans USD 115 95 Floating 6.03%(5) Bullet Dec. 31, 2024 Ca/CCC
Subtotal EUR 1,016 931 8.68%
Lease liabilities(6) Various 178 178 Fixed 7.94%
Accrued PIK Interest EUR+USD 16 16 NA 0%
Accrued Interest Various 16 16 NA 0%
Other Debt Various 1 1 NA 0%
Total Gross Debt 1,227 1,142 8.34%
Cash & Cash
equivalents Various 330 330
Total Net Debt 897 812
Leverage ratio (7) 5.37
(1) Rates as of December 31, 2020.
(2) Cash interest of 6-month EURIBOR with a floor of 0% +6.00% and PIK interest of 6.00%.
(3) Cash interest of 6-month LIBOR with a floor of 0% +6.00% and PIK interest of 6.00%.
(4) Cash interest of 6-month EURIBOR with a floor of 0% + 3.00% and PIK interest of 3.00%.
(5) Cash interest of 6-month LIBOR with a floor of 0% + 2.75% and PIK interest of 3.00
(6) Of which €14 million are capital leases and €164 million is operating lease debt under IFRS 16
(7) Net debt using nominal value of financial debts divided by adjusted EBITDA, not tested as at December 31, 2020

C3 - Restricted Natixis
27
DETAILS OF DEBT AT DECEMBER 31, 2020 (INCLUDING OP. LEASE DEBT)
Nominal IFRS Int. Rate Dec 31, 2020 Dec 31, 2019
Borrower Type Curr. Rate Formula Maturity Rate Rate Hedging? Nominal IFRS Nominal IFRS
Technicolor SA Term Loan USD Libor w/ floor of 0% + 2.75% n.a.* 4.66% 4.76% No - - 259 258
Technicolor SA Term Loan EUR Euribor w/ floor of 0% + 3.00% n.a.* 3.00% 3.11% No - - 275 274
Technicolor SA Term Loan EUR Euribor w/ floor of 0% + 3.50% n.a.* 3.50% 3.62% No - - 450 448
Technicolor SA Term Loan USD Libor w/ floor of 0% + 2.75% + 3% PIK Dec 2024 6.03% 11.37% No 115 95 - -
Technicolor SA Term Loan EUR Euribor w/ floor of 0% + 3.00% + 3% PIK Dec 2024 6.00% 11.34% Yes 453 372 - -
Tech 6 Notes EUR Euribor w/ floor of 0% + 6.00% + 6% PIK Jun 2024 12.00% 10.95% No 350 363 - -
Technicolor USA Inc. Term Loan USD Libor w/ floor of 0% + 6.00% + 6% PIK Jun 2024 12.34% 11.31% No 98 101 - -
Various entities Accrued PIK EUR+USD 0% 0% No 16 16
Various entities IFRS 16 Operating lease liabilities 8.07% 8.07% No 164 164 272 272
Various entities Capital lease liabilities 6.43% 6.43% No 14 14 40 40
Various entities Accrued interest 0% 0% No 16 16 3 3
Various entities Other debt 0% 0% No 1 1 3 3
* This debt is no longer outstanding Total Debt: €1,227 €1,142 €1,302 €1,298
Cash: 330 330 65 65
Net Debt: €897m €812m €1237m €1233m
Average interest rate: 8.34% 10.36% 4.34% 4.42%
Average rate (with hedging): 8.38% 10.40% 4.38% 4.46%
Jun & Dec 2024

C3 - Restricted Natixis
28
LIQUIDITY
* The availability of this credit line varies depending on the amount of receivables.
Liquidity at December 31st, 2020 Available Amount (€m)
Cash on hand 330
Committed credit facilities (fully undrawn)
Wells Fargo credit line* ($125m) 102
Liquidity €432m
► Moreover, Technicolor has the possibility of drawing an additional €50 million, on an uncommitted basis, of New
Money debt


C3 - Restricted Natixis
30
GROUP PROFILE – REVENUE
26%
53%
9%
12%
29%
57%
5%
9%
2020
North America
Europe, Middle-East& Africa
Latina America
Asia-Pacific
2019
52%
23%
24%1%
59%
23%
17%1%
2020
2019 DVD Services
Connected Home
Production ServicesCorporate & Other

C3 - Restricted Natixis
31
DETAILS OF DEBT AT DECEMBER 31, 2020 (EXCLUDING OP. LEASE DEBT)
Nominal IFRS Int. Rate Dec 31, 2020 Dec 31, 2019
Borrower Type Curr. Rate Formula Maturity Rate Rate Hedging? Nominal IFRS Nominal IFRS
Technicolor SA Term Loan USD Libor w/ floor of 0% + 2.75% n.a.* 4.66% 4.76% No - - 259 258
Technicolor SA Term Loan EUR Euribor w/ floor of 0% + 3.00% n.a.* 3.00% 3.11% No - - 275 274
Technicolor SA Term Loan EUR Euribor w/ floor of 0% + 3.50% n.a.* 3.50% 3.62% No - - 450 448
Technicolor SA Term Loan USD Libor w/ floor of 0% + 2.75% + 3% PIK Dec 2024 6.03% 11.37% No 115 95 - -
Technicolor SA Term Loan EUR Euribor w/ floor of 0% + 3.00% + 3% PIK Dec 2024 6.00% 11.34% Yes 453 372 - -
Tech 6 Notes EUR Euribor w/ floor of 0% + 6.00% + 6% PIK Jun 2024 12.00% 10.95% No 350 363 - -
Technicolor USA Inc. Term Loan USD Libor w/ floor of 0% + 6.00% + 6% PIK Jun 2024 12.34% 11.31% No 98 101 - -
Various entities Accrued PIK EUR+USD 0% 0% No 16 16
Various entities Capital lease liabilities 6.43% 6.43% No 14 14 40 40
Various entities Accrued interest 0% 0% No 16 16 3 3
Various entities Other debt 0% 0% No 1 1 3 3
* This debt is no longer outstanding €1,063 €978 €1,030 €1,026
Cash: 330 330 65 65
Net Debt: €733m €648m €965m €961m
8.38% 10.74% 3.74% 3.84%
8.43% 10.80% 3.79% 3.89%
Average interest rate:
Average rate (with hedging):
Total Debt:
Jun & Dec 2024

C3 - Restricted Natixis
THANK YOU
Related Documents