Tuesday, 11 December 2007 Topic Page Number Overnight Summary 2 US Equities 3 US Bonds 3 Commodities 3 International Markets 4 US Economic Action 4 Australian Market Summary 5 Australian Equity Market Movers (Sector) 5 Australian Equity 5 Best / Worst Stocks 5 Australian Companies Ex-Dividend 6 Australian Equity Snapshots 7 Summary of Daily Research Reports 8 ST GEORGE BANK LIMITED SHARE PRICE AS AT 10 December 2007 Last Sale $35.35 Changes -$0.24 Total Volume 1,965,461 Web Address: www.stgeorge.privatebank.com.au www.banksa.privatebank.com.au PRIVATE BANK PORTFOLIO SERVICES DAILY BULLETIN

Welcome message from author
This document is posted to help you gain knowledge. Please leave a comment to let me know what you think about it! Share it to your friends and learn new things together.
Transcript

Tuesday, 11 December 2007
Topic Page Number
Overnight Summary 2
US Equities 3
US Bonds 3
Commodities 3
International Markets 4
US Economic Action 4
Australian Market Summary 5
Australian Equity Market Movers (Sector) 5
Australian Equity 5 Best / Worst Stocks 5
Australian Companies Ex-Dividend 6
Australian Equity Snapshots 7
Summary of Daily Research Reports 8
ST GEORGE BANK LIMITED
SHARE PRICE AS AT 10 December 2007
Last Sale $35.35
Changes -$0.24
Total Volume 1,965,461
Web Address: www.stgeorge.privatebank.com.au
www.banksa.privatebank.com.au
PR
IVA
TE B
AN
K P
OR
TFO
LIO
SE
RV
ICE
S
DA
ILY
BU
LLE
TIN

Daily Bulletin 11 December 2007
Overnight Markets
US stocks rallied in late afternoon trade, thanks to large cashinfusions into battered financial firms and stronger than expectedpending home sales. Investors are also eagerly awaitingtomorrow’s expected interest rate cut.
Australian Market Summary
The Australian market opened the week with a decline in the earlymorning trading. The All Ordinaries quickly bounced back but losttraction in the early afternoon to loose further ground and end 28points down.
Flashnotes
Macquarie Office Trust (MOF) - Offical opening of 2 MarketStreet redevelopmentGoodman Group (GMG) - GMG announces $835M five yeardebt facilityMacarthur Coal Ltd (MCC) - Enters into a trading haltMacquarie Media Group (MMG) - MMG not to proceed with ruralradio station acquisitionSymbion Health Limited (SYB) - Primary snares 30% interest asHealthscope increases stake to 11%Fairfax Media (FXJ) - To retain radio stations acquired in mergerwith Rural PressHealthscope (HSP) - Increases interest in SYB to 11%, asPrimary moves to 30%Pacific Brands (PBG) - Sells NZ Foams, Flooring and BeddingbusinessesCommander Communications (CDR) - New commander takesthe helmDyno Nobel (DXL) - Trading HaltSP AusNet (SPN) - Cancellation of the Alinta assets acquisitionANZ Bank (ANZ) - ANZ achieves advanced accreditation underregulatory capital changesBabcock & Brown (BNB) - Assicurazioni Generali Group investsin BNB Development FundNufarm (NUF) - Acquisition proposal fails to meet deadlineMacquarie Group Limited (MQG) - Macquarie Bank receivesBasel II accreditation from APRADowner EDI Limited (DOW) - Appoints Geoff Knox as CEOCommonwealth Bank (CBA) - CBA achieves advancedaccreditation under regulatory capital changesBHP Billiton Limited (BHP) - Kilpspruit Coal Project approvedWestpac (WBC) - WBC achieves advanced accreditation underregulatory capital changesHills Industries (HIL) - Trading halt
Foreign EquitiesIndex/Security Close Chg %ChgDow Jones (US) 13,727 +101.5 +0.7S&P 500 1,516 +11.3 +0.8NASDAQ 2,719 +12.8 +0.5FTSE 100 (UK) 6,565 +10.5 +0.2DAX 30 (Germany) 8,033 +39.3 +0.5CAC 40 (France) 5,751 +32.2 +0.6Nikkei (Japan) 15,924 -32.0 -0.2
Figures as at 11/12/2007 8:30 AM AEST
Australian Market SummaryIndex/Security Close Chg %ChgAll Ordinaries 6,686 -28.0 -0.4ASX 200 6,625 -29.6 -0.4ASX Small Ords 4,034 -0.5 0.0Industrials 7,013 -52.4 -0.7Fin.-x-Prop Trusts 7,457 -26.4 -0.4Materials 15,817 +39.9 +0.3Cons. Staple 9,084 -109.2 -1.2Telecom Serv. 1,659 -23.0 -1.410y Bond Yield 6.05 +0.04 +0.7
Figures as at 10/12/2007 4:30 PM AEST
CommoditiesIndex/Security Close Chg %Chg UnitsBase MetalsCRB Index 343.5 +0.53 +0.2Aluminium 2,404 -21.3 -0.9 USD/tCopper 6,766 -92.5 -1.3 USD/tLead 2,539 -128.5 -4.8 USD/tNickel 25,945 -1,100.0 -4.1 USD/tTin 16,513 +23.0 +0.1 USD/tZinc 2,369 -47.5 -2.0 USD/tPrecious MetalsGold 809 +14.4 +1.8 USD/OzSilver 14.7 +0.3 +2.2 USD/OzEnergyOil (West Texas) 87.9 -0.4 -0.5 USD/Bar
Figures as at 11/12/2007 8:30 AM AEST
CurrenciesIndex/Security Close Chg %Chg UnitsAUD / USD 0.885 +0.008 +0.9 $USAUD / Euro 0.601 +0.003 +0.6 $AAUD / STG 0.432 -0.002 -0.4 GBPAUD / Yen 97.9 +0.0 +0.0 YenUSD / Yen 112 +0.4 +0.3 YenEuro / USD 1.47 +0.00 +0.1 $US
Figures as at 10/12/2007 4:30 PM AEST

Private Bank Daily Bulletin
Daily Research Reports
ResMed (RMD) - Model changes...we HOLD our viewSP AusNet (SPN) - Cancellation of the Alinta assets acquisitionAlumina Ltd (AWC) - Recommendation upgradeAust Pharmaceutical (API) - Model changes...no change to viewBabcock & Brown Infrastructure Group (BBI) - BBI pursues its port consolidation strategy
Page 3

Private Bank Daily Bulletin
US EquitiesUS stocks rallied in late afternoon trade, thanks to large cash infusions into battered financial firms and stronger than expectedpending home sales. Investors are also eagerly awaiting tomorrow’s expected interest rate cut.
UBS managed to secure US$11.5B in new equity to help it offset its shocking US$10B writedown due to the credit marketturmoil. While investors were initially put off by the profit warning, they cheered the fact that the Swiss investment bank couldstill raise substantial amounts of new capital, most of which came from the Singapore government.
UBS was not the only one to celebrate a cash injection. Troubled bond insurer MBIA surged over 11% after announcing that ithad received a US$1B investment from buyout firm Warburg Pincus amid concerns that MBIA might be facing a liquidity crisis.
Others in the sector also rose as analysts had been speculating that the downtrodden financial sector would receive moreinvestment inflows after Abu Dhabi’s investment in Citigroup last month. JP Morgan gained over 3% on reports that theInvestment Corporation of Dubai had held talks with the third largest US bank on ways to “cooperate”. Still on corporate activity, MGI Pharma soared almost 20% after it agreed to be takenover by Japanese drug company Eisai forUS$3.9B in cash.
Meanwhile, a surprise rise in pending home sales for October lifted the S&P Homebuilders index by over 3%. However, theNational Association of Relators, which complied the report, is warning of more pain ahead as home sales are expected to fallagain next year.
Elsewhere, McDonald’s hit fresh record highs after the company said its same-store sales jumped 8.2%, well aboveexpectations.
Another notable gainer was Cisco Systems on news that AT&T had placed a large order for its routers to upgrade the US phonegiant’s Internet backbone.
Market breadth was positive with all NYSE indices finishing up. Even the Energy sector managed to overcome early weaknessfrom the lower crude oil price.
US BondsUS Treasuries extended yesterday’s losses as confidence returned to equity markets ahead of the expected 0.25% interest ratecut tomorrow.
The yields on the two- and five-year notes rose to 3.17% (+0.07) and 3.54% (+0.05) respectively. The 30-year bond is providinga yield of 4.60% (+0.04).
US EQUITIES US BONDS
Page 4

Private Bank Daily Bulletin
CommoditiesCrude oil prices slipped after warm weather forecasts and lingering concerns about an economic slowdown knocked prices offearly highs.
Crude jumped by more than US$1 in early trade on news that shipping was halted along the fog-shrouded Houston ShipChannel and by the waning US dollar.
Gold ignored oil and hit a 10-day high thanks to heavy fund buying as prices hit a technical support and the US dollarweakened.
However, copper prices eased on profit taking as traders were reluctant to open fresh positions ahead of the US interest ratedecision tomorrow.
COPPER & NICKEL OIL
GOLD
Page 5
Private Bank Daily Bulletin
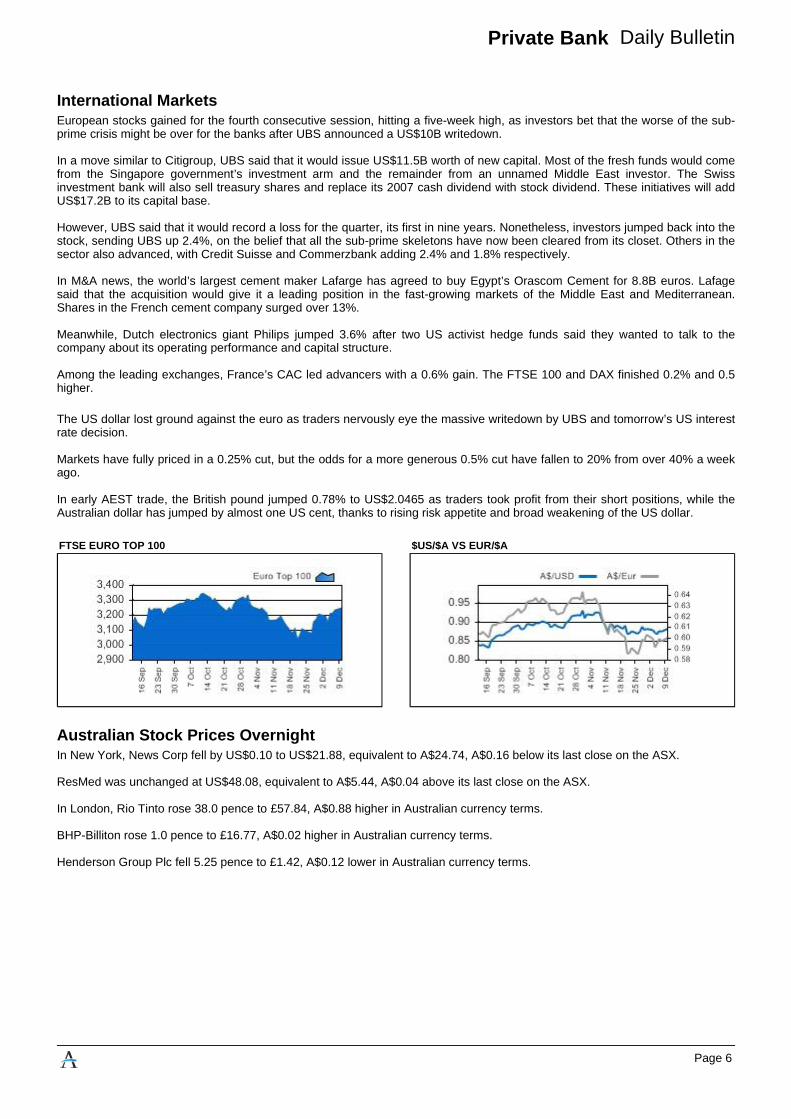
International MarketsEuropean stocks gained for the fourth consecutive session, hitting a five-week high, as investors bet that the worse of the sub-prime crisis might be over for the banks after UBS announced a US$10B writedown.
In a move similar to Citigroup, UBS said that it would issue US$11.5B worth of new capital. Most of the fresh funds would comefrom the Singapore government’s investment arm and the remainder from an unnamed Middle East investor. The Swissinvestment bank will also sell treasury shares and replace its 2007 cash dividend with stock dividend. These initiatives will addUS$17.2B to its capital base.
However, UBS said that it would record a loss for the quarter, its first in nine years. Nonetheless, investors jumped back into thestock, sending UBS up 2.4%, on the belief that all the sub-prime skeletons have now been cleared from its closet. Others in thesector also advanced, with Credit Suisse and Commerzbank adding 2.4% and 1.8% respectively.
In M&A news, the world’s largest cement maker Lafarge has agreed to buy Egypt’s Orascom Cement for 8.8B euros. Lafagesaid that the acquisition would give it a leading position in the fast-growing markets of the Middle East and Mediterranean.Shares in the French cement company surged over 13%.
Meanwhile, Dutch electronics giant Philips jumped 3.6% after two US activist hedge funds said they wanted to talk to thecompany about its operating performance and capital structure.
Among the leading exchanges, France’s CAC led advancers with a 0.6% gain. The FTSE 100 and DAX finished 0.2% and 0.5higher.
The US dollar lost ground against the euro as traders nervously eye the massive writedown by UBS and tomorrow’s US interestrate decision.
Markets have fully priced in a 0.25% cut, but the odds for a more generous 0.5% cut have fallen to 20% from over 40% a weekago.
In early AEST trade, the British pound jumped 0.78% to US$2.0465 as traders took profit from their short positions, while theAustralian dollar has jumped by almost one US cent, thanks to rising risk appetite and broad weakening of the US dollar.
Australian Stock Prices OvernightIn New York, News Corp fell by US$0.10 to US$21.88, equivalent to A$24.74, A$0.16 below its last close on the ASX.
ResMed was unchanged at US$48.08, equivalent to A$5.44, A$0.04 above its last close on the ASX.
In London, Rio Tinto rose 38.0 pence to £57.84, A$0.88 higher in Australian currency terms.
BHP-Billiton rose 1.0 pence to £16.77, A$0.02 higher in Australian currency terms.
Henderson Group Plc fell 5.25 pence to £1.42, A$0.12 lower in Australian currency terms.
FTSE EURO TOP 100 $US/$A VS EUR/$A
Page 6

Private Bank Daily Bulletin
US Economic ActionAccording to the National Association of Realtors, Pending Home Sales rose 0.6% for October, versus expectations of further1% contraction. However, the association is warning that homes sales are likely to decline in 2008, for the third consecutiveyear.
� Pending Home Sales (for October, released Tue AEST, Prior: 0.2%)
� Wholesale Inventories (for October, released Wed AEST, F/cast: 0.5%, Prior: 0.8%)
� FOMC Policy Statement (for October, released Wed AEST)
� Export Prices excluding agriculture (for November, released Thur AEST, Prior: 0.5%)
� Import Prices excluding oil (for November, released Thur AEST, Prior: 0.5%)
� Trade Balance (for October, released Thur AEST, F/cast: -US$57.0B, Prior: -US$56.5B)
� Crude Inventories (for week of 07 December, released Thur AEST, Prior: -7913K)
� Treasury Budget (for November, released Thur AEST, F/cast: -US$75B, Prior: -US$75.6B)
� Retail Sales (for November, released Fri AEST, F/cast: 0.5%, Prior: 0.2%)
� Retail Sales excluding auto (for November, released Fri AEST, F/cast: 0.6%, Prior: 0.2%)
� PPI (for November, released Fri AEST, F/cast: 1.5%, Prior: 0.1%)
� Core PPI (for November, released Fri AEST, F/cast: 0.2%, Prior: 0.0%)
� Initial Claims (for week of 08 December, released Fri AEST, F/cast: 335K, Prior: 338K)
� Business Inventories (for October, released Fri AEST, F/cast: 0.3%, Prior: 0.4%)
� CPI (for November, released Sat AEST, F/cast: 0.6%, Prior: 0.3%)
� Core CPI (for November, released Sat AEST, F/cast: 0.2%, Prior: 0.2%)
� Industrial Production (for November, released Sat AEST, F/cast: 0.1%, Prior: -0.5%)
� Utility Utilisation (for November, released Sat AEST, F/cast: 81.7%, Prior: 81.7%)
Page 7

Private Bank Daily Bulletin
Australian Market Summary: As at 10 December 2007
OverviewAUSTRALIAN EQUITIES MARKET: The Australian market opened the week with a decline in the early morning trading. The AllOrdinaries quickly bounced back but lost traction in the early afternoon to loose further ground and end 28 points down.
The S&P/ASX 200 ended 30 points lower with selling in Financials, Energy and Consumer Staples outweighing gains byMaterials. Financials were pulled down by selling in NAB (-$0.34), ANZ (-$0.18) and Commonwealth Bank (-$0.22), whileSuncorp (+$0.15) bucked the trend. Woodside Petroleum (-$1.03) and Origin (-$0.26) dragged on the Energy sector, whilewithin Consumer Staples we saw declines in Wesfarmers (-$0.98) and Fosters (-$0.13). Meanwhile, Materials were propped upby buying in Rio Tinto (+$1.22) and Fortescue Metals (+$1.98).
In market news, Healthscope (-$0.03) announced it had varied the terms of its equity swap agreement with Goldman SachsJBWere to now have an economic interest in 10.96% of Symbion (unchanged). This interest is now large enough forHealthscope to prevent Primary Health Care (unchanged) from moving to a compulsory acquisition of Symbion. SP Ausnet(+$0.10) decided not to proceed with the proposed acquisition of the Alinta assets and businesses from its majority securityholder Singapore Power International. Management confirmed it had incurred a portion of the costs of the transaction, estimatedat $26M but maintained its FY08 full year distribution guidance of 11.55 cps. Shares in Nufarm (-$2.02) fell after a potentialbidder ended takeover talks.
AUSTRALIAN BOND MARKET: The yields on Australian government bonds rose between 8 to 12 basis points through Mondaytrade.
AUSTRALIAN DOLLAR: The Australian dollar witnessed volatile trade against the greenback but rallied in the afternoon to endhigher at US$0.878.
AUSTRALIAN ECONOMIC STATISTICS: ABS AUSTRALIAN HOME LOAN APPROVALS: The ABS reported the number ofhome loans granted fell 0.7 percent in October, contrary to the expected 1% growth forecast by analysts. ANZ JOBADVERTISEMENTS: Growth in Australian job advertisements eased to 0.7% growth in November.
Market Movers
SECTOR PERFORMANCE
5 BEST / WORST STOCKS
Page 8

Private Bank Daily Bulletin
Companies Ex-Dividend
Ex Date Sub Type Security Div Amt(cents) Franking
24-Dec-07 First Quarter Result AMP Capital China Growth Fund (AGF)24-Dec-07 Special Event Coates Hire Limited (COA) 53 10023-Dec-07 First Quarter Result Generator Income Trust ginha (GINHA)21-Dec-07 Half Yearly Result Aspen Group (APZ) 3.875 021-Dec-07 Half Yearly Result Ale Property Group (LEP) 16.7521-Dec-07 Half Yearly Result Macquarie Communications Infrastructure Group (MCG) 23 021-Dec-07 Half Yearly Result Orchard Industrial Property Fund (OIF)
21-Dec-07 Third Quarter Result CBA Perpetual Exchangeable Repurchaseable Listed Shares(PERLS III) (PCAPA) 5.5697 0
21-Dec-07 Half Yearly Result Thakral Holdings Group (THG) 2.75 0
20-Dec-07 First Quarter Result Gunns Frankable Optionally Redeemable Equity SettleableTransferable Securities (FORESTS) (GNSPA) 166.20 100
20-Dec-07 Half Yearly Result RR Australia Limited (RRA) 1.78 10018-Dec-07 Special Event Futuris Hybrids (FCLPA) 159.85 10018-Dec-07 Half Yearly Result PaperlinX Step-up Preference Securities (PXUPA) 452.19 017-Dec-07 Special Event Contango Microcap Limited (CTN) 5 10014-Dec-07 Final Year Result Ruralco Holdings Limited (RHL) 13 10013-Dec-07 Half Yearly Result Singapore Telecommunications Limited (SGT) 012-Dec-07 Special Event Crusade Global Trust No. 1 of 2006 - Class A-3 Notes (CTJ)12-Dec-07 Half Yearly Result Envirozel Limited (EVZ) .5 10012-Dec-07 First Quarter Result Timbercorp Orchard Trust 9% Debenture (TODHA) 2.27 011-Dec-07 Half Yearly Result Van Eyk Three Pillars Limited (VTP) 5 100
Page 9

Private Bank Daily Bulletin
Flashnotes
MOF announced the official opening of its redevelopment at 2 Market St, Sydney. The $46M co-venture project with AllianzAustralia Ltd was completed in 19 months with a return of over 30%. The redevelopment has repositioned the property as an A-grade office building and is targeting a 5 star ABGR. The property's office space is 100% occupied with a WALE of 9.2 yearsand an expected average annual rental growth of over 4%. The retail space is almost fully let with one tenancy remainingvacant.
GMG announced it has successfully secured a new $835M (€500 million with ability to draw a further €25M) debt facility for aterm of five years. The debt facility will be used to refinance a smaller expiring facility with the remainder of the funds to be usedfor general corporate purposes. The ranking of this facility will be equal with GMG’s existing unsecured debt. The terms,conditions and pricing are also consistent with GMG’s existing unsecured debt of similar tenor.
MCC has requested that the company be placed in trading halt, pending the release of an announcement. The company willremain suspended until the release of the announcement, which is expected on or before 12 December, 2007.
MMG announced that together with Fairfax Media (FXJ), it has agreed that the previously announced acquisition by MMG fromFXJ of nine commercial radio licenses, will not proceed. The nine licenses serving five regional areas in South Australia andQueensland and were conditional on a number of issues including regulatory approval. FXJ will retain the radio stations in theabove mentioned areas, which were acquired in merger with Rural Press.
Macquarie Office Trust (MOF) - Offical opening of 2 Market Street redevelopment 10-Dec-07 14:47
Goodman Group (GMG) - GMG announces $835M five year debt facility 10-Dec-07 13:46
Macarthur Coal Ltd (MCC) - Enters into a trading halt 10-Dec-07 13:43
Macquarie Media Group (MMG) - MMG not to proceed with rural radio station acquisition 10-Dec-07 13:11
Page 10

Private Bank Daily Bulletin
HSP has varied the terms of its equity swap agreement with GS JBWere so that it now has an economic interest in 10.96% ofSymbion at a notional price of $4.09 per share. This interest is now large enough for HSP to prevent Primary Health Care frommoving to a compulsory acquisition of Symbion should its $4.10 cash offer for SYB gain further traction. Primary, meanwhile,has advised today that it has gained institutional acceptances for 9.72% of SYB, bringing its total interest in SYB to 29.73%.
FXJ announced that together with Macquarie Media Group (MMG), it has agreed that the previously announced acquisition byMMG from Fairfax Media of nine commercial radio licenses, will not proceed. The nine licenses serving five regional areas inSouth Australia and Queensland and were conditional on a number of issues including regulatory approval. FXJ will retain theradio stations in the above mentioned areas, which were acquired in merger with Rural Press.
HSP has varied the terms of its equity swap agreement with GS JBWere so that it now has an economic interest in 10.96% ofSymbion at a notional price of $4.09 per share. This interest is now large enough for HSP to prevent Primary Health Care frommoving to a compulsory acquisition of Symbion should its $4.10 cash offer for SYB gain further traction. Primary, meanwhile,has advised today that it has gained institutional acceptances for 9.72% of SYB, bringing its total interest in SYB to 29.73%.
PBG announced it has entered into a conditional agreement to sell its New Zealand Foams, Flooring and Bedding businesses toVita New Zealand Limited. Final details will be released once approvals are given and the transaction is complete. The partiesanticipate that the transaction will completed early in 2008.
CDR has announced the appointment of Ms Amanda Lacaze as Managing Director and CEO from 7 January 2008. Mr Cootetendered his resignation as CEO and director today. The CDR chairman stated that CDR will continue to look at options torecapitalise and will not contemplate any break up of its core elements. Ms Lacaze has over 20 years experience inmanagement and marketing with key roles within Telstra, Orion Telecom and AOL|7. Shane Allan also joins the company as anon-executive director.
Symbion Health Limited (SYB) - Primary snares 30% interest as Healthscope increases stake to 11% 10-Dec-07 13:00
Fairfax Media (FXJ) - To retain radio stations acquired in merger with Rural Press 10-Dec-07 12:59
Healthscope (HSP) - Increases interest in SYB to 11%, as Primary moves to 30% 10-Dec-07 12:46
Pacific Brands (PBG) - Sells NZ Foams, Flooring and Bedding businesses 10-Dec-07 12:43
Commander Communications (CDR) - New commander takes the helm 10-Dec-07 12:32
Page 11

Private Bank Daily Bulletin
DXL has been placed in a trading halt at the request of the company. The securities will remain in pre-open until the earlier ofthe commencement of trading on Wednesday, 12 December 2007 or when the announcement is released to the market. DXLhas not disclosed the reason behind the trading halt.
SPN has decided not to proceed with the proposed acquisition of the Alinta assets and businesses from its majoritysecurityholder Singapore Power International Pte Ltd. It is due to the ongoing deterioration in capital markets, in particular debtcapital markets after the release of the Explanatory Memorandum. SPN has incurred a portion of the costs of the transaction,estimated at approximately $26M. SPN will maintain its FY08 full year distribution guidance of 11.55 cps.
ANZ advised that it has received advanced accreditation under the new Basel Capital Accord (i.e. Basel II) from the prudentialregulator, APRA. The net effect is that ANZ expects some reduction in the minimum allowable regulatory capital requirements,however the net impact is still being finalised. APRA has placed a cap of 10% in 2008 and 2009 on any reduction in capital fromthe Basel II changes. The approval is effective from 1 Jan 08.
BNB announced the placement of two-thirds of the equity capital in BNB Development Fund (BBDF) to Assicurazioni Generaligroup of Italy. BBDF is a 9 year closed end Italian real estate investment fund established and managed by BBSGR, thelicensed Italian asset management company of BNB. Its initial portfolio comprises three developments in Northern Italy with avalue in excess of €300M. BNB through BBSGR will retain management responsibility over the Fund following the sell down.
Dyno Nobel (DXL) - Trading Halt 10-Dec-07 11:57
SP AusNet (SPN) - Cancellation of the Alinta assets acquisition 10-Dec-07 11:47
ANZ Bank (ANZ) - ANZ achieves advanced accreditation under regulatory capital changes 10-Dec-07 11:25
Babcock & Brown (BNB) - Assicurazioni Generali Group invests in BNB Development Fund 10-Dec-07 11:05
Page 12

Private Bank Daily Bulletin
On the 5-Nov-07, an acquisition proposal was put forward by China National Chemical Corp, The Blackstone Group and FoxPaine Management III to acquire NUF. NUF have advised today that there has been no formalised proposal received and thatdiscussions between NUF and the consortium have ceased. Management stated that NUF will continue with its expansion plansin the context of a very positive environment and future outlook for companies involved in agricultural industries.
MQG announced that Macquarie Bank Ltd (MBL) has received accreditation from the Australian Prudential Regulatory Authority(APRA) to adopt the advanced approach under Basel II from credit risk and operational risk. MQG does not expect any materialreduction in MBL’s regulatory capital as a result of the implementation of Basel II.
DOW has announced the appointment of Mr Geoff Knox as its CEO. He will commence duties on 1 February 2008 andsucceeds Brent Waldron, who was appointed on an interim basis. Prior to accepting the CEO role with DOW, Mr Knox wasGlobal executive director, Hatchcos Holdings; Executive Chairman, Hatch Associates; and Global Managing Director, HatchInfrastructure. He was also the former President of BHP Engineering and VP of BHP Project Management.
From 1 Jan 08 CBA has received advanced accreditation under the new Basel Capital Accord (i.e. Basel II) from the prudentialregulator, APRA. CBA expects its total regulatory capital ratio to rise above 10%, however it does not anticipate a materialchange in capital management until the net impact is finalised. APRA has placed a cap of 10% in 2008 and 2009 on anyreduction in capital from the Basel II changes. CBA also noted it is considering applying for Financial Holding Company status.
BHP has approved the Kilpspruit Energy Coal Project in South Africa. The Kilpspruit mine currently has a capacity of 4.8Mtpa,this will be expanded to 8Mtpa at a cost of US$450M. The project includes the development of a 16Mtpa coal processing plantcalled Phola Coal, a 50:50 JV with Anglo Coal. The plant will process 8Mtpa from each JV partner. The increased production isexpected to commence in 2H CY09. The mine is expected to have a 20 year life with current reserves.
WBC advised that it has received advanced accreditation under the new Basel Capital Accord (i.e. Basel II) from the prudentialregulator, APRA. The net effect is that WBC expects to see an increase in its regulatory capital ratios, though the net impact isstill being finalised. APRA has placed a cap of 10% in 2008 and 2009 on any reduction in capital from the Basel II changes. Theapproval is effective from 1 Jan 08.
HIL has been placed in a pre-open trading halt. HIL securities will remain in pre-open until 12 Dec 07. Management hasrequested this halt while capital is raised to fund the recent proposed acquisition of BSA, as well as further growth. The fundingis expected to take the form of a $50M placement and a $50M Share Purchase Plan. Further details will be released to themarket in due course.
Nufarm (NUF) - Acquisition proposal fails to meet deadline 10-Dec-07 11:01
Macquarie Group Limited (MQG) - Macquarie Bank receives Basel II accreditation from APRA 10-Dec-07 10:52
Downer EDI Limited (DOW) - Appoints Geoff Knox as CEO 10-Dec-07 10:15
Commonwealth Bank (CBA) - CBA achieves advanced accreditation under regulatory capital changes 10-Dec-07 09:49
BHP Billiton Limited (BHP) - Kilpspruit Coal Project approved 10-Dec-07 09:32
Westpac (WBC) - WBC achieves advanced accreditation under regulatory capital changes 10-Dec-07 09:19
Hills Industries (HIL) - Trading halt 10-Dec-07 09:00
Page 13

Private Bank Daily Bulletin
Daily Research Reports
Following RMD's recent recovery in share price, we have reviewed our modelling assumptions. Given the early stage andpotential size of RMD's sleep disordered breathing market, we have assigned a higher growth rate than the 3% GDP level for afurther 10 years beyond the standard 10-year forecast period. As a result of making this adjustment to our perpetuity value, our12-month target price for RMD has increased by 17%. We remain neutral on RMD on both 12-month and 3-year investmenthorizons.
SPN has decided not to proceed with the proposed acquisition of the Alinta assets and businesses from its majority securityholder, Singapore Power International Pte Ltd (SPI). This is due to the ongoing deterioration in support from capital markets, inparticular debt capital markets, after the release of the Explanatory Memorandum. SPN has incurred a portion of the costs of thetransaction, estimated at approximately $26M. SPN will maintain its FY08 full-year distribution guidance of 11.55cps.
We have reviewed our AWC model in light of its recent share price decline, and we consider it necessary to change ourrecommendation.
In light of the recent fall in share price, we have reviewed our model. We have increased expected working capital requirements,which increased forecast interest expense and lowered forecast earnings. We also note that API's recent ejection from theASX200 index is likely to be associated with declining institutional interest in the stock, and therefore weaker investor sentimentto the stock going forward. We retain our neutral view on 12-month and long-term investment horizons.
BBI announced that it has acquired interests in three port operators located in Germany, Belgium and the US. BBI subsidiaryBenelux Port Holdings has acquired 43% of the Westerlund Group (Belgium) with negotiations on the remaining 57% stillunderway. BBI acquired 50% of Seehafen Rostock Umschlagsgesellchaft GmbH (Germany) with pre-emptive rights over theremaining 50%. Lastly, BBI has entered an agreement to acquire 50% of ICS Logistics Inc (US). The acquisitions have an EV of~A$616.5M.
ResMed (RMD) - Model changes...we HOLD our view
SP AusNet (SPN) - Cancellation of the Alinta assets acquisition
Alumina Ltd (AWC) - Recommendation upgrade
Aust Pharmaceutical (API) - Model changes...no change to view
Babcock & Brown Infrastructure Group (BBI) - BBI pursues its port consolidation strategy
Page 14

Health CareJohn Kessell
ASX: RMD Bloomberg: RMD AU Reuters: RMD.AX 10 December 2007
ResMedModel changes...we HOLD our view
EventFollowing RMD's recent recovery in share price, we have reviewed ourmodelling assumptions. Our standard model methodology involves 10years of forecast cash flows followed by a perpetuity value based on anassumption that earnings growth in the long term revert to an averageGDP growth rate of 3%. Given the early stage and potential size ofRMD's sleep disordered breathing market, we have modelled out ahigher growth rate than the 3% GDP level for a further 10 years beyondthe standard 10-year forecast period. By the end of this period, we dropthe growth rate to 3%.
ImplicationsAs a result of making this adjustment to our perpetuity value, our 12-month target price for RMD has increased by 17% to $5.93. Our basicrecommendation on RMD remains HOLD for both 12-month and 3-yearinvestment horizons.
Investment OpinionResMed remains the global leader in the Sleep Disordered Breathing(SDB) market, although CY07's product recall and loss of salesmomentum to competitor Respironics is concerning. Management isexperienced and stable. The SDB market is in its infancy, with studiesincreasingly showing links of SDB to serious medical conditions suchas heart disease and diabetes. Our long-term view is neutral.
We continue to like RMD's long-term market opportunity in sleepdisordered breathing, as well as its high quality product suite. However,we would like to see a reversal of the downward trend in sales growthand margins, and consider earnings risks to be to the downside. Atcurrent prices, RMD appears fairly valued.
Key Information
Price Performance
Market Statistics
Key Assumptions
Share Price $5.4012 month view HOLD12 month target return (%) 9.8
12 month target price $5.93
Long Term View HOLDLong Term Target Return (% pa) 11.3
3 year target price n/a
Market Cap (M) $4,226
Shares (M) 782.5
% of Market 0.20
% of Sector 7.23
12 Month Range $4.34 - $7.04
Company Risk
Share Price Risk
Ethical rating
Performance against indices (%)3 Months 6 Months 12 Months
RMD 6.1 3.8 (14.7)Sector 5.1 14.8 32.7Market 7.7 6.8 23.5
Beta: 1.1
Market risk premium (%): 5.5
Risk free rate (%): 6.1
WACC (%): 11.3
Forecast cashflow (years): 10
Residual value % of total valuation: 61.2
Nominal terminal growth rate (%): 3.0
Earnings Summary
1 NPAT and EPS are adjusted by removing non-recurring items. All the above statistics are derived from normalised earnings.
Yr to Jun NPATRep $M
NPAT1
Adj $MEPS1
cEPS chg
%PER
xPER rel
All Ords xPER rel
Sector xDPS
cYield
%Franking
%ROE
%
2006A 119.5 129.9 17.3 39.6 31.2 1.4 0.8 0.0 0.0 0 17.0
2007A 83.2 139.2 18.3 5.5 29.6 1.5 1.0 0.0 0.0 0 13.4
2008F 135.3 140.5 18.3 0.2 29.5 1.9 1.2 0.0 0.0 0 12.5
2009F 170.8 176.1 22.7 23.9 23.8 1.7 1.1 0.0 0.0 0 13.2

ResMed
Year end Jun. All figures in A$M
Notes: 1. The 12M recommendation rates stocks on a 12 month, absolute basis based on the total return (capital and dividends). BUY denotes an expectation of 15% ormore total return; SELL 5% or less; HOLD within the range of 5-15%. ACCEPT OFFER relates to a situation where there is a public offer for shares and our view is toaccept that offer.2. The Long Term Recommendation rates stocks on a long term, absolute basis based on the average total return per annum (capital and dividends). BUY denotes a longterm expectation of 1% or more above the cost of equity (also known as the required return, which measures the the return required by investors given the company's risk);HOLD within the range of 1% above and 3% below the cost of equity; SELL more than 3% below the cost of equity but above a total forecast annual return for the stock of0%; AVOID denotes a long term expectation of a total annual return below 0%. ACCEPT OFFER relates to a situation where there is a public offer for shares and our viewis to accept that offer.
12M Recommendation1: HOLD 12M Target: $5.93 Long Term Recommendation 2: HOLD Long Term Target Return: 11.3% pa
Profit & loss summary 2006A 2007A 2008F 2009F
Operating revenue 821.6 883.6 945.0 1,127.4Invest & other income 1.8 0.0 0.0 0.0
EBITDA 223.4 237.1 229.9 276.3Depreciation/Amort (35.9) (39.8) (44.2) (47.7)
EBIT 187.5 197.3 185.8 228.7Net Interest 1.7 6.0 16.6 26.6
Pre-tax profit 189.2 203.3 202.4 255.3Tax expense (59.3) (64.1) (61.9) (79.1)
Minorities/Assoc./Prefs 0.0 0.0 0.0 0.0
NPAT 129.9 139.2 140.5 176.1Non recurring items (4.8) (50.3) 0.0 0.0
Reported profit 119.5 83.2 135.3 170.8NPAT add Goodwill & Pref 0.0 0.0 0.0 0.0
Adjusted profit 129.9 139.2 140.5 176.1
Cashflow summary 2006A 2007A 2008F 2009F
EBITDA 223.4 237.1 229.9 276.3Working capital changes (55.8) (85.2) (25.7) (58.4)
Interest and tax (66.8) (54.5) (19.6) (44.4)
Other operating items 25.7 0.0 0.0 0.0
Operating cashflow 126.4 97.4 184.6 173.6Required capex (138.8) (32.1) (31.1) (33.6)
Maintainable cashflow (12.4) 65.3 153.4 140.0Dividends 0.0 0.0 0.0 0.0
Acq/Disp (14.2) 0.0 0.0 0.0
Other investing items (8.9) (71.8) 0.0 0.0
Free cashflow (35.4) (6.5) 153.4 140.0Equity 59.4 0.0 0.0 67.2
Debt inc/(red'n) 71.6 (29.7) (153.4) (207.2)
Balance sheet 2006A 2007A 2008F 2009FCash & deposits 295.4 334.2 371.8 593.0
Inventories 156.3 189.2 199.2 239.0
Trade debtors 185.9 202.0 204.6 245.5
Other curr assets 49.0 77.8 72.2 77.3
Total current assets 686.5 803.2 847.8 1,154.9Prop., plant & equip. 330.1 373.7 342.6 340.2
Non-curr intangibles 329.0 304.9 284.9 289.3
Non-curr investments 0.0 0.0 0.0 0.0
Other non-curr assets 9.5 23.2 22.1 22.9
Total assets 1,355.1 1,505.0 1,497.4 1,807.2Trade creditors 60.6 63.8 64.7 77.7
Curr borrowings 6.6 34.1 32.5 33.6
Other curr liabilities 106.4 144.0 162.8 176.5
Total current liab. 173.6 241.9 260.0 287.7Borrowings 156.3 105.5 0.0 0.0
Other non-curr liabilities 32.1 37.0 35.2 36.4
Total liabilities 362.0 384.4 295.2 324.2Minorities/Convertibles 0.0 0.0 0.0 0.0
Shareholders equity 993.1 1,120.6 1,202.2 1,483.0
Ratio analysis 2006A 2007A 2008F 2009FRevenue growth (%) 48.4 7.5 7.0 19.3
EBITDA growth (%) 38.3 6.1 (3.0) 20.2
EPS growth (%) 39.6 5.5 0.2 23.9
EBITDA/Sales margin (%) 27.2 26.8 24.3 24.5
EBIT/Sales margin (%) 22.8 22.3 19.7 20.3
Tax rate (%) 31.3 31.6 30.6 31.0
Net debt/equity (%) (13.3) (17.4) (28.2) (37.7)
Net debt/net debt + equity (%) (15.4) (21.0) (39.3) (60.6)
Net interest cover (x) n/a n/a n/a n/a
Payout ratio (%) 0.0 0.0 0.0 0.0
Capex to deprec'n (%) 387.7 80.6 70.5 70.5
NTA per share ($) 0.88 1.09 1.19 1.50
ROA (%) 15.9 14.1 12.9 13.9
ROE (%) 17.0 13.4 12.5 13.2
Multiple analysis 2006A 2007A 2008F 2009FMarket cap (M) 4,226
Net debt ($M) (199.6)
Peripheral assets ($M) (0.0)
Enterprise value ($M) 4,026.1
EV/EBIT (x) 21.5 20.4 21.7 17.6
EV/EBITDA (x) 18.0 17.0 17.5 14.6EV/EBITDA All Ind (x) 10.3 9.2 8.2 7.6
EV/EBITDA rel All Ind (x) 1.8 1.8 2.1 1.9
P/E (x) 31.2 29.6 29.5 23.8P/E rel All Ind (x) 1.3 1.5 1.8 1.6
P/E rel All Ind ex banks (x) 1.2 1.5 1.8 1.6
P/E sector (x) 36.8 30.1 25.6 21.6
P/E rel sector (x) 0.8 1.0 1.2 1.1
Assumptions 2006A 2007A 2008F 2009FUS$/A$ ($) 0.74 0.79 0.87 0.86
Euro/A$ ($) 0.61 0.60 0.59 0.58
Inflation (%) 3.20 3.09 2.47 2.50
Notes To AccountsAll P&L items (except Reported profit) now exclude GoodwillAmortisation as per the IFRS requirements. Note: RMD reports inUSD but all data are translated into AUD in this table.
Copyright © 2000 - 2007 Aegis Equities Holdings Pty Limited. All rights reserved.This information must be read in conjunction with the Legal Notice which can be located at http://www.aegis.com.au/public/disclaimer.aspx.

UtilitiesWilbur Tong
ASX: SPN Bloomberg: SPN AU Reuters: SPN.AX 10 December 2007
SP AusNetCancellation of the Alinta assetsacquisition
EventSPN has decided not to proceed with the proposed acquisition of theAlinta assets and businesses from its majority security holder,Singapore Power International Pte Ltd (SPI). SPN's decision is due tothe ongoing deterioration in support from capital markets, in particularthe debt capital markets, after the release of the ExplanatoryMemorandum. SPN has incurred a portion of the costs of thetransaction, estimated at approximately $26M. SPN will maintain itsFY08 full-year distribution guidance of 11.55cps.
ImplicationsSince the announcement of the potential acquisition of Alinta assets on20 September 2007, the market has reacted unfavourably to the news.Our recommendation to security holders in our last report to voteagainst the acquisition is consistent with the market view that thetransaction is not value-accretive to SPN. The decision by SPN not toproceed with the proposed acquisition from its parent, SPI, will improvethe company's outlook in our view. We believe SPN's 12-month pricetarget will revert back to our original forecast of $1.43, based on itsexisting businesses, after allowing for adjustment of the incurredtransaction costs. In our opinion, the market has been sold down sincethe pre-announcement high at $1.39. We are reverting both our short-and long-term recommendations from Hold back to BUY.
Investment OpinionWe view SPN as a solid income-type investment. We like SPN'sportfolio of strong cash flow Victorian-based energy transmission anddistribution assets, which offer scope for moderate electricity and gasdistribution volume growth. The extension into other business streamsis clearly within SPN's strategy as it identified an interest in non-regulated revenue streams. SPN is backed by Singapore Power Ltd,which has significant experience in both transmission and distributionoperations.
SPN's immediate outlook is for steady cash flow generation derivedfrom its utility assets. While it will report negative free cash flow, thereis sufficient debt capacity to support CPI-like growth in the distributions.We feel SPN is a stable reliable infrastructure player providing a gooddividend yield.
Key Information
Price Performance
Market Statistics
Key Assumptions
Share Price $1.2912 month view BUY12 month target return (%) 20.5
12 month target price $1.43
Long Term View BUYLong Term Target Return (% pa) 13.6
3 year target price n/a
Market Cap (M) $2,689
Shares (M) 2,092.7
% of Market 0.13
% of Sector 7.63
12 Month Range $1.16 - $1.55
Company Risk
Share Price Risk
Ethical rating
Performance against indices (%)3 Months 6 Months 12 Months
SPN (7.6) (7.2) (4.1)Sector (4.8) (8.1) 3.9Market 7.7 6.8 23.5
Beta: 0.8
Market risk premium (%): 5.5
Risk free rate (%): 6.1
WACC (%): 7.7
Forecast cashflow (years): 10
Residual value % of total valuation: 68.9
Nominal terminal growth rate (%): 3.0
Earnings Summary
1 NPAT and EPS are adjusted by removing non-recurring items. All the above statistics are derived from normalised earnings.
Yr to Mar NPATRep $M
NPAT1
Adj $MEPS1
cEPS chg
%PER
xPER rel
All Ords xPER rel
Sector xDPS
cYield
%Franking
%Deferred Tax
%
2006A 367.6 136.9 6.5 n/a 19.6 0.9 0.6 3.3 2.5 5 68
2007A 178.5 161.5 7.7 18.0 16.7 0.9 0.7 11.3 8.8 9 64
2008F 158.6 176.8 8.4 9.5 15.2 1.0 0.8 11.6 9.0 9 60
2009F 158.4 158.4 7.6 (10.4) 17.0 1.2 1.0 11.8 9.2 9 59

SP AusNet
Year end Mar. All figures in A$M
Notes: 1. The 12M recommendation rates stocks on a 12 month, absolute basis based on the total return (capital and dividends). BUY denotes an expectation of 15% ormore total return; SELL 5% or less; HOLD within the range of 5-15%. ACCEPT OFFER relates to a situation where there is a public offer for shares and our view is toaccept that offer.2. The Long Term Recommendation rates stocks on a long term, absolute basis based on the average total return per annum (capital and dividends). BUY denotes a longterm expectation of 1% or more above the cost of equity (also known as the required return, which measures the the return required by investors given the company's risk);HOLD within the range of 1% above and 3% below the cost of equity; SELL more than 3% below the cost of equity but above a total forecast annual return for the stock of0%; AVOID denotes a long term expectation of a total annual return below 0%. ACCEPT OFFER relates to a situation where there is a public offer for shares and our viewis to accept that offer.
12M Recommendation1: BUY 12M Target: $1.43 Long Term Recommendation 2: BUY Long Term Target Return: 13.6% pa
Profit & loss summary 2006A 2007A 2008F 2009F
Operating revenue 737.5 1,019.3 1,069.9 1,093.7Invest & other income 0.0 0.0 0.0 0.0
EBITDA 492.2 624.7 675.9 710.1Depreciation/Amort (148.6) (200.0) (209.7) (232.9)
EBIT 343.6 424.7 466.2 477.1Net Interest (166.1) (219.2) (238.8) (273.6)
Pre-tax profit 177.5 205.5 227.4 203.5Tax expense (40.6) (44.0) (50.6) (45.1)
Minorities/Assoc./Prefs 0.0 0.0 0.0 0.0
NPAT 136.9 161.5 176.8 158.4Non recurring items 230.7 17.1 (18.2) 0.0
Reported profit 367.6 178.5 158.6 158.4NPAT add Goodwill & Pref 0.0 0.0 0.0 0.0
Adjusted profit 136.9 161.5 176.8 158.4
Cashflow summary 2006A 2007A 2008F 2009F
EBITDA 492.2 624.7 675.9 710.1Working capital changes 112.6 16.1 13.0 0.4
Interest and tax (175.2) (251.8) (298.4) (310.0)
Other operating items (251.8) 1.4 (2.8) 0.7
Operating cashflow 177.9 390.4 387.7 401.1Required capex (294.8) (320.4) (327.3) (300.5)
Maintainable cashflow (117.0) 70.0 60.4 100.6Dividends 0.0 (185.9) (238.8) (244.8)
Acq/Disp 2,046.1 (80.0) 0.4 0.0
Other investing items (0.6) 2.3 (26.0) 0.0
Free cashflow 1,928.6 (193.6) (204.0) (144.1)Equity 8.1 0.0 0.0 0.0
Debt inc/(red'n) (1,974.8) 194.0 203.8 144.1
Balance sheet 2006A 2007A 2008F 2009FCash & deposits 8.7 9.1 9.0 9.0
Inventories 6.5 5.9 6.2 6.2
Trade debtors 132.0 140.9 135.7 137.3
Other curr assets 194.6 34.2 186.7 186.7
Total current assets 341.8 190.1 337.6 339.2Prop., plant & equip. 6,227.1 6,312.2 6,437.0 6,504.6
Non-curr intangibles 354.5 354.5 354.5 354.5
Non-curr investments 0.0 0.0 0.0 0.0
Other non-curr assets 23.7 75.5 87.1 87.1
Total assets 6,947.0 6,932.3 7,216.1 7,285.4Trade creditors 140.3 165.7 173.8 175.8
Curr borrowings 644.4 619.9 619.9 619.9
Other curr liabilities 196.4 95.3 34.5 43.8
Total current liab. 981.2 880.9 828.2 839.5Borrowings 2,870.4 2,940.3 3,021.5 3,165.6
Other non-curr liabilities 516.9 457.7 781.0 781.2
Total liabilities 4,368.4 4,278.9 4,630.7 4,786.3Minorities/Convertibles 0.0 0.0 0.0 0.0
Shareholders equity 2,581.6 2,652.6 2,585.4 2,499.1
Ratio analysis 2006A 2007A 2008F 2009FRevenue growth (%) 109.6 38.2 5.0 2.2
EBITDA growth (%) 104.9 26.9 8.2 5.1
EPS growth (%) n/a 18.0 9.5 (10.4)
EBITDA/Sales margin (%) 66.7 61.3 63.2 64.9
EBIT/Sales margin (%) 46.6 41.7 43.6 43.6
Tax rate (%) 22.9 21.4 22.3 22.2
Net debt/equity (%) 135.8 133.9 140.5 151.1
Net debt/net debt + equity (%) 57.6 57.2 58.4 60.2
Net interest cover (x) 2.1 1.9 2.0 1.7
Payout ratio (%) 49.7 146.0 136.8 156.4
Capex to deprec'n (%) 198.4 160.2 156.1 129.0
NTA per share ($) 1.06 1.10 1.07 1.02
ROA (%) 5.0 6.0 6.5 6.6
ROE (%) 7.3 6.1 6.7 6.2
Multiple analysis 2006A 2007A 2008F 2009FMarket cap (M) 2,689
Net debt ($M) 3,632.4
Peripheral assets ($M) (0.0)
Enterprise value ($M) 6,321.5
EV/EBIT (x) 18.4 14.9 13.6 13.2
EV/EBITDA (x) 12.8 10.1 9.4 8.9EV/EBITDA All Ind (x) 10.3 9.2 8.2 7.6
EV/EBITDA rel All Ind (x) 1.2 1.1 1.1 1.2
P/E (x) 19.6 16.7 15.2 17.0P/E rel All Ind (x) 0.8 0.8 0.9 1.1
P/E rel All Ind ex banks (x) 0.8 0.8 0.9 1.1
P/E sector (x) 30.7 25.1 19.3 16.8
P/E rel sector (x) 0.6 0.7 0.8 1.0
Assumptions 2006A 2007A 2008F 2009FGDP growth (%) 4.17 2.41 2.87 3.58
Interest Rates (%) 5.65 6.19 6.85 7.50
Inflation (%) 2.82 3.56 2.36 2.50
Copyright © 2000 - 2007 Aegis Equities Holdings Pty Limited. All rights reserved.This information must be read in conjunction with the Legal Notice which can be located at http://www.aegis.com.au/public/disclaimer.aspx.

MaterialsGaius King
ASX: AWC Bloomberg: AWC AU Reuters: AWC.AX 10 December 2007
Alumina LtdRecommendation upgrade
EventWe have reviewed our AWC model in light of its recent share pricedecline, and we consider it necessary to change our recommendation.
ImplicationsGiven recent turmoil in global markets and negative sentimentassociated with the general slowdown expected in the US economy,especially in the area of housing, it is not surprising that aluminiumconsumption has declined 6% in the US. Aluminium consumptiongrowth elsewhere flourished, from a modest 3% increase in Europe to45% increase in Chinese demand. Although we expect aluminiumprices to moderate by 7% in 2008, aluminium demand is expected todouble by 2020. To reach this target, annual production growth wouldhave to increase at a global compound rate of 6% per annum over thenext 12 years.
At its current share price, we have adopted a positive view onAWC, forecasting a total 12-month return of 22% on the stock. Hence,we are changing our 12-month recommendation for AWC from Hold toBUY. The current difference between our IRR and its cost of equity is1.74%. Therefore, we are also changing our long-termrecommendation on AWC from Hold to BUY.
Investment OpinionAWC is a 40% partner in Alcoa World Alumina & Chemicals (AWAC), aglobally dominant, low-cost bauxite mining and alumina refiningcompany. Earnings tend to be cyclical, with the alumina price linkedthrough long-term contracts to the LME aluminium price, typically in the12.5%–13.0% range; this increases in periods of high demand. Alcoamay decide at some stage to bid for Alumina and move to 100% ofAWAC.
The aluminium market is in the midst of flux, with rapid growth inproduction from China, which now accounts for 33% of the globaloutput. This is closely matched with China's growth in consumption,estimated by AWC to be above 20% per annum. We anticipate thatAWC's strong business fundamentals will continue into 2008. Increasedproductive capacity coming on-stream and a relatively strongaluminium market will result in solid earnings.
Key Information
Price Performance
Market Statistics
Key Assumptions
Share Price $6.4812 month view BUY12 month target return (%) 21.3
12 month target price $7.55
Long Term View BUYLong Term Target Return (% pa) 16.1
3 year target price n/a
Market Cap (M) $7,337
Shares (M) 1,129
% of Market 0.36
% of Sector 1.05
12 Month Range $5.90 - $8.88
Company Risk
Share Price Risk
Ethical rating
Performance against indices (%)3 Months 6 Months 12 Months
AWC (4.7) (18.5) 0.2Sector 15.9 23.4 49.0Market 8.1 7.3 24.0
Beta: 1.5
Market risk premium (%): 5.5
Risk free rate (%): 6.1
WACC (%): 11.7
Forecast cashflow (years): 10
Residual value % of total valuation: 51.9
Nominal terminal growth rate (%): 3.0
Earnings Summary
1 NPAT and EPS are adjusted by removing non-recurring items. All the above statistics are derived from normalised earnings.
Yr to Dec NPATRep $M
NPAT1
Adj $MEPS1
cEPS chg
%PER
xPER rel
All Ords xPER rel
Sector xDPS
cYield
%Franking
%ROE
%
2006A 569 511 43.8 36.7 14.8 0.7 0.8 22.0 3.4 100 34.5
2007F 469 469 41.5 (5.2) 15.6 0.8 0.9 20.0 3.1 100 27.9
2008F 517 517 45.8 10.3 14.2 0.9 1.0 31.0 4.8 100 28.2
2009F 553 553 49.0 6.9 13.2 0.9 1.1 30.5 4.7 100 27.1

Alumina Ltd
Year end Dec. All figures in A$M
Notes: 1. The 12M recommendation rates stocks on a 12 month, absolute basis based on the total return (capital and dividends). BUY denotes an expectation of 15% ormore total return; SELL 5% or less; HOLD within the range of 5-15%. ACCEPT OFFER relates to a situation where there is a public offer for shares and our view is toaccept that offer.2. The Long Term Recommendation rates stocks on a long term, absolute basis based on the average total return per annum (capital and dividends). BUY denotes a longterm expectation of 1% or more above the cost of equity (also known as the required return, which measures the the return required by investors given the company's risk);HOLD within the range of 1% above and 3% below the cost of equity; SELL more than 3% below the cost of equity but above a total forecast annual return for the stock of0%; AVOID denotes a long term expectation of a total annual return below 0%. ACCEPT OFFER relates to a situation where there is a public offer for shares and our viewis to accept that offer.
12M Recommendation1: BUY 12M Target: $7.55 Long Term Recommendation 2: BUY Long Term Target Return: 16.1% pa
Profit & loss summary 2006A 2007F 2008F 2009F
Operating revenue 3,048 2,819 3,007 3,072Invest & other income (2) 1 (14) (15)
EBITDA 928 852 946 1,007Depreciation/Amort (115) (126) (138) (152)
EBIT 812 726 808 855Net Interest (14) (45) (69) (66)
Pre-tax profit 798 681 738 790Tax expense (287) (213) (222) (237)
Minorities/Assoc./Prefs 0 0 0 0
NPAT 511 469 517 553Non recurring items 58 0 0 0
Reported profit 569 469 517 553NPAT add Goodwill & Pref 0 0 0 0
Adjusted profit 511 469 517 553
Cashflow summary 2006A 2007F 2008F 2009F
EBITDA 928 852 946 1,007Working capital changes (76) (332) (29) (6)
Interest and tax (16) (326) (255) (296)
Other operating items (169) 293 44 20
Operating cashflow 667 488 705 726Required capex (259) (77) (86) (98)
Maintainable cashflow 408 411 619 628Dividends (233) (276) (265) (350)
Acq/Disp 0 (614) (384) (92)
Other investing items 16 0 0 0
Free cashflow 190 (479) (30) 186Equity 10 (250) 0 0
Debt inc/(red'n) 139 589 30 (186)
Balance sheet 2006A 2007F 2008F 2009FCash & deposits 169 0 0 0
Inventories 0 109 119 120
Trade debtors 0 222 242 246
Other curr assets 2 2 2 2
Total current assets 171 332 363 368Prop., plant & equip. 0 360 677 700
Non-curr intangibles 0 0 0 0
Non-curr investments 2,186 2,402 2,402 2,402
Other non-curr assets 0 0 0 0
Total assets 2,358 3,094 3,442 3,471Trade creditors 13 11 12 12
Curr borrowings 380 576 581 589
Other curr liabilities 2 109 159 169
Total current liab. 395 696 752 770Borrowings 208 546 571 377
Other non-curr liabilities 0 162 177 180
Total liabilities 603 1,405 1,501 1,327Minorities/Convertibles 0 0 0 0
Shareholders equity 1,755 1,690 1,941 2,144
Ratio analysis 2006A 2007F 2008F 2009FRevenue growth (%) 22.9 (7.5) 6.7 2.1
EBITDA growth (%) 42.0 (8.1) 11.0 6.5
EPS growth (%) 36.7 (5.2) 10.3 6.9
EBITDA/Sales margin (%) 30.4 30.2 31.4 32.8
EBIT/Sales margin (%) 26.6 25.8 26.8 27.8
Tax rate (%) 36.0 31.2 30.0 30.0
Net debt/equity (%) 23.9 66.4 59.3 45.0
Net debt/net debt + equity (%) 19.3 39.9 37.2 31.1
Net interest cover (x) 56.8 16.2 11.7 13.0
Payout ratio (%) 50.3 48.2 67.7 62.3
Capex to deprec'n (%) 224.7 60.8 62.2 64.6
NTA per share ($) 1.55 1.50 1.72 1.90
ROA (%) 29.8 28.2 24.7 24.8
ROE (%) 34.5 27.9 28.2 27.1
Multiple analysis 2006A 2007F 2008F 2009FMarket cap (M) 7,337
Net debt ($M) 768
Peripheral assets ($M) 0
Enterprise value ($M) 8,105
EV/EBIT (x) 10.0 11.4 10.0 9.5
EV/EBITDA (x) 8.7 9.7 8.6 8.0EV/EBITDA All Ind (x) 10.3 9.3 8.2 7.6
EV/EBITDA rel All Ind (x) 0.8 1.0 1.0 1.1
P/E (x) 14.8 15.6 14.2 13.2P/E rel All Ind (x) 0.6 0.8 0.8 0.9
P/E rel All Ind ex banks (x) 0.6 0.8 0.8 0.9
P/E sector (x) 19.1 17.6 14.0 11.9
P/E rel sector (x) 0.8 0.9 1.0 1.1
Assumptions 2006A 2007F 2008F 2009FUS$/A$ ($) 0.75 0.84 0.87 0.84
Aluminium (US$/lb) 1.18 1.21 1.13 1.05
GDP growth (%) 2.66 2.63 3.47 3.49
Copyright © 2000 - 2007 Aegis Equities Holdings Pty Limited. All rights reserved.This information must be read in conjunction with the Legal Notice which can be located at http://www.aegis.com.au/public/disclaimer.aspx.

Alumina Ltd
Aluminium Supply
� Unlike many other commodities, Aluminium has not displayed the spectacular price increases (see Figure 2).
� We expect that average aluminium price will drop by 7.2% to $2,481/t next year from an expected $2,673/t thisyear. Production is expected to exceed consumption for a second successive year, leading to a build in stocks to around5.4 weeks’ consumption by the end of 2008 from 4.6 weeks’ consumption at the end of this year.
TABLE 2: ALUMINIUM PRODUCTION, CONSUMPTION AND FORECAST 2008 PRICE
Source: ABARE/Aegis Equities * CY2007 over CY2008
FIGURE 2: ALUMINIUM LME STOCKPILE AND PRICE
Source: Bloomberg/Aegis Equities
� ABARE expects average alumina prices to fall by 10% to an average US$296/t in 2008 from around $330/t this year.This year’s expected average already represents a 24% reduction from 2006 prices. Despite the strong increase inglobal aluminium production this year - and thus in alumina consumption - alumina production growth in the likes ofChina, Australia, Brazil and Russia is expected to exceed consumption growth in the short-term.
� According to the International Aluminium Institute, global aluminium production has increased a staggering 12.7% on apcp basis, primarily from China, as well as contributions from Argentina, Brazil, Iceland, India, Iran, Russia and theUnited Arab Emirates.
� This production growth is, however, expected to moderate dramatically, as the impact of increasing power costs makessome existing facilities uneconomic, such as those that have recently closed in France, Germany and Norway.
Aluminium Demand
� As mentioned previously (see "Updated currency assumptions", released on 4 July 2007), aluminium is a potentialsubstitute for copper (although it only has 65% of copper's conductivity). For example, aluminium can be used forelectrical transformers and long-distance electricity transmission cabling. Since June 2002, aluminium prices havedeclined relative to copper and, currently, aluminium is approximately 30% to 40% of copper prices.
� Despite a 6% decline in consumption by North America, consumption has grown 3.2% in Europe, 5.2% in Asia (withoutChina), 7.8% in Latin America, 9.9% in Russia and 10% for the rest of the world (Alcoa, 2007).
2006a 2007f 2008f % Change*Production kt 33,967 37,730 40,440 7.2%Consumption kt 33,970 37,218 39,599 6.4%Closing Stocks kt 2,764 3,277 4,118 25.7%Weeks consumption 4.2 4.6 5.4 17.4%Price US$/t 2,570 2,673 2,481 -7.2%
Usc/lb 116.6 1.21 1.13 -7.2%
Copyright © 2000 - 2007 Aegis Equities Holdings Pty Limited. All rights reserved.This information must be read in conjunction with the Legal Notice which can be located at http://www.aegis.com.au/public/disclaimer.aspx.

Alumina Ltd
Aluminium Demand (cont.)
� The key driver, however, is Chinese aluminium consumption, which has increased by 45% over the pcp, driven bystrong growth in building construction, expansion of electrical power grids, and growing output of consumer householdproducts and motor vehicles. In the first nine months of 2007, investment in fixed assets, such as factories and housing,increased by around 26% over the pcp, while light motor vehicle production increased by 20%. Over the same period,both electricity production and the production of major white goods increased by 14% (ABARE 2007).
� In 2008, ABARE expects Chinese consumption of aluminium to increase by 13% to almost 13.6Mt as a result ofcontinued strong economic and industrial production growth, with global aluminium demand forecast to double by 2020(WBMS, 2007).
� Aluminium production is forecast to rise by more than 7% to 40.4Mt, largely as a result of continued strong productiongrowth in China. Both 3-month and 15-month futures are in contango (i.e., future expected prices are higher than thoseat present).
FIGURE 3: ALUMINIUM PRICE AND FUTURES DIFFERENTIAL
Source: Bloomberg/Aegis Equities
Outlook
� Given recent turmoil in global markets and negative sentiment associated with the general slowdown expected in the USeconomy, especially in the area of housing, it is not surprising that aluminium consumption has declined 6% in the USonly. We believe that this is predominately the reason why there has been negative sentiment towards AWC.
� Global aluminium demand is forecast to double by 2020. To reach this target, annual production growth would have toincrease at a compound rate of 6% per annum over the next 12 years.
� Chinese consumption of aluminium is forecast to increase by 13% to almost 13.6Mt as a result of continued strongeconomic and industrial production growth.
� As a result of increased capacity coming online in 2007, we expect average aluminium price will drop by 7.2% to$2,481/t next year from an expected $2,673/t this year. Production is expected to exceed consumption for a secondsuccessive year, leading to a build in stocks to around 5.4 weeks’ consumption by the end of 2008 from 4.6 weeks’consumption at the end of this year.
� At its current share price, we have adopted a positive view on AWC, forecasting a total 12-month return of 22% on thestock. Hence, we are changing our 12-month recommendation for AWC from Hold to BUY.
� The current difference between our IRR and its cost of equity is 1.74%. Therefore, we are also changing our long-termrecommendation on AWC from Hold to BUY.
Copyright © 2000 - 2007 Aegis Equities Holdings Pty Limited. All rights reserved.This information must be read in conjunction with the Legal Notice which can be located at http://www.aegis.com.au/public/disclaimer.aspx.

Health CareJohn Kessell
ASX: API Bloomberg: API AU Reuters: API.AX 10 December 2007
Aust PharmaceuticalModel changes...no change to view
EventIn light of the recent fall in share price, we have reviewed our model.We have increased expected working capital requirements as weconsider the levels at which API ended their 16-month transitionalperiod to be unsustainably low. We also note that API's recent ejectionfrom the ASX200 index is likely to be associated with declininginstitutional interest in the stock and, therefore, weaker investorsentiment to the stock going forward.
ImplicationsThe net effect of the increased forecast working capital has been arequirement for increased debt with some increase in interest expenseand consequent decrease in EPS in FY08 and FY09 by around 6%.Our 12-month target price has fallen by 11% to $2.01. We maintain ourHOLD recommendations on 12-month and long-term investmenthorizons.
Investment OpinionAPI is Australia's largest pharmacy distributor and has a large group ofloyal banner-brand pharmacy members (Soul Pattinson, ChemWorld,Pharmacist Advice). The company's reputation suffered further damagein FY07 from a poor operational result following the financialembarrassment suffered in FY06. The Alphapharm partnership is acoup for API. Our long-term view for API is neutral.
The FY07 result showed both Pharmacy and Retail businesses have along way to go to recover, but the interim 4-month result post-FY07showed that the CEO is making good headway in improving thebusiness. The risk to earnings forecasts is diminishing. Nevertheless,continued uncertainty surrounds the new generics-related regulatorychanges to the PBS, to be introduced in 2H CY08. HOLD.
Key Information
Price Performance
Market Statistics
Key Assumptions
Share Price $1.8212 month view HOLD12 month target return (%) 12.0
12 month target price $2.01
Long Term View HOLDLong Term Target Return (% pa) 12.5
3 year target price n/a
Market Cap (M) $472
Shares (M) 257.3
% of Market 0.02
% of Sector 0.80
12 Month Range $1.65 - $2.48
Company Risk
Share Price Risk
Ethical rating
Performance against indices (%)3 Months 6 Months 12 Months
API (6.4) (22.9) (26.3)Sector 5.8 15.6 33.6Market 8.1 7.3 24.0
Beta: 1.3
Market risk premium (%): 5.5
Risk free rate (%): 6.1
WACC (%): 12.2
Forecast cashflow (years): 10
Residual value % of total valuation: 49.9
Nominal terminal growth rate (%): 3.0
Earnings Summary
1 NPAT and EPS are adjusted by removing non-recurring items. All the above statistics are derived from normalised earnings.
Yr to Apr NPATRep $M
NPAT1
Adj $MEPS1
cEPS chg
%PER
xPER rel
All Ords xPER rel
Sector xDPS
cYield
%Franking
%ROE
%
2006A 20.6 39.3 15.3 (9.8) 11.9 0.5 0.3 9.3 5.1 100 8.9
2007A (14.1) 7.3 2.8 (81.5) 64.1 3.3 2.1 0.0 0.0 0 1.8
2008F 27.0 26.0 10.1 257.0 17.9 1.1 0.7 2.5 1.4 100 6.2
2009F 32.6 32.6 12.7 25.2 14.3 1.0 0.7 9.5 5.2 100 7.4

Aust Pharmaceutical
Year end Apr. All figures in A$M
Notes: 1. The 12M recommendation rates stocks on a 12 month, absolute basis based on the total return (capital and dividends). BUY denotes an expectation of 15% ormore total return; SELL 5% or less; HOLD within the range of 5-15%. ACCEPT OFFER relates to a situation where there is a public offer for shares and our view is toaccept that offer.2. The Long Term Recommendation rates stocks on a long term, absolute basis based on the average total return per annum (capital and dividends). BUY denotes a longterm expectation of 1% or more above the cost of equity (also known as the required return, which measures the the return required by investors given the company's risk);HOLD within the range of 1% above and 3% below the cost of equity; SELL more than 3% below the cost of equity but above a total forecast annual return for the stock of0%; AVOID denotes a long term expectation of a total annual return below 0%. ACCEPT OFFER relates to a situation where there is a public offer for shares and our viewis to accept that offer.
12M Recommendation1: HOLD 12M Target: $2.01 Long Term Recommendation 2: HOLD Long Term Target Return: 12.5% pa
Profit & loss summary 2006A 2007A 2008F 2009F
Operating revenue 2,919.6 3,589.3 3,025.7 3,082.4Invest & other income 0.0 0.0 0.0 0.0
EBITDA 71.7 70.1 67.9 72.7Depreciation/Amort (11.7) (21.1) (18.0) (18.5)
EBIT 60.1 49.0 49.9 54.2Net Interest (13.3) (27.6) (0.6) 0.2
Pre-tax profit 46.8 21.4 49.3 54.4Tax expense (7.8) (6.2) (13.8) (16.3)
Minorities/Assoc./Prefs 0.3 (7.9) (9.4) (5.5)
NPAT 39.3 7.3 26.0 32.6Non recurring items (18.8) (21.4) 1.0 0.0
Reported profit 20.6 (14.1) 27.0 32.6NPAT add Goodwill & Pref 0.0 0.0 0.0 0.0
Adjusted profit 39.3 7.3 26.0 32.6
Cashflow summary 2006A 2007A 2008F 2009F
EBITDA 71.7 70.1 67.9 72.7Working capital changes 108.8 65.1 (87.7) 0.7
Interest and tax (21.8) (29.6) (12.7) (15.1)
Other operating items (70.2) (69.8) 0.1 (3.1)
Operating cashflow 88.5 35.8 (32.3) 55.2Required capex (18.3) (23.6) (19.3) (19.9)
Maintainable cashflow 70.2 12.1 (51.6) 35.3Dividends (33.5) (7.7) 0.0 (19.3)
Acq/Disp 21.0 3.1 9.5 1.0
Other investing items (29.1) 5.4 1.0 0.0
Free cashflow 28.7 12.9 (41.2) 17.0Equity 0.0 0.0 0.0 0.0
Debt inc/(red'n) (18.7) (33.4) 41.2 (17.0)
Balance sheet 2006A 2007A 2008F 2009FCash & deposits 36.1 16.1 0.0 0.0
Inventories 251.1 301.0 347.1 343.6
Trade debtors 212.0 148.3 182.7 180.9
Other curr assets 3.0 23.4 23.4 23.4
Total current assets 502.3 488.8 553.2 547.9Prop., plant & equip. 72.6 77.3 69.2 69.6
Non-curr intangibles 212.9 208.6 208.6 208.6
Non-curr investments 30.0 23.8 19.0 16.2
Other non-curr assets 59.3 109.6 109.6 109.6
Total assets 877.0 908.3 959.7 951.9Trade creditors 412.6 464.0 456.7 452.2
Curr borrowings 6.5 8.7 8.7 8.7
Other curr liabilities 18.7 17.6 20.0 20.8
Total current liab. 437.9 490.2 485.4 481.7Borrowings 4.8 2.9 28.0 11.0
Other non-curr liabilities 5.5 8.0 12.3 12.2
Total liabilities 448.2 501.1 525.7 504.9Minorities/Convertibles 0.9 0.0 (0.2) (0.4)
Shareholders equity 428.9 407.2 434.0 447.0
Ratio analysis 2006A 2007A 2008F 2009FRevenue growth (%) (13.7) 22.9 (15.7) 1.9
EBITDA growth (%) (4.6) (2.3) (3.2) 7.1
EPS growth (%) (9.8) (81.5) 257.0 25.2
EBITDA/Sales margin (%) 2.5 2.0 2.2 2.4
EBIT/Sales margin (%) 2.1 1.4 1.6 1.8
Tax rate (%) 16.6 28.8 28.0 30.0
Net debt/equity (%) (5.8) (1.1) 8.5 4.4
Net debt/net debt + equity (%) (6.1) (1.1) 7.8 4.2
Net interest cover (x) 4.5 1.8 80.7 n/a
Payout ratio (%) 60.6 0.0 24.7 75.0
Capex to deprec'n (%) 163.3 111.8 107.2 107.2
NTA per share ($) 0.84 0.77 0.88 0.93
ROA (%) 5.5 5.2 5.2 5.4
ROE (%) 8.9 1.8 6.2 7.4
Multiple analysis 2006A 2007A 2008F 2009FMarket cap (M) 472
Net debt ($M) (4.5)
Peripheral assets ($M) (0.0)
Enterprise value ($M) 467.8
EV/EBIT (x) 7.8 9.5 9.4 8.6
EV/EBITDA (x) 6.5 6.7 6.9 6.4EV/EBITDA All Ind (x) 10.3 9.3 8.2 7.6
EV/EBITDA rel All Ind (x) 0.6 0.7 0.8 0.8
P/E (x) 11.9 64.1 17.9 14.3P/E rel All Ind (x) 0.5 3.2 1.1 0.9
P/E rel All Ind ex banks (x) 0.5 3.2 1.1 0.9
P/E sector (x) 37.0 30.3 25.6 21.7
P/E rel sector (x) 0.3 2.1 0.7 0.7
Assumptions 2006A 2007A 2008F 2009FGDP growth (%) 4.17 2.41 2.87 3.58
Interest Rates (%) 5.65 6.27 6.36 6.30
Inflation (%) 2.82 3.56 2.36 2.50
Notes To AccountsNote: API changed its year end from April to August from 1-Sep-07.The company reported results for the four month interim period fromMay-07 to Aug-07 in October, and we have restated our FY07financials to cover the 16 month period from May-06 to Aug-07.
Copyright © 2000 - 2007 Aegis Equities Holdings Pty Limited. All rights reserved.This information must be read in conjunction with the Legal Notice which can be located at http://www.aegis.com.au/public/disclaimer.aspx.

UtilitiesAlan Stuart
ASX: BBI Bloomberg: BBI AU Reuters: BBI.AX 08 December 2007
Babcock & Brown Infrastructure GroupBBI pursues its port consolidationstrategy
EventBBI announced that it has acquired interests in three port operatorslocated in Germany, Belgium and the US. BBI subsidiary Benelux PortHoldings has acquired 43% of the Westerlund Group (Belgium) withnegotiations on the remaining 57% still underway. BBI acquired 50% ofSeehafen Rostock Umschlagsgesellchaft GmbH (Germany) with pre-emptive rights over the remaining 50%. Lastly, BBI has entered anagreement to acquire 50% of ICS Logistics Inc (US). The acquisitionshave an EV of ~A$616.5M.
ImplicationsWe have made no adjustments to our EPS forecasts at this time.We shall be having discussions with management to confirm some ofour model assumptions before updating our financial forecasts. Thatsaid, from a broad overview of the transaction, it looks positive.Following our discussions with management we shall provide anupdate. We retain our bullish view on both 12-month and long-terminvestment horizons.
Investment OpinionBBI is a diversified utility and infrastructure vehicle with an aggressiveasset growth profile, having acquired $6B+ of assets since listing in2002. BBI's long-life, long concession, monopolistic underlying assetsproduce strong and stable cash flows, secured by regulated tariffregimes or contracted revenues. We expect continued success via itsrelationship with BNB, which identifies, secures and finances BBI'sacquisitions. We have a positive long-term view on the stock.
Our BBI forecasts reflect improved cash flows derived from its whollyowned Dalrymple Bay Coal Terminal and moderate growth from itsutilities portfolio. We favour the proposed acquisition of the AAN assetsand expect the deal to be earnings accretive. BBI offers an attractiveyield, given its moderate growth outlook. Overall, we have a positive12-month view on the stock.
Key Information
Price Performance
Market Statistics
Key Assumptions
Share Price $1.6412 month view BUY12 month target return (%) 32.1
12 month target price $2.02
Long Term View BUYLong Term Target Return (% pa) 20.0
3 year target price n/a
Market Cap (M) $3,597
Shares (M) 1,745.8
% of Market 0.17
% of Sector 10.23
12 Month Range $1.42 - $2.03
Company Risk
Share Price Risk
Ethical rating
Performance against indices (%)3 Months 6 Months 12 Months
BBI (0.6) (11.1) (9.1)Sector (4.5) (7.8) 4.3Market 8.1 7.3 24.0
Beta: 1.3
Market risk premium (%): 5.5
Risk free rate (%): 6.1
WACC (%): 8.8
Forecast cashflow (years): 10
Residual value % of total valuation: 60.5
Nominal terminal growth rate (%): 3.0
Earnings Summary
1 NPAT and EPS are adjusted by removing non-recurring items. All the above statistics are derived from normalised earnings.
Yr to Jun NPATRep $M
NPAT1
Adj $MEPS1
cEPS chg
%PER
xPER rel
All Ords xPER rel
Sector xDPS
cYield
%Franking
%Deferred Tax
%
2006A 82.7 13.5 1.2 n/a >99 6.3 4.5 13.3 8.1 0 100
2007A 106.8 47.7 3.1 158.2 53.3 2.7 2.1 14.3 8.7 0 100
2008F 113.7 163.5 7.8 153.0 21.1 1.3 1.1 15.0 9.1 0 100
2009F 134.3 193.9 8.7 12.3 18.8 1.3 1.1 16.0 9.8 0 100

Babcock & Brown Infrastructure Group
Year end Jun. All figures in A$M
Notes: 1. The 12M recommendation rates stocks on a 12 month, absolute basis based on the total return (capital and dividends). BUY denotes an expectation of 15% ormore total return; SELL 5% or less; HOLD within the range of 5-15%. ACCEPT OFFER relates to a situation where there is a public offer for shares and our view is toaccept that offer.2. The Long Term Recommendation rates stocks on a long term, absolute basis based on the average total return per annum (capital and dividends). BUY denotes a longterm expectation of 1% or more above the cost of equity (also known as the required return, which measures the the return required by investors given the company's risk);HOLD within the range of 1% above and 3% below the cost of equity; SELL more than 3% below the cost of equity but above a total forecast annual return for the stock of0%; AVOID denotes a long term expectation of a total annual return below 0%. ACCEPT OFFER relates to a situation where there is a public offer for shares and our viewis to accept that offer.
12M Recommendation1: BUY 12M Target: $2.02 Long Term Recommendation 2: BUY Long Term Target Return: 20.0% pa
Profit & loss summary 2006A 2007A 2008F 2009F
Operating revenue 787.7 1,239.3 1,617.4 1,700.7Invest & other income (18.4) 0.0 (44.5) (45.6)
EBITDA 358.7 485.2 736.4 776.9Depreciation/Amort (123.8) (181.0) (260.3) (265.5)
EBIT 234.9 304.2 476.1 511.4Net Interest (236.1) (301.7) (214.4) (217.4)
Pre-tax profit (1.2) 2.5 261.7 294.0Tax expense 15.6 51.3 (87.0) (88.2)
Minorities/Assoc./Prefs (0.9) (6.1) (61.0) (71.5)
NPAT 13.5 47.7 113.7 134.3Non recurring items 69.2 59.1 0.0 0.0
Reported profit 82.7 106.8 113.7 134.3NPAT add Goodwill & Pref 0.0 0.0 49.8 59.6
Adjusted profit 13.5 47.7 163.5 193.9
Cashflow summary 2006A 2007A 2008F 2009F
EBITDA 358.7 485.2 736.4 776.9Working capital changes 181.1 105.1 25.5 6.5
Interest and tax (199.8) (284.4) (246.2) (288.0)
Other operating items (32.8) (90.5) (17.7) 1.7
Operating cashflow 307.2 215.5 498.0 497.0Required capex (326.9) (581.8) (108.9) (114.3)
Maintainable cashflow (19.6) (366.3) 389.1 382.7Dividends (62.9) (204.0) (312.8) (403.9)
Acq/Disp (1,257.5) (56.2) (823.2) (550.0)
Other investing items 6.8 (219.0) 0.0 0.0
Free cashflow (1,333.3) (845.4) (746.9) (571.2)Equity 682.7 562.1 1,520.2 0.0
Debt inc/(red'n) 665.3 204.3 (773.3) 571.2
Balance sheet 2006A 2007A 2008F 2009FCash & deposits 309.1 227.9 50.0 50.0
Inventories 14.9 14.9 18.8 19.7
Trade debtors 225.4 185.3 233.9 246.2
Other curr assets 74.0 235.7 235.7 235.7
Total current assets 623.4 663.7 538.3 551.6Prop., plant & equip. 4,390.0 5,026.4 5,718.2 6,147.1
Non-curr intangibles 1,967.1 2,113.3 2,113.3 2,113.3
Non-curr investments 391.8 382.5 382.5 382.6
Other non-curr assets 150.2 210.3 172.2 144.7
Total assets 7,522.5 8,396.2 8,924.6 9,339.2Trade creditors 232.4 297.3 375.4 395.1
Curr borrowings 130.1 37.7 37.7 37.7
Other curr liabilities 53.0 86.7 166.2 170.4
Total current liab. 415.5 421.7 579.2 603.2Borrowings 4,452.4 4,640.2 3,689.0 4,260.2
Other non-curr liabilities 719.0 864.6 825.6 825.6
Total liabilities 5,586.9 5,926.5 5,093.8 5,689.0Minorities/Convertibles 136.4 122.5 933.8 945.7
Shareholders equity 1,935.8 2,469.7 3,830.8 3,650.3
Ratio analysis 2006A 2007A 2008F 2009FRevenue growth (%) 117.1 57.3 30.5 5.2
EBITDA growth (%) 95.1 35.3 51.8 5.5
EPS growth (%) n/a 158.2 153.0 12.3
EBITDA/Sales margin (%) 45.5 39.2 45.5 45.7
EBIT/Sales margin (%) 29.8 24.5 29.4 30.1
Tax rate (%) >1000 (<1000) 33.2 30.0
Net debt/equity (%) 237.5 189.6 126.9 157.1
Net debt/net debt + equity (%) 70.4 65.5 55.9 61.1
Net interest cover (x) 1.0 1.0 2.2 2.4
Payout ratio (%) >1000 463.3 192.6 183.2
Capex to deprec'n (%) 264.0 321.4 41.8 43.1
NTA per share ($) (0.11) 0.13 0.35 0.27
ROA (%) 4.7 3.8 5.5 5.6
ROE (%) 1.1 2.5 4.0 4.8
Multiple analysis 2006A 2007A 2008F 2009FMarket cap (M) 3,597
Net debt ($M) 4,450.0
Peripheral assets ($M) (377.2)
Enterprise value ($M) 7,669.8
EV/EBIT (x) 32.8 25.2 16.1 15.0
EV/EBITDA (x) 21.4 15.8 10.4 9.9EV/EBITDA All Ind (x) 10.3 9.3 8.2 7.6
EV/EBITDA rel All Ind (x) 2.1 1.7 1.3 1.3
P/E (x) >99 53.3 21.1 18.8P/E rel All Ind (x) 5.9 2.7 1.3 1.2
P/E rel All Ind ex banks (x) 5.5 2.7 1.3 1.2
P/E sector (x) 30.5 25.0 19.2 16.7
P/E rel sector (x) 4.5 2.1 1.1 1.1
Assumptions 2006A 2007A 2008F 2009FGDP growth (%) 2.92 2.50 3.02 3.64
Interest Rates (%) 5.73 6.38 6.34 6.30
Inflation (%) 3.20 3.09 2.47 2.50
Notes To AccountsAll P&L items (except Reported profit) now exclude GoodwillAmortisation as per the new IFRS requirements. Our adjusted NPATrepresents returns to both ordinary unit holders and preference shareholders.
Copyright © 2000 - 2007 Aegis Equities Holdings Pty Limited. All rights reserved.This information must be read in conjunction with the Legal Notice which can be located at http://www.aegis.com.au/public/disclaimer.aspx.

Andrew Black Neil Verringer General Manager, St George Private Bank Head of BSA Private Bank [email protected] [email protected] Phone +61 2 9236 3056 Phone + 61 088424 548 7 St.George Private Bank & BankSA Private Bank Locations Sydney Level 4, 182 George Street, Sydney, NSW 2000 Phone (02) 9236 1882 Melbourne Level 8, 530 Collins Street, Melbourne, VIC 3000 Phone (03) 9274 4850 Brisbane Central Plaza, Level 4, 345 Queen Street, Brisbane, QLD 4000 (07) 3232 8888 Perth 152-158 St Georges Terrace, Perth, WA 6000 Phone (08) 9265 7510 Adelaide BankSA Private Bank Level 1, 97 King William Street Adelaide, SA 5000 (08) 8424 4141 Staff Directory Private Bank Directors Warren Acworth Brisbane [email protected] Richard Battifuoco Adelaide [email protected] David Gray Sydney [email protected] David Scannell Sydney [email protected] David Wyndham Sydney [email protected] Private Bank Relationship Managers – Financial Advi ce Peter Coulthard Melbourne [email protected] Andrew Smith Sydney [email protected] Damien Ferguson Brisbane [email protected] Gerry Duffy Sydney [email protected] ROXANNE GORMAN SYDNEY [email protected] Sharyn Besch Brisbane [email protected] Darren Carr Perth [email protected] Private Bank Relationship Managers – Banking Jeanette McCann Sydney [email protected] Brett Edwards Sydney [email protected] Anne Fraser Sydney [email protected] Scott Heyes Melbourne [email protected] Andrew Horsnell Adelaide [email protected] Bruce Kleem Sydney [email protected] Lisa Marks Melbourne [email protected] Kishore Mudaliar Sydney [email protected] Richard Northey Sydney [email protected] Josie Prasad Sydney [email protected] Geoffrey Bell Sydney [email protected] Josephine Prasad Sydney [email protected]
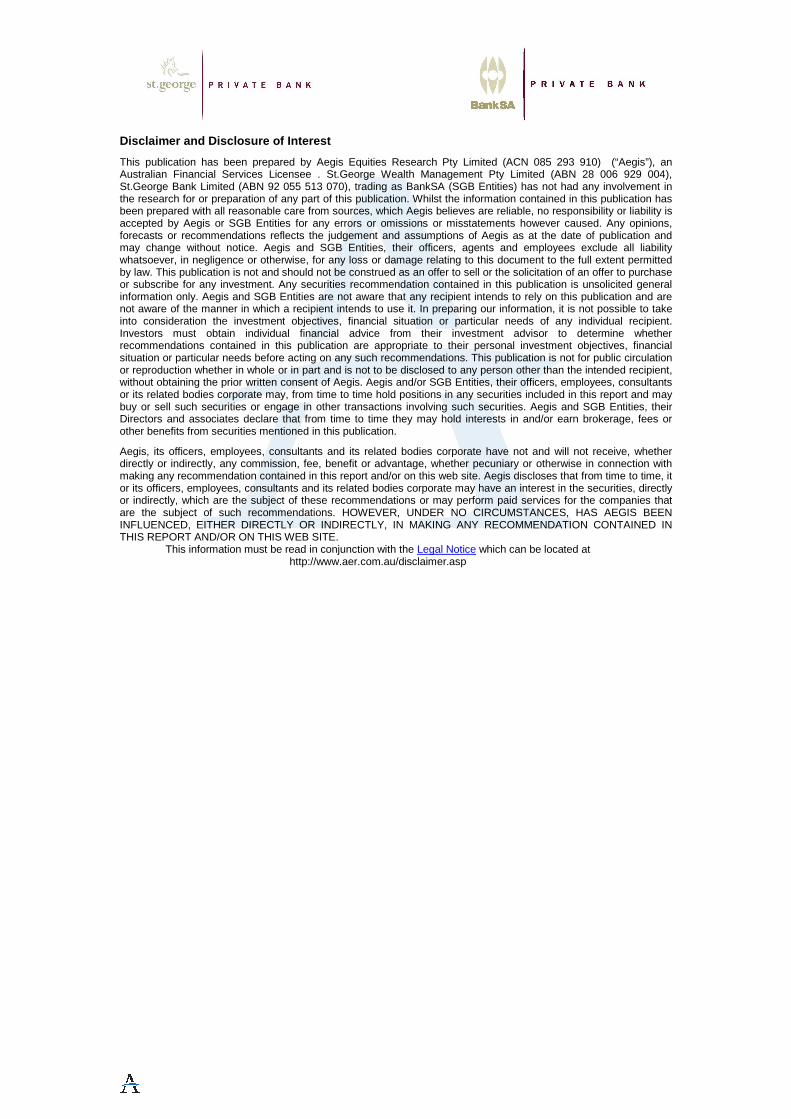
Disclaimer and Disclosure of Interest
This publication has been prepared by Aegis Equities Research Pty Limited (ACN 085 293 910) (“Aegis”), an Australian Financial Services Licensee . St.George Wealth Management Pty Limited (ABN 28 006 929 004), St.George Bank Limited (ABN 92 055 513 070), trading as BankSA (SGB Entities) has not had any involvement in the research for or preparation of any part of this publication. Whilst the information contained in this publication has been prepared with all reasonable care from sources, which Aegis believes are reliable, no responsibility or liability is accepted by Aegis or SGB Entities for any errors or omissions or misstatements however caused. Any opinions, forecasts or recommendations reflects the judgement and assumptions of Aegis as at the date of publication and may change without notice. Aegis and SGB Entities, their officers, agents and employees exclude all liability whatsoever, in negligence or otherwise, for any loss or damage relating to this document to the full extent permitted by law. This publication is not and should not be construed as an offer to sell or the solicitation of an offer to purchase or subscribe for any investment. Any securities recommendation contained in this publication is unsolicited general information only. Aegis and SGB Entities are not aware that any recipient intends to rely on this publication and are not aware of the manner in which a recipient intends to use it. In preparing our information, it is not possible to take into consideration the investment objectives, financial situation or particular needs of any individual recipient. Investors must obtain individual financial advice from their investment advisor to determine whether recommendations contained in this publication are appropriate to their personal investment objectives, financial situation or particular needs before acting on any such recommendations. This publication is not for public circulation or reproduction whether in whole or in part and is not to be disclosed to any person other than the intended recipient, without obtaining the prior written consent of Aegis. Aegis and/or SGB Entities, their officers, employees, consultants or its related bodies corporate may, from time to time hold positions in any securities included in this report and may buy or sell such securities or engage in other transactions involving such securities. Aegis and SGB Entities, their Directors and associates declare that from time to time they may hold interests in and/or earn brokerage, fees or other benefits from securities mentioned in this publication.
Aegis, its officers, employees, consultants and its related bodies corporate have not and will not receive, whether directly or indirectly, any commission, fee, benefit or advantage, whether pecuniary or otherwise in connection with making any recommendation contained in this report and/or on this web site. Aegis discloses that from time to time, it or its officers, employees, consultants and its related bodies corporate may have an interest in the securities, directly or indirectly, which are the subject of these recommendations or may perform paid services for the companies that are the subject of such recommendations. HOWEVER, UNDER NO CIRCUMSTANCES, HAS AEGIS BEEN INFLUENCED, EITHER DIRECTLY OR INDIRECTLY, IN MAKING ANY RECOMMENDATION CONTAINED IN THIS REPORT AND/OR ON THIS WEB SITE.
This information must be read in conjunction with the Legal Notice which can be located at http://www.aer.com.au/disclaimer.asp
Related Documents