1 1 CHAPTER FOURTEEN FINANCIAL ANALYSIS OF COMMON STOCKS

11 CHAPTER FOURTEEN FINANCIAL ANALYSIS OF COMMON STOCKS.
Dec 16, 2015
Welcome message from author
This document is posted to help you gain knowledge. Please leave a comment to let me know what you think about it! Share it to your friends and learn new things together.
Transcript

1 1
CHAPTER FOURTEEN
FINANCIAL ANALYSIS OF COMMON STOCKS

2
FINANCIAL ANALYSIS
• REASONS FOR FINANCIAL ANALYSIS– TWO PRIMARY REASONS
• to determine certain securities’ characteristics
• to attempt to identify mispriced securities

3
FINANCIAL ANALYSIS
• REASON #1: DETERMINING SECURITY CHARACTERISTICS– estimate future sensitivity to major factors– estimate dividend yield

4
FINANCIAL ANALYSIS
• REASON #2: ATTEMPTING TO IDENTIFY MISPRICED SECURITIES– use fundamental analysis– approaches
• valuation determines the intrinsic value compared to the current market value
• estimate key financial variables such as– EPS next year
– income growth next year

5
FUNDAMENTAL ANALYSIS
• TOP-DOWN V. BOTTOM UP– TOP-DOWN APPROACH
• attempts to forecast in the following order
1. economic activity
2. industry performance
3. firm’s performance

6
Business Cycle Sensitivity
0
20
40
60
80
100
120
140
1963
1965
1967
1969
1971
1973
1975
1977
1979
1981
1983
1985
1987
1989
1991
1993
Ind
ust
ry S
ale
s (1
963=
100)
Cigarette Sales Passenger Car Sales
FUNDAMENTAL ANALYSIS
Economic Analysis

7
FUNDAMENTAL ANALYSIS
• FINANCIAL STATEMENT ANALYSIS– INTEGRAL PART OF FUNDAMENTAL
ANALYSIS• it helps the analyst understand a firm’s current
condition
• where it is headed
• what factors affect it
• how the factors affect it

8
FUNDAMENTAL ANALYSIS
• FINANCIAL STATEMENT ANALYSIS– Review of Accounting Statements
• includes a study of the three major statements prepared monthly by most accountants:
– the balance sheet
– the income statement
– the statement of cash flows

9
FUNDAMENTAL ANALYSIS
• FINANCIAL STATEMENT ANALYSIS– RATIO ANALYSIS
• DEFINITION: a technique used to examine a company’s financial statements
• Use of Ratios– as an absolute standard
– as a comparative indicator
– as a trend over time

10
FUNDAMENTAL ANALYSIS
• FINANCIAL STATEMENT ANALYSIS– RATIO ANALYSIS
• Types of Ratios– internal liquidity
– operating performance
– risk analysis
– growth analysis
– profitability
– market ratios

11
FUNDAMENTAL ANALYSIS
• internal liquidity ratios:– indicate the ability of the firm to meet future
short-term financial obligations– some liquidity ratios:
• current ratio
• quick ratio
• cash ratio
• receivables turnover

12
FUNDAMENTAL ANALYSIS
• operating performance ratios:– indicate how well the management is operating
the business– some examples:
• total asset turnover
• net fixed asset turnover
• equity turnover

13
FUNDAMENTAL ANALYSIS
• risk analysis ratios:– indicates the uncertainty of income flows for
the total firm and for the individual sources of capital (debt and stock)
– some examples:• debt to equity ratio
• long-term debt/total capital ratio

14
FUNDAMENTAL ANALYSIS
• growth analysis ratios:– indicate how fast a firm should grow– it involves analysis using several other ratios
• net profit margin
• total asset turnover
• total assets/equity

15
Profitability Ratios• Gross Margin
– Gross profit / Sales
• Operating Margin– Operating income / Sales
• ROA– Net income / Total assets
• ROE– Net income / Owner’s equity
FUNDAMENTAL ANALYSIS
16
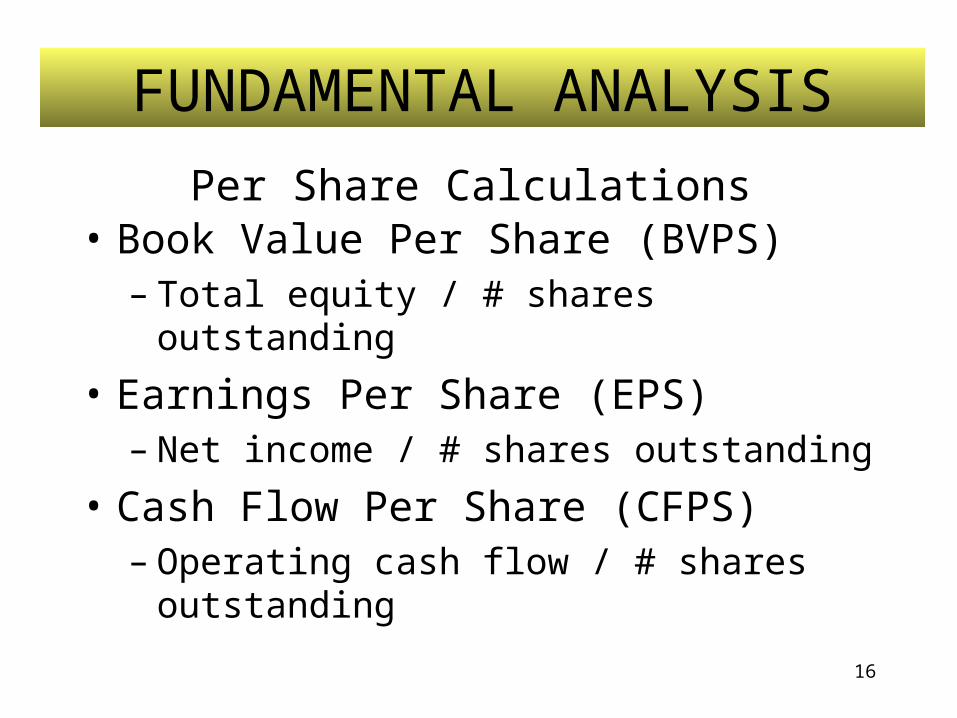
Per Share Calculations• Book Value Per Share (BVPS)
– Total equity / # shares outstanding
• Earnings Per Share (EPS)– Net income / # shares outstanding
• Cash Flow Per Share (CFPS)– Operating cash flow / # shares outstanding
FUNDAMENTAL ANALYSIS

17
• Price / Book (or Market / Book)– Stock price / BVPS
• Price / Earnings (P/E)– Stock price / EPS
• Price / Cash flow (P/CF)– Stock price / CFPS
FUNDAMENTAL ANALYSIS
Market Value Ratios

18
Sources of Information• Annual reports
• Wall Street Journal
• Value Line
• Standard & Poor’s
• Research Insight

19
Sources of Information• Internet
– NYSE (www.nyse.com)
– Nasdaq (www.nasdaq.com)
– Text (www.mhhe.com/cj)
– CNNfn.com
– CNBC.com
– Yahoo.com
– Zacks.com
– Smartmoney.com
– Multex.com
– MSNBC.com
– Quicken.com

20
Sources of Information
• SEC– EDGAR
– 10K & 10Q reports

21
TECHNICAL ANALYSIS
• DEFINITION: a form of security analysis that attempts to forecast price changes based on historical price and volume trends

22
TECHNICAL ANALYSIS
• Two Groups of Strategies Used:1. Momentum and Contrarian Strategies
2. Moving Average and Trading Range Breakout
Strategies
23
Technical Analysis
• Support and resistance areas– Support level / Bottom feeders
– Resistance level / Topping out / profit taking
– Breakouts

24
TECHNICAL ANALYSIS
1. Momentum and Contrarian Strategies– METHDOLOGY:
• examine the returns over a time period just ended to identify
– momentum investors who seek out stocks recently rising in price for purchase; falling for sale
– contrarians who follow the opposite strategy of most investors
» contrarians base their strategy on the overreaction theory

25
TECHNICAL ANALYSIS
2. Moving Average and Trading Range Breakout Strategies– MOVING AVERAGE STRATEGY:
• calculate a moving average over the last 200 days of closing prices
• divide today’s closing price into the moving average (SHORT-TO-LONG RATIO)
• if short-to-long ratio is greater than 1, buy
• if ratio is less than 1, sell

26
TECHNICAL ANALYSIS
• 2. Moving Average and Trading Range Breakout Strategies– TRADING RANGE BREAKOUT
STRATEGY:• high and low prices for past 200 trading days are
identified
• if today’s close is greater than the high = buy!
• if today’s close is less than the low = sell!

27
Reading the tea leaves…• Advance / decline line: Closing Arms or Trin• Relative strength• Moving averages• Candlestick chart• Chart formations: head-and-shoulders
TECHNICAL ANALYSIS

28
DiariesNYSE TUE MON WK AGOAdvances 1,187 1,203 1,642Declines 1,878 1,879 1,414Unchanged 487 504 477New highs 36 44 19New lows 316 285 275zAdv vol (000) 319,260 291,385 493,942zDecl vol (000) 525,920 452,626 381,351Ztotal vol (000) 868,959 765,631 900,037Closing tick -130 -175 -240Closing Arms (trin) 1.04 1.01 0.9zBlock trades 18,775 15,988 19,985
STOCK MARKET DATA BANK

29
Examples• Closing Arms: Trin
Values > 1 considered bearish
Trin = Declining volume / Declines
Advancing volume / Advances

30
Examples• Advance/Decline Line Calculation
Issues Issues
Weekday Advancing Declining Difference Cumulative
THU 1,162 1,888 -726 -726
FRI 2,275 1,198 1,077 351
MON 1,203 1,849 -646 -295
TUE 1,187 1,878 -691 -986
WED 1,739 1,311 428 -558
THU 2,193 910 1,283 725
FRI 2,178 974 1,204 1,929
MON 1,540 1,525 15 1,944
TUE 1,660 1,540 120 2,064

31
Advance/Decline Line
-1,500
-1,000
-500
0
500
1,000
1,500
2,000
2,500
1 2 3 4 5 6 7 8 9
Cumulative

32
Examples
• Relative strength:
Charts performance relative to industry or market
Value Line Timeliness*
Price performance/Average performance of V-L Stocks

33
• Moving AverageTime Mini Dow MA
1 112 123 14 12.334 13 13.005 16 14.336 17 15.337 19 17.338 18 18.009 17 18.0010 18 17.67
11 + 12 + 14 = 12.33
3
12 + 14 + 13 = 13.00
3

34
Moving Average Graph
10
11
12
13
14
15
16
17
18
19
20
0 1 2 3 4 5 6 7 8 9 10 11
Time
Sto
ck
Pri
ce
s
Mini Dow MA

35
Candlestick MakingHigh
Upper Shadow
Low
Lower Shadow
Open
Bullish Bearish
Body
Close

36
Head and Shoulders Formation
Neckline
LeftShoulder
Head
RightShoulder
ThrowBack
Related Documents