11-1 Chapter 11 Diversification and Risky Asset Allocation

11-1 Chapter 11 Diversification and Risky Asset Allocation.
Dec 17, 2015
Welcome message from author
This document is posted to help you gain knowledge. Please leave a comment to let me know what you think about it! Share it to your friends and learn new things together.
Transcript

11-1
Chapter 11
Diversification and Risky Asset Allocation

11-2
Learning Objectives 1. How to calculate expected returns
and variances for a security.
2. How to calculate expected returns and variances for a portfolio.
3. The importance of portfolio diversification.
4. The efficient frontier and the importance of asset allocation.
11-3
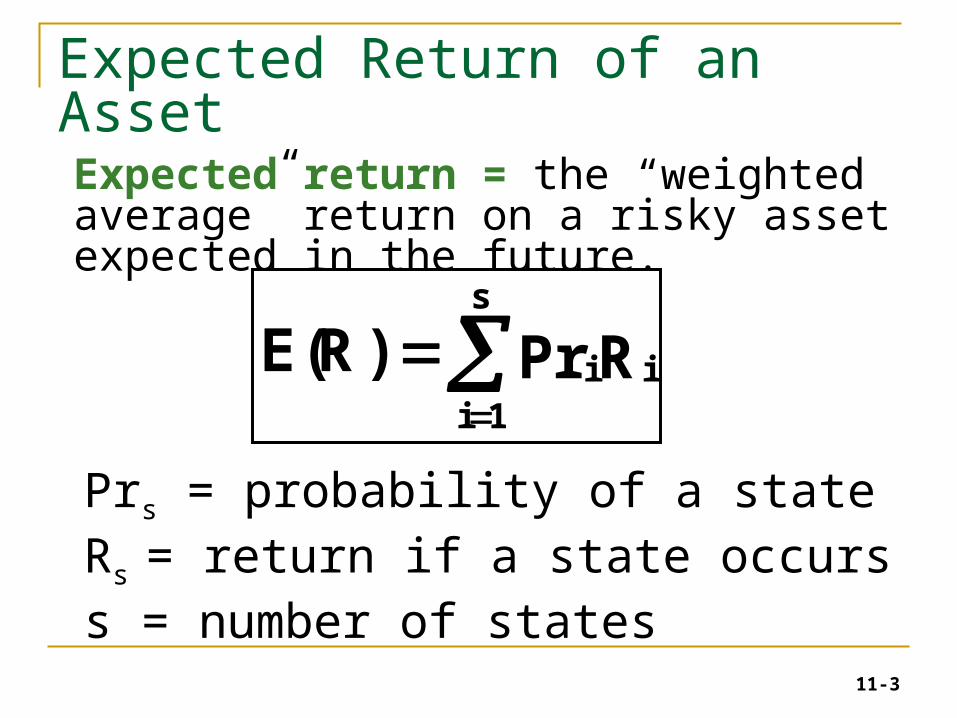
Prs = probability of a stateRs = return if a state occurss = number of states
Expected Return of an Asset
RPr)R(E i
s
1ii
Expected return = the “weighted average” return on a risky asset expected in the future.
11-4
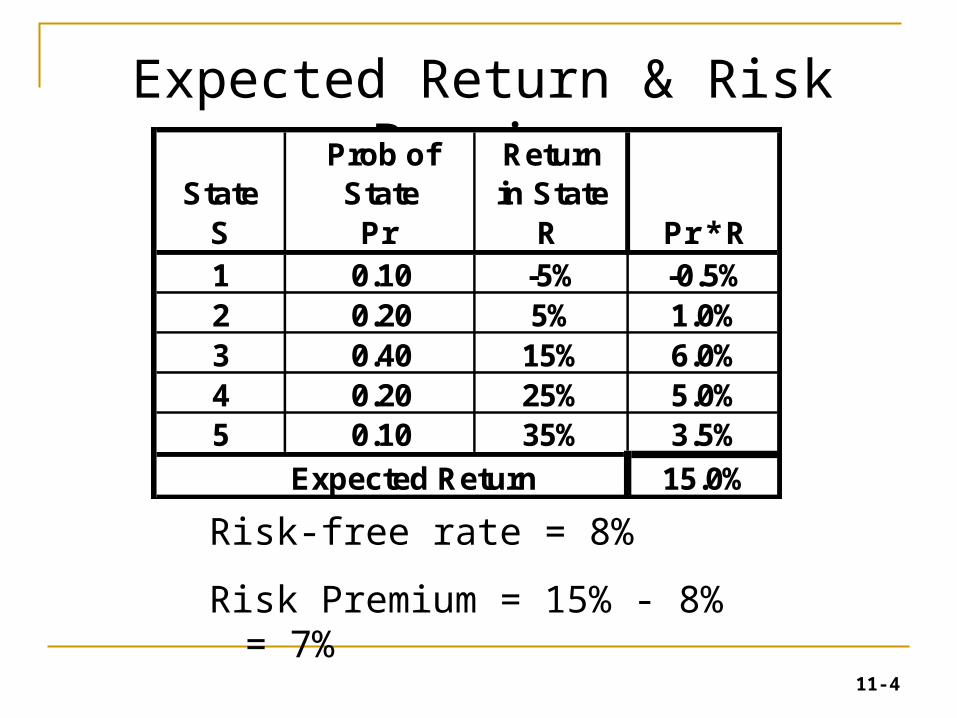
Expected Return & Risk Premium
Risk-free rate = 8%
Risk Premium = 15% - 8% = 7%
S Pr R Pr * R1 0.10 -5% -0.5%2 0.20 5% 1.0%3 0.40 15% 6.0%4 0.20 25% 5.0%5 0.10 35% 3.5%
Expected Return 15.0%
Return in State
Prob of StateState
11-5
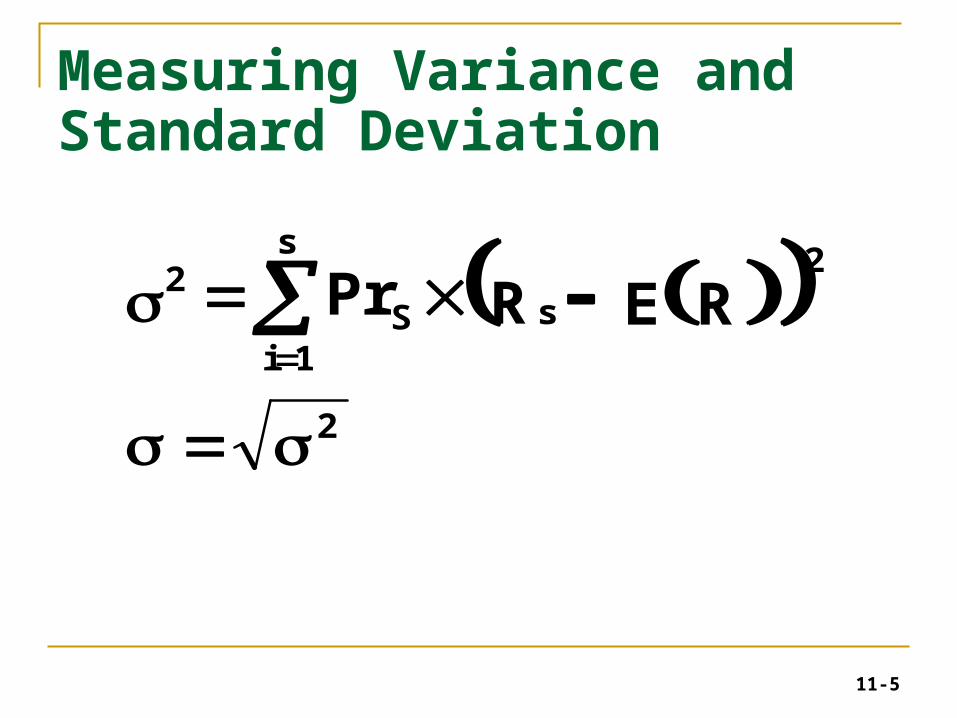
Measuring Variance and Standard Deviation
2
s
1is
2
S2
RERPr
11-6
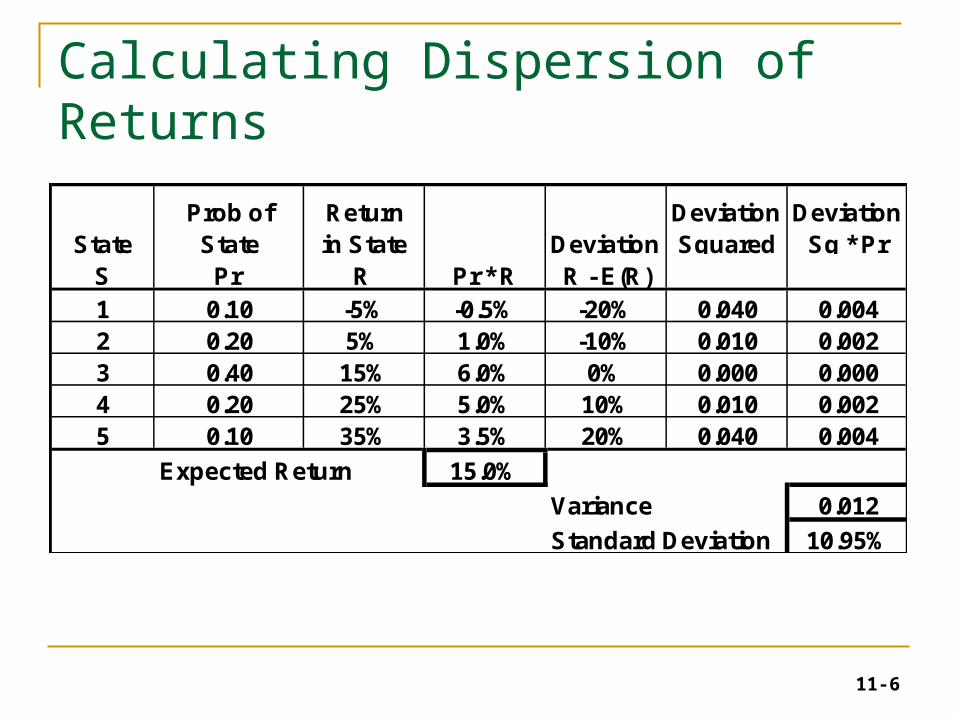
Calculating Dispersion of Returns
S Pr R Pr * R R - E(R)1 0.10 -5% -0.5% -20% 0.040 0.0042 0.20 5% 1.0% -10% 0.010 0.0023 0.40 15% 6.0% 0% 0.000 0.0004 0.20 25% 5.0% 10% 0.010 0.0025 0.10 35% 3.5% 20% 0.040 0.004
Expected Return 15.0%
Variance 0.012
Standard Deviation 10.95%
Prob of StateState Deviation
Deviation Squared
Deviation Sq * Pr
Return in State
11-7
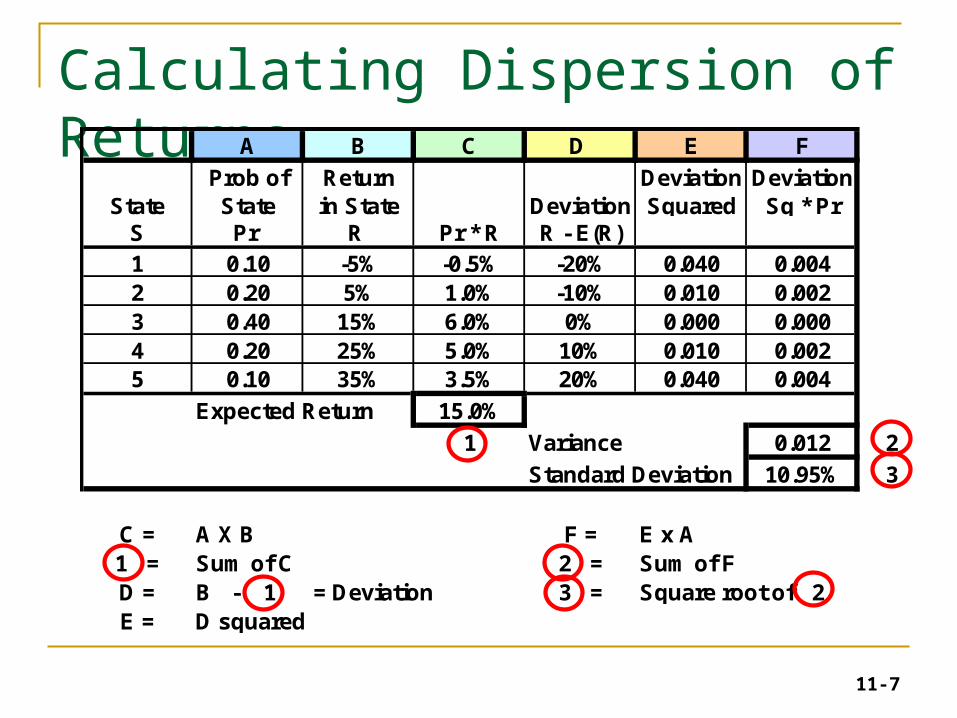
Calculating Dispersion of ReturnsA B C D E F
S Pr R Pr * R R - E(R)1 0.10 -5% -0.5% -20% 0.040 0.0042 0.20 5% 1.0% -10% 0.010 0.0023 0.40 15% 6.0% 0% 0.000 0.0004 0.20 25% 5.0% 10% 0.010 0.0025 0.10 35% 3.5% 20% 0.040 0.004
Expected Return 15.0%
1 Variance 0.012 2
Standard Deviation 10.95% 3
C = A X B F = E x A1 = Sum of C 2 = Sum of FD = B - 1 = Deviation 3 = Square root of 2E = D squared
Deviation Squared
Deviation Sq * Pr
Return in State
Prob of StateState Deviation
11-8
Portfolios• Portfolios = groups of assets, such as stocks and
bonds, that are held by an investor.• Portfolio Description = list the proportion of the
total value of the portfolio that is invested into each asset.
• Portfolio Weights = proportions • Sometimes expressed in percentages.• In calculations, make sure you use proportions
(i.e., decimals).
11-9
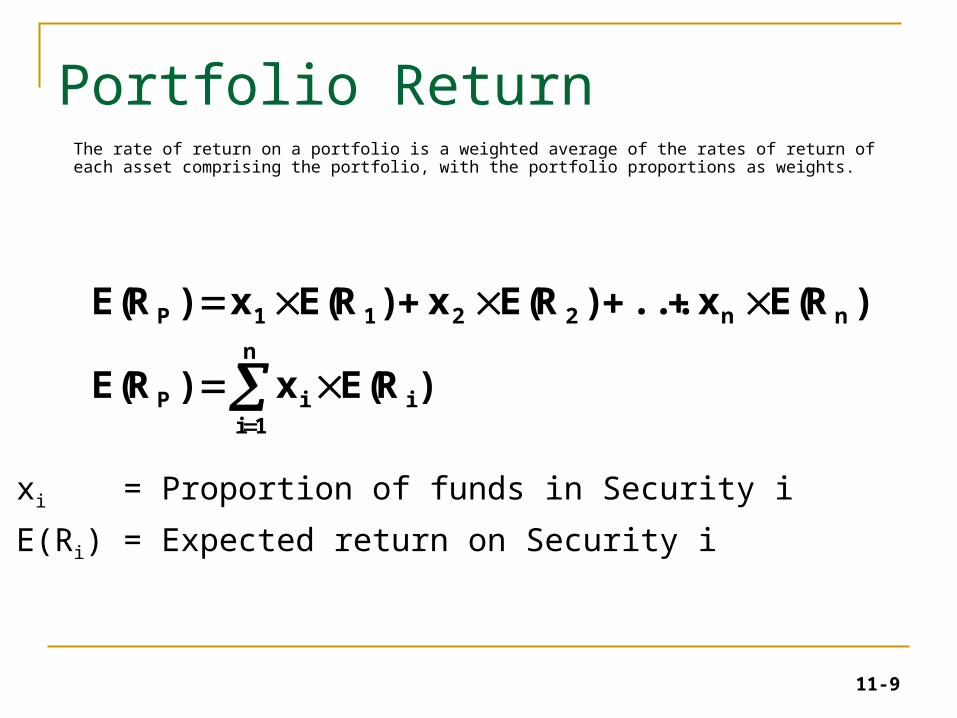
Portfolio Return The rate of return on a portfolio is a weighted average of the rates of return of each asset comprising the portfolio, with the portfolio proportions as weights.
n
1iiiP
nn2211P
)R(Ex)R(E
)R(Ex...)R(Ex)R(Ex)R(E
xi = Proportion of funds in Security i
E(Ri) = Expected return on Security i
11-10
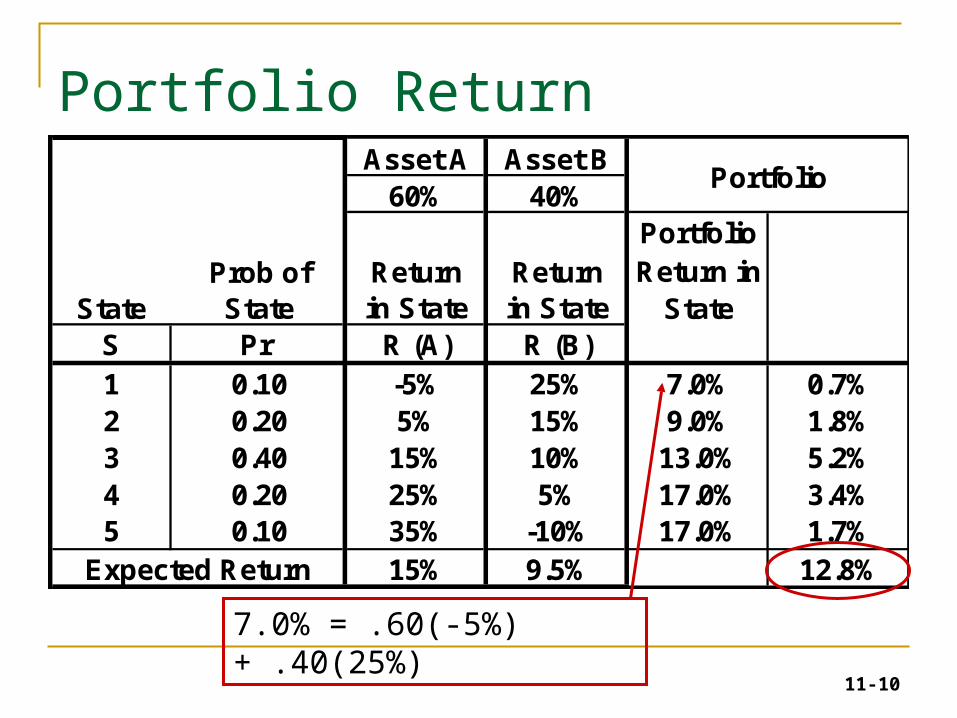
Asset A Asset B60% 40%
PortfolioReturn in
StateS Pr R (A) R (B)1 0.10 -5% 25% 7.0% 0.7%2 0.20 5% 15% 9.0% 1.8%3 0.40 15% 10% 13.0% 5.2%4 0.20 25% 5% 17.0% 3.4%5 0.10 35% -10% 17.0% 1.7%
15% 9.5% 12.8%
Portfolio
Expected Return
Return in State
Return in StateState
Prob of State
Portfolio Return
7.0% = .60(-5%) + .40(25%)
11-11
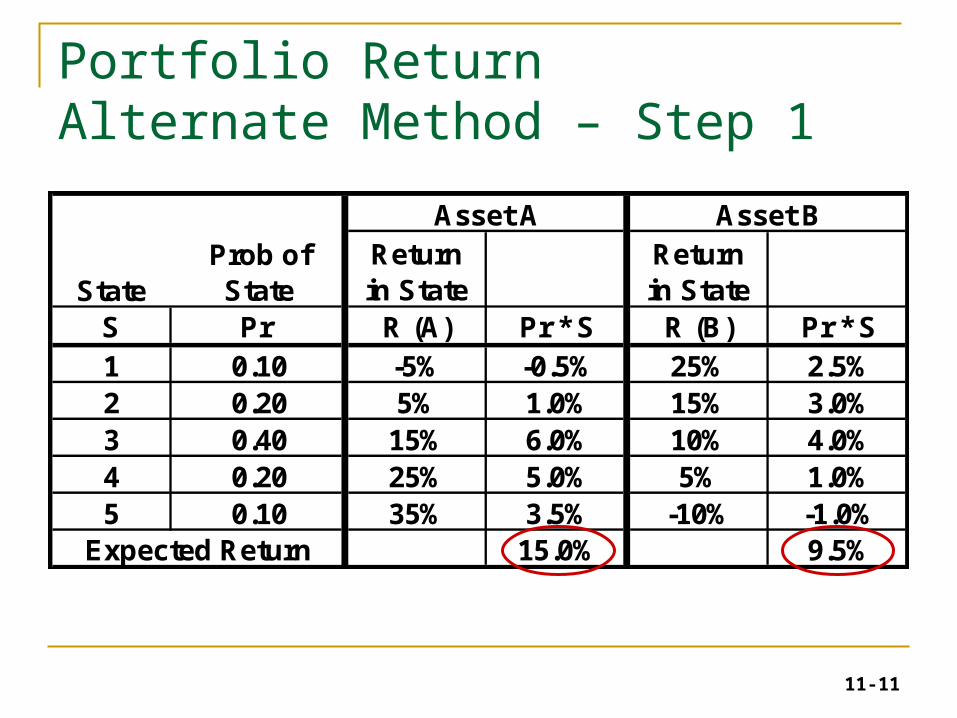
Portfolio Return Alternate Method – Step 1
S Pr R (A) Pr * S R (B) Pr * S1 0.10 -5% -0.5% 25% 2.5%2 0.20 5% 1.0% 15% 3.0%3 0.40 15% 6.0% 10% 4.0%4 0.20 25% 5.0% 5% 1.0%5 0.10 35% 3.5% -10% -1.0%
15.0% 9.5%Expected Return
Return in State
Asset A Asset BReturn in StateState
Prob of State
11-12
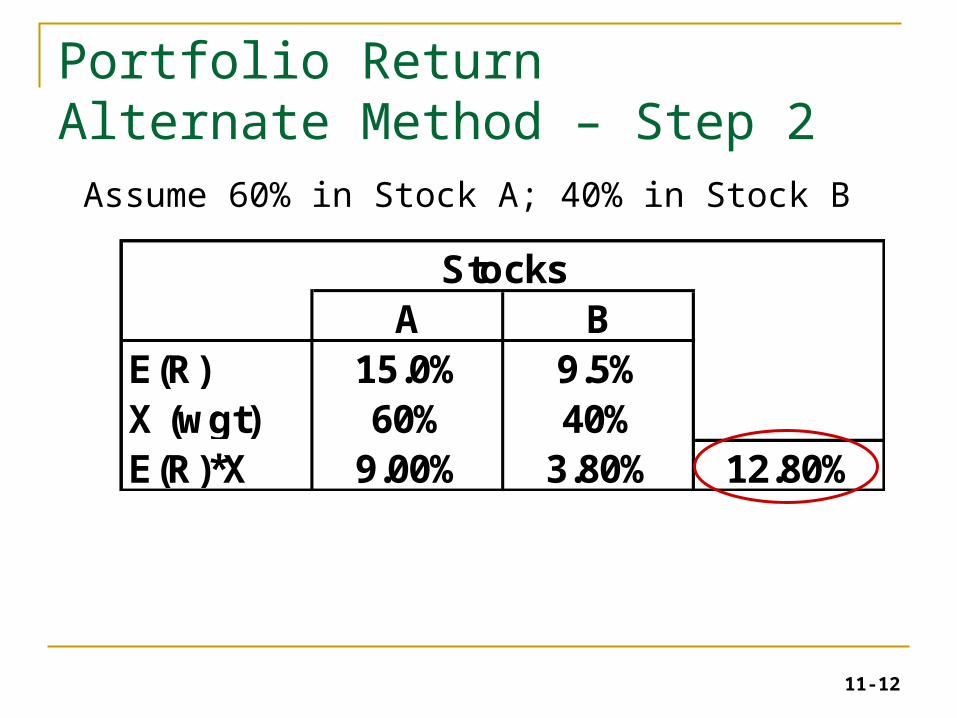
Portfolio Return Alternate Method – Step 2
Assume 60% in Stock A; 40% in Stock B
A BE(R) 15.0% 9.5%X (wgt) 60% 40%E(R)*X 9.00% 3.80% 12.80%
Stocks
11-13
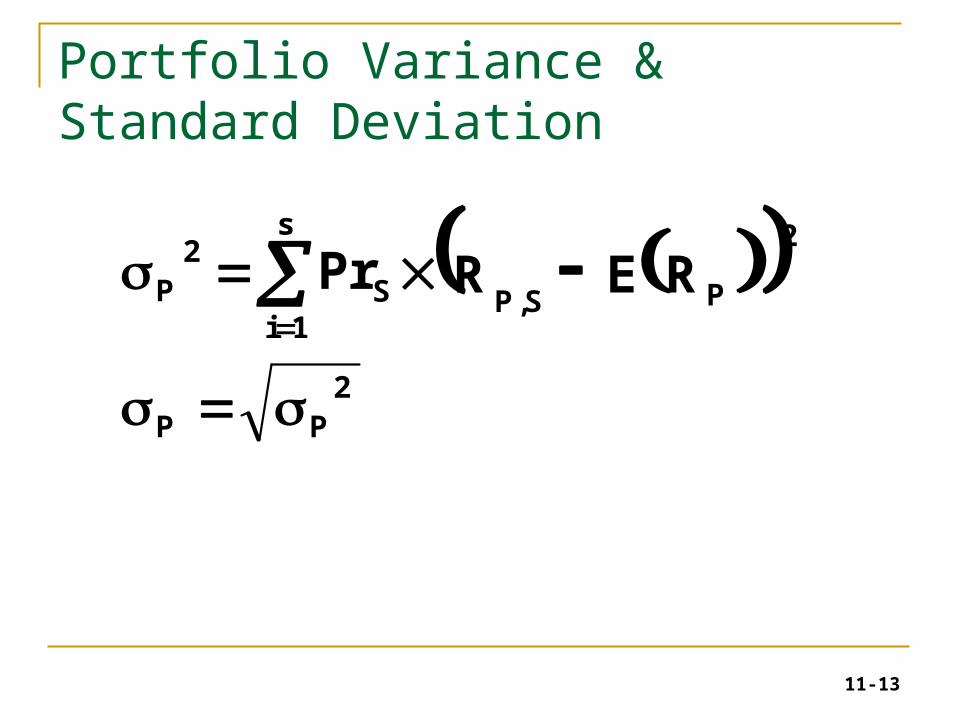
Portfolio Variance & Standard Deviation
2
PP
s
1iPS,P
2
SP2
RERPr
11-14
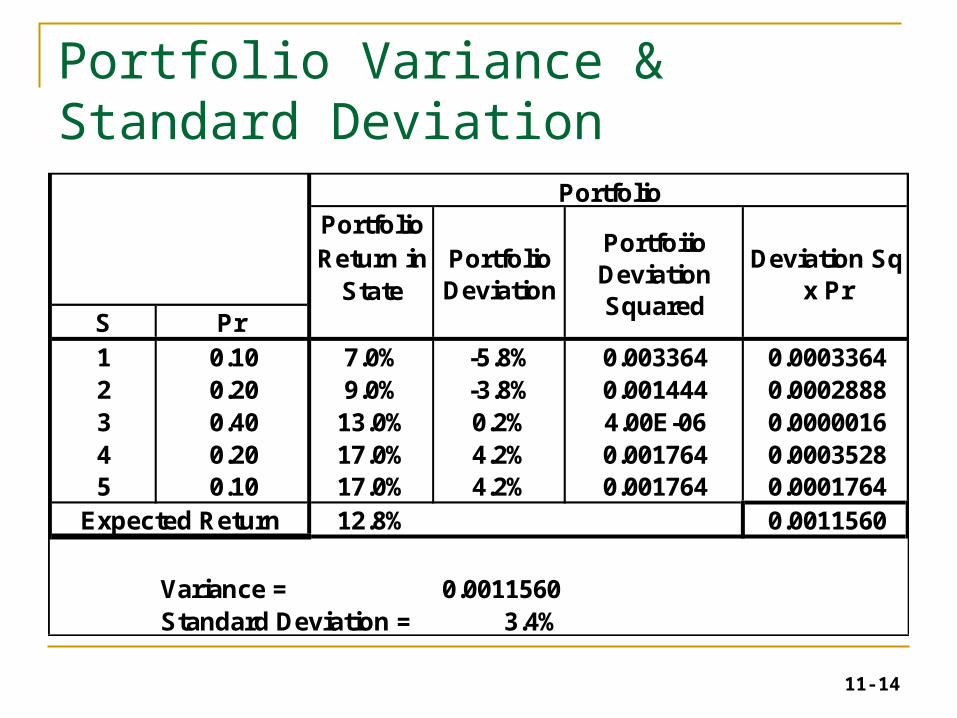
Portfolio Variance & Standard Deviation
PortfolioReturn in
StateS Pr 1 0.10 7.0% -5.8% 0.003364 0.00033642 0.20 9.0% -3.8% 0.001444 0.00028883 0.40 13.0% 0.2% 4.00E-06 0.00000164 0.20 17.0% 4.2% 0.001764 0.00035285 0.10 17.0% 4.2% 0.001764 0.0001764
12.8% 0.0011560
Variance = 0.0011560Standard Deviation = 3.4%
Portfolio
Deviation Sq x Pr
Expected Return
Portfolio Deviation
Portfoiio Deviation Squared
11-15
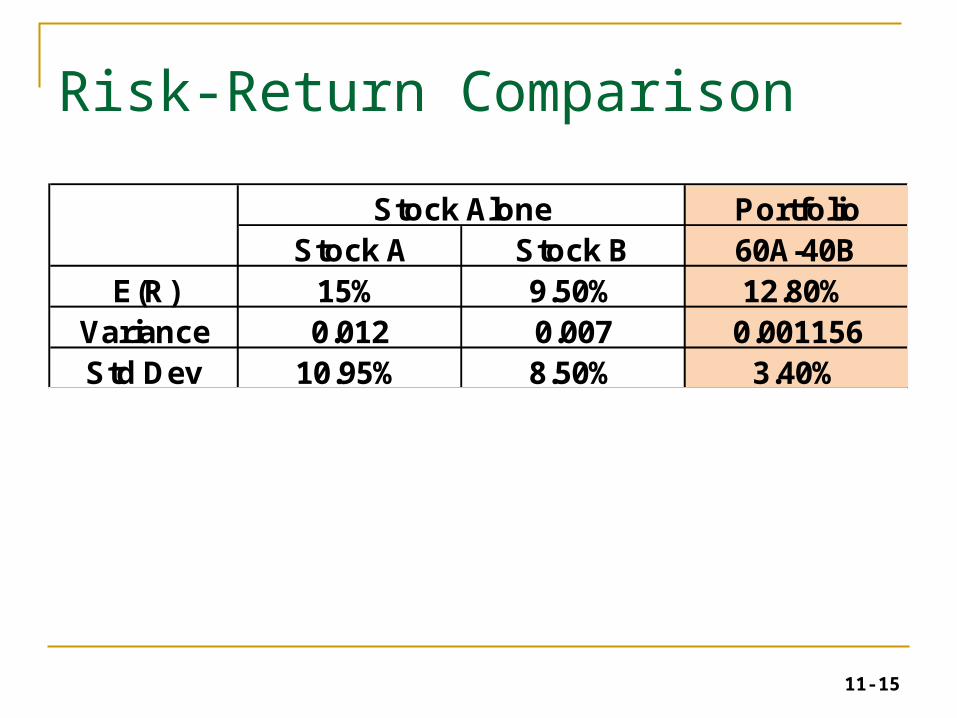
Risk-Return Comparison
PortfolioStock A Stock B 60A-40B
E(R) 15% 9.50% 12.80%Variance 0.012 0.007 0.001156Std Dev 10.95% 8.50% 3.40%
Stock Alone
11-16
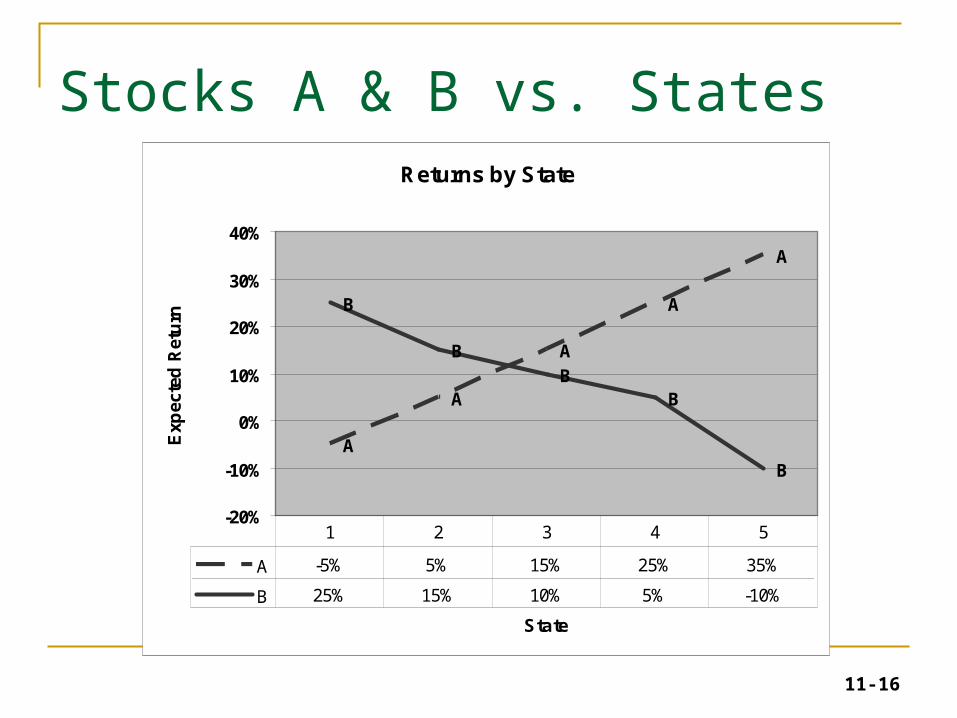
Stocks A & B vs. StatesReturns by State
A
A
A
A
A
B
BB
B
B
-20%
-10%
0%
10%
20%
30%
40%
State
Exp
ecte
d R
etu
rn
A -5% 5% 15% 25% 35%
B 25% 15% 10% 5% -10%
1 2 3 4 5
11-17
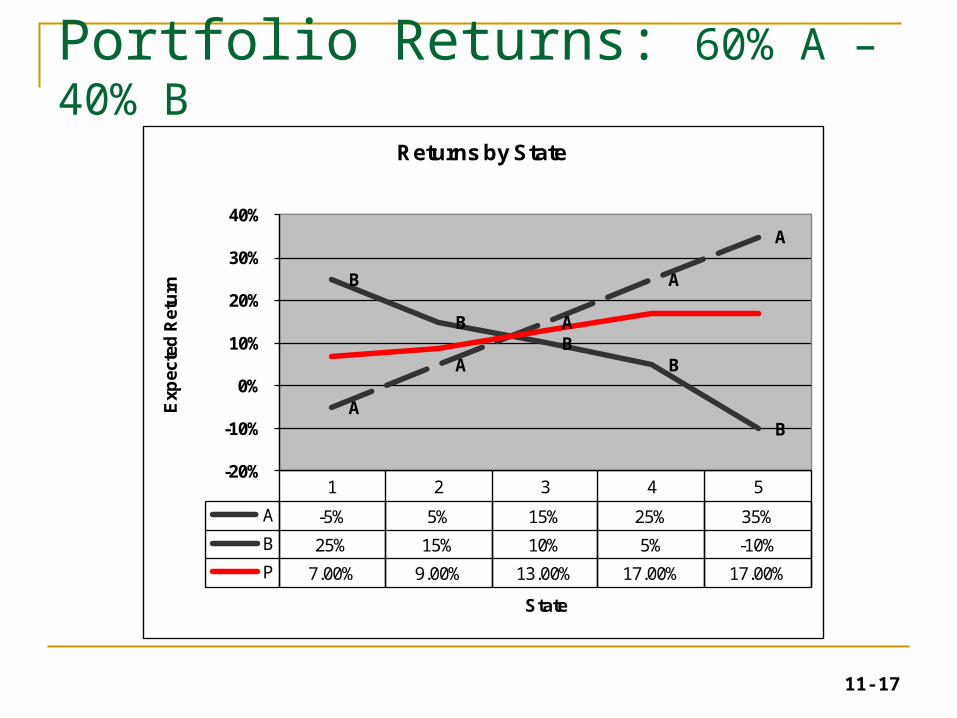
Portfolio Returns: 60% A – 40% B
1 2 3 4 5
A -5% 5% 15% 25% 35%
B 25% 15% 10% 5% -10%
P 7.00% 9.00% 13.00% 17.00% 17.00%
A
A
A
A
A
B
BB
B
B
-20%
-10%
0%
10%
20%
30%
40%
Exp
ecte
d R
etu
rn
State
Returns by State
11-18
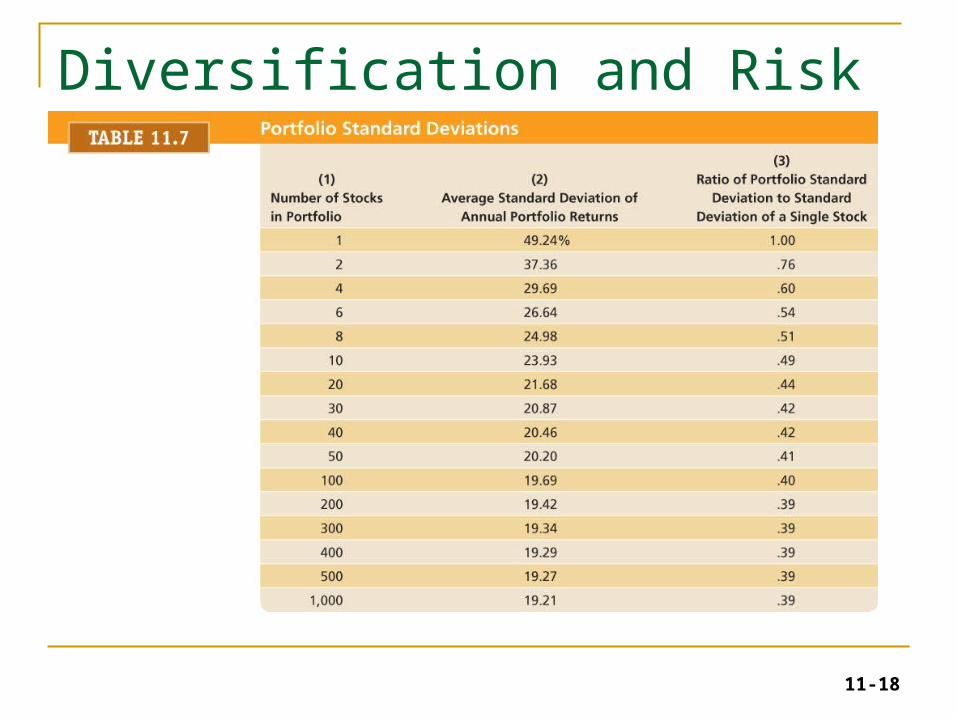
Diversification and Risk
11-19
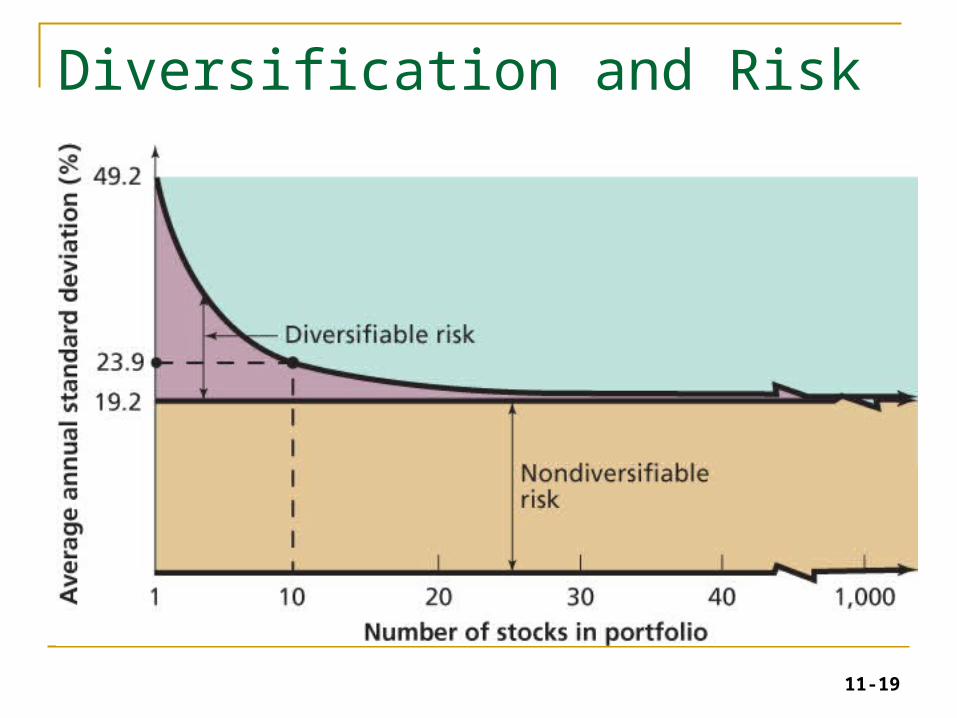
Diversification and Risk
11-20
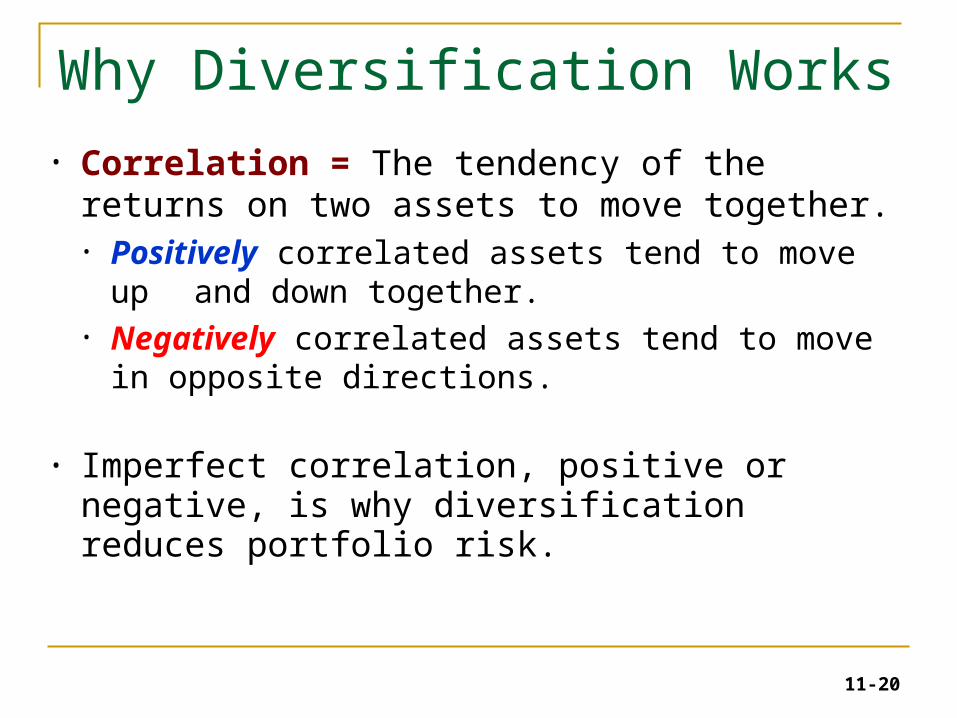
Why Diversification Works
• Correlation = The tendency of the returns on two assets to move together. • Positively correlated assets tend to move up
and down together.• Negatively correlated assets tend to move in
opposite directions.
• Imperfect correlation, positive or negative, is why diversification reduces portfolio risk.

11-21
Correlation Coefficient
•Correlation Coefficient = ρ (rho)•Scales covariance to [-1,+1]
= -1.0 Two stocks can be combined to form a riskless portfolio
= +1.0 No risk reduction at all • In general, stocks have ≈ 0.35 - 0.67• Risk is lowered but not eliminated
)R, Bba
abab ACORR(R
Will Not Be on a Test

11-22
Returns distribution for two perfectly negatively correlated stocks (ρ = -1.0)
-10
15 15
25 2525
15
0
-10
Stock W
0
Stock M
-10
0
Portfolio WM

11-23
Returns distribution for two perfectly positively correlated stocks (ρ = 1.0)
Stock M
0
15
25
-10
Stock M’
0
15
25
-10
Portfolio MM’
0
15
25
-10
11-24
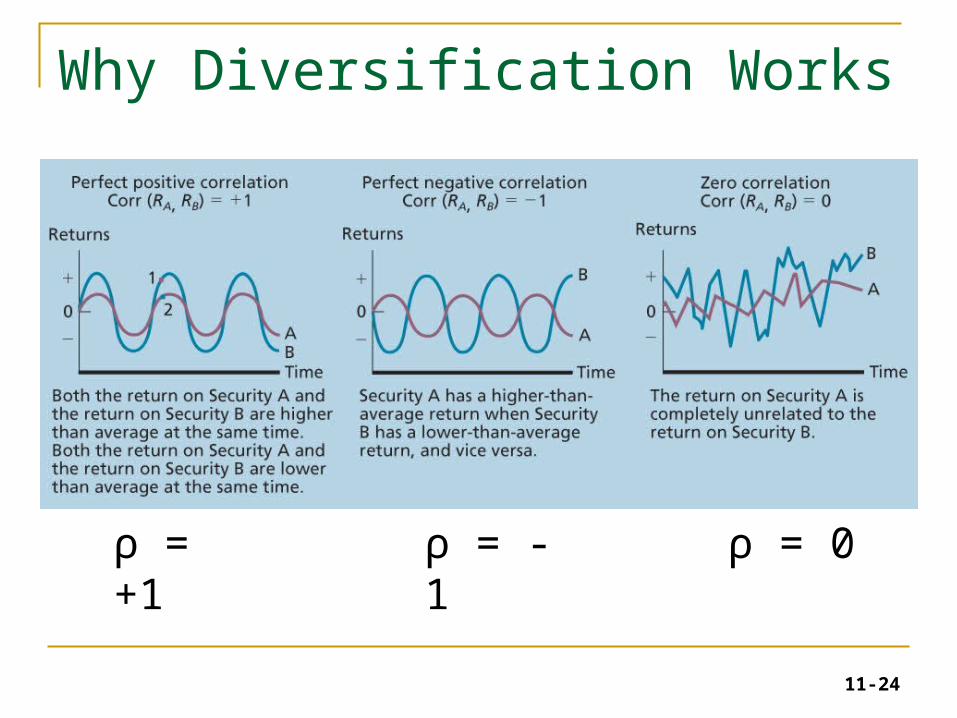
Why Diversification Works
ρ = +1 ρ = -1 ρ = 0
11-25
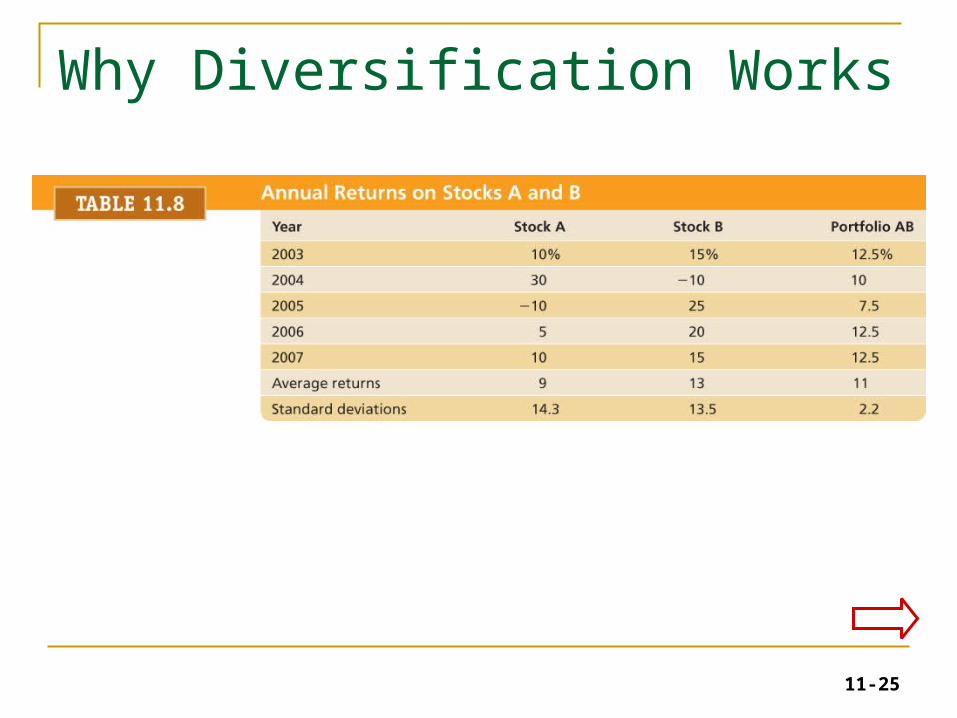
Why Diversification Works

11-26
Why Diversification Works
11-27
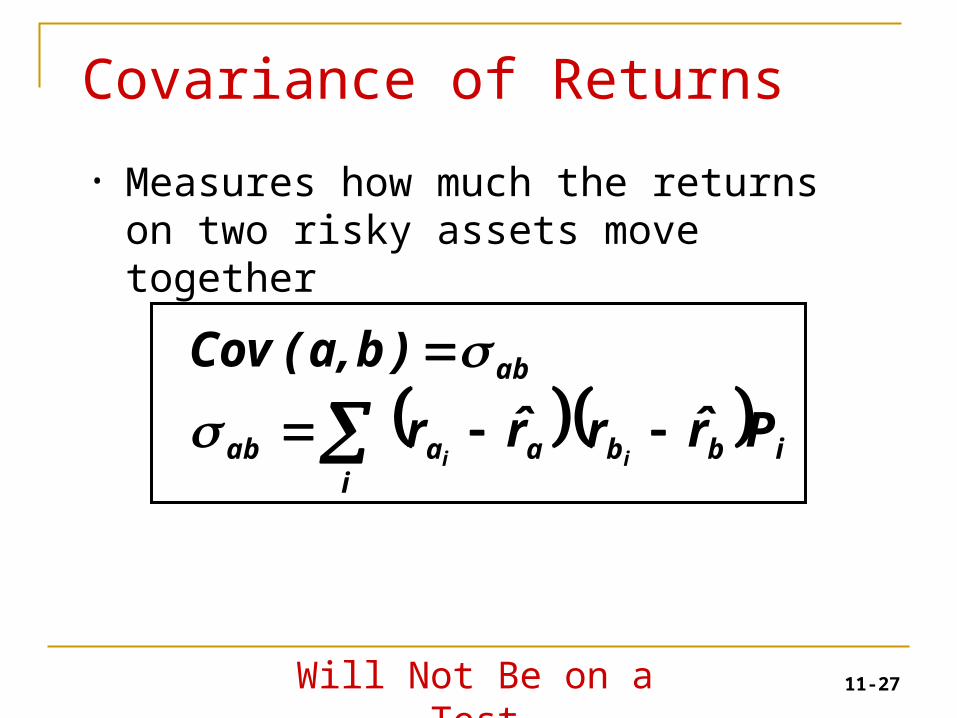
Covariance of Returns
• Measures how much the returns on two risky assets move together
ibbi
aaab
ab
Pr̂rr̂r
)b,a(Cov
ii
Will Not Be on a Test
11-28
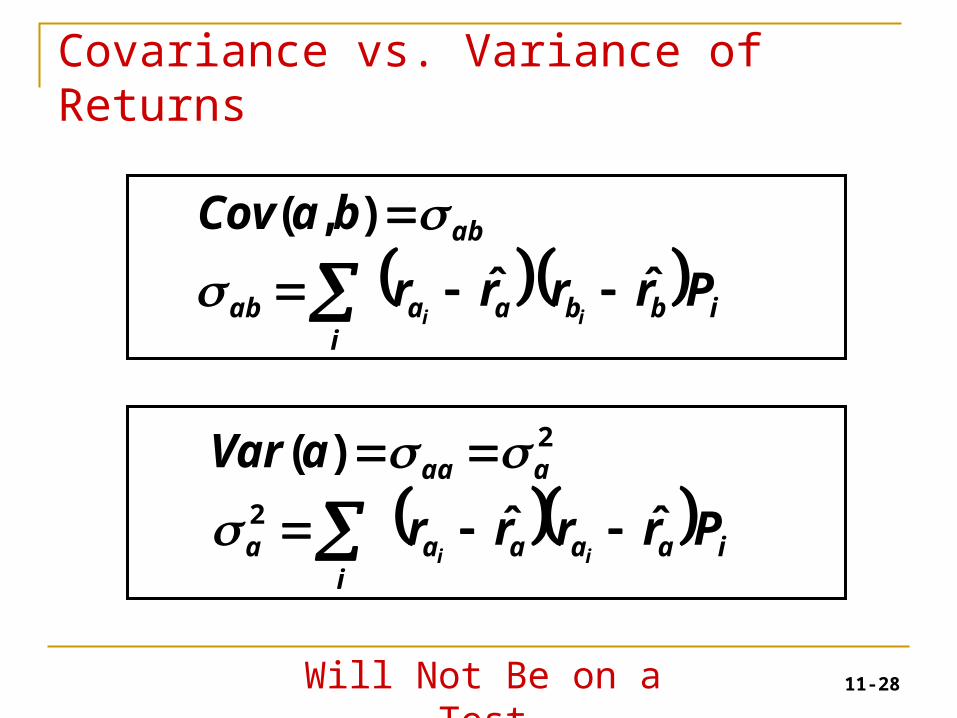
Covariance vs. Variance of Returns
ibbi
aaab
ab
Prrrr
baCov
iiˆˆ
),(
iaaaai
a
aaa
Prrrr
aVar
iiˆˆ
)(2
2
Will Not Be on a Test
11-29
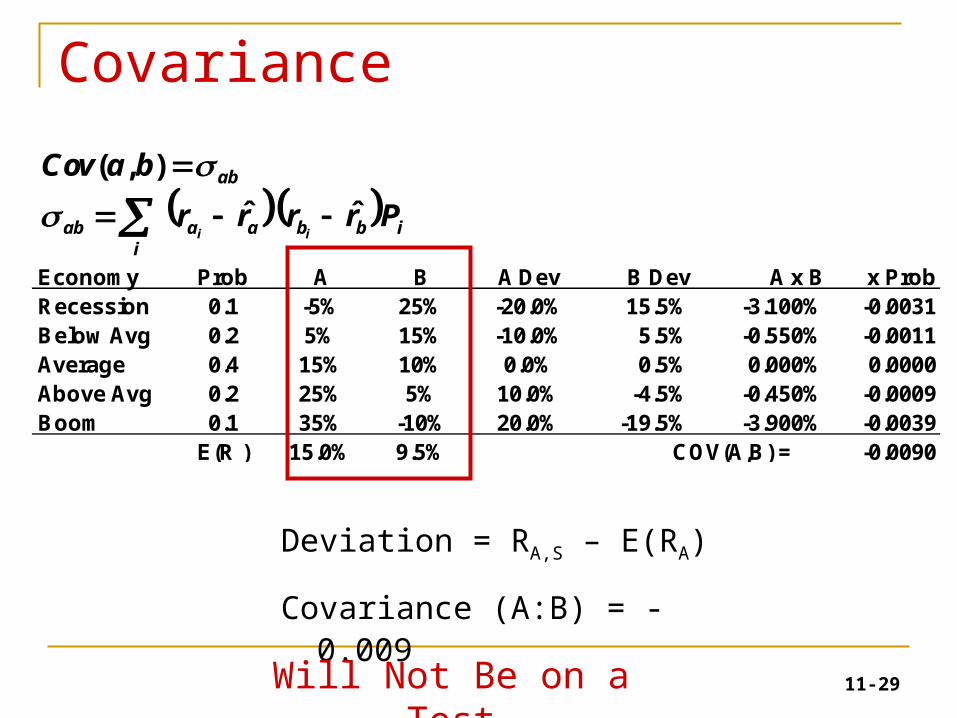
Covariance
Deviation = RA,S – E(RA)
Covariance (A:B) = -0.009
Economy Prob A B A Dev B Dev A x B x ProbRecession 0.1 -5% 25% -20.0% 15.5% -3.100% -0.0031Below Avg 0.2 5% 15% -10.0% 5.5% -0.550% -0.0011Average 0.4 15% 10% 0.0% 0.5% 0.000% 0.0000Above Avg 0.2 25% 5% 10.0% -4.5% -0.450% -0.0009Boom 0.1 35% -10% 20.0% -19.5% -3.900% -0.0039
E(R ) 15.0% 9.5% COV(A,B) = -0.0090
ibbi
aaab
ab
Prrrr
baCov
iiˆˆ
),(
Will Not Be on a Test
11-30Will Not Be on a Test
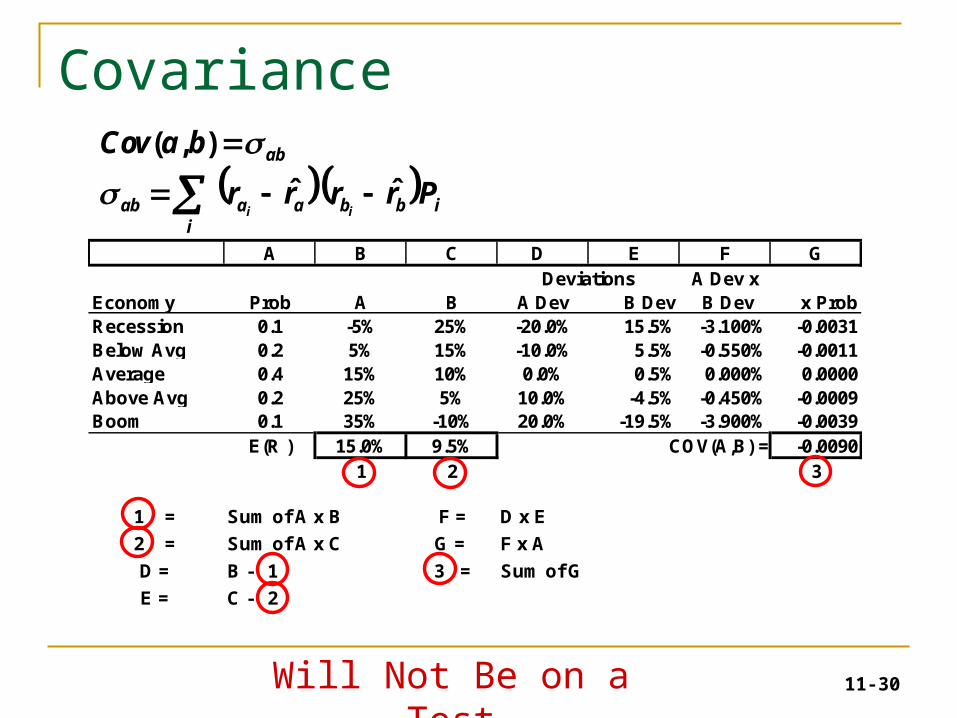
A B C D E F GA Dev x
Economy Prob A B A Dev B Dev B Dev x ProbRecession 0.1 -5% 25% -20.0% 15.5% -3.100% -0.0031Below Avg 0.2 5% 15% -10.0% 5.5% -0.550% -0.0011Average 0.4 15% 10% 0.0% 0.5% 0.000% 0.0000Above Avg 0.2 25% 5% 10.0% -4.5% -0.450% -0.0009Boom 0.1 35% -10% 20.0% -19.5% -3.900% -0.0039
E(R ) 15.0% 9.5% COV(A,B) = -0.00901 2 3
1 = Sum of A x B F = D x E
2 = Sum of A x C G = F x A
D = B - 1 3 = Sum of G
E = C - 2
Deviations
ibbi
aaab
ab
Prrrr
baCov
iiˆˆ
),(
Covariance
11-31
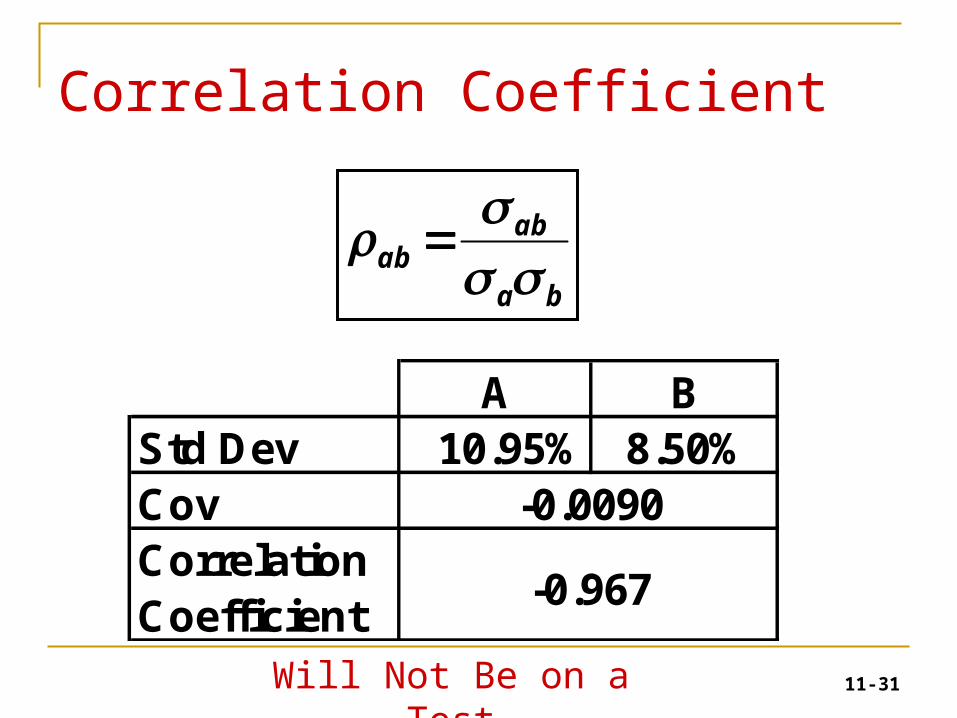
Correlation Coefficient
ba
abab
A BStd Dev 10.95% 8.50%CovCorrelationCoefficient
-0.0090
-0.967
Will Not Be on a Test
11-32
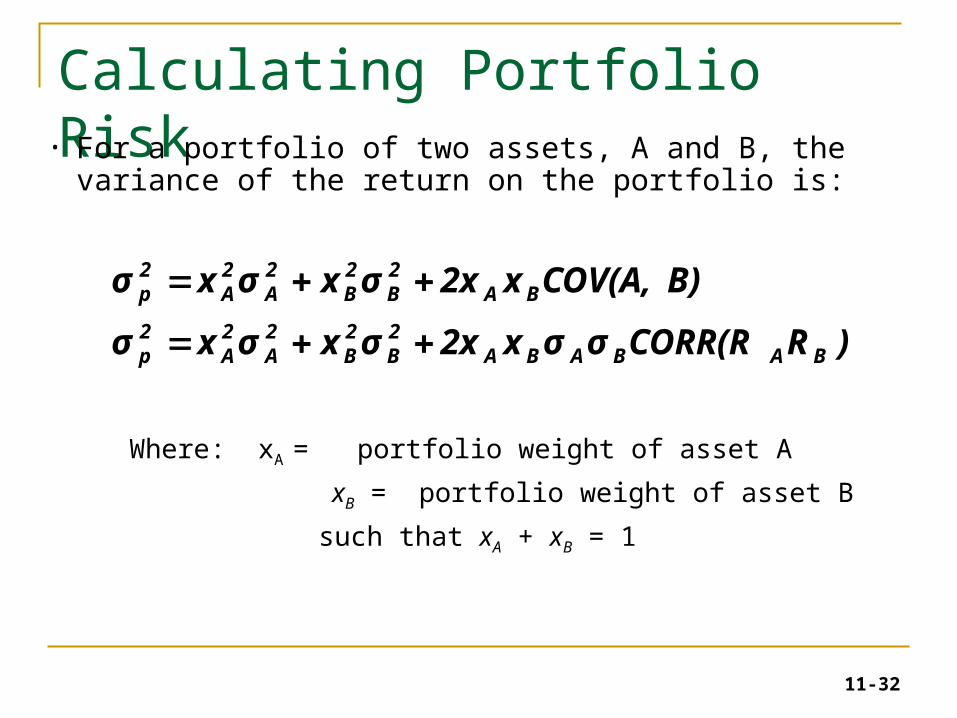
Calculating Portfolio Risk• For a portfolio of two assets, A and B, the
variance of the return on the portfolio is:
Where: xA = portfolio weight of asset A
xB = portfolio weight of asset B
such that xA + xB = 1
)RCORR(Rσσx2xσxσxσ
B)COV(A,x2xσxσxσ
BABABA2B
2B
2A
2A
2p
BA2B
2B
2A
2A
2p

11-33
Portfolio Risk Example
• Continuing our 2-stock example
),(222222BABABABBAAP RRCorrxxxx
PortfolioStock A Stock B 60A-40B
E(R) R 15% 9.50% 12.80%
Variance σ20.012 0.007 0.001156
Std Dev σ 10.95% 8.50% 3.40%Pf Weight X 60% 40%
Correlation Corr(RA,RB) -0.97
Stock Alone
11-34
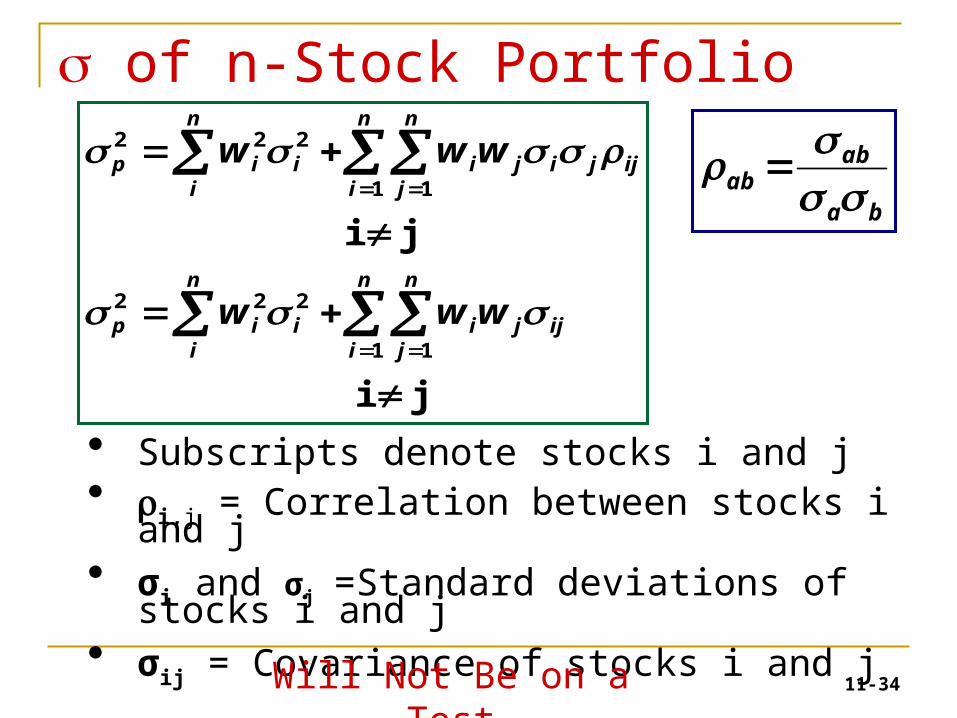
of n-Stock Portfolio
ji
ji
1 1
222
1 1
222
n
i
n
jijji
n
iiip
ij
n
i
n
jjiji
n
iiip
www
www
Subscripts denote stocks i and j i,j = Correlation between stocks i and j σi and σj =Standard deviations of stocks i and j σij = Covariance of stocks i and j
ba
abab
Will Not Be on a Test
11-35
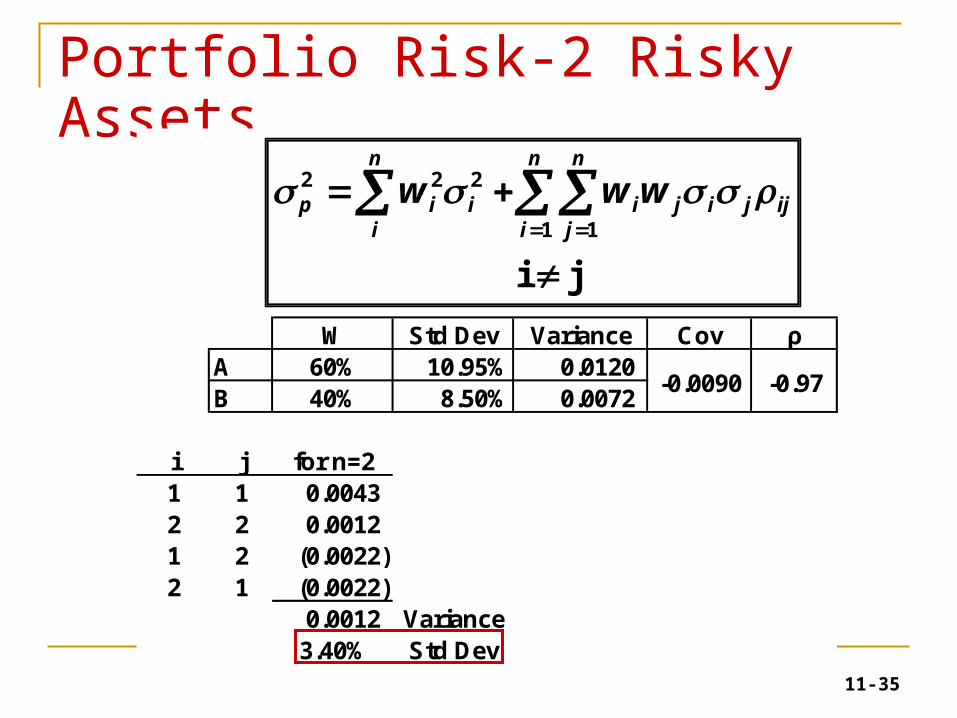
Portfolio Risk-2 Risky Assets
W Std Dev Variance Cov ρA 60% 10.95% 0.0120 B 40% 8.50% 0.0072
i j for n=21 1 0.0043 2 2 0.0012 1 2 (0.0022) 2 1 (0.0022)
0.0012 Variance3.40% Std Dev
-0.0090 -0.97
ji 1 1
222
ij
n
i
n
jjiji
n
iiip www
11-36
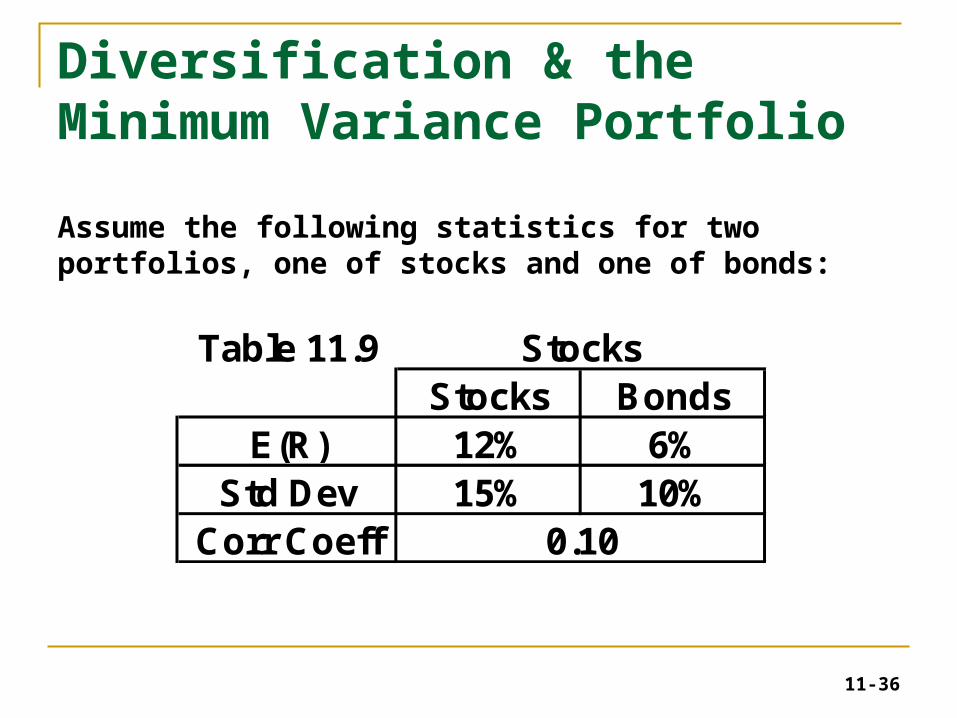
Diversification & the Minimum Variance Portfolio
Assume the following statistics for two portfolios, one of stocks and one of bonds:
Table 11.9Stocks Bonds
E(R) 12% 6%Std Dev 15% 10%
Corr Coeff 0.10
Stocks
11-37
Correlation and Diversification

11-38
Correlation and Diversification
11-39
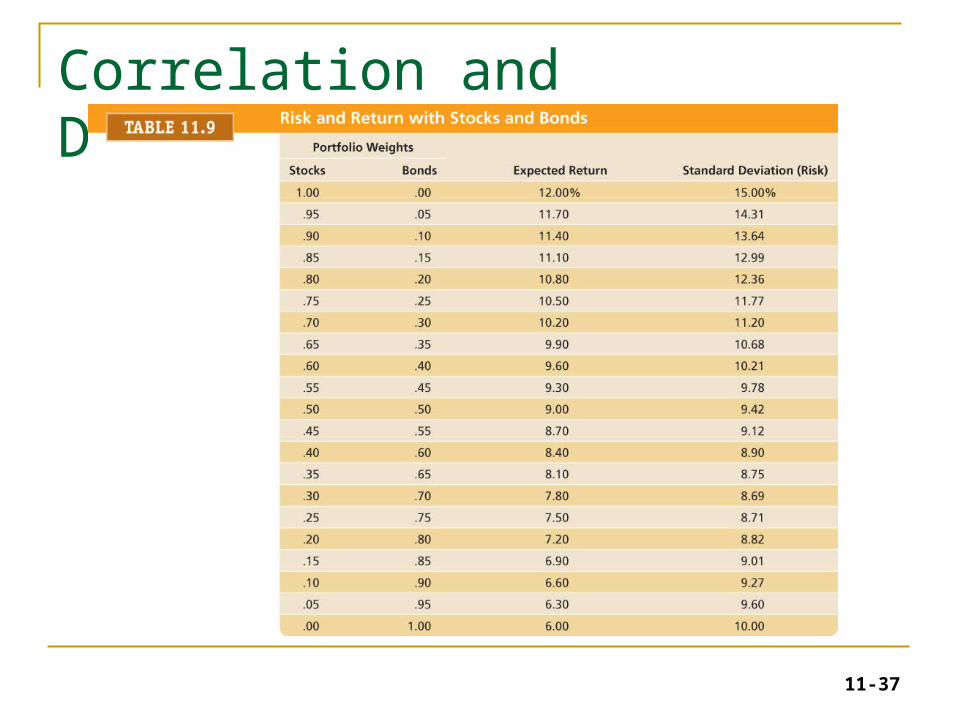
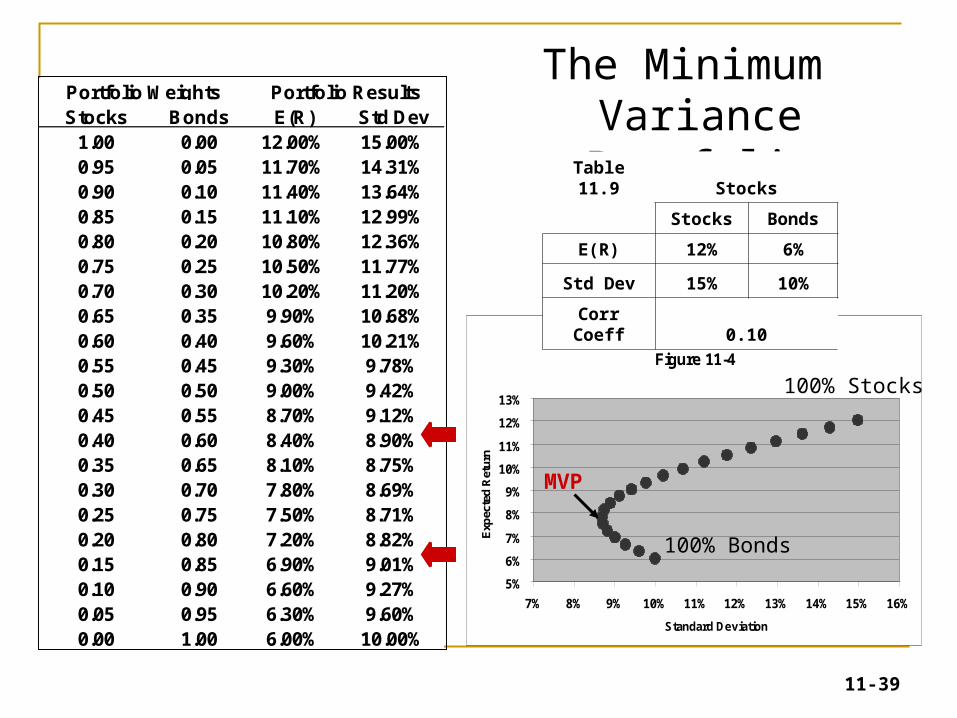
Stocks Bonds E(R) Std Dev1.00 0.00 12.00% 15.00%0.95 0.05 11.70% 14.31%0.90 0.10 11.40% 13.64%0.85 0.15 11.10% 12.99%0.80 0.20 10.80% 12.36%0.75 0.25 10.50% 11.77%0.70 0.30 10.20% 11.20%0.65 0.35 9.90% 10.68%0.60 0.40 9.60% 10.21%0.55 0.45 9.30% 9.78%0.50 0.50 9.00% 9.42%0.45 0.55 8.70% 9.12%0.40 0.60 8.40% 8.90%0.35 0.65 8.10% 8.75%0.30 0.70 7.80% 8.69%0.25 0.75 7.50% 8.71%0.20 0.80 7.20% 8.82%0.15 0.85 6.90% 9.01%0.10 0.90 6.60% 9.27%0.05 0.95 6.30% 9.60%0.00 1.00 6.00% 10.00%
Portfolio Weights Portfolio Results
Risk-Return with Stocks & BondsFigure 11-4
5%
6%
7%
8%
9%
10%
11%
12%
13%
7% 8% 9% 10% 11% 12% 13% 14% 15% 16%
Standard Deviation
Exp
ecte
d R
etur
n
The Minimum Variance Portfolio
100% Stocks
100% Bonds
MVP
Table 11.9 Stocks
Stocks Bonds
E(R) 12% 6%
Std Dev 15% 10%
Corr Coeff 0.10
11-40
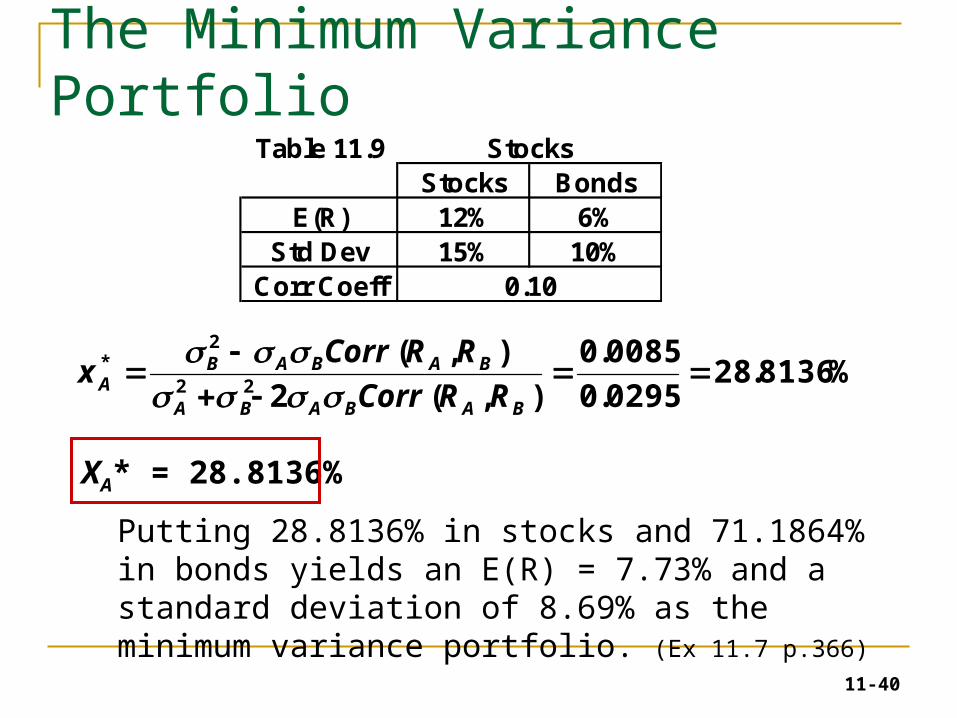
The Minimum Variance Portfolio
%8136.280295.0
0085.0
),(2
),(22
2*
BABABA
BABABA RRCorr
RRCorrx
Table 11.9Stocks Bonds
E(R) 12% 6%Std Dev 15% 10%
Corr Coeff 0.10
Stocks
XA* = 28.8136%
Putting 28.8136% in stocks and 71.1864% in bonds yields an E(R) = 7.73% and a standard deviation of 8.69% as the minimum variance portfolio. (Ex 11.7 p.366)
11-41
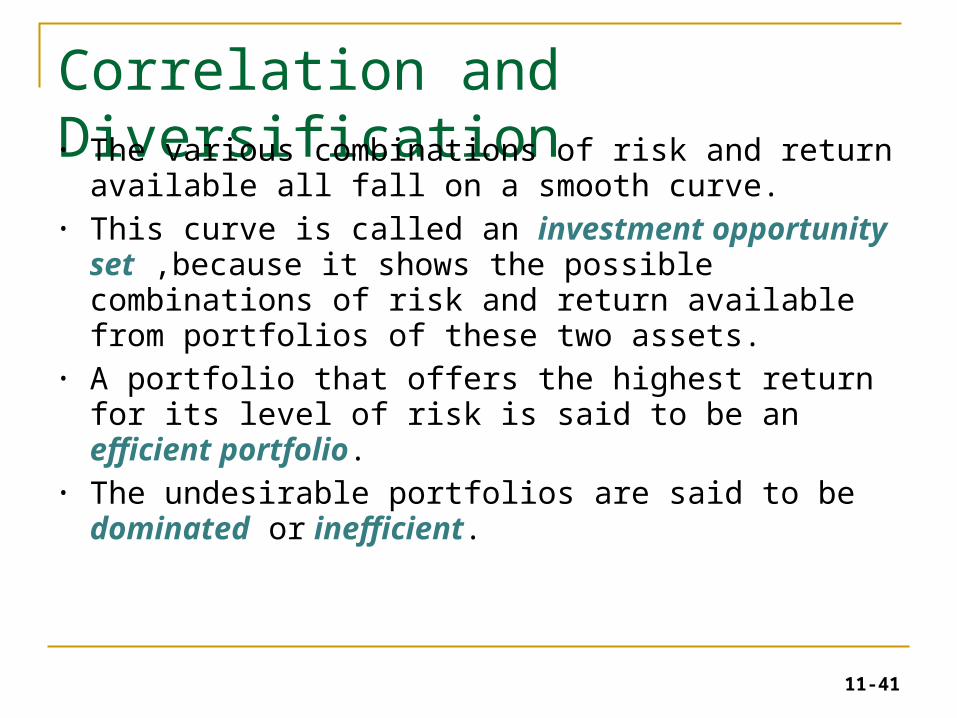
Correlation and Diversification• The various combinations of risk and return
available all fall on a smooth curve.• This curve is called an investment opportunity set
,because it shows the possible combinations of risk and return available from portfolios of these two assets.
• A portfolio that offers the highest return for its level of risk is said to be an efficient portfolio.
• The undesirable portfolios are said to be dominated or inefficient.
11-42
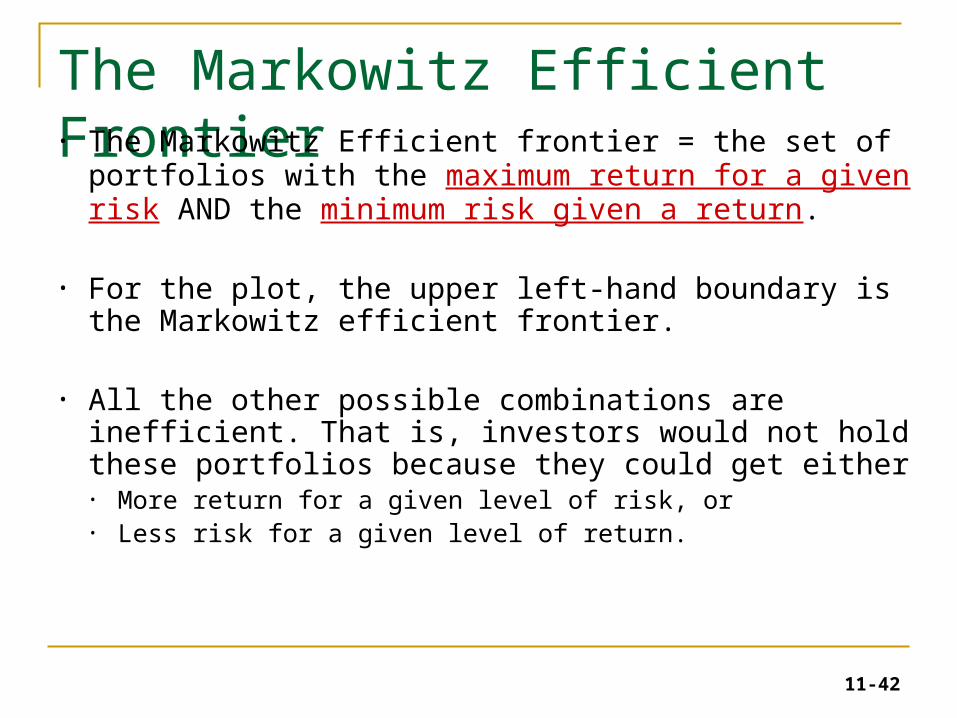
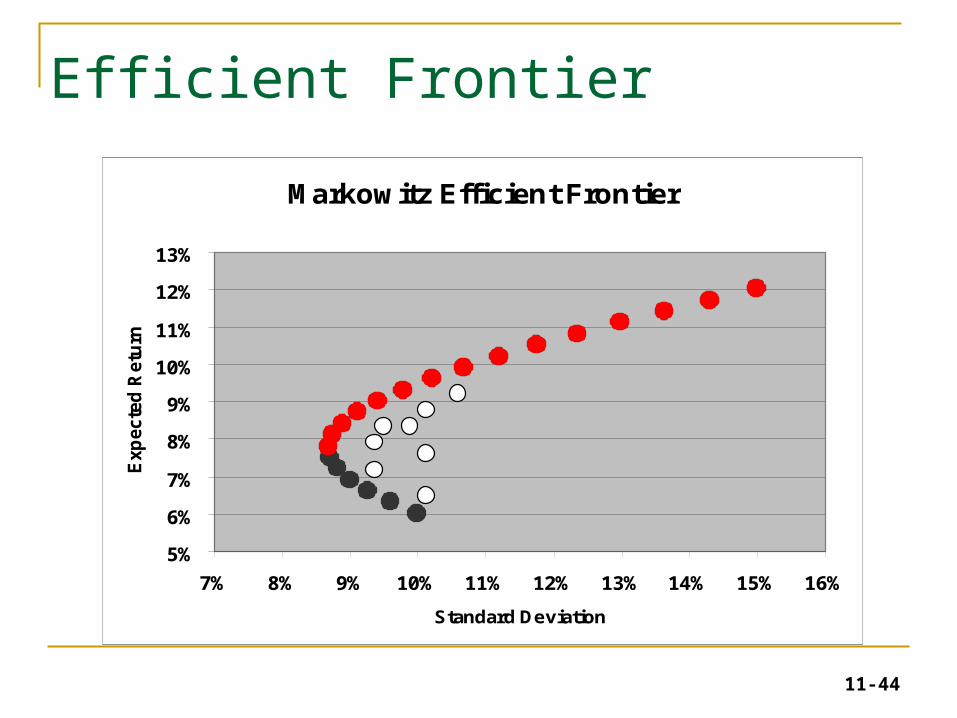
The Markowitz Efficient Frontier• The Markowitz Efficient frontier = the set of portfolios
with the maximum return for a given risk AND the minimum risk given a return.
• For the plot, the upper left-hand boundary is the Markowitz efficient frontier.
• All the other possible combinations are inefficient. That is, investors would not hold these portfolios because they could get either• More return for a given level of risk, or• Less risk for a given level of return.

11-43
Markowitz Efficient Frontier
Risk-Return with Stocks & BondsFigure 11-4
5%
6%
7%
8%
9%
10%
11%
12%
13%
7% 8% 9% 10% 11% 12% 13% 14% 15% 16%
Standard Deviation
Exp
ecte
d R
etu
rn
Efficient Frontier
Inefficient Frontier
11-44
Efficient Frontier
Markowitz Efficient Frontier
5%
6%
7%
8%
9%
10%
11%
12%
13%
7% 8% 9% 10% 11% 12% 13% 14% 15% 16%
Standard Deviation
Exp
ecte
d R
etu
rn
11-45
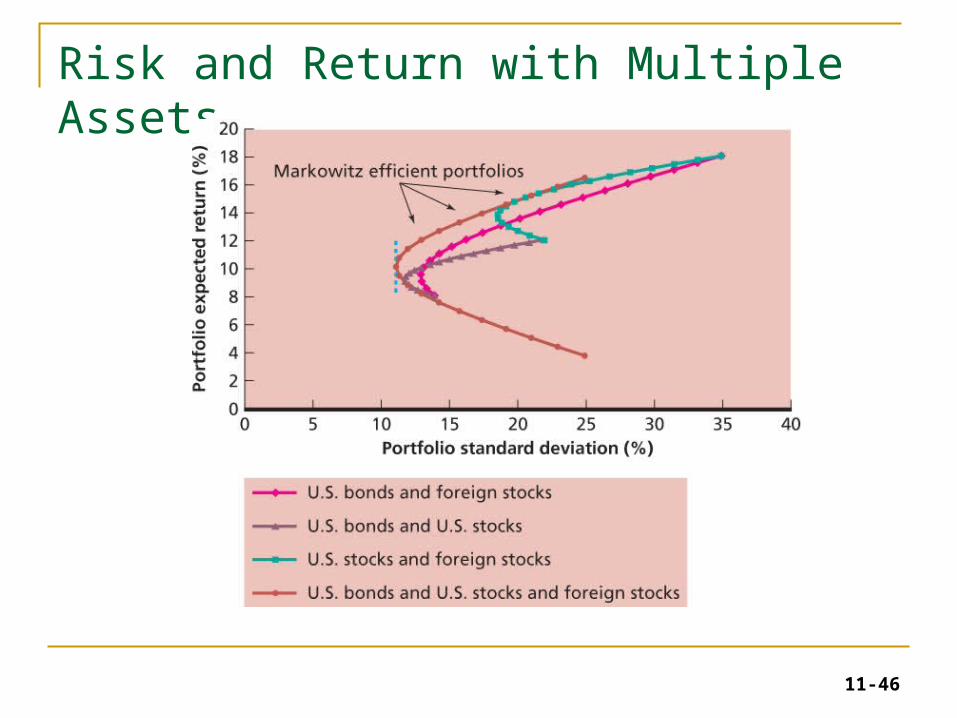
The Importance of Asset Allocation
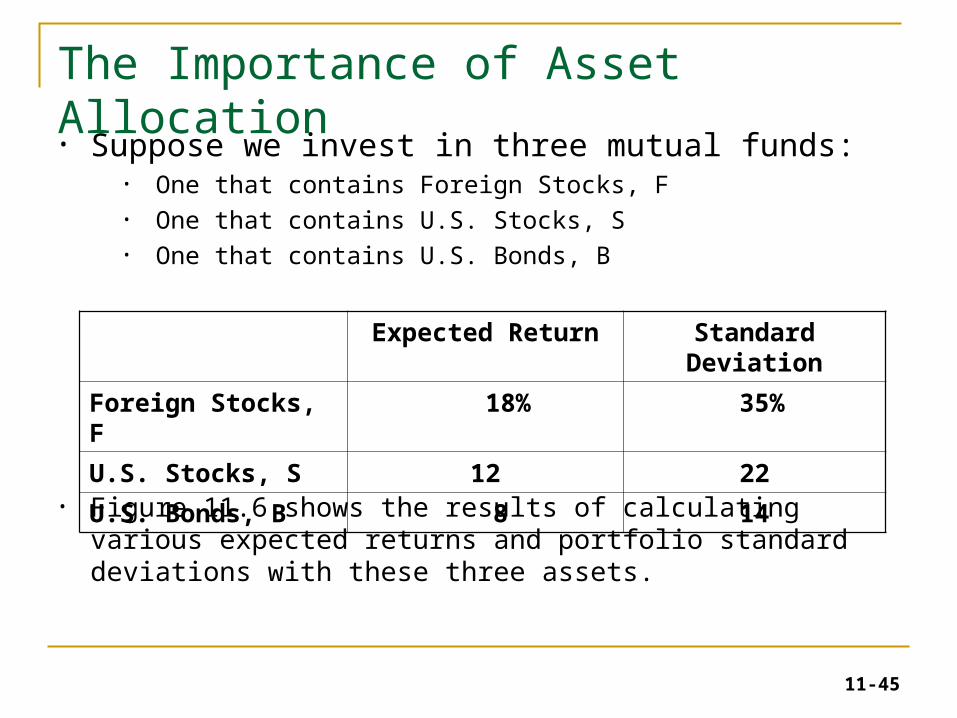
• Suppose we invest in three mutual funds:• One that contains Foreign Stocks, F• One that contains U.S. Stocks, S• One that contains U.S. Bonds, B
• Figure 11.6 shows the results of calculating various expected returns and portfolio standard deviations with these three assets.
Expected Return Standard Deviation
Foreign Stocks, F 18% 35%
U.S. Stocks, S 12 22
U.S. Bonds, B 8 14
11-46
Risk and Return with Multiple Assets
11-47
Useful Internet Sites
• www.411stocks.com (to find expected earnings)• www.investopedia.com (for more on risk measures)• www.teachmefinance.com (also contains more on risk
measure)• www.morningstar.com (measure diversification using “instant x-
ray”)• www.moneychimp.com (review modern portfolio theory)• www.efficentfrontier.com (check out the reading list)
Related Documents