11- 11-1

Welcome message from author
This document is posted to help you gain knowledge. Please leave a comment to let me know what you think about it! Share it to your friends and learn new things together.
Transcript

11-11-11

11-11-22
Chapter Eleven
Simple Linear Regression Analysis
McGraw-Hill/Irwin Copyright © 2004 by The McGraw-Hill Companies, Inc. All rights reserved.

11-11-33
Simple Linear Regression
11.1 The Simple Linear Regression Model
11.2 The Least Squares Point Estimates
11.3 Model Assumptions, Mean Squared Error, Std. Error
11.4 Testing Significance of Slope and y-Intercept
11.5 Confidence Intervals and Prediction Intervals
11.6 The Coefficient of Determination and Correlation
11.7 An F Test for the Simple Linear Regression Model
*11.8 Checking Regression Assumptions by Residuals
*11.9 Some Shortcut Formulas

11-11-44
11.1 The Simple Linear Regression Model
εxββ=εμy= y|x 10
y|x = + 1x + is the mean value of the dependent variable y when the value of the independent variable is x.
is the y-intercept, the mean of y when x is 0.
1 is the slope, the change in the mean of y per unit change in x.
is an error term that describes the effect on y of all factors other than x.
AverageHourly Weekly FuelTemperature Consumption
Week x (deg F) y (MMcf)1 28.0 12.42 28.0 11.73 32.5 12.44 39.0 10.85 45.9 9.46 57.8 9.57 58.1 8.08 62.5 7.5

11-11-55
The Simple Linear Regression Model Illustrated

11-11-66
11.2 The Least Squares Point Estimates
n
xxxxSS
n
yxyxyyxxSS
SS
SSb
iiixx
iiiiiixy
xx
xy
2
22
1
)(
)()(
xbby 10 ˆ
n
xx
n
yyxbyb ii 10
Estimation/Prediction Equation:
Least squares point estimate of the slope 1
Least squares point estimate of the y-intercept 0

11-11-77
Example: The Least Squares Point Estimates
0.1279
355.1404
6475.179
355.14048
)8.351(76.16874
6475.1798
)7.81)(8.351(11.3413
1
22
2
xx
xy
iixx
iiiixy
SS
SSb
n
xxSS
n
yxyxSS
15.84
)98.43)(1279.0(2125.10
98.438
8.351
2125.108
7.81
10 xbyb
n
xx
n
yy
i
i
Slope b1 y-Intercept b0
y x x2 xy12.4 28.0 784.00 347.2011.7 28.0 784.00 327.6012.4 32.5 1056.25 403.0010.8 39.0 1521.00 421.209.4 45.9 2106.81 431.469.5 57.8 3340.84 549.108.0 58.1 3375.61 464.807.5 62.5 3906.25 468.75
81.7 351.8 16874.76 3413.11
Gas of MMcf10.720.1279(40)-15.84 xbby 10 ˆPrediction (x = 40)

11-11-88
11.3 The Regression Model Assumptions
Assumptions about the model error terms, ’s
Mean Zero The mean of the error terms is equal to 0.
Constant Variance The variance of the error terms is, the same for all values of x.
Normality The error terms follow a normal distribution for all values of x.
Independence The values of the error terms are statistically independent of each other.
εxββ=εμy= y|x 10Model

11-11-99
Regression Model Assumptions Illustrated

11-11-1010
Mean Square Error and Standard Error
Mean Square Error, point estimate of residual variance 2
2
n-
SSEMSEs
2n-
SSEMSEs Standard Error, point estimate of
residual standard deviation
y x pred y - pred (y - pred)2
12.4 28.0 12.2588 0.1412 0.01993711.7 28.0 12.2588 -0.5588 0.31225712.4 32.5 11.6833 0.7168 0.51373110.8 39.0 10.8519 -0.0519 0.0026949.4 45.9 9.9694 -0.5694 0.3242059.5 57.8 8.4474 1.0526 1.1080098.0 58.1 8.4090 -0.4090 0.1672897.5 62.5 7.8463 -0.3462 0.119889
SSE 2.568011
Example 11.6 The Fuel Consumption Case
0.428
6
568.22
2
n-
SSEMSEs
0.6542 428.02ss
22 )ˆ( iii yyeSSE Sum of Squared Errors

11-11-1111
11.4 Significance Test and Estimation for Slope
xx
bb SS
ss
s
bt=
1
1
where1
Test Statistic
If the regression assumptions hold, we can reject H0: 1 = 0 at the level of significance (probability of Type I error equal to ) if and only if the appropriate rejection point condition holds or, equivalently, if the corresponding p-value is less than .
0:
0:
0:
1
1
1
a
a
a
H
H
H
2/2/
2/
or
isthat,
tttt
tt
tt
tt
t, t/2 and p-values are based on n – 2 degrees of freedom.
Alternative Reject H0 if: p-Value
tofrightondistributit underarea Twice
tofleftondistributit underArea
tofrightondistributit underArea
100(1-)% Confidence Interval for 1
][12/1 bstb

11-11-1212
Significance Test and Estimation for y-Intercept
xxb
b SS
x
nss
s
bt=
20 1
where0
0
Test Statistic
If the regression assumptions hold, we can reject H0: 0 = 0 at the level of significance (probability of Type I error equal to ) if and only if the appropriate rejection point condition holds or, equivalently, if the corresponding p-value is less than .
0:
0:
0:
0
0
0
a
a
a
H
H
H
2/2/
2/
or
isthat,
tttt
tt
tt
tt
t, t/2 and p-values are based on n – 2 degrees of freedom.
Alternative Reject H0 if: p-Value
tofrightondistributit underarea Twice
tofleftondistributit underArea
tofrightondistributit underArea
100(1-)% Conf Interval for 0
][02/0 bstb

11-11-1313
Example: Inferences About Slope and y-Intercept
Example 11.7 The Fuel Consumption Case Excel Output
Regression StatisticsMultiple R 0.948413871R Square 0.899488871Adjusted R Square 0.882737016Standard Error 0.654208646Observations 8
ANOVAdf SS MS F Significance F
Regression 1 22.980816 22.980816 53.694882 0.000330052Residual 6 2.567934 0.427989Total 7 25.548750
Coefficients Standard Error t Stat P-valueIntercept 15.83785741 0.801773385 19.75353349 0.000001092Temp -0.127921715 0.01745733 -7.327679169 0.000330052
Coefficients Standard Error Lower 95% Upper 95%Intercept 15.83785741 0.801773385 13.87598718 17.79972765Temp -0.127921715 0.01745733 -0.170638294 -0.085205136
Tests
Intervals

11-11-1414
11.5 Confidence and Prediction Intervals
] valueDistancety[ /2s
t is based on n-2 degrees of freedom
] valueDistance+1ty[ /2s
Prediction (x = x0)
010ˆ xbby Distance Value
xxSS
xx
n
20 )(1
100(1 - )% confidence interval for the mean value of y, y|xo
If the regression assumptions hold,
100(1 - )% prediction interval for an individual value of y

11-11-1515
Example: Confidence and Prediction Intervals
Example 11.7 The Fuel Consumption Case
Minitab Output (predicted FuelCons when Temp, x = 40)
Predicted Values Fit StDev Fit 95.0% CI 95.0% PI 10.721 0.241 ( 10.130, 11.312) ( 9.014, 12.428)

11-11-1616
11.6 The Simple Coefficient of Determination
The simple coefficient of determination r2 is
variationTotal
n variatioExplainedr2
(SSE)SquaresofSumErrorˆ= variationdUnexplaine
(SSR) SquaresofSumRegressionˆ= variationExplained
(SSTO) SquaresofSumTotal = variationTotal
2
2
2
)y(y
)yy(
)y(y
ii
i
i
variation dUnexplaine variation Explained variation Total
r2 is the proportion of the total variation in y explained by the simple linear regression model

11-11-1717
The Simple Correlation Coefficient
The simple correlation coefficient measures the strength of the linear relationship between y and x and is denoted by r.
negative is if
and positive, is if
12
12
brr=
brr=
Where, b1 is the slope of the least squares line.
Regression StatisticsMultiple R 0.948413871R Square 0.899488871Adjusted R Square 0.882737016Standard Error 0.654208646Observations 8
ANOVAdf SS MS F Significance F
Regression 1 22.980816 22.980816 53.694882 0.000330052Residual 6 2.567934 0.427989Total 7 25.548750
Example 11.15Fuel Consumption Excel Output
948414.0899489.0
899489.0548750.25
980816.222
r
r

11-11-1818
Different Values of the Correlation Coefficient
11-11-1919
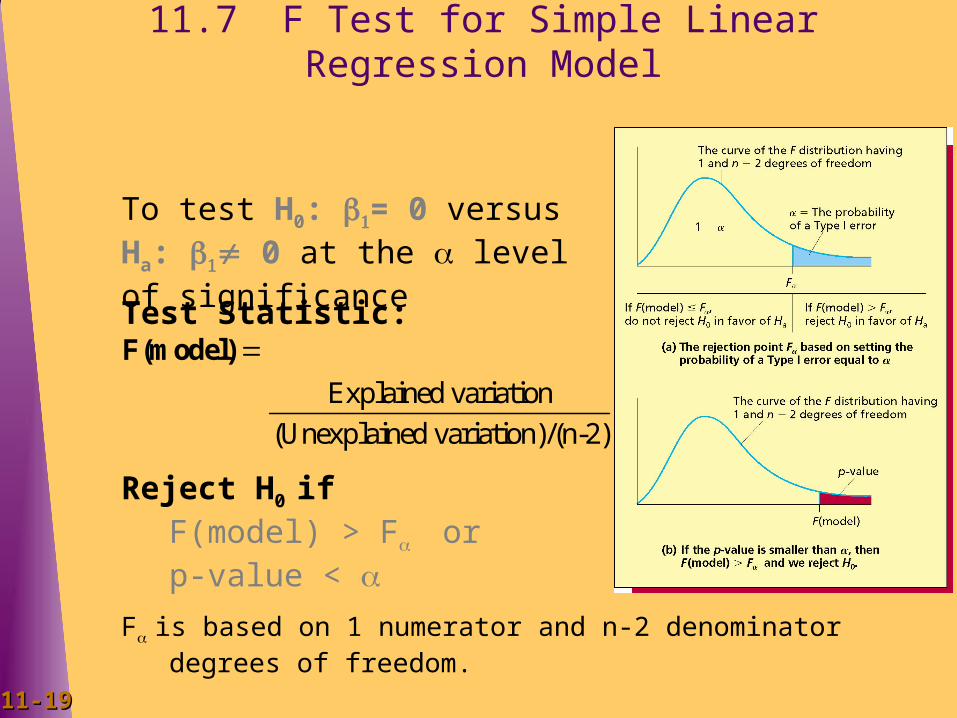
11.7 F Test for Simple Linear Regression Model
To test H0: = 0 versus Ha: 0 at the level of significance
Test Statistic:
Explained variation
(Unexplained variation)/(n-2)
F(model)
Reject H0 if F(model) > For p-value <
Fis based on 1 numerator and n-2 denominator degrees of freedom.

11-11-2020
Example: F Test for Simple Linear Regression
Test Statistic:
695.53)28/(567904.2
980816.22
2)-)/(n variationed(Unexplain
variationExplainedF(model)
Example 11.17 The Fuel Consumption Case Excel Output
ANOVAdf SS MS F Significance F
Regression 1 22.980816 22.980816 53.694882 0.000330052Residual 6 2.567934 0.427989Total 7 25.548750
F-test at = 0.05 level of significance
Reject H0 at level of significance, since
Fis based on 1 numerator and 6 denominator degrees of freedom.
05.000033.0value-p
and99.5695.53F(model) 05.F

11-11-2121
*11.8 Checking the Regression Assumptions by Residual Analysis
For an observed value of y, the residual is
where the predicted value of y is calculated as
y)predictedy(observedˆ yye
xbby 10ˆ
If the regression assumptions hold, the residuals should look like a random sample from a normal distribution with mean 0 and variance 2.
Residual Plots
Residuals versus independent variablesResiduals versus predicted y’sResiduals in time order (if the response is a time series)Histogram of residualsNormal plot of the residuals

11-11-2222
Checking the Constant Variance Assumption
Example 11.18: The QHIC CasePlot: Residual versus x and predicted responses

11-11-2323
Checking the Normality Assumption
Example 11.18: The QHIC CasePlots: Histogram and Normal Plot of Residuals

11-11-2424
Checking the Independence Assumption
Plots: Residuals versus Fits (to check for functional form, not shown) Residuals versus Time Order

11-11-2525
Combination Residual Plots
Example 11.18: The QHIC Case Minitab OutputPlots: Histogram and Normal Plot of Residuals, Residuals versus Order (I Chart), Residuals versus Fit.
-300 -200 -100 0 100 200 300
0123456789
Residual
Freq
uenc
y
Histogram of Residuals
0 10 20 30 40-500
0
500
Observation Number
Res
idua
l
I Chart of Residuals
2
2
X=0.000
3.0SL=396.3
-3.0SL=-396.3
0 20040060080010001200140016001800
-300
-200
-100
0
100
200
300
Fit
Res
idua
lResiduals vs. Fits
-2 -1 0 1 2
-300
-200
-100
0
100
200
300
Normal Plot of Residuals
Normal Score
Res
idua
l
Residual Model Diagnostics
11-11-2626
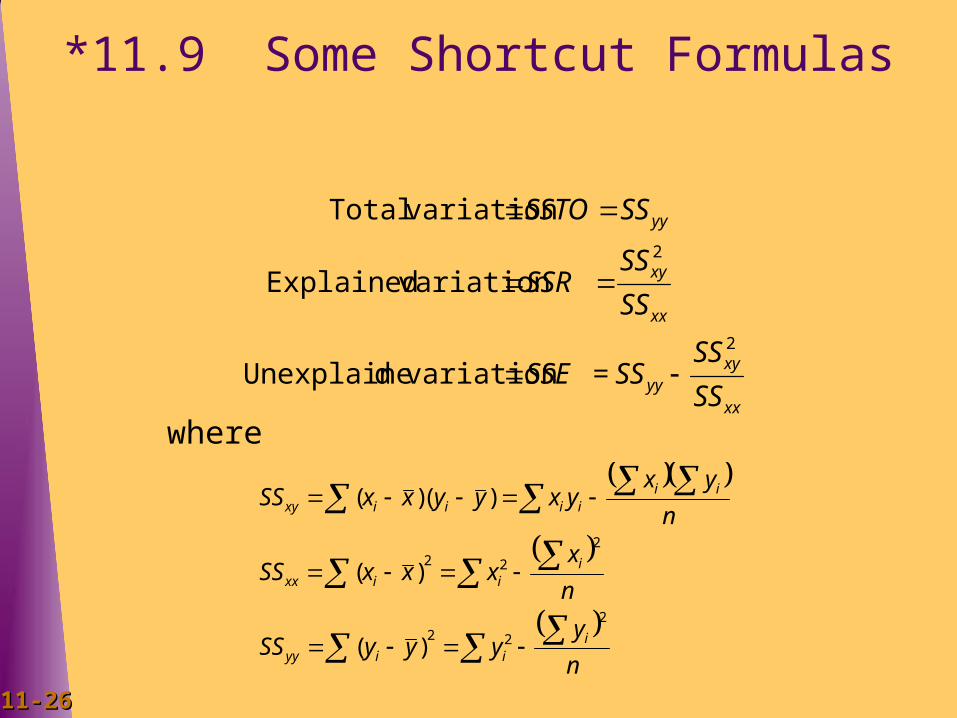
*11.9 Some Shortcut Formulas
xx
xyyy
xx
xy
yy
SS
SSSS=SSE
SS
SSSSR
SSSSTO
2
2
variationdUnexplaine
variationExplained
variationTotal
n
yyyySS
n
xxxxSS
n
yxyxyyxxSS
iiiyy
iiixx
iiiiiixy
2
22
2
22
)(
)(
)()(
where

11-11-2727
Simple Linear RegressionSummary: 11.1 The Simple Linear Regression Model 11.2 The Least Squares Point Estimates 11.3 Model Assumptions, Mean Squared Error, Std.
Error 11.4 Testing Significance of Slope and y-Intercept 11.5 Confidence Intervals and Prediction Intervals 11.6 The Coefficient of Determination and
Correlation 11.7 An F Test for the Simple Linear Regression
Model*11.8 Checking Regression Assumptions by
Residuals*11.9 Some Shortcut Formulas
Related Documents