October 31, 2012 FY 2012 First-Half Financial Results April 1, 2012 - September 30, 2012 Fujitsu Limited Press Contacts Fujitsu Limited Public and Investor Relations Division Inquiries:https://www-s.fujitsu.com/global/news/contacts/inquiries/index.html

11 06-12 fujitsu results-q2-1
Jan 12, 2015
Welcome message from author
This document is posted to help you gain knowledge. Please leave a comment to let me know what you think about it! Share it to your friends and learn new things together.
Transcript
October 31, 2012
FY 2012 First-Half Financial Results April 1, 2012 - September 30, 2012
Fujitsu Limited
Press Contacts Fujitsu Limited Public and Investor Relations Division Inquiries:https://www-s.fujitsu.com/global/news/contacts/inquiries/index.html
Contents
Part I: Financial Tables
1. Summary of FY 2012 First-Half Consolidated Results p. 1
2. Dividends Per Share of Common Stock p. 1
3. Number of Issued Shares (Common Shares) p. 2
4. Consolidated Earnings Forecast for FY 2012 p. 2
5. FY2012 First-Half Consolidated Income Statements p. 3
and Consolidated Statements of Comprehensive Income
6. FY2012 First-Half Consolidated Business Segment Information p. 5
7. FY2012 First-Half Consolidated Balance Sheets p. 7
8. FY2012 First-Half Consolidated Statements of Cash Flows p. 9
9. FY2012 Second-Quarter Consolidated Income Statements p. 10
and Consolidated Statements of Comprehensive Income
10. FY2012 Second-Quarter Consolidated Business Segment Information p. 12
Part II: Explanation of Financial Results
1. Overview of FY2012 Second-Quarter Consolidated Financial Results p. 14
2. Profit and Loss for the Second Quarter p. 16
3. Results by Business Segment p. 18
4. Overview of FY2012 First-Half Consolidated Results p. 22
5. Financial Condition p. 28
6. FY2012 Consolidated Earnings Projections p. 32
7. Segment Information p. 34
8. Consolidated Per Share Data p. 39
9. Major Subsequent Events p. 40
10. Notes to Consolidated Financial Statements p. 41
Part III: Supplementary Information 1. Forecast for FY 2012 Consolidated Business Segment Information p.S1
2. Miscellaneous Forecasts for FY 2012 p.S3

Part I: Financial Tables
1. Summary of FY 2012 First-Half Consolidated Results
a. Summary of Consolidated Income Statements and Comprehensive Income
Yen
(Millions, except per share data)
1H FY 2012 1H FY 2011
Net sales Operating income Income (loss) before income taxes
and minority interests Net income Comprehensive income
Y (4/1/12~9/30/12)
2,071,813 7,690
3,121 (11,059) (25,004)
(4/1/11~9/30/11)
2,092,317 7,051
(10,277) 5,774
(23,093)
Net income (loss) per common share: Basic Diluted Y
(5.34) -
2.79 2.79
b. Summary of Consolidated Financial Condition
Yen
(Millions, except per share data)
Total assets Net assets Owners' equity Owners' equity ratio
Y
Y
September 30, 2012
2,772,298 928,767 805,248
29.0%
March 31, 2012
2,945,507 966,598 841,039
28.6%
2. Dividends Per Share of Common Stock
Yen
FY2012 FY 2011
First-quarter ended June 30 Second-quarter ended September 30 Third-quarter ended December 31 Full year ended March 31 Total
Y
Y
(Actual)
-(Forecast)
5.00 -
5.00 10.00
(Actual)
-5.00
-5.00
10.00
5.00
1
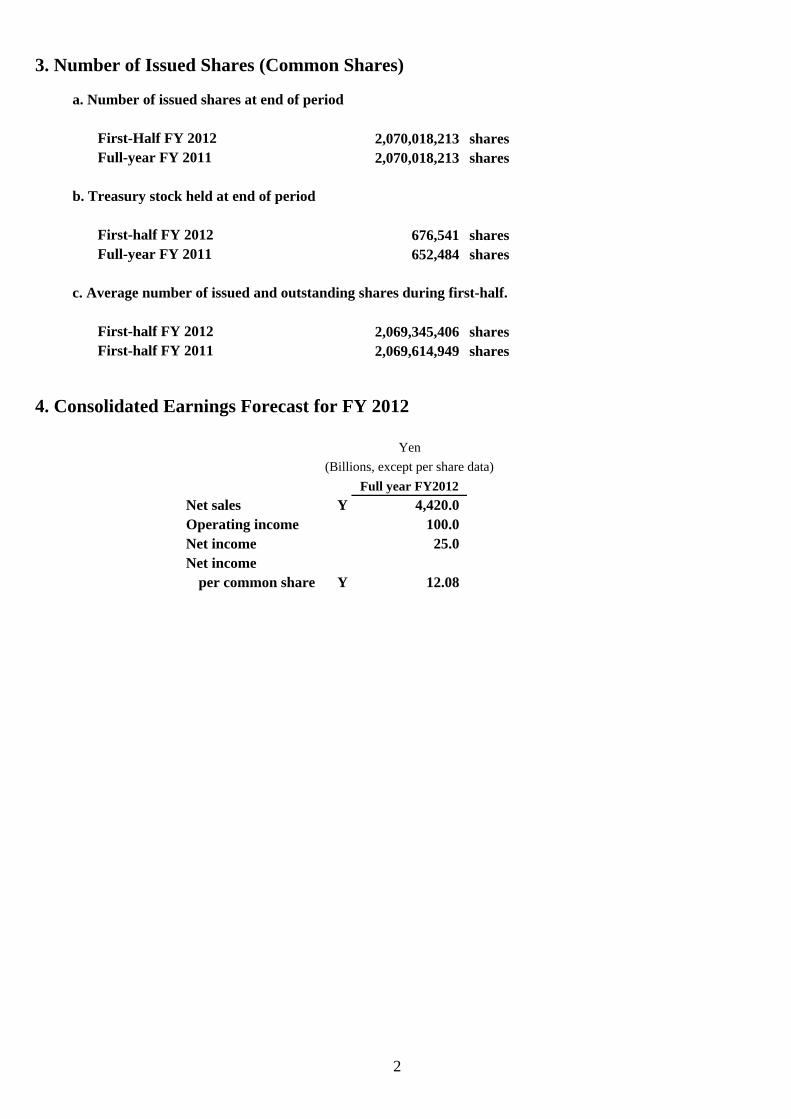
3. Number of Issued Shares (Common Shares)
a. Number of issued shares at end of period
First-Half FY 2012 2,070,018,213 shares Full-year FY 2011 2,070,018,213 shares
b. Treasury stock held at end of period
First-half FY 2012 676,541 shares Full-year FY 2011 652,484 shares
c. Average number of issued and outstanding shares during first-half.
First-half FY 2012 2,069,345,406 shares First-half FY 2011 2,069,614,949 shares
4. Consolidated Earnings Forecast for FY 2012
Yen
(Billions, except per share data)
Full year FY2012
Net sales Y 4,420.0 Operating income 100.0 Net income 25.0 Net income
per common share Y 12.08
2
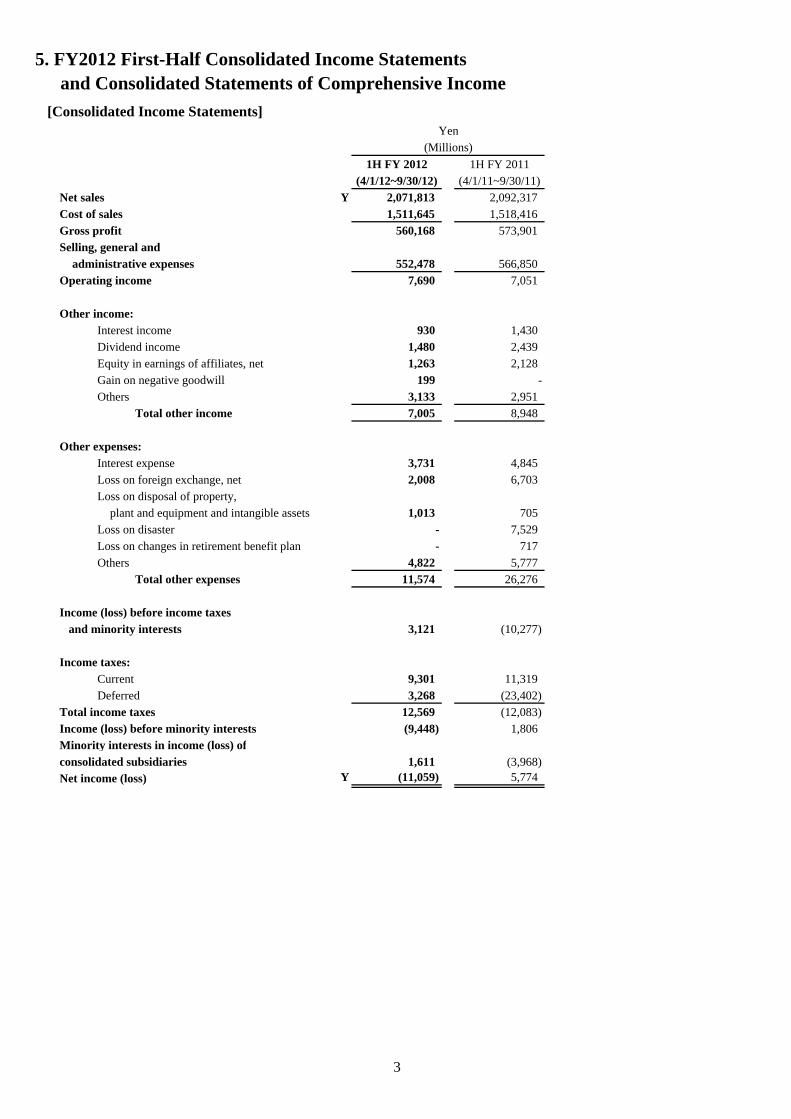
5. FY2012 First-Half Consolidated Income Statements and Consolidated Statements of Comprehensive Income
[Consolidated Income Statements] Yen
(Millions)
1H FY 2012 1H FY 2011
(4/1/12~9/30/12) (4/1/11~9/30/11)
Net sales Y 2,071,813 2,092,317
Cost of sales 1,511,645 1,518,416
Gross profit 560,168 573,901
Selling, general and
administrative expenses 552,478 566,850
Operating income 7,690 7,051
Other income:
Interest income 930 1,430
Dividend income 1,480 2,439
Equity in earnings of affiliates, net 1,263 2,128
Gain on negative goodwill 199 -
Others 3,133 2,951
Total other income 7,005 8,948
Other expenses:
Interest expense 3,731 4,845
Loss on foreign exchange, net 2,008 6,703
Loss on disposal of property,
plant and equipment and intangible assets 1,013 705
Loss on disaster - 7,529
Loss on changes in retirement benefit plan - 717
Others 4,822 5,777
Total other expenses 11,574 26,276
Income (loss) before income taxes
and minority interests 3,121 (10,277)
Income taxes:
Current 9,301 11,319
Deferred 3,268 (23,402)
Total income taxes 12,569 (12,083)
Income (loss) before minority interests (9,448) 1,806 Minority interests in income (loss) of
consolidated subsidiaries 1,611 (3,968)
Net income (loss) Y (11,059) 5,774
3
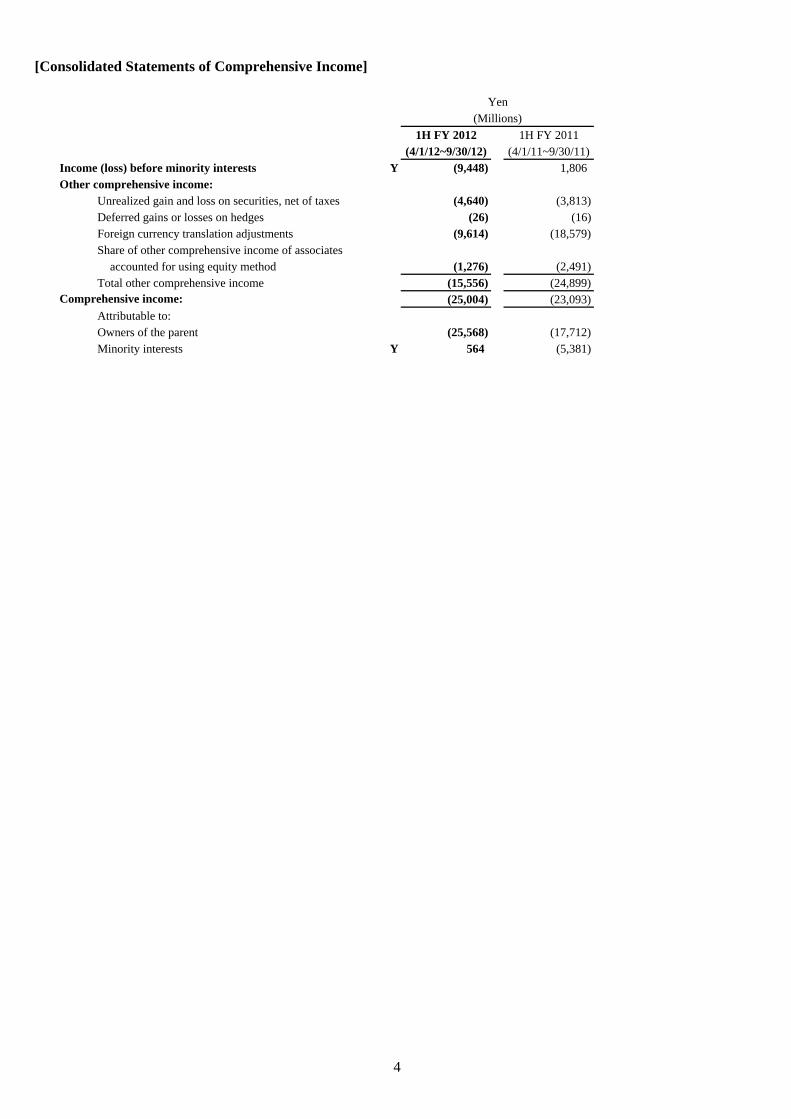
[Consolidated Statements of Comprehensive Income]
Yen (Millions)
1H FY 2012 1H FY 2011 (4/1/12~9/30/12) (4/1/11~9/30/11)
Income (loss) before minority interests Y (9,448) 1,806 Other comprehensive income:
Unrealized gain and loss on securities, net of taxes (4,640) (3,813) Deferred gains or losses on hedges (26) (16) Foreign currency translation adjustments (9,614) (18,579) Share of other comprehensive income of associates
accounted for using equity method (1,276) (2,491) Total other comprehensive income (15,556) (24,899)
Comprehensive income: (25,004) (23,093) Attributable to: Owners of the parent (25,568) (17,712) Minority interests Y 564 (5,381)
4
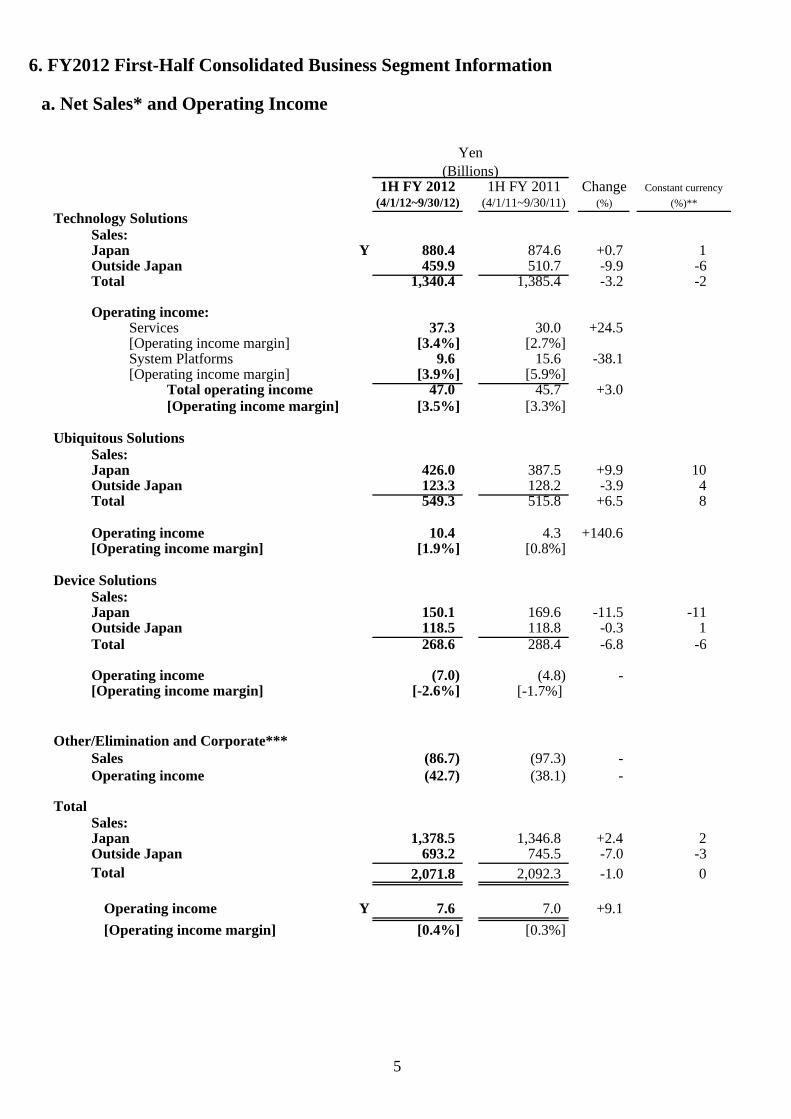
6. FY2012 First-Half Consolidated Business Segment Information
a. Net Sales* and Operating Income
Technology Solutions Sales: JapanOutside JapanTotal
1H FY 2012 1H FY 2011 (4/1/12~9/30/12) (4/1/11~9/30/11)
Y 880.4 874.6 459.9 510.7
1,340.4 1,385.4
Yen (Billions)
Change (%)
+0.7 -9.9 -3.2
Constant currency
(%)**
1 -6 -2
Operating income:Services [Operating income margin]System Platforms [Operating income margin]
Total operating income [Operating income margin]
37.3 [3.4%]
9.6 [3.9%]
47.0 [3.5%]
30.0 [2.7%]
15.6 [5.9%]
45.7 [3.3%]
+24.5
-38.1
+3.0
Ubiquitous Solutions Sales: JapanOutside JapanTotal
426.0 123.3 549.3
387.5 128.2 515.8
+9.9 -3.9
+6.5
10 4 8
Operating income[Operating income margin]
10.4 [1.9%]
4.3 [0.8%]
+140.6
Device Solutions Sales: JapanOutside Japan Total
150.1 118.5 268.6
169.6 118.8 288.4
-11.5 -0.3 -6.8
-11 1
-6
Operating income[Operating income margin]
(7.0)[-2.6%]
(4.8)[-1.7%]
-
Other/Elimination and Corporate*** Sales Operating income
(86.7) (42.7)
(97.3)(38.1)
--
Total Sales: JapanOutside Japan Total
1,378.5 693.2
2,071.8
1,346.8 745.5
2,092.3
+2.4 -7.0 -1.0
2 -3 0
Operating income
[Operating income margin]
Y 7.6
[0.4%]
7.0
[0.3%]
+9.1
5
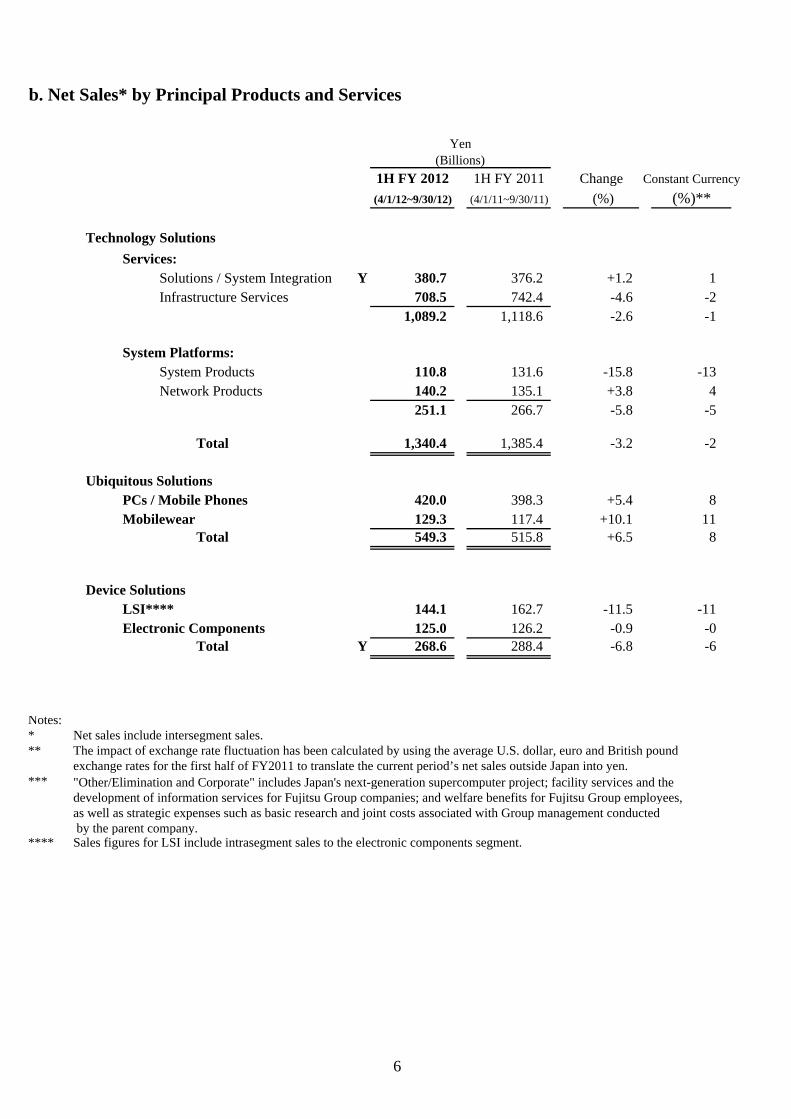
b. Net Sales* by Principal Products and Services
Yen (Billions)
1H FY 2012 1H FY 2011 Change Constant Currency
(4/1/12~9/30/12) (4/1/11~9/30/11) (%) (%)**
Technology Solutions
Services: Solutions / System Integration Infrastructure Services
Y 380.7 708.5
1,089.2
376.2 742.4
1,118.6
+1.2 -4.6 -2.6
1 -2 -1
System Platforms: System Products Network Products
110.8 140.2 251.1
131.6 135.1 266.7
-15.8 +3.8 -5.8
-13 4
-5
Total 1,340.4 1,385.4 -3.2 -2
Ubiquitous Solutions PCs / Mobile Phones Mobilewear
Total
420.0 129.3 549.3
398.3 117.4 515.8
+5.4 +10.1
+6.5
8 11
8
Device Solutions LSI**** Electronic Components
Total Y
144.1 125.0 268.6
162.7 126.2 288.4
-11.5 -0.9 -6.8
-11 -0 -6
Notes: * **
***
****
Net sales include intersegment sales. The impact of exchange rate fluctuation has been calculated by using the average U.S. dollar, euro and British pound exchange rates for the first half of FY2011 to translate the current period’s net sales outside Japan into yen.
Sales figures for LSI include intrasegment sales to the electronic components segment. by the parent company.
"Other/Elimination and Corporate" includes Japan's next-generation supercomputer project; facility services and the development of information services for Fujitsu Group companies; and welfare benefits for Fujitsu Group employees, as well as strategic expenses such as basic research and joint costs associated with Group management conducted
6
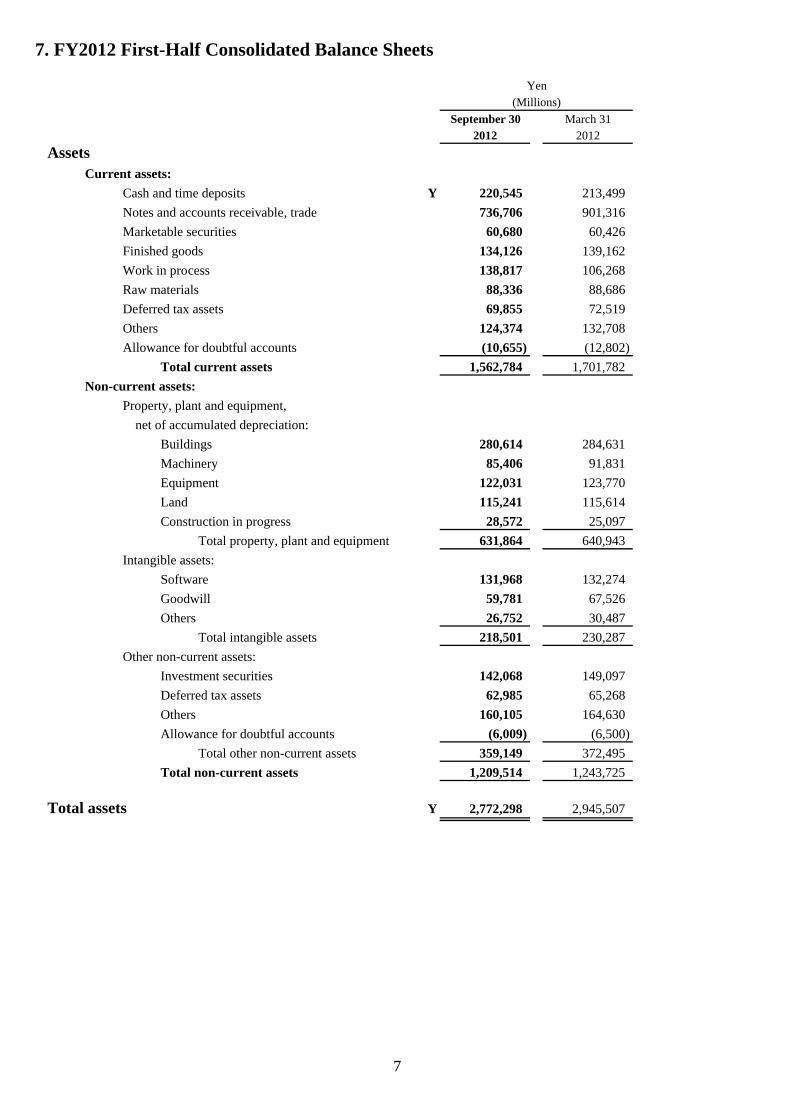
7. FY2012 First-Half Consolidated Balance Sheets
Yen
(Millions)
September 30 March 31 2012 2012
Assets Current assets:
Cash and time deposits Y
Notes and accounts receivable, trade
Marketable securities
Finished goods
Work in process
Raw materials
Deferred tax assets
Others
Allowance for doubtful accounts
220,545 213,499
736,706 901,316
60,680 60,426
134,126 139,162
138,817 106,268
88,336 88,686
69,855 72,519
124,374 132,708
(10,655) (12,802)
Total current assets 1,562,784 1,701,782
Non-current assets:
Property, plant and equipment,
net of accumulated depreciation:
Buildings 280,614 284,631
Machinery 85,406 91,831
Equipment 122,031 123,770
Land 115,241 115,614
Construction in progress 28,572 25,097
Total property, plant and equipment 631,864 640,943
Intangible assets:
Software 131,968 132,274
Goodwill 59,781 67,526
Others 26,752 30,487
Total intangible assets 218,501 230,287
Other non-current assets:
Investment securities 142,068 149,097
Deferred tax assets 62,985 65,268
Others 160,105 164,630
Allowance for doubtful accounts (6,009) (6,500)
Total other non-current assets 359,149 372,495
Total non-current assets 1,209,514 1,243,725
Total assets Y 2,772,298 2,945,507
7
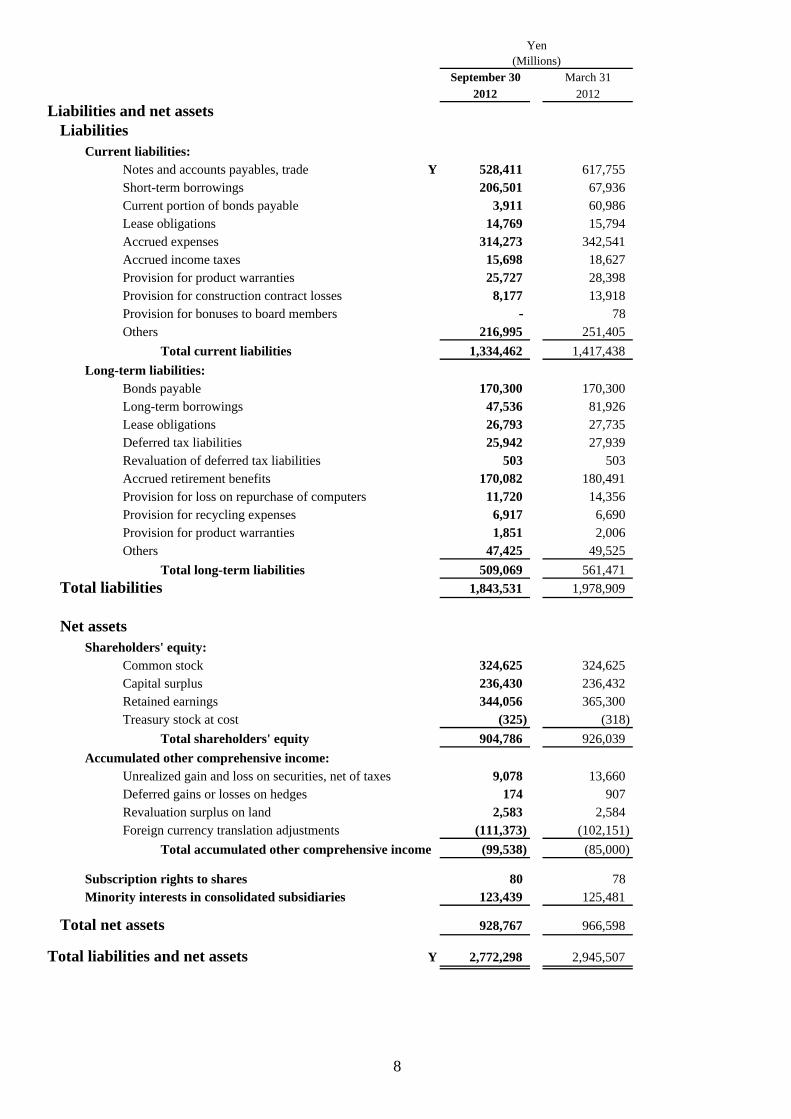
Yen (Millions)
September 30 March 31
2012 2012
Liabilities and net assets Liabilities
Current liabilities: Notes and accounts payables, trade Y 528,411 617,755 Short-term borrowings 206,501 67,936 Current portion of bonds payable 3,911 60,986 Lease obligations 14,769 15,794 Accrued expenses 314,273 342,541 Accrued income taxes 15,698 18,627 Provision for product warranties 25,727 28,398 Provision for construction contract losses 8,177 13,918 Provision for bonuses to board members - 78 Others 216,995 251,405
Total current liabilities 1,334,462 1,417,438
Long-term liabilities: Bonds payable 170,300 170,300 Long-term borrowings 47,536 81,926 Lease obligations 26,793 27,735 Deferred tax liabilities 25,942 27,939 Revaluation of deferred tax liabilities 503 503 Accrued retirement benefits 170,082 180,491 Provision for loss on repurchase of computers 11,720 14,356 Provision for recycling expenses 6,917 6,690 Provision for product warranties 1,851 2,006 Others 47,425 49,525
Total long-term liabilities 509,069 561,471
Total liabilities 1,843,531 1,978,909
Net assets Shareholders' equity:
Common stock 324,625 324,625 Capital surplus 236,430 236,432 Retained earnings 344,056 365,300 Treasury stock at cost (325) (318)
Total shareholders' equity 904,786 926,039
Accumulated other comprehensive income: Unrealized gain and loss on securities, net of taxes 9,078 13,660 Deferred gains or losses on hedges 174 907 Revaluation surplus on land 2,583 2,584 Foreign currency translation adjustments (111,373) (102,151)
Total accumulated other comprehensive income (99,538) (85,000)
Subscription rights to shares 80 78 Minority interests in consolidated subsidiaries 123,439 125,481
Total net assets 928,767 966,598
Total liabilities and net assets Y 2,772,298 2,945,507
8
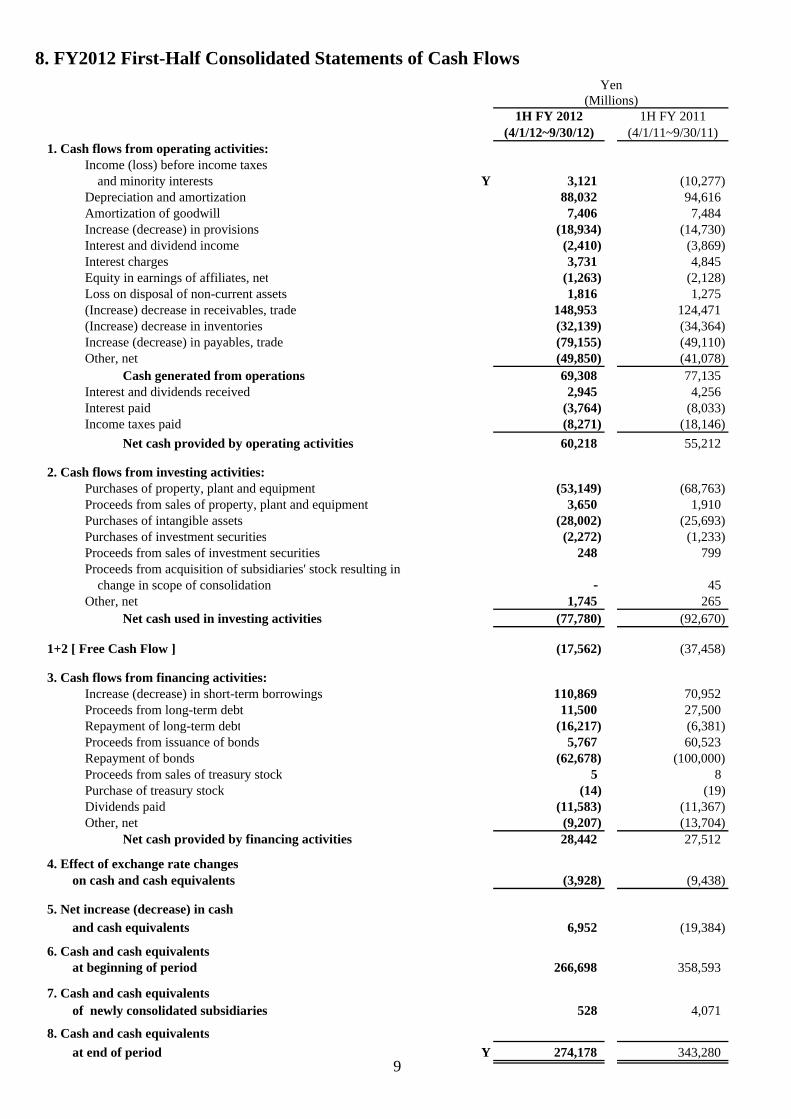
8. FY2012 First-Half Consolidated Statements of Cash Flows Yen
(Millions) 1H FY 2012 1H FY 2011
1. Cash flows from operating activities: Income (loss) before income taxes
and minority interests Depreciation and amortization Amortization of goodwill Increase (decrease) in provisions Interest and dividend income Interest charges Equity in earnings of affiliates, net Loss on disposal of non-current assets (Increase) decrease in receivables, trade (Increase) decrease in inventories Increase (decrease) in payables, trade Other, net
Cash generated from operations Interest and dividends received Interest paid Income taxes paid
Y
(4/1/12~9/30/12)
3,121 88,032
7,406 (18,934)
(2,410) 3,731
(1,263) 1,816
148,953 (32,139) (79,155) (49,850) 69,308
2,945 (3,764) (8,271)
(4/1/11~9/30/11)
(10,277) 94,616
7,484 (14,730)
(3,869) 4,845
(2,128) 1,275
124,471 (34,364) (49,110) (41,078) 77,135
4,256 (8,033)
(18,146)
Net cash provided by operating activities 60,218 55,212
2. Cash flows from investing activities: Purchases of property, plant and equipment Proceeds from sales of property, plant and equipment Purchases of intangible assets Purchases of investment securities Proceeds from sales of investment securities
(53,149) 3,650
(28,002) (2,272)
248
(68,763) 1,910
(25,693) (1,233)
799 Proceeds from acquisition of subsidiaries' stock resulting in
change in scope of consolidationOther, net
-1,745
45 265
Net cash used in investing activities (77,780) (92,670)
1+2 [ Free Cash Flow ] (17,562) (37,458)
3. Cash flows from financing activities: Increase (decrease) in short-term borrowings Proceeds from long-term debt Repayment of long-term debt Proceeds from issuance of bonds Repayment of bonds Proceeds from sales of treasury stock Purchase of treasury stock Dividends paid Other, net
Net cash provided by financing activities
110,869 11,500
(16,217) 5,767
(62,678) 5
(14) (11,583)
(9,207) 28,442
70,952 27,500 (6,381) 60,523
(100,000) 8
(19) (11,367) (13,704) 27,512
4. Effect of exchange rate changes on cash and cash equivalents (3,928) (9,438)
5. Net increase (decrease) in cash
and cash equivalents 6,952 (19,384)
6. Cash and cash equivalents at beginning of period 266,698 358,593
7. Cash and cash equivalents of newly consolidated subsidiaries 528 4,071
8. Cash and cash equivalents
at end of period 9
Y 274,178 343,280
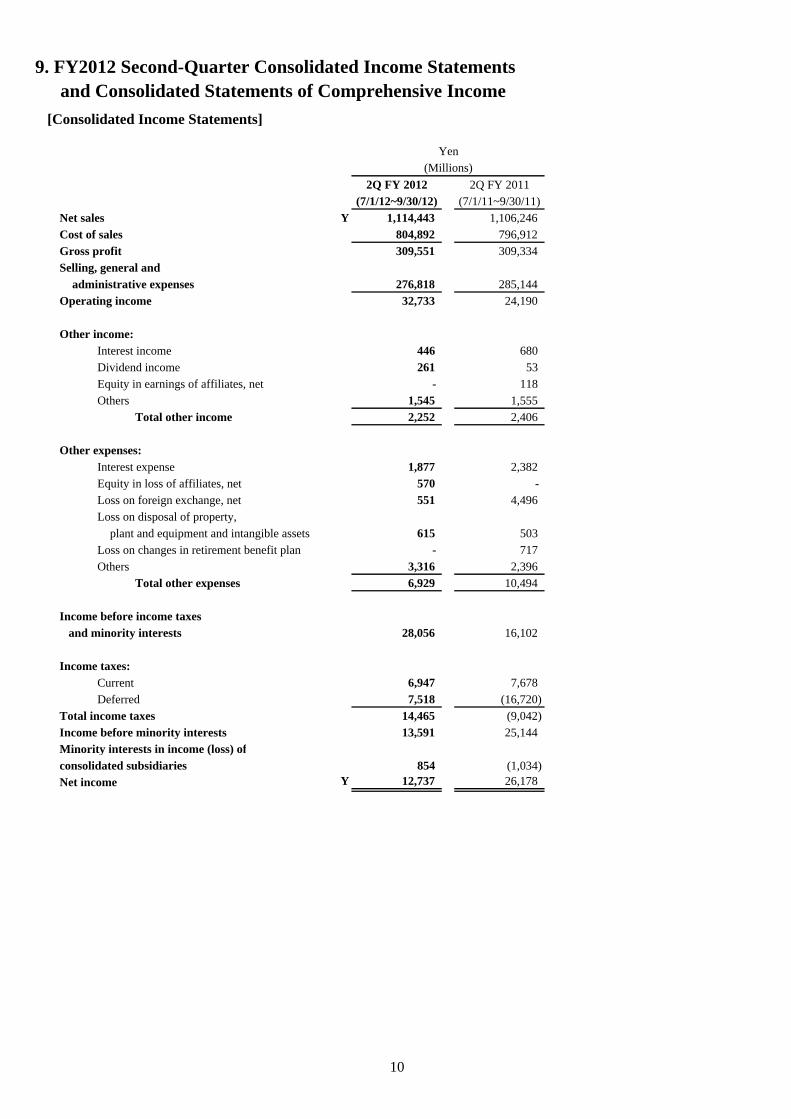
9. FY2012 Second-Quarter Consolidated Income Statements and Consolidated Statements of Comprehensive Income
[Consolidated Income Statements]
Yen
(Millions)
2Q FY 2012 2Q FY 2011
(7/1/12~9/30/12) (7/1/11~9/30/11)
Net sales Y 1,114,443 1,106,246
Cost of sales 804,892 796,912
Gross profit 309,551 309,334
Selling, general and
administrative expenses 276,818 285,144
Operating income 32,733 24,190
Other income:
Interest income 446 680
Dividend income 261 53
Equity in earnings of affiliates, net - 118
Others 1,545 1,555
Total other income 2,252 2,406
Other expenses:
Interest expense 1,877 2,382
Equity in loss of affiliates, net 570 -
Loss on foreign exchange, net 551 4,496
Loss on disposal of property,
plant and equipment and intangible assets 615 503
Loss on changes in retirement benefit plan - 717
Others 3,316 2,396
Total other expenses 6,929 10,494
Income before income taxes
and minority interests 28,056 16,102
Income taxes:
Current 6,947 7,678
Deferred 7,518 (16,720)
Total income taxes 14,465 (9,042)
Income before minority interests 13,591 25,144 Minority interests in income (loss) of
consolidated subsidiaries 854 (1,034)
Net income Y 12,737 26,178
10

[Consolidated Statements of Comprehensive Income]
Yen (Millions)
2Q FY 2012 2Q FY 2011 (7/1/12~9/30/12) (7/1/11~9/30/11)
Income before minority interests Y 13,591 25,144 Other comprehensive income:
Unrealized gain and loss on securities, net of taxes (1,330) (4,288) Deferred gains or losses on hedges 3 2 Foreign currency translation adjustments 769 (15,520) Share of other comprehensive income of associates
accounted for using equity method (463) (1,824) Total other comprehensive income (1,021) (21,630)
Comprehensive income: 12,570 3,514 Attributable to: Owners of the parent 11,812 5,643 Minority interests Y 758 (2,129)
11

10. FY2012 Second-Quarter Consolidated Business Segment Information
a. Net Sales* and Operating Income
2Q FY2012Yen
vs(Billions)
2Q FY2011
2Q FY 2012 1Q FY 2012 Change Constant currency
(7/1/12~9/30/12) (4/1/12~6/30/12) (%) (%)**
Technology Solutions Sales: Japan Y 478.2 402.2 +1.3 1 Outside Japan 235.1 224.8 -7.6 -5 Total 713.3 627.1 -1.8 -1
Operating income:Services 32.4 4.9 +16.0 [Operating income margin] [5.6%] [1.0%]System Platforms 13.7 (4.0) -9.5 [Operating income margin] [10.0%] [-3.6%]
Total operating income 46.2 0.8 +7.0 [Operating income margin] [6.5%] [0.1%]
Ubiquitous Solutions Sales: Japan 250.2 175.8 +19.9 20 Outside Japan 64.5 58.7 -9.9 -4 Total 314.7 234.6 +12.3 14
Operating income 12.4 (2.0) +185.3 [Operating income margin] [4.0%] [-0.9%]
Device Solutions Sales: Japan 78.1 72.0 -11.5 -12 Outside Japan 60.1 58.3 +1.5 2 Total 138.3 130.3 -6.3 -6
Operating income (3.3) (3.6) -[Operating income margin] [-2.4%] [-2.8%]
Other/Elimination and Corporate*** Sales (51.9) (34.7) - -Operating income (22.5) (20.2) -
Total Sales: Japan 759.5 618.9 +4.5 4 Outside Japan 354.8 338.3 -6.4 -3 Total 1,114.4 957.3 +0.7 2
Operating income Y 32.7 (25.0) +35.3
[Operating income margin] [2.9%] [-2.6%]
12
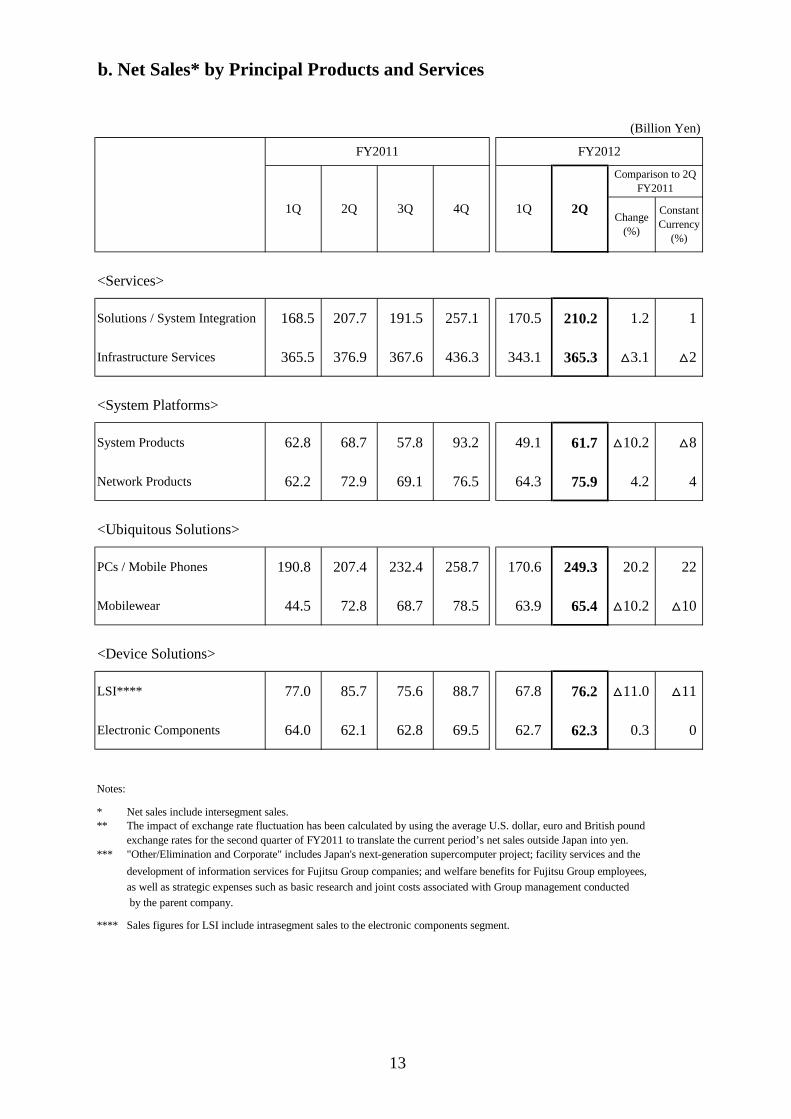
b. Net Sales* by Principal Products and Services
(Billion Yen)
FY2011
1Q 2Q 3Q 4Q
FY2012
1Q 2Q
Comparison to 2Q FY2011
Change (%)
Constant Currency
(%)
<Services>
Solutions / System Integration
Infrastructure Services
168.5
365.5
207.7
376.9
191.5
367.6
257.1
436.3
170.5 210.2 1.2 1
343.1 365.3 ᇞ3.1 ᇞ2
<System Platforms>
System Products
Network Products
62.8
62.2
68.7
72.9
57.8
69.1
93.2
76.5
49.1 61.7 ᇞ10.2 ᇞ8
64.3 75.9 4.2 4
<Ubiquitous Solutions>
PCs / Mobile Phones
Mobilewear
190.8
44.5
207.4
72.8
232.4
68.7
258.7
78.5
170.6 249.3 20.2 22
63.9 65.4 ᇞ10.2 ᇞ10
<Device Solutions>
LSI****
Electronic Components
77.0
64.0
85.7
62.1
75.6
62.8
88.7
69.5
67.8 76.2 ᇞ11.0 ᇞ11
62.7 62.3 0.3 0
Notes:
* Net sales include intersegment sales. ** The impact of exchange rate fluctuation has been calculated by using the average U.S. dollar, euro and British pound
exchange rates for the second quarter of FY2011 to translate the current period’s net sales outside Japan into yen. *** "Other/Elimination and Corporate" includes Japan's next-generation supercomputer project; facility services and the
development of information services for Fujitsu Group companies; and welfare benefits for Fujitsu Group employees,
as well as strategic expenses such as basic research and joint costs associated with Group management conducted
by the parent company.
**** Sales figures for LSI include intrasegment sales to the electronic components segment.
13
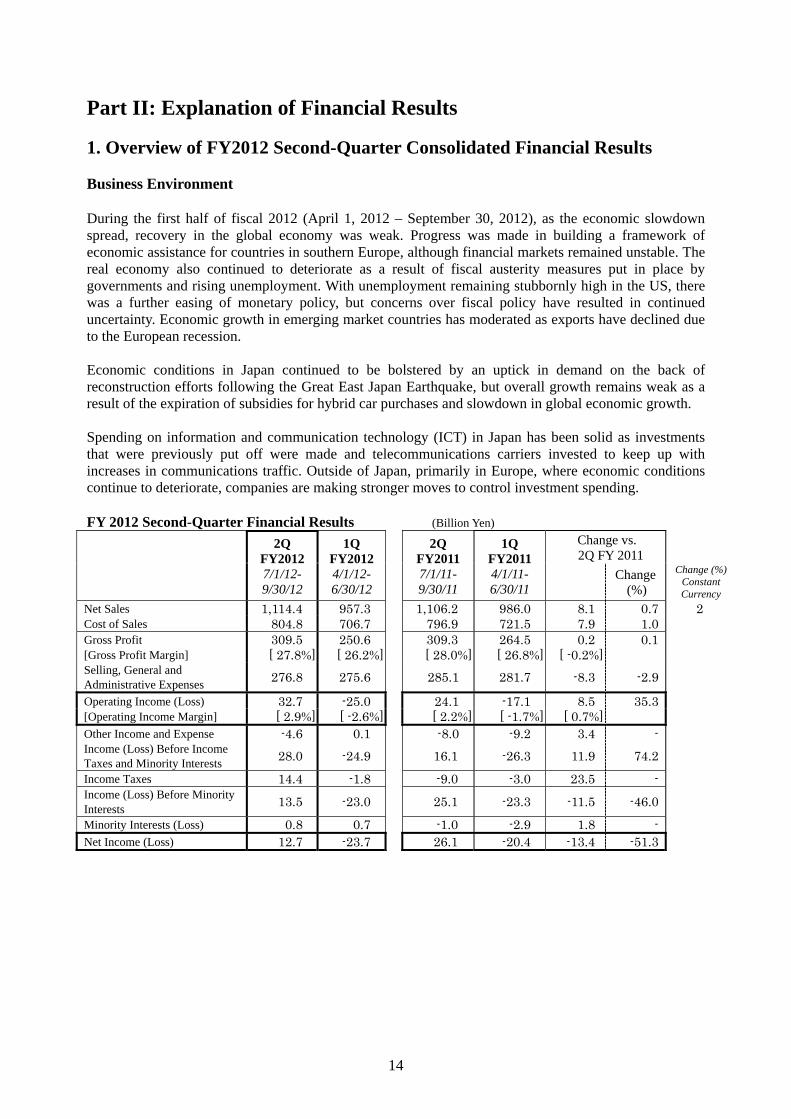
Part II: Explanation of Financial Results
1. Overview of FY2012 Second-Quarter Consolidated Financial Results
Business Environment
During the first half of fiscal 2012 (April 1, 2012 – September 30, 2012), as the economic slowdown spread, recovery in the global economy was weak. Progress was made in building a framework of economic assistance for countries in southern Europe, although financial markets remained unstable. The real economy also continued to deteriorate as a result of fiscal austerity measures put in place by governments and rising unemployment. With unemployment remaining stubbornly high in the US, there was a further easing of monetary policy, but concerns over fiscal policy have resulted in continued uncertainty. Economic growth in emerging market countries has moderated as exports have declined due to the European recession.
Economic conditions in Japan continued to be bolstered by an uptick in demand on the back of reconstruction efforts following the Great East Japan Earthquake, but overall growth remains weak as a result of the expiration of subsidies for hybrid car purchases and slowdown in global economic growth.
Spending on information and communication technology (ICT) in Japan has been solid as investments that were previously put off were made and telecommunications carriers invested to keep up with increases in communications traffic. Outside of Japan, primarily in Europe, where economic conditions continue to deteriorate, companies are making stronger moves to control investment spending.
FY 2012 Second-Quarter Financial Results (Billion Yen)
Change (%) Constant Currency
2
2Q FY2012 7/1/12-9/30/12
1Q FY2012 4/1/12-6/30/12
Net Sales Cost of Sales
1,114.4804.8
957.3 706.7
Gross Profit [Gross Profit Margin] Selling, General and Administrative Expenses
309.5 [ 27.8%]
276.8
250.6 [ 26.2%]
275.6
Operating Income (Loss) [Operating Income Margin]
32.7 [ 2.9%]
-25.0 [ -2.6%]
Other Income and Expense Income (Loss) Before Income Taxes and Minority Interests
-4.6
28.0
0.1
-24.9
Income Taxes 14.4 -1.8 Income (Loss) Before Minority Interests
13.5 -23.0
Minority Interests (Loss) 0.8 0.7 Net Income (Loss) 12.7 -23.7
Change vs. 2Q 1Q 2Q FY 2011 FY2011 FY2011
7/1/11- 4/1/11- Change 9/30/11 6/30/11 (%)
1,106.2 986.0 8.1 0.7 796.9 721.5 7.9 1.0 309.3 264.5 0.2 0.1 [ 28.0%] [ 26.8%] [ -0.2%]
285.1 281.7 -8.3 -2.9
24.1 -17.1 8.5 35.3 [ 2.2%] [ -1.7%] [ 0.7%] -8.0 -9.2 3.4 -
16.1 -26.3 11.9 74.2
-9.0 -3.0 23.5 -
25.1 -23.3 -11.5 -46.0
-1.0 -2.9 1.8 -26.1 -20.4 -13.4 -51.3
14
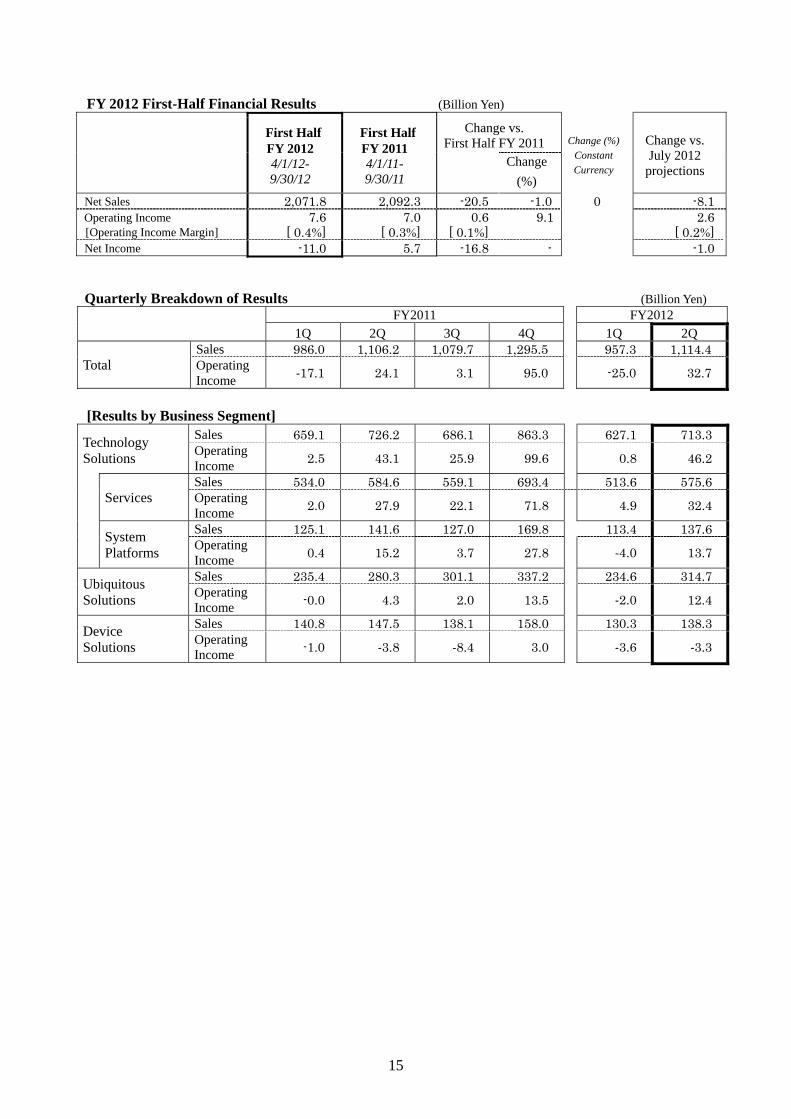
FY 2012 First-Half Financial Results (Billion Yen)
Net Sales Operating Income [Operating Income Margin] Net Income
First Half FY 2012 4/1/12-9/30/12
2,071.8 7.6
[ 0.4%] -11.0
Quarterly Breakdown of Results
[Results by Business Segment]
First Half FY 2011 4/1/11-9/30/11
2,092.3 7.0
[ 0.3%] 5.7
Change vs. First Half FY 2011
-20.5 0.6
[ 0.1%] -16.8
Change (%) Change vs. Constant July 2012 Change Currency projections
(%)
-1.0 0 -8.1 9.1 2.6
[ 0.2%] - -1.0
(Billion Yen) FY2011
1Q 2Q 3Q 4Q
Total Sales Operating Income
986.0
‐17.1
1,106.2
24.1
1,079.7
3.1
1,295.5
95.0
FY2012 1Q 2Q 957.3
-25.0
1,114.4
32.7
Technology Solutions
Sales Operating Income
659.1
2.5
726.2
43.1
686.1
25.9
863.3
99.6
Sales 534.0 584.6 559.1 693.4 Services Operating
Income 2.0 27.9 22.1 71.8
System Platforms
Sales Operating Income
125.1
0.4
141.6
15.2
127.0
3.7
169.8
27.8
Ubiquitous Solutions
Sales Operating Income
235.4
-0.0
280.3
4.3
301.1
2.0
337.2
13.5
Device Solutions
Sales Operating Income
140.8
-1.0
147.5
‐3.8
138.1
‐8.4
158.0
3.0
627.1 713.3
0.8 46.2
513.6 575.6
4.9 32.4
113.4 137.6
‐4.0 13.7
234.6 314.7
‐2.0 12.4
130.3 138.3
‐3.6 ‐3.3
15
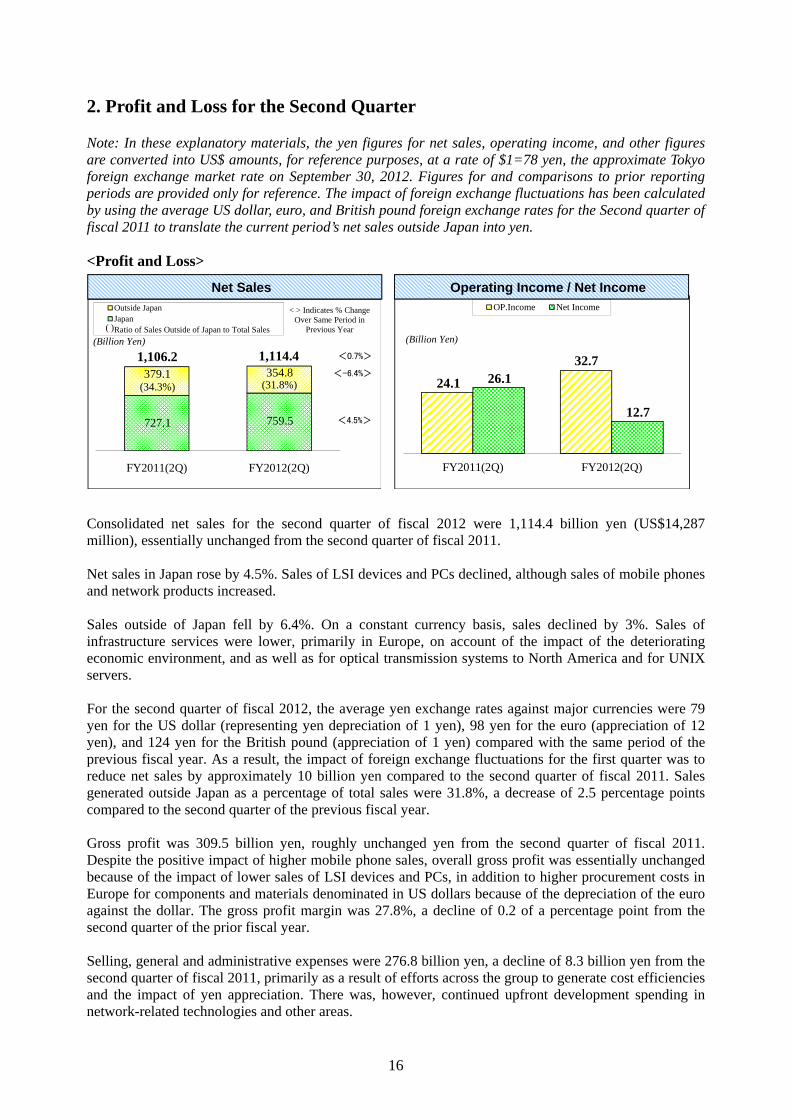
2. Profit and Loss for the Second Quarter
Note: In these explanatory materials, the yen figures for net sales, operating income, and other figures are converted into US$ amounts, for reference purposes, at a rate of $1=78 yen, the approximate Tokyo foreign exchange market rate on September 30, 2012. Figures for and comparisons to prior reporting periods are provided only for reference. The impact of foreign exchange fluctuations has been calculated by using the average US dollar, euro, and British pound foreign exchange rates for the Second quarter of fiscal 2011 to translate the current period’s net sales outside Japan into yen.
<Profit and Loss>
24.1
32.7 26.1
12.7
FY2011(2Q) FY2012(2Q)
OP.Income Net Income
(Billion Yen)
727.1 759.5
379.1 354.8 (34.3%) (31.8%)
FY2011(2Q) FY2012(2Q)
Outside Japan Japan Ratio of Sales Outside of Japan to Total Sales
(Billion Yen)
1,106.2 1,114.4
( )
<0.7%>
<-6.4 %>
<4.5%>
< > Indicates % Change Over Same Period in
Previous Year
Net Sales Operating Income / Net Income
Consolidated net sales for the second quarter of fiscal 2012 were 1,114.4 billion yen (US$14,287 million), essentially unchanged from the second quarter of fiscal 2011.
Net sales in Japan rose by 4.5%. Sales of LSI devices and PCs declined, although sales of mobile phones and network products increased.
Sales outside of Japan fell by 6.4%. On a constant currency basis, sales declined by 3%. Sales of infrastructure services were lower, primarily in Europe, on account of the impact of the deteriorating economic environment, and as well as for optical transmission systems to North America and for UNIX servers.
For the second quarter of fiscal 2012, the average yen exchange rates against major currencies were 79 yen for the US dollar (representing yen depreciation of 1 yen), 98 yen for the euro (appreciation of 12 yen), and 124 yen for the British pound (appreciation of 1 yen) compared with the same period of the previous fiscal year. As a result, the impact of foreign exchange fluctuations for the first quarter was to reduce net sales by approximately 10 billion yen compared to the second quarter of fiscal 2011. Sales generated outside Japan as a percentage of total sales were 31.8%, a decrease of 2.5 percentage points compared to the second quarter of the previous fiscal year.
Gross profit was 309.5 billion yen, roughly unchanged yen from the second quarter of fiscal 2011. Despite the positive impact of higher mobile phone sales, overall gross profit was essentially unchanged because of the impact of lower sales of LSI devices and PCs, in addition to higher procurement costs in Europe for components and materials denominated in US dollars because of the depreciation of the euro against the dollar. The gross profit margin was 27.8%, a decline of 0.2 of a percentage point from the second quarter of the prior fiscal year.
Selling, general and administrative expenses were 276.8 billion yen, a decline of 8.3 billion yen from the second quarter of fiscal 2011, primarily as a result of efforts across the group to generate cost efficiencies and the impact of yen appreciation. There was, however, continued upfront development spending in network-related technologies and other areas.
16

As a result of the above factors, Fujitsu recorded operating income of 32.7 billion yen (US$419 million), an increase of 8.5 billion yen from the previous fiscal year’s second quarter.
In other income and expenses, Fujitsu recorded a loss of 4.6 billion yen, representing an improvement of 3.4 billion yen, primarily on lower foreign exchange losses.
Fujitsu reported consolidated net income of 12.7 billion yen (US$163 million), a decline of 13.4 billion yen from the second quarter of fiscal 2011. Although income before income taxes and minority interests increased, net income declined because, in the second quarter of fiscal 2011, the decision to liquidate a subsidiary in Europe and a stock transfer executed in line with group reorganization that had the effect of lowering tax expenses.
17
System Platforms Services
System Platforms Services
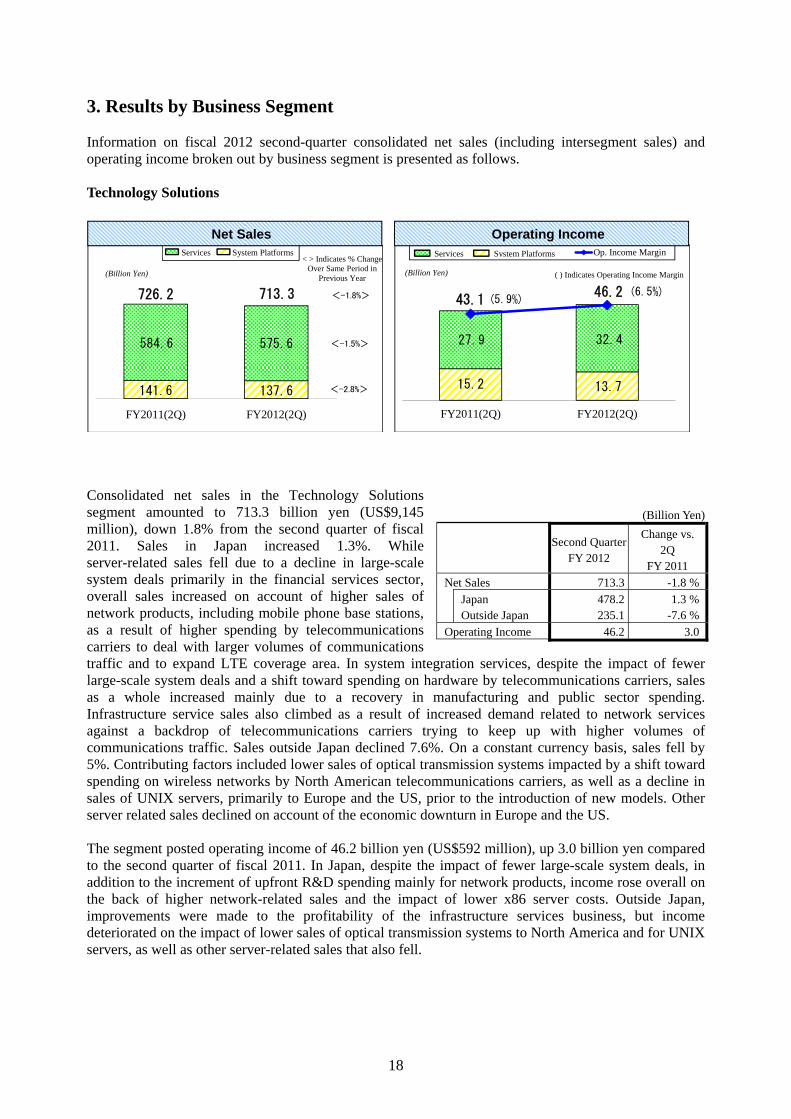
3. Results by Business Segment
Information on fiscal 2012 second-quarter consolidated net sales (including intersegment sales) and operating income broken out by business segment is presented as follows.
Technology Solutions
15.2 13.7
27.9 32.4
(5.9%) (6.5%)
FY2011(2Q) FY2012(2Q)
Op. Income Margin
( ) Indicates Operating Income Margin (Billion Yen)
43.1 46.2
141.6 137.6
584.6 575.6
FY2011(2Q) FY2012(2Q)
(Billion Yen)
< > Indicates % Change Over Same Period in
Previous Year
726.2 713.3
<-1.5%>
<-1.8%>
<-2 .8%>
Services System Platforms Services System Platforms
Net Sales Operating Income
Consolidated net sales in the Technology Solutions segment amounted to 713.3 billion yen (US$9,145 (Billion Yen) million), down 1.8% from the second quarter of fiscal 2011. Sales in Japan increased 1.3%. While server-related sales fell due to a decline in large-scale system deals primarily in the financial services sector, overall sales increased on account of higher sales of network products, including mobile phone base stations, as a result of higher spending by telecommunications carriers to deal with larger volumes of communications traffic and to expand LTE coverage area. In system integration services, despite the impact of fewer large-scale system deals and a shift toward spending on hardware by telecommunications carriers, sales as a whole increased mainly due to a recovery in manufacturing and public sector spending. Infrastructure service sales also climbed as a result of increased demand related to network services against a backdrop of telecommunications carriers trying to keep up with higher volumes of communications traffic. Sales outside Japan declined 7.6%. On a constant currency basis, sales fell by 5%. Contributing factors included lower sales of optical transmission systems impacted by a shift toward spending on wireless networks by North American telecommunications carriers, as well as a decline in sales of UNIX servers, primarily to Europe and the US, prior to the introduction of new models. Other server related sales declined on account of the economic downturn in Europe and the US.
The segment posted operating income of 46.2 billion yen (US$592 million), up 3.0 billion yen compared to the second quarter of fiscal 2011. In Japan, despite the impact of fewer large-scale system deals, in addition to the increment of upfront R&D spending mainly for network products, income rose overall on the back of higher network-related sales and the impact of lower x86 server costs. Outside Japan, improvements were made to the profitability of the infrastructure services business, but income deteriorated on the impact of lower sales of optical transmission systems to North America and for UNIX servers, as well as other server-related sales that also fell.
Change vs.Second Quarter
2QFY 2012
FY 2011
Net Sales 713.3 -1.8 %
Japan 478.2 1.3 % Outside Japan 235.1 -7.6 %
Operating Income 46.2 3.0
18
(a) Services
Net sales in the Services sub-segment were 575.6 billion yen (US$7,379 million), down 1.5% from the same period a year earlier. In Japan, sales increased 1.7%. For system integration services, despite the impact of fewer large-scale system deals primarily in the financial services sector, in addition to a shift toward spending on hardware by telecommunications carriers to deal with higher communications traffic, sales as a whole were higher mainly due to a recovery in spending in the
(Billion Yen)
Second Quarter FY 2012
Change vs. 2Q
FY 2011
Net Sales 575.6 -1.5 %
Japan 376.0 1.7 % Outside Japan 199.5 -7.1 %
Operating Income 32.4 4.4
manufacturing and public sectors. Infrastructure services were impacted by a shift in the ISP business, from packaged products that include connection fees to stand-alone products, although overall sales rose on higher demand related to network services as telecommunications carriers endeavored to keep up with higher volumes of communications traffic. Sales outside Japan declined 7.1%. On a constant currency basis, sales declined 5%. The datacenter business in Australia and North America is growing steadily, although sales were hit by constrained corporate investments against the backdrop of the economic downturn in Europe, as well as the impact of fiscal austerity policies put in place by the UK government.
Operating income for the Services sub-segment was 32.4 billion yen (US$415 million), up 4.4 billion yen compared to the second quarter of fiscal 2011. In Japan, income increased due to a rise in sales of network services, despite the impact of fewer large-scale system deals. Outside Japan, earnings improved as a result of the effect of increased sales and cost efficiencies in Australia and North America.
(b) System Platforms
Net sales in the System Platforms sub-segment were 137.6 billion yen (US$1,764 million), a decrease of 2.8%
(Billion Yen) from the second quarter of fiscal 2011. Sales in Japan were essentially unchanged. Server-related sales fell due to a decline in large-scale system deals, particularly in the financial services industry. Sales of network products, including mobile phone base stations, climbed on account of increased investments to deal with higher network traffic and to expand the LTE coverage area. Sales outside Japan declined 10.1%. On a constant currency basis, sales decreased by 7%. Sales of optical communications systems declined due to a shift toward spending on wireless networks by North American telecommunications carriers. Sales of UNIX servers primarily to Europe and the US also fell in advance of the introduction of new models.
The System Platforms sub-segment posted operating income of 13.7 billion yen (US$176 million), representing a deterioration of 1.4 billion yen from the same period of the previous year. In Japan, although income from server-related products declined, in addition to higher upfront R&D spending mainly in network products, overall operating income remained essentially unchanged due to the effect of increased sales of network products and cost reductions for x86 servers. Outside Japan, income was adversely impacted by lower sales of optical transmission systems to North America and for UNIX servers.
Change vs.Second Quarter
2QFY 2012
FY 2011
Net Sales 137.6 -2.8 %
Japan 102.1 0.0 % Outside Japan 35.5 -10.1 %
Operating Income 13.7 -1.4
19
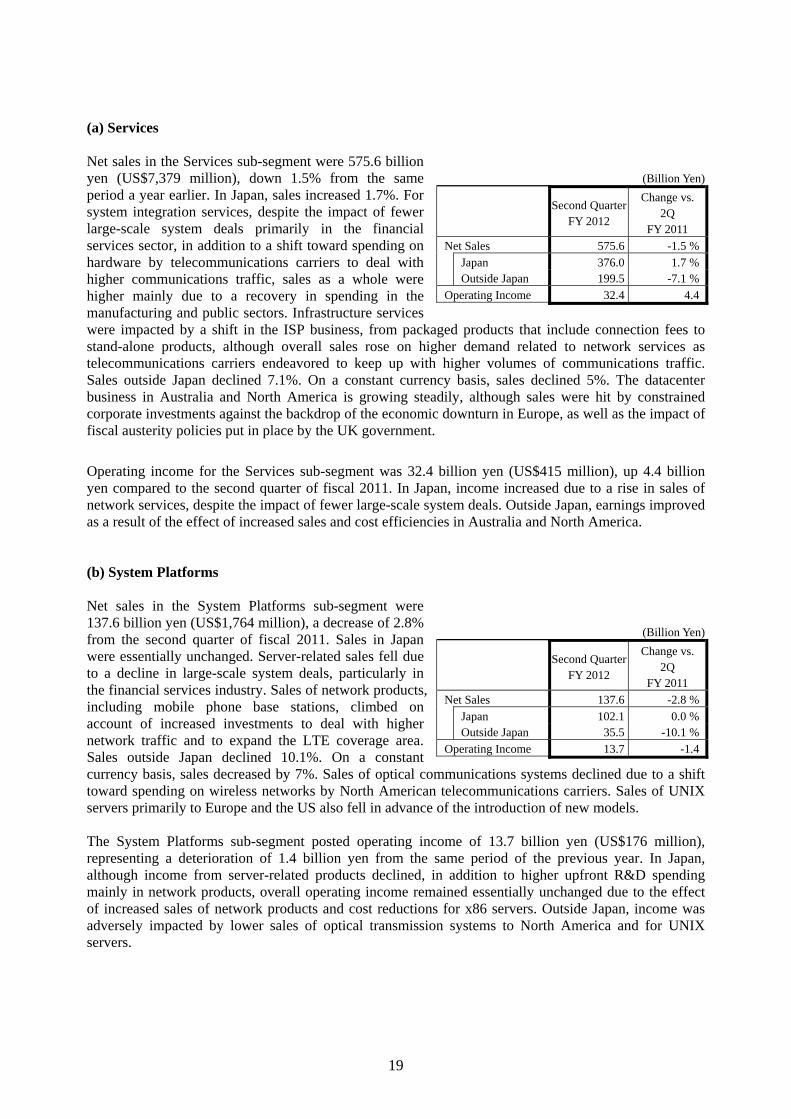
Ubiquitous Solutions
207.4 249.3
72.8 65.4
FY2011(2Q) FY2012(2Q)
PCs/Mobile Phones Mobilewear
(Billion Yen)
280.3 314.7
< -10.2%>
< 12.3%>
< 20.2%>
< > Indicates % Change Over Same Period in Previous
Year
4.3
12.4
(1.6%)
(4.0%)
FY2011(2Q) FY2012(2Q)
Op.Income Op. Income Margin
(Billion Yen) ( ) Indicates Operating Income Margin
Net Sales Operating Income
Net sales in the Ubiquitous Solutions segment were 314.7 billion yen (US$4,035 million), an increase of 12.3% from the second quarter of fiscal 2011. Sales in (Billion Yen)
Japan rose by 19.9%. Overall units of PCs shipped increased on large-volume orders received from corporations, although sales declined on weak consumer demand and lower sales prices. Sales of mobile phones increased as a result of the introduction of many new models such as Raku-Raku (“easy-to-use”) smartphones and an expansion in the market for tablets computer market. Sales of the Mobilewear sub-segment’s car audio and navigation systems declined compared to the higher production of automobiles in the second quarter of fiscal 2011 when automobile production picked up following the Great East Japan Earthquake. Sales outside Japan declined by 9.9%. On a constant currency basis, sales declined by 4%. Although unit sales of PCs increased in EMEA, a fall in market sales prices left net sales essentially unchanged from the same period of the previous fiscal year. Sales of mobilewear devices also declined, primarily in North America.
The Ubiquitous Solutions segment posted operating income of 12.4 billion yen (US$159 million), an increase of 8.0 billion yen from the second quarter of fiscal 2011. Operating income in Japan benefited from higher sales of mobile phones, even though there was a decline in the sales prices of PCs. In addition, the impact of lower sales of mobilewear devices was offset by cost efficiencies and improvements from structural reforms. Outside of Japan, operating income was adversely affected by lower PC sales prices and higher procurement costs in Europe for components and materials denominated in US dollars because of the depreciation of the euro against the dollar. Operating income from mobilewear devices was essentially unchanged.
Change vs.Second Quarter
2QFY 2012
FY 2011
Net Sales 314.7 12.3 %
Japan 250.2 19.9 % Outside Japan 64.5 -9.9 %
Operating Income 12.4 8.0
20
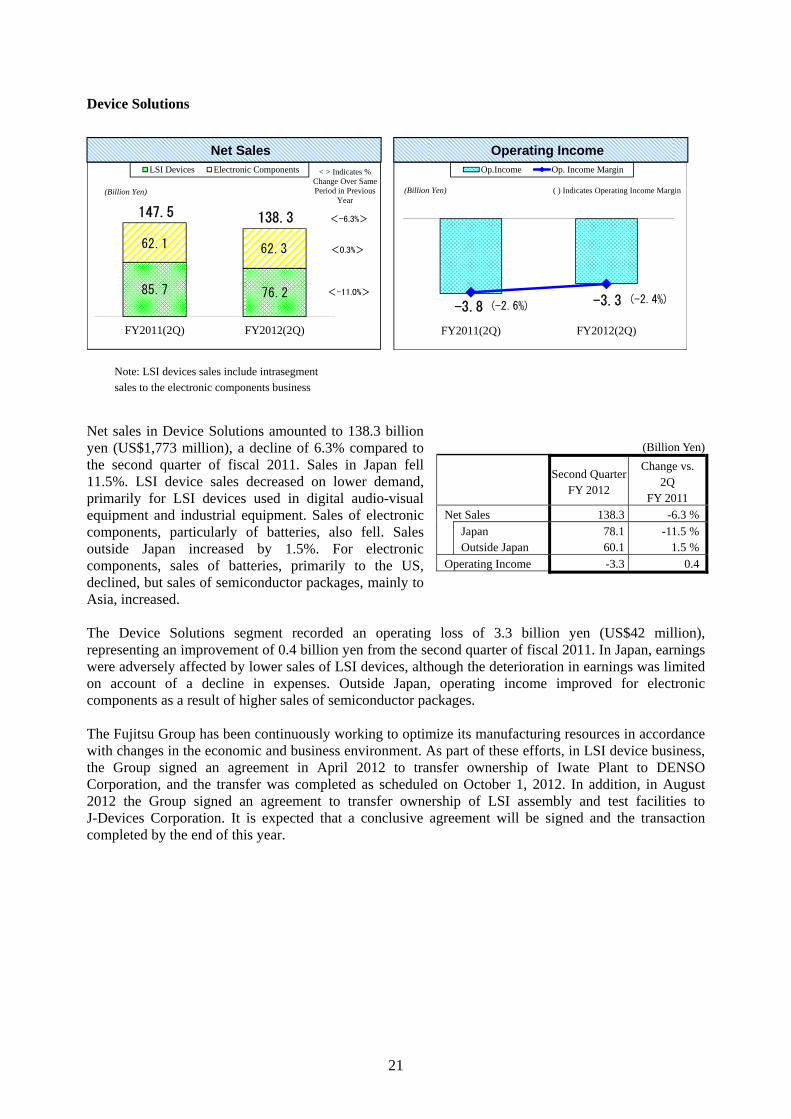
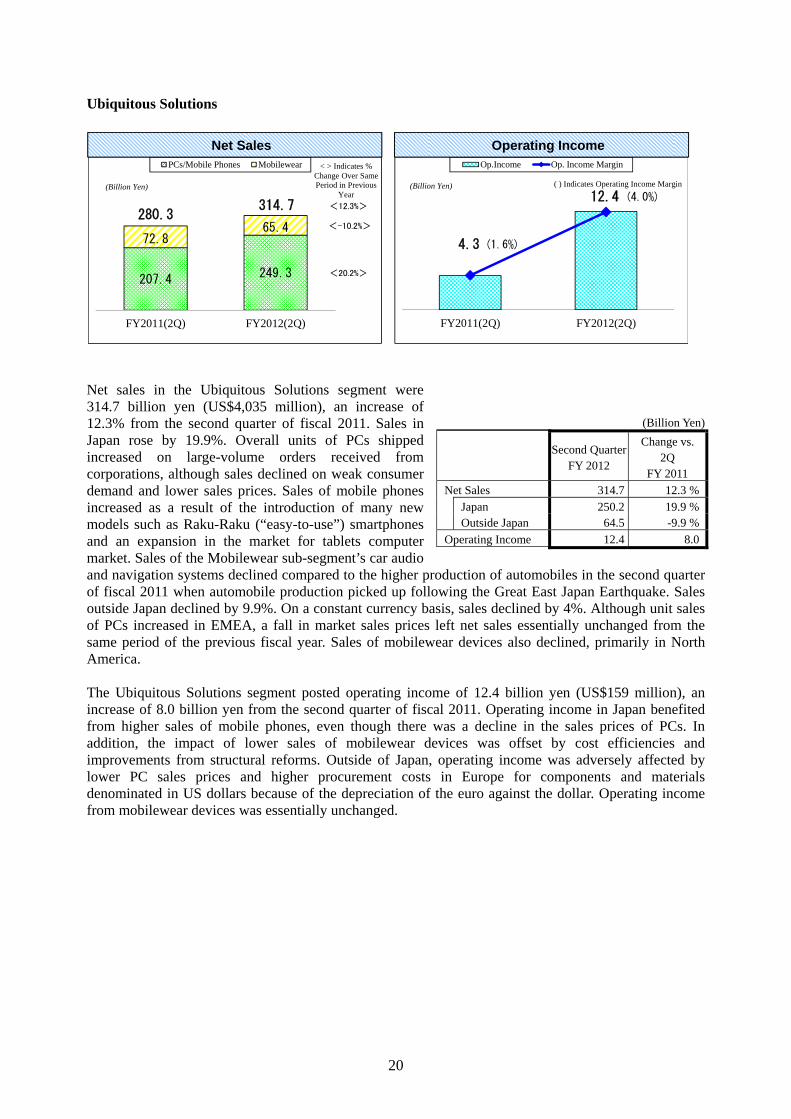
Device Solutions
Note: LSI devices sales include intrasegment
sales to the electronic components business
85.7 76.2
62.1 62.3
FY2011(2Q) FY2012(2Q)
LSI Devices Electronic Components
(Billion Yen)
147.5 138.3
<0 .3%>
<-6 .3%>
< -11.0%>
< > Indicates % Change Over Same Period in Previous
Year
Net Sales
(-2.6%) (-2.4%)
FY2011(2Q) FY2012(2Q)
Op.Income Op. Income Margin
( ) Indicates Operating Income Margin (Billion Yen)
-3.8 -3.3
Operating Income
Net sales in Device Solutions amounted to 138.3 billion yen (US$1,773 million), a decline of 6.3% compared to (Billion Yen)
the second quarter of fiscal 2011. Sales in Japan fell 11.5%. LSI device sales decreased on lower demand, primarily for LSI devices used in digital audio-visual equipment and industrial equipment. Sales of electronic components, particularly of batteries, also fell. Sales outside Japan increased by 1.5%. For electronic components, sales of batteries, primarily to the US, declined, but sales of semiconductor packages, mainly to Asia, increased.
The Device Solutions segment recorded an operating loss of 3.3 billion yen (US$42 million), representing an improvement of 0.4 billion yen from the second quarter of fiscal 2011. In Japan, earnings were adversely affected by lower sales of LSI devices, although the deterioration in earnings was limited on account of a decline in expenses. Outside Japan, operating income improved for electronic components as a result of higher sales of semiconductor packages.
The Fujitsu Group has been continuously working to optimize its manufacturing resources in accordance with changes in the economic and business environment. As part of these efforts, in LSI device business, the Group signed an agreement in April 2012 to transfer ownership of Iwate Plant to DENSO Corporation, and the transfer was completed as scheduled on October 1, 2012. In addition, in August 2012 the Group signed an agreement to transfer ownership of LSI assembly and test facilities to J-Devices Corporation. It is expected that a conclusive agreement will be signed and the transaction completed by the end of this year.
Change vs.Second Quarter
2QFY 2012
FY 2011
Net Sales 138.3 -6.3 %
Japan 78.1 -11.5 % Outside Japan 60.1 1.5 %
Operating Income -3.3 0.4
21

4. Overview of FY2012 First-Half Consolidated Results
Note: In these explanatory materials, the yen figures for net sales, operating income, and other figures are converted into US$ amounts, for reference purposes, at a rate of $1=78 yen, the approximate Tokyo foreign exchange market rate on September 30, 2012. Figures for and comparisons to prior reporting periods are provided only for reference. The impact of foreign exchange fluctuations has been calculated by using the average US dollar, euro, and British pound foreign exchange rates for the first half of fiscal 2011 to translate the current period’s net sales outside Japan into yen.
<Profit and Loss>
7.0 7.65.7
-11.0 FY2011(1H) FY2012(1H)
OP.Income Net Income
(Billion Yen)
Operating Income
1,346.8 1,378.5
745.5 693.2 (35.6%) (33.5%)
FY2011(1H) FY2012(1H)
Outside Japan Japan Ratio of Sales Outside of Japan to Total Sales
(Billion Yen)
2,092.3 2,071.8
( )
<-1.0%>
<-7.0%>
<2.4%>
< > Indicates % Change Over Same Period in
Previous Year
Net Sales
Consolidated net sales for the first half of fiscal 2012 amounted to 2,071.8 billion yen (US$26,562 million), essentially unchanged from the first half of fiscal 2011.
Net sales in Japan rose by 2.4%. Sales revenues stemming from the next-generation supercomputer system, for which deliveries peaked in fiscal 2011, declined, and sales of LSI devices were adversely affected by weak demand. Sales of mobile phones, however, increased, primarily in the second quarter, as did sales of network products also increased.
Sales outside of Japan fell by 7.0%. On a constant currency basis, sales declined by 3%. Sales of infrastructure services were lower, primarily in Europe, on account of the deteriorating economic environment, and sales of optical transmission systems to North America and for UNIX servers decreased.
For the first half of fiscal 2012, the average yen exchange rates against major currencies were 79 yen for the US dollar (representing yen appreciation of 1 yen), 101 yen for the euro (appreciation of 13 yen), and 126 yen for the British pound (appreciation of 3 yen) compared with the same period of the previous fiscal year. As a result, the impact of foreign exchange fluctuations for the first half was to reduce net sales by approximately 30.0 billion yen compared to the first half of fiscal 2011. Sales generated outside Japan as a percentage of total sales were 33.5%, a decrease of 2.1 percentage points compared to the first half of the previous fiscal year.
Gross profit was 560.1 billion yen, a decline of 13.7 billion yen from the first half of fiscal 2011. The decline was the result of the impact of lower sales of LSI devices and optical transmission systems, in addition to higher procurement costs in Europe for components and materials denominated in US dollars on depreciation of the euro against the dollar. The gross profit margin was 27.0%, a decrease of 0.4 of a percentage point from the first half of the previous fiscal year.
Selling, general and administrative expenses were 552.4 billion yen, a decline of 14.3 billion yen from the first half of fiscal 2011, primarily as a result of group-wide efforts to generate cost efficiencies and
22

the impact of yen appreciation. There was, however, continued upfront development spending in network-related technologies and other areas.
As a result of the above factors, Fujitsu recorded operating income of 7.6 billion yen (US$97 million), an increase of 0.6 billion yen from the previous fiscal year’s first half.
Income before income taxes and minority interests was 3.1 billion yen, representing an improvement of 13.3 billion yen. The main reason for the improvement was in the first half of the previous fiscal year, a loss on disaster of 7.5 billion yen was recorded as a result of the impact of the earthquake. Exchange losses were also lower.
Fujitsu reported a consolidated net loss of 11.0 billion yen (US$141 million), representing a deterioration of 16.8 billion yen from the first half of fiscal 2011. Although income before income taxes and minority interests increased, there was deterioration in net income because, in the first half of fiscal 2011, the decision to liquidate a subsidiary in Europe and a stock transfer executed in line with group reorganization had the effect of lowering tax expenses.
Comparison to Consolidated Earnings Projections Announced in July 2012
Net sales and operating income amounted to 2,071.8 billion yen and operating income were 7.6 billion yen, respectively, essentially unchanged from projections announced on July 27, 2012. Service business in Japan was steady due to a mild recovery to ICT investments. Mobile phone sales exceeded projections on account of strong smartphone sales. LSI devices and electronic components were adversely impacted by weak demand. In addition, the services business in Europe were affected by the economic downturn, and PC sales inside and outside Japan fell short of projections due to decline in sales prices.
A net loss of 11.0 billion yen was recorded
(Billion Yen)
First Half FY2011
July 2012 Projections
First Half FY2012
Change vs. July 2012 Projections
Change (%)
Net Sales 2,092.3 2,080.0 2,071.8 -8.1 -0.4
Operating Income [Operating Income Margin] [
7.0 0.3%] [
5.0 0.2%] [
7.6 0.4%] [
2.6 0.2%]
53.8
Net Income 5.7 -10.0 -11.0 -1.0 -
23

Results by Business Segment
Information on fiscal 2012 first-half consolidated net sales (including intersegment sales) and operating income broken out by business segment is presented as follows.
Technology Solutions
Consolidated net sales in the Technology Solutions (Billion Yen) segment amounted to 1,340.4 billion yen (US$17,185
million), down 3.2% from the first half of fiscal 2011. In Japan, sales were essentially unchanged. Server-related sales declined compared to the same period in fiscal 2011, when there was high-volume production of dedicated servers for use in the K computer, a next-generation supercomputer, in addition, there was an adverse impact by a decline in large-scale system deals. Sales of network products including mobile phone base stations increased due to higher spending by telecommunications carriers to deal with larger volumes of communications traffic and to expand LTE coverage. In system integration services, despite the impact of fewer large-scale system deals and a shift toward spending on hardware by telecommunications carriers, sales as a whole grew due to a recovery in spending, primarily in the manufacturing, retailing, and public sectors. Infrastructure service sales were weak. Sales outside Japan declined 9.9%. On a constant currency basis, sales fell by 6%. Contributing factors included lower sales of optical transmission systems due to a shift toward spending on wireless network by North American telecommunications carriers, as well as a decline in sales of UNIX servers, primarily to Europe and the US, prior to the introduction of new models. Other server-related sales declined on account of the economic downturn in Europe and the US.
The segment posted operating income of 47.0 billion yen (US$603 million), up 1.3 billion yen compared to the first half of fiscal 2011. In Japan, despite the impact of lower sales of large-scale system integration and server-related system deals, in addition to higher upfront R&D spending, mainly for network products, income rose overall on the back of higher network-related sales and the impact of cost reductions for x86 servers. Outside Japan, improvements were made to the profitability of the infrastructure services business, although income deteriorated on the impact of lower optical transmission systems to North America and for UNIX servers, and other server-related sales also declined.
Change vs.First Half
1HFY 2012
FY 2011
Net Sales 1,340.4 -3.2 %
Japan 880.4 0.7 % Outside Japan 459.9 -9.9 %
Operating Income 47.0 1.3
24
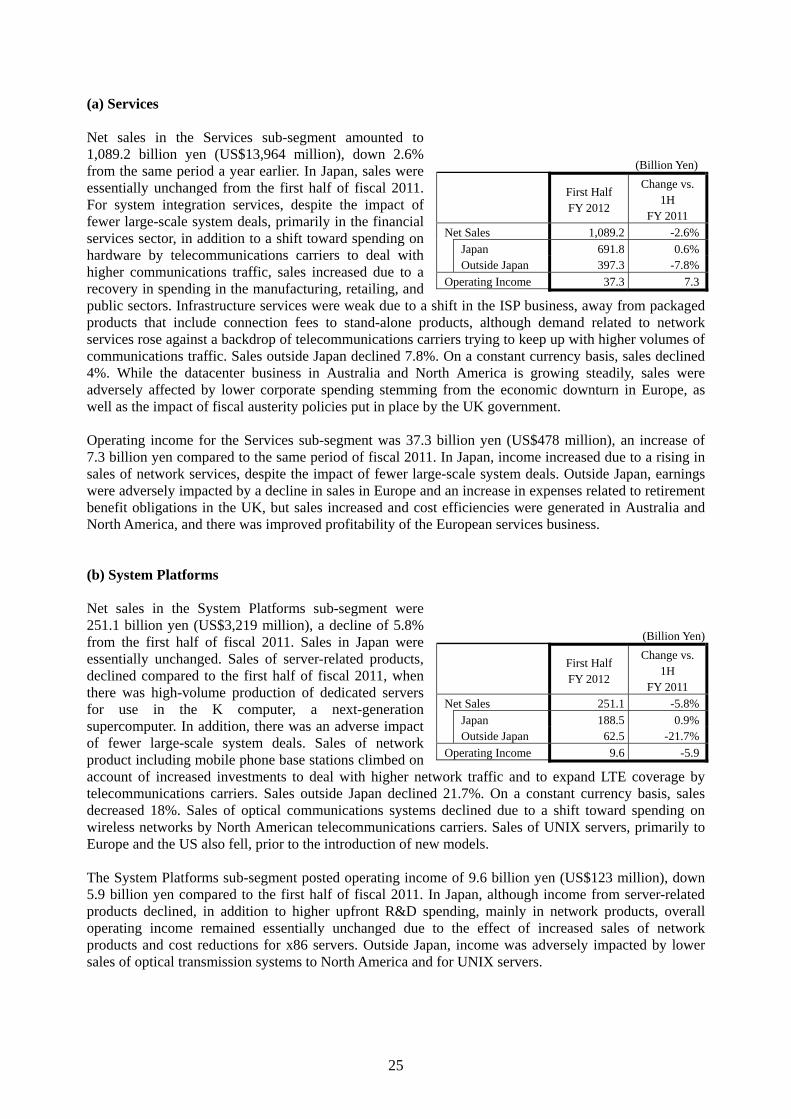
(a) Services
Net sales in the Services sub-segment amounted to 1,089.2 billion yen (US$13,964 million), down 2.6%
(Billion Yen) from the same period a year earlier. In Japan, sales were essentially unchanged from the first half of fiscal 2011. For system integration services, despite the impact of fewer large-scale system deals, primarily in the financial services sector, in addition to a shift toward spending on hardware by telecommunications carriers to deal with higher communications traffic, sales increased due to a recovery in spending in the manufacturing, retailing, and public sectors. Infrastructure services were weak due to a shift in the ISP business, away from packaged products that include connection fees to stand-alone products, although demand related to network services rose against a backdrop of telecommunications carriers trying to keep up with higher volumes of communications traffic. Sales outside Japan declined 7.8%. On a constant currency basis, sales declined 4%. While the datacenter business in Australia and North America is growing steadily, sales were adversely affected by lower corporate spending stemming from the economic downturn in Europe, as well as the impact of fiscal austerity policies put in place by the UK government.
Operating income for the Services sub-segment was 37.3 billion yen (US$478 million), an increase of 7.3 billion yen compared to the same period of fiscal 2011. In Japan, income increased due to a rising in sales of network services, despite the impact of fewer large-scale system deals. Outside Japan, earnings were adversely impacted by a decline in sales in Europe and an increase in expenses related to retirement benefit obligations in the UK, but sales increased and cost efficiencies were generated in Australia and North America, and there was improved profitability of the European services business.
(b) System Platforms
Net sales in the System Platforms sub-segment were 251.1 billion yen (US$3,219 million), a decline of 5.8%
(Billion Yen) from the first half of fiscal 2011. Sales in Japan were essentially unchanged. Sales of server-related products, declined compared to the first half of fiscal 2011, when there was high-volume production of dedicated servers for use in the K computer, a next-generation supercomputer. In addition, there was an adverse impact of fewer large-scale system deals. Sales of network product including mobile phone base stations climbed on account of increased investments to deal with higher network traffic and to expand LTE coverage by telecommunications carriers. Sales outside Japan declined 21.7%. On a constant currency basis, sales decreased 18%. Sales of optical communications systems declined due to a shift toward spending on wireless networks by North American telecommunications carriers. Sales of UNIX servers, primarily to Europe and the US also fell, prior to the introduction of new models.
The System Platforms sub-segment posted operating income of 9.6 billion yen (US$123 million), down 5.9 billion yen compared to the first half of fiscal 2011. In Japan, although income from server-related products declined, in addition to higher upfront R&D spending, mainly in network products, overall operating income remained essentially unchanged due to the effect of increased sales of network products and cost reductions for x86 servers. Outside Japan, income was adversely impacted by lower sales of optical transmission systems to North America and for UNIX servers.
Change vs.First Half
1HFY 2012
FY 2011
Net Sales 1,089.2 -2.6%
Japan 691.8 0.6% Outside Japan 397.3 -7.8%
Operating Income 37.3 7.3
Change vs.First Half
1HFY 2012
FY 2011
Net Sales 251.1 -5.8%
Japan 188.5 0.9% Outside Japan 62.5 -21.7%
Operating Income 9.6 -5.9
25

Ubiquitous Solutions
Net sales in the Ubiquitous Solutions segment were 549.3 billion yen (US$7,042 million), up 6.5% compared
(Billion Yen) to the first half of 2011. Sales in Japan rose by 9.9%. Overall unit shipments of PCs increased because of large-volume orders received from corporations, particularly in the financial services sector, but sales of consumer PCs fell on weak consumer demand and a decline in sales prices. Sales of mobile phones increased as a result of the introduction of many new models such as Raku-Raku (“easy-to-use”) smartphones and an expansion in the market for tablet computers. Sales of the mobilewear sub-segment’s car audio and navigation systems also increased compared to last fiscal year’s first half, when automobile production was suspended due to the Great East Japan Earthquake. Sales outside Japan declined 3.9%. On a constant currency basis, sales rose by 4%. Although unit sales of PCs increased, particularly in Europe, a fall in market prices left sales essentially unchanged from the same period of the previous fiscal year. Sales of mobilewear rose as the result of the suspension of automobile manufacturing outside Japan in the first half of fiscal 2011.
The Ubiquitous Solutions segment posted operating income of 10.4 billion yen (US$133 million), an increase of 6.0 billion yen from the same period of the previous fiscal year. Operating income in Japan benefited from the impact of higher sales of mobile phones and mobilewear, and impact of restructuring for mobilewear, even though there was a decline in the sales prices of PCs. Outside Japan, earnings were adversely affected by lower PC sales prices and higher procurement costs in Europe for components and materials denominated in US dollars because of the depreciation of the euro against the dollar.
Device Solutions
Net sales in Device Solutions amounted to 268.6 billion yen (US$3,444 million), a decline of 6.8% compared to
(Billion Yen) the first half of fiscal 2011. Sales in Japan declined 11.5%. LSI device sales decreased as shipments of CPUs for the next-generation supercomputer system were completed during the first half of fiscal 2011, and sales of LSI devices for use in Fujitsu’s own servers were sluggish. In addition, sales of LSI devices, primarily for digital audio-visual equipment, were adversely impacted by the delayed recovery in market conditions. Sales of electronic components, particularly of batteries, also fell. Sales outside Japan were essentially unchanged from the first half of fiscal 2011. On a constant currency basis, sales rose 1%. LSI device sales declined, mainly to Europe. For electronic components, sales of batteries, particularly to the US, declined, but sales of semiconductor packages, primarily to Asia, increased.
The Device Solutions segment recorded an operating loss of 7.0 billion yen (US$90 million), representing a deterioration of 2.2 billion yen compared to the first half of fiscal 2011. In Japan, earnings were adversely affected by lower sales of LSI devices and a decline in production line capacity utilization rates. Production lines for 300mm wafers maintained high utilization rates, although basic product lines remained at a low level. Outside Japan, electronic components were adversely impacted by yen appreciation, but results benefited from higher sales of semiconductor packages.
Change vs.First Half
1HFY 2012
FY 2011
Net Sales 549.3 6.5%
Japan 426.0 9.9% Outside Japan 123.3 -3.9%
Operating Income 10.4 6.0
Change vs.First Half
1HFY 2012
FY 2011
Net Sales 268.6 -6.8%
Japan 150.1 -11.5% Outside Japan 118.5 -0.3%
Operating Income -7.0 -2.2
26
1,586.5
349.3
126.6
225.4
FY2012(1H)
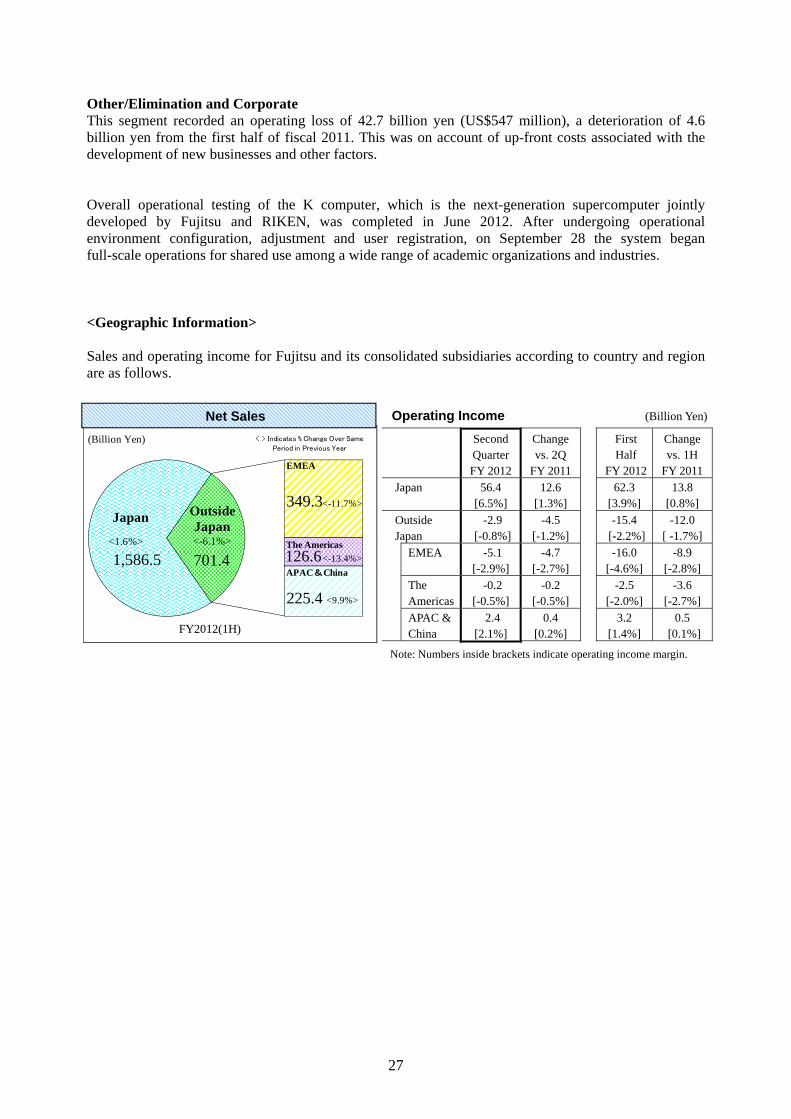
Other/Elimination and Corporate This segment recorded an operating loss of 42.7 billion yen (US$547 million), a deterioration of 4.6 billion yen from the first half of fiscal 2011. This was on account of up-front costs associated with the development of new businesses and other factors.
Overall operational testing of the K computer, which is the next-generation supercomputer jointly developed by Fujitsu and RIKEN, was completed in June 2012. After undergoing operational environment configuration, adjustment and user registration, on September 28 the system began full-scale operations for shared use among a wide range of academic organizations and industries.
<Geographic Information>
Sales and operating income for Fujitsu and its consolidated subsidiaries according to country and region are as follows.
1,586.5
349.3
126.6
225.4
FY2012(1H)
701.4
< > Indicates % Change Over Same Period in Previous Year
(Billion Yen)
EMEA
The Americas
APAC&China
Japan Outside Japan
<-13.4%>
<-11.7%>
<9.9%>
<-6.1%> <1.6%>
Net Sales Operating Income (Billion Yen)
Second Change Quarter vs. 2Q FY 2012 FY 2011
Japan 56.4 12.6 [6.5%] [1.3%]
Outside -2.9 -4.5 Japan [-0.8%] [-1.2%]
EMEA -5.1 -4.7 [-2.9%] [-2.7%]
The -0.2 -0.2 Americas [-0.5%] [-0.5%]
APAC & 2.4 0.4 China [2.1%] [0.2%]
First Change Half vs. 1H
FY 2012 FY 2011
62.3 13.8 [3.9%] [0.8%]
-15.4 -12.0 [-2.2%] [ -1.7%]
-16.0 -8.9 [-4.6%] [-2.8%]
-2.5 -3.6 [-2.0%] [-2.7%]
3.2 0.5 [1.4%] [0.1%]
Note: Numbers inside brackets indicate operating income margin.
27
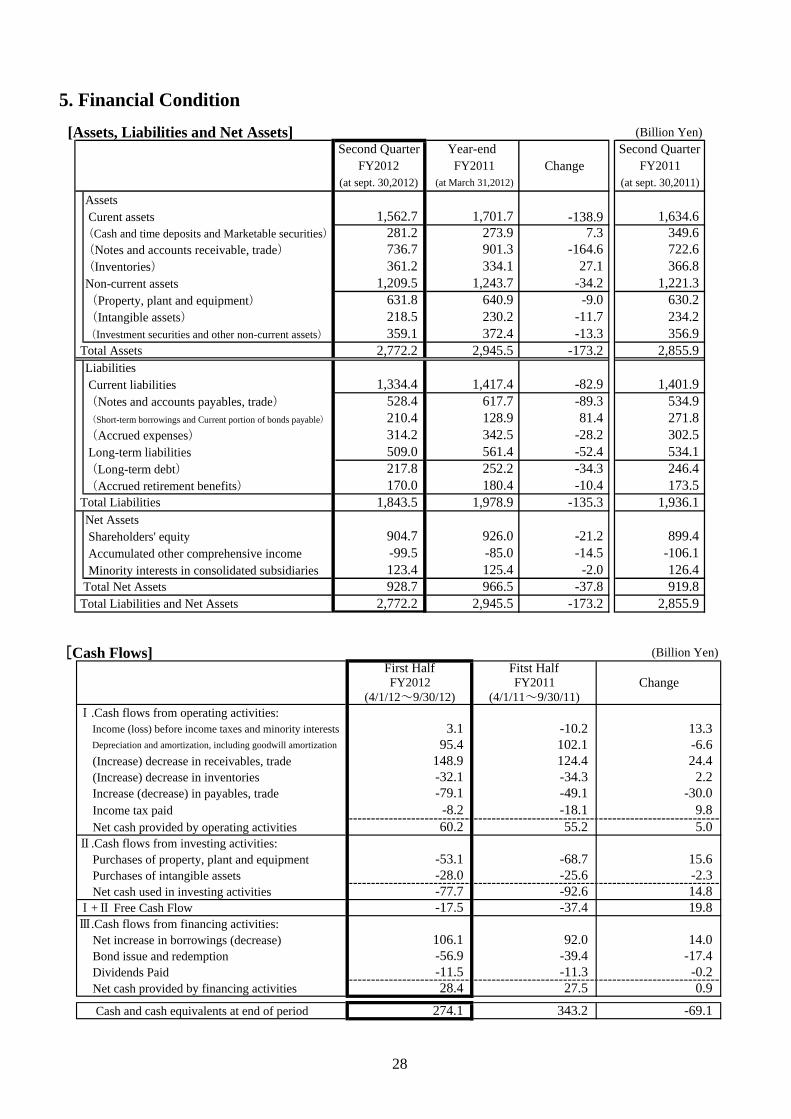
5. Financial Condition
[Assets, Liabilities and Net Assets] (Billion Yen) Second Quarter
FY2012 (at sept. 30,2012)
Year-end FY2011
(at March 31,2012)
Change Second Quarter
FY2011 (at sept. 30,2011)
Assets Curent assets 1,562.7 1,701.7 -138.9 1,634.6(Cash and time deposits and Marketable securities)
(Notes and accounts receivable, trade) (Inventories)
Non-current assets
281.2 736.7 361.2
1,209.5 1,243.7
901.3 334.1
273.9
-34.2
-164.6 27.1
7.3
1,221.3
722.6 366.8
349.6
(Property, plant and equipment)(Intangible assets)(Investment securities and other non-current assets)
631.8 218.5 359.1
230.2 372.4
640.9 -11.7 -13.3
-9.0 234.2 356.9
630.2
Total Assets 2,772.2 2,945.5 -173.2 2,855.9 Liabilities Current liabilities 1,334.4 1,417.4 -82.9 1,401.9 (Notes and accounts payables, trade)(Short-term borrowings and Current portion of bonds payable)
(Accrued expenses) Long-term liabilities
528.4 210.4 314.2 509.0
342.5 561.4
617.7 128.9
-28.2 -52.4
-89.3 81.4
302.5 534.1
534.9 271.8
(Long-term debt)(Accrued retirement benefits)
217.8 170.0
252.2 180.4
-34.3 -10.4
246.4 173.5
Total Liabilities 1,843.5 1,978.9 -135.3 1,936.1 Net Assets Shareholders' equity Accumulated other comprehensive income Minority interests in consolidated subsidiaries
904.7 -99.5 123.4
926.0
125.4 -85.0
-21.2
-2.0 -14.5
899.4
126.4 -106.1
Total Net Assets 928.7 966.5 -37.8 919.8 Total Liabilities and Net Assets 2,772.2 2,945.5 -173.2 2,855.9
(Billion Yen)[Cash Flows]
FY2012 (4/1/12~9/30/12)
First Half Fitst Half FY2011
(4/1/11~9/30/11) Change
Ⅰ.Cash flows from operating activities: Income (loss) before income taxes and minority interests
Depreciation and amortization, including goodwill amortization
(Increase) decrease in receivables, trade (Increase) decrease in inventories Increase (decrease) in payables, trade Income tax paid Net cash provided by operating activities
148.9 -32.1 -79.1
-8.2 60.2
3.1 95.4
-49.1
55.2 -18.1
124.4 -34.3
102.1 -10.2
5.0
-30.0 9.8
24.4 2.2
-6.6 13.3
Ⅱ.Cash flows from investing activities: Purchases of property, plant and equipment Purchases of intangible assets Net cash used in investing activities -77.7
-53.1 -28.0
-92.6
-68.7 -25.6
14.8
15.6 -2.3
Ⅰ+Ⅱ Free Cash Flow -17.5 -37.4 19.8 Ⅲ.Cash flows from financing activities:
Net increase in borrowings (decrease) Bond issue and redemption Dividends Paid Net cash provided by financing activities
-11.5 28.4
106.1 -56.9
27.5 -11.3 -39.4 92.0
0.9 -0.2
-17.4 14.0
Cash and cash equivalents at end of period 274.1 343.2 -69.1
28
Interest Bearing Loans Net Interest Bearing Loans
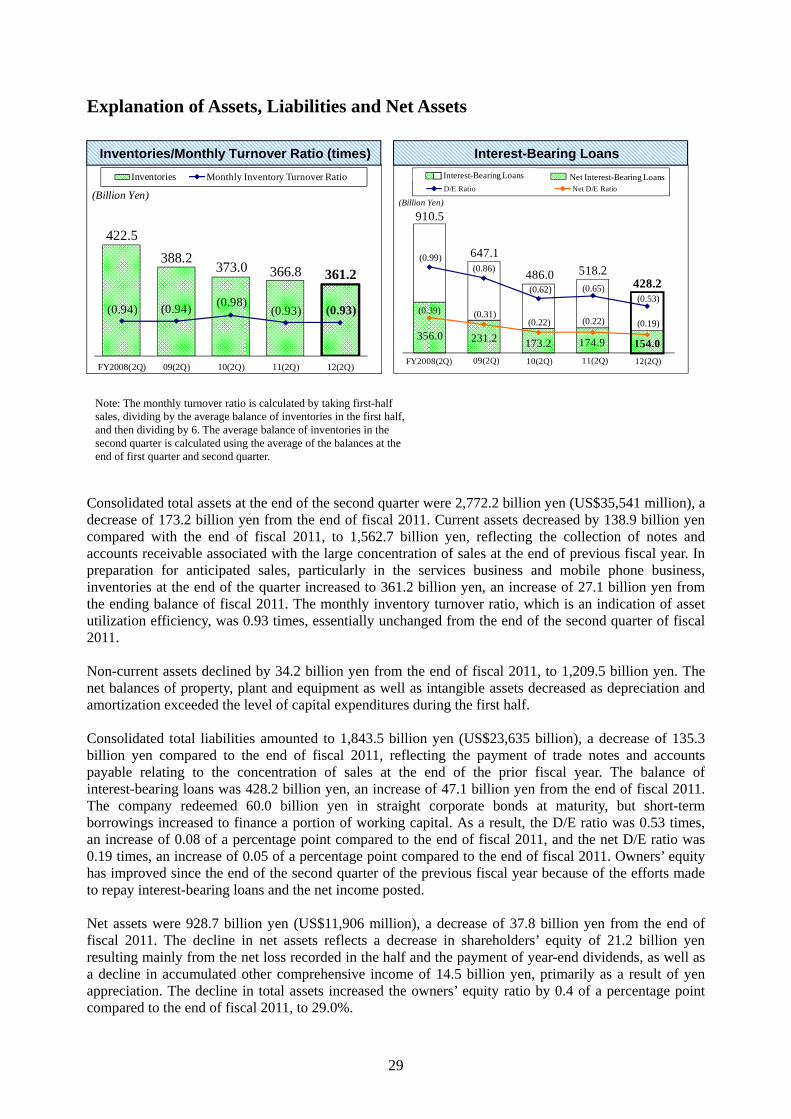
Explanation of Assets, Liabilities and Net Assets
Note: The monthly turnover ratio is calculated by taking first-half sales, dividing by the average balance of inventories in the first half, and then dividing by 6. The average balance of inventories in the second quarter is calculated using the average of the balances at the end of first quarter and second quarter.
422.5
388.2 373.0 366.8 361.2
(0.94) (0.94) (0.98) (0.93) (0.93)
FY2008(2Q) 09(2Q) 10(2Q) 11(2Q) 12(2Q)
Inventories Monthly Inventory Turnover Ratio
(Billion Yen)
Inventories/Monthly Turnover Ratio (times)
356.0 231.2 173.2 174.9 154.0
(0.99) (0.86)
(0.62) (0.65) (0.53)
(0.39) (0.31) (0.22) (0.22) (0.19)
- -
D/E Ratio Net D/E Ratio
(Billion Yen)
910.5
647.1
486.0 518.2 428.2
Interest-Bearing Loans
FY2008(2Q) 09(2Q) 10(2Q) 11(2Q) 12(2Q)
Net Interest-Bearing Loans
Interest-Bearing Loans
Consolidated total assets at the end of the second quarter were 2,772.2 billion yen (US$35,541 million), a decrease of 173.2 billion yen from the end of fiscal 2011. Current assets decreased by 138.9 billion yen compared with the end of fiscal 2011, to 1,562.7 billion yen, reflecting the collection of notes and accounts receivable associated with the large concentration of sales at the end of previous fiscal year. In preparation for anticipated sales, particularly in the services business and mobile phone business, inventories at the end of the quarter increased to 361.2 billion yen, an increase of 27.1 billion yen from the ending balance of fiscal 2011. The monthly inventory turnover ratio, which is an indication of asset utilization efficiency, was 0.93 times, essentially unchanged from the end of the second quarter of fiscal 2011.
Non-current assets declined by 34.2 billion yen from the end of fiscal 2011, to 1,209.5 billion yen. The net balances of property, plant and equipment as well as intangible assets decreased as depreciation and amortization exceeded the level of capital expenditures during the first half.
Consolidated total liabilities amounted to 1,843.5 billion yen (US$23,635 billion), a decrease of 135.3 billion yen compared to the end of fiscal 2011, reflecting the payment of trade notes and accounts payable relating to the concentration of sales at the end of the prior fiscal year. The balance of interest-bearing loans was 428.2 billion yen, an increase of 47.1 billion yen from the end of fiscal 2011. The company redeemed 60.0 billion yen in straight corporate bonds at maturity, but short-term borrowings increased to finance a portion of working capital. As a result, the D/E ratio was 0.53 times, an increase of 0.08 of a percentage point compared to the end of fiscal 2011, and the net D/E ratio was 0.19 times, an increase of 0.05 of a percentage point compared to the end of fiscal 2011. Owners’ equity has improved since the end of the second quarter of the previous fiscal year because of the efforts made to repay interest-bearing loans and the net income posted.
Net assets were 928.7 billion yen (US$11,906 million), a decrease of 37.8 billion yen from the end of fiscal 2011. The decline in net assets reflects a decrease in shareholders’ equity of 21.2 billion yen resulting mainly from the net loss recorded in the half and the payment of year-end dividends, as well as a decline in accumulated other comprehensive income of 14.5 billion yen, primarily as a result of yen appreciation. The decline in total assets increased the owners’ equity ratio by 0.4 of a percentage point compared to the end of fiscal 2011, to 29.0%.
29
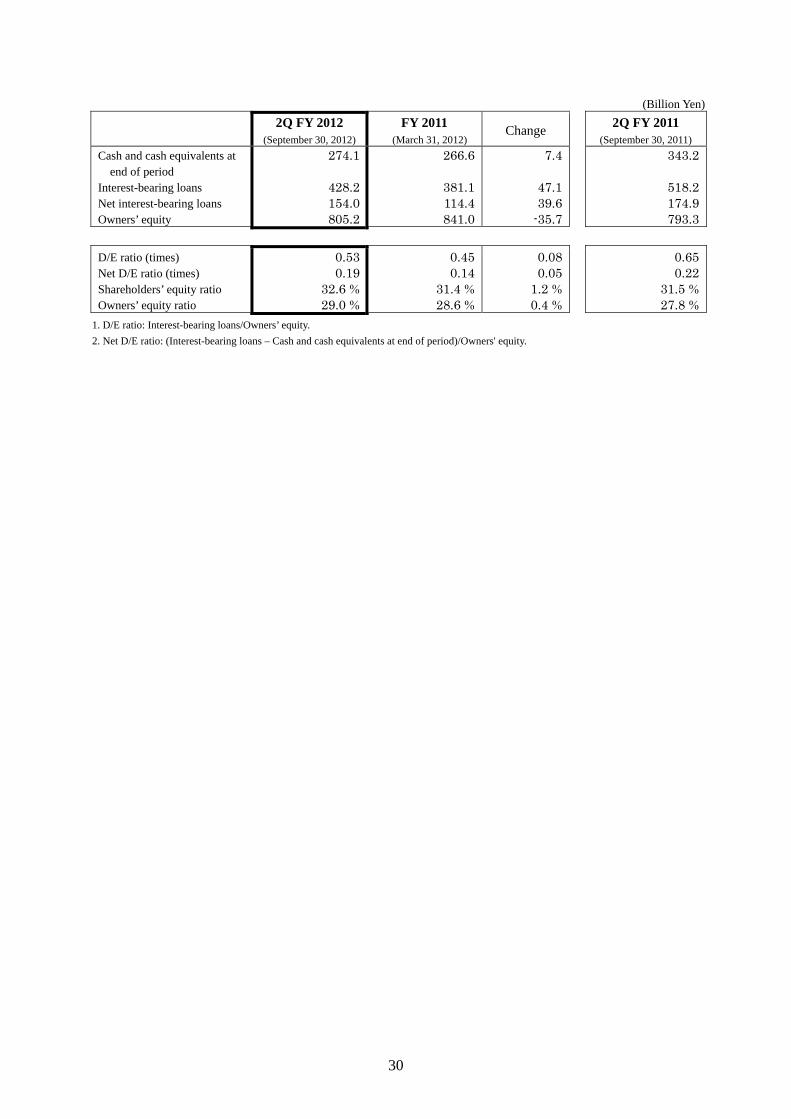
(Billion Yen)
2Q FY 2012 (September 30, 2012)
FY 2011 (March 31, 2012)
Change
Cash and cash equivalents at end of period
Interest-bearing loans Net interest-bearing loans Owners’ equity
274.1
428.2 154.0 805.2
266.6
381.1 114.4 841.0
7.4
47.1 39.6
-35.7
2Q FY 2011 (September 30, 2011)
343.2
518.2 174.9 793.3
D/E ratio (times) 0.53 0.45 0.08 Net D/E ratio (times) 0.19 0.14 0.05 Shareholders’ equity ratio 32.6 % 31.4 % 1.2 % Owners’ equity ratio 29.0 % 28.6 % 0.4 %
0.65 0.22
31.5 % 27.8 %
1. D/E ratio: Interest-bearing loans/Owners’ equity.
2. Net D/E ratio: (Interest-bearing loans – Cash and cash equivalents at end of period)/Owners' equity.
30
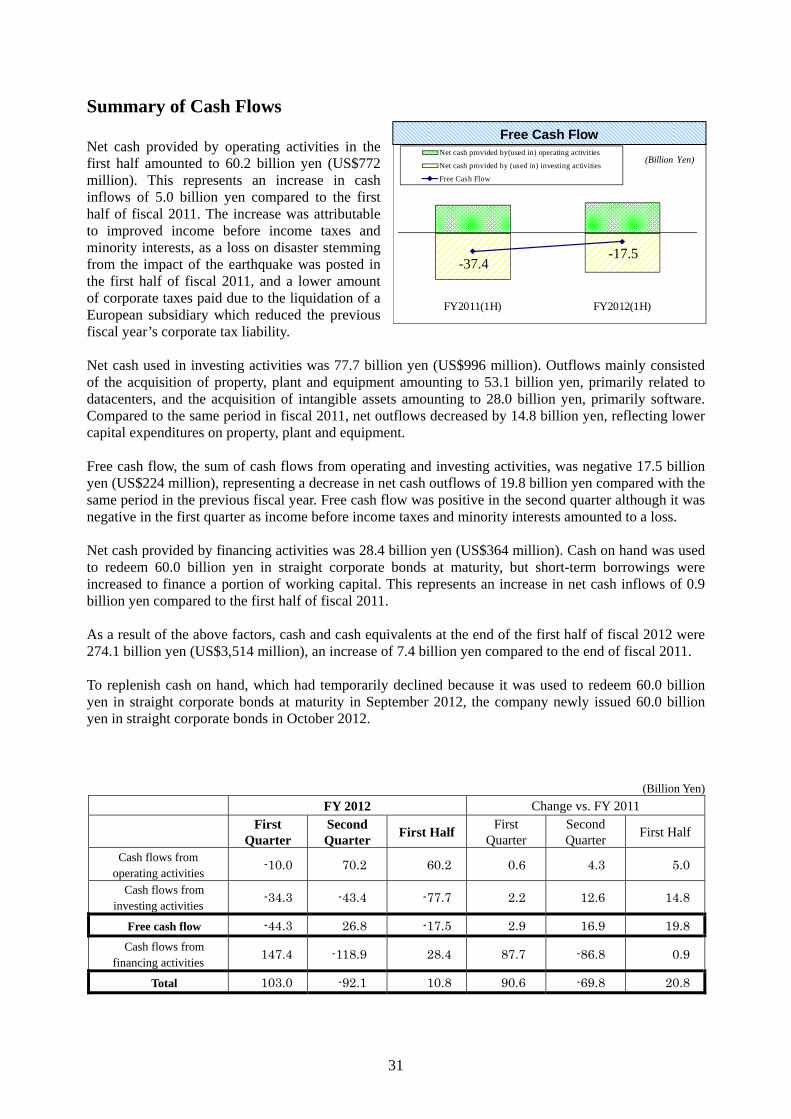
Summary of Cash Flows
Net cash provided by operating activities in the first half amounted to 60.2 billion yen (US$772 million). This represents an increase in cash inflows of 5.0 billion yen compared to the first half of fiscal 2011. The increase was attributable to improved income before income taxes and minority interests, as a loss on disaster stemming from the impact of the earthquake was posted in the first half of fiscal 2011, and a lower amount of corporate taxes paid due to the liquidation of a European subsidiary which reduced the previous fiscal year’s corporate tax liability.
-37.4 -17.5
FY2011(1H) FY2012(1H)
Net cash provided by(used in) operating activities
Net cash provided by (used in) investing activities
Free Cash Flow
(Billion Yen)
Free Cash Flow
Net cash used in investing activities was 77.7 billion yen (US$996 million). Outflows mainly consisted of the acquisition of property, plant and equipment amounting to 53.1 billion yen, primarily related to datacenters, and the acquisition of intangible assets amounting to 28.0 billion yen, primarily software. Compared to the same period in fiscal 2011, net outflows decreased by 14.8 billion yen, reflecting lower capital expenditures on property, plant and equipment.
Free cash flow, the sum of cash flows from operating and investing activities, was negative 17.5 billion yen (US$224 million), representing a decrease in net cash outflows of 19.8 billion yen compared with the same period in the previous fiscal year. Free cash flow was positive in the second quarter although it was negative in the first quarter as income before income taxes and minority interests amounted to a loss.
Net cash provided by financing activities was 28.4 billion yen (US$364 million). Cash on hand was used to redeem 60.0 billion yen in straight corporate bonds at maturity, but short-term borrowings were increased to finance a portion of working capital. This represents an increase in net cash inflows of 0.9 billion yen compared to the first half of fiscal 2011.
As a result of the above factors, cash and cash equivalents at the end of the first half of fiscal 2012 were 274.1 billion yen (US$3,514 million), an increase of 7.4 billion yen compared to the end of fiscal 2011.
To replenish cash on hand, which had temporarily declined because it was used to redeem 60.0 billion yen in straight corporate bonds at maturity in September 2012, the company newly issued 60.0 billion yen in straight corporate bonds in October 2012.
(Billion Yen)
FY 2012 Change vs. FY 2011 First
Quarter Second Quarter
First Half First
Quarter Second Quarter
First Half
Cash flows from operating activities
-10.0 70.2 60.2 0.6 4.3 5.0
Cash flows from investing activities
-34.3 -43.4 -77.7 2.2 12.6 14.8
Free cash flow -44.3 26.8 -17.5 2.9 16.9 19.8
Cash flows from financing activities
147.4 -118.9 28.4 87.7 -86.8 0.9
Total 103.0 -92.1 10.8 90.6 -69.8 20.8
31

6. FY2012 Consolidated Earnings Projections
For the first half of fiscal 2012, both net sales and operating income were in line with the projections announced on July 27, 2012. Services business in Japan was steady due to mild recovery of ICT investment. Mobile phone sales exceeded projections on account of strong smartphone sales. On the other hand, LSI devices and electronic components were adversely impacted by weak demand. In addition, services business in Europe was affected by the economic downturn, and PC sales inside and outside Japan fell short of projections due to decline in sales prices. The net loss was also in line with projections.
Taking into consideration the expectation that the downward trend for LSI, electronic components and services business in Europe will continue, Fujitsu will revise its fiscal 2012 projections announced on July 27, 2012, as follows. Exchange rate projections are also revised to 77 yen for the US dollar and 125 yen to the British pound. The euro remains at 100 yen, the same as July projections.
Fujitsu will revise its net sales projections for the full fiscal year downward by 110.0 billion yen from projections announced in July, to 4,420.0 billion yen. Projected sales for Technology Solutions are being revised downward by 60.0 billion yen. The downward revision reflects the adverse impact on the services business outside Japan due to economic downturn, primarily in Europe, and delayed recovery of investment by North American telecommunications carriers in network products. An exchange rate impact of 15.0 billion yen was factored in. The services business in Japan was stable. Projected sales for Ubiquitous Solutions are being revised downward by 10.0 billion yen, reflecting the impact of deteriorating market conditions and lower sales prices on the PC business both in and outside of Japan as well as the impact of a decline in automobile production on the mobilewear business. Sales of mobile phones are expected to exceed previous projections. Projected sales for Device Solutions are also being revised downward by 65.0 billion yen, with sales lower by 30.0 billion yen for LSI devices and by 35.0 billion yen for electronic components. The lower sales projection for LSI devices reflects a significant demand drop for LSI devices, primarily in consumer equipment, with the exception of smartphones, and the lower sales projection for electronic components reflects the impact of weak demand primarily for components used in PCs.
Fujitsu will revise its full-year projection for operating income downward by 35.0 billion yen, to 100.0 billion yen. Device Solutions accounts for 27.0 billion yen of the downward revision, reflecting the fall in demand, while Ubiquitous Solutions accounts for 5.0 billion yen. For the technology Solutions segment, no changes will be made to the previous projection. Steady growth of the services business in Japan offset the adverse impact of declining revenue on the services business outside Japan.
Fujitsu will also revise its full-year projection for net income downward by 35.0 billion yen, reflecting downward of operating income and expenses of about 10 billion yen related to the transfer of ownership of LSI assembly and test facilities.
32

FY 2012 Full-Year Consolidated Forecast (Billion Yen)
Fiscal Change vs. July Change vs. July 2012 Forecast FY 2011
Forecast Full-Year Change Change Forecast (%) (%)
4,530.0 4,420.0 ‐110.0 ‐2.4 ‐47.5 *‐1.1
135.0 100.0 ‐35.0 ‐25.9 ‐5.3 ‐5.0
[3.0%] [2.3%] [‐0.7%] [‐0.1%]
60.0 25.0 ‐35.0 ‐58.3 ‐17.7 ‐41.5
* Change (%) Constant Currency; -0
Operating Income by Business Segment
Fiscal 2011 Full-Year Results
Net Sales 4,467.5
Operating Income 105.3
[Operating Income Margin] [2.4%]
Net Income 42.7
Technology Solutions 171.2 Services 124.0
System Platforms 47.2 Ubiquitous Solutions 19.9 Device Solutions ‐10.1Other/Elimination and Corporate
‐75.7
180.0 130.0
50.0
180.0 130.0
50.0
---
25.0 20.0 ‐5.0 15.0 ‐12.0 ‐27.0
‐85.0 ‐88.0 ‐3.0
8.7 5.15.9 4.82.7 5.8 0.0 0.3 ‐1.8 -
‐12.2 -
Note: The impact of exchange rate fluctuation has been calculated by using the average U.S. dollar, euro and British pound exchange rates for fiscal 2011 to translate the current period’s net sales outside Japan into yen.
[Reference]
Breakdown of annual dividend payments
Dividend Per Share Record Date End of First Half End of Fiscal Year Annual Basis Payment for FY2011 5 yen 5 yen 10 yen Payment for FY2012 5 yen * 5 yen (planned) 10 yen (planned)
*Effective Date: November 22, 2012
33
7. Segment Information
I. Segment Overview
Fujitsu's reportable business segments consist of components of the Fujitsu group for which discrete financial information is available and whose operating results are regularly reviewed by the group’s executive decision-making body to make decisions about resource allocation to the segments and assess their performance.
In the field of information and communication technology (ICT), while delivering wide varieties of services, the group offers comprehensive solutions, from the development, manufacturing, and sales, to the maintenance and operations of cutting-edge, high-performance and high-quality products, and electronic devices that support services. The group's business is organized into three reportable segments—Technology Solutions, Ubiquitous Solutions, and Device Solutions—based on the group's managerial structure, characteristics of the products and services, and the similarities of the sales market within each operating segment. Managerial structure and product and service classification in each reportable segment are as follows.
(1) Technology Solutions To optimally deliver to customers services that integrate products, software, and services, the segment is organized in a matrix management structure comprised of business departments that are organized by product and service type, in order to manage costs and devise global business strategies, and sales departments that are organized along industry and geographic lines. This reportable segment consists of Solutions/Systems Integration, which are services for the construction of information and communication systems, Infrastructure Services, which are primarily outsourcing and maintenance services, System Products, which covers mainly the servers and storage systems that comprise ICT platforms, and Network Products, which are used to build communications infrastructure, such as mobile phone base stations and optical transmission systems.
(2) Ubiquitous Solutions The segment is organized into independent business management units along product lines and includes the sales departments.
This reportable segment contains ubiquitous terminals—including personal computers and mobile phones, as well as car audio and navigation systems, mobile communication equipment, and automotive electronic equipment—that collect various information and knowledge generated from the behavioral patterns of people and organizations needed to achieve the group’s vision of a “Human Centric Intelligent Society” (a society that enjoys the benefits of the value generated by ICT without requiring anyone to be conscious of the technological complexities involved).
(3) Device Solutions The segment is organized by product in independent business management units which include the respective sales departments and contains cutting-edge technologies, including LSI devices used in digital home appliances, automobiles, mobile phones and servers, as well as electronic components, such as semiconductor packages and batteries.
34

II. First Half of Fiscal 2012 (April 1, 2012 to September 30, 2012)
1.Amounts of Net Sales, Profit or Loss by Reportable Segments (Million Yen)
Reportable Segments
Other(*)
TotalTechnology Solutions
Ubiquitous Solutions
Device Solutions Sub-Total
Net Sales
External customers 1,314,193 494,988 241,987 2,051,168 12,741 2,063,909
Inter-segment 26,249 54,400 26,704 107,353 22,966 130,319
Total net sales 1,340,442 549,388 268,691 2,158,521 35,707 2,194,228
Operating Income (Loss) 47,094 10,428 -7,039 50,483 -3,152 47,331
* The “Other” segment consists of operations not included in reportable segments, such as Japan’s Next-Generation Supercomputer project, facility services and development of information systems for group companies, and welfare benefits for group employees.
2.Reconciliation of Net Sales and Operating Income or Loss of Reportable Segments with those of the Consolidated Income Statements
(Million Yen)
Reconciliation of Net Sales Amount
Total of Reportable Segments
Net Sales of "Other" Category
Elimination of Intersegment Transactions
2,158,521
35,707
-122,415
Net Sales in Consolidated Income Statements 2,071,813
(Million Yen)Reconciliation of Operating Income (Loss) Amount
Total of Reportable Segments
Operating Income of "Other" Category
Corporate Expenses *
Elimination of Intersegment Transactions
-3,152
50,483
-37,085
-2,556
Operating Income in Consolidated Income Statements 7,690
* Corporate Expenses mainly consist of strategic expenses such as basic research and development expenses which are not attributable to the reportable segments and group management shared expenses incurred by Fujitsu.
III. First Half of Fiscal 2011 (April 1, 2011 to September 30, 2011)
1.Amounts of Net Sales, Profit or Loss by Reportable Segments (Million Yen)
Reportable Segments
Other(*)
TotalTechnology Solutions
Ubiquitous Solutions
Device Solutions Sub-Total
Net Sales
External customers 1,344,946 460,665 254,874 2,060,485 25,885 2,086,370
Inter-segment 40,469 55,144 33,572 129,185 23,128 152,313
Total net sales 1,385,415 515,809 288,446 2,189,670 49,013 2,238,683
Operating Income (Loss) 45,722 4,335 -4,838 45,219 -1,099 44,120
* The “Other” segment consists of operations not included in reportable segments, such as Japan’s Next-Generation Supercomputer project, facility services and development of information systems for group companies, and welfare benefits for group employees.
35

2.Reconciliation of Net Sales and Operating Income or Loss of Reportable Segments with those of the Consolidated Income Statements
(Million Yen) Reconciliation of Net Sales Amount
Total of Reportable Segments
Net Sales of "Other" Category
Elimination of Intersegment Transactions
2,189,670
49,013
-146,366
Net Sales in Consolidated Income Statements 2,092,317
(Million Yen) Reconciliation of Operating Income (Loss) Amount
Total of Reportable Segments
Operating Income of "Other" Category
Corporate Expenses *
Elimination of Intersegment Transactions
45,219
-1,099
-36,534
-535
Operating Income in Consolidated Income Statements 7,051
* Corporate Expenses mainly consist of strategic expenses such as basic research and development expenses which are not attributable to the reportable segments and group management shared expenses incurred by Fujitsu.
IV.Second Quarter of Fiscal 2012 (July 1, 2012 to September 30, 2012)
1.Amounts of Net Sales, Profit or Loss by Reportable Segments (Million Yen)
Reportable Segments
Other(*)
TotalTechnology Solutions
Ubiquitous Solutions
Device Solutions
Sub-Total
Net Sales
External customers 699,821 283,187 123,955 1,106,963 3,434 1,110,397
Inter-segment 13,501 31,587 14,361 59,449 12,582 72,031
Total net sales 713,322 314,774 138,316 1,166,412 16,016 1,182,428
Operating Income (Loss) 46,219 12,463 -3,383 55,299 -1,675 53,624
* The “Other” segment consists of operations not included in reportable segments, such as Japan’s Next-Generation Supercomputer project, facility services and development of information systems for group companies, and welfare benefits for group employees.
2.Reconciliation of Net Sales and Operating Income or Loss of Reportable Segments with those of the Consolidated Income Statements
(Million Yen)Reconciliation of Net Sales Amount
Total of Reportable Segments
Net Sales of "Other" Category
Elimination of Intersegment Transactions
1,166,412
16,016
-67,985
Net Sales in Consolidated Income Statements 1,114,443
(Million Yen)Reconciliation of Operating Income (Loss) Amount
Total of Reportable Segments
Operating Income of "Other" Category
Corporate Expenses *
Elimination of Intersegment Transactions
-19,465
-1,426
55,299
-1,675
Operating Income in Consolidated Income Statements 32,733
* Corporate Expenses mainly consist of strategic expenses such as basic research and development expenses which are not attributable to the reportable segments and group management shared expenses incurred by Fujitsu.
36

V. Second Quarter of Fiscal 2011 (July 1, 2011 to September 30, 2011)
1.Amounts of Net Sales, Profit or Loss by Reportable Segments (Million Yen)
Reportable Segments
Other(*)
TotalTechnology Solutions
Ubiquitous Solutions
Device Solutions Sub-Total
Net Sales
External customers 712,063 250,848 132,052 1,094,963 8,122 1,103,085
Inter-segment 14,205 29,519 15,516 59,240 12,297 71,537
Total net sales 726,268 280,367 147,568 1,154,203 20,419 1,174,622
Operating Income (Loss) 43,196 4,368 -3,810 43,754 -1,573 42,181
* The “Other” segment consists of operations not included in reportable segments, such as Japan’s Next-Generation Supercomputer project, facility services and development of information systems for group companies, and welfare benefits for group employees.
2.Reconciliation of Net Sales and Operating Income or Loss of Reportable Segments with those of the Consolidated Income Statements
(Million Yen)
Reconciliation of Net Sales Amount
Total of Reportable Segments
Net Sales of "Other" Category
Elimination of Intersegment Transactions
20,419
1,154,203
-68,376
Net Sales in Consolidated Income Statements 1,106,246
(Million Yen)Reconciliation of Operating Income (Loss) Amount
Total of Reportable Segments
Operating Income of "Other" Category
Corporate Expenses *
Elimination of Intersegment Transactions
-19,263
1,272
43,754
-1,573
Operating Income in Consolidated Income Statements 24,190
* Corporate Expenses mainly consist of strategic expenses such as basic research and development expenses which are not attributable to the reportable segments and group management shared expenses incurred by Fujitsu.
37
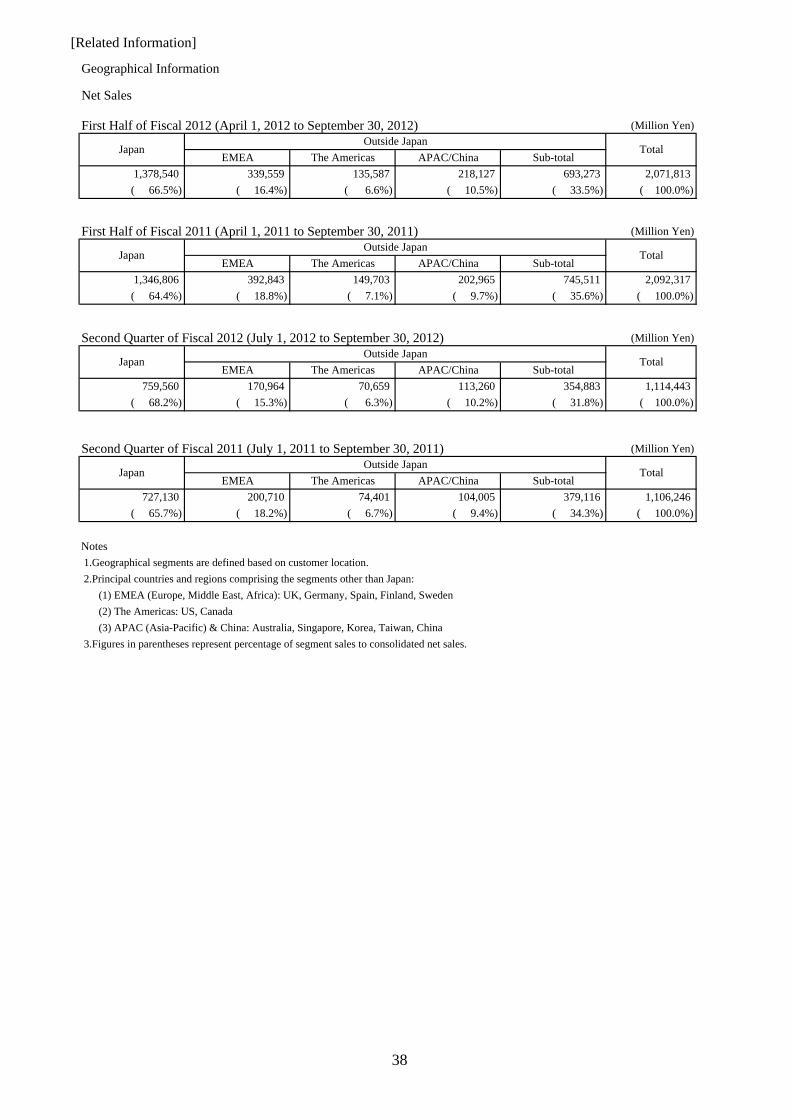
[Related Information]
Geographical Information
Net Sales
First Half of Fiscal 2012 (April 1, 2012 to September 30, 2012) (Million Yen)
Japan Outside Japan
TotalEMEA The Americas APAC/China Sub-total
( 66.5%)
1,378,540
( 16.4%)
339,559 135,587
( 6.6%)
218,127
( 10.5%)
693,273
( 33.5%)
2,071,813
( 100.0%)
First Half of Fiscal 2011 (April 1, 2011 to September 30, 2011) (Million Yen)
Japan Outside Japan
TotalEMEA The Americas APAC/China Sub-total
1,346,806
( 64.4%)
392,843
( 18.8%)
149,703
( 7.1%)
202,965
( 9.7%)
745,511
( 35.6%) ( 100.0%)
2,092,317
Second Quarter of Fiscal 2012 (July 1, 2012 to September 30, 2012) (Million Yen)
Japan Outside Japan
TotalEMEA The Americas APAC/China Sub-total
759,560
( 68.2%)
170,964
( 15.3%)
70,659
( 6.3%)
113,260
( 10.2%)
354,883
( 31.8%)
1,114,443
( 100.0%)
Second Quarter of Fiscal 2011 (July 1, 2011 to September 30, 2011) (Million Yen)
Japan Outside Japan
TotalEMEA The Americas APAC/China Sub-total
( 65.7%)
727,130
( 18.2%)
200,710
( 6.7%)
74,401
( 9.4%)
104,005
( 34.3%)
379,116 1,106,246
( 100.0%)
Notes
1.Geographical segments are defined based on customer location.
2.Principal countries and regions comprising the segments other than Japan:
(1) EMEA (Europe, Middle East, Africa): UK, Germany, Spain, Finland, Sweden
(2) The Americas: US, Canada
(3) APAC (Asia-Pacific) & China: Australia, Singapore, Korea, Taiwan, China
3.Figures in parentheses represent percentage of segment sales to consolidated net sales.
38
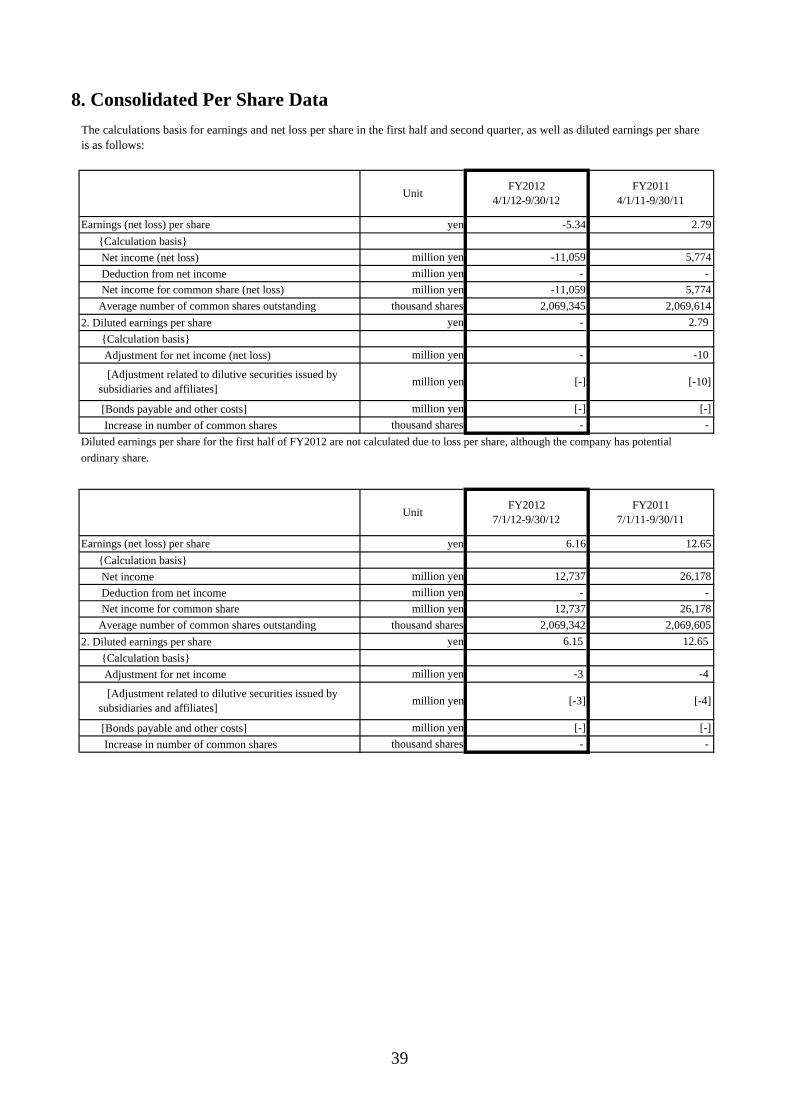
8. Consolidated Per Share Data
The calculations basis for earnings and net loss per share in the first half and second quarter, as well as diluted earnings per share is as follows:
Unit FY2012
4/1/12-9/30/12 FY2011
4/1/11-9/30/11
Earnings (net loss) per share yen -5.34 2.79
{Calculation basis}
Net income (net loss) million yen -11,059 5,774
Deduction from net income million yen - -
Net income for common share (net loss) million yen -11,059 5,774
Average number of common shares outstanding thousand shares 2,069,345 2,069,614
2. Diluted earnings per share yen - 2.79
{Calculation basis}
Adjustment for net income (net loss) million yen - -10
[Adjustment related to dilutive securities issued by subsidiaries and affiliates]
million yen [-] [-10]
[Bonds payable and other costs] million yen [-] [-]
Increase in number of common shares thousand shares - -
Diluted earnings per share for the first half of FY2012 are not calculated due to loss per share, although the company has potential
ordinary share.
UnitFY2012
7/1/12-9/30/12 FY2011
7/1/11-9/30/11
Earnings (net loss) per share yen 6.16 12.65
{Calculation basis}
Net income million yen 12,737 26,178
Deduction from net income million yen - -
Net income for common share million yen 12,737 26,178
Average number of common shares outstanding thousand shares 2,069,342 2,069,605
2. Diluted earnings per share yen 6.15 12.65
{Calculation basis}
Adjustment for net income million yen -3 -4
[Adjustment related to dilutive securities issued by subsidiaries and affiliates]
million yen [-3] [-4]
[Bonds payable and other costs] million yen [-] [-]
Increase in number of common shares thousand shares - -
39

9. Major Subsequent Events
After the completion of the first half of FY2012, Fujitsu issued the following straight bonds.
30th Series Unsecured Straight Bonds 1. Total amount of issue 40 billion yen 2. Interest rate 0.331% per annum 3. Issue price 100% of the denomination of each bond 4. Term and redemption methodOctober 16, 2015 (3 years), Bullet repayment 5. Payment date October 16, 2012 6. Collateral The bonds are not secured by any pledge, mortgage or other charge
on any assets or revenues of the Company or of others, nor are they guaranteed. There are no assets reserved as security for the bonds.
7. Application of funds The amount is scheduled to be allocated for redemption and repayment of the bonds and loans that will reach maturity by the end of March, 2013.
31st Series Unsecured Straight Bonds 1. Total amount of issue 20 billion yen 2. Interest rate 0.476% per annum 3. Issue price 100% of the denomination of each bond 4. Term and redemption methodOctober 16, 2017 (5 years), Bullet repayment 5. Payment date October 16, 2012 6. Collateral The bonds are not secured by any pledge, mortgage or other charge
on any assets or revenues of the Company or of others, nor are they guaranteed. There are no assets reserved as security for the bonds.
7. Application of funds The amount is scheduled to be allocated for redemption and repayment of the bonds and loans that will reach maturity by the end of March, 2013.
40
10. Notes to Consolidated Financial Statements
(1) Significant Changes to Subsidiaries in the Current Reporting Period (changes to specified subsidiaries resulting from changes in scope of consolidation)
There are none.
(2) Application of accounting procedures specific to preparation of quarterly consolidated financial statements
There are none.
(3) Changes in accounting policies and accounting estimates, and restatements 1.Changes in accounting policies arising from revision of accounting standards: None 2.Changes arising from other factors: None 3.Changes in accounting estimates: None 4. Restatements: None
(4) Cautionary Note Regarding Assumptions of a Going Concern
There are none.
(5) Compliance with Quarterly Review Procedures
These materials fall outside the jurisdiction of the quarterly review procedures of the Financial Instruments and Exchange Act. Therefore, at the time of disclosure, a portion of the review has not yet been completed. Upon completion of the review, a statutory quarterly report will be submitted on November 14, 2012.
(6) Significant Changes in Shareholders’ Equity
There are none.
(7) Precautions on Usage of Earnings Projections
These materials may contain forward-looking statements that are based on management’s current information, views and assumptions and involve known and unknown risks and uncertainties that could cause actual results, performance or events to differ materially from those expressed or implied in such statements. Actual results may differ materially from those projected or implied in the forward-looking statements due to, without limitation, the following factors listed below.
For information regarding the assumptions used to prepare these projections, please refer to “FY2012 Consolidated Earnings Projections” on page 32.
● General economic and market conditions in key markets (particularly in Japan, North America, Europe, and Asia, including China) ● Rapid changes in the high-technology market (particularly semiconductors, PCs, etc.) ● Fluctuations in exchange rates or interest rates ● Fluctuations in capital markets ● Intensifying price competition ● Changes in market positioning due to competition in R&D ● Changes in the environment for the procurement of parts and components ● Changes in competitive relationships relating to collaborations, alliances and technical provisions ● Risks related to public regulations, public policy and tax matters
41

● Risks related to product or services defects ● Potential emergence of unprofitable projects ● Risks related to R&D investments, capital expenditures, business acquisitions, business restructuring, etc. ● Risks related to natural disasters and unforeseen events ● Changes in accounting policies
42
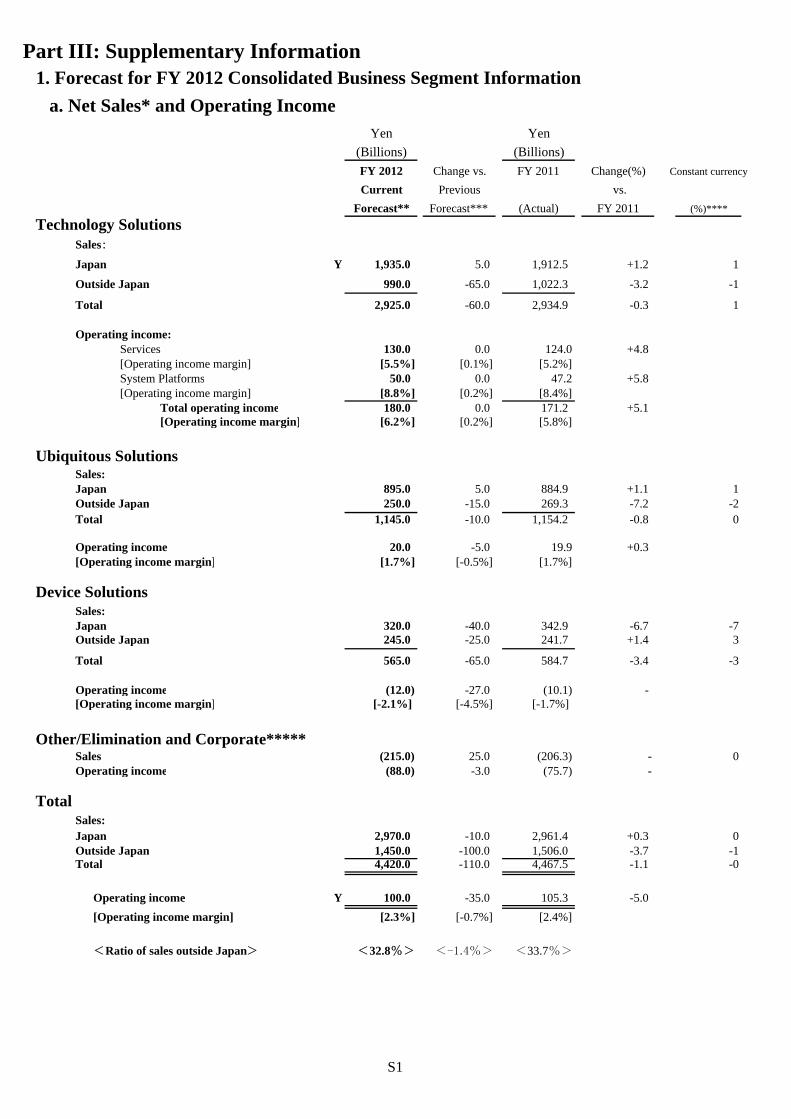
Part III: Supplementary Information 1. Forecast for FY 2012 Consolidated Business Segment Information
a. Net Sales* and Operating Income
Yen Yen
(Billions)
FY 2012
Current
Change vs.
Previous
(Billions)
FY 2011 Change(%)
vs.
Constant currency
Technology Solutions Sales:
Forecast** Forecast*** (Actual) FY 2011 (%)****
Japan
Outside Japan
Y 1,935.0
990.0
5.0
-65.0
1,912.5
1,022.3
+1.2
-3.2
1
-1
Total 2,925.0 -60.0 2,934.9 -0.3 1
Operating income: Services [Operating income margin] System Platforms [Operating income margin]
Total operating income [Operating income margin]
130.0 [5.5%]
50.0 [8.8%] 180.0
[6.2%]
0.0 [0.1%]
0.0 [0.2%]
0.0 [0.2%]
124.0 [5.2%]
47.2 [8.4%] 171.2 [5.8%]
+4.8
+5.8
+5.1
Ubiquitous Solutions Sales: Japan Outside Japan Total
895.0 250.0
1,145.0
5.0 -15.0 -10.0
884.9 269.3
1,154.2
+1.1 -7.2 -0.8
1 -2 0
[Operating income margin] Operating income 20.0
[1.7%] -5.0
[-0.5%] 19.9
[1.7%] +0.3
Device Solutions Sales: Japan Outside Japan
320.0 245.0
-40.0 -25.0
342.9 241.7
-6.7 +1.4
-7 3
Total 565.0 -65.0 584.7 -3.4 -3
Operating income [Operating income margin]
(12.0) [-2.1%]
-27.0 [-4.5%]
(10.1)[-1.7%]
-
Other/Elimination and Corporate***** Sales Operating income
(215.0) (88.0)
25.0 -3.0
(206.3) (75.7)
--
0
Total Sales: Japan Outside Japan Total
2,970.0 1,450.0 4,420.0
-10.0 -100.0 -110.0
2,961.4 1,506.0 4,467.5
+0.3 -3.7 -1.1
0 -1 -0
Operating income
[Operating income margin]
Y 100.0
[2.3%]
-35.0
[-0.7%]
105.3
[2.4%]
-5.0
<Ratio of sales outside Japan> <32.8%> <-1.4%> <33.7%>
S1
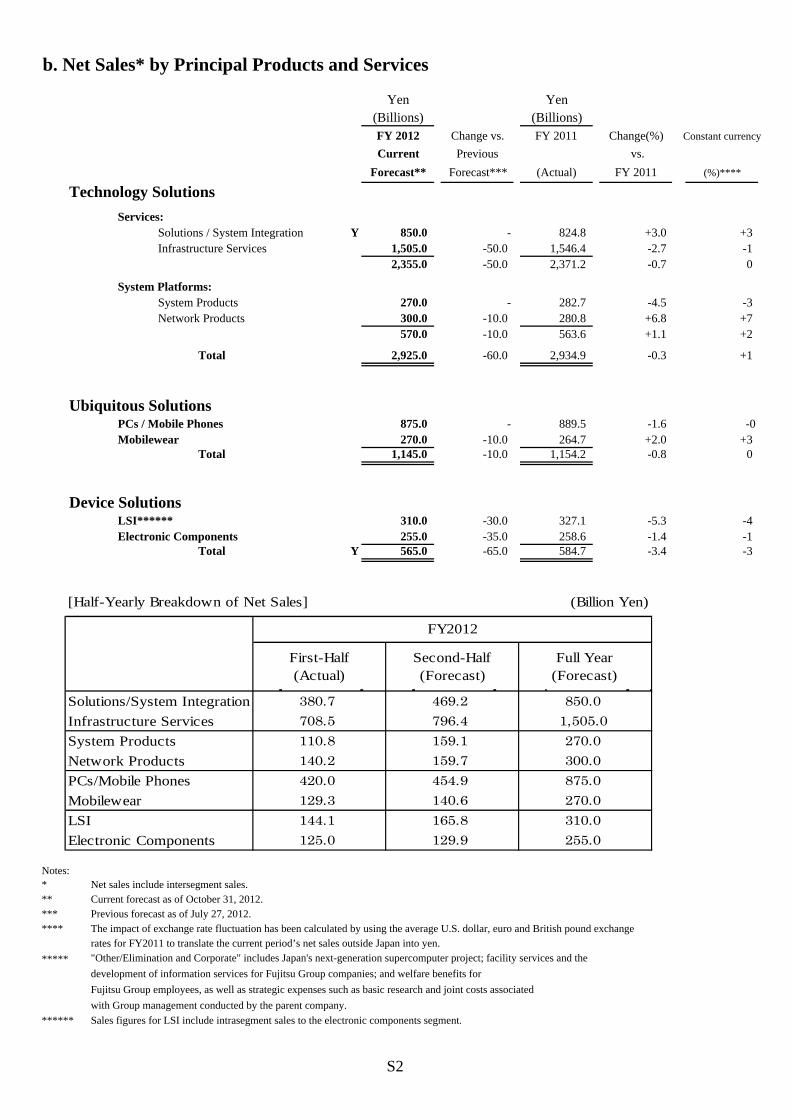
b. Net Sales* by Principal Products and Services
Yen Yen (Billions) (Billions) FY 2012 Change vs. FY 2011 Change(%) Constant currency
Current Previous vs.
Forecast** Forecast*** (Actual) FY 2011 (%)****
Technology Solutions
Services: Solutions / System Integration Y 850.0 - 824.8 +3.0 +3 Infrastructure Services 1,505.0 -50.0 1,546.4 -2.7 -1
2,355.0 -50.0 2,371.2 -0.7 0
System Platforms: System Products 270.0 - 282.7 -4.5 -3 Network Products 300.0 -10.0 280.8 +6.8 +7
570.0 -10.0 563.6 +1.1 +2
Total 2,925.0 -60.0 2,934.9 -0.3 +1
Ubiquitous Solutions PCs / Mobile Phones 875.0 - 889.5 -1.6 -0 Mobilewear 270.0 -10.0 264.7 +2.0 +3
Total 1,145.0 -10.0 1,154.2 -0.8 0
Device Solutions LSI****** 310.0 -30.0 327.1 -5.3 -4 Electronic Components 255.0 -35.0 258.6 -1.4 -1
Total Y 565.0 -65.0 584.7 -3.4 -3
[Half-Yearly Breakdown of Net Sales] (Billion Yen)
FY2012
First-Half (Actual)
Second-Half (Forecast)
Full Year (Forecast)
Solutions/System Integration
Infrastructure Services
380.7
708.5
469.2
796.4
850.0
1,505.0
System Products
Network Products
110.8
140.2
159.1
159.7
270.0
300.0
PCs/Mobile Phones
Mobilewear
420.0
129.3
454.9
140.6
875.0
270.0
LSI
Electronic Components
144.1
125.0
165.8
129.9
310.0
255.0
Notes: * Net sales include intersegment sales. ** Current forecast as of October 31, 2012. *** Previous forecast as of July 27, 2012. **** The impact of exchange rate fluctuation has been calculated by using the average U.S. dollar, euro and British pound exchange
rates for FY2011 to translate the current period’s net sales outside Japan into yen.
***** "Other/Elimination and Corporate" includes Japan's next-generation supercomputer project; facility services and the
development of information services for Fujitsu Group companies; and welfare benefits for
Fujitsu Group employees, as well as strategic expenses such as basic research and joint costs associated
with Group management conducted by the parent company.
****** Sales figures for LSI include intrasegment sales to the electronic components segment.
S2

2. Miscellaneous Forecasts for FY 2012 a. R&D Expenses
Yen Yen Yen
(Billions) (Billions) (Billions) FY2011 FY2012 Change vs.
1H Full-year 1H Full-year previous (Actual) (Actual) (Actual) (Forecast) forecast*
116.5 238.3 114.6 240.0 5.0 As % of sales 5.6% 5.3% 5.5% 5.4% 0.2%
b. Capital Expenditures and Depreciation Yen Yen Yen
(Billions) (Billions) (Billions) FY2011 FY2012 Change vs.
1H Full-year 1H Full-year previous (Actual) (Actual) (Actual) (Forecast) forecast*
Capital Expenditures Technology Solutions Y 35.7 73.4 29.1 85.0 -Ubiquitous Solutions 7.0 15.6 7.0 15.0 -Device Solutions 22.1 47.2 19.6 35.0 -Other/Corporate
Total 0.3
65.3 4.3
140.6 3.6
59.5 5.0
140.0 --
Depreciation Y 64.3 131.5 57.8 130.0 -
c. Cash Flows Yen Yen Yen
(Billions) (Billions) (Billions)
FY2011 FY2012 Change vs.
1H Full-year 1H Full-year previous (Actual) (Actual) (Actual) (Forecast) forecast*
(A) Cash flows from operating activities Y 55.2 240.0 60.2 150.0 -140.0 *** [Net income] [5.7] [42.7] [-11.0] [25.0] -35.0 [Depreciation & goodwill amortization**] [102.1] [209.5] [95.4] [210.0] -[Others] [-52.6] [-12.2] [-24.1] [-85.0] -105.0
(B) Cash flows from investing activities (92.6) (190.8) (77.7) (190.0) -
(C) Free cash flow (A)+(B) (37.4) 49.1 (17.5) (40.0) -140.0
(D) Cash flows from financing activities 27.5 (138.9) 28.4 60.0 140.0 ***
(E) Total (C)+(D) Y (9.9) (89.7) 10.8 20.0 -
Notes: * Previous forecast as of July 27, 2012.
** Depreciation & goodwill amortization include amortization of intangible assets.
*** Change vs previous forecast
Cash flows from operating activities : -140.0
[Contributing factors]
Special contribution to the pension fund of a UK subsidiary, expenditure related to the transfer of ownership of LSI assembly
and test facilities and a decline in cash flow due to deterioration in earnings.
Cash flows from financing activities : 140.0
[Contributing factors]
Issuance of bonds and increase in borrowings
S3

d. Exchange Rates
Average rate: (Yen)
FY 2011
(Yen)
FY 2012
(Yen)
Change vs.
1H (Actual)
2H (Actual)
1H (Actual)
2H (Forecast)
previous forecast*
U.S. dollar 80 78 79 77 -3 euro 114 104 101 100 -British pound 129 123 126 125 -5
Reference information: A 1 yen fluctuation (depreciation/appreciation) is expected to have the following effect on operating income in 1H FY 2012.
U.S. dollar : Increase/decrease by approximately 0.2 billion yen. euro : Increase/decrease by approximately 0 billion yen.
British pound : Increase/decrease by approximately 0 billion yen.
A 1 yen fluctuation (depreciation/appreciation) is expected to have the following effect on operating income in 2H FY 2012.
U.S. dollar : Increase/decrease by approximately 0.5 billion yen. euro : Increase/decrease by approximately 0.2 billion yen.
British pound : Increase/decrease by approximately 0 billion yen.
e. PC Shipments (Million Units) (Million Units) (Million Units)
FY2011 FY2012 Change vs.
1H Full-year 1H Full-year previous (Actual) (Actual) (Actual) (Forecast) forecast*
2.71 6.02 2.87 7.00 -
f. Mobile Phone Shipments (Million Units) (Million Units) (Million Units)
FY2011 FY2012 Change vs. 1H
(Actual) 3.40
Full-year (Actual)
8.00
1H (Actual)
3.80
Full-year (Forecast)
8.00
previous forecast*
-
Notes: * Previous forecast as of July 27, 2012.
S4
Related Documents