EXPERIMENTAL STUDY ON THE STABILITY OF A NATURAL CIRCULATION DRIVEN SUPER-CRITICAL WATER COOLED REACTOR CHRISTOPHE T’JOEN Delft University of Technology, Department of Radiation, Radionuclides and Reactors The Netherlands [email protected] MARTIN ROHDE Delft University of Technology, Department of Radiation, Radionuclides and Reactors The Netherlands Abstract The supercritical water reactor (SCWR) is one of the advanced nuclear reactor designs currently under investigation. Considering the large density difference which the coolant experiences when travelling through the core, using natural circulation as the driving force seems feasible. This avoids the use of pumps and therefore adds an inherent safety feature. The same large density difference however, is also expected to induce flow instabilities, as is known from natural circulation boiling water reactors. These instabilities are due to inherent feedback mechanisms, either pure thermo-hydraulic or neutronic – thermo-hydraulic. In this study, the stability of a natural circulation SCWR is studied experimentally. The setup (DeLight) is a scaled version using Freon R23. The thermo-hydraulic feedback naturally occurs within a closed loop, but to mimic a nuclear reactor, neutronic feedback and the fuel rod behaviour is artificially implemented. This was done based on local density measurements and with a first order time delay model. It was found that there are no pure thermal-hydraulic instabilities, but applying the neutronic feedback does result in significant instabilities for certain operating conditions. A parameter study was performed by examining the impact of the power distribution and the fuel time constant on the nature of the instabilities. Keywords: natural circulation, supercritical water reactor, stability INTRODUCTION The SuperCritical Water Reactor (SCWR) is one of the six concept designs that is being studied as part of the international generation IV effort to develop more efficient, safer and proliferation resistant nuclear reactors. By using supercritical water, the exit temperature can be raised significantly, most designs consider an exit temperature of 500°C and a pressure of 25 MPa. This results in a higher efficiency (up to 42-45%), which is well above that of current nuclear reactors. Using supercritical water also results in a reduced complexity of the auxiliary systems and plant components, cutting investment costs, as reported by Buongiorno and MacDonald (2003). Over the course of the past decades a number of core designs have finalized, including recently a European design (Fischer et al., 2009). These designs differ considerably with regards to the fuel assembly, flow layout or neutron spectra which are used. The European design (HPLWR, High Performance Light Water Reactor) is remarkable in having a three-pass core layout (Fig. 1A) combined with water rods for moderation. The system operates at 25 MPa, with an inlet and exit temperature of 280 °C and 500 °C. Between the passes mixing plena are used to reduce peak cladding temperatures by homogenizing the

Welcome message from author
This document is posted to help you gain knowledge. Please leave a comment to let me know what you think about it! Share it to your friends and learn new things together.
Transcript
EXPERIMENTAL STUDY ON THE STABILITY OF A NATURAL CIRCULATION
DRIVEN SUPER-CRITICAL WATER COOLED REACTOR
CHRISTOPHE T’JOEN Delft University of Technology, Department of Radiation, Radionuclides and Reactors
The Netherlands
MARTIN ROHDE
Delft University of Technology, Department of Radiation, Radionuclides and Reactors
The Netherlands
Abstract The supercritical water reactor (SCWR) is one of the advanced nuclear reactor designs
currently under investigation. Considering the large density difference which the coolant
experiences when travelling through the core, using natural circulation as the driving force
seems feasible. This avoids the use of pumps and therefore adds an inherent safety feature.
The same large density difference however, is also expected to induce flow instabilities, as is
known from natural circulation boiling water reactors. These instabilities are due to inherent
feedback mechanisms, either pure thermo-hydraulic or neutronic – thermo-hydraulic. In this
study, the stability of a natural circulation SCWR is studied experimentally. The setup
(DeLight) is a scaled version using Freon R23. The thermo-hydraulic feedback naturally
occurs within a closed loop, but to mimic a nuclear reactor, neutronic feedback and the fuel
rod behaviour is artificially implemented. This was done based on local density
measurements and with a first order time delay model. It was found that there are no pure
thermal-hydraulic instabilities, but applying the neutronic feedback does result in significant
instabilities for certain operating conditions. A parameter study was performed by examining
the impact of the power distribution and the fuel time constant on the nature of the
instabilities.
Keywords: natural circulation, supercritical water reactor, stability
INTRODUCTION
The SuperCritical Water Reactor (SCWR) is one of the six concept designs that is being
studied as part of the international generation IV effort to develop more efficient, safer and
proliferation resistant nuclear reactors. By using supercritical water, the exit temperature can
be raised significantly, most designs consider an exit temperature of 500°C and a pressure of
25 MPa. This results in a higher efficiency (up to 42-45%), which is well above that of
current nuclear reactors. Using supercritical water also results in a reduced complexity of the
auxiliary systems and plant components, cutting investment costs, as reported by Buongiorno
and MacDonald (2003). Over the course of the past decades a number of core designs have
finalized, including recently a European design (Fischer et al., 2009). These designs differ
considerably with regards to the fuel assembly, flow layout or neutron spectra which are
used. The European design (HPLWR, High Performance Light Water Reactor) is remarkable
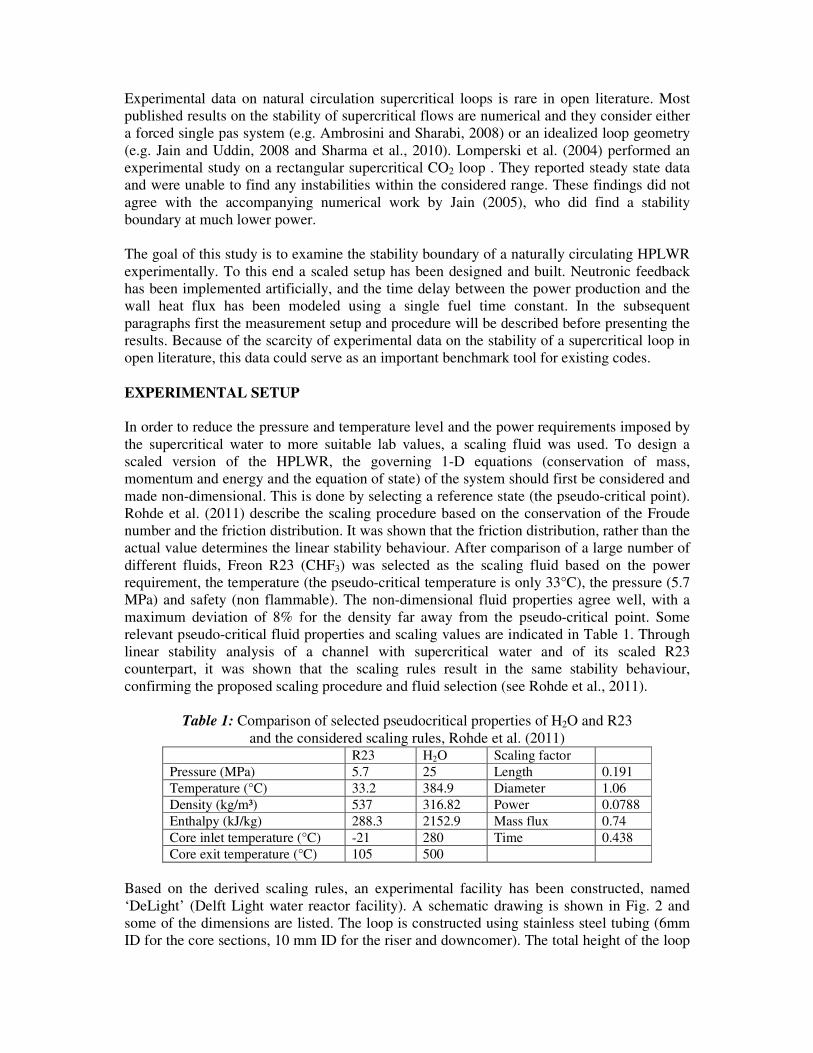
in having a three-pass core layout (Fig. 1A) combined with water rods for moderation. The
system operates at 25 MPa, with an inlet and exit temperature of 280 °C and 500 °C. Between
the passes mixing plena are used to reduce peak cladding temperatures by homogenizing the
flow into the passes. More details on the HPLWR fuel assembly can be found in Hofmeister
et al. (2007).
As is well known, supercritical fluids experience strong changes in fluid properties. This is
illustrated in Fig 1B. The density varies between 780 kg/m³ and 90 kg/m³ with a sharp change
near the pseudo critical point. This large density difference could be used as the driving force
for natural circulation. This removes the need for large feed water pumps, and adds a layer of
inherent safety to the system. Currently most reactor designs only consider natural circulation
for emergency situations, despite its inherent safety aspect. So far only one design, the
ESBWR (as studied by e.g. Marcel et al., 2008), has actually been constructed in a small size
at Dodewaard, the Netherlands and was operated for decades. However, a number of reactors
are currently under development with single phase natural circulation: e.g. the REX-10
(Regional Energy Reactor – 10 MWth) which uses water at 2 MPa (Jang et al., 2011). GE also
continues to research the ESBWR design for future application.
Figure 1: A: Three pass core arrangement proposed for the HPLWR (Fischer et al., 2009), B:
normalized fluid properties for water at 25 MPa for a range of temperatures
Natural circulation loops however can become unstable under specific operational conditions
(e.g. high power and low flow rate). Bouré et al. (1973) presented a classification of the
different types of instabilities. A static instability (flow excursion) can be described using
only the steady state equations. In this case, a small change in the flow conditions will result
in a new steady state not in the vicinity of the original one. For dynamic instabilities, such as
density wave oscillations or DWO, the steady state equations are not sufficient to predict the
system behavior, not even the threshold of instability. In such a situation, multiple competing
solutions exist for the governing equations. The system will move from one solution to the
other, driven by feedback mechanisms. March-Leuba and Rey 0(1993) presented a detailed
explanation of the DWO and the feedback mechanisms, which is driven by the interaction of
inertia and friction for the thermo-hydraulic modes. In a nuclear reactor another feedback
mechanism is present: the neutronic feedback. This couples the fluid density to the power
production through the moderation done by the water molecules. This makes the fission rate
and subsequently the heat generated in a reactor core directly correlated to the neutron
density. This results in a much more complex behavior, as shown by Van Bragt and Van der
Hagen (1998) for the ESBWR and recently by Yi et al. (2004) for the US design of a SCWR.
A
Experimental data on natural circulation supercritical loops is rare in open literature. Most
published results on the stability of supercritical flows are numerical and they consider either
a forced single pas system (e.g. Ambrosini and Sharabi, 2008) or an idealized loop geometry
(e.g. Jain and Uddin, 2008 and Sharma et al., 2010). Lomperski et al. (2004) performed an
experimental study on a rectangular supercritical CO2 loop . They reported steady state data
and were unable to find any instabilities within the considered range. These findings did not
agree with the accompanying numerical work by Jain (2005), who did find a stability
boundary at much lower power.
The goal of this study is to examine the stability boundary of a naturally circulating HPLWR
experimentally. To this end a scaled setup has been designed and built. Neutronic feedback
has been implemented artificially, and the time delay between the power production and the
wall heat flux has been modeled using a single fuel time constant. In the subsequent
paragraphs first the measurement setup and procedure will be described before presenting the
results. Because of the scarcity of experimental data on the stability of a supercritical loop in
open literature, this data could serve as an important benchmark tool for existing codes.
EXPERIMENTAL SETUP
In order to reduce the pressure and temperature level and the power requirements imposed by
the supercritical water to more suitable lab values, a scaling fluid was used. To design a
scaled version of the HPLWR, the governing 1-D equations (conservation of mass,
momentum and energy and the equation of state) of the system should first be considered and
made non-dimensional. This is done by selecting a reference state (the pseudo-critical point).
Rohde et al. (2011) describe the scaling procedure based on the conservation of the Froude
number and the friction distribution. It was shown that the friction distribution, rather than the
actual value determines the linear stability behaviour. After comparison of a large number of
different fluids, Freon R23 (CHF3) was selected as the scaling fluid based on the power
requirement, the temperature (the pseudo-critical temperature is only 33°C), the pressure (5.7
MPa) and safety (non flammable). The non-dimensional fluid properties agree well, with a
maximum deviation of 8% for the density far away from the pseudo-critical point. Some
relevant pseudo-critical fluid properties and scaling values are indicated in Table 1. Through
linear stability analysis of a channel with supercritical water and of its scaled R23
counterpart, it was shown that the scaling rules result in the same stability behaviour,
confirming the proposed scaling procedure and fluid selection (see Rohde et al., 2011).
Table 1: Comparison of selected pseudocritical properties of H2O and R23
and the considered scaling rules, Rohde et al. (2011) R23 H2O Scaling factor
Pressure (MPa) 5.7 25 Length 0.191
Temperature (°C) 33.2 384.9 Diameter 1.06
Density (kg/m³) 537 316.82 Power 0.0788
Enthalpy (kJ/kg) 288.3 2152.9 Mass flux 0.74
Core inlet temperature (°C) -21 280 Time 0.438
Core exit temperature (°C) 105 500
Based on the derived scaling rules, an experimental facility has been constructed, named
‘DeLight’ (Delft Light water reactor facility). A schematic drawing is shown in Fig. 2 and
some of the dimensions are listed. The loop is constructed using stainless steel tubing (6mm
ID for the core sections, 10 mm ID for the riser and downcomer). The total height of the loop
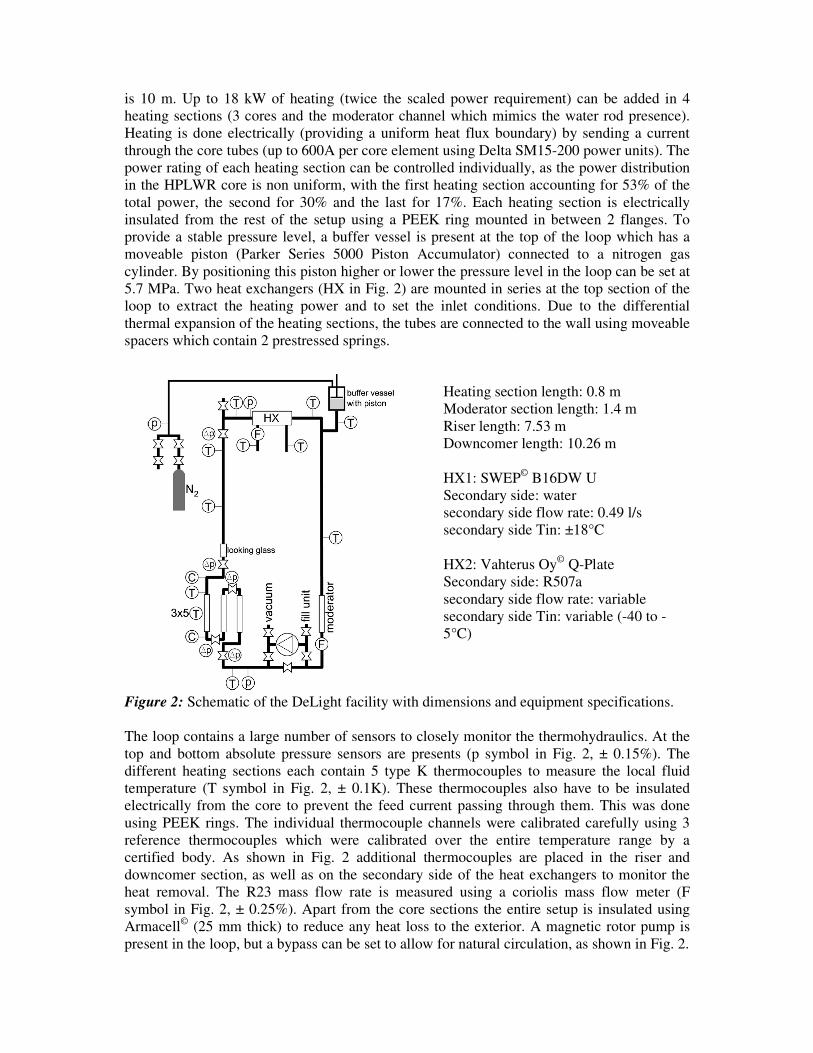
is 10 m. Up to 18 kW of heating (twice the scaled power requirement) can be added in 4
heating sections (3 cores and the moderator channel which mimics the water rod presence).
Heating is done electrically (providing a uniform heat flux boundary) by sending a current
through the core tubes (up to 600A per core element using Delta SM15-200 power units). The
power rating of each heating section can be controlled individually, as the power distribution
in the HPLWR core is non uniform, with the first heating section accounting for 53% of the
total power, the second for 30% and the last for 17%. Each heating section is electrically
insulated from the rest of the setup using a PEEK ring mounted in between 2 flanges. To
provide a stable pressure level, a buffer vessel is present at the top of the loop which has a
moveable piston (Parker Series 5000 Piston Accumulator) connected to a nitrogen gas
cylinder. By positioning this piston higher or lower the pressure level in the loop can be set at
5.7 MPa. Two heat exchangers (HX in Fig. 2) are mounted in series at the top section of the
loop to extract the heating power and to set the inlet conditions. Due to the differential
thermal expansion of the heating sections, the tubes are connected to the wall using moveable
spacers which contain 2 prestressed springs.
Figure 2: Schematic of the DeLight facility with dimensions and equipment specifications.
The loop contains a large number of sensors to closely monitor the thermohydraulics. At the
top and bottom absolute pressure sensors are presents (p symbol in Fig. 2, ± 0.15%). The
different heating sections each contain 5 type K thermocouples to measure the local fluid
temperature (T symbol in Fig. 2, ± 0.1K). These thermocouples also have to be insulated
electrically from the core to prevent the feed current passing through them. This was done
using PEEK rings. The individual thermocouple channels were calibrated carefully using 3
reference thermocouples which were calibrated over the entire temperature range by a
certified body. As shown in Fig. 2 additional thermocouples are placed in the riser and
downcomer section, as well as on the secondary side of the heat exchangers to monitor the
heat removal. The R23 mass flow rate is measured using a coriolis mass flow meter (F
symbol in Fig. 2, ± 0.25%). Apart from the core sections the entire setup is insulated using
Armacell©
(25 mm thick) to reduce any heat loss to the exterior. A magnetic rotor pump is
present in the loop, but a bypass can be set to allow for natural circulation, as shown in Fig. 2.
Heating section length: 0.8 m
Moderator section length: 1.4 m
Riser length: 7.53 m
Downcomer length: 10.26 m
HX1: SWEP©
B16DW U
Secondary side: water
secondary side flow rate: 0.49 l/s
secondary side Tin: ±18°C
HX2: Vahterus Oy©
Q-Plate
Secondary side: R507a
secondary side flow rate: variable
secondary side Tin: variable (-40 to -
5°C)
The data acquisition system consists of a PC with one National Instruments PCI-6259 data
acquisition card, connected to a National Instruments SCXI-1001 rack with two SCXI-1102B
32-channel amplifiers. This system is used for monitoring the experimental setup and for
recording sensor signals. The measured and processed data are displayed on a PC screen
which allows for continuous monitoring. Additionally, seven signals (three temperature
values, two pressure values, and the R23 and cooling water flow rates) are connected to a
separate stand-alone data acquisition system. This system is used for safety monitoring and
will shut down the power supplies if one of the signals exceeds prescribed limits. A third PC
is used to control the setup, setting the pressure level and the power input.
In order to mimic the behaviour of a nuclear reactor, neutronic feedback has to be included
within the setup. This feedback mimics the moderating effect of the water, whereby an
increase of the density (= lower temperature ~ drop in power) raises the moderating effect
and thus increases the probability of fission, which then again raises the power level to the
original level. This is described through the ‘reactivity’ of the
system. The artificial feedback is implemented by measuring the average core density ρ with
the help of the 15 installed thermocouples and the equation of state for the density (similar to
that used by Marcel et al., 2008). To allow for a fast computation, the equation of state was
implemented as a series of splines . The node points for the splines (NIST database
v.8) were carefully selected and spaced more closely near to the pseudocritical point. Once
the neutronic feedback is engaged, the measured density variations are used to calculate the
reactivity via Eq. (1). The change in power due to the reactivity feedback is then calculated
with the help of a linearized six-group, point-kinetic model (Duderstadt and Hamilton, 1976).
This model for the neutronic feedback was also used by Yi et al. (2004). The precursor decay
constants and fractions can be found in Table 2 and the delayed neutron faction β was set to
0.0056. These values were obtained from Ortega-Gomez (2009), but because of the time
scaling in the facility, the decay constants need to be modified using the time scaling. The
mean generation time was set to 22 µs, which is the scaled equivalent of a BWR, taken from
Marcel et al. (2008). The density coefficient of the reactivity ,
is defined based on the work of Schlagenhaufer et al. (2007) who studied the density
feedback in the HPLWR. This value also needed to be scaled.
(1)
Table 2: Delayed neutron fractions and decay time constants used, Ortega-Gomez (2009) fractions Decay constants
β1 0.038 λ1 0.0290
β2 0.213 λ2 0.0724
β3 0.188 λ3 0.263
β4 0.407 λ4 0.710
β5 0.128 λ5 3.20
β6 0.026 λ6 8.84
Using the point-kinetics equations, the instantaneous change of fission inside the fuel pellets
is determined based on the density pertubation. In reality however, there is a time delay
between the release of the fission energy and the moment when the coolant is exposed to a
change in heat flux. This is because of the finite pellet size and its thermal conductivity. This
time delay was modeled as a first order process with a time constant of 6 seconds. This value
is based on earlier experimental work on the ESBWR fuel rods (Van der Hagen, 1988).
Because this value is related to the actual dimensions of the fuel rod and its inner gap, it can
vary significantly between the different reactor designs which are currently being studied. It

can be as low as 2 seconds. Therefore this value will be varied in this study, to determine its
effect on the stability.
EXPERIMENTAL PROCEDURE
To experimentally determine the stability behaviour, the following procedure was used. First,
the pump was used to start the circulation in the loop and a small amount of heating was
added (1.5 kW). The pump was then switched off and bypassed, resulting in a naturally
circulation. The pressure was then raised above the critical pressure and the cooling setup
was turned on. By simultaneously controlling the position of the piston and slowly
incrementing the added heat, the system was brought to the required testing conditions (5.7
MPa, and a specified power input in the HPLWR distribution). To control the inlet
temperature, the expansion pressure on the secondary side of HX2 was set to levels such as -
38°C, -30°C, -20°C… To reach values in between or for finer control of the inlet
temperature, the moderator section at the bottom of the downcomer (see Fig. 2) was used. By
adding more or less heat to this section, the temperature could be controlled to within 0.2°C,
and this was used to set intermediate inlet temperatures. To judge if the system was stable, a
number of signals were monitored: three temperatures (core inlet and outlet and heat
exchanger outlet): variation < 0.2 °C, and the absolute pressure variations in the loop (<
0.025 MPa).
Once a steady state situation has been reached, the measurement was started. First over a
period of 2 minutes the average core density is recorded. Then the neutronic feedback would
be switched on. If the system is unstable, the neutronic feedback results in a fluctuating
power input with a growing amplitude. These signals would then be recorded until saturation
is reached. The saturation value was set to 10% of the power input to prevent large pressure
fluctuations in the loop. If the system was stable, and no large oscillations were present two
minutes after switching on the feedback, a step increase in the power (250 or 500W) was
done for 5 seconds. The decaying signal was then recorded until it was no longer
distinguishable. Once the measurement was completed the power was raised by 250W and
the next point was recorded. This was continued until the signal variations were no longer
measurable. The power was then increased to the next power level to measure the next point.
This was continued until the core exit temperature exceeded 110°C (safety limit). The
instabilities could be seen in all the recorded signals but they were most apparent in the
temperature signals. So it was decided to use the inlet temperature signal of the riser as input
for the signal analysis. Two examples of this measured temperature are shown in Fig. 3.
Figure 3: Examples of a measured stable (A) and unstable (B) temperature signal

These temperature signals were then processed using signal analysis tools. All the sensor
signals are sampled with a frequency of 120 Hz and then resampled to 20 Hz. Before
resampling, the signals are filtered with a cut-off frequency of 9Hz. This was done using a
digital filter implemented in Matlab©
. The resampling is done by taking a running average of
6 samples. These resampled data values were then used to determine the decay ratio ‘DR’.
This was done by fitting the equation to the first
two periods of the auto correlation function (ACF) of the signal. The DR is then defined by
equation (2). These equations have been derived based on the work of Marcel (2007) for a
natural circulation BWR. As an extra check for the resonance frequency, the auto power
spectral density is also determined, verifying it contains a single well defined peak at the
frequency f. In the following section the measured DR values will be presented.
22 b
DR e
π
ω
⋅ ⋅
= (2)
RESULTS
To represent the results in a more general form, a set of non-dimensional numbers are
required. Because previous studies have used different formulations of the 1D transport
equations, different non-dimensional units were derived to show the results. These numbers
are mostly inspired by the earlier work done on boiling systems, seeking to extend the
concept of the subcooling number and the phase change number into the supercritical range,
as can be read in Ortega Gómez (2009) and Ambrosini and Sharabi (2008). Rohde et al.
(2011) proposed a scaling procedure to preserve the stability behavior of a supercritical loop
and suggested the pseudo phase change number NPCH and subcooling number NSUB (Eqs. (3)-
(4)), using the pseudo-critical enthalpy hpc as reference (288.03 kJ/kg). NPCH represents the
ratio of the power input (heat flux q” multiplied by the tube length L and the wetted perimeter
Ph) to the mass flow rate (mass flux G multiplied by the flow surface area A).
pcin
h
PCHhAG
LPqN
⋅⋅
⋅⋅=
" (3)
( )pc
inpc
SUBh
hhN
−= (4)
Steady-state power to flow map
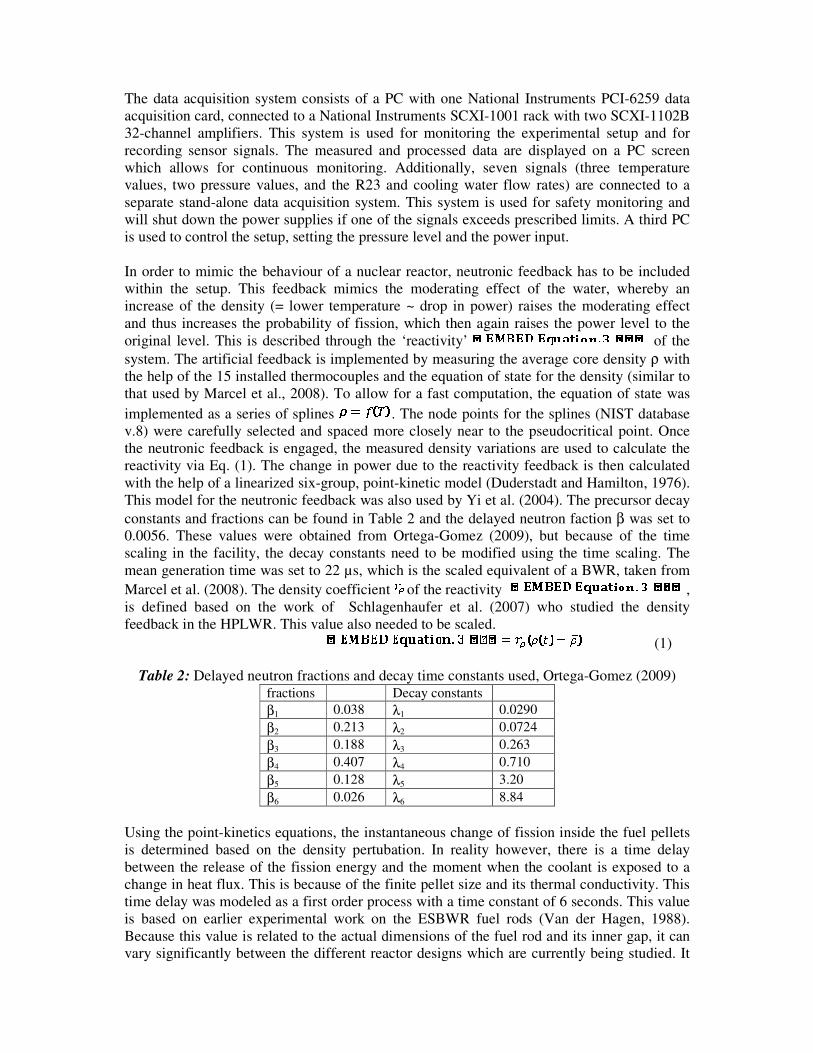
Figure 4 shows three measured power flow curves for various inlet temperatures. As can be
seen, these series show the expected trend: as the power increases, first the flow rate
increases as well. This is due to the increased density difference that drives the flow. Starting
from a given power the flow rate begins to decrease again. This is due to the increasing
friction within the loop, which increases sharply as the velocity goes up (decreasing density).
Furthermore, increasing the inlet subcooling relative to the pseudo-critical point increases the
flow rate, and shifts the maximum flow rate to a higher power. By increasing the subcooling
at the inlet, the inlet density goes up, requiring thus a larger amount of heating in order to
make it sufficiently low so that friction can balance the increased driving force. Note how the
slope of the second half of the power flow curve becomes steeper at increased subcooling.
These trends are consistent with the published numerical work on supercritical loops (Jain
and Uddin, 2008 and Sharma et al., 2010).
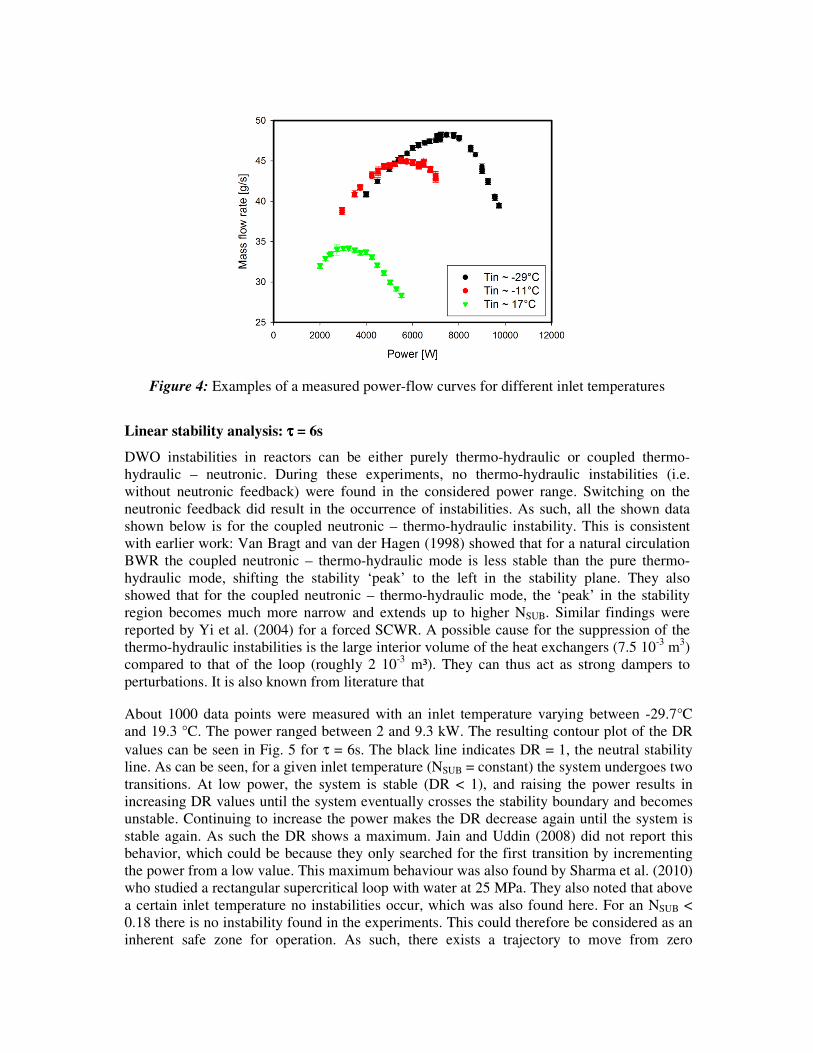
Figure 4: Examples of a measured power-flow curves for different inlet temperatures
Linear stability analysis: ττττ = 6s
DWO instabilities in reactors can be either purely thermo-hydraulic or coupled thermo-
hydraulic – neutronic. During these experiments, no thermo-hydraulic instabilities (i.e.
without neutronic feedback) were found in the considered power range. Switching on the
neutronic feedback did result in the occurrence of instabilities. As such, all the shown data
shown below is for the coupled neutronic – thermo-hydraulic instability. This is consistent
with earlier work: Van Bragt and van der Hagen (1998) showed that for a natural circulation
BWR the coupled neutronic – thermo-hydraulic mode is less stable than the pure thermo-
hydraulic mode, shifting the stability ‘peak’ to the left in the stability plane. They also
showed that for the coupled neutronic – thermo-hydraulic mode, the ‘peak’ in the stability
region becomes much more narrow and extends up to higher NSUB. Similar findings were
reported by Yi et al. (2004) for a forced SCWR. A possible cause for the suppression of the
thermo-hydraulic instabilities is the large interior volume of the heat exchangers (7.5 10-3
m3)
compared to that of the loop (roughly 2 10-3
m³). They can thus act as strong dampers to
perturbations. It is also known from literature that
About 1000 data points were measured with an inlet temperature varying between -29.7°C
and 19.3 °C. The power ranged between 2 and 9.3 kW. The resulting contour plot of the DR
values can be seen in Fig. 5 for τ = 6s. The black line indicates DR = 1, the neutral stability
line. As can be seen, for a given inlet temperature (NSUB = constant) the system undergoes two
transitions. At low power, the system is stable (DR < 1), and raising the power results in
increasing DR values until the system eventually crosses the stability boundary and becomes
unstable. Continuing to increase the power makes the DR decrease again until the system is
stable again. As such the DR shows a maximum. Jain and Uddin (2008) did not report this
behavior, which could be because they only searched for the first transition by incrementing
the power from a low value. This maximum behaviour was also found by Sharma et al. (2010)
who studied a rectangular supercritical loop with water at 25 MPa. They also noted that above
a certain inlet temperature no instabilities occur, which was also found here. For an NSUB <
0.18 there is no instability found in the experiments. This could therefore be considered as an
inherent safe zone for operation. As such, there exists a trajectory to move from zero

power/low inlet temperatures towards high power/high inlet temperatures, something that is
impossible for natural circulation BWR’s as the boiling boundary and the neutral stability
boundary cross each other at the origin of the stability plane. Such a trajectory might be
exploited during the start-up phase of the HPLWR as long as the reactor vessel can be
pressurized beforehand.
Figure 5: Contourplot of the measured DR values for τ = 6s, HPLWR power distribution.
The DR plot is similar to that of a natural circulation driven BWR, see Van Bragt and Van
der Hagen (1998). In such a system, for a given subcooling number, the flow will undergo
three transitions: (i) from stable to unstable, crossing the boiling line hout = hsat and moving
towards the low frequency type-I instability, (ii) from unstable to stable and (iii) then, at
higher power, again from stable to unstable, moving towards the high frequency type-II
instability. The measured frequency for these instabilities is about 0.1 Hz. In Fig. 5 the
supercritical equivalent of the boiling line, the ‘reference line’, hout = hpc is shown as a black
dashed line. As can be seen, the instabilities occur very close to this line. As the density of a
supercritical fluid is a continuous function (compared to the step change for a boiling
medium), it should be clear that even if the temperature at the outlet is lower than Tpc, a
strong density gradient occurs, which can trigger instabilities. So this ‘reference line’ can’t be
a fixed boundary for a supercritical system, as it is for a BWR. As such, the location of the
instabilities in the stability plane and the recorded frequencies both clearly suggest that these
instabilities are in fact the supercritical analogue of the type I instability in a BWR.
The instability threshold moves almost parallel to the reference line at NSUB > 0.27. This
suggests that an exit temperature close to Tpc could be used as a criterion for instability. The
graphs reported by Sharma et al. (2010) show a similar trend for the thermo-hydraulic mode.
They also showed that this first transition is insensitive to the loop height and local friction
distribution (though only small variations was examined). This indicates that this boundary is
a more general property of a supercritical loop, which is consistent with the aforementioned
idea of extending the reference line from type I instabilities of BWR.
Impact of the fuel time constant
The fuel time constant has a strong effect on the stability of the system. This is highlighted in
Fig. 6. Increasing the fuel time constant results in a more unstable system. It increases the
size of the instable zone, shifting it to lower NPCH and NSUB. The peak value of the DR also
increases considerably. For τ = 2s the peak value is about 1.3, whereas for τ = 6s this is
almost 2.5. The frequency remains unaffected, and is about 0.1-0.12 Hz for all measured
instabilities. This shows that the fuel time constant is an important system parameter for the
coupled neutronic – thermo-hydraulic instability in a supercritical loop. As this is related to
the size of the fuel rods, it is an important design parameter to consider for the safe operation
of the system in natural circulation mode.
0.3 0.4 0.5 0.6 0.70.15
0.2
0.25
0.3
0.35
0.4
Nsub
0.3 0.4 0.5 0.6 0.7
0.3 0.4 0.5 0.6 0.7
N∆h
0.5
1
1.5
2
Figure 6: Contourplots of the measured DR values for τ = 2s (A), τ = 4s (B) and τ = 6s (C),
HPLWR power distribution. The black line indicates the stability threshold, and the dashed
line the ‘reference’ line
Impact of the power distribution
Because of the three pass core layout, whereby the evaporator is located at the center of the
HPLWR, and superheater I and II concentrically around it, the power distribution per ‘pass’
is very different. The power distribution is 53% for the evaporator section, 30 for superheater
I and 17% for superheater II (Fisher et al., 2007). This power distribution will have an effect
on the density profile in the core, and as such on the stability of the system. To determine
how strong the power distribution affects the stability, a uniform power distribution was
considered here. Each pass then provides one third of the total power. The fuel time constant
was set to 6 seconds. The results are shown in Fig. 7. As can be seen, the uniform power
distribution is considerably more stable, as the unstable zone is shifted to higher NPCH. The
left boundary still runs parallel to the reference line, but is shifted to the right. The location of
the tip is shifted to slightly higher NSUB. The shift to higher power is related to the reduced
density gradients occurring in the core sections, as the power is spread out more evenly. This
also reduces the mean friction at a given power level, as the average core density is higher,
lowering the mean core velocity. This shows that the power distribution is another important
parameter to consider in the reactor design, not only from a neutronic point of view for the
final power output, but also considering the stability of the natural circulation.
A B C

Figure 7: Contourplot of the measured DR values for τ = 6s, uniform power distribution.
CONCLUSIONS
An experimental study was performed on the thermo-hydraulic and coupled neutronic –
thermo-hydraulic stability of a natural circulation HPLWR. This was done with the scaled
DeLight facility using Freon R23 at 5.7 MPa. The result show there are no pure thermal-
hydraulic instabilities, but applying the neutronic feedback does result an unstable zone for
certain operating conditions. The measured frequency and the location in the stability plane
indicate that the found instabilities are in fact the supercritical equivalent of the type I
instabilities of a natural circulation BWR. A parameter study was performed by examining
the impact of the power distribution and the fuel time constant on the nature of the
instabilities. Lowering the fuel time constant and making the power distribution more
uniform both make the system more stable. These results show how that the design of the fuel
rods (size and enrichment) and the layout of the core are not only important from the point of
view of the power generation or the heat transfer, but are also very important when
considering a natural circulating system.
ACKNOWLEDGEMENTS
The authors would like to express gratitude to the Netherlands Organization for Scientific
Research (NWO), project number 680-47-119 and to the EU FW7 THINS project, which
provided support for the current study and thank Mr. D. De Haas and P. van der Baan for
their technical expertise in designing and building the setup as well as setting up the data
acquisition and analysis tools.
REFERENCES
Ambrosini, W., Sharabi, M., 2008, Dimensionless parameters in stability analysis of heated
channels with fluids at supercritical pressures, Nuclear Engineering and Design 238, 1917-
1929
Bouré, J.A., Bergles, A.E., Tong, T.S., 1973, Review of two-phase flow instability, Nuclear
Engineering and Design 25, 165-192
Buongiorno, J., MacDonald, P.E., Supercritical water reactor (SCWR), progress report for
the FY-O3 Generation IV R&D activities for the development of the SCWR in the U.S.,
Report INEEL/EXT-03-01210, 38 pages, 2003.
Duderstadt, J.J., Hamilton, L.J., Nuclear reactor analysis, John Wiley & Sons, 1976
Fischer, K., Schulenberg, T., Laurien, E., 2009, Design of a supercritical water-cooled
reactor with a three-pass core arrangement, Nuclear Engineering and Design 239, 800-812
Hofmeister, J., Waata, C., Starflinger, J., Schulenberg, T., Laurien, E., 2007, Fuel assembly
design study for a reactor with supercritical water, Nuclear Engineering and Design 237,
1513-1521.
Jang, B.-I., Kim, M.H., Jeun, G., 2011, Experimental and computational investigation of a
natural circulation system in Regional Energy Reactor – 10 MWth, Nuclear Engineering and
Design 241, 2214-2223
Jain, R., 2005, Thermal-hydraulic instabilities in natural circulation flow loops under
supercritical conditions, Ph.D. Thesis, University of Wisconsin Madison, USA
Jain, P.K. , Uddin, R., 2008, Numerical analysis of supercritical flow instabilities in a natural
circulation loop, Nuclear Engineering and Design 238, 1947-1957.
Lomperski, S., Cho, D., Jain, R., Corradini, M.L., 2004, Stability of a natural circulation loop
with a fluid heated through the thermodynamic pseudocritical point, Proceedings of
ICAPP’04, Pittsburgh, PA, USA, June 13-17
Marcel, C.P., 2007, Experimental and Numerical Stability Investigations on natural
Circulation Boiling Water Reactors, Ph.D. Thesis, Delft University of Technology
Marcel, C.P., Rohde, M., Van der Hagen, T.H.J.J., 2008, Experimental investigations on the
ESBWR stability performance, Nuclear Technology 25, 232-244
March-Leuba, J., Rey, J.M., 1993, Coupled thermohydraulic-neutronic instabilities in boiling
water nuclear reactors: a review of the state of the art, Nuclear Engineering and Design 145,
pp. 97-111
Ortega-Gomez, T., 2009, Stability analysis of the High Performance Light Water Reactor,
Ph.D. Thesis, Forschungszentrum Karlsruhe, Institute for nuclear and energy technologies,
University of Karlsruhe
Rohde, M., Marcel, C.P., T’Joen C., Class, A., Van der Hagen, T.H.J.J., 2011, Downscaling a
supercritical water loop for experimental studies on system stability, International Journal of
Heat and Mass Transfer 54, pp. 65-74
Schlagenhaufer, M., Vogt, B., Schulenberg, T., 2007, Reactivity control mechanisms for a
HPLWR fuel assembly, Proceedings of Global 2007, 934-943, Boise, ID, USA, September
9–13.

Sharma, M., Pilkhwal, D.S., Vijayan, P.K., Saha, D., Sinha, R.K., 2010, Steady state and
linear stability analysis of a supercritical water loop, Nuclear Engineering and Design 240,
588-59
Van Bragt, D.D.B., T.H.J.J. van der Hagen, 1998, Stability of natural circulation boiling
water reactors: part II: parametric study of coupled neutronic-thermohydraulic instabilities,
Nuclear Technology 121, 52-62
Van der Hagen, T.H.J.J., 1988, Experimental and theoretical evidence for a short effective
fuel time constant in a boiling water reactor, Nuclear Technology 83, 87-97
Yi, T.T., Koschizuka, S., Oka, Y., 2004, A linear stability analysis of supercritical water
reactors (II): coupled neutronic thermal-hydraulic instability, Journal of Nuclear Science and
Technology 41, 1176-1186
Related Documents