NBER WORKING PAPER SERIES FINANCIAL INTERMEDIATION IN THE UNITED STATES Benjamin M. Friedman Working Paper No. 1451 NATIONAL BUREAU OF ECONOMIC RESEARCH 1050 Massachusetts Avenue Cambridge, MA 02138 September 198)4 The research reported here is part of the NBER's research program in Financial Markets and Monetary Economics. Any opinions expressed are those of the author and not those of the National Bureau of Economic Research.

Welcome message from author
This document is posted to help you gain knowledge. Please leave a comment to let me know what you think about it! Share it to your friends and learn new things together.
Transcript

NBER WORKING PAPER SERIES
FINANCIAL INTERMEDIATION INTHE UNITED STATES
Benjamin M. Friedman
Working Paper No. 1451
NATIONAL BUREAU OF ECONOMIC RESEARCH1050 Massachusetts Avenue
Cambridge, MA 02138September 198)4
The research reported here is part of the NBER's research programin Financial Markets and Monetary Economics. Any opinionsexpressed are those of the author and not those of the NationalBureau of Economic Research.

NBER Working Paper #1451September 1984
Financial Intermediation in the United States
ABSTRACT
The principal rationales that give rise to financial intermediationare benefits of size and specialization, the diversification of specificasset risks, and the pooling of even broader classes of risk. Each is asignificant factor in accounting for the U.S. economy's reliance on intermediation.In addition, since World War II a further important factor has been theeconomy's continual shift away from government debt toward the debt ofprivate nonfinancial entities including individuals and businesses. Nonfinancialinvestors (primarily individuals) have exhibited a strong preference forholding the debt of these nonfinancial borrowers via financial intermediariesrather than directly.
As the U.S. economy's reliance on financial intermediaries overall hasincreased during the post—war period, some specific kinds of intermediaryinstitutions have grown more rapidly than others. Commercial banks have aboutheld their own in relative terms, while steadily shifting their basicbusiness back toward lending activities and away from securities investments.NDnbank deposit intermediaries have grown in relation to overall economicand financial activity, as the growth of savings and loan associations hasmore than offset the (relative) decline of mutual savings banks. Amongprivate nondeposit intermediaries, life insurance companies have declinedin relative terms while both public and private sector pension funds haveshown exceptionally rapid growth. Finally, the federal government's participationin the financial intermediation process in the United States has alsoincreased rapidly during these years, in part as a result of the pressurescreated bj the economy's shift to private instead of government debt.
Benjamin M. FriedmanHarvard UniversityDepartment of EconomicsLittauer Center 127Cambridge, MA 02138(617) 495—4246
Be vised
June, 1984
FINANCIAI INTERMEDIATION IN THE UNITED STATES*
Benjamin M. FriedmanHarvard University
The intermediating function provided by specialized institutions
has always been a hallmark of well developed financial markets. In the
modern economy almost everyone participates in the financial markets, and
few economic events take place without their financial counterpart. The
basic role of the financial markets is to enable millions of businesses
and individuals to carry out, more easily and more efficiently, the inter-actions that their activities in the nonfinancial economy entail. Although
in principle businesses and individuals could carry out their financial
dealings directly, without the advantages of intermediary services,
in most cases doing so would be inconsistent with the underlying reason
for having and using financial markets in the first place. Intermediation
renders financial transactions more efficient, and therefore increases
the use that both businesses and individuals make of financial markets.
In addition, in some instances financial intermediaries enable market
participants to achieve objectives that would be unattainable in their
absence.
This important role played by financial intermediation is typically
not static. Throughout their history financial markets have undergone
a shift — away from direct transactions between nonfinancial borrowers and
lenders, toward the intervention of financial intermediaries. In the
United States the development of the commercial banking system and of the
life insurance industry in earlier years, and more recently the great
expansion of nonbank deposit institutions and both private and public
—2—
sector pension funds, have been important features of the development of
the U.S. financial system. In addition, the roles played even by specific
intermediary institutions change over time. The shifting requirements
of the nonfinancial economy, the evolution of new communications and
information processing technologies, changes in government regulations,
and even independent financial innovations, all play a part in this dynamic
process.
The goal of this chapter is to examine the structure of financial
intermediation in the United States, both as it exists today and as it has
evolved in the years since World War 11.1 The primary focus is on the
role played by intermediation in general, and by specific kinds of inter-
mediaries in particular, in fulfilling the financial markets' basic purpose
of serving the needs of the nonfinancial economy.
Section 1 notes explicitly several of the main rationales underlying
the use of financial intermediation. Section 2 relates these considerations
to the observed portfolio behavior of participants in the U.S. financial
markets other than financial intermediaries, including especially the
household sector. Section 3 quantifies the role of financial intermediaries,
at the aggregate level, in the United States. Section 4 details the
respective roles of several specific kinds of intermediaries, including
commercial banks, nonbank deposit institutions, life insurance companies
and pension funds, and federally sponsored intermediaries. Section 5
briefly summarizes the chapter's principal points.
—3—
1. Rationales for Financial Intermediation
Three basic rationales typically motivate the reliance on financial
intermediaries in the modern economy: benefits of size and specialization,
when there are economies of scale in gathering information or in processing
transactions; diversification of specific asset risks, when asset holders
are risk averse; and pooling of liquidity or other risks, when asset
holders themselves face uncertain contingencies.
1.1. Benefits of Size and Specialization. Many economic activities
exhibit economies of scale, at least up to a point1 and what takes place
in the financial markets is no exception. At the simplest level, the data
processing equipment needed to process many financial transactions efficiently
is expensive. Acquiring it to meet the sole needs of any financial market
participants but a few of the largest businesses would be out of the
question. The obvious solution is sharing effected by reliance on specialized
institutions.i analogous argument applies to the human capital represented by
the specific knowledge required either to operate sophisticated equipment
or to perform the purely human aspects of financial transactions. The kinds
of human capital involved in the services provided by financial intermediaries
go well beyond mere transactions processing, however. The existence of
assets bearing uncertain returns, due to either market or specific risk,
creates a need for information-related activities; Holders of such assets
must first discover the attendant risks, and then monitor them on an ongoing
basis. These information costs are especially large in the case of
negotiated loans like home mortgages, consumer credit, and bank loans
to businesses, although some kinds of securities investments have similar
characteristics. Once again, the obvious solution is for most asset holders

—4—
to delegate these information gathering and monitoring costs to specialized
third parties.
In some cases economies of scale are sufficiently great that assets
simply become indivisible beyond set limits. Many kinds of investments
available in today's financial markets have minimum transaction sizes.
Real estate assets are a common example, as are participations in newly
created business enterprises. In principle, of course, an investor could
directly obtain a smaller unit size at some price, but in practice no one
does so. In such cases the more straightforward, and economically more
sensible, approach to such indivisibilities is to hold the relevant assets
through intermediaries.
1.2. Diversification of Specific Asset Risks. Investors who are
risk averse care not just about the most likely return associated with their
asset holdings but also about the uncertainty associated with that return.
For a given level of uncertainty, of course, investors presumably prefer
a higher expected return to a lower one. Conversely, for a given expected
return, risk averse investors prefer less uncertainty to more.
When different assets bear specific risks that are not perfectly
correlated — as is the case, for example, among equity investments in
different companies — investors can reduce the level of uncertainty
associated with the return to their overall portfolios by holding a diverse
mix of assets rather than only one. By doing so they can take advantage
of the imperfect correlation among the individual asset returns, in effect
exploiting the "law of large numbers" as some assets end up delivering
higher than expected returns and others lower, to achieve a total portfolio
return more likely to fall within any stated range above or below the
associated expected return.

—5—
Such diversification is, in essence, the motivation behind mutual
funds. A risk averse investor is better off, in the sense of facing less
uncertainty for a given expected return, holding a diversified portfolio
of equities rather than just one stock. The same argument holds for
mortgages, consumer and business loans, and a wide variety of other assets.
Pther than betting on whether any single borrower will default, a risk averse
investor is in each case better off holding a portfolio of many such loans.
Because of indivisibilities and economies of scale in asset holding,
however, this kind of diversification is not feasible for most individuals
or for most nonfinancial businesses acting on their own. Few investors
have sufficient capital even to acquire well diversified equity portfolios
consisting of round lots of each security. Fewer still have sufficient
capital to acquire and service portfolios of mortgages or other loans.
The obvious solution is to achieve the required diversification through
intermediation. Financial intermediaries in effect transform assets,
therefore, holding assets subject to specific risk while issuing against
them claims in which these specific risks are largely diversified away.
1.3 Risk Pooling. Risks associated with their portfolios of
financial assets are hardly the only kind of risks that individuals and
businesses face in today's environment. At the individual level, people
can lose their jobs, suffer expensive illnesses, have automobile accidents,
or see their houses burned or burgled. Businesses face many of the same
contingencies, as well as more directly business—connected risks like weak
market demand, delivery failures, or lawsuits.
The pooling of such risks via explicit insurance arrangements is
a long-standing practice, and both life and casualty insurance have been
familiar examples of financial intermediation for centuries. By insuring

—6—
against a specific contingency, an individual or business in effect accepts
a cost equal to the average incidence of that contingency within the
insured population. Although it is possible to imagine such insurance
taking place in abstraction from any financial intermediation per se, in
practice almost all insurance arrangements guarantee performance through
the holding of financial reserves. Moreover, certain forms of life
insurance have traditionally combined saving and risk pooling features.
Risk spreading via financial intermediation goes well beyond
insurance arrangements, however. Banks and other deposit intermediaries
in effect pool the liquidity needs of many individual and business depositors.
Just as risk pooling makes sense in an insurance context because it is
highly improbable that all houses will burn or all automobiles will crash
in any year, deposit intermediation is advantageous because not all
depositors are likely to want to withdraw their funds on the same day,
or even in the same week or month. Deposit intermediaries in effect
exploit the imperfect correlation among depositors' uncertain liquidity
requirements to achieve yet.a further kind of asset transformation, holding
portfolios that may consist mostly of highly illiquid assets while issuing
against them claims which each depositor can rightly regard as fully
liquid. Even some nondeposit intermediaries, like open—ended mutual funds,
perform an analogous transformation.
Because of these three basic economic effects achieved by the
intermediation process —exploitation of economies of scale, diversification
of specific asset risks, and risk pooling — the development of intermediation
in general and of specific intermediary institutions has typically paralleled,
and has often spurred, the evolution of modern financial markets.

—7—
2. The Portfolio Behavior of Nonfinancial Investors
The function of the financial markets in any economy is to provide
for the needs of participants in the nonfinancial economy. On one side,
individuals and businesses come to these markets to find financial resources,
seeking to issue claims of various forms in exchange for those resources.
At the same time, others come with resources to deploy, seeking to acquire
in exchange for them some kind of claim on resources in the future. The
unwillingness of some individuals and businesses to hold directly the
claims that others issue creates the need for intermediation.
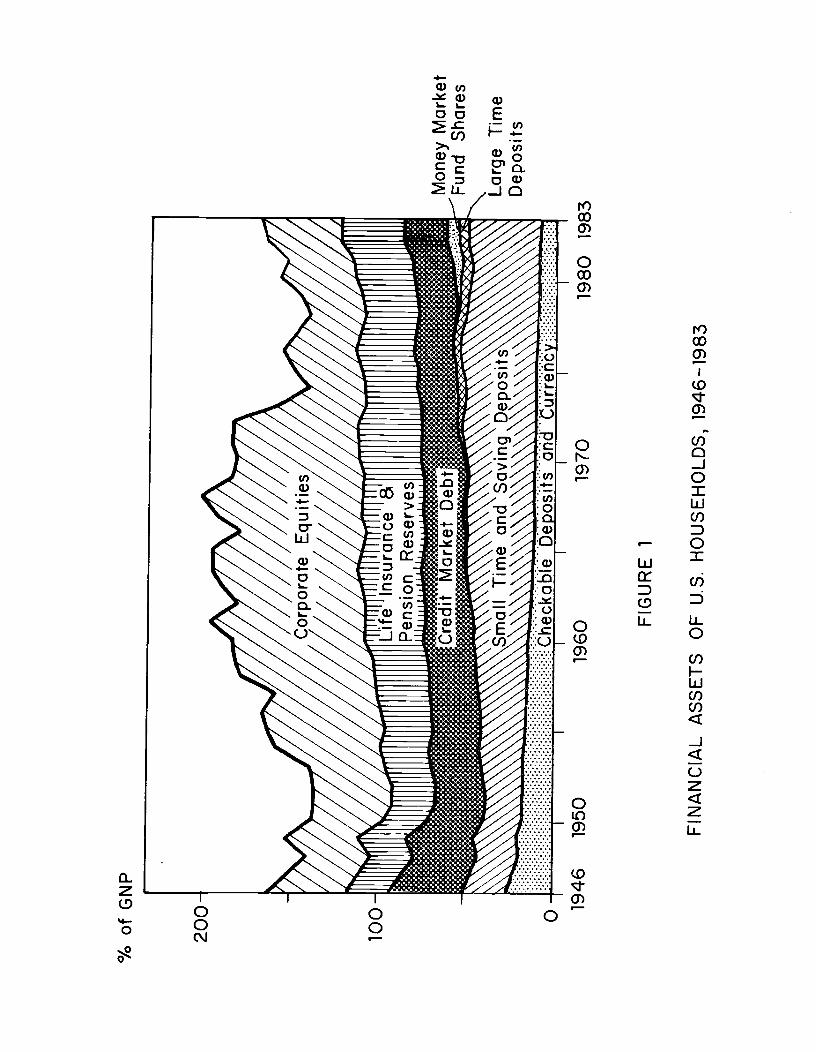
2.1. Households. In the United States individuals are the principal
nonfinancial holders of assets that represent direct claims on other
nonfinancial participants in the economy. Figure 1 shows that U.S.
households have shifted the composition of their financial asset portfolios
in important ways during the post-war period.2 Households' aggregate
holdings of deposit—type liabilities of financial intermediaries have
grown continually from the early l950s to the early l980s, not only
absolutely but in relation to overall nonfinancial economic activity (and
personal income). Households' claims on insurance and pension reserves
have also grown on balance during the post—war years, although here the
growth has been less steady because of the effect of equity price changes
on the valuation of these reserves. By contrast, households' direct
holdings of nonintermediated debt have declined in relative terms almost
continually since World War II, and their direct holdings of equity claims
on business corporations have varied mostly with equity price fluctuations,
exhibiting little overall relative trend.3 Since the total size of
households' financial asset portfolios in relation to gross national product
has also shown no overall trend — first declining during the immediate
% o
fGN
P
200
100 0 19
46
FIG
UR
E 1
FIN
AN
CIA
L A
SS
ET
S
OF
U.S
. H
OU
SE
HO
LDS
, 194
6-19
83
1950
19
60
1970
19
80
1983
—8—
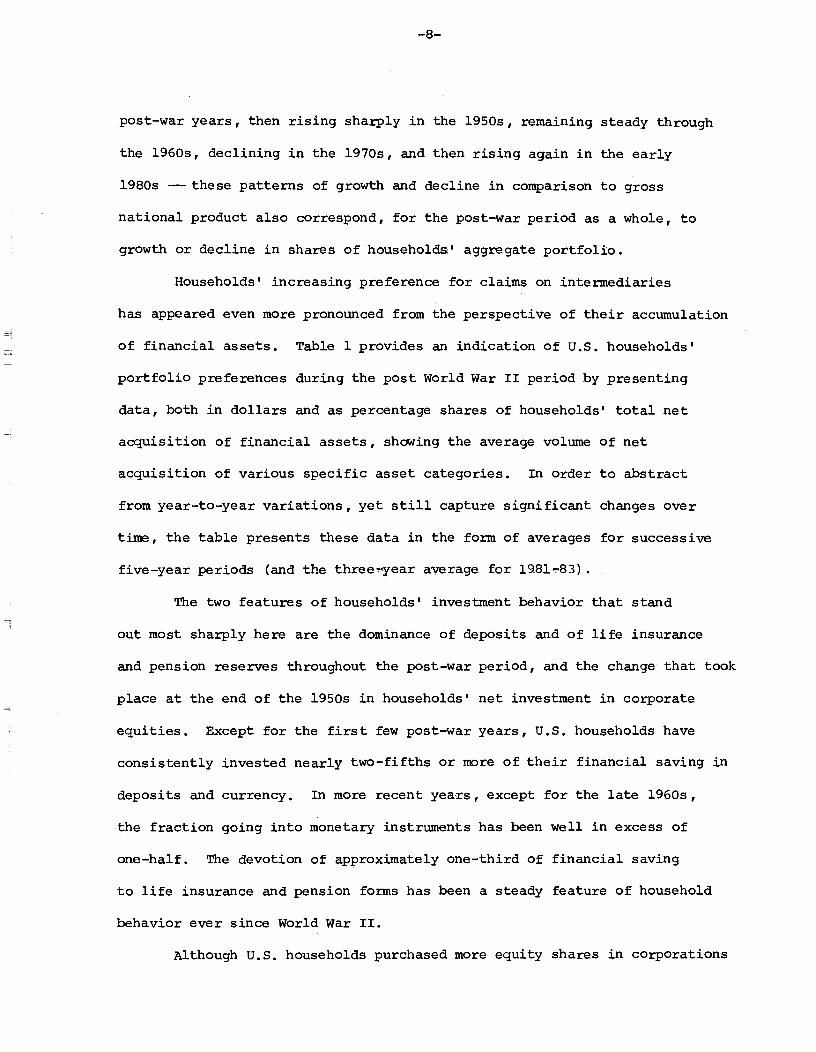
post-war years, then rising sharply in the 1950s, remaining steady through
the 1960s, declining in the l970s, and then rising again in the early
1980s — these patterns of growth and decline in comparison to gross
national product also correspond, for the post—war period as a whole, to
growth or decline in shares of households.' aggregate portfolio.
Households' increasing preference for claims on intermediaries
has appeared even more pronounced from the perspective of their accumulation
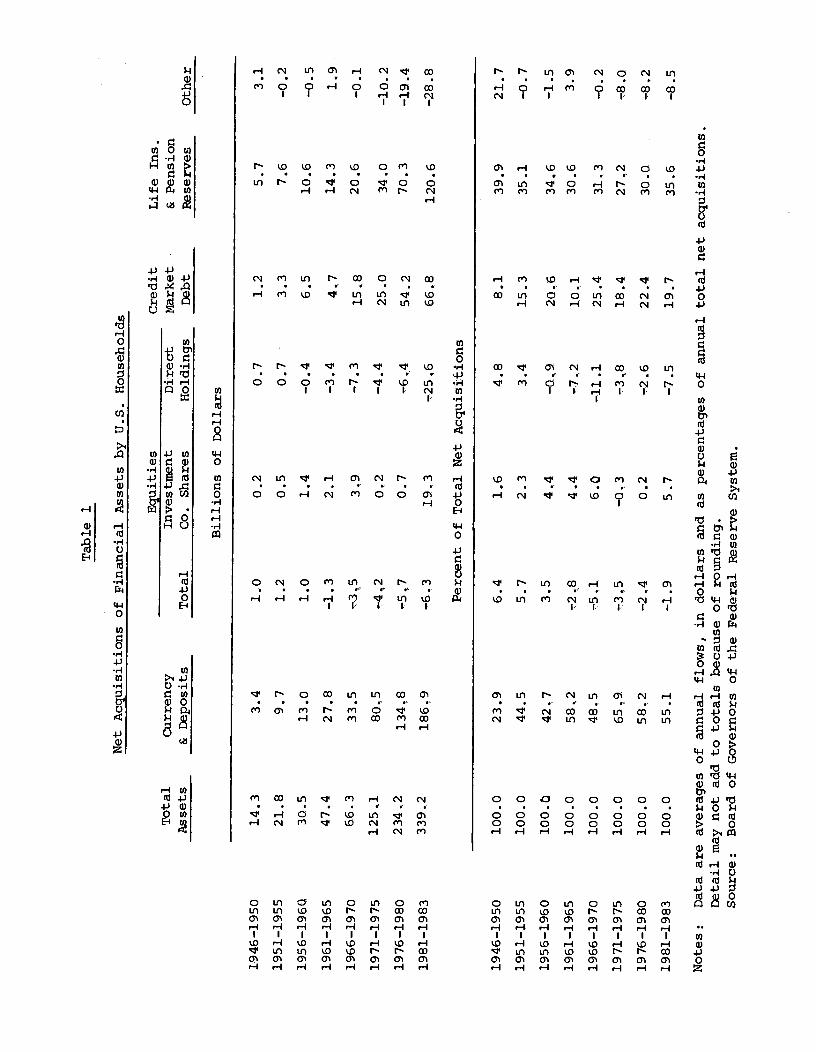
of financial assets. Table 1 provides an indication of U.S. households'
portfolio preferences during the post World War II period by presenting
data, both in dollars and as percentage shares of households' total net
acquisition of financial assets, showing the average volume of net
acquisition of various specific asset categories. In order to abstract
from year—to—year variations, yet still capture significant changes over
time, the table presents these data in the form of averages for successive
five-year periods (and the three-year average for 1981-83)..
The two features of households' investment behavior that stand
out most sharply here are the dominance of deposits and of life insurance
and pension reserves throughout the post—war period, and the change that took
place at the end of the 1950s in households' net investment in corporate
equities. Except for the first few post—war years, U.S. households have
consistently invested nearly two-fifths or more of their financial saving in
deposits and currency. In more recent years, except for the late l960s,
the fraction going into monetary instruments has been well in excess of
one-half. The devotion of approximately one-third of financial saving
to life insurance and pension forms has been a steady feature of household
behavior ever since World War II.
Although U.S. households purchased more equity shares in corporations
Net Acquisitions
Table 1
of Financial ssets by U.S. Households
Billions of Dollars
Percent of Total Net Acquisitions
Total
Ps s
ets
Currency
& Deposits
Equ
ities
In
vest
men
t D
irec
t T
otal
C
o.
Shar
es
Hol
ding
s
Cre
dit
Mar
ket
Debt
Life Ins.
& Pension
Reserves
14.3
21.8
30.5
47.4
66.3
1251
234 ..
2
339.2
3.4
9.7
13.0
27.8
33.5
8O5
134.8
186.9
Other
1..0
1.2
1.0
—1.3
-'3 5
--4 2
.7
—6 •
3
0.2
0.5
1.4
2.1
3.9
0,2
0.7
19,3
0.7
0.7
—0.
4
—3.
4
—7. 3
—4.4
'6. .L
—25
,6
1.2
3.3
6.5
4,7
15.8
25.0
54.2
66
.8
5.7
7.6
10.6
14.3
20.6
34.0
70.3
120.
6
3.1
—0.2
—0.5
1,9
—0.1
—10
.2
—19.4
—28.8
1946
—19
50
1951
—19
55
1956—1960
1961—1965
1966—1970
1971—1975
1976—1980
1981—1983
1946—1950
100.0
23.9
6.4
1.6
4.8
1951—1955
100.
0 44
.5
5.7
2.3
3.4
1956
—19
60
100.0
42.7
4.4
—0,9
1961—1965
100.0
58,2
—2.8
4.4
1966—1970
100.0
48.5
—5.1
6.0
—11.1
1971—1975
100.0
65,9
—3,5
—0,3
1976—1980
100.0
582
—2,4
0.2
—2.6
1981—1983
100.0
55.1
—1.9
5.7
—7.5
Not
es:
Dat
a ar
e av
erag
es o
f an
nual
flo
ws,
in
dolla
rs a
nd a
s pe
rcen
tage
s of
ann
ual
Det
ail
may
not
add
to
tota
ls b
ecau
se o
f ro
undi
ng.
Sour
ce:
Boa
rd o
f G
over
nors
of
the
Fede
ral
Res
erve
Sys
tem
.
8.1
39.9
21.7
15.3
35.1
—0.7
20.6
34.6
—1.5
10.1
30
.6
3.9
25.4
31
,3
—02
18
.4
27,2
—
8.0
22,4
30
.0
—8.
2
19.7
35
.6
—8.
5
tota
l net acquisitions.

—9—
than they sold in every year during 1946-57, so that the tripling in value
of their direct equity holdings over this period represented the combined
result of capital gains and positive net purchases, in every year since
1958 they have sold more direct equity shares than they have purchased.
Capital gains have therefore accounted for more than all of the increase
in total value of their direct equity holdings during this period. Moreover,
allowing for the shift from direct ownership of equities to indirect
ownership via mutual funds does not alter this picture of individuals'
investment behavior. Households in the aggregate were net purchasers of
mutual fund shares during the rise of that industry in the l960s, and have
been again during 1980-83, but in neither period were mutual fund purchases
sufficient to offset the liquidation of their direct equity holdings.
During the 1970s households were net sellers of both direct equity
holdings and mutual fund shares. Hence the conclusion stands that equity
price movements have accounted for more than all of any increase in the
value of individuals' equity holdings for the past quarter century.
Because equity prices have fluctuated widely but shown little net gain
since the mid 1960s, even in nominal terms, the aggregate equity portfolio
of individuals in the United States has shown no trend movement in nominal
value and has declined in relative value during the last decade and more.
This shift of individuals' investment flows away from equities
during the second half of the post—war period probably reflects several
considerations in addition to the economies-of—scale and diversification
motives noted above as general advantages of intermediation. No doubt
changing birth rates, age distributions, and income levels have all played
some role. The increasing government provision of health, education and
income security benefits has also altered the objectives associated with

—10—
saving for many people. The growing importance of workers' claims on
future pension benefits, including job-specific pensions in both the
private and public sectors and also Social Security, has especially
changed many people's need to accumulate assets directly to finance their
retirement.4 Perceptions of the relative returns and risks associated
with different assets, including both debt and equity securities, have
also changed markedly during the post-war period. After the official
unpegging of bond prices in 1951, fixed—income securities became subject
to market risk in addition to inflation risk, and since the l970s both
inflation risk and market risk have increased dramatically. During most
of the l950s and 1960s renewed confidence in economic stability and
prosperity lessened fears of any collapse of equity values comparable to
that of 1929-33, and in addition many people regarded equities as a "hedge"
against price inflation.5 Following the rapid acceleration of inflation
and the poor performance of both equity prices and the U.S. economy during
the 1970s, however, prevailing opinion became progressively more skeptical
both of the economy's long—run growth prospects and of the usefulness of
equities as an inflation hedge.6
Apart from equities, holdings of direct claims against other
nonfinancial participants in the economy has always constituted a relatively
small fraction of U.S. households' aggregate portfolios. As Table 1 shows,
net acquisitions of such debt have accounted for less than one—fourth of
households' financial saving throughout the post-war period. Against this
background of households' aversion to holding direct claims in either debt or
equity form, the need for financial intermediation is readily apparent.
2.2. Other Nonfinancial Investors. Although individuals are the
dominant nonfinancial holders of direct claims on other nonfinancial
—11—
participants in the U.S. economy, businesses also advance a substantial
amount of direct credit, both to individuals in the form of installment
and other consumer credit, and to each other in the form of trade credit
and commercial paper. Even with the ready availability of business credit
cards and charge accounts, however, commercial banks and finance companies
have increasingly dominated the consumer credit field. The share of
outstanding consumer credit owed to nonfinancial businesses (including
corporations and others) has fallen from just over one—third in the early
1950s to just under one-sixth since the 1970s. In addition, business
lending via purchases of nonfinancial commercial paper has remained
relatively small, so that trade credit —typically equal to 15-18% of the
gross national product, and mostly borrowed and lent within the corporate
sector — remains the primary vehicle for businesses' holdings of direct
claims on nonfinancial obligors.
Foreign investors have held a small but growing share of direct
claims on nonfinancial participants in the U.S. economy throughout the
post-war period.7 The growth of foreign holdings was especially rapid
during the l970s, as the persistent U.S. balance of payments deficit
transferred assets abroad, especially to member countries of the international
oil cartel. This rapid growth proceded from a small base, however, so that
foreign holdings still represented less than 5% of all direct claims
against U.S. nonfinancial obligors as of yearend 1983. Nevertheless, the
concentration of foreign (especially foreign official)investments.-in
specific instruments has made foreign holdings of somewhat greater
importance in several U.S. markets. The yearend 1983 share of federal
government securities held abroad, for example, was approximately one—tenth.
In sum, neither individuals nor other nonfinancial entities

—12—
participating in the U.S. financial markets, including businesses and
foreign investors, have shown much willingness to hold direct claims
on U.S. individuals and businesses. Instead, they have largely left that
task to financial intermediaries.
—13—
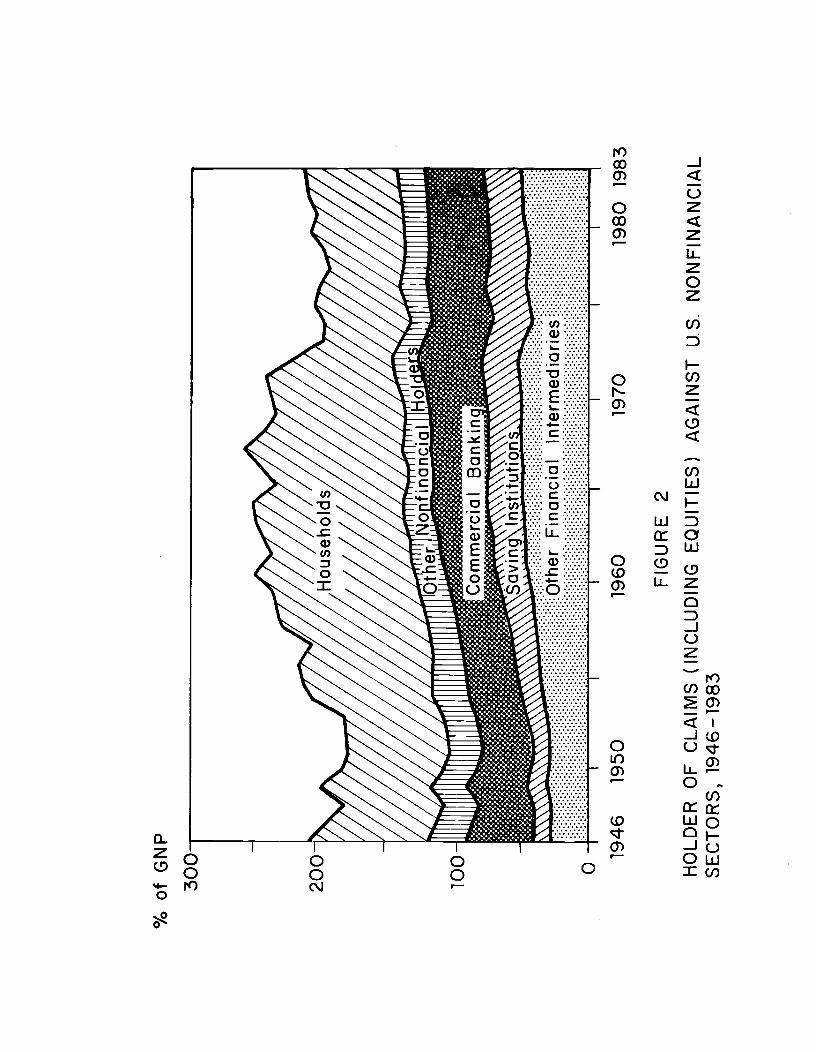
3. The Dominance of Financial Intermediation
Figures 2 and 3 indicate the extent to which the increasing
preference for claims on financial intermediaries by individuals (and, to
a lesser extent, by other nonfinancial investors) has shifted to
intermediaries the task of meeting the needs that nonfinancial participants
in the economy have brought to the U.S. financial markets. As of 1983
individuals in the aggregate remained the largest single class of holders
of all direct claims on nonfinancial borrowers and share issuers —but
only by virture of their continuing domination of the ownership of
corporate equities, as the contrast between Figures 2 and 3 shows. On an
overall basis, however, the household share either including or excluding
equities has declined, as has the share held by all other nonfinancial
investors. As the share of direct claims on nonfinancial entities held
by all nonfinancial investors has declined, the share held by financial
intermediaries has correspondingly risen. Intermediaries' holdings first
accounted for the majority of all direct claims outstanding in the U.S.
financial markets (including equities) in 1969, and they have remained
the majority ever since.
Table 2 presents flow data indicating the even stronger post-war
dominance of intermediaries in meeting the new funds required each year by
nonfinancial participants in the U.S. economy. The table shows data both in
dollars and as percentage shares of all net funds extended to all nonfinancial
sectors. As in Table 1, the data are in the form of five—year averages
(and the three-year aveae. for l98l-83) lso as in Table 1 these data
exclude equity capital gains, which constituted most of the increase in
households' equity holdings. until the late l960s, and more than all of the
increase since then.
%of
GN
P
FIG
UR
E
2
HO
LDE
R O
F
CLA
IMS
(IN
CLU
DIN
G
EQ
UIT
IES
) S
EC
TO
RS
, 19
46-1
983
AG
AIN
ST
U
.S.
NO
NF
INA
NC
IAL
1946
19
50
1960
19
70
1980
19
83

%of
GN
P
1960
19
80
1983
FIG
UR
E
3
HO
LDE
RS
O
F C
LAIM
S (
EX
CLU
DIN
G
EQ
UIT
IES
)AG
AIN
ST
U.S
. N
ON
FIN
AN
CIA
L S
EC
TO
RS
, 19
46 -1
983
30 19
46
1950
• •; •
; • ;.
• •;
•: •:
• —
• —
.— •—
:•
:
•:•:
QtIe
r F
i na
i—ic
ia I
I rit
errr
ied
i arie
s
1970

Tab
le 2
U.S
. Credit Market Funds A
dvan
ced
to Nonfinancial Sectors
Fore
ign
Bill
ions
of
0., 0
0,7
1,3
0.7
3.1
12.8
25.3
24,6
Percent of Total
Total
Dollars
8,8
0.6
22.6
5.6
30,0
7.4
54.,1
18.1
77-5
28,2
140,6
49.9
268,3
87,0
355,7
107.3
Funds -
Adv
ance
d
2.7
5.6
8.6
14.6
13.0
35., 4
59.1
37.5
5.5
11. 3
14.0
21.4
36.3
55.3
122.2
211.
0
Pvt.
Dom
. N
onfin
anci
al
Total
Investors
Fede
ral
Gov
t.
Financial Intermediaries
Commercial Savings
Banks
Insts.
Other
12.2
30, 6
37 , 8
58,3
87,5
181.7
339-, 1
441.8
3.1
6.. 7
5,6.
2,4
4,5
24.2
33,8
49. •
5
0-, 3
0,6
0,8
1,0
2,4
4.1
11.8
11.8
19 46—1950
1951—1955
1956 —1960
1961—1965
1966—1970
1971—1975
1976—1980
1981—1983
1946—1950
1951—195 5
1956—1960
1961—1965
1966—1970
1971—1975
1976—1980
1981—1983
100.0,
41,2
3.2
3.3
53,3
26,9
5,5
19.9
100.0
20.8
2.1
2,2
74,8
19.4
18,1
37.3
100.0
13,4
2.1
3..4
81,2
20,3
23.1
37.7
100.0
4,1
1,8
1,3
92,7
30,8
25.3
36.6
100.0
100.0
5.5.
12.6-
2,8
2,1
3,0
7,5
88,7
77.7
32,2
. 27
,7
14.8
19,6
41.7
30.4
100.0
10.0.
3.4
7.6
79,0
25.4
18.0
35.6
100.0
10,5.
2,9
5.6
81.0
24.3
7.4
49.3
Notes: Data are averages of annual flows, in dollars and a
s percentages of annual total
Detail may not add to totals because of rounding.
Source: Board of Governors of the Federal Reserve System.
funds advanced.
—14—
Apart from accumulating capital gains on equities, individuals
and other private domestic nonfinancial investors have played only a
small and (except for the early 1980s) shrinking role in meeting directly
the needs that nonfinancial entities have brought to the U.S. financial
markets.8 Similarly, the role of the federal government has been consistently
small in this context, and that of foreign investors has grown but remains
small nonetheless. In part because of the growing fraction of nonfinancial
sectors' needs that have come in the form of debt issued by private borrowers
rather than government borrowers (at least until the l980s) , as well as
for other reasons related to financial innovation, nonfinancial investors
have instead accumulated claims on intermediaries and have left to them
the task of directly allocating the economy's financial resources. As
Table 2 also shows, banks, savings institutions and nondeposit intermediaries
have all been significant participants in this process.

—15—
4. The Role of Specific Intermediaries
The advance of intermediation in the U.S. financial markets since
World War II has hardly been uniform. The specialization of financial
intermediaries has inevitably led to some playing more important roles
than others, and some experiencing more rapid growth than others, as the
needs and objectives of both borrowers and lenders have changed, and as
government interventions have (intentionally or otherwise) favored first
one kind of institution and then another.
4.1. Commercial Banks. The commercial banking system has long
stood at the center of attention devoted to financial markets. Even today,
despite several decades of increasing importance of nonbank intermediaries10
many kinds of discussions ranging from textbook descriptions of the economy
to professional evaluations of monetary policy often proceed as if commercial
banks were the only intermediaries in the U.S. financial markets. This
emphasis on the commercial banking system is understandable in part, in
view of the special role that banks play in the monetary policy process
by virtue of their relationship to the Federal Reserve System. In addition,
in the past commercial banks were more dominant in financial market activity
than they are today. Earlier in this century banks' assets and liabilitiesdwarfed those of other intermediaries, and before passage of the Glass-
Steagall Act in 1933 commercial banks also dominated the securities
business . Until as recently as the early l970s, commercial banks in
the United States enjoyed a monopoly on the right to issue checkable
deposits.
Since World War II the U.S. commercial banking system has
approximately held its own in relation to the scale of nonfinancial economic
activity, but it has not participated in the economy's overall post-war

—16—
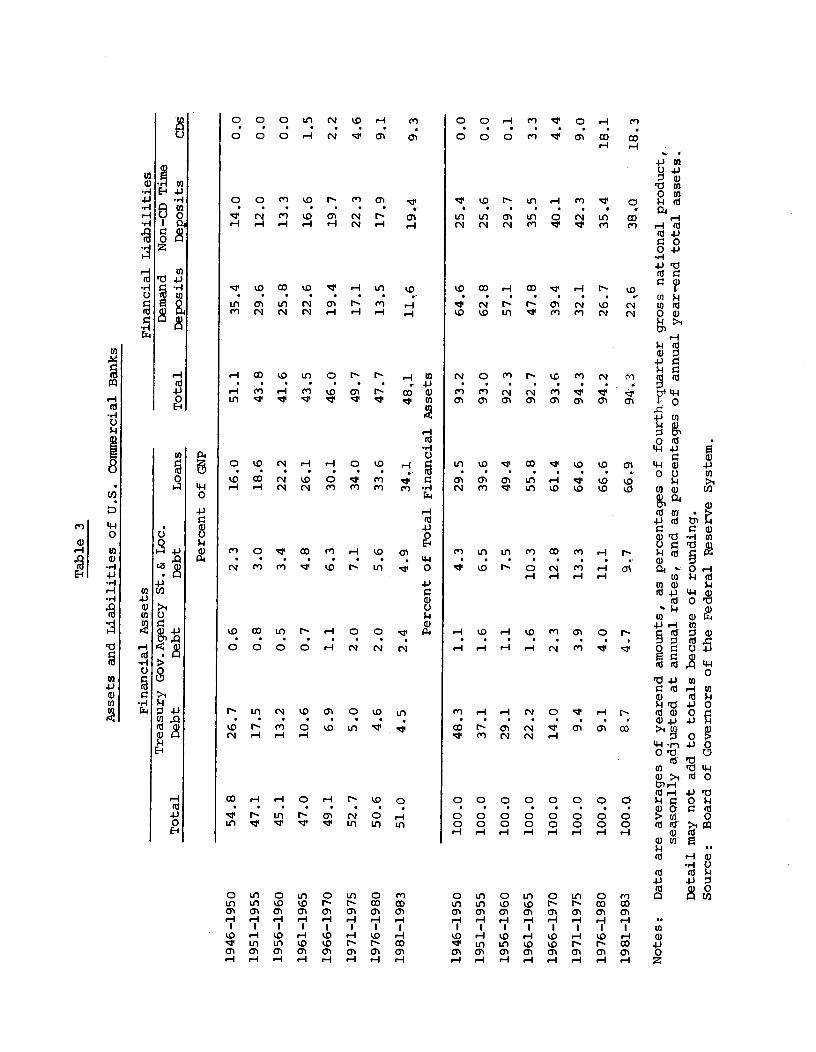
expansion of intermediation. The approximate stability of the banking
system's relative size is apparent in Figure 3, and also in the more
detailed data on commercial banks' assets and liabilities in relation to
gross national product presented in the upper half of Table 3. The total
size of the banking system in relation to gross national product has shown
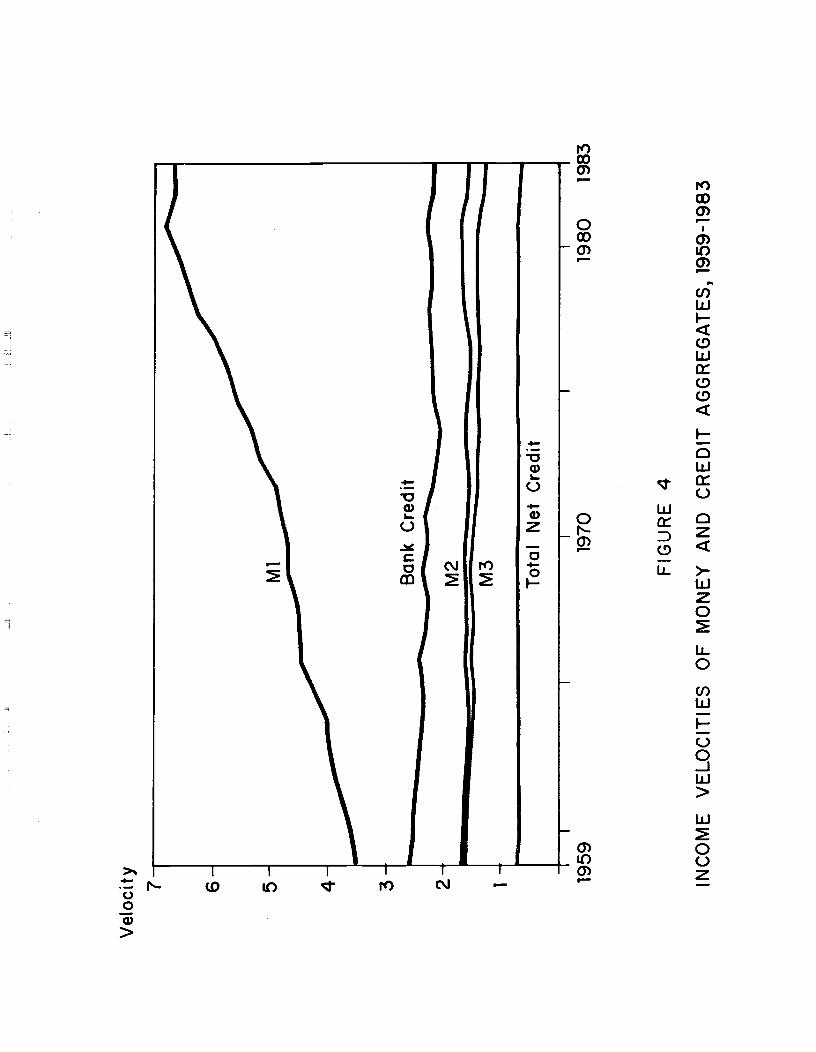
essentially no trend during the post-war period. As Figure 4 shows,
there has been little post-war trend in the "income veolcity" of bank
credit, which consists of most commercial bank earning assets. This
relative stability stands in marked contrast to the pre-war years when,
over nearly a century, the size of the banking system continually grew
in relation to gross national product.12
Within the stability of the overall totals, however, the post-war
years have also seen substantial shifts in composition on both sides of
the banking system's balance sheet, as is clear from the percentage share
data presented in the lower half of Table 3. among bank assets, the most
significant development during this period has been the post-war (really
post—depression) recovery of bank loan portfolios, and hence the general
resumption of banks' traditional role as "inside" intermediaries. In
1929 loans constituted 73% of bank credit. During the depression and then
the war years, however, the fall—off in private debt issuing activity
meant that, for all practical purposes, there was little or no loan business
to be had. By contrast, the federal government was then issuing debt in
record volume, and banks participated in financing it. By 1935 banks'
securities investments exceeded their loan portfolios, and in 1945 investments
constituted 79% of bank credit. Commercial banks simply were no longer
very commercial. The years since 1946 have largely consisted of a reversal
of the 1930—45 pattern, with bank loans exceeding securities investments
Tab
le 3
Ass
ets
and
Lia
bilit
ies
of U
.S.
Com
mer
cial
Ban
ks
Financial Assets
Treasury Gov.Agency St.& Loc.
Total
Debt
Deb
t D
ebt
Loa
ns
Perc
ent of
GN
P
Fina
ncia
l L
iabi
litie
s D
eman
d Non-CD Time
Tot
al
Dep
osits
D
epos
its
CD
e
1946—1950
54.8
26.7
0.6
2.3
16.0
51.1
35.4
14.0
0.0
1951—1955
47.1
17.5
0.8
3.0
18.6
43.8
29.6
12.0
0.0
1956—1960
45.1
13.2
0.5
3.4
22.2
41.6
25.8
13.3
0.0
1961—1965
47.0
10.6
0.7
4.8
26.1
43.5
22.6
16.6
1.5
1966—1970
49.1
6.9
1.1
6.3
30.1
46.0
19.4
19.7
2.2
1971—1975
52.7
5.0
2.0
7.1
34.0
49.7
17.1
22.3
4.6
1976—1980
50.6
4.6
2.0
5.6
33.6
47.7
13.5
17.9
9.1
1981—1983
51.0
4,5
2.4 Percent 4
.9.
of Total
34.1
Financial
48,1
Assets
11.6
19.4
9.3
1946—1950
100.0
48.3
1.1
4,3
29.5
93.2
64.6
25.4
0.0
1951—1955
100.0
37.1
1.6
6.5
39.6
93.0
62.8
25.6
0.0
1956
—19
60
100.
0 29
.1
1.1
7.5
49.4
92.3
57.1
29.7
0.1
1961
—19
65
100.
0 22
.2
1.6
10.3
55
.8
92.7
47
.8
35.5
3.
3 19
66—
1970
10
0.0
14.0
2.
3 12
.8
61.4
93
.6
39.4
40
.1
4.4
1971
—19
75
100.
0 9.
4 3.
9 13
.3
64.6
94
.3
32.1
42
.3
9.0
1976—1980
100.0
9.1
4.0
11.1
66.6
94.2
26.7
35.4
18.1
1981—1983
100.0.
8.7
4.7
.7
66.9
9.4.3
22.6
38,0
18.3
Notes:
Data are averages of yearend amounts, as percentages of fourth-quarter gross national product,
s.eaSQnhly adjusted at annual rates, and as percentages of annual year'-end total assets,
Detail may not add to totals because of rounding.
Source: Board of Governors of the Federal Reserve S
yste
m.
FIG
UR
E
4
INC
OM
E
VE
LOC
ITIE
S
OF
M
ON
EY
A
ND
C
RE
DIT
A
GG
RE
GA
TE
S,
1959
-198
3
Vel
ocity
7 6 5 4.
3 2 1 1959
19
70
1980
19
83

—17—
in 1957 for the first time in more than two decades, and standing again
at 73% of total bank credit as of yearend l983
In rebuilding their loan portfolios and de-emphasizing their invest-
nnts, banks have both altered the mix of their lending business and changed
the character of their securities holdings. Although banks remain a
principal source of business credit, and commercial and industrial loans
are still the largest single category of bank lending, these loans no
longer dominate bank loan portfolios as they once did. Instead, mortgage
credit and other consumer loans now comprise more th.an one-third of the total.
Especially during the second half of the post-war period, the widespread
use of bank-issued credit cards has been a major factor in banks' development
of their consumer lending business. Moreover, among business loans per
Se, the larger banks have increasingly become a major element in the
intermediate-term credit market through the use of explicitly longer
maturity loans (in son cases up to ten years) and revolving credits of
an implicitly ongoing nature. Total bank investments have grown slowly
since World War II, but because of tax incentives banks have so concentrated
their investments on state and local government issues that, for a few
years in the early l970s, they held more of these securities than of
13federal government debt.
Among bank liabilities, the two most significant changes that have
occurred during the post—war period have been the continual decline of
demand balances and increase of time and saving deposits, relative to
either total bank liabilities or gross national product, and the "liability
management revolution" that has greatly increased the larger banks'
reliance on "bought funds." As Figure 4 shows, the income velocity of the
narrow Ml money stock, consisting of currency plus checkable deposits,
—18—
has about tripled over the post—war years as a result of a combination of
influences including economies of scale in the public's holding of cash
balances, the secular rise in nominal interest rates, and the increasingly
widespread use of credit cards and charge accounts.14 This persistent trend
increase in Ml velocity stands in sharp contrast to either the absence of
any trend during 1910-30 or the steeply declining trend during 1930-45.
Onlythe strong growth of time and savings deposits, including the new
negotiable certificates of deposit that first came into existence in 1961,
has accounted for the absence of much post-war trend in the income velocity
of the broader M2 and M3. "Total net credit," consisting of the outstanding
debt of all U.S. obligors other than financial intermediaries, has also
shown no velocity trend.
Large banks' growing use of such liabilities as certificates of
deposit, federal funds, Eurodollar borrowings, commercial paper issues,
repurchase agreements and so on — instruments that in son cases represent
the development of new financial markets since World War II —has not
only changed banks' balance sheets but also facilitated a major change in
the feasible aggressiveness of bank lending practices. The enormous post—war
expansion of bank loan portfolios, which banks have achieved in part through
the competitive use of such devices as loan commitxents and medium—term
credits, would probably have been impossible if banks had simply continued
to follow the classic practice of treating their deposits (and other
liabilities) as determined by outside forces.
Finally, it is useful to point out explicitly that because of changes
in commercial bank organization, especially during the 1960s, the representa-
tion of banks as having merely held their own during the post—war increase
in the U.S. economy's reliance on financial intermediation relative to

—19—
economic activity risks understating by a wide margin the growing overall
presence of commercial banks in the financial system. After falling by
more than one-half between 1920 and 1935, the number of american commercial
banks has remained roughly steady at about 14,000. The number of bank
branches, however, has risen from some 4,000 to over 39,000 during the
post—war years, with most of this growth occurring since 1960. Moreover,
especially since the 1970 Imendments to the Bank Holding Company Act and
the 1980 Depository Institution Deregulation and Monetary Control Act,
banks have increasingly entered activities other than their traditional
loan and deposit business. Most recently, these extensions of activity
have included indirect participation in the securities brokerage business.
Although their direct participation in financial intermediation has not
kept pace with the rising post-war trend, commercial banks have increasingly
enhanced their importance as more nearly full-service financial institutions.
4.2. Nonbank Deposit Institutions. As is clear from Figure 3, one
group of intermediaries that has accounted for much of the post World War II
increase in U.S. financial intermediation has been the nonbank deposit
institutions including savings and loan associations, mutual savings banks,
and credit unions. The public's strong demand for consumer—type time and
savings deposits has enabled these institutions to grow rapidly, not just
absolutely but in relation to economic activity, during most of the post—war
period. Their growth has been great enough to offset the relative stagnation
of the commercial banking system, so that the income velocities of the
M2 and M3 money stocks have shown a modest downward trend. When extrapolated
backward, this trend appears to have been a continuation of the downward
trend associated with corresponding aggregates during the pre—war era
when nonbank deposit institutions were not of major impottance.

—20—
Table 4 presents data for the individual deposit (or share) volume
and combined asset holdings of the three major groups of nonbank deposit
institutions, first in relation to gross national product and then as a
share of the total assets of the three groups of institutions together.
The post-war expansion of the savings and loan industry stands out clearly
here. Between the early post—war years and the l970s outstanding savings
and loan shares more than quadrupled as a percentage of gross national
product. By 1983 the amount of these shares was well over twice the amount
of mutual savings bank deposits and credit union shares combined, and was
almost equal to the amount of consumer-type time and savings deposits held
at commercial banks. In comparison with mutual savings banks, the primary
factor underlying the more rapid growth of savings and loan associations
has probably been mere geography; mutual savings banks are overwhelmingly
concentrated in a few states, especially New York and Massachusetts, which
have experienced slower than average economic growth since World War II.
In comparison with commercial banks, the primary factor at work has probably
been the effect of government regulation, in that savings and loan associations
did not face deposit interest rate ceilings until 1965 and enjoyed a one—
fourth percent differential over commercial banks for many years thereafter.
The growth of credit unions has been even faster than that of savings and
loan associations, but credit unions constitute another example of rapid
growth from a small base, and they remain by far the smallest of the three
groups of institutions. Mutual savings banks are alone among the three groups
in having failed to do more than grow in pace with economic activity.
Although mutual savings banks were twice as large as savings and loan
associations at the end of World War II, savings and loans were equal in
size in 1954 and larger by a factor of four by 1983.

Tab
le 4
Ass
ets
and
Lia
bilit
ies
of U
.S.
Non
bank
Dep
osit
Inst
itutio
ns
Com
bine
d Fi
nanc
ial
Ass
ets
Con
sum
er
Total
Mortgages
Credit
• L
iabi
litie
s by
Ins
titut
ion
Savi
ngs
Mut
ual
Cre
dit
& L
oan
Savi
ng B
anks
U
nion
Sh
ares
D
epos
its
Shar
es
Perc
ent
of G
NP
1946
—19
50
13.4
6.
3 0.
3 4.
3 7.
2 0.
2 19
51—
1955
15
.3
9.7
0.5
6.3
6.6
0.5
1956
—19
60
21.0
15
.0
1.0
10.3
7.
1 0.
8
1961
—19
65
26.9
20
.5
1.3
14.7
7.
3 1.
2
1966
—19
70
27.0
20
.9
1.6
14.7
7.
2 1.
4
1971
—19
75
30.2
22
.3
2.1
16.8
7.
2 1.
8
1976
—19
80
32.4
23
.1
2.5
19.0
6.
3 2.
3
1981
—19
83
31.2
19
.1
2.4
18.6
5.].
25
Percent of Total Combined Financial Assets
19 46—1950
1951—1955
1956—1960
1961—1965
1966 —19 70
1971—1975
1976—1980
1981—1983
Notes: Data are averages of yearend amounts, as
percentages of fourth-quarter gros.s national product,
seasonally a
djus
ted
at a
nnua
l ra
tes,
and
as percentages of annual year—end total combined
Detail m
ay n
ot a
dd t
o to
tals
bec
ause
of
roun
ding
. So
urce
: B
oard
of
Gov
erno
rs o
f th
e Fe
dera
l R
eser
ve S
yste
m.
assets.
100.0
100.
0 10
0.0
100.
0 10
0.0
100.
0 10
0.0
100.
0
47.4
63.4
71.4
76.4
77.3
73.9
71.2
2.2
3.3
4.4
5.0
6.0
7.0
7.8
32.3
41.2
50.0
54.7
54.5
56.0
58.6
53.5
43.0
33.9
27.1
26.6
23.5
19.4
61,5
1.8
3.0
4.0
4.4
5.2
6.2
7.2
7'5
59,8
16.3
8.2
—21—
The history of nonbank deposit institutions in the United States
since World War II has been in large part a story of evolving financial
regulation, including restrictions on these intermediaries' liability issuing
as well as their asset holding. Especially because these institutions
operate under legal and regulatory constraints governing the disposition
of their asset portfolios (although some of these constraints were weakened
by the 1980 Depository Institutions Deregulation and Monetary Control Act),
their aggregate contribution to meeting the financial needs of nonfinancial
participants in the economy has followed a fairly predictable pattern.
Savings and loan associations and mutual savings banks both typically
invest the majority of their assets, in mortgages, so that these two
groups together have become the nation's leading provider of mortgage lending.
This dominance has lessened somewhat in recent years, however, especia1ly
with the increasing prominence of the federally sponsored mortgage pools.
of yearend 1983 savings and loan associations and mutual savings banks
together held more than one-third of all outstanding mortgages, down from
nearly one—half only a few years earlier. (By comparison, commercial
banks held less than one—fifth of all outstanding mortgages as of 1983.)
Credit unions have instead traditionally invested most of their assets
in consumer installment loans, and as of 1983 they accounted for just over
one—tenth of the outstanding consumer credit.
4.3. Private Nondeposit Intermediaries. As is also apparent from
Figure 3, a significant part of the post World War II increase in the
U.S. economy's reliance on financial intermediation has stemmed from
neither commercial banks nor nonbank deposit institutions but, instead,
from intermediaries that issue only nondeposit claims. There are many
forms of such intermediaries operating in the U.S. markets, but among the

—22—
most familiar and important are life and casualty insurance companies,
private and public sector pension funds, independent consumer finance
companies and the "captive" finance companies of nonfinancial businesses,
equity and money market mutual funds, real estate investment trusts, and
securities brokers and dealers.
Table 5 presents data, analogous to that shown above for the nonbank
deposit institutions, for three specific categories of U.S. nondeposit
intermediaries :15 life insurance companies, private pension funds, and
state and local government pension funds. The reason, for focusing in
particular on these three kinds of institutions is not only that they
are the largest of the nondeposit intermediaries but also that their
respective post—war experience reflects interesting contrasts. Because
the low interest rates implicitly paid on the savings component of ordinary
life insurance have increasingly pronipted the use of group and other term
insurance policies, life insurance companies' total assets held and
liabilities outstanding grew little relative to gross national product
during the first half of the post-war period, and since then they have mostly
been declining in relative terms. Moreover, the relative decline in these
companies' life insurance business has been even more pronounced, in that
their growth in recent years has consisted disproportionately of pension
monies which they manage for other businesses. As of yearend 1983 pension
reserves constituted more than two—fifths of U.S. life insurance companies'
total liabilities, up from less than one-tenth in the early post-war years.
By contrast, both private and public sector pensions have experienced
extraordinarily rapid growth throughout these years.16 Tax incentives
at both the individual and corporate levels, business personnel policies
aimed at reducing worker turn—over, features of the collective bargaining

JJ.J
LJ.
Tab
le 5
Ass
ets
of U
.S.
Lif
e In
sura
nce
Com
pani
es a
nd P
ensi
on F
unds
Mor
tgag
es
Perc
ent
of G
NP
1946
—19
50
24.6
0.
8 8.
2 4.
3 21
.2
1.9
1.4
1951
—19
55
26.3
1.6
10.8
6.5
20.8
3.3
2.2
1956—1960
31.8
3.4
13.2
8.3
22.3
6.2
3.3
1961—1965
36.0
6.1
14.3
9.1
22.3
9.2
4.5
1966—1970
36.8
8.3
14.0
9.0
20.6
10.8
5.4
1971—1975
35.1
10.2
12.9
6.7
18.4
10.4
6.4
1976—1980
33.2
8.7
12.5
5.4
17.0
9.3
6.8
1981—1983
36.5
9.7
119
5,1
178
1.0.5
8,2
Percent of Total Combined Financial Assets
1946—1950
100.0
3.3
33.4
17.4
86.4
7.7
5.9
1951—1955
100.0
6.0
41.1
24.9
79.1
12.6
8.3
1956—1960
100.0
10.6
41.4
26.1
70.0
19.4
10.5
1961—1965
100.0
17.0
39.7
25.3
62.0
25.6
12.4
1966—1970
100.0
22.6
38.1
24.3
55.9
29.3
14.8
1971—1975
100.0
29.0
36.7
19.6
52.4
29.5
18.1
1976—1980
100.0
26.2
37.8
16.3
51.4
28.0
20.6
1981—1983
100.0
26.5
32,6
139.
48,7
288
225
Notes:
Dat
a ar
e av
erag
es o
f ye
aren
d am
ount
s, a
s pe
rcen
tage
s of
fou
rth—
quar
ter
gros
s na
tiona
l pr
oduc
t, se
ason
ally
adj
used
at
annu
al ra
tes
and
as p
erce
nta9
es o
f an
nual
yea
r-en
d to
tal
com
bine
d as
sets
. D
etai
l m
ay not add to totals because of rounding.
Source: Board of Governors of the Federal peserve System.
Com
bine
d Fi
nanc
ial A
sset
s C
orpo
rate
T
otal
E
quiti
es
Bon
ds
Financial
Life
Assets by Institution
Priv
ate
State & L
ocal
Insur. Co.
Pension
Gov
. Pension

—23—
process, and other corporate financial objectives have all combined to
favor the mushrooming of private pension liabilities since World War II.
During most of this period, however, businesses had (and many used) broad
latitude to incur pension liabilities without funding them. The 1974
Employee Retirement Income Security Act subsequently specified minimum
standards for the vesting of workers' rights to accumulated pension
benefits and for employers' funding of vested pension liabilities. Even
so, businesses retain important flexibility in choosing the actuarial
assumptions underlying the calculation of future benefits, the minimum
required amortization of unfunded vested benefits is very slow, and
nonvested benefits require no funding at all. Consequently, many businesses
continue to carry substantial amounts of unfunded liabilities, so that
private pension funds' total assets as shown in Table 5 substantially
understate their liabilities.17 This understatement was especially
great during the l970s when many private pension funds' asset portfolios,
nre than half of which in the aggregate is invested in equities, suffered
an erosion in market value.
State and local government pensions, including both teachers' and
other employees' funds, have experienced similar post—war growth. Public
sector workers have the same tax incentive to use the pension mechanism
to spread income beyond retirement as do private sector workers. Although
public sector employers do not have the same tax incentives as do private
businesses, in many cases the political process has favored the use of
pension compensation over current compensation, especially when there is
no pressure to raise tax or other revenues immediately to fund the
accumulating pension liabilities. Hence public sector pension funds have
been and remain substantially underfunded, so that the asset data shown

—24—
in Table 5 greatly understate their liabilities also.l8 The continued
growth of public sector pensions' assets during the l970s, in contrast
to private pensions, reflects merely the smaller share of assets invested
in equities by public sector funds' portfolios (about one-third in the
aggregate) rather than any difference in funding practices.
The asset mix of these insurance and pension intermediaries, and
hence their role in financing economic activity, has undergone
important changes since World War II. Regulatory changes in the 1960s
allowed many life insurance companies to increase the equity portion of
their portfolios, and since the mid 1960s life insurers have largely
withdrawn from direct home mortgage lending. State and local government
pension funds and especially private pension funds have even more
dramatically increased the equity share of their investments, Consequently,
these nondeposit intermediaries have increasingly become a major source
of both debt and equity funds for corporate businesses. As a result of
these portfolio changes, together with the rapid growth of pensions and
the (relative) stagnation of the commercial banking system, insurance
companies and pension funds couined have increasingly dominated banks
as holders of claims on the U.S. corporate business sector — despite
banks' post—war emphasis on loans over investments in governnnt securities.
In the early post—war years these nondeposit intermediaries held only
slightly more claims on the corporate sector than did commercial banks,
but by the 1970s they held more than twice as much.
It is also important to distinguish the claims on business held
by banks, which are overwhelmingly in the form of short- to medium-term
loans, from the corresponding claims held by insurance companies and
pension funds, which consist mostly of long-term debt and equity securities.
—25—
These non-deposit intermediaries have traditionally held more than two-thirds
of all outstanding corporate bonds, and in recent years, they have also
come to hold about one-sixth of all corporate equity. On a flow basis,
these investors have been of even greater importance in providing long—
term debt and equity capital to U.S. business corporations. In addition
to accounting for much or all of the corporate sector's net long-term
bond financing throughout the post-war period, since 1960 they have also
accounted for more than all of its equity financing, absorbing also the
equity holdings liquidated by the household sector. In sum, businesses'
equity and bond financing has become increasingly dominated by these
nondeposit intermediaries. Given their high rates of portfolio turn-over,
especially in comparison with individuals, equity and bond trading has
become even more so.
4.4. Government Sponsored Intermediaries. another important change
that has come about in the U.S. financial markets since World War II
has been the great increase in the federal government's activities as an
intermediary for (and also a guarantor of) private credit. "Off-budget"
sponsored credit agencies like the Federal Home Loan Bank System and the
Federal Intermediate Credit Bank were in operation before World War II,
but the scale of their lending operations was small then. 2s of 1946, all of
these agencies combined held only about $2 billion of assets, the majority
of which consisted of agricultural loans, and they owed only $2 billion
of liabilities. The focus of these agencies' activity turned more toward
support for homebuilding after the Federal National Mortgage Association
began its lending operations in 1955, but as late as 1960, when their
combined assets had reached $11 billion, their total agricultural credit
outstanding still exceeded their total housing credit. Only since the

—26—
1960s, as the interaction of deposit interest rate ceilings with rising
nominal interest rates led to the introduction of large—scale support for
housing, did government financial intermediation begin to increase rapidly.
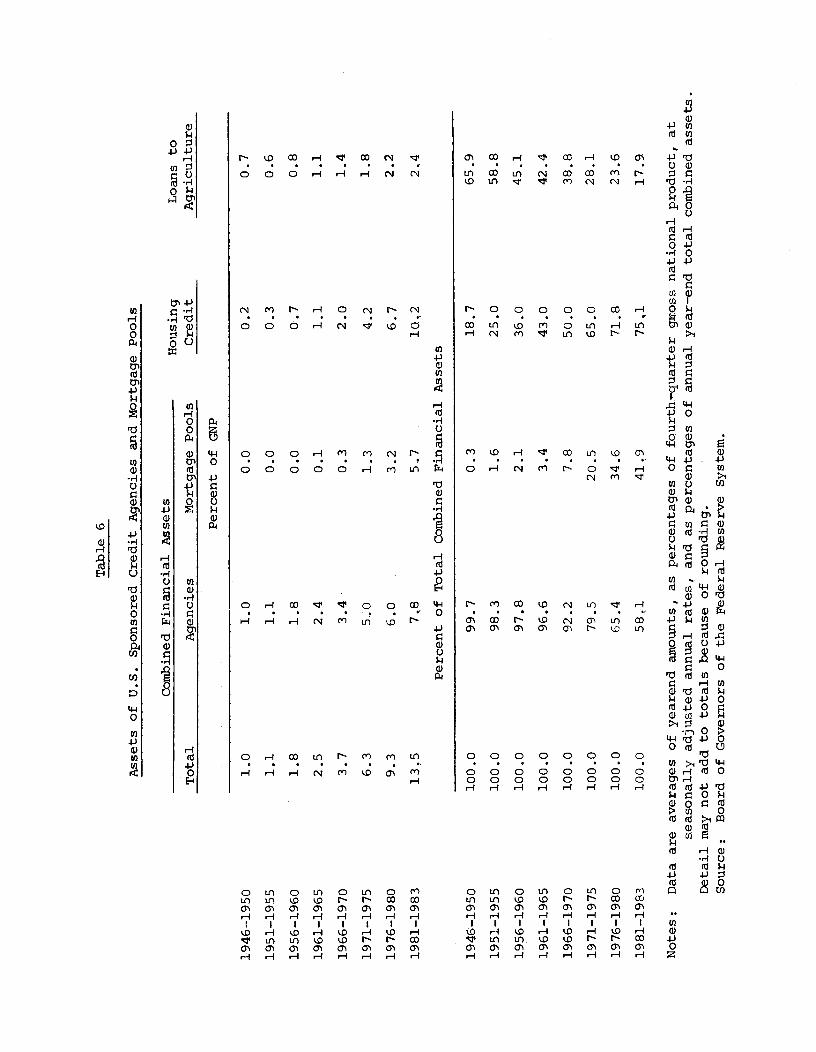
Table 6 presents data, comparable to that shown above for other
groups of intermediaries, for the assets of the federally sponsored credit
agencies and the even more recent mortgage "poois" like the Government
National Mortgage association and the Federal Home Loan Corporation.
Government sponsored intermediation has grown rapidly, not just absolutely
but in relation to gross national product, and by 1983 these intermediaries
held more than one-fifth of all outstanding home mortgages and more than
two—fifths of all outstanding farm debt. Moreover, the total housing credit
advanced by these intermediaries, which have grown especially rapidly since
the onset of periodic diintermediation in the mid 1960s, includes not only
direct purchases of mortgages but also Federal Home Loan Bank advances
to savings and loan associations, so that the effective amount is even
greater. Federally sponsored intermediaries accounted for 45%, 48%,
52% and 100% of the total net extensions of single-family home mortgage
credit in the high-disintermediation years 1969, 1970, 1974 and 1982,
19respectively.
Federally sponsored intermediaries conduct their business much
like private intermediaries, acquiring financial assets on either a loan
or purchase basis, and in turn issuing their own liabilities. There are
at least two important differences, however. One is that government
intermediaries do not operate subject to the profit motive alone. While
they typically pursue a profit objective,, they do so within the limitations imposed
by their charter to support areas of economic activity designated by
Congress as public policy priorities.20 The other key difference is that
1946—1950
1951—1955
1956
—19
60
1961
—19
65
1966—1970
19 71
—19
75
1976
—19
80
1981
—19
83
Not
es:
Data
Table 6
Assets of U.S. Sponsored Credit Agencies and M
ortg
age
Pools
100 .0
100.0
100 .0
100 .0
100.0
100.0
100.0
100.0
99.7
98.3
97.8
96.6
92.2
79.5
65.4
58,1
0.3
1.6
2.1
3.4
7.8
20.5
34
.6
41.9
18.7
25.0
36.0
43.0
50.0
65
.0
71.8
754
65.9
58.8
45.1
42.4
38.8
28
.1
23.6
17 9
.
Combined Financial Assets
Total
Agencies
Mortgage
Percent of
Pools
GNP
Hou
sing
C
redi
t Loans to
Agriculture
1946
—19
50
1.0
1.0
0.0
0.2
0.7
1951—1955
1.1
1.1
0.0
0.3
0.6
1956—1960
1.8
1.8
0.0
0.7
0.8
1961
—19
65
2.5
2.4
0.1
1.1
1.1
1966
—19
70
3.7
3.4
0.3
2.0
1.4
1971
—19
75
6.3
5.0
1.3
4.2
1.8
1976—1980
9.3
6.0
3.2
6.7
2.2
1981—1983
13.5
7.8
5.7
10.2
2,4
Percent of Total Combined Financial Assets
are
aver
ages
of
year
end
amou
nts,
as
perc
enta
ges
of f
ourt
h—qu
arte
r gr
oss
natio
nal
prod
uct,
at
seas
onal
ly a
djus
ted
annu
al ra
tes,
and
as
perc
enta
ges
of a
nnua
l ye
ar—
end
tota
l co
mbi
ned
asse
ts.
Det
ail
may
not
add
to t
otal
s be
caus
e of
rou
ndin
g.
Sour
ce:
Boa
rd o
f G
over
nors
of
the
Fede
ral
Res
erve
Sys
tem
.
—27—
the liabilities of the mortgage pools and some of the sponsored credit
agencies are directly guaranteed by the federal government and accordingly
pay interest geared to that on federal government securities. Hence
government intermediation also provides some degree of subsidy in the form
of access to less expensive (because less risky, by virtue of the guarantee)
21credit.
The federal government's role as a credit guarantor, which is not
limited to the financial intermediation that it sponsors, is itself an
important factor that has had great influence on the U.S. economy's reliance
on financial intermediation. Deposit insurance provided by the Federal
Deposit Insurance Corporation and the Federal Savings and Loan Insurance
corporation constitutes the most prevalent form of government sponsored
guarantee provided for a fee, and it significantly alters the character
of the liabilities that private sector deposit intermediaries can offer.
Other familiar government sponsored agencies providing guarantees for a fee
include the Veterans Administration, the Federal Housing Authority, the
Overseas Investors Protection Corporation, the Security Investors Protection
corporation, and most recently the Pension Benefit Guarantee Corporation.
The federal governxrnt has also sponsored large-scale loan guarantee
programs for diverse borrowers ranging from college students and small
businesses to the Lockheed and chrysler Corporations and New York City.
In all, the government's 1983 outstanding credit and credit guarantees —
including direct loans, formally guaranteed loans, and other loans by
federally sponsored lenders — totaled $848 billion in comparison to $986
billion of direct federal debt obligations outstanding and held outside
the federal government (including the Federal Reserve System).
This post World War II growth in the U.S. economy's reliance on
—28—
federal government intermediation, deposit insurance, and other credit
guarantees has probably been to a great extent a counterpart of the
government's waning role as a direct borrower. Given the substantial
decline (relative to nonfinancial activity) in the federal government's
outstanding debt, and the corresponding increase in the outstanding debt
of private nonfinancial borrowers,22 the U.S. financial markets have
increasingly attempted to make private obligations more acceptable to the
economy's ultimate wealth holders by converting them into government
obligations via government insurance and credit guarantees. Along with the
increase in private financial intermediation, the growth of government
credit guarantees broadly defined — including some that are merly implicit
— has enabled the U.S. financial system to absorb with substantial
success the large post-war shift in the public versus private mix of the
economy's debt.
—29—
5. Summary
Intermediation is a hallmark of all highly developed financial
systems, and the United States is no exception. The U.S. financial markets
are heavily intermediated, and since World War II they have become
progressively more so.
The principal rationales that give rise to financial intermediation
are benefits of size and specialization,, the diversification of specific
asset risks, and the pooling of even broader classes of risk. Each is a
significant factor in accounting for the U.S. economy's reliance on
intermediation. In addition, since World War II a further important factor
has been the economy's continual shift away from government debt toward
the debt of private nonfinancial entities including individuals and businesses.
Nonfinancial investors (primarily individuals) have exhibited a strong
preference for holding the debt of these nonfinancial borrowers via financial
intermediaries rather than directly.
As the U.S. economy's reliance on financial intermediaries overall
has increased during the post—war period, some specific kinds of intermediary
institutions have grown more rapidly than others. Commercial banks have
about held their own in relative terms, while steadily shifting their
basic business back toward lending activities and away from securities
investments. Nonbank deposit intermediaries have grown in relation to
overall economic and financial activity, as the growth of savings and
loan associations has more than offset the (relative) decline of mutual
savings banks. Among private nondeposit intermediaries, life insurance
companies have declined in relative terms while both public and private
sector pension funds have shown exceptionally rapid growth. Finally, the
federal government's participation in the financial intermediation process

—30—
in the United States has also increased rapidly during these years, in
part as a result of the pressures created by the economy's shift to private
instead of government debt.

Footnotes
* This paper was prepared as a contribution to The Banking Handbook,edited by Richard C. Aspinwall and Robert A. Eisenbeis (New York:John Wiley & Sons, Inc., forthcoming). It is based in part on my earliercontribution to The mericari Economy in Transition, edited by Martin Feldstein(chicago: University of Chicago Prss, 1980). I am grateful to Michael Burdaand Jeff Fuhrer for research assistance and helpful suggestions.
1. See Goldsmith (1958, 1969) and Gurley and Shaw (1960) for an analysisof the prior experience.
2. The discussion here (and the data plotted in Figure 1 and used inTable 1 below) refers 'only to financial assets and hence excludesnonfinancial assets like houses and consumer durables. As of yearend1983 households' nonfinancial assets, valued at replacement cost,totaled $4.8 trillion (of which $2.2 trillion was residential realestate), in comparison to $8.3 trillion of financial assets. Theavailable current—value data on nonfinancial asset holdings are
understandably weak.
3. Moreover, these data overstate households! direct equity holdings inthat they do not separate holdings via mutual funds, which grew from2% of total equity holdings on average during 1946-50 to 6% on averageduring 1976—80.
4. Feldstein (1974) , for example, derived a large estimate of Social
Security "wealth" (defined as the present discounted value of expectedfuture benefits) and found evidence of a significant impact of SocialSecurity on private saving behavior. Although this work and the
literature that has followed it have emphasized effects on totalsaving behavior, there is no reason to expect the composition of assetholding to remain invariant.
5. Some of the best known examples of this thinking were Greenough (1951)and Advisory Committee (1969).
6. Lintner (1975), Modigliani and Cohn (1979) and Feldstein (1979), amongothers, have provided analyses of the failure of equity returns to
keep pace with inflation.
7. A distinction documented by Hartman (1978) is that, within the categoryof long-term portfolio (as opposed to direct) investments, foreigninvestors have mostly bought U.S. equities while U.S. investors have
mostly bought foreign debt securities.
8. Funds generated internally and retained by corporate businesses alsorepresent a form of investment by the holders of equity shares inthose corporations, of course. Given the large houshold ownershipof equities, including retained earnings in the data shown in Table 1would greatly increase the share of funds "advanced" by nonfinancialinvestors, but would still leave intermediaries as the direct sourceof well over half of the total.

9. See Friedman (1980, 1982) for a discussion of the post—war increasein the role of private debt in the U.S. economy.
10. Gurley and Shaw (1960) first emphasized this phenomenon.
11. Following Glass-Steagall, commercial banks no longer engage on theirown account in investment banking or broker—dealer activities for publiclyoffered corporate securities, although they do so for public sectorsecurities, and in recent years they have been increasingly involvedin arranging direct placements of corporate securities. In addition,the trust departments of commercial banks continue to be the largestsingle factor in private asset management.
12. See the historical account given in Friedman and Schwartz (1963).
13. Banks' holdings of Treasury securities were essentially flat from1946 until the swelling of the federal deficit in 1975, so thatbanks' portfolios of municipals have exceeded their portfolios ofdirect U.S. Treasury obligations ever since 1969. Except for1974—76 and 1980-83, all of the growth in banks' holdings of federalgovernment debt has consisted of federal agency securities.
14. See Goldfeld (1973, 1976) for a review of the post—war evidence onmoney demand behavior.
15. In Table 5, however, the respective size of the three groups isindicated by their total assets because of the lack of historicaldata on pension funds' liabilities.
16. See Bodie and Shoven (1983) and Kotlikoff and Smith (1983) for acomprehensive survey of the role of pension funds in the U.S. economy.
17. Several of the papers in Bodie and Shoven (1983) investigate thenature of this underfunding. Although corporations are now requiredto report (as a footnote to the balance sheet) the difference betweenpension assets and liabilities for vested benefits, there is no easyway to discover the liability for nonvested benefits.
18. See again Kotlikoff and Smith (1983).
19. The mortgage market receives, as a net addition to available funds, lessthan all of the credit provided by the sponsored credit agencies andmortgage pools if they in turn sell their securities to investorswho would otherwise have held deposits in thrift institutions; see theanalysis of this question in Jaf fee and Rosen (1979).
20. It is important not to draw this distinction too firmly, however.For example, savings and loan associations have a tax incentive tohold at least 82% of their asset portfolios in residential mortagages(or other qualified assets). Also, in the presence of deposit interestceilings limiting the pay—out of earnings to holders of deposit shares,it has never been clear what role the profit motive plays in portfoliodecisions of savings and loan associations or mutual savings banks.

21. See Penner and Silber (1973) for an analysis of the subsidy implicitin federal credit programs.
22. See again Friedman (1980, 1982).

References
Advisory Conumittee on Endowment Management. Managing Educational Endowments.New York: Ford Foundation, 1969.
Bodie, Zvi, and Shoven, John B. Financial Aspects of the United States
Pension System. chicago: University of chicago Press, 1983.
Feldstein, Martin S. "Social Security, Induced Retirement and AggregateCapital Formation." Journal of Political Economy 82 (September-October, 1974), 905—926.
_________________ "Inflation, Tax Rules, and the Stock Market."Journal of Monetary Economics 6 (July, 1980), 309—331.
Friedman, Benjamin M. "Post—War changes in the American Financial Markets.Feldstein, ed., The American Economy in Transition. Chicago:University of Chicago Press, 1980.
_________________ "Debt and Economic Activity in the United States."
Friedman, ed., The Changing Roles of Debt and Equity in FinancingU.S. Capital Formation. Chicago: University of chicago Press, 1982.
Friedman, Milton, and Schwartz, Anna Jacobson. "A Monetary History of theUnited States 1967—1960." Princeton: Princeton University Press, 1963.
Goldfeld, Stephen M. "The Demand for Money Revisited." .Brookings Paperson Economic Activity (No.3, 1973), 577—638.
"The Case of the Missing Money." Brookings Paperson Economic Activity (No. 3, 1976) , 683—730.
Goldsmith, Raymond W. Financial Intermediaries in the American EconomySince 1900. Princeton: Princeton University Press, 1958.
__________________ Financial Structure and Development. New Haven:Yale University Press, 1969.
Greenough, William C. A New Approach to Retirement Income. New York:Teachers Insurance & Annuity Association of America, 1951.
Gurley, John G., and Shaw, Edward S. Money in a Theory of Finance.Washington, D.C.: The Brookings Institution, 1960.
Hartma.n, David G. "Long—Term International Capital Flows and the U.S.Economy." Mimeographed. Cambridge: Harvard University, 1978.
Jaffee, Eiight M., and Rosen, Kenneth T. "Mortgage Credit Availabilityand Residential Construction." Brookings Papers on Economic Activity(No. 3, 1979), 333—376.

Kotlikoff, Laurence, and Smith, Daniel. Pensions in the American Economy.
thicago: University of thicago Press, 1983.
Lintner, John. "Inflation and Security returns." Journal of Finance 30(May, 1957), 259—280.
Modigliani, Franco, and Cohn, Richard A. "Inflation, Rational Valuationand the Market." Financial analysts Journal (March-April, 1979),24—44.
Penner, Rudolph G., and Silber, William L. "The Interaction BetweenFederal Credit Programs and the Impact on the Allocation of Credit."American Economic Review 63 (December, 1973), 838—852.
Related Documents