AD April 2017 Vol 25 No 3 Isivili Enjiniyering Focus on: Geotechnical Engineering • Southern Cape Landslip • Upgrading the Kranspoort Pass Profile: Dr Phil Paige-Green

Welcome message from author
This document is posted to help you gain knowledge. Please leave a comment to let me know what you think about it! Share it to your friends and learn new things together.
Transcript

VOLTEXAD
April 2017 Vol 25 No 3
Isivili Enjiniyering
Focus on: Geotechnical Engineering• Southern Cape Landslip
• Upgrading the Kranspoort Pass
Profi le: Dr Phil Paige-Green
BAUER Maschinen GmbHBAUER-Strasse 186529 Schrobenhausen, Germanywww.bauer.de
BAUER Maschinen Group is the world market leader in specialist foundation engineering equipment and in equipment for exploration, development and exploitation of natural resources.
PASSION FOR PROGRESS

Civil Engineering April 2017 1
F R O M T H E C E O ’ S D E S K
Civil Engineering April 2017 1
The DonOn the morning of Ahmed Kathrada’s
death, the renowned and respected car-
toonist Nanda Sooben took to social media
asking, “Are there any good men left?”
After the recent cabinet reshuffl e, I
asked our members if SAICE should take a
stand. Some of our members have encour-
aged SAICE to engage. SAICE’s young
members, particularly, wish SAICE to be
heard, and seen to be heard on the matter.
Other members are quiet – and I
respect that, too. SAICE has always cher-
ished the complexity of views that ema-
nate from our diverse membership. Th is is
the brilliance of our own democracy. But
I must make the point that Elie Wiesel
made – indiff erence, while it is tempting,
is a peril. Wiesel argues that, because it
benefi ts the aggressor and not the victim,
indiff erence is a friend of the enemy.
At the recent ICE Conference in Cape
Town (April 2017), Yunus Ballim PrEng,
Vice Chancellor of Sol Plaatje University
in Kimberley, and professor of civil engi-
neering at Wits University, on a platform
with distinguished colleagues Sundran
Naicker PrEng and Paul Jowitt CEng,
articulated two gems that appealed to my
civil engineering sense of social justice.
He said:
■ To be a civil engineer, is to be funda-
mentally engaged in critical matters of
the human condition; and
■ For civil engineers to avoid politics
– to not be involved in politics – is
fl awed and imaginary. Civil engineers
must intervene in places of power and
spaces of powerlessness.
Civilution expressly requires of us to be
honest with introspection. In the malaise
of our country’s past, SAICE practised
great circumspection when sharing views
outside of cold concrete civil engineering.
At the turn of the millennium, some of
our members from previously disadvan-
taged communities reluctantly joined
SAICE, because SAICE was “deafeningly
quiet” during the apartheid years, when
they needed us most. Th is is why many
black civil engineering practitioners still
claim that SAICE is a “white” organisa-
tion. Th e culture of SAICE, supported by
our membership statistics, shows oth-
erwise. But we shouldn’t miss the point.
SAICE should not repeat its mistakes, as
we will be judged severely for it in future,
in both moral and metaphysical terms.
I attended the funeral of Donald
Macleod PrEng, who was City Engineer
of Durban from 1976 to 1992. Millions
of people enjoy safe sanitation in Durban
because of Don’s leadership. At the memo-
rial I noticed the humility and understated
elegance of the full life of a good man. In
his SAICE presidential address in 1987,
he said, “We should never see the fruits of
technology as being of greater importance
than people. Our respect for the dignity
and immeasurable value of the human
being should always be upheld.” He was
known as a leftist in the nationalist climate
of the day. As a white civil engineer, he was
known for rescuing black people during
the Cator Manor uprising, and delivering
sanitation to black communities in a time
when policies and nationalist establish-
ment dictated otherwise.
Having worked with his son, Neil
Macleod PrEng, at SAICE, the Macleod
name is in the company of those bas-
tions of social justice mentioned in this
article – so, too, is the name of every
civil engineering practitioner who abides
by the traditions and tenets of this
incredible profession.
I am aware that SAICE is a nonpar-
tisan, impartial and unprejudiced voice
for civil engineering professionals. Our
objectives are the growth and develop-
ment of our members, and the promotion
of the science and practice of civil engi-
neering and the advancement of the civil
engineering profession. Ahmed Kathrada
would have agreed with us and then said,
“… I express the hope that you will choose
the correct way.”
So what is the correct way? My per-
sonal answer to the icon would be along
these lines:
“Our involvement is unattached to
any individual, political party or schisms
in party politics. It is principally asso-
ciated with good governance and the
role of state in creating conditions for
democratic process, and social justice in
South Africa. Civil engineering serves all
South Africans. Recent instances of dys-
functional and unaccountable behaviour
in parliament, as well as unclear reasons
for ministerial appointments, cause
concern about our government’s ability
to properly respond to the development,
infrastructure and socio-economic
well-being of South Africa. I am a civil
engineer. I protest for the South Africa I
love, because I believe in its resilience.”
With sword in one hand and pen in
the other, my answer to Nanda Sooben is,
“Yes! Th ere are still good men and women
left amongst 52 million South Africans.
We have 13 000 of them – we are civil
engineering professionals.”
A good name is more desirable than great riches …
(Proverbs 22:1)
FROM THE CEO’S DESK
The Don. . . . . . . . . . . . . . . . . . . . . . . . . . . . . . . . . . . . . . . . . . . . . . . . . . . . . . . . . . . . . . . . 1
ON THE COVER
Franki overcomes challenges on the Paarl bulk sewer line . . . . . . . . . . . . . . . . . . . . . . 7
PROFILE
Loving his job because it’s meaningful. . . . . . . . . . . . . . . . . . . . . . . . . . . . . . . . . . . . . . 10
GEOTECHNICAL ENGINEERING
Southern Cape Landslip, Mossel Bay . . . . . . . . . . . . . . . . . . . . . . . . . . . . . . . . . . . . . . . 14
St Helena Airport dry gut rockfi ll. . . . . . . . . . . . . . . . . . . . . . . . . . . . . . . . . . . . . . . . . . . 21
Some geotechnical aspects of small hydropower projects in
Southern, Central and East Africa. . . . . . . . . . . . . . . . . . . . . . . . . . . . . . . . . . . . . . . . . . 29
Town Hill pipe jack . . . . . . . . . . . . . . . . . . . . . . . . . . . . . . . . . . . . . . . . . . . . . . . . . . . . . . 33
Geotechnical engineering through the Kranspoort Pass . . . . . . . . . . . . . . . . . . . . . . . . 38
Wall 3 Versfeld Pass, Piketberg. . . . . . . . . . . . . . . . . . . . . . . . . . . . . . . . . . . . . . . . . . . . 42
The problem with MSE walls –
a case study in support of integrated geotechnical engineering design . . . . . . . . . . . 47
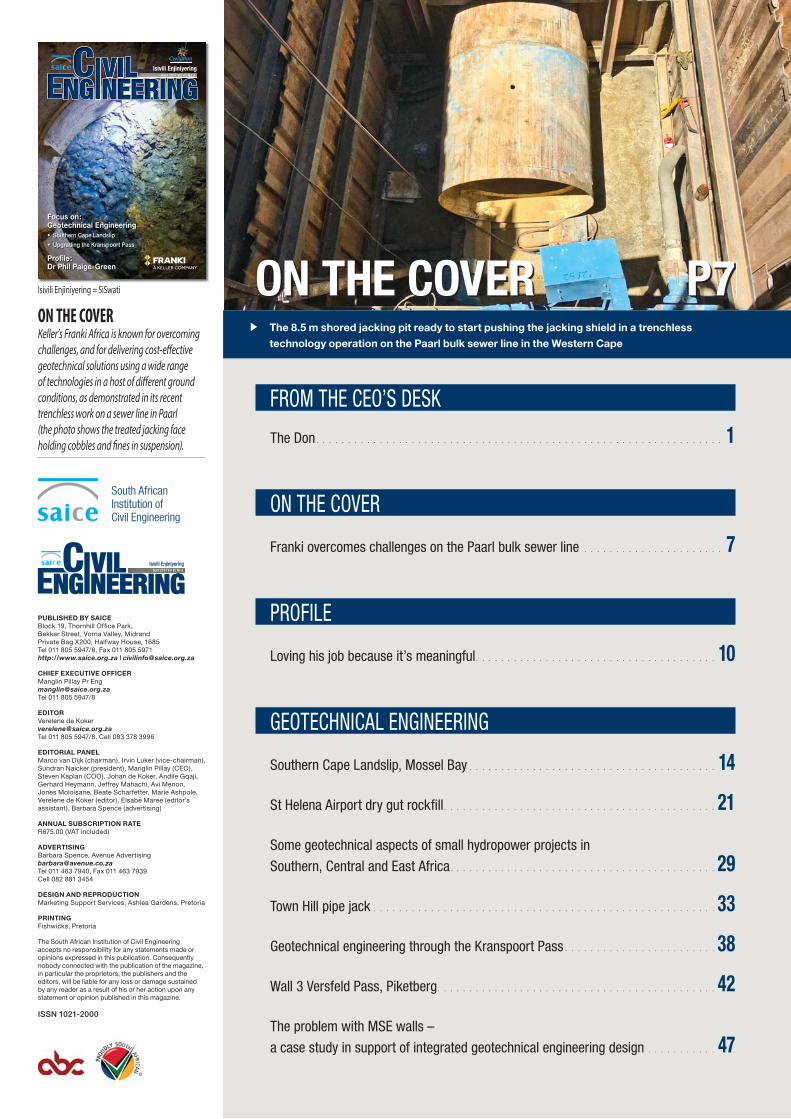
The 8.5 m shored jacking pit ready to start pushing the jacking shield in a trenchless
technology operation on the Paarl bulk sewer line in the Western Cape
ON THE COVERKeller’s Franki Africa is known for overcoming challenges, and for delivering cost-eff ective geotechnical solutions using a wide range of technologies in a host of diff erent ground conditions, as demonstrated in its recent trenchless work on a sewer line in Paarl (the photo shows the treated jacking face holding cobbles and fi nes in suspension).
April 2017 Vol 25 No 3
Isivili Enjiniyering
Focus on: Geotechnical Engineering• Southern Cape Landslip
• Upgrading the Kranspoort Pass
Profi le: Dr Phil Paige-Green
South African Institution ofCivil Engineering
April 2017 Vol 25 No 3
Isivili EnjiniyeringIsivili Enjiniyering
Isivili Enjiniyering = SiSwati
PUBLISHED BY SAICEBlock 19, Thornhill Offi ce Park, Bekker Street, Vorna Valley, MidrandPrivate Bag X200, Halfway House, 1685Tel 011 805 5947/8, Fax 011 805 5971http://www.saice.org.za | [email protected]
CHIEF EXECUTIVE OFFICERManglin Pillay Pr [email protected] 011 805 5947/8
EDITORVerelene de [email protected] 011 805 5947/8, Cell 083 378 3996
EDITORIAL PANELMarco van Dijk (chairman), Irvin Luker (vice-chairman), Sundran Naicker (president), Manglin Pillay (CEO), Steven Kaplan (COO), Johan de Koker, Andile Gqaji, Gerhard Heymann, Jeffrey Mahachi, Avi Menon, Jones Moloisane, Beate Scharfetter, Marie Ashpole, Verelene de Koker (editor), Elsabé Maree (editor’s assistant), Barbara Spence (advertising)
ANNUAL SUBSCRIPTION RATER675.00 (VAT included)
ADVERTISINGBarbara Spence, Avenue [email protected] 011 463 7940, Fax 011 463 7939Cell 082 881 3454
DESIGN AND REPRODUCTIONMarketing Support Services, Ashlea Gardens, Pretoria
PRINTINGFishwicks, Pretoria
The South African Institution of Civil Engineering accepts no responsibility for any statements made or opinions expressed in this publication. Consequently nobody connected with the publication of the magazine, in particular the proprietors, the publishers and the editors, will be liable for any loss or damage sustained by any reader as a result of his or her action upon any statement or opinion published in this magazine.
ISSN 1021-2000
ON THE COVER P7

Civil Engineering April 2017 3
Ground improvement by compaction grouting in IHC5 and
IHC7 dolomitic conditions . . . . . . . . . . . . . . . . . . . . . . . . . . . . . . . . . . . . . . . . . . .53
A case study illustrating the advantages of detailed gravity
surveys in dolomitic terrain . . . . . . . . . . . . . . . . . . . . . . . . . . . . . . . . . . . . . . . . . . 59
Rigid inclusions – an innovative geotechnical solution for
challenging ground conditions. . . . . . . . . . . . . . . . . . . . . . . . . . . . . . . . . . . . . . . .63
The use of CSW testing to estimate bedrock depth . . . . . . . . . . . . . . . . . . . . . .68
Geotechnical research at WITS . . . . . . . . . . . . . . . . . . . . . . . . . . . . . . . . . . . . . . . 74
Soil Mechanics Research Group at CUT . . . . . . . . . . . . . . . . . . . . . . . . . . . . . . . .77
Are you smarter than a student? . . . . . . . . . . . . . . . . . . . . . . . . . . . . . . . . . . . . . 81
SAICE AND PROFESSIONAL NEWS
SAICE Training Calendar 2017. . . . . . . . . . . . . . . . . . . . . . . . . . . . . . . . . . . . . . . .86
P38
P14
P53
P29
executionexcellence in execution

1
2
3 4
5
DOWN
1. The formula p=m•v is used to calculate.
2. The SI Unit for Pascals (the derived unit
to quantify internal pressure).
3. The letter S in S=d/t is used to notate
which scalar quantity?
4. Formula for the volume of a cube.
ACROSS
5. The equation stated by Émile Clapeyron in
1834 as a combination of the empirical
Boyle’s law, Charles’ law and Avogadro’s
Law commonly known as the ideal gas law.
You’re an engineering professional. You’ve spent years studying your chosen field. So you don’t need us to help you with the answers to this crossword. Completing it,
however, will be revealing. Your rarity should be rewarding - and with PPS, it is. Bespoke financial solutions and rewards tailored for graduate professionals only.To find out more, contact your PPS-accredited financial adviser or visit pps.co.za
#RAREISREWARDING
Financial Planning Short-Term Insurance Medical AidInvestmentsLife Insurance
PPS offers unique financial solutions to select graduate professionals. PPS is an authorised Financial Services Provider.
Civil Engineering April 2017 7
INTRODUCTIONKeller’s Franki Africa has a reputation for being able to deliver cost-
eff ective geotechnical solutions using a wide range of appropriate
technologies in a host of diff erent, and often challenging, ground
conditions. “We have worked in southern Africa for many decades
and have a profound understanding of the diff erent soil conditions
and the optimal geotechnical solutions for them,” says Franki’s
Trenchless Technology Manager, Byron Field.
He adds that this knowledge enables the company to be pro-
active in solving problems that, on the face of it, sometimes seem
insoluble. Th e Drakenstein Municipality’s bulk sewer pipeline is an
excellent example of this.
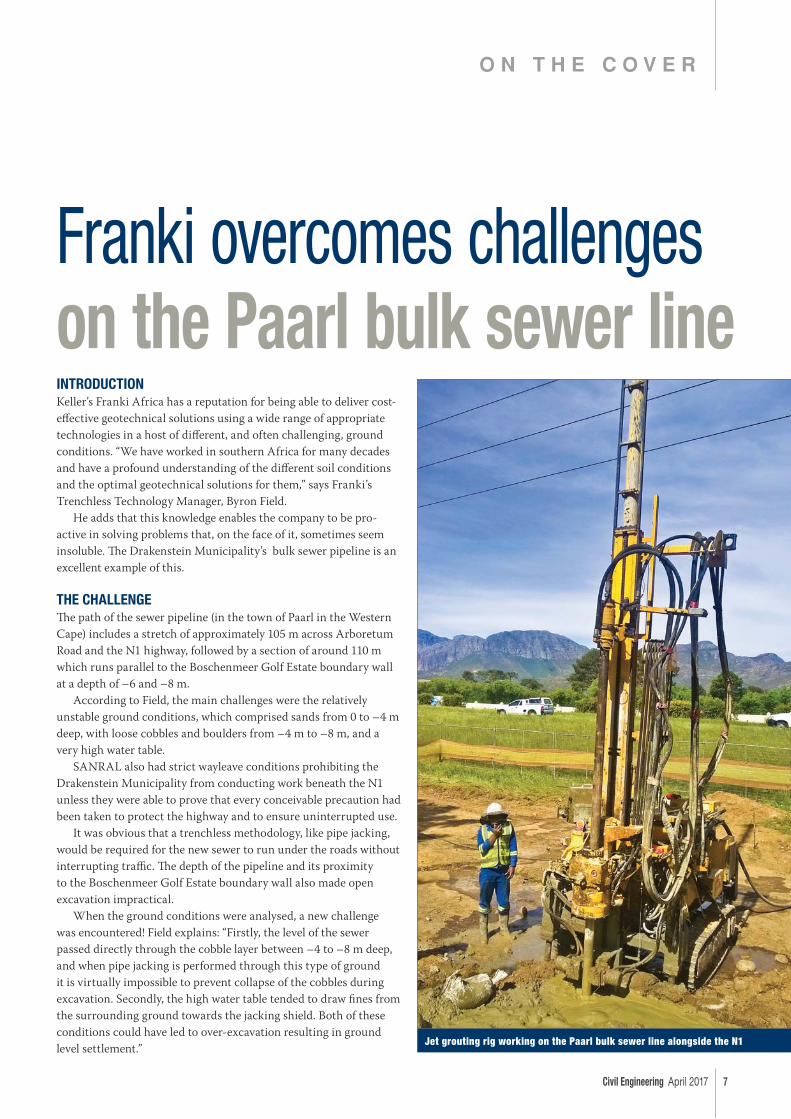
THE CHALLENGETh e path of the sewer pipeline (in the town of Paarl in the Western
Cape) includes a stretch of approximately 105 m across Arboretum
Road and the N1 highway, followed by a section of around 110 m
which runs parallel to the Boschenmeer Golf Estate boundary wall
at a depth of –6 and –8 m.
According to Field, the main challenges were the relatively
unstable ground conditions, which comprised sands from 0 to –4 m
deep, with loose cobbles and boulders from –4 m to –8 m, and a
very high water table.
SANRAL also had strict wayleave conditions prohibiting the
Drakenstein Municipality from conducting work beneath the N1
unless they were able to prove that every conceivable precaution had
been taken to protect the highway and to ensure uninterrupted use.
It was obvious that a trenchless methodology, like pipe jacking,
would be required for the new sewer to run under the roads without
interrupting traffi c. Th e depth of the pipeline and its proximity
to the Boschenmeer Golf Estate boundary wall also made open
excavation impractical.
When the ground conditions were analysed, a new challenge
was encountered! Field explains: “Firstly, the level of the sewer
passed directly through the cobble layer between –4 to –8 m deep,
and when pipe jacking is performed through this type of ground
it is virtually impossible to prevent collapse of the cobbles during
excavation. Secondly, the high water table tended to draw fi nes from
the surrounding ground towards the jacking shield. Both of these
conditions could have led to over-excavation resulting in ground
level settlement.”
O N T H E C O V E R
Franki overcomes challenges on the Paarl bulk sewer line
Jet grouting rig working on the Paarl bulk sewer line alongside the N1

8 April 2017 Civil Engineering
FRANKI’S PROACTIVE PROPOSALFranki approached the Drakenstein Municipality with a proposal
to treat the ground beneath Arboretum Road and the N1, as well
as alongside the Boschenmeer Golf Estate boundary wall.
Th e proposal entailed jet grouting – which involves the
mixing and partial replacement of the in-situ soil with cement
slurry – to consolidate the in-situ ground condition along the
sewer centreline and between the depths of –4 to –9 m, and
to then install a pipe jack through the treated ground. “Th e
treatment of the ground would prevent collapse of the sand and
cobbles during pipe jack excavation and would reduce the ingress
of water to manageable levels,” Field says.
He adds that jet grouting was Franki’s preferred method of
treatment, as high-pressure jetting can be used to consolidate in-
situ ground at exact levels, and can provide up to 2.5 m diameter
columns with only an 80 mm drill stem.
Th e municipality’s design team included the proposed
solution in the tender document for this phase of the works
and, in August 2016, Franki was appointed by the main
contractor, Vakala Construction, to carry out the specialist
geotechnical work.
THE RESULTField says that the jet grouting went according to plan and was
carried out with zero impact on traffi c. “In addition, once the jet
grouting had been completed and the site cleared, there was no
remaining evidence at ground level that the ground beneath had
been treated.
“Th e entire pipe jacking operation went smoothly, with
the ground treatment working better than even our highest
expectations.”
Th e sub-contract work was completed by Franki on time
(February 2017) and within budget.
FRANKI – MORE THAN JUST PILESFranki is renowned for its geotechnical solutions using an array
of diff erent piles, including driven tube piles, precast piles, auger
piles, full displacement screwpiles, rotapiles, micropiles, the
famous Frankipile (driven cast-in-situ pile) and many more. It
is also well-known for its soil improvement systems, including
dyna mic compaction, deep soil mixing, accelerated consolida-
tion, and of course jet grouting as discussed above.
Franki’s skills in trenchless technology are just as impressive.
For more than 30 years it has successfully been providing pipe
jacking and other trenchless technologies – augering, thrust
boring and large-diameter case boring – to a wide range of
clients in southern Africa.
Trenchless technology is a ‘family’ of methods, materials and
equipment capable of being used for the installation, replacement
or rehabilitation of existing underground infrastructure with
minimal disruption to surface traffi c, business and other activi-
ties. It is, therefore, often the most cost-eff ective solution.
Pipe jacking, an integral part of this ‘family’, is a technique
for installing underground pipelines, ducts and culverts.
Powerful hydraulic jacks are used to push specially designed
pipes through the ground behind a shield at the same time as
excavation is taking place within the shield. Th e method provides
a fl exible, structural, watertight, fi nished pipeline as the tunnel
is excavated.
CONCLUSIONBy being part of the Keller Group, Franki’s leadership in the
geotechnical space in southern Africa has been signifi cantly
enhanced. Keller is the world’s largest independent geotechnical
engineering contractor, off ering Franki signifi cant advantages,
such as access to a wide range of innovative technologies, state-
of-the-art machinery and a wealth of geotechnical intellectual
property and experience.
INFO
Victor Ferreira
Franki Africa
+27 11 531 2700
Treated ground at jacking faceExposed trial jet grout column clearly showing dense cobbles that are bound together after treatment

HIGH MAST AND STREET POLE SPECIALIST
View the full range of products and services
on our newly launched website
www.lightingstructures.co.za
Our product offering includes the design, manufacture and installation of high masts and towers.
Expertise also entails the supply of lighting poles and decorative light fittings for infrastructural and residential developments.
Tel: 083 701 4253/082 776 8479

10 April 2017 Civil Engineering
“While I had the modem on loan I had to respond to that email
by either accepting or declining the award. I thought about past
recipients such as Jere Jennings, Geoff Blight, Tony Williams, Tony
Brink, Fritz Wagener, Peter Day and others, and wondered if I, an
engineering geologist, should ever be placed on the same pedestal as
any of them. I didn’t really think so, but agreed to accept the medal
before the committee changed their minds! I must say that I feel
really honoured and humbled to have been recognised in this way.”
EARLY LOVE AFFAIR WITH STONESWhen Phil was around six or seven years old, while living in a
small mining town in Swaziland, he was given a few stones by an
old woman on the mine who was moving house. From then on
(with some help from the mine geologist) he was always going
to be a geologist. Living on some of the world’s oldest ultramafi c
rocks belonging to the 3.5 billion years old Onverwacht Group
of the famed Barberton Super Group probably also helped in
developing his geological disposition.
“Behind our house on the mine was a 4 to 5 m high cut-
ting in clay – I would now probably call it a ‘slightly moist,
red mottled orange, fi rm to stiff , fi ssured, silty clay, residual
basalt/ greenstone’ – in which I had excavated many metres of
roads, half tunnels, full tunnels and underground cavities for my
collection of dinky cars. Little did I know then that I would spend
more than 40 years of my life involved in these on a much larger
scale. I also used to gaze at the landslides in our backyard each
time it rained, wondering why this happened, and where all of my
structures and roads had gone – obviously non-climate resilient!
I knew that the rain caused it, but didn’t know why at that stage.”
GAINING AN UNDERSTANDING OF STONES AND SOILSAfter moving to Durban and completing high school, Phil
did a BSc in Geology at the University of Natal, including an
introductory course in engineering geology from Rodney Maud,
which resulted in him topping up his degree with a Master’s in
Engineering Geology, based on Rodney’s fascinating tales of life
as an engineering geologist.
Th is was the start of his training and mentorship under
such infl uential people as Ken Knight (Phil’s lecturer in soil
mechanics and co-supervisor of his MSc), Rodney Maud (lec-
turer and examiner of his MSc), and others. At the time (1975)
he had the opportunity to attend his fi rst of seven Regional
African Conferences on SMFE (Soil Mechanics and Foundation
Engineering) in Durban, where he met numerous people who
later infl uenced his career signifi cantly.
P R O F I L E
Loving his job because it’s meaningfulDr Phil Paige-Green, the both-feet-on-the-ground 2016 recipient of SAICE’s Geotechnical Gold Medal, received the news of his nomination for this award while working near Xai Xai in the Gaza Province of Mozambique – after borrowing a modem to download emails so as to avoid too many when he got back to civilisation.
Dr Phil Paige-Green, 2016 recipient of SAICE’s Geotechnical Gold Medal
A gift of a few stones when Phil was small inspired a lifelong passion for geology
Civil Engineering April 2017 11
While at the University of Natal, Phil was off ered a position at
the then National Institute of Road Research at the CSIR, where
he started in 1976, and remained until his retirement from the
CSIR in 2013.
“I consider myself lucky in my career. As Isaac Newton said way
back in 1676: ‘If I have seen further, it is by standing on the shoulders
of giants’. I have managed to meet and work with many of the giants
in the geotechnical fi eld, all of whom have helped me, a relative
dwarf, to see further. In fact, there are only three or four names on
the list of the past 32 Gold Medal recipients that I never got to meet.
Many of the remainder I have worked closely with over the years –
these include such giants as Tony Williams, Tony Brink, Gary Jones,
Frank Netterberg, Hartmut Weinert, Peter Day and many others. I
am also happy to see that I am the fourth engineering geologist to
be honoured with this prestigious engineering award, the others
being Tony Brink, Frank Netterberg and Hartmut Weinert, all of
whom I have worked with over the years, and coincidentally all of
whom had spent at least part of their careers at the CSIR.”
FIRST GEOTECHNICAL TASKWhen he started at the CSIR, Gary Jones was his fi rst boss, and
one of his fi rst geotechnical jobs was the proposed Wonderfontein
section of the N4. Gary told Phil to go and profi le the sites of two
embankment fi lls and a bridge foundation, and do some CPT pro-
fi les using the newly introduced equipment (before piezocones).
“I did the fi eld work, went back to the offi ce and sent the fi eld
sheets through to Gary. He called me in and told me that I had only
done half a job, and that I needed to analyse them as well and see if
the preliminary designs were adequate. I didn’t have a clue what to
do and so, after a quick course by Gary in applied foundation engi-
neering, I carried on and did it. It transpired that the materials were
very weak, fi ssured, residual clays, and one of the embankments
and the bridge foundations would probably have failed as designed
originally – I am pleased to say they are still there today!”
TURNING A DILEMMA INTO MEANINGFUL WORKTh e theme of Phil’s PhD thesis in the mid-80s (University of
Pretoria) was, Th e infl uence of geotechnical properties on the
performance of gravel-wearing course materials. “With my PhD
came the realisation that I had a bit of a dilemma – was I doing
the work of a geologist or an engineer? Th e material selection and
performance modelling of unpaved road behaviour led onto the
design, which was suddenly an engineering issue more than engi-
neering geology, but I knew I couldn’t be an engineer, although I
did join SAICE at that time as a visitor.”
As it turned out, Phil moved into materials investigation for
low-volume paved roads and then the design of these, which is
what still keeps him busy today as an independent consultant.
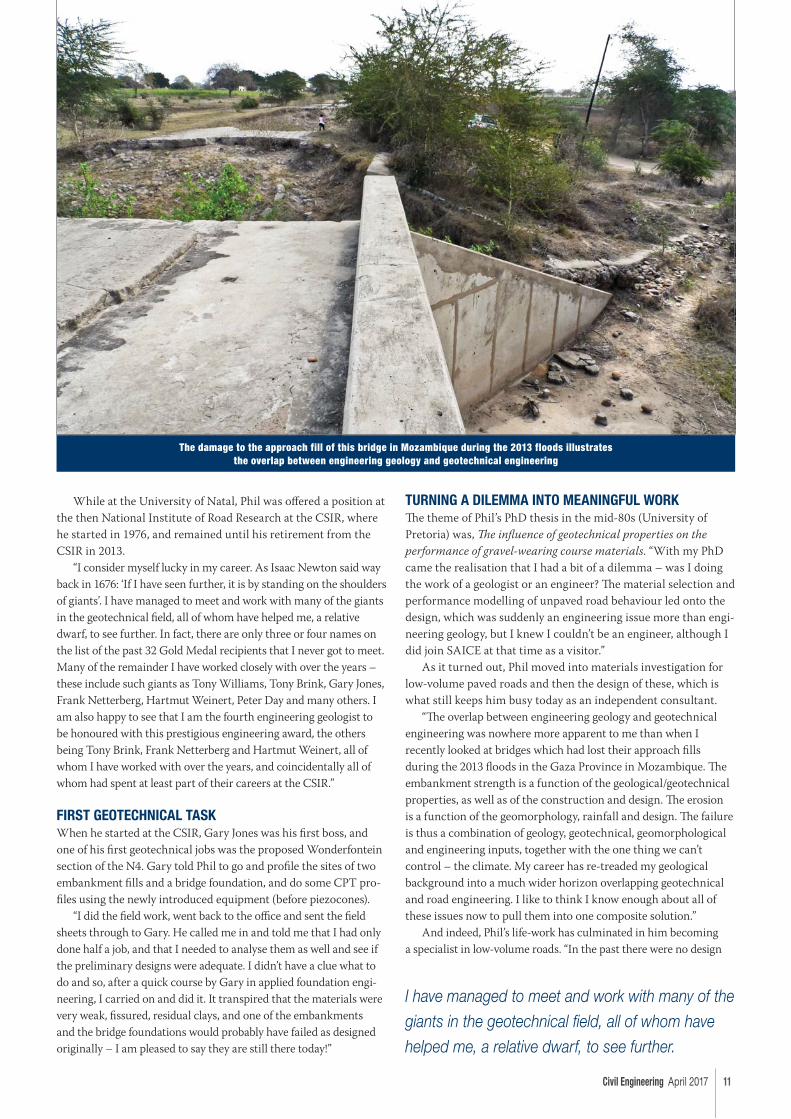
“Th e overlap between engineering geology and geotechnical
engineering was nowhere more apparent to me than when I
recently looked at bridges which had lost their approach fi lls
during the 2013 fl oods in the Gaza Province in Mozambique. Th e
embankment strength is a function of the geological/geotechnical
properties, as well as of the construction and design. Th e erosion
is a function of the geomorphology, rainfall and design. Th e failure
is thus a combination of geology, geotechnical, geomorphological
and engineering inputs, together with the one thing we can’t
control – the climate. My career has re-treaded my geological
background into a much wider horizon overlapping geotechnical
and road engineering. I like to think I know enough about all of
these issues now to pull them into one composite solution.”
And indeed, Phil’s life-work has culminated in him becoming
a specialist in low-volume roads. “In the past there were no design
The damage to the approach fill of this bridge in Mozambique during the 2013 floods illustrates the overlap between engineering geology and geotechnical engineering
I have managed to meet and work with many of the
giants in the geotechnical fi eld, all of whom have
helped me, a relative dwarf, to see further.
12 April 2017 Civil Engineering
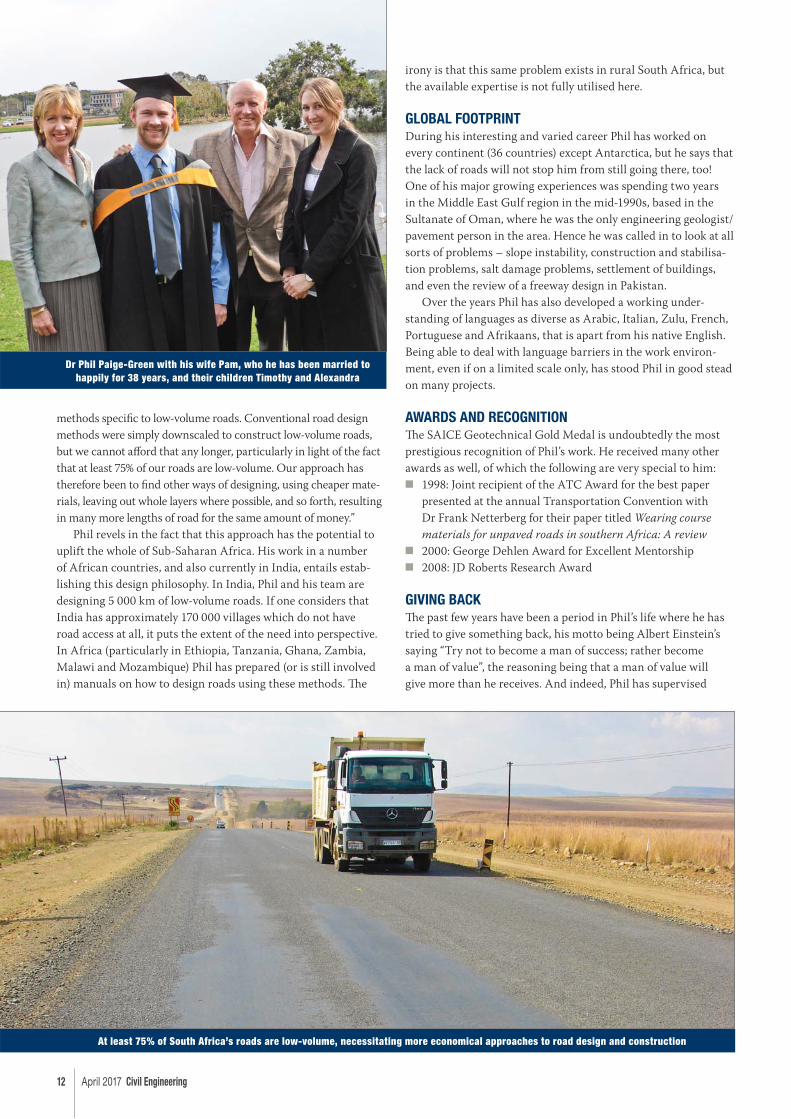
methods specifi c to low-volume roads. Conventional road design
methods were simply downscaled to construct low-volume roads,
but we cannot aff ord that any longer, particularly in light of the fact
that at least 75% of our roads are low-volume. Our approach has
therefore been to fi nd other ways of designing, using cheaper mate-
rials, leaving out whole layers where possible, and so forth, resulting
in many more lengths of road for the same amount of money.”
Phil revels in the fact that this approach has the potential to
uplift the whole of Sub-Saharan Africa. His work in a number
of African countries, and also currently in India, entails estab-
lishing this design philosophy. In India, Phil and his team are
designing 5 000 km of low-volume roads. If one considers that
India has approximately 170 000 villages which do not have
road access at all, it puts the extent of the need into perspective.
In Africa (particularly in Ethiopia, Tanzania, Ghana, Zambia,
Malawi and Mozambique) Phil has prepared (or is still involved
in) manuals on how to design roads using these methods. Th e
irony is that this same problem exists in rural South Africa, but
the available expertise is not fully utilised here.
GLOBAL FOOTPRINTDuring his interesting and varied career Phil has worked on
every continent (36 countries) except Antarctica, but he says that
the lack of roads will not stop him from still going there, too!
One of his major growing experiences was spending two years
in the Middle East Gulf region in the mid-1990s, based in the
Sultanate of Oman, where he was the only engineering geologist/
pavement person in the area. Hence he was called in to look at all
sorts of problems – slope instability, construction and stabilisa-
tion problems, salt damage problems, settlement of buildings,
and even the review of a freeway design in Pakistan.
Over the years Phil has also developed a working under-
standing of languages as diverse as Arabic, Italian, Zulu, French,
Portuguese and Afrikaans, that is apart from his native English.
Being able to deal with language barriers in the work environ-
ment, even if on a limited scale only, has stood Phil in good stead
on many projects.
AWARDS AND RECOGNITIONTh e SAICE Geotechnical Gold Medal is undoubtedly the most
prestigious recognition of Phil’s work. He received many other
awards as well, of which the following are very special to him:
■ 1998: Joint recipient of the ATC Award for the best paper
presented at the annual Transportation Convention with
Dr Frank Netterberg for their paper titled Wearing course
materials for unpaved roads in southern Africa: A review
■ 2000: George Dehlen Award for Excellent Mentorship
■ 2008: JD Roberts Research Award
GIVING BACKTh e past few years have been a period in Phil’s life where he has
tried to give something back, his motto being Albert Einstein’s
saying “Try not to become a man of success; rather become
a man of value”, the reasoning being that a man of value will
give more than he receives. And indeed, Phil has supervised
At least 75% of South Africa’s roads are low-volume, necessitating more economical approaches to road design and construction
Dr Phil Paige-Green with his wife Pam, who he has been married to happily for 38 years, and their children Timothy and Alexandra

Civil Engineering April 2017 13
six PhDs and numerous Master’s theses, and lectured for
many years at various universities in South Africa, which led
to his appointment as Extraordinary Professor in the Faculty
of Engineering and the Built Environment at the Tshwane
University of Technology three years ago, where he taught
geology for engineers, geo mechanics, construction materials
and concrete technology. Phil found this very rewarding, indeed,
but says, “I just don’t have the time to set tests and exams, and
do the marking, so now I only do post-graduate supervision and
exam moderation, as well as serving on the Academic Advisory
Committees. I also present regular courses for SARF on unpaved
roads, low-volume paved roads and stabilisation, and have also
given courses in New Zealand and the USA.”
INVOLVEMENT IN PROFESSIONAL BODIESAs a committee member of the SAICE Geotechnical Division
and a Council member of SAIEG (South African Institute for
Engineering and Environmental Geologists) over many years,
Phil has tried to foster closer relationships between the two
organisations, as they are undeniably linked. He believes that the
two bodies are currently very close to each other and, as the need
for CPD points for engineering geologists grows with the recent
introduction of this requirement for natural scientists, mutual
association will get even closer. SAIEG is also working with
ECSA (thanks to SAICE’s Peter Day for his on-going involve-
ment) in the tricky area of job description.
ADVICE TO YOUNG ENGINEERSPhil has mentored many young engineers, and his advice to them
can be summarised as follows:
■ Improve your qualifi cations.
■ Learn from the people around you.
■ Don’t job-hop for the sake of money; rather build a steady
career.
■ Do what you do do well (from a ’60s song by Ned Miller)
ADVICE TO ENGINEERS IN GENERALNearing retirement age himself now, he cautions against special-
ising in too narrow a fi eld, which could limit one’s employment
potential in later years quite considerably. Phil’s expertise is in
fact a good example of diversifi cation, as, within his specialised
fi eld (construction materials) he is skilled in paved and unpaved
low-volume roads, cement and lime road stabilisation, the
geology of roads and the forensic aspects thereof, the manage-
ment of potholes (identifying the cause before patching), and the
evaluation of proprietary soil stabilisers.
FUTURE PLANS, PHILOSOPHY OF LIFEPhil quips that some of his geological colleagues older than him
say, ”We never retire, we seem to weather with time and eventu-
ally decompose in the ultimate test pit.” Although Phil hopes
to start slowing down soon, he is still fully occupied, mostly on
projects beyond our borders.
He would love to spend more time off the beaten track,
watching and photographing birds. His family have in any case
become used to repeated stops on holiday trips so that he can
take photos of geology, roads and other engineering things!
Verelene de Koker
14 April 2017 Civil Engineering
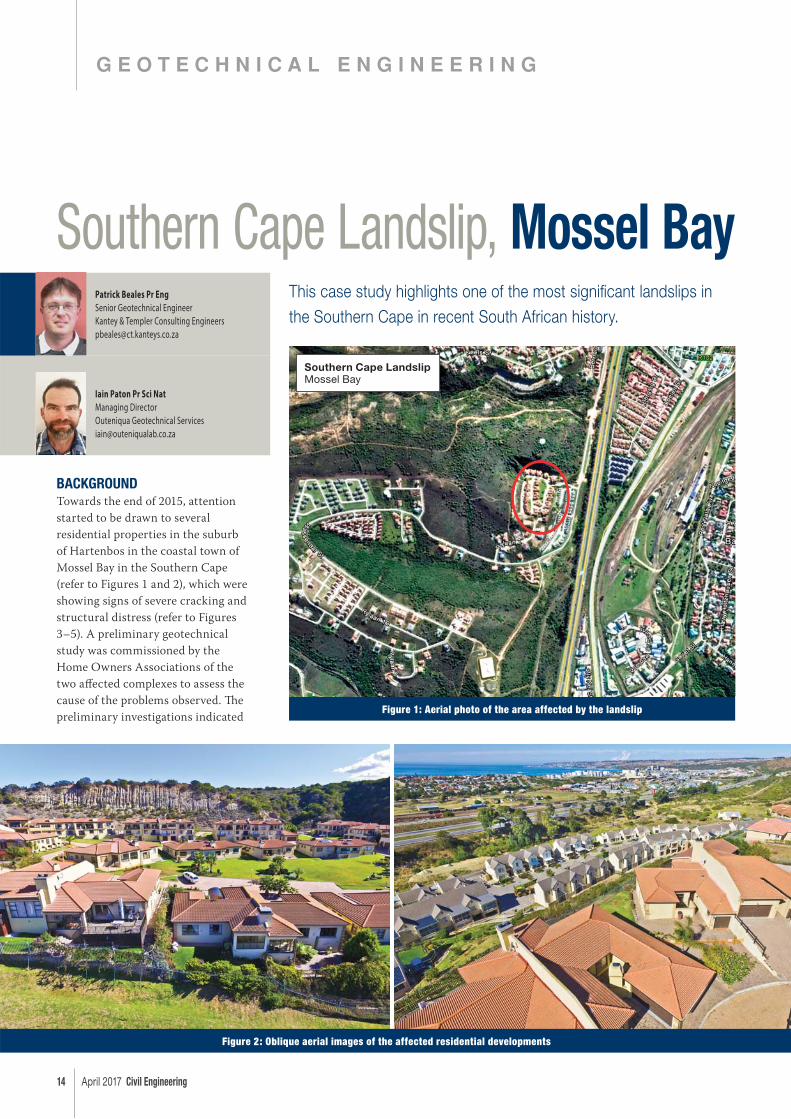
BACKGROUNDTowards the end of 2015, attention
started to be drawn to several
residential properties in the suburb
of Hartenbos in the coastal town of
Mossel Bay in the Southern Cape
(refer to Figures 1 and 2), which were
showing signs of severe cracking and
structural distress (refer to Figures
3–5). A preliminary geotechnical
study was commissioned by the
Home Owners Associations of the
two aff ected complexes to assess the
cause of the problems observed. Th e
preliminary investigations indicated
G E O T E C H N I C A L E N G I N E E R I N G
Patrick Beales Pr Eng
Senior Geotechnical EngineerKantey & Templer Consulting [email protected]
Iain Paton Pr Sci Nat
Managing DirectorOuteniqua Geotechnical [email protected]
Southern Cape Landslip, Mossel BayThis case study highlights one of the most signifi cant landslips in the Southern Cape in recent South African history.
Figure 1: Aerial photo of the area affected by the landslip
Southern Cape LandslipMossel Bay
Figure 2: Oblique aerial images of the affected residential developments
Civil Engineering April 2017 15
CAPE TOWN (021) 405 9600DURBAN (031) 266 6535JOHANNESBURG (011) 501 4760
EAST LONDON (043) 762 6443PORT SHEPSTONE (039) 315 1519
www.kanteys.co.zaBranches:GEORGE (044) 874 2177PIETERMARITZBURG (033) 347 5453PORT ELIZABETH (041) 373 0738
K&T are proud to have provided the Geotechnical Engineering services to this challenging project.
GEOTECHNICAL
CIVIL
STRUCTURAL
MECHANICAL
ELECTRICAL
PETROCHEMICAL
URBAN & RURAL
DEVELOPMENT
ROADS &
TRANSPORTATION
CONTAMINATION
ENVIRONMENTAL
QUANTITY SURVEYING
& COST ENGINEERING
Engineering Fields:
www.kanteys.co.za
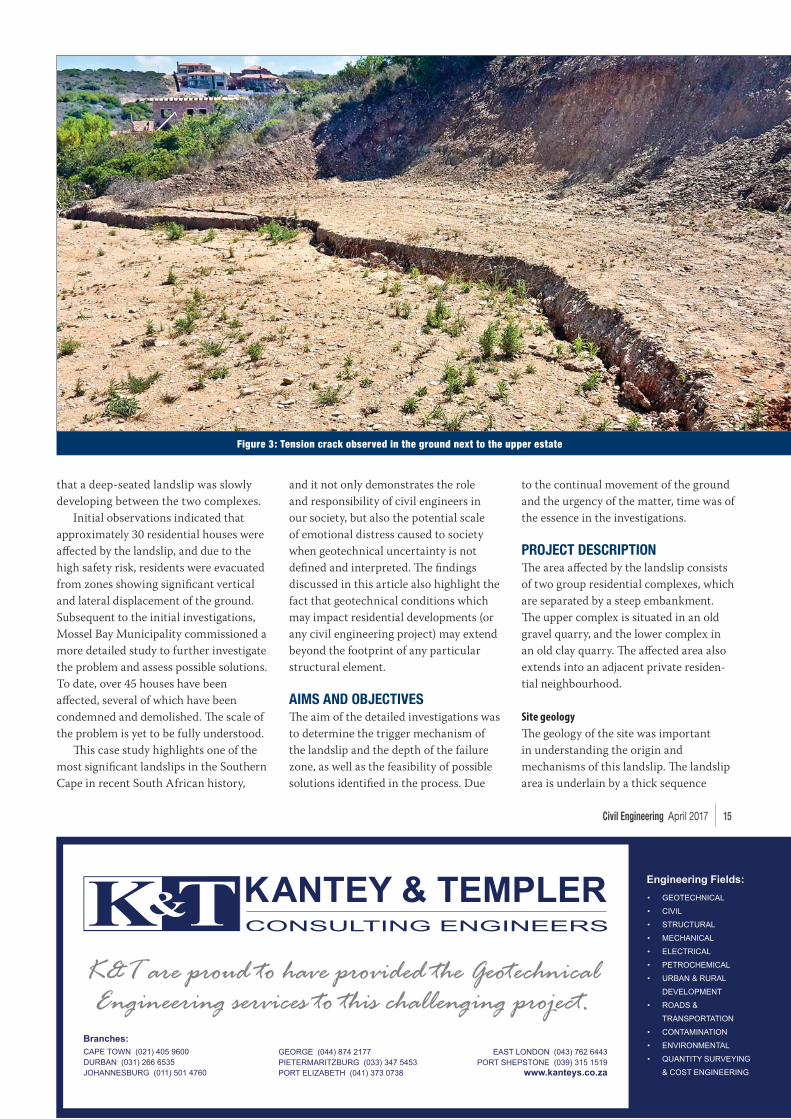
that a deep-seated landslip was slowly
developing between the two complexes.
Initial observations indicated that
approximately 30 residential houses were
aff ected by the landslip, and due to the
high safety risk, residents were evacuated
from zones showing signifi cant vertical
and lateral displacement of the ground.
Subsequent to the initial investigations,
Mossel Bay Municipality commissioned a
more detailed study to further investigate
the problem and assess possible solutions.
To date, over 45 houses have been
aff ected, several of which have been
condemned and demolished. Th e scale of
the problem is yet to be fully understood.
Th is case study highlights one of the
most signifi cant landslips in the Southern
Cape in recent South African history,
and it not only demonstrates the role
and responsibility of civil engineers in
our society, but also the potential scale
of emotional distress caused to society
when geotechnical uncertainty is not
defi ned and interpreted. Th e fi ndings
discussed in this article also highlight the
fact that geotechnical conditions which
may impact residential developments (or
any civil engineering project) may extend
beyond the footprint of any particular
structural element.
AIMS AND OBJECTIVESTh e aim of the detailed investigations was
to determine the trigger mechanism of
the landslip and the depth of the failure
zone, as well as the feasibility of possible
solutions identifi ed in the process. Due
to the continual movement of the ground
and the urgency of the matter, time was of
the essence in the investigations.
PROJECT DESCRIPTIONTh e area aff ected by the landslip consists
of two group residential complexes, which
are separated by a steep embankment.
Th e upper complex is situated in an old
gravel quarry, and the lower complex in
an old clay quarry. Th e aff ected area also
extends into an adjacent private residen-
tial neighbourhood.
Site geology
Th e geology of the site was important
in understanding the origin and
mechanisms of this landslip. Th e landslip
area is underlain by a thick sequence
Figure 3: Tension crack observed in the ground next to the upper estate
16 April 2017 Civil Engineering
of alluvial sediments of the Uitenhage
Group, which consists locally of the
younger Buff elskloof Formation and the
older underlying Kirkwood Formation.
Th e depositional environment was a
dynamic coastal embayment created
under fl uctuating sea levels, with interfi n-
gering of marine, estuarine and alluvial
sediments. Th e Kirkwood Formation
was deposited in a low-energy fl uvial
environment, and consists mainly of
mudstone and fi ne sandstone. Subsequent
continental uplift and regression of sea
levels resulted in increased erosion of
the interior Cape Fold Belt mountains,
and rivers fl owing from these high-lying
areas bisected lower-lying alluvial ter-
races, depositing thick sequences of sand,
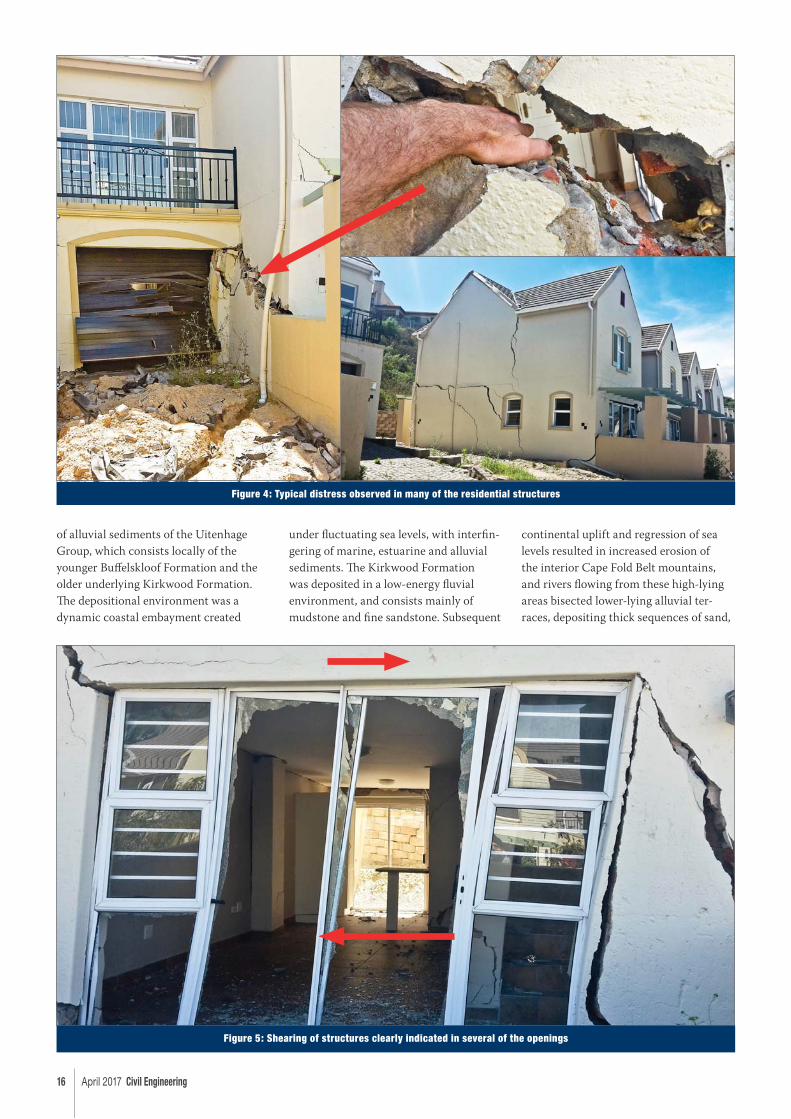
Figure 5: Shearing of structures clearly indicated in several of the openings
Figure 4: Typical distress observed in many of the residential structures
Civil Engineering April 2017 17
gravel and cobbles (conglomerate) of the
Buff elskloof Formation in gullies and
large alluvial fans.
At the site under investigation, the
Kirkwood Formation is exposed on the
lower part of the site, and the Buff elskloof
Conglomerate is exposed on the upper part.
Th e contact between the two formations
is exposed along the steep embankment
between the two residential complexes. Th e
contact between the two formations dips
towards the base of the slope.
Site investigation methods
Several shallow test pits, as well as rotary
core boreholes, were drilled across the
site. Cross sections were then taken be-
tween the boreholes in order to establish
a geological model of the site, and samples
of residual Kirkwood clay were taken
to determine indicative shear strength
parameters in the laboratory.
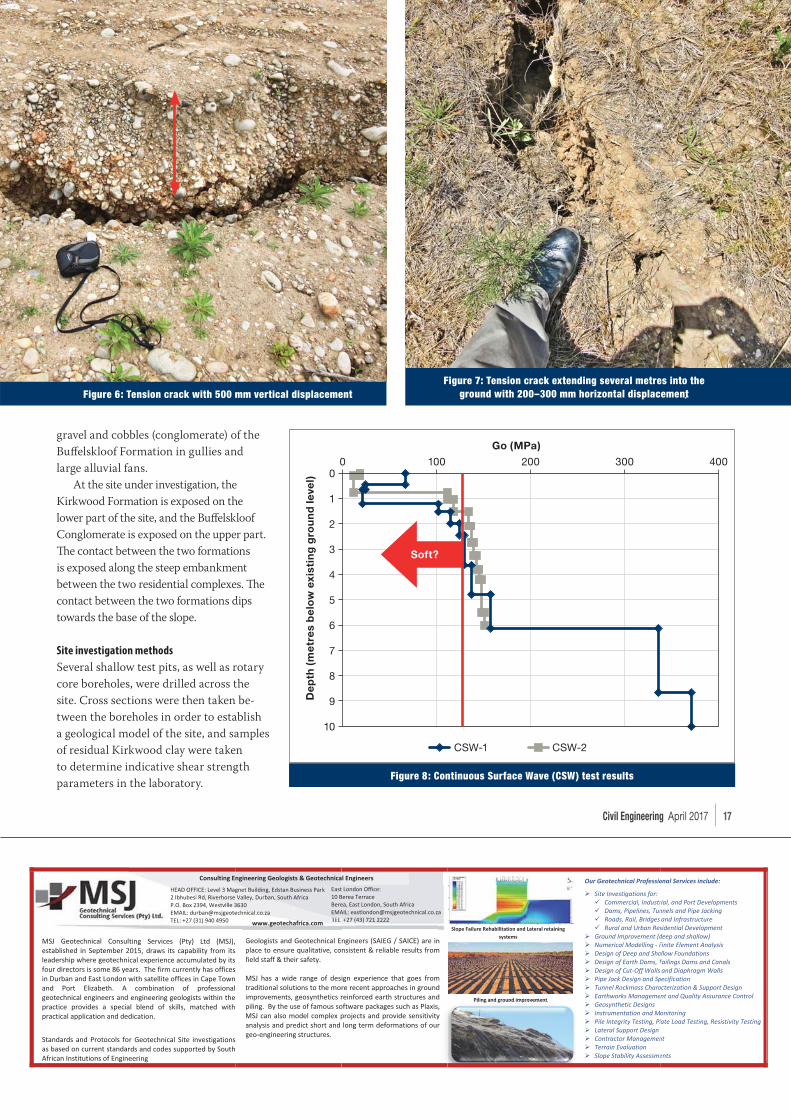
Figure 7: Tension crack extending several metres into the ground with 200–300 mm horizontal displacement
Figure 8: Continuous Surface Wave (CSW) test results
Go (MPa)
De
pth
(m
etre
s b
elo
w e
xist
ing
gro
un
d le
vel)
40030020010000
10
9
8
7
6
5
4
3
2
1
CSW-1 CSW-2
Soft?
Figure 6: Tension crack with 500 mm vertical displacement
18 April 2017 Civil Engineering
A high-precision three-dimensional
(3D) survey was undertaken of several
structures in the area to determine the
magnitude and direction of movement.
Due to time constraints, the installation
of geotechnical instrumentation was not
possible. Following the high-precision
survey results, it became evident that
such instrumentation (inclinometers,
etc) would probably have been damaged
in a relatively short period of time by the
extent of the movement measured.
Continuous Surface Wave (CSW) tests
were also employed to assess the ground
stiff ness profi le and help identify zones of
soft or weak ground. Th e CSW test posi-
tions were situated in locations where the
perceived slip plane associated with the
landslip was assumed to be close to the
existing ground surface.
A 2D model of the slope was then
generated using computer software, and a
slope stability analysis was undertaken to
assess conceptual failure mechanisms.
PROBLEMS ENCOUNTERED AND INNOVATIONSIt became evident during the core drilling
operations that the ground was moving
continuously, and it resulted in the
contractor drilling through his lower steel
casing on quite a few occasions due to the
ground movement below. Th e boreholes
essentially became crude inclinometers,
information which was later used to
model the slope stability and determine
the depth of the problem. Th e extent
of the ground movement is shown in
Figures 6 and 7.
Th e presence of abundant gravel
(pebbles) resulted in poor recovery during
drilling operations and an inadequate as-
sessment of the shear strength properties
associated with the landslip. Good core
recovery was, however, obtained in the
Kirkwood clays, and one of the failure
planes was recovered in the core. Th is
allowed for more accurate sampling for
shear strength tests.
RESULTS OF THE INVESTIGATIONSTh e geological model that was con-
structed from the drilling data indicates a
sloping palaeo-channel in the Kirkwood
clay, which is now fi lled with Buff elskloof
Formation conglomerate. Seepage of
groundwater was also noted where the
palaeo-channel daylights on the sloping
embankment between the upper and
lower residential developments.
Th e CSW test results, presented in
Figure 8, clearly indicate that the upper
Kirkwood Formation was of a very low
stiff ness (soft consistency).
Th e upper Kirkwood Formation was
identifi ed as the zone in which the land-
slip is occurring. Consolidated, undrained
shear strength test results demonstrated
very low cohesion and friction angles
that varied between 10° and 21°. Some
interesting information and discussions
were noted on several occasions by
experienced laboratory testing staff who
performed the shear strength testing.
Further microscopic assessment was
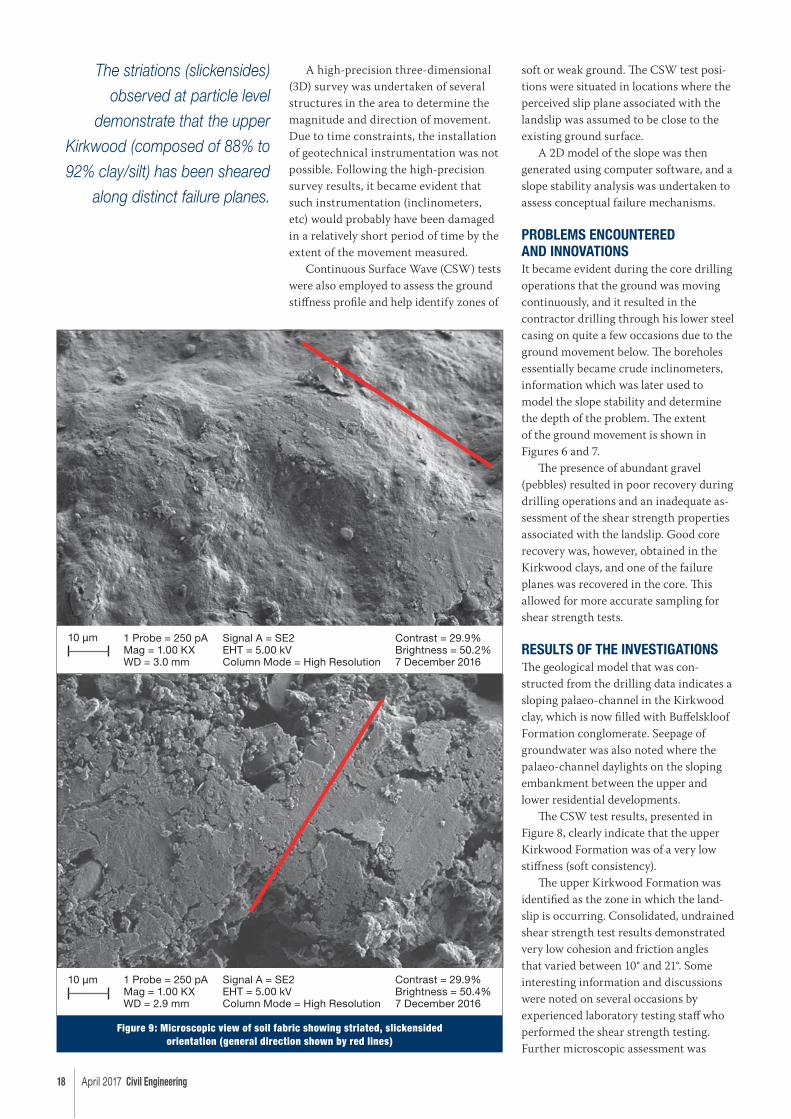
Figure 9: Microscopic view of soil fabric showing striated, slickensided orientation (general direction shown by red lines)
10 μm 1 Probe = 250 pAMag = 1.00 KXWD = 3.0 mm
Signal A = SE2EHT = 5.00 kVColumn Mode = High Resolution
Contrast = 29.9%Brightness = 50.2%7 December 2016
10 μm 1 Probe = 250 pAMag = 1.00 KXWD = 2.9 mm
Signal A = SE2EHT = 5.00 kVColumn Mode = High Resolution
Contrast = 29.9%Brightness = 50.4%7 December 2016
The striations (slickensides)
observed at particle level
demonstrate that the upper
Kirkwood (composed of 88% to
92% clay/silt) has been sheared
along distinct failure planes.
Civil Engineering April 2017 19
performed by SCI-BA Laboratories and
Scientifi c Consultants on undisturbed
upper Kirkwood material, and a few
interesting characteristics were observed
(see Figure 9).
Th e striations (slickensides) observed
at particle level demonstrate that the
upper Kirkwood (composed of 88% to
92% clay/silt) has been sheared along
distinct failure planes. Depending on the
degree of surface water ingress and pene-
tration into the Kirkwood, the disturbed
mass is expected to continue moving.
Furthermore, it is interesting to note
that the landslip movement is tending to
refl ect the monthly rainfall patterns in
the Mossel Bay area.
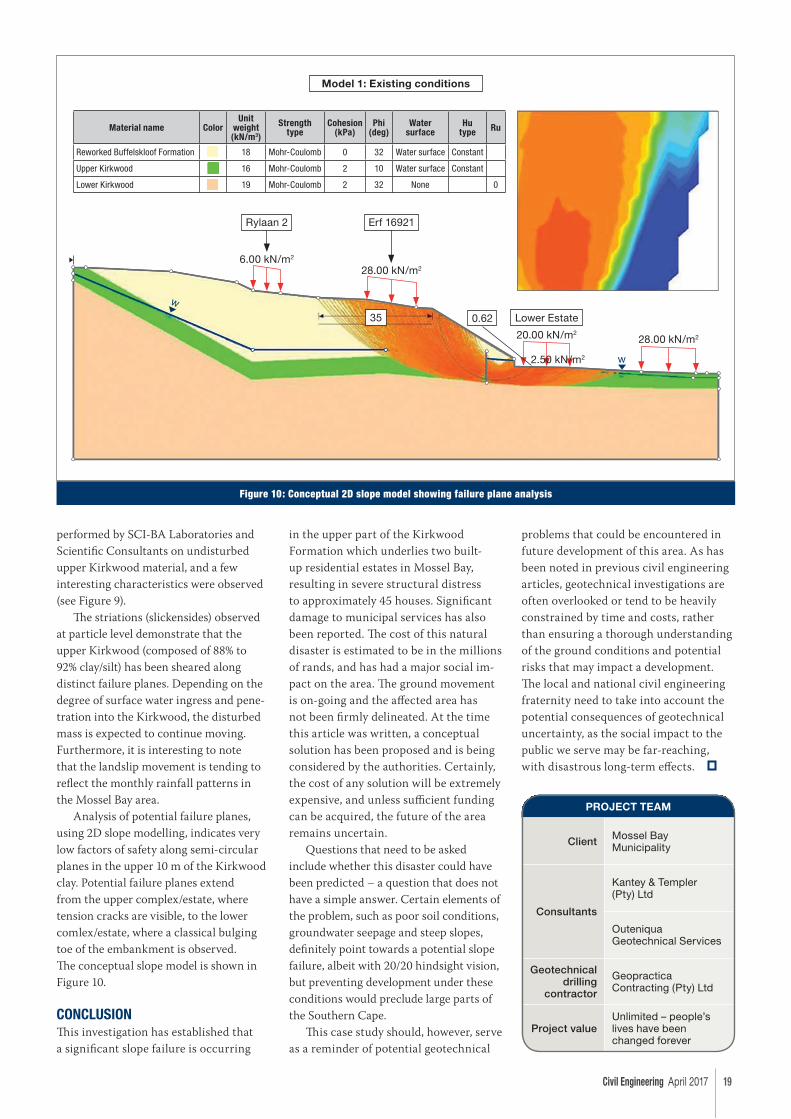
Analysis of potential failure planes,
using 2D slope modelling, indicates very
low factors of safety along semi-circular
planes in the upper 10 m of the Kirkwood
clay. Potential failure planes extend
from the upper complex/estate, where
tension cracks are visible, to the lower
comlex / estate, where a classical bulging
toe of the embankment is observed.
Th e conceptual slope model is shown in
Figure 10.
CONCLUSIONTh is investigation has established that
a signifi cant slope failure is occurring
in the upper part of the Kirkwood
Formation which underlies two built-
up residential estates in Mossel Bay,
resulting in severe structural distress
to approximately 45 houses. Signifi cant
damage to municipal services has also
been reported. Th e cost of this natural
disaster is estimated to be in the millions
of rands, and has had a major social im-
pact on the area. Th e ground movement
is on-going and the aff ected area has
not been fi rmly delineated. At the time
this article was written, a conceptual
solution has been proposed and is being
considered by the authorities. Certainly,
the cost of any solution will be extremely
expensive, and unless suffi cient funding
can be acquired, the future of the area
remains uncertain.
Questions that need to be asked
include whether this disaster could have
been predicted – a question that does not
have a simple answer. Certain elements of
the problem, such as poor soil conditions,
groundwater seepage and steep slopes,
defi nitely point towards a potential slope
failure, albeit with 20/20 hindsight vision,
but preventing development under these
conditions would preclude large parts of
the Southern Cape.
Th is case study should, however, serve
as a reminder of potential geotechnical
problems that could be encountered in
future development of this area. As has
been noted in previous civil engineering
articles, geotechnical investigations are
often overlooked or tend to be heavily
constrained by time and costs, rather
than ensuring a thorough understanding
of the ground conditions and potential
risks that may impact a development.
Th e local and national civil engineering
fraternity need to take into account the
potential consequences of geotechnical
uncertainty, as the social impact to the
public we serve may be far-reaching,
with disastrous long-term eff ects.
Lower Estate
Erf 16921Rylaan 2
Material name ColorUnit
weight (kN/m3)
Strength type
Cohesion (kPa)
Phi (deg)
Water surface
Hu type Ru
Reworked Buffelskloof Formation 18 Mohr-Coulomb 0 32 Water surface Constant
Upper Kirkwood 16 Mohr-Coulomb 2 10 Water surface Constant
Lower Kirkwood 19 Mohr-Coulomb 2 32 None 0
Model 1: Existing conditions
6.00 kN/m2
28.00 kN/m2
20.00 kN/m2
2.50 kN/m2
28.00 kN/m2
w
w
0.6235
Figure 10: Conceptual 2D slope model showing failure plane analysis
PROJECT TEAM
Client Mossel Bay Municipality
Consultants
Kantey & Templer (Pty) Ltd
Outeniqua Geotechnical Services
Geotechnical drilling
contractor
Geopractica Contracting (Pty) Ltd
Project valueUnlimited – people’s lives have been changed forever

www.twitter.com/USB_ED www.facebook.com/USBED USB Executive Development www.youtube.com/USBExecED
Western Cape, South Africa
t: +27 (0)21 918 4488e: [email protected]
Gauteng, South Africa
t: +27 (0)11 460 6980e: [email protected]
KwaZulu-Natal, South Africa
t: +27 (0)31 535 7117e: [email protected]
Dar Es Salaam, Tanzania
Rest of Africa
t: +27 (0)11 460 6980e: [email protected]
Addis Ababa, Ethiopia
Senior Project Management ProgrammeCPT (Starting August) DBN (Starting July) JHB (Starting August) WINDHOEK (Starting October)
3 study blocks
For career project managers and recognised by PMSA in terms of the Senior Project Manager Designation.
Project ManagementCPT (Starting April) JHB (Starting July)
For middle to senior managers who need to launch or manage projects.
Project Management Principles and PracticesCPT (Starting May) DBN (Starting September) JHB (Starting July) KIM (Starting October) QTN (Starting June)UTN (Starting September)
For middle to senior managers managing projects and requiring increased technical skills.
Visit www.usb-ed.com for course information
PROJECT MANAGEMENTSHORT COURSES
Contact Marie van Wyk | t: +27 (0)21 918 4488 | e: [email protected]
USBED20173E

Civil Engineering April 2017 21
INTRODUCTIONSt Helena is one of the most geographi-
cally isolated islands in the world, located
approximately 1 950 km from the
southwest coast of Africa. Since the
island’s discovery in 1502, the only access
has been by sea, with the maximum size
and weight of any single component
being determined by the fact that it had
to be transported by the mail ship RMS
St Helena.
Th e economic viability of St Helena
is dependent on the frequency and
reliability of access for people and
goods to the island. Th e airport project
was destined to change the lives of all
Saints, not only in providing employ-
ment with opportunities of developing
new skills, but ultimately boosting the
island’s economic growth with increased
tourism, and stimulating the expansion
of support industries.
Graham Isaac
Chief Engineer: Special ProjectsContracted Lead Engineer
Gawie Steyn
Lead Geotechnical EngineerKnight Piesold
St Helena Airport dry gut rockfi ll
Terraced dry gut rockfill – total height 102 m
22 April 2017 Civil Engineering
Th e airport project provided many
unique and unusual features requiring
advanced engineering ingenuity and plan-
ning. Th e remote location of the island
necessitated major logistical considera-
tions, as almost everything, excluding
rock and water, had to be shipped to the
island. Th e island’s heritage and fragile
environment – a signifi cant legacy of
international acclaim – also necessitated
careful consideration and detailed design
and construction planning.
AIRPORT INFRASTRUCTURE – DRY GUT ROCKFILLTh e construction of the runway entailed
the following:
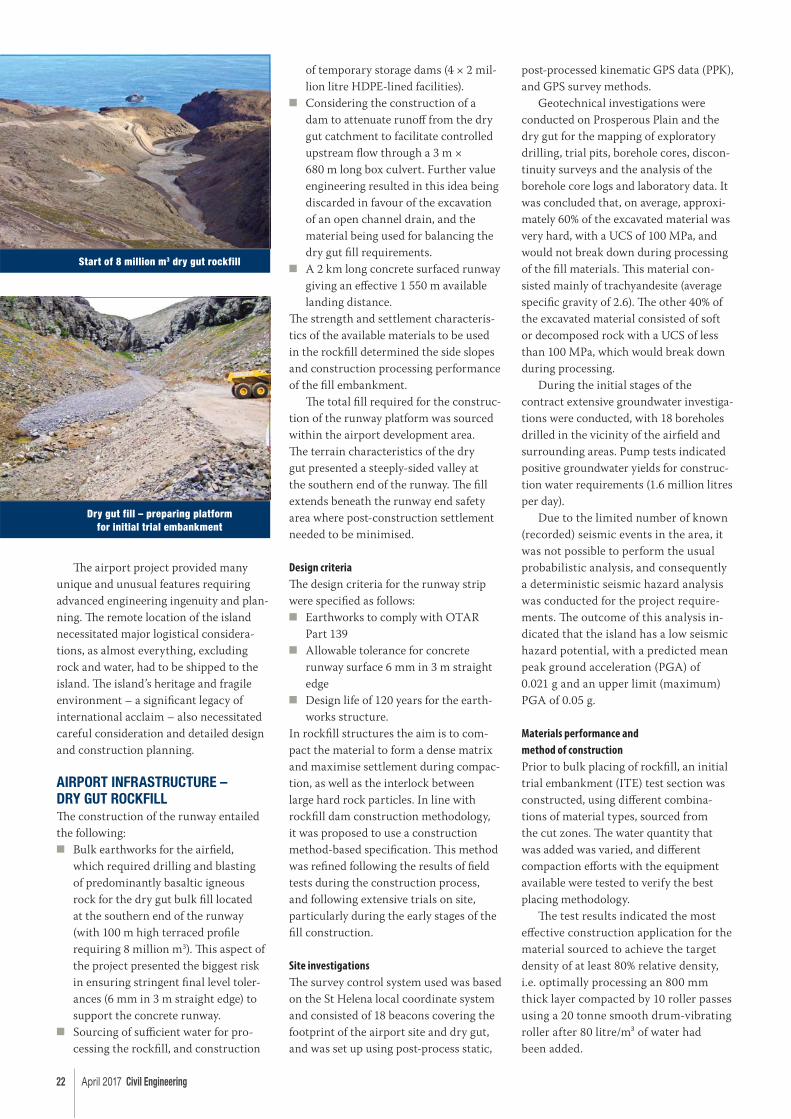
■ Bulk earthworks for the airfi eld,
which required drilling and blasting
of predominantly basaltic igneous
rock for the dry gut bulk fi ll located
at the southern end of the runway
(with 100 m high terraced profi le
requiring 8 million m3). Th is aspect of
the project presented the biggest risk
in ensuring stringent fi nal level toler-
ances (6 mm in 3 m straight edge) to
support the concrete runway.
■ Sourcing of suffi cient water for pro-
cessing the rockfi ll, and construction
of temporary storage dams (4 × 2 mil-
lion litre HDPE-lined facilities).
■ Considering the construction of a
dam to attenuate runoff from the dry
gut catchment to facilitate controlled
upstream fl ow through a 3 m ×
680 m long box culvert. Further value
engineering resulted in this idea being
discarded in favour of the excavation
of an open channel drain, and the
material being used for balancing the
dry gut fi ll requirements.
■ A 2 km long concrete surfaced runway
giving an eff ective 1 550 m available
landing distance.
Th e strength and settlement characteris-
tics of the available materials to be used
in the rockfi ll determined the side slopes
and construction processing performance
of the fi ll embankment.
Th e total fi ll required for the construc-
tion of the runway platform was sourced
within the airport development area.
Th e terrain characteristics of the dry
gut presented a steeply-sided valley at
the southern end of the runway. Th e fi ll
extends beneath the runway end safety
area where post-construction settlement
needed to be minimised.
Design criteria
Th e design criteria for the runway strip
were specifi ed as follows:
■ Earthworks to comply with OTAR
Part 139
■ Allowable tolerance for concrete
runway surface 6 mm in 3 m straight
edge
■ Design life of 120 years for the earth-
works structure.
In rockfi ll structures the aim is to com-
pact the material to form a dense matrix
and maximise settlement during compac-
tion, as well as the interlock between
large hard rock particles. In line with
rockfi ll dam construction methodology,
it was proposed to use a construction
method-based specifi cation. Th is method
was refi ned following the results of fi eld
tests during the construction process,
and following extensive trials on site,
particularly during the early stages of the
fi ll construction.
Site investigations
Th e survey control system used was based
on the St Helena local coordinate system
and consisted of 18 beacons covering the
footprint of the airport site and dry gut,
and was set up using post-process static,
post-processed kinematic GPS data (PPK),
and GPS survey methods.
Geotechnical investigations were
conducted on Prosperous Plain and the
dry gut for the mapping of exploratory
drilling, trial pits, borehole cores, discon-
tinuity surveys and the analysis of the
borehole core logs and laboratory data. It
was concluded that, on average, approxi-
mately 60% of the excavated material was
very hard, with a UCS of 100 MPa, and
would not break down during processing
of the fi ll materials. Th is material con-
sisted mainly of trachyandesite (average
specifi c gravity of 2.6). Th e other 40% of
the excavated material consisted of soft
or decomposed rock with a UCS of less
than 100 MPa, which would break down
during processing.
During the initial stages of the
contract extensive groundwater investiga-
tions were conducted, with 18 boreholes
drilled in the vicinity of the airfi eld and
surrounding areas. Pump tests indicated
positive groundwater yields for construc-
tion water requirements (1.6 million litres
per day).
Due to the limited number of known
(recorded) seismic events in the area, it
was not possible to perform the usual
probabilistic analysis, and consequently
a deterministic seismic hazard analysis
was conducted for the project require-
ments. Th e outcome of this analysis in-
dicated that the island has a low seismic
hazard potential, with a predicted mean
peak ground acceleration (PGA) of
0.021 g and an upper limit (maximum)
PGA of 0.05 g.
Materials performance and
method of construction
Prior to bulk placing of rockfi ll, an initial
trial embankment (ITE) test section was
constructed, using diff erent combina-
tions of material types, sourced from
the cut zones. Th e water quantity that
was added was varied, and diff erent
compaction eff orts with the equipment
available were tested to verify the best
placing methodology.
Th e test results indicated the most
eff ective construction application for the
material sourced to achieve the target
density of at least 80% relative density,
i.e. optimally processing an 800 mm
thick layer compacted by 10 roller passes
using a 20 tonne smooth drum-vibrating
roller after 80 litre/m³ of water had
been added.
Dry gut fill – preparing platform for initial trial embankment
Start of 8 million m3 dry gut rockfill
Civil Engineering April 2017 23
GRLWEAP Wave Equation Analysis Software
GRLWEAP Predicts:• Driving stresses• Hammer performance• Relation between pile bearing
capacity and net set per blow• Total driving time
Available in standard
[email protected] | www.pile.com
Two embankment zones were con-
structed, namely an inner zone directly
under the runway and an outer zone
forming the outer embankment slopes.
A third drainage zone was constructed
between the natural valley slopes and the
fi ll, and along the bottom of the dry gut
valley. Th e minimum fi ll layer thickness
was controlled with the maximum par-
ticle size not exceeding two-thirds of the
layer thickness.
Mixing and blending of the rock
material was achieved during the normal
excavation and placing process. Th e
composition of the source material varied
signifi cantly and was tested in the fi eld at
various source locations. A ratio of 60%
harder trachyandesite rock to 40% softer
basalt rock was considered desirable.
Placing took place over a wide front
to facilitate a high production rate –
approximately 15 000 m³ to 20 000 m³ per
day utilising a double-shift 24-hour-day
production strategy.
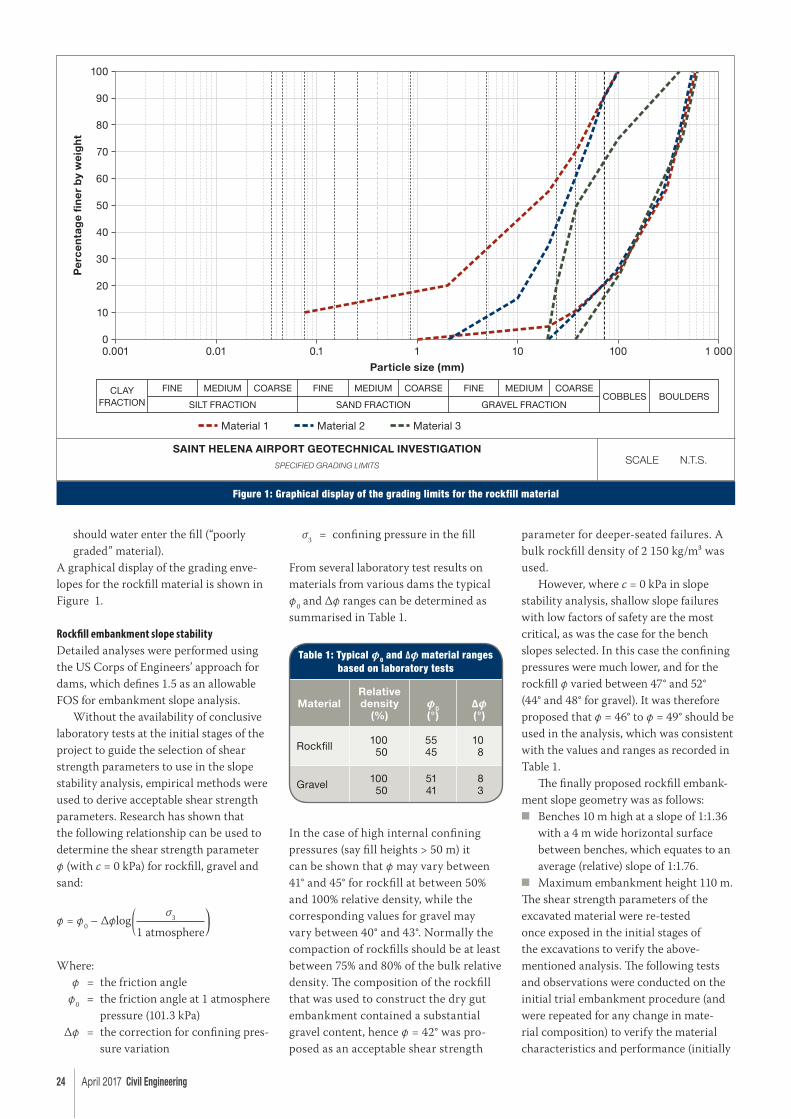
Grading of rockfi ll materials
Considering the materials available, it
was recommended that only three dif-
ferent categories of material be used for
the construction of the fi ll. Th e target
grading for all materials was charac-
terised as “well graded” with respect to
gravel content – where the coeffi cient of
uniformity (Cu) was exceeding 4, and
the coeffi cient of curvature (Cz) between
1 and 3 for a well graded material. It
was decided that “poorly graded” mate-
rial would also be acceptable, as long
as the general grading was within the
specifi ed ranges.
■ Material 1 formed the bulk of the
rockfi ll embankment and comprised
a blend of the uncontrolled blasted
hard rock and the softer rock materials
(“well graded” material).
■ Material 2 was used on the exposed
embankment slopes for added slope
stability and protection against the
elements, and consisted of hard rock
material only (“well graded” material).
Adequate volumes of this type of
material was stockpiled separately to
ensure the required volume would be
available for the construction of the
outer section of the benched slopes.
Material 2 was placed in a 4 m to 5 m
wide zone on the outer surface of the
benched slopes, from the bottom to
the top of the rockfi ll embankment.
Th e target grading of Material 2 was
such that 15% of particle sizes less than
19 mm were excluded and point-to-
point contact was retained for particle
sizes greater than 50 mm.
■ Material 3 was used as the drainage
layer in the base of the dry gut channel
and as a drainage interface layer to
continue up the valley sides to provide
the lowest resistance against fl ow,
Laboratory sample after grading
24 April 2017 Civil Engineering
should water enter the fi ll (“poorly
graded” material).
A graphical display of the grading enve-
lopes for the rockfi ll material is shown in
Figure 1.
Rockfi ll embankment slope stability
Detailed analyses were performed using
the US Corps of Engineers’ approach for
dams, which defi nes 1.5 as an allowable
FOS for embankment slope analysis.
Without the availability of conclusive
laboratory tests at the initial stages of the
project to guide the selection of shear
strength parameters to use in the slope
stability analysis, empirical methods were
used to derive acceptable shear strength
parameters. Research has shown that
the following relationship can be used to
determine the shear strength parameter
φ (with c = 0 kPa) for rockfi ll, gravel and
sand:
φ = φ0 – Δφlog
σ3
1 atmosphere
Where:
φ = the friction angle
φ0 = the friction angle at 1 atmosphere
pressure (101.3 kPa)
Δφ = the correction for confi ning pres-
sure variation
σ3 = confi ning pressure in the fi ll
From several laboratory test results on
materials from various dams the typical
φ0 and Δφ ranges can be determined as
summarised in Table 1.
In the case of high internal confi ning
pressures (say fi ll heights > 50 m) it
can be shown that φ may vary between
41° and 45° for rockfi ll at between 50%
and 100% relative density, while the
corresponding values for gravel may
vary between 40° and 43°. Normally the
compaction of rockfi lls should be at least
between 75% and 80% of the bulk relative
density. Th e composition of the rockfi ll
that was used to construct the dry gut
embankment contained a substantial
gravel content, hence φ = 42° was pro-
posed as an acceptable shear strength
parameter for deeper-seated failures. A
bulk rockfi ll density of 2 150 kg/m³ was
used.
However, where c = 0 kPa in slope
stability analysis, shallow slope failures
with low factors of safety are the most
critical, as was the case for the bench
slopes selected. In this case the confi ning
pressures were much lower, and for the
rockfi ll φ varied between 47° and 52°
(44° and 48° for gravel). It was therefore
proposed that φ = 46° to φ = 49° should be
used in the analysis, which was consistent
with the values and ranges as recorded in
Table 1.
Th e fi nally proposed rockfi ll embank-
ment slope geometry was as follows:
■ Benches 10 m high at a slope of 1:1.36
with a 4 m wide horizontal surface
between benches, which equates to an
average (relative) slope of 1:1.76.
■ Maximum embankment height 110 m.
Th e shear strength parameters of the
excavated material were re-tested
once exposed in the initial stages of
the excavations to verify the above-
mentioned analysis. Th e following tests
and observations were conducted on the
initial trial embankment procedure (and
were repeated for any change in mate-
rial composition) to verify the material
characteristics and performance (initially
Pe
rce
nta
ge
fi n
er
by
wei
gh
t100
90
80
70
60
50
40
30
20
10
0
SAINT HELENA AIRPORT GEOTECHNICAL INVESTIGATIONSPECIFIED GRADING LIMITS SCALE N.T.S.
Figure 1: Graphical display of the grading limits for the rockfill material
Particle size (mm)
0.001 0.01 0.1 1 10 100 1 000
Material 3Material 1 Material 2
CLAY FRACTION
FINE MEDIUM COARSE
SILT FRACTION SAND FRACTION
FINE MEDIUM COARSE FINE MEDIUM COARSE
GRAVEL FRACTIONCOBBLES BOULDERS
Table 1: Typical φ0 and Δφ material ranges based on laboratory tests
MaterialRelative density
(%)φ0(°)
Δφ (°)
Rockfi ll 10050
5545
108
Gravel 10050
5141
83

Civil Engineering April 2017 25
at a frequency of approximately 50 000 m³
intervals, and once a level of consistency
was achieved, at every 100 000 m³ during
the construction progression):
■ Plate load tests
■ Large volume density tests
■ Grading analysis
■ Water absorption and porosity
■ Wash-out trial tests to monitor the
optimum water demand required
to achieve interlocking of the rock
fragments
■ Compaction eff ort against settlement
measurements.
Settlement
It is very diffi cult to quantitatively predict
the settlement of a rockfi ll embankment,
and therefore the experience gained
at diff erent rockfi ll dams in southern
Africa was considered, together with
international experience documented on
concrete-faced rockfi ll dams.
Th e embankment settlement was
regularly monitored and assessed with
installed settlement monitoring equip-
ment and geodetic survey measurements
during the construction phase. Th is
data, together with numerical analysis,
provided confi dence in the construction
methods used and in determining the
fi nal construction levels to accommodate
the projected settlement, and hence
ensuring that the upper surface of the fi ll
remain within the prescribed tolerances
throughout its design life.
Stormwater drainage
Due to the diffi culty of constructing
drainage collection channels at the inter-
face of the toe of the fi ll with the natural
rock valley sides, stormwater runoff from
the airfi eld footprint was directed away
from the fi ll matrix and channelled via
outlets to convenient locations along
natural contours and into the neigh-
bouring water courses.
Also of note was that an open channel
drain was excavated into the southern
face of the dry gut (1 million m3) to redi-
rect the stormwater fl ows from the upper
dry gut catchment into the neighbouring
valley, thus resulting in the omission of
the initially proposed dry gut culvert and
attenuation dam.
Balance of earthworks, design
drawings and volume calculations
Th e surfaces of the embankment profi les
and volume calculations were generated
from Model Maker TOT fi les of the site
survey data. Due to the initial uncer-
tainty of the ultimate performance of the
This data, together with numerical analysis, provided confi dence
in the construction methods used and in determining the fi nal
construction levels to accommodate the projected settlement, and
hence ensuring that the upper surface of the fi ll remain within the
prescribed tolerances throughout its design life.

26 April 2017 Civil Engineering
source materials, a sensitivity analysis
was computed.
Fixing the fi nal vertical alignment
of the runway was vital, considering
the lead time required in setting up the
procedures for the necessary fl ight path
sensitivity analysis and the follow-on re-
quirements with early submissions to the
Aviation Regulator for fi nal approvals. As
such any later adjustment to the runway
alignment would have had serious time-
delay consequences for the construction
programme.
Th e earthworks volume-sensitivity
analysis clearly showed that the slightest
variation in the material performance
would have a marked eff ect on the mate-
rial balance.
CONSTRUCTION CHALLENGESTh e biggest challenge in constructing
the St Helena Airport was creating and
maintaining an effi cient planning and
logistics chain. Th ere were no major
construction plant or building materials
on the island, and virtually everything
had to be shipped to the island. Th e con-
tractor chartered a 2 500 ton ocean-going
vessel for the duration of the contract to
accommodate their plant and materials
supply requirements. With no harbour
on the island, a temporary jetty had to be
constructed to accommodate roll-on-roll-
off facilities. Other early works establish-
ments consisted of a temporary fuel
facility (1.5 million litres), construction
of a 14.5 km haul road over very harsh
rocky and steep terrain, borehole explora-
tions to source adequate groundwater
for construction water, construction of
staff accommodation and workshops,
the establishment of a fully equipped
internationally accredited laboratory, and
the erection of crushing and concrete
batching plants.
Risk awareness during project
execution was absolutely crucial for
the success of the project, and both the
St Helena government and the project
team ran and shared a comprehensive
risk and opportunity register. Th is was
vital to identify and mitigate any risks
to the health and safety of personnel,
and to protect the special features of the
island prior to the commencement of
any sector of the works. Th is approach
was instrumental to the ultimate goal of
successfully completing the contract on
time and within budget (construction
works for the airport infrastructure
was completed in April 2016, and an
Aerodrome Certifi cation was issued by
ASSI on 10 May 2016).
A haul road of 14.5 km had to be constructed over very harsh, rocky and steep terrain
PROJECT TEAM
ClientDepartment of International Development, UK Government
Main Contractor Basil Read (Pty) Ltd
Contract Design Build Operate
Fixing the fi nal vertical
alignment of the runway was
vital, considering the lead
time required in setting up the
procedures for the necessary
fl ight path sensitivity analysis and
the follow-on requirements with
early submissions to the Aviation
Regulator for fi nal approvals.

octa
rine
3961
CPD Geosynthetics
INVITATIONOPEN
Keep up to date with the latest technical and regulatory information on geosynthetics and earn CPD Points.
The Kaytech Geosynthetics Online Lecture Series gives you 7 lectures to complete online, at your own convenience. These accredited CPD lectures are supplied to you at no charge, with our compliments.
Register now at www.kaytech.co.za/CPD
Accredited CPDAny time, any place!
www.kaytech.co.za
Civil Engineering April 2017 29
INTRODUCTIONIncreasing energy demands and
increasing demands for greener en-
ergy – particularly in the developing
world – have seen a growing focus on
renewables. Small hydropower (i.e. up to
20 MW) is an important part of that mix.
While most of Southern Africa is water
scarce and therefore has limited potential
for small hydropower generation, many
possibilities exist in West, Central and
East Africa. Geotechnical factors are
major considerations in many aspects of
implementing such projects, including
evaluating the viability of various options,
and considering the design, construction,
operational and maintenance impacts.
TYPICAL PROJECT ELEMENTS AND SITE CHARACTERISTICSHydropower generation is not in itself a
new concept, and in essence depends on
two main parameters – the water fl ow
and the available head. Even relatively
small rivers with suffi cient elevation
diff erence might represent a viable small
hydropower project. Larger rivers can get
away with less head, and still represent
feasible schemes.
Typical project elements include a
diversion structure or dam within the
river at the highest practical elevation, a
desilting structure, the conveyance (likely
Gary Davis Pr Sci Nat
Ground Engineering Lead, TshwaneAurecon South Africa
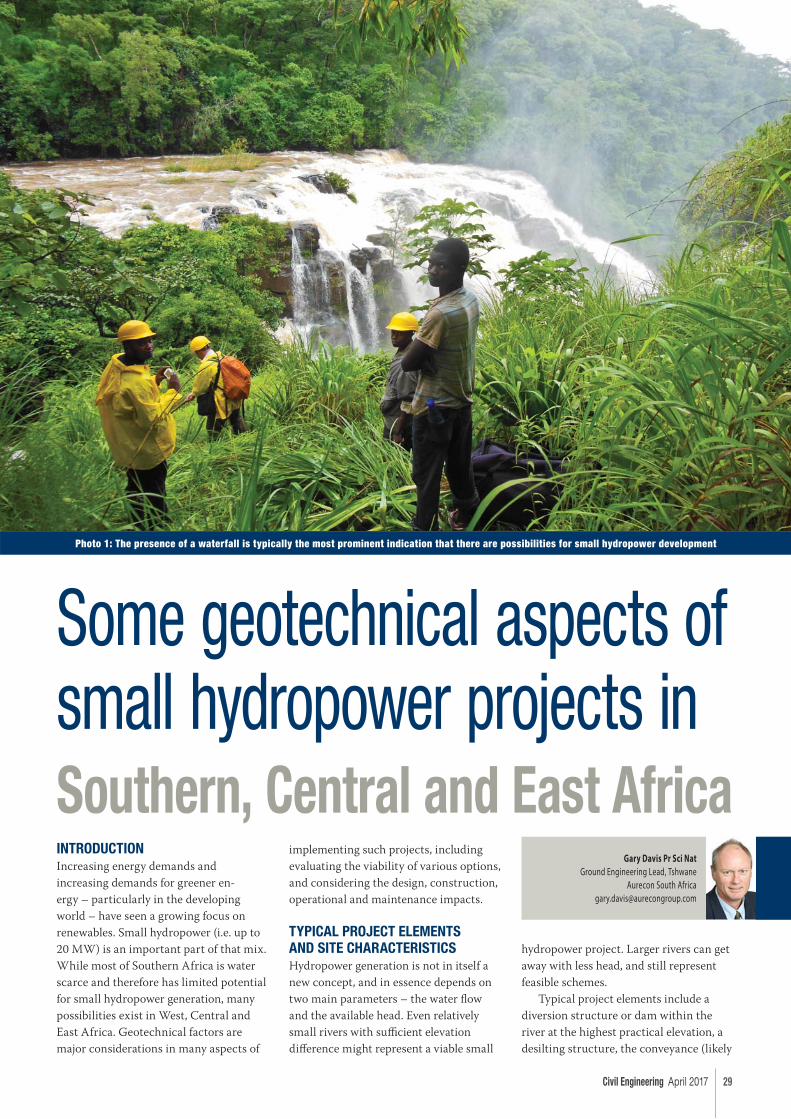
Some geotechnical aspects of small hydropower projects in Southern, Central and East Africa
Photo 1: The presence of a waterfall is typically the most prominent indication that there are possibilities for small hydropower development
30 April 2017 Civil Engineering
comprising the headrace canal or pipe-
line), a surge tank or forebay, penstock
and powerhouse. Once through the tur-
bines, the water is returned to the river.
By virtue of the need for perennial
rivers, many of the hydropower pos-
sibilities are located in the tropics band
incorporating West, Central and East
Africa, or in mountain ranges that might
be associated with high rainfall. It follows
that the topography is generally steep,
and waterfalls are often a refl ection of the
sudden drop in elevation (Photo 1).
Th ere are exceptions to the above, for
example in the case of releases from the
Lesotho Highlands Water Project, which
have created hydropower generating pos-
sibilities in South Africa, even though the
natural elevation diff erences are not large.
GENERAL REGIONAL GEOLOGICAL AND GEOMORPHOLOGICAL CHARACTERISTICSIn the tropics it is to be expected that the
typical tropical soils and laterites might
be developed, while deep weathering of
the bedrock is also characteristic.
Parts of East Africa are further
characterised by elevated levels of seismic
risk due to the presence of the East
African Rift System (EARS). Many of the
small hydropower possibilities within
this region are located either within or
in close proximity to the Rift System.
Such elevated seismic hazards need to be
considered in designs.
In addition to the seismicity, many
of these schemes are further located in
areas of relatively young volcanic activity
(Mount Kenya, Mount Elgon) where the
geological succession is characterised by
an alternating sequence of lavas (pos-
sible hard rock), weaker tuff s and other
agglomerates.
Some of the mountains, such as the
Rwenzori Mountains, comprise uplifted
horst / fault blocks, and granite gneiss
predominates.
In terms of the geomorphology,
conditions encountered are not entirely
shaped by current climatic conditions.
For example, the thick alluvial deposits,
including massive boulders beyond the
capabilities of the current river regime
(Photo 2), as encountered in many of the
river valleys, have their actual origin in
the various repetitive cycles of glaciation
and retreat of the ice sheets. Th ese ice
sheets are still visible in places today
(Rwenzori Mountains and also Mount
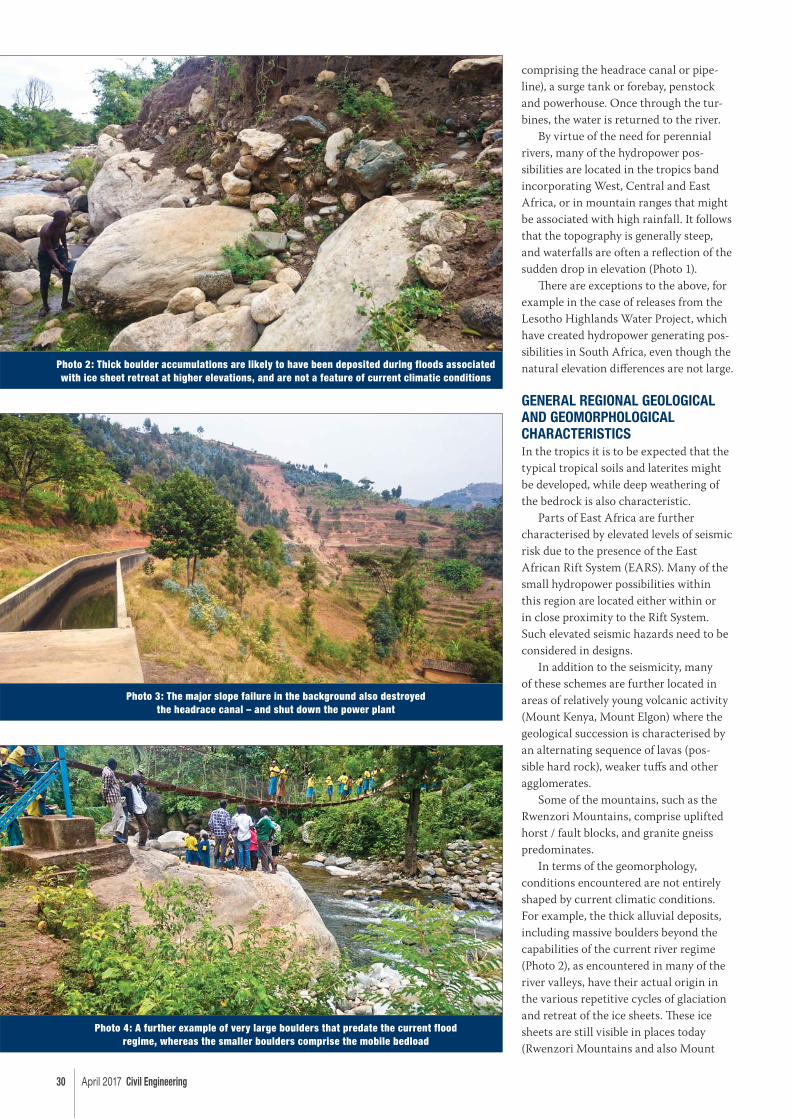
Photo 2: Thick boulder accumulations are likely to have been deposited during floods associated with ice sheet retreat at higher elevations, and are not a feature of current climatic conditions
Photo 3: The major slope failure in the background also destroyed the headrace canal – and shut down the power plant
Photo 4: A further example of very large boulders that predate the current flood regime, whereas the smaller boulders comprise the mobile bedload
Civil Engineering April 2017 31
TITANGEOTECHNICAL SYSTEM (PTY) LTD
[email protected] www.titangeo.co.zaOffice: +27 (0)11 316 6300 Antje: +27 (0)83 959 6216 John: +27 (0)71 672 8235
TITAN self-drilling hollow bars Approved for temporary and permanent application. Compliant with relevant European standards for micro piles, soil nails, ground anchors and re-inforcement steel.
Kenya, for example), although they are
much reduced. Th ese past infl uences must
be recognised in assessing the current
geomorphological environment.
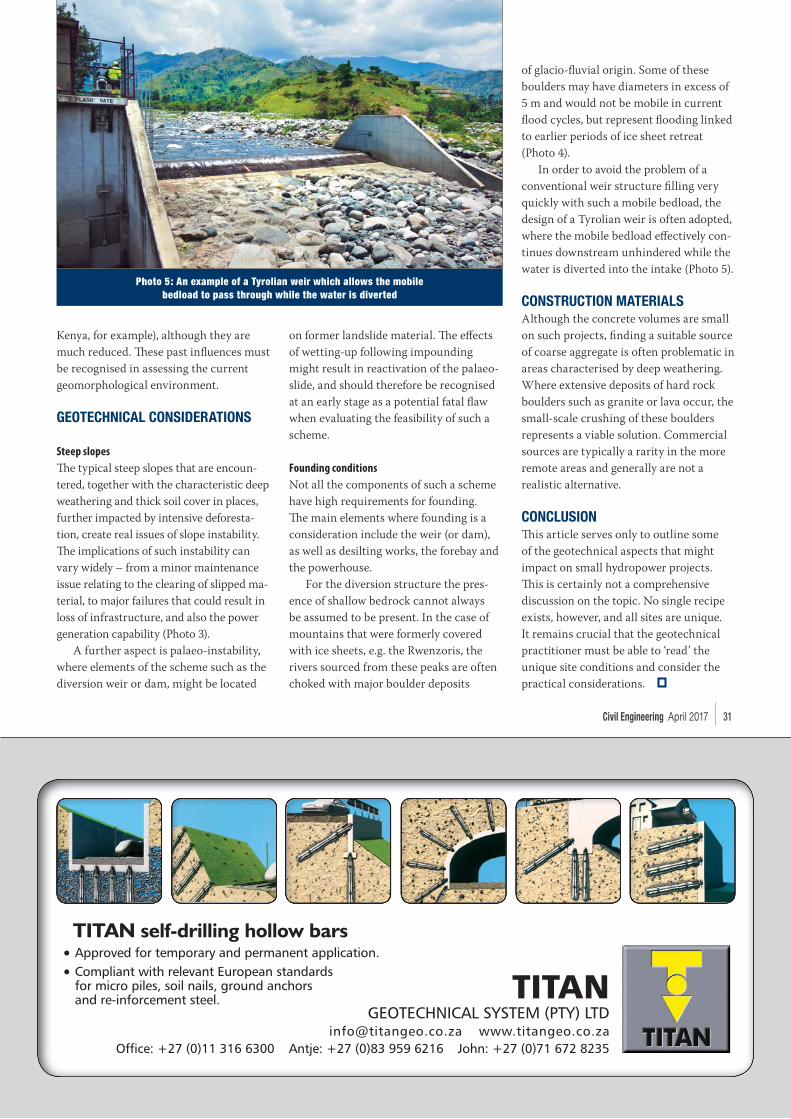
GEOTECHNICAL CONSIDERATIONS
Steep slopes
Th e typical steep slopes that are encoun-
tered, together with the characteristic deep
weathering and thick soil cover in places,
further impacted by intensive deforesta-
tion, create real issues of slope instability.
Th e implications of such instability can
vary widely – from a minor maintenance
issue relating to the clearing of slipped ma-
terial, to major failures that could result in
loss of infrastructure, and also the power
generation capability (Photo 3).
A further aspect is palaeo-instability,
where elements of the scheme such as the
diversion weir or dam, might be located
on former landslide material. Th e eff ects
of wetting-up following impounding
might result in reactivation of the palaeo-
slide, and should therefore be recognised
at an early stage as a potential fatal fl aw
when evaluating the feasibility of such a
scheme.
Founding conditions
Not all the components of such a scheme
have high requirements for founding.
Th e main elements where founding is a
consideration include the weir (or dam),
as well as desilting works, the forebay and
the powerhouse.
For the diversion structure the pres-
ence of shallow bedrock cannot always
be assumed to be present. In the case of
mountains that were formerly covered
with ice sheets, e.g. the Rwenzoris, the
rivers sourced from these peaks are often
choked with major boulder deposits
of glacio-fl uvial origin. Some of these
boulders may have diameters in excess of
5 m and would not be mobile in current
fl ood cycles, but represent fl ooding linked
to earlier periods of ice sheet retreat
(Photo 4).
In order to avoid the problem of a
conventional weir structure fi lling very
quickly with such a mobile bedload, the
design of a Tyrolian weir is often adopted,
where the mobile bedload eff ectively con-
tinues downstream unhindered while the
water is diverted into the intake (Photo 5).
CONSTRUCTION MATERIALSAlthough the concrete volumes are small
on such projects, fi nding a suitable source
of coarse aggregate is often problematic in
areas characterised by deep weathering.
Where extensive deposits of hard rock
boulders such as granite or lava occur, the
small-scale crushing of these boulders
represents a viable solution. Commercial
sources are typically a rarity in the more
remote areas and generally are not a
realistic alternative.
CONCLUSIONTh is article serves only to outline some
of the geotechnical aspects that might
impact on small hydropower projects.
Th is is certainly not a comprehensive
discussion on the topic. No single recipe
exists, however, and all sites are unique.
It remains crucial that the geotechnical
practitioner must be able to ‘read’ the
unique site conditions and consider the
practical considerations.
Photo 5: An example of a Tyrolian weir which allows the mobile bedload to pass through while the water is diverted


Civil Engineering April 2017 33
INTRODUCTIONIn March 2015 a sink hole, approximately
4 m x 3 m wide and 3 m deep, developed
in the fast lane of the N3 southbound
carriageway on Town Hill between
Pietermaritzburg and Hilton. Fortunately
no motorists were injured. Immediately
after the sink hole appeared, the lane was
closed and the cavity was backfi lled with
rock underlain with bidim fabric. Th e lane
was soon reopened after the surface had
been patched with an asphalt seal.
Drennan Maud (Pty) Ltd was ap-
proached shortly thereafter to investigate the cause of the sink hole and provide
remedial recommendations to prevent the
likelihood of such future catastrophes.
It was soon discovered that the hole
had developed directly above an existing
900 mm diameter Armco pipe that lay
approximately 10 m below road surface
level. Th e Armco pipe had been installed
in the 1960s when the N2 was fi rst
constructed and later extended, with the
widening of the N3 at Town Hill.
SITE DESCRIPTIONTh e immediate section of the N3 where
the sink hole occurred is located on a
fi ll embankment constructed on the
lower slopes of the Townhill escarpment
approximately 1 km north of the Peter
Brown Bridge. Two drainage lines off the
elevated north-eastern escarpment fl ank
converge slightly downslope of this road
section and were piped through the fi ll
embankment when it was constructed.
Th e outlet from the pipes fl ow into
the Town Bush stream, a tributary of the
Msunduze River. Continuous seepage,
likely to be gravity-fed by springs
from the upper Townhill slopes, was
evident down the drainage line, which
increased substantially during the wetter
summer months.
GEOLOGY AND SOILSTh e area is underlain by the
Pietermaritzburg Formation, which
broadly comprises massive to laminated,
deeply weathered, carbonaceous siltstone
Marco Pauselli Pr Eng
Drennan Maud (Pty) [email protected]
Julian O’Reilly BSc Eng
Drennan Maud (Pty) [email protected]
Town Hill pipe jack
Figure 1: Town Hill pipe jack site location
Location
Figure 2: Existing and new drainage system
Sealed ARMCO pipes
New inlet
New 900Ø pipe
New outlet / inlet New 1473Ø concrete pipe
Jacking pit
Outlet
N3SB
N3NB
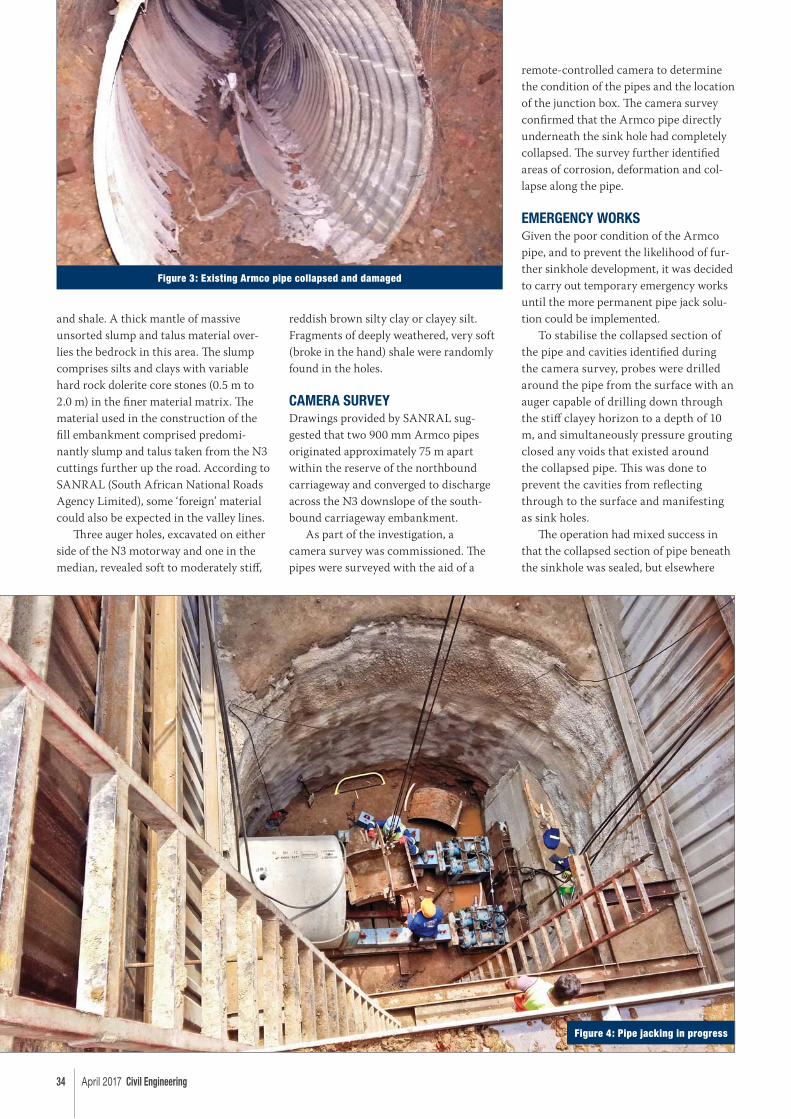
34 April 2017 Civil Engineering
and shale. A thick mantle of massive
unsorted slump and talus material over-
lies the bedrock in this area. Th e slump
comprises silts and clays with variable
hard rock dolerite core stones (0.5 m to
2.0 m) in the fi ner material matrix. Th e
material used in the construction of the
fi ll embankment comprised predomi-
nantly slump and talus taken from the N3
cuttings further up the road. According to
SANRAL (South African National Roads
Agency Limited), some ‘foreign’ material
could also be expected in the valley lines.
Th ree auger holes, excavated on either
side of the N3 motorway and one in the
median, revealed soft to moderately stiff ,
reddish brown silty clay or clayey silt.
Fragments of deeply weathered, very soft
(broke in the hand) shale were randomly
found in the holes.
CAMERA SURVEYDrawings provided by SANRAL sug-
gested that two 900 mm Armco pipes
originated approximately 75 m apart
within the reserve of the northbound
carriageway and converged to discharge
across the N3 downslope of the south-
bound carriageway embankment.
As part of the investigation, a
camera survey was commissioned. Th e
pipes were surveyed with the aid of a
remote-controlled camera to determine
the condition of the pipes and the location
of the junction box. Th e camera survey
confi rmed that the Armco pipe directly
underneath the sink hole had completely
collapsed. Th e survey further identifi ed
areas of corrosion, deformation and col-
lapse along the pipe.
EMERGENCY WORKSGiven the poor condition of the Armco
pipe, and to prevent the likelihood of fur-
ther sinkhole development, it was decided
to carry out temporary emergency works
until the more permanent pipe jack solu-
tion could be implemented.
To stabilise the collapsed section of
the pipe and cavities identifi ed during
the camera survey, probes were drilled
around the pipe from the surface with an
auger capable of drilling down through
the stiff clayey horizon to a depth of 10
m, and simultaneously pressure grouting
closed any voids that existed around
the collapsed pipe. Th is was done to
prevent the cavities from refl ecting
through to the surface and manifesting
as sink holes.
Th e operation had mixed success in
that the collapsed section of pipe beneath
the sinkhole was sealed, but elsewhere
Figure 3: Existing Armco pipe collapsed and damaged
Figure 4: Pipe jacking in progress
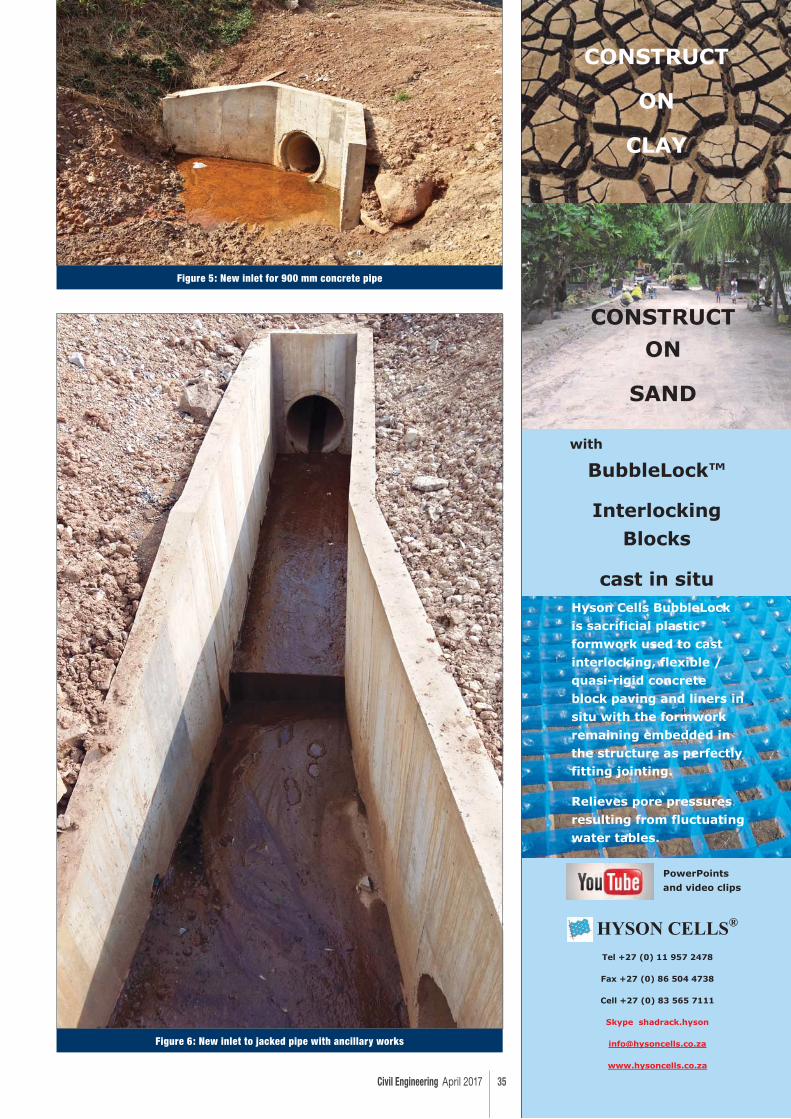
Civil Engineering April 2017 35
CONSTRUCT
ON
CLAY
BubbleLock™
Interlocking
Blocks
cast in situ Hyson Cells BubbleLock
is sacrificial plastic
formwork used to cast
interlocking, flexible /
quasi-rigid concrete
block paving and liners in
situ with the formwork
remaining embedded in
the structure as perfectly fitting jointing.
Relieves pore pressures
resulting from fluctuating
water tables.
with
CONSTRUCT
ON
SAND
Tel +27 (0) 11 957 2478
Fax +27 (0) 86 504 4738
Cell +27 (0) 83 565 7111
Skype shadrack.hyson
www.hysoncells.co.za
HYSON CELLS®
PowerPoints
and video clips
Figure 6: New inlet to jacked pipe with ancillary works
Figure 5: New inlet for 900 mm concrete pipe
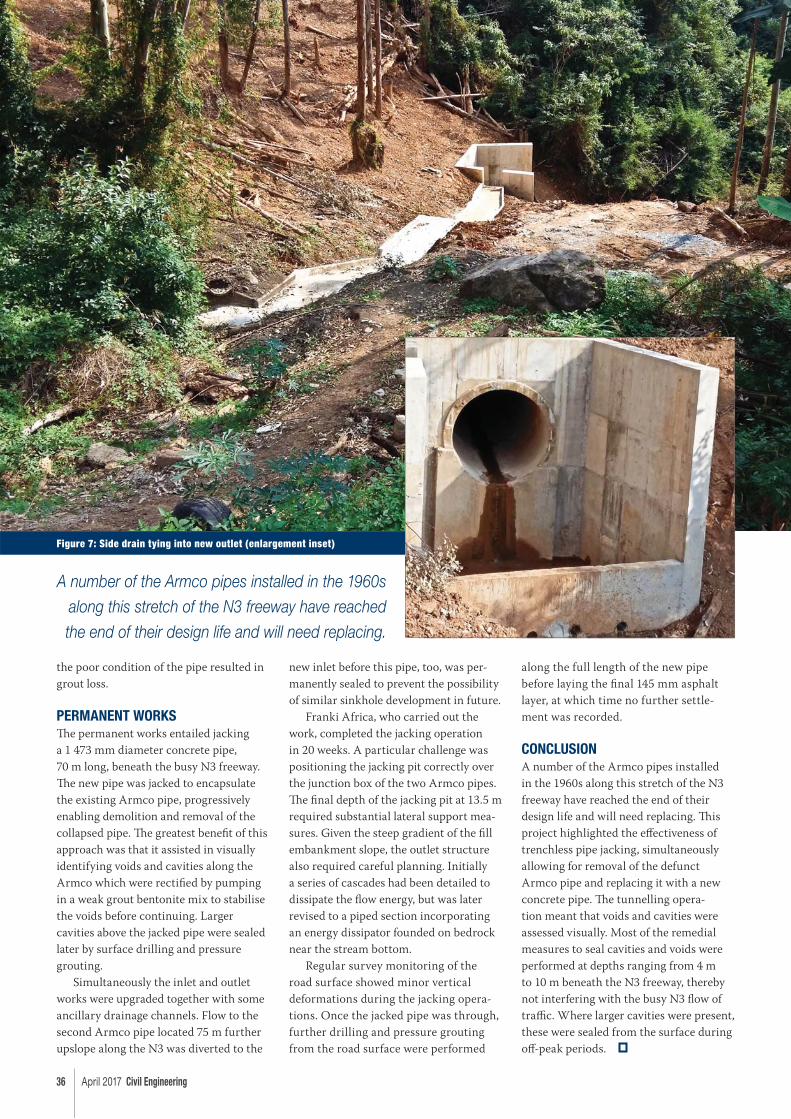
36 April 2017 Civil Engineering
the poor condition of the pipe resulted in
grout loss.
PERMANENT WORKSTh e permanent works entailed jacking
a 1 473 mm diameter concrete pipe,
70 m long, beneath the busy N3 freeway.
Th e new pipe was jacked to encapsulate
the existing Armco pipe, progressively
enabling demolition and removal of the
collapsed pipe. Th e greatest benefi t of this
approach was that it assisted in visually
identifying voids and cavities along the
Armco which were rectifi ed by pumping
in a weak grout bentonite mix to stabilise
the voids before continuing. Larger
cavities above the jacked pipe were sealed
later by surface drilling and pressure
grouting.
Simultaneously the inlet and outlet
works were upgraded together with some
ancillary drainage channels. Flow to the
second Armco pipe located 75 m further
upslope along the N3 was diverted to the
new inlet before this pipe, too, was per-
manently sealed to prevent the possibility
of similar sinkhole development in future.
Franki Africa, who carried out the
work, completed the jacking operation
in 20 weeks. A particular challenge was
positioning the jacking pit correctly over
the junction box of the two Armco pipes.
Th e fi nal depth of the jacking pit at 13.5 m
required substantial lateral support mea-
sures. Given the steep gradient of the fi ll
embankment slope, the outlet structure
also required careful planning. Initially
a series of cascades had been detailed to
dissipate the fl ow energy, but was later
revised to a piped section incorporating
an energy dissipator founded on bedrock
near the stream bottom.
Regular survey monitoring of the
road surface showed minor vertical
deformations during the jacking opera-
tions. Once the jacked pipe was through,
further drilling and pressure grouting
from the road surface were performed
along the full length of the new pipe
before laying the fi nal 145 mm asphalt
layer, at which time no further settle-
ment was recorded.
CONCLUSIONA number of the Armco pipes installed
in the 1960s along this stretch of the N3
freeway have reached the end of their
design life and will need replacing. Th is
project highlighted the eff ectiveness of
trenchless pipe jacking, simultaneously
allowing for removal of the defunct
Armco pipe and replacing it with a new
concrete pipe. Th e tunnelling opera-
tion meant that voids and cavities were
assessed visually. Most of the remedial
measures to seal cavities and voids were
performed at depths ranging from 4 m
to 10 m beneath the N3 freeway, thereby
not interfering with the busy N3 fl ow of
traffi c. Where larger cavities were present,
these were sealed from the surface during
off -peak periods.
Figure 7: Side drain tying into new outlet (enlargement inset)
A number of the Armco pipes installed in the 1960s
along this stretch of the N3 freeway have reached
the end of their design life and will need replacing.
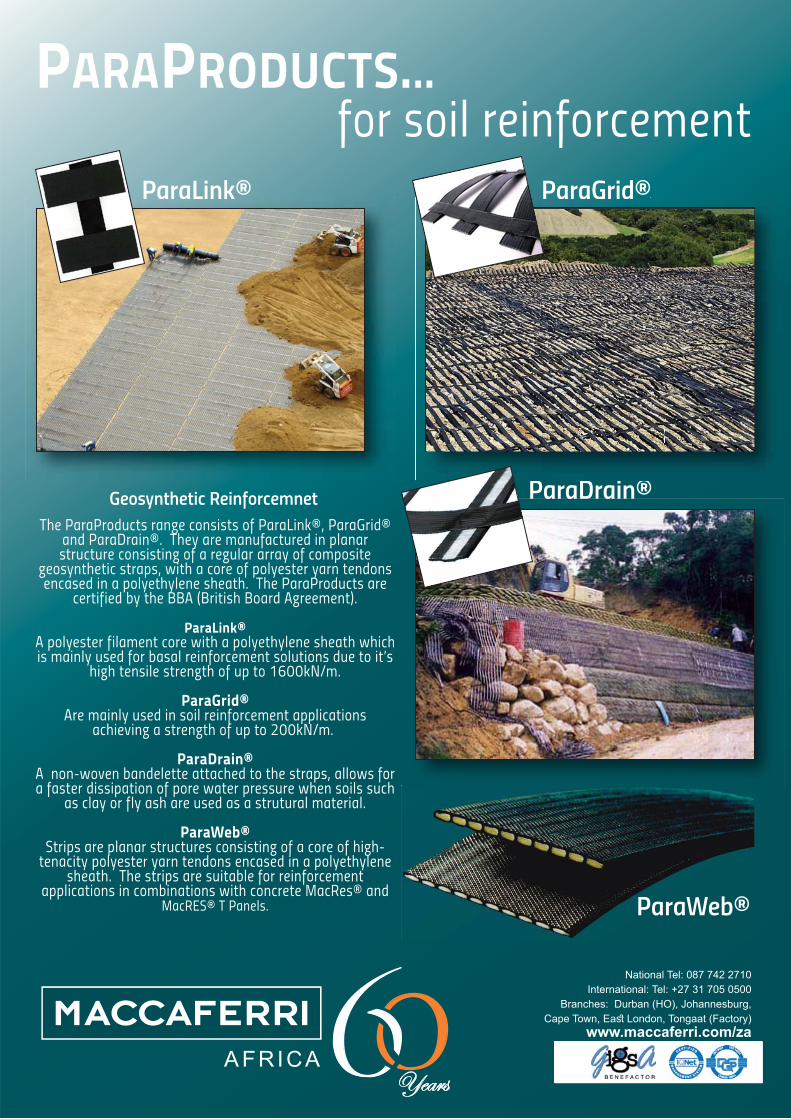
ParaGrid®
ParaDrain® Geosynthetic Reinforcemnet
ParaDrain®
ParaLink®
Years
National Tel: 087 742 2710International: Tel: +27 31 705 0500
Branches: Durban (HO), Johannesburg,
www.maccaferri.com/za
for soil reinforcement PARAPRODUCTS...
a a a
ParaWeb®
ParaLink ParaGrid
®
PPPPPPPPPPPPPPPPPPPPPPPPPPPPPPPPPPPPPPPPPPPPPPPPPPPPPPPPPPPPPPPPPPPPPPPPPPPPPPPPPPPPPPPPPPPPPPPPPPPPPPPPPPPPPPPPPPPPPPPPPPPPPPPPPPPPPPPPPPPPPPPPPPPPPPPPPPPPPPPPPPPPPPPPPPPPPPPPPPPPPPPPPPPPPPPPPPPPPPPPPPPPPPPPPPPPPPPPPPPPPPPPPPPPPPPPPPPPPPPPPPPPPPPPPPPPPPPPPPPPPPPPPPPPPPPPPPPPPPPPPPPPPPPPPPPPPPPPPPPPPPPPPPPPPPPPPPPPPPPPPPPPPPPPPPPPPPPPPPPPPPPPPPPPPPPPPPPPPPPPPPPPPPPPPPPPPPPPPPPPPPPPPPPPPPPPPPPPPPPPPPPPPPPPPPPPPPPPPPPPPPPPPPPPPPPPPPPPPPPPPPPPPPPPPPPPPPPPPPPPPPPPPPPPPPPPPPPPPPPPPPPPPPPPPPPPPPPPPPPPPPPPPPPPPPPPPPPPPPPPPPPPPPPPPPPPPPPPPPPPPPPPPPPPPPPPPPPPPPPPPPPPPPPPPPPPPPPPPPPPaaaaaaaaaaaaaaaaaaaaaaaaaaaaaaaaaaaaaaaaaaaaaaaaaaaaaaaaaaaaaaaaaaaaaaaaaaaaaaaaaaaaaaaaaaaaaaaaaaaaaaaaaaaaaaaaaaaaaaaaaaaaaaaaaaaaaaaaaaaaaaaaaaaaaaaaaaaaaaaaaaaaaaaaaaaaaaaaaaaaaaaaaaaaaaaaaaaaaaaaaaaaaaaaaaaaaaaaaaaaaaaaaaaaaaaaaaaaaaaaaaaaaaaaaaaaaaaaaaaaaaaaaaaaaaaaaaaaaaaaaaaaaaaaaaaaaaaaaaaaaaaaaaaaaaaaaaaaaaaaaaaaaaaaaaaaaaarrrrrrrrrrrrrrrrrrrrrrrrrrrrrrrrrrrrrrrrrrrrrrrrrrrrrrrrrrrrrrrrrrrrrrrrrrrrrrrrrrrrrrrrrrrrrrrrrrrrrrrrrrrrrrrrrrrrrrrrrrrrrrrrrrrrrrrrrrrrrrrrrrrrrrrrrrrrrrrrrrrrrrrrrrrrrrrrrrrrrrrrrrrrrrrrrrrrrrrrrrrrrrrrrrrrrrrrrrrrrrrrrrrrrrrrrrrrrrrrrrrrrraaaaaaaaaaaaaaaaaaaaaaaaaaaaaaaaaaaaaaaaaaaaaaaaaaaaaaaaaaaaaaaaaaaaaaaaaaaaaaaaaaaaaaaaaaaaaaaaaaaaaaaaaaaaaaaaaaaaaaaaaaaaaaaaaaaaaaaaaaaaaaaaaaaaaaaaaaaaaaaaaaaaaaaaaaaaaaaaaaaaaaaaaaaaaaaaaaaaaaaaaaaaaaaaaaaaaaaaaaaaaaaaaaaaaaaaaaaaaaaaaaaaaaaaaaaaaaaaaaaaaaaaaaaaaaaaaaaaaaaaaaaaaaaaaaaaaaaaaaaaaaaaaaaaaaaaaaaaaaaaaaaaaaaaaaaaaaaaaaaaaaaaaaaaaaaaaaaaaaaDDDDDDDDDDDDDDDDDDDDDDDDDDDDDDDDDDDDDDDDDDDDDDDDDDDDDDDDDDDDDDDDDDDDDDDDDDDDDDDDDDDDDDDDDDDDDDDDDDDDDDDDDDDDDDDDDDDDDDDDDDDDDDDDDDDDDDDDDDDDDDDDDDDDDDDDDDDDDDDDDDDDDDDDDDDDDDDDDDDDDDDDDDDDDDDDDDDDDDDDDDDDDDDDDDDDDDDDDDDDDDDDDDDDDDDDDDDDDDDDDDDDDDDDDDDDDDDDDDDDDDDDDDDDDDDDDDDDDDDDDDDDDDDDDDDDDDDDDDDDDDDDDDDDDDDDDDDDDDDDDDDDDDDDDDDDDDDDDDDDDDDDDDDDDDDDDDDDDDDDDDDDDDDDDDDDDDDDDDDDDDDDDDDDDDDDDDDDDDDDDDDDDDDDDDDDDDDDDDDDDDDDDDDDDDDDDDDDDDDDDDDDDDDDDDDrrrrrrrrrrrrrrrrrrrrrrrrrrrrrrrrrrrrrrrrrrrrrrrrrrrrrrrrrrrrrrrrrrrrrrrrrrrrrrrrrrrrrrrrrrrrrrrrrrrrrrrrrrrrrrrrrrrrrrrrrrrrrrrrrrrrrrrrrrrrrrrrrrrrrrrrrrrrrrrrrrrrrrrrrrrrrrrrrrrrrrrrrrrrrrrrrrrrrrrrraaaaaaaaaaaaaaaaaaaaaaaaaaaaaaaaaaaaaaaaaaaaaaaaaaaaaaaaaaaaaaaaaaaaaaaaaaaaaaaaaaaaaaaaaaaaaaaaaaaaaaaaaaaaaaaaaaaaaaaaaaaaaaaaaaaaaaaaaaaaaaaaaaaaaaaaaaaaaaaaaaaaaaaaaaaaaaaaaaaaaaaaaaaaaaaaaaaaaaaaaaaaaaaaaaaaaaaaaaaaaaaaaaaaaaaaaaaaaaaaaaaaaaaaaaaaaaaaaaaaaaaaaaaaaaaaaaaaaaaaaaaaaaaaaaaaaaaaaaaaaaaaaaaaaaaaaaaaaaaaaiiiiiiiiiiiiiiiiiiiiiiiiiiiiiiiiiiiiiiiiiiiiiiiiiiiiiiiiiiiiiiiiiiiiiiiiiiiiiiiiiiiiiiiiiiiiiiiiiiiiiiiiiiiiiiiiiiiiiiiiiiiiiiiiiiiiiiiiiiiiiiiiiiiiiiiiiiiiiiiiiiiiiiiiinnnnnnnnnnnnnnnnnnnnnnnnnnnnnnnnnnnnnnnnnnnnnnnnnnnnnnnnnnnnnnnnnnnnnnnnnnnnnnnnnnnnnnnnnnnnnnnnnnnnnnnnnnnnnnnnnnnnnnnnnnnnnnnnnnnnnnnnnnnnnnnnnnnnnnnnnnnnnnnnnnnnnnnnnnnnnnnnnnnnnnnnnnnnnnnnnnnnnnnnnnnnnnnnnnnnnnnnnnnnnnnnnnnnnnnnnnnnnnnnnnnnnnnnnnnnnnnnnnnnnnnnnnnnnnnnnnnnnnnnnnnnnnnnnnnnnnnnnnnnnnnnnnnnnnnnnnnnnnn®®®®®®®®®®®®®®®®®®®®®®®®®®®®®®®®®®®®®®®®®®®®®®®®®®®®®®®®®®®®®®®®®®®®®®®®®®®®®®®®®®®®®®®®®®®®®®®®®®®®®®®®®®®®®®®®®®®®®®®®®®®®®®®®®®®®®®®®®®®®®®®®®®®®®®®®®®®®®®®®®®®®®®®®®®®®®®®®®®®®®®®®®®®®®®®®®®®®®®®®®®®®®®®®®®®®®®®®®®®®®®®®®®®®®®®®®®®®®®®®®®®®®®®®®®®®®®®®®®®®®®®®®®®®®®®®®®®®®®®®®®®®®®®®®®®®®®®®®®®®®®®®®®®®®®®®®®®®®®®®®®®®®®®®®®®®®®®®®®®®®®®®®®®®®®®®®®®®®®®®®®®®®®®®®®®®®®®®®®®®®®®®®®®®®®®®®®®®®®®®®®®®®®®®®®®®®®®®®®®®®®®®®®®®®®®®®®®®®®®®®®®®®®®®®®®®®®®®®®®®®®®®®®®®®®®®®®®®®®®®®®®®®®®®®®®®®®®®®®®®®®®®®®®®®®®®®®®®®®®®®®®®®®®®
The ParaProducts range consists of ParaLink®, ParaGrid® and ParaDrain®. They are manufactured in planar structure consisting of a regular array of composite
geosynthetic straps, with a core of polyester yarn tendons encased in a polyethylene sheath. The ParaProducts are
certified by the BBA (British Board Agreement).
ParaLink® A polyester filament core with a polyethylene sheath which is mainly used for basal reinforcement solutions due to it’s
high tensile strength of up to 1600kN/m.
ParaGrid® Are mainly used in soil reinforcement applications
achieving a strength of up to 200kN/m.
ParaDrain®A non-woven bandelette attached to the straps, allows for a faster dissipation of pore water pressure when soils such
as clay or fly ash are used as a strutural material.
ParaWeb® Strips are planar structures consisting of a core of high-
tenacity polyester yarn tendons encased in a polyethylene sheath. The strips are suitable for reinforcement
applications in combinations with concrete MacRes® and MacRES® T Panels.
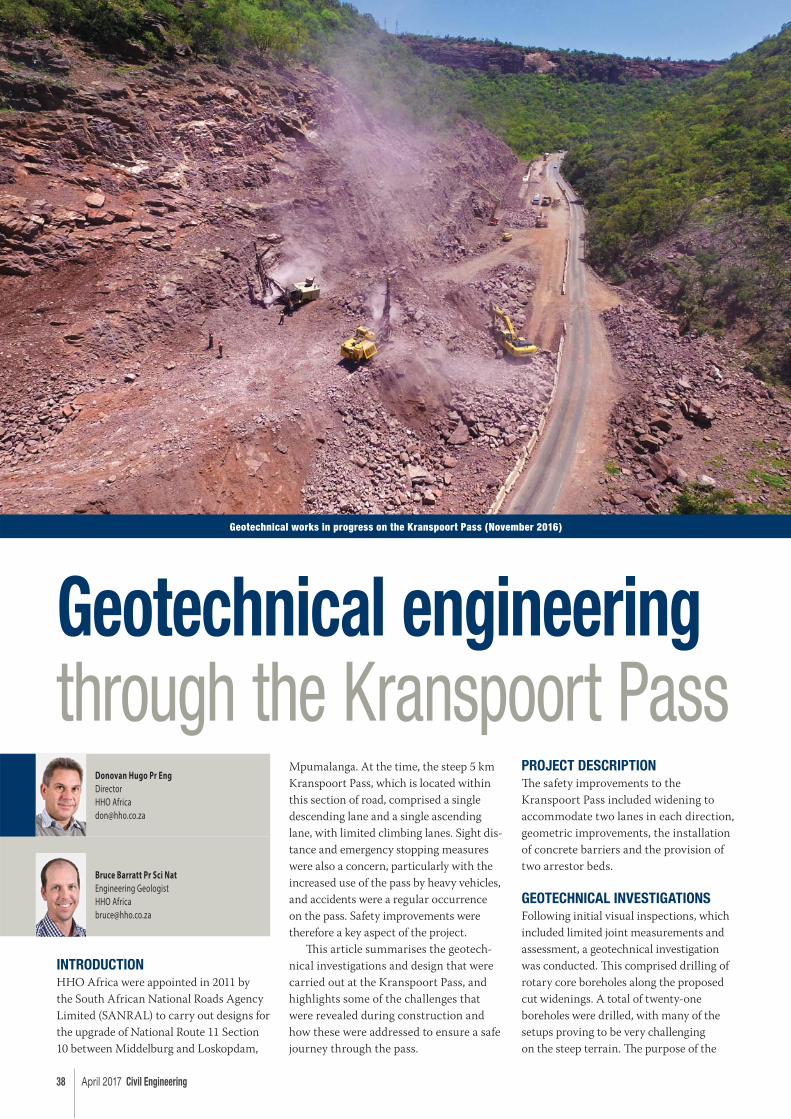
38 April 2017 Civil Engineering
INTRODUCTIONHHO Africa were appointed in 2011 by
the South African National Roads Agency
Limited (SANRAL) to carry out designs for
the upgrade of National Route 11 Section
10 between Middelburg and Loskopdam,
Mpumalanga. At the time, the steep 5 km
Kranspoort Pass, which is located within
this section of road, comprised a single
descending lane and a single ascending
lane, with limited climbing lanes. Sight dis-
tance and emergency stopping measures
were also a concern, particularly with the
increased use of the pass by heavy vehicles,
and accidents were a regular occurrence
on the pass. Safety improvements were
therefore a key aspect of the project.
Th is article summarises the geotech-
nical investigations and design that were
carried out at the Kranspoort Pass, and
highlights some of the challenges that
were revealed during construction and
how these were addressed to ensure a safe
journey through the pass.
PROJECT DESCRIPTIONTh e safety improvements to the
Kranspoort Pass included widening to
accommodate two lanes in each direction,
geometric improvements, the installation
of concrete barriers and the provision of
two arrestor beds.
GEOTECHNICAL INVESTIGATIONSFollowing initial visual inspections, which
included limited joint measurements and
assessment, a geotechnical investigation
was conducted. Th is comprised drilling of
rotary core boreholes along the proposed
cut widenings. A total of twenty-one
boreholes were drilled, with many of the
setups proving to be very challenging
on the steep terrain. Th e purpose of the
Donovan Hugo Pr Eng
DirectorHHO [email protected]
Bruce Barratt Pr Sci Nat
Engineering GeologistHHO [email protected]
Geotechnical engineering through the Kranspoort Pass
Geotechnical works in progress on the Kranspoort Pass (November 2016)
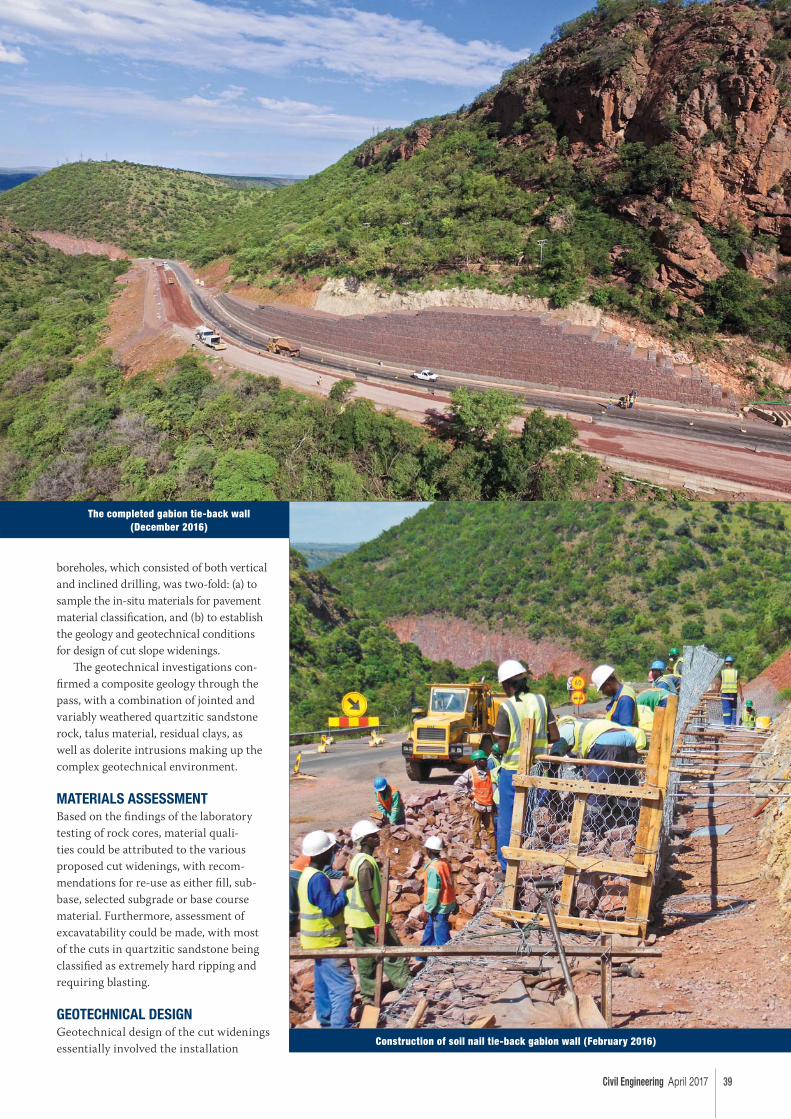
Civil Engineering April 2017 39
boreholes, which consisted of both vertical
and inclined drilling, was two-fold: (a) to
sample the in-situ materials for pavement
material classifi cation, and (b) to establish
the geology and geotechnical conditions
for design of cut slope widenings.
Th e geotechnical investigations con-
fi rmed a composite geology through the
pass, with a combination of jointed and
variably weathered quartzitic sandstone
rock, talus material, residual clays, as
well as dolerite intrusions making up the
complex geotechnical environment.
MATERIALS ASSESSMENTBased on the fi ndings of the laboratory
testing of rock cores, material quali-
ties could be attributed to the various
proposed cut widenings, with recom-
mendations for re-use as either fi ll, sub-
base, selected subgrade or base course
material. Furthermore, assessment of
excavatability could be made, with most
of the cuts in quartzitic sandstone being
classifi ed as extremely hard ripping and
requiring blasting.
GEOTECHNICAL DESIGNGeotechnical design of the cut widenings
essentially involved the installation
The completed gabion tie-back wall (December 2016)
Construction of soil nail tie-back gabion wall (February 2016)
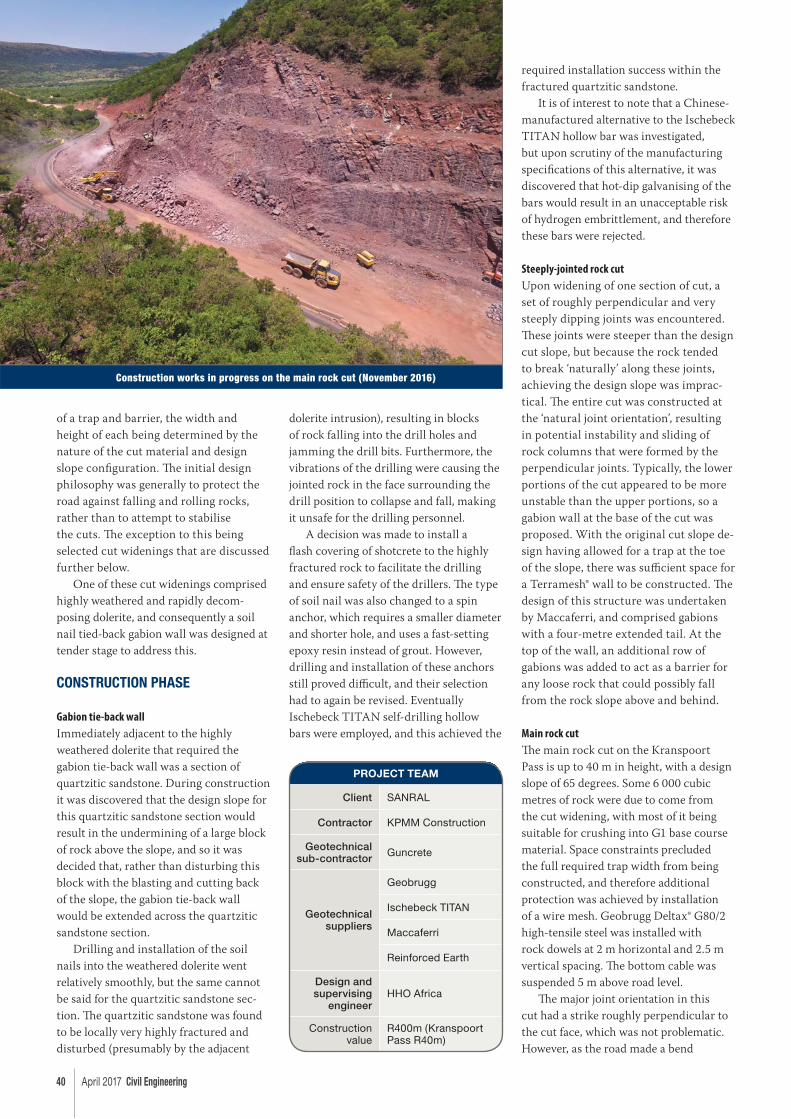
40 April 2017 Civil Engineering
of a trap and barrier, the width and
height of each being determined by the
nature of the cut material and design
slope confi guration. Th e initial design
philosophy was generally to protect the
road against falling and rolling rocks,
rather than to attempt to stabilise
the cuts. Th e exception to this being
selected cut widenings that are discussed
further below.
One of these cut widenings comprised
highly weathered and rapidly decom-
posing dolerite, and consequently a soil
nail tied-back gabion wall was designed at
tender stage to address this.
CONSTRUCTION PHASE
Gabion tie-back wall
Immediately adjacent to the highly
weathered dolerite that required the
gabion tie-back wall was a section of
quartzitic sandstone. During construction
it was discovered that the design slope for
this quartzitic sandstone section would
result in the undermining of a large block
of rock above the slope, and so it was
decided that, rather than disturbing this
block with the blasting and cutting back
of the slope, the gabion tie-back wall
would be extended across the quartzitic
sandstone section.
Drilling and installation of the soil
nails into the weathered dolerite went
relatively smoothly, but the same cannot
be said for the quartzitic sandstone sec-
tion. Th e quartzitic sandstone was found
to be locally very highly fractured and
disturbed (presumably by the adjacent
dolerite intrusion), resulting in blocks
of rock falling into the drill holes and
jamming the drill bits. Furthermore, the
vibrations of the drilling were causing the
jointed rock in the face surrounding the
drill position to collapse and fall, making
it unsafe for the drilling personnel.
A decision was made to install a
fl ash covering of shotcrete to the highly
fractured rock to facilitate the drilling
and ensure safety of the drillers. Th e type
of soil nail was also changed to a spin
anchor, which requires a smaller diameter
and shorter hole, and uses a fast-setting
epoxy resin instead of grout. However,
drilling and installation of these anchors
still proved diffi cult, and their selection
had to again be revised. Eventually
Ischebeck TITAN self-drilling hollow
bars were employed, and this achieved the
required installation success within the
fractured quartzitic sandstone.
It is of interest to note that a Chinese-
manufactured alternative to the Ischebeck
TITAN hollow bar was investigated,
but upon scrutiny of the manufacturing
specifi cations of this alternative, it was
discovered that hot-dip galvanising of the
bars would result in an unacceptable risk
of hydrogen embrittlement, and therefore
these bars were rejected.
Steeply-jointed rock cut
Upon widening of one section of cut, a
set of roughly perpendicular and very
steeply dipping joints was encountered.
Th ese joints were steeper than the design
cut slope, but because the rock tended
to break ‘naturally’ along these joints,
achieving the design slope was imprac-
tical. Th e entire cut was constructed at
the ‘natural joint orientation’, resulting
in potential instability and sliding of
rock columns that were formed by the
perpendicular joints. Typically, the lower
portions of the cut appeared to be more
unstable than the upper portions, so a
gabion wall at the base of the cut was
proposed. With the original cut slope de-
sign having allowed for a trap at the toe
of the slope, there was suffi cient space for
a Terramesh® wall to be constructed. Th e
design of this structure was undertaken
by Maccaferri, and comprised gabions
with a four-metre extended tail. At the
top of the wall, an additional row of
gabions was added to act as a barrier for
any loose rock that could possibly fall
from the rock slope above and behind.
Main rock cut
Th e main rock cut on the Kranspoort
Pass is up to 40 m in height, with a design
slope of 65 degrees. Some 6 000 cubic
metres of rock were due to come from
the cut widening, with most of it being
suitable for crushing into G1 base course
material. Space constraints precluded
the full required trap width from being
constructed, and therefore additional
protection was achieved by installation
of a wire mesh. Geobrugg Deltax® G80/2
high-tensile steel was installed with
rock dowels at 2 m horizontal and 2.5 m
vertical spacing. Th e bottom cable was
suspended 5 m above road level.
Th e major joint orientation in this
cut had a strike roughly perpendicular to
the cut face, which was not problematic.
However, as the road made a bend
PROJECT TEAM
Client SANRAL
Contractor KPMM Construction
Geotechnical sub-contractor Guncrete
Geotechnical suppliers
Geobrugg
Ischebeck TITAN
Maccaferri
Reinforced Earth
Design and supervising
engineerHHO Africa
Construction value
R400m (Kranspoort Pass R40m)
Construction works in progress on the main rock cut (November 2016)
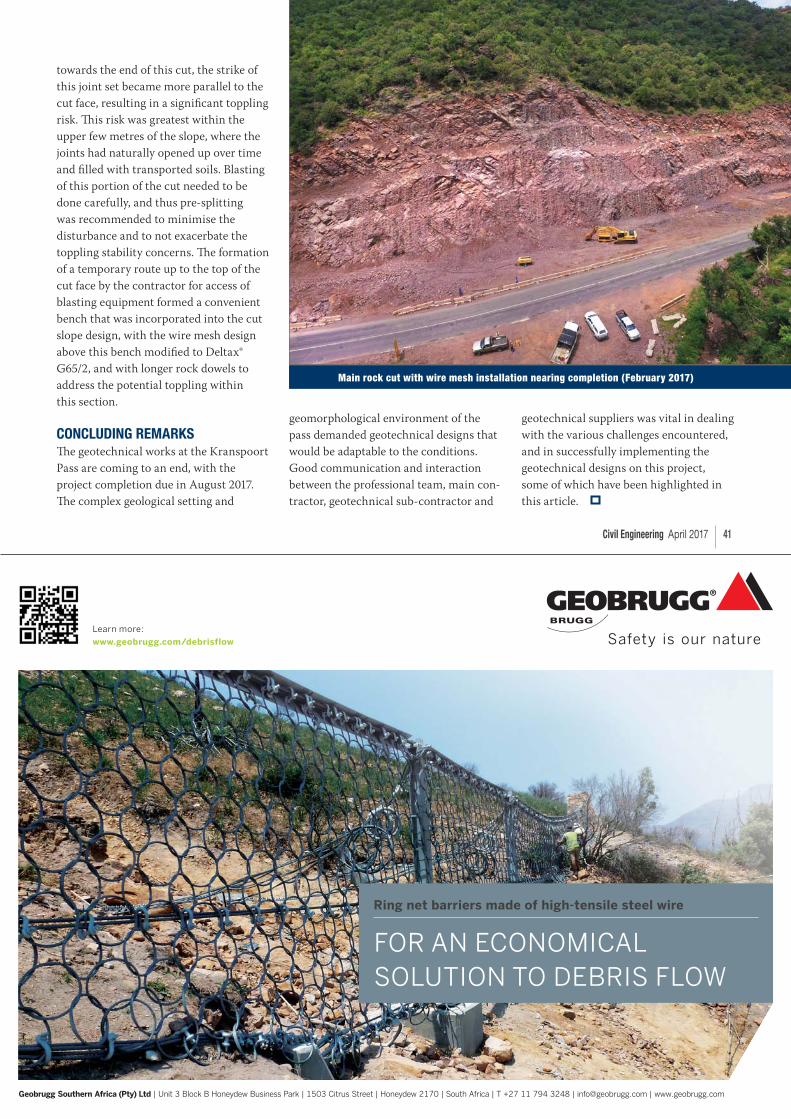
Civil Engineering April 2017 41
Geobrugg Southern Africa (Pty) Ltd | Unit 3 Block B Honeydew Business Park | 1503 Citrus Street | Honeydew 2170 | South Africa | T +27 11 794 3248 | [email protected] | www.geobrugg.com
Ring net barriers made of high-tensile steel wire
FOR AN ECONOMICAL SOLUTION TO DEBRIS FLOW
Learn more:
www.geobrugg.com/debrisflow
towards the end of this cut, the strike of
this joint set became more parallel to the
cut face, resulting in a signifi cant toppling
risk. Th is risk was greatest within the
upper few metres of the slope, where the
joints had naturally opened up over time
and fi lled with transported soils. Blasting
of this portion of the cut needed to be
done carefully, and thus pre-splitting
was recommended to minimise the
disturbance and to not exacerbate the
toppling stability concerns. Th e formation
of a temporary route up to the top of the
cut face by the contractor for access of
blasting equipment formed a convenient
bench that was incorporated into the cut
slope design, with the wire mesh design
above this bench modifi ed to Deltax®
G65/2, and with longer rock dowels to
address the potential toppling within
this section.
CONCLUDING REMARKSTh e geotechnical works at the Kranspoort
Pass are coming to an end, with the
project completion due in August 2017.
Th e complex geological setting and
geomorphological environment of the
pass demanded geotechnical designs that
would be adaptable to the conditions.
Good communication and interaction
between the professional team, main con-
tractor, geotechnical sub-contractor and
geotechnical suppliers was vital in dealing
with the various challenges encountered,
and in successfully implementing the
geotechnical designs on this project,
some of which have been highlighted in
this article.
Main rock cut with wire mesh installation nearing completion (February 2017)
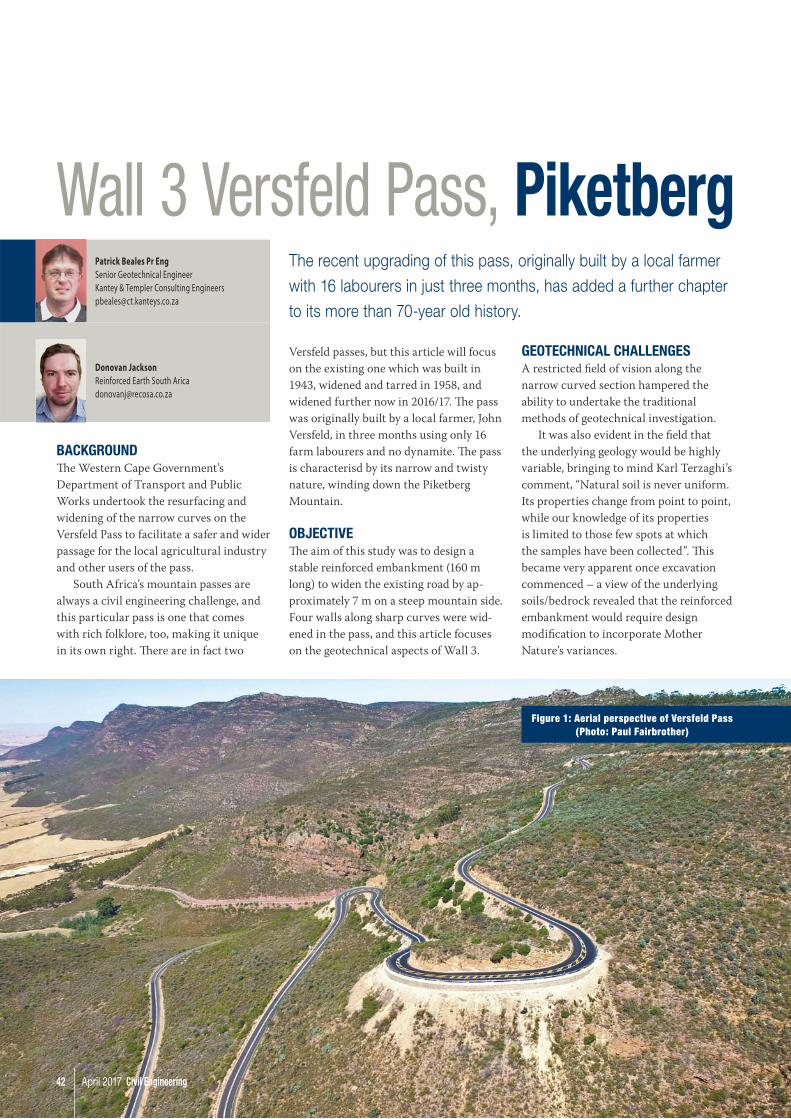
42 April 2017 Civil Engineering
BACKGROUNDTh e Western Cape Government’s
Department of Transport and Public
Works undertook the resurfacing and
widening of the narrow curves on the
Versfeld Pass to facilitate a safer and wider
passage for the local agricultural industry
and other users of the pass.
South Africa’s mountain passes are
always a civil engineering challenge, and
this particular pass is one that comes
with rich folklore, too, making it unique
in its own right. Th ere are in fact two
Versfeld passes, but this article will focus
on the existing one which was built in
1943, widened and tarred in 1958, and
widened further now in 2016/17. Th e pass
was originally built by a local farmer, John
Versfeld, in three months using only 16
farm labourers and no dynamite. Th e pass
is characterisd by its narrow and twisty
nature, winding down the Piketberg
Mountain.
OBJECTIVETh e aim of this study was to design a
stable reinforced embankment (160 m
long) to widen the existing road by ap-
proximately 7 m on a steep mountain side.
Four walls along sharp curves were wid-
ened in the pass, and this article focuses
on the geotechnical aspects of Wall 3.
GEOTECHNICAL CHALLENGESA restricted fi eld of vision along the
narrow curved section hampered the
ability to undertake the traditional
methods of geotechnical investigation.
It was also evident in the fi eld that
the underlying geology would be highly
variable, bringing to mind Karl Terzaghi’s
comment, “Natural soil is never uniform.
Its properties change from point to point,
while our knowledge of its properties
is limited to those few spots at which
the samples have been collected”. Th is
became very apparent once excavation
commenced – a view of the underlying
soils/bedrock revealed that the reinforced
embankment would require design
modifi cation to incorporate Mother
Nature’s variances.
Patrick Beales Pr Eng
Senior Geotechnical EngineerKantey & Templer Consulting [email protected]
Donovan Jackson
Reinforced Earth South [email protected]
Wall 3 Versfeld Pass, PiketbergThe recent upgrading of this pass, originally built by a local farmer with 16 labourers in just three months, has added a further chapter to its more than 70-year old history.
Figure 1: Aerial perspective of Versfeld Pass (Photo: Paul Fairbrother)
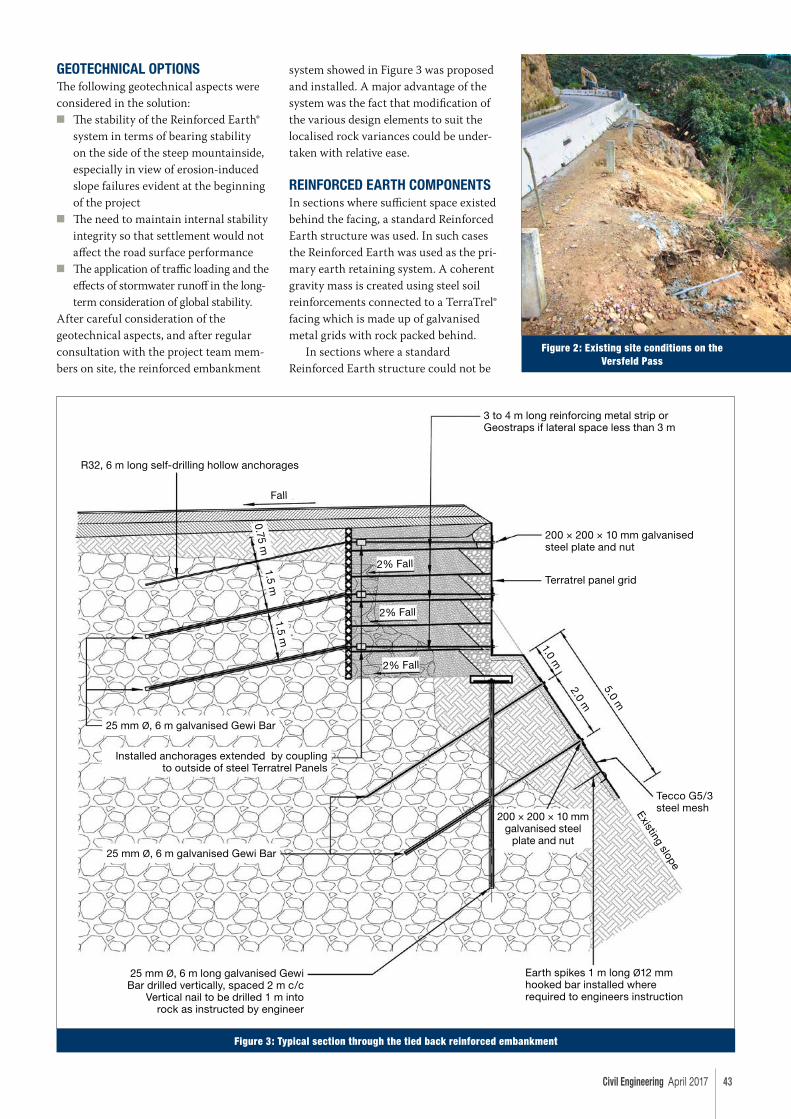
Civil Engineering April 2017 43
GEOTECHNICAL OPTIONSThe following geotechnical aspects were considered in the solution:
N The stability of the Reinforced Earth® system in terms of bearing stability on the side of the steep mountainside, especially in view of erosioninduced slope failures evident at the beginning of the project
N The need to maintain internal stability integrity so that settlement would not affect the road surface performance
N The application of traffic loading and the effects of stormwater runoff in the longterm consideration of global stability.
After careful consideration of the geotechnical aspects, and after regular consultation with the project team members on site, the reinforced embankment
system showed in Figure 3 was proposed and installed. A major advantage of the system was the fact that modification of the various design elements to suit the localised rock variances could be undertaken with relative ease.
REINFORCED EARTH COMPONENTSIn sections where sufficient space existed behind the facing, a standard Reinforced Earth structure was used. In such cases the Reinforced Earth was used as the primary earth retaining system. A coherent gravity mass is created using steel soil reinforcements connected to a TerraTrel® facing which is made up of galvanised metal grids with rock packed behind.
In sections where a standard Reinforced Earth structure could not be
Figure 2: Existing site conditions on the Versfeld Pass
Figure 3: Typical section through the tied back reinforced embankment
R32, 6 m long self-drilling hollow anchorages
Fall
3 to 4 m long reinforcing metal strip or Geostraps if lateral space less than 3 m
200 × 200 × 10 mm galvanised steel plate and nut
Terratrel panel grid
5.0 m
1.0 m
2.0 m
Tecco G5/3 steel meshExisting slope
Earth spikes 1 m long ø12 mm hooked bar installed where required to engineers instruction
200 × 200 × 10 mm galvanised steel
plate and nut
25 mm ø, 6 m long galvanised Gewi Bar drilled vertically, spaced 2 m c/c
Vertical nail to be drilled 1 m into rock as instructed by engineer
25 mm ø, 6 m galvanised Gewi Bar
Installed anchorages extended by coupling to outside of steel Terratrel Panels
25 mm ø, 6 m galvanised Gewi Bar
2% Fall
2% Fall
2% Fall
0.75 m1.5 m
1.5 m
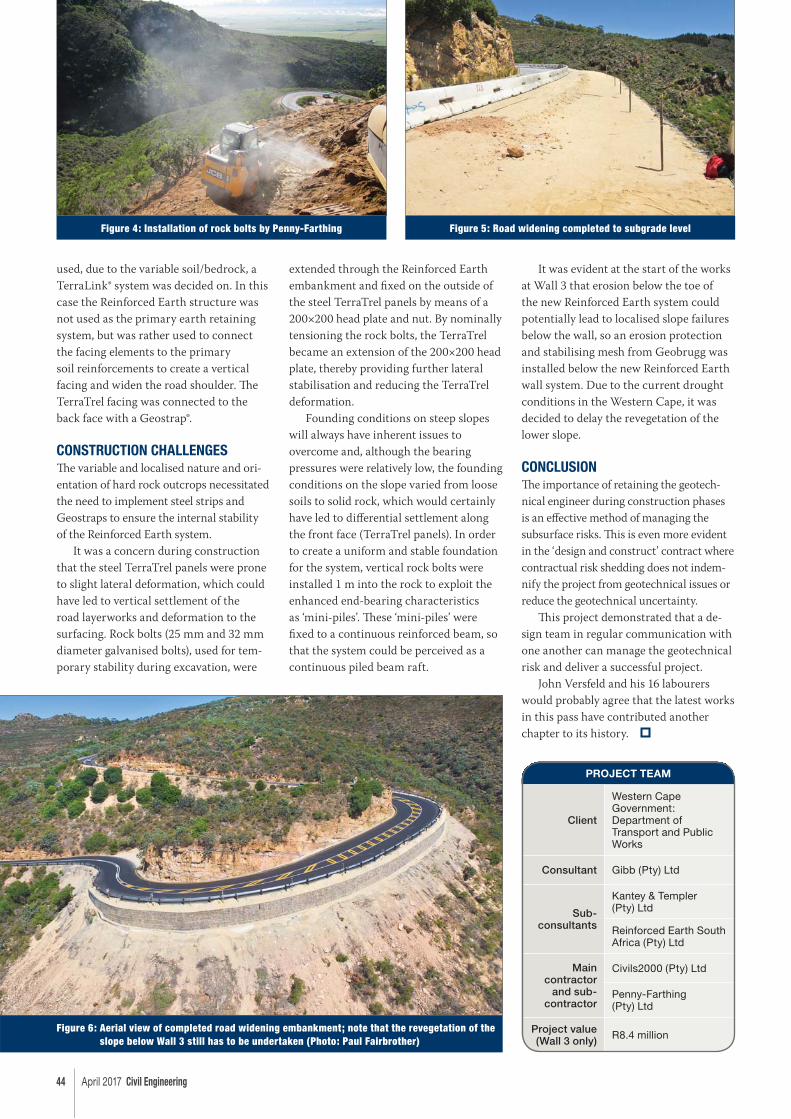
44 April 2017 Civil Engineering
used, due to the variable soil/bedrock, a
TerraLink® system was decided on. In this
case the Reinforced Earth structure was
not used as the primary earth retaining
system, but was rather used to connect
the facing elements to the primary
soil reinforcements to create a vertical
facing and widen the road shoulder. Th e
TerraTrel facing was connected to the
back face with a Geostrap®.
CONSTRUCTION CHALLENGESTh e variable and localised nature and ori-
entation of hard rock outcrops necessitated
the need to implement steel strips and
Geostraps to ensure the internal stability
of the Reinforced Earth system.
It was a concern during construction
that the steel TerraTrel panels were prone
to slight lateral deformation, which could
have led to vertical settlement of the
road layerworks and deformation to the
surfacing. Rock bolts (25 mm and 32 mm
diameter galvanised bolts), used for tem-
porary stability during excavation, were
extended through the Reinforced Earth
embankment and fi xed on the outside of
the steel TerraTrel panels by means of a
200×200 head plate and nut. By nominally
tensioning the rock bolts, the TerraTrel
became an extension of the 200×200 head
plate, thereby providing further lateral
stabilisation and reducing the TerraTrel
deformation.
Founding conditions on steep slopes
will always have inherent issues to
overcome and, although the bearing
pressures were relatively low, the founding
conditions on the slope varied from loose
soils to solid rock, which would certainly
have led to diff erential settlement along
the front face (TerraTrel panels). In order
to create a uniform and stable foundation
for the system, vertical rock bolts were
installed 1 m into the rock to exploit the
enhanced end-bearing characteristics
as ‘mini-piles’. Th ese ‘mini-piles’ were
fi xed to a continuous reinforced beam, so
that the system could be perceived as a
continuous piled beam raft.
It was evident at the start of the works
at Wall 3 that erosion below the toe of
the new Reinforced Earth system could
potentially lead to localised slope failures
below the wall, so an erosion protection
and stabilising mesh from Geobrugg was
installed below the new Reinforced Earth
wall system. Due to the current drought
conditions in the Western Cape, it was
decided to delay the revegetation of the
lower slope.
CONCLUSIONTh e importance of retaining the geotech-
nical engineer during construction phases
is an eff ective method of managing the
subsurface risks. Th is is even more evident
in the ‘design and construct’ contract where
contractual risk shedding does not indem-
nify the project from geotechnical issues or
reduce the geotechnical uncertainty.
Th is project demonstrated that a de-
sign team in regular communication with
one another can manage the geotechnical
risk and deliver a successful project.
John Versfeld and his 16 labourers
would probably agree that the latest works
in this pass have contributed another
chapter to its history.
Figure 4: Installation of rock bolts by Penny-Farthing Figure 5: Road widening completed to subgrade level
Figure 6: Aerial view of completed road widening embankment; note that the revegetation of the slope below Wall 3 still has to be undertaken (Photo: Paul Fairbrother)
PROJECT TEAM
Client
Western Cape Government: Department of Transport and Public Works
Consultant Gibb (Pty) Ltd
Sub-consultants
Kantey & Templer (Pty) Ltd
Reinforced Earth South Africa (Pty) Ltd
Main contractor
and sub-contractor
Civils2000 (Pty) Ltd
Penny-Farthing (Pty) Ltd
Project value (Wall 3 only) R8.4 million
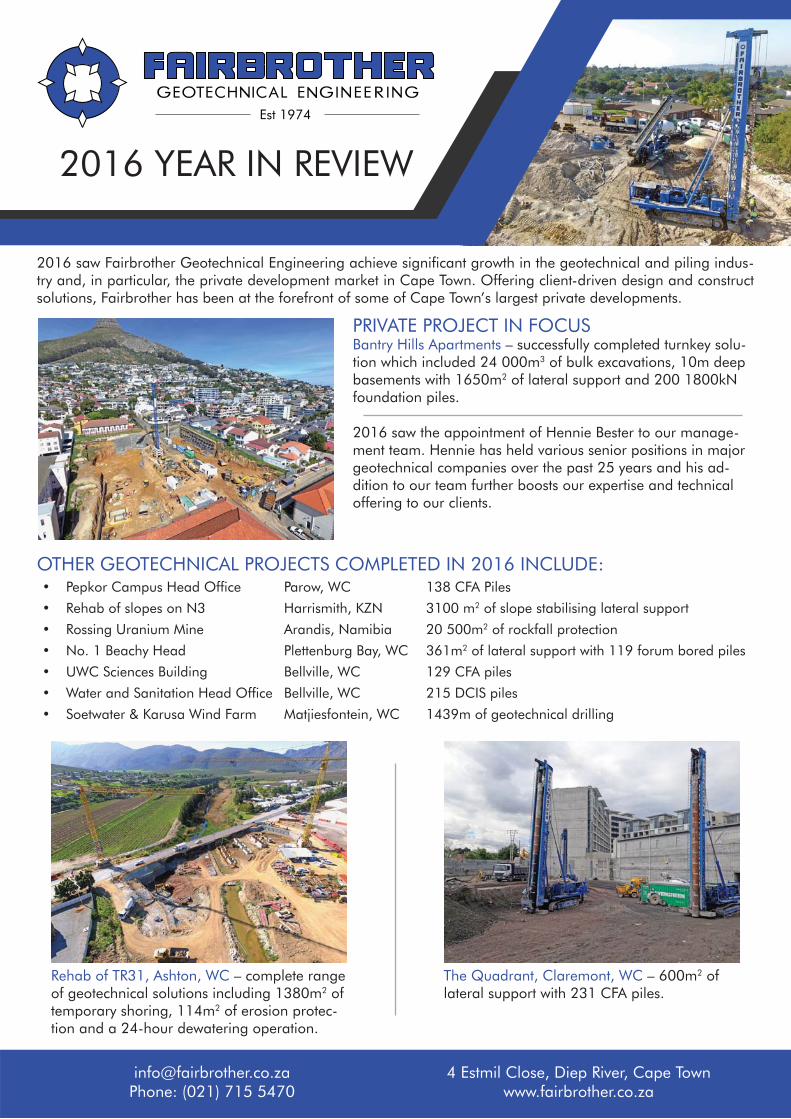
2016 saw Fairbrother Geotechnical Engineering achieve significant growth in the geotechnical and piling indus-try and, in particular, the private development market in Cape Town. Offering client-driven design and construct solutions, Fairbrother has been at the forefront of some of Cape Town’s largest private developments.
OTHER GEOTECHNICAL PROJECTS COMPLETED IN 2016 INCLUDE:• Pepkor Campus Head Office Parow, WC 138 CFA Piles
• Rehab of slopes on N3 Harrismith, KZN 3100 m2 of slope stabilising lateral support
• Rossing Uranium Mine Arandis, Namibia 20 500m2 of rockfall protection
• No. 1 Beachy Head Plettenburg Bay, WC 361m2 of lateral support with 119 forum bored piles
• UWC Sciences Building Bellville, WC 129 CFA piles
• Water and Sanitation Head Office Bellville, WC 215 DCIS piles
• Soetwater & Karusa Wind Farm Matjiesfontein, WC 1439m of geotechnical drilling
Est 1974
2016 YEAR IN REVIEW
PRIVATE PROJECT IN FOCUSBantry Hills Apartments – successfully completed turnkey solu-tion which included 24 000m3 of bulk excavations, 10m deep basements with 1650m2 of lateral support and 200 1800kN foundation piles.
2016 saw the appointment of Hennie Bester to our manage-ment team. Hennie has held various senior positions in major geotechnical companies over the past 25 years and his ad-dition to our team further boosts our expertise and technical offering to our clients.
Rehab of TR31, Ashton, WC – complete range of geotechnical solutions including 1380m2 of temporary shoring, 114m2 of erosion protec-tion and a 24-hour dewatering operation.
The Quadrant, Claremont, WC – 600m2 of lateral support with 231 CFA piles.
[email protected]: (021) 715 5470
4 Estmil Close, Diep River, Cape Townwww.fairbrother.co.za
The only supplier of Reinforced Earth®
to the Construction Industry
We patented the Reinforced Earth® technique in 1963.Over the last 50 years we have:
� forged an unrivalled level of experience and expertise in reinforced backfill applications
� set the standards in the technique� played an active role in over 50,000 projects worldwide.
Registered trademarks protect the company from others wishing to supply Reinforced Earth® services and products under the Reinforced Earth® banner.
www.recosa.co.za
+27 11 726 6180Johannesburg
SOUTH AFRICA

Civil Engineering April 2017 47
INTRODUCTIONMechanically Stabilised Earth (MSE)
walls have a growing application in place
of conventional retaining systems for
varying reasons, most notably economy
and constructability. However, there have
recently been a number of failures or
instances of poor performance of these
systems throughout the southern African
region. An evaluation of these indicates
that there are two fundamental causes
for poor performance. Th e fi rst relates
to the nature in which MSE structures
are planned, designed and constructed.
Th e second relates to the need for the
geotechnical designer to develop a clear
understanding of the subsurface condi-
tions, together with a need for routine
verifi cations of the ground conditions,
design, construction and materials during
the process of construction. Th is article
presents a case study of the planning, de-
sign and construction of an MSE wall, in
this case a Reinforced Earth® wall, which
was successfully constructed over a poor
subgrade in Durban. In the context of the
preceding discussion, the case for inte-
grated design by geotechnical engineers
is made, given the uncertainties with the
“design and build” procurement model
which is typically used for the supply of
MSE systems.
MR458 ROAD-OVER-RAIL BRIDGELocated approximately 20 km north
of Durban, connecting JG Champion
Drive to the Cornubia Industrial and
Business Estate (CIBE), lies the new
MR458 road-over-rail bridge which
leads motorists directly to the main
entrance of the estate. CIBE forms part
of the Cornubia development, which is
a multi-billion rand integrated human
settlement incorporating industrial, com-
mercial, residential and open space use.
It is being developed by Tongaat Hulett
Developments and the eTh ekwini Metro
Municipality, and has been adopted by the
Cabinet as a national priority project.
Th e dual bridges, each 88.5 m in
length, comprise four spans with slanted
piers and an integral deck consisting of
pre-tensioned beams. Th e abutments to
the bridges are also slanted and include
some 200 m of MSE wall (MSEW) ap-
proach fi lls. Th e site is situated in an allu-
vial plain, with the western portion of the
site previously cultivated as a watercress
farm, while the eastern portion was used
as a dump site for sludge from a nearby
wastewater works.
Th e site off ered poor founding condi-
tions for the MSEW and bridge struc-
tures, with over 120 mm of settlement
Frans van der Merwe Pr Eng
Geotechnical EngineerSMEC South Africa
Fernando Pequenino Pr Eng
Principal Geotechnical EngineerGaGE Consulting Geotechnical Engineers
Charles Warren-Codrington
Geotechnical EngineerSMEC South Africa
The problem with MSE walls – a case study in support of integrated geotechnical engineering design
Completed Cornubia Bridge and MSE walls – MSEWs are the ultimate geotechnical structures, as they have an incontrovertible link with the soils within, around and below

48 April 2017 Civil Engineering
predicted for the 9.5 m high abutments.
Th e bridge abutments are buttressed
walls, leaning back at a 1 in 4 slope. Th e
fact that the abutments were slanted
implied that any settlement between
the bridge (which is founded on rock-
socketed piles) and the MSEW would be
accentuated and immediately visible in
the architectural feature of the bridges.
Th e development of negative skin frictions
on the piles for the abutments was also
a concern, due to the poor subgrade.
Dynamic replacement stone columns
were thus required to improve the
founding conditions below the MSEW.
OVERVIEW OF MSE WALLSMSEWs in the broadest sense comprise
concrete block or panel façades connected
with multiple layers of inclusions acting
as reinforcement in the soils placed as
fi ll. Th e complexity begins with the wide
array and ever-developing soil reinforce-
ment technologies, suppliers, materials
and even connection and construction
methodologies, which implies that the
performance of any MSE system hinges
on the application for which the system is
selected.
Added to this, is the multifarious
interaction that occurs with the founding
soils on which it is built and the soil
materials with which it is built. MSEWs
are the ultimate geotechnical structures;
the structure has an incontrovertible link
with the soils within, around and below.
Th e stresses developed and strain en-
countered in the soils and the structural
system itself, infl uence each other and
cannot be designed independently of each
other.
Th e case for the use of the MSE
systems can be strongly motivated when
the cost and time taken to construct
such systems are considered. Cost benefi t
comparisons undertaken on recent bridge
projects have shown that only once walls
exceed 20 m in height should consid-
eration be given to the replacement of
sections of MSEW with additional bridge
spans if there are no other considerations
aff ecting the bridge length.
An inherent problem with MSE
systems is the way in which they are pro-
cured, planned, designed and constructed.
In trying to account for the varying
patented systems, the most common ap-
proach is to allow the contractor to supply
the design based on usually very limited
information by the designer. For example,
Cornubia Bridge west abutment – the abutments were slanted, which would have visually accentuated the effect of any downward settlement behind the abutment
Ground improvement comprising dynamic replacement craters
Load transfer platform designed in accordance to EBGEO

Civil Engineering April 2017 49
www.theconcreteinstitute.org.za+27 11 315 0300
Need to excel in concrete? Our School of Concrete Technology offers internationally recognised courses for anyone interested in concrete. Master concrete with us.
We are there when you celebrate
drawings could very simply state “wall
design by others” with limited or inappro-
priate specifi cation, and no guidance on
design, design specifi cation or para meters.
Th is option is selected to encourage
competition between suppliers, and is
generally welcomed by suppliers, despite
the self-infl icting problems caused.
Consequently, this procurement
model has led to the following unintended
consequences which undermine the ef-
fectiveness and credibility of the MSEW
system:
■ Th e elimination of proper geotechnical
investigation and almost no involve-
ment by geotechnical engineers as part
of the principal design or owner’s con-
sulting team. Th is is supposedly under
the assumption that the contractor (or
supplier) assumes the risk, which is
not the case.
■ Without specifi cations provided by the
owners, or if such specifi cations are
too broad, it is not possible to compare
MSEW on any basis other than on
price. Hence, the least robust design
will produce the lowest cost. Lack of a
design basis memorandum may result
in liberal soil strengths, optimistic
loading conditions, and favourable
groundwater conditions. Additionally,
some proprietary design approaches
eliminate or alter minimum standards
of practice (e.g. facing connection,
bearing capacity, corrosion protection,
internal failure surface orientation,
and global stability) (Simac et al 2007).
Th is is particularly true in South
Africa, where even unreinforced
block retaining walls are confusingly
marketed as technically equivalent to
MSEWs.
Returning to the issue of risk, and with
reference to the GCC and COLTO specifi -
cations, the design consultant retains re-
sponsibility for overall stability and design
criteria. Th e system thus actually involves
a shared design responsibility between the
owner, design consultant, supplier and/or
contractor.
It is not a design-and-build method,
which is the method that the owner and
designer usually believe they are getting,
even though none of the procedural,
contractual and legal criteria necessary to
invoke a design-and-build scenario are put
into place. Th is leads to confusion before,
during and after construction regarding
exactly which party assumes engineering
responsibility (and liability) for important
design decisions and quality assurance.
Th e above highlights that there is
signifi cant responsibility assumed by the
owner and his designer when specifying
MSEW systems, and in the case of the
new Cornubia Bridge, the poor subgrade
conditions and a bridge design which
accentuates any settlement of the MSE
walls behind the abutment, necessitated
that an integrated geotechnical design
approach was required for the success of
the project. Th is integrated geotechnical
design entailed the following:
■ Geotechnical investigation
in accordance with the SAICE
Geotechnical Division Code of
Practice for Site Investigations, and led
by a registered geotechnical engineer;
■ An initial detailed design to establish
technical and performance criteria,
and select suitable MSEW systems;
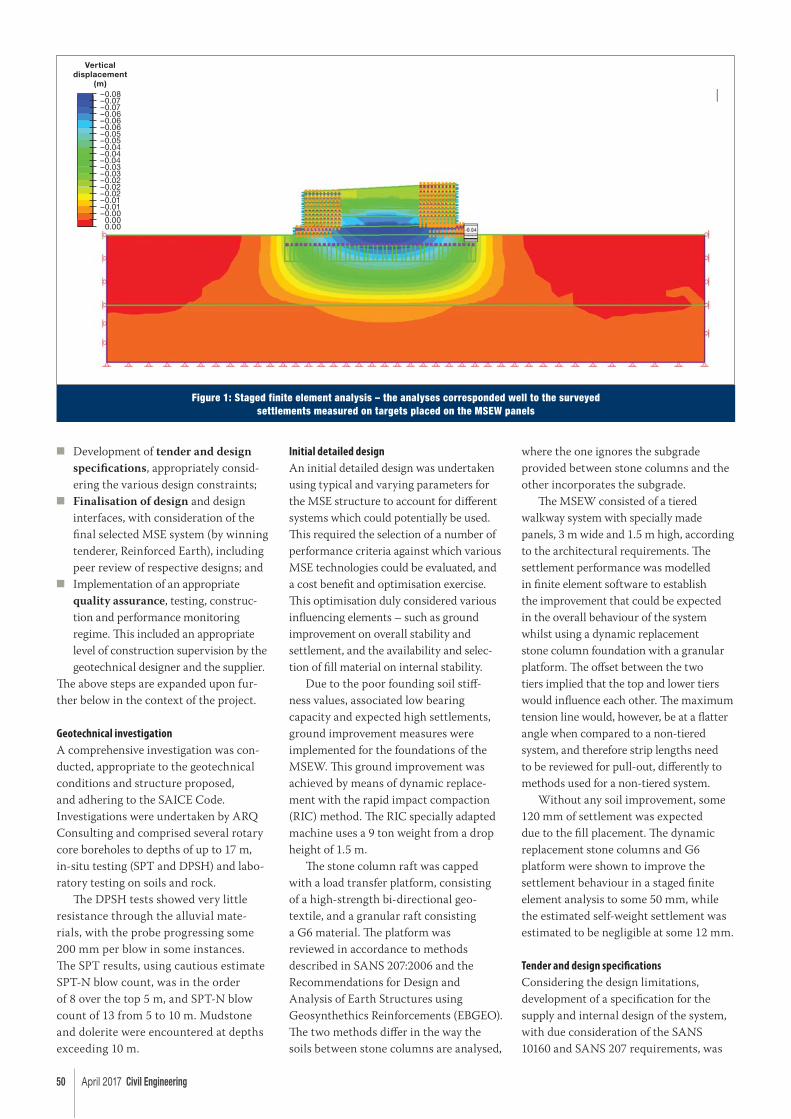
50 April 2017 Civil Engineering
■ Development of tender and design
specifi cations, appropriately consid-
ering the various design constraints;
■ Finalisation of design and design
interfaces, with consideration of the
fi nal selected MSE system (by winning
tenderer, Reinforced Earth), including
peer review of respective designs; and
■ Implementation of an appropriate
quality assurance, testing, construc-
tion and performance monitoring
regime. Th is included an appropriate
level of construction supervision by the
geotechnical designer and the supplier.
Th e above steps are expanded upon fur-
ther below in the context of the project.
Geotechnical investigation
A comprehensive investigation was con-
ducted, appropriate to the geotechnical
conditions and structure proposed,
and adhering to the SAICE Code.
Investigations were undertaken by ARQ
Consulting and comprised several rotary
core boreholes to depths of up to 17 m,
in-situ testing (SPT and DPSH) and labo-
ratory testing on soils and rock.
Th e DPSH tests showed very little
resistance through the alluvial mate-
rials, with the probe progressing some
200 mm per blow in some instances.
Th e SPT results, using cautious estimate
SPT-N blow count, was in the order
of 8 over the top 5 m, and SPT-N blow
count of 13 from 5 to 10 m. Mudstone
and dolerite were encountered at depths
exceeding 10 m.
Initial detailed design
An initial detailed design was undertaken
using typical and varying parameters for
the MSE structure to account for diff erent
systems which could potentially be used.
Th is required the selection of a number of
performance criteria against which various
MSE technologies could be evaluated, and
a cost benefi t and optimisation exercise.
Th is optimisation duly considered various
infl uencing elements – such as ground
improvement on overall stability and
settle ment, and the availability and selec-
tion of fi ll material on internal stability.
Due to the poor founding soil stiff -
ness values, associated low bearing
capacity and expected high settlements,
ground improvement measures were
implemented for the foundations of the
MSEW. Th is ground improvement was
achieved by means of dynamic replace-
ment with the rapid impact compaction
(RIC) method. Th e RIC specially adapted
machine uses a 9 ton weight from a drop
height of 1.5 m.
Th e stone column raft was capped
with a load transfer platform, consisting
of a high-strength bi-directional geo-
textile, and a granular raft consisting
a G6 material. Th e platform was
reviewed in accordance to methods
described in SANS 207:2006 and the
Recommendations for Design and
Analysis of Earth Structures using
Geosynthethics Reinforcements (EBGEO).
Th e two methods diff er in the way the
soils between stone columns are analysed,
where the one ignores the subgrade
provided between stone columns and the
other incorporates the subgrade.
Th e MSEW consisted of a tiered
walkway system with specially made
panels, 3 m wide and 1.5 m high, according
to the architectural requirements. Th e
settlement performance was modelled
in fi nite element software to establish
the improvement that could be expected
in the overall behaviour of the system
whilst using a dynamic replacement
stone column foundation with a granular
platform. Th e off set between the two
tiers implied that the top and lower tiers
would infl uence each other. Th e maximum
tension line would, however, be at a fl atter
angle when compared to a non-tiered
system, and therefore strip lengths need
to be reviewed for pull-out, diff erently to
methods used for a non-tiered system.
Without any soil improvement, some
120 mm of settlement was expected
due to the fi ll placement. Th e dynamic
replacement stone columns and G6
platform were shown to improve the
settlement behaviour in a staged fi nite
element analysis to some 50 mm, while
the estimated self-weight settlement was
estimated to be negligible at some 12 mm.
Tender and design specifi cations
Considering the design limitations,
development of a specifi cation for the
supply and internal design of the system,
with due consideration of the SANS
10160 and SANS 207 requirements, was
Figure 1: Staged finite element analysis – the analyses corresponded well to the surveyed settlements measured on targets placed on the MSEW panels
Vertical displacement
(m)–0.08–0.07–0.07–0.06–0.06–0.06–0.05–0.05–0.04–0.04–0.04
0.000.00
–0.00–0.01–0.01–0.02–0.02–0.02–0.03–0.03
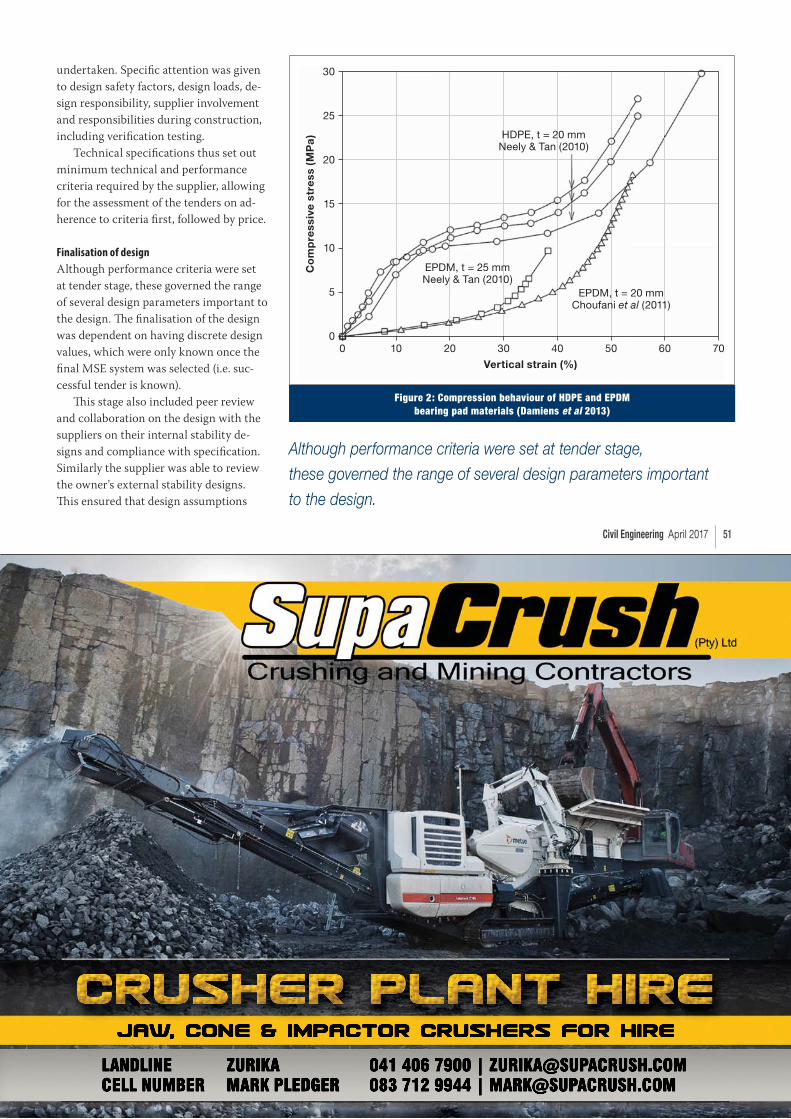
Civil Engineering April 2017 51
undertaken. Specifi c attention was given
to design safety factors, design loads, de-
sign responsibility, supplier involvement
and responsibilities during construction,
including verifi cation testing.
Technical specifi cations thus set out
minimum technical and performance
criteria required by the supplier, allowing
for the assessment of the tenders on ad-
herence to criteria fi rst, followed by price.
Finalisation of design
Although performance criteria were set
at tender stage, these governed the range
of several design parameters important to
the design. Th e fi nalisation of the design
was dependent on having discrete design
values, which were only known once the
fi nal MSE system was selected (i.e. suc-
cessful tender is known).
Th is stage also included peer review
and collaboration on the design with the
suppliers on their internal stability de-
signs and compliance with specifi cation.
Similarly the supplier was able to review
the owner’s external stability designs.
Th is ensured that design assumptions
Figure 2: Compression behaviour of HDPE and EPDM bearing pad materials (Damiens et al 2013)
Co
mp
ress
ive
stre
ss (
MP
a)
30
25
20
15
10
5
0
Vertical strain (%)
0 10 20 30 40 50 60 70
HDPE, t = 20 mmNeely & Tan (2010)
EPDM, t = 25 mmNeely & Tan (2010)
EPDM, t = 20 mmChoufani et al (2011)
Although performance criteria were set at tender stage,
these governed the range of several design parameters important
to the design.
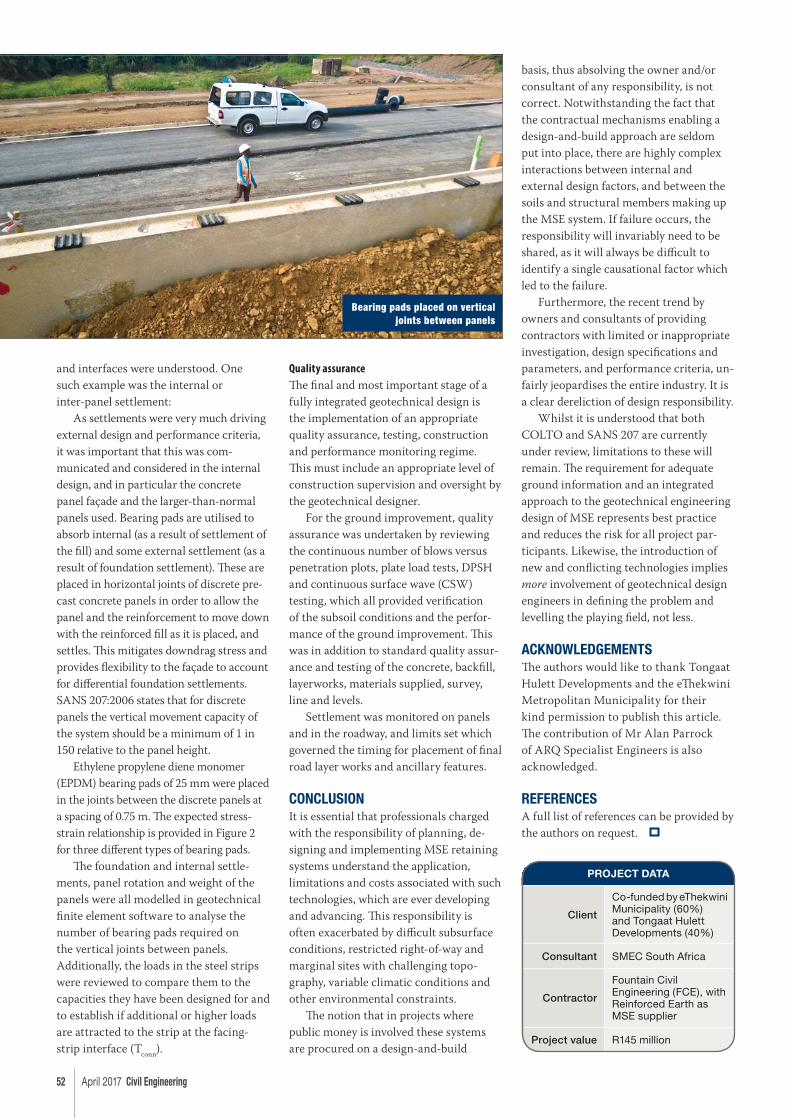
52 April 2017 Civil Engineering
and interfaces were understood. One
such example was the internal or
inter-panel settlement:
As settlements were very much driving
external design and performance criteria,
it was important that this was com-
municated and considered in the internal
design, and in particular the concrete
panel façade and the larger-than-normal
panels used. Bearing pads are utilised to
absorb internal (as a result of settlement of
the fi ll) and some external settlement (as a
result of foundation settlement). Th ese are
placed in horizontal joints of discrete pre-
cast concrete panels in order to allow the
panel and the reinforcement to move down
with the reinforced fi ll as it is placed, and
settles. Th is mitigates downdrag stress and
provides fl exibility to the façade to account
for diff erential foundation settlements.
SANS 207:2006 states that for discrete
panels the vertical movement capacity of
the system should be a minimum of 1 in
150 relative to the panel height.
Ethylene propylene diene monomer
(EPDM) bearing pads of 25 mm were placed
in the joints between the discrete panels at
a spacing of 0.75 m. Th e expected stress-
strain relationship is provided in Figure 2
for three diff erent types of bearing pads.
Th e foundation and internal settle-
ments, panel rotation and weight of the
panels were all modelled in geotechnical
fi nite element software to analyse the
number of bearing pads required on
the vertical joints between panels.
Additionally, the loads in the steel strips
were reviewed to compare them to the
capacities they have been designed for and
to establish if additional or higher loads
are attracted to the strip at the facing-
strip interface (Tconn
).
Quality assurance
Th e fi nal and most important stage of a
fully integrated geotechnical design is
the implementation of an appropriate
quality assurance, testing, construction
and performance monitoring regime.
Th is must include an appropriate level of
construction supervision and oversight by
the geotechnical designer.
For the ground improvement, quality
assurance was undertaken by reviewing
the continuous number of blows versus
pene tration plots, plate load tests, DPSH
and continuous surface wave (CSW)
testing, which all provided verifi cation
of the subsoil conditions and the perfor-
mance of the ground improvement. Th is
was in addition to standard quality assur-
ance and testing of the concrete, backfi ll,
layerworks, materials supplied, survey,
line and levels.
Settlement was monitored on panels
and in the roadway, and limits set which
governed the timing for placement of fi nal
road layer works and ancillary features.
CONCLUSIONIt is essential that professionals charged
with the responsibility of planning, de-
signing and implementing MSE retaining
systems understand the application,
limitations and costs associated with such
technologies, which are ever developing
and advancing. Th is responsibility is
often exacerbated by diffi cult subsurface
conditions, restricted right-of-way and
marginal sites with challenging topo-
graphy, variable climatic conditions and
other environmental constraints.
Th e notion that in projects where
public money is involved these systems
are procured on a design-and-build
basis, thus absolving the owner and/or
consultant of any responsibility, is not
correct. Notwithstanding the fact that
the contractual mechanisms enabling a
design-and-build approach are seldom
put into place, there are highly complex
interactions between internal and
external design factors, and between the
soils and structural members making up
the MSE system. If failure occurs, the
responsibility will invariably need to be
shared, as it will always be diffi cult to
identify a single causational factor which
led to the failure.
Furthermore, the recent trend by
owners and consultants of providing
contractors with limited or inappropriate
investigation, design specifi cations and
parameters, and performance criteria, un-
fairly jeopardises the entire industry. It is
a clear dereliction of design responsibility.
Whilst it is understood that both
COLTO and SANS 207 are currently
under review, limitations to these will
remain. Th e requirement for adequate
ground information and an integrated
approach to the geotechnical engineering
design of MSE represents best practice
and reduces the risk for all project par-
ticipants. Likewise, the introduction of
new and confl icting technologies implies
more involvement of geotechnical design
engineers in defi ning the problem and
levelling the playing fi eld, not less.
ACKNOWLEDGEMENTSTh e authors would like to thank Tongaat
Hulett Developments and the eTh ekwini
Metropolitan Municipality for their
kind permission to publish this article.
Th e contribution of Mr Alan Parrock
of ARQ Specialist Engineers is also
acknowledged.
REFERENCESA full list of references can be provided by
the authors on request.
PROJECT DATA
Client
Co-funded by eThekwini Municipality (60%) and Tongaat Hulett Developments (40%)
Consultant SMEC South Africa
Contractor
Fountain Civil Engineering (FCE), with Reinforced Earth as MSE supplier
Project value R145 million
Bearing pads placed on vertical joints between panels

Civil Engineering April 2017 53
INTRODUCTIONAMKA Products is a black-owned and
managed South African enterprise in the
health and beauty industry, led by several
generations of the Kalla family since its
inception in the 1950s. It has grown from
a humble trading operation struggling to
break into the mainstream retail sector
to now having a strong presence in South
Africa, and showing increasing growth
into Africa. Th is Top 500 South African
company is consistently rated as one of
the top ten empowerment companies, and
was the winner of the Shoprite Supplier
of the Year award for 2016, and the
recipient of a PMI Diamond Arrow Top
Manufacturer award in 2013.
Today the company employs more
than 1 000 staff members and produces
over 800 fast-moving consumer goods
products which are marketed in the hair
care, skin care, fragrance and home care
markets, with over 30 leading brand
names sold in 35 African countries. Th e
company operates, perhaps a little dis-
jointedly, from six manufacturing plants
in Sunderland Ridge, Pretoria, some of
which it has outgrown, necessitating a
sizeable expansion in its operation – cur-
rently under construction – to cope with
present and future demand.
Th is expansion project has provided
AMKA with an ideal opportunity to both
consolidate and streamline the future
operation into an integrated, state-of-
the-art manufacturing and warehousing
enterprise, following global best practice
procedures in the industry.
EXPANSION PROJECTFor the purposes of this expansion,
AMKA procured a prime site on the
corner of the M10 and R55 arterials in
Sunderland Ridge (see Figure 1), and
proceeded with the construction of the
fi rst of the warehouses – denoted as
CDC1 in Figure 1 – roughly 20 years
ago. Th is warehouse is presently fully
functional and is operated under contract
by Imperial Logistics.
Th e second and signifi cantly larger
phase of the expansion project com-
menced some two years back, with a
view to construct the fi rst of two new
factories on the same premises, which
will supply both the existing (CDC1) and
future (CDC2) warehouses, supported by
a formal multi-storey offi ce block with
upgraded access control.
Th e new CDC2 warehouse has been
designed to comprise racks standing ap-
proximately 50% higher than the present
9 m high racks of CDC1, and will be used
for longer-term storage than CDC1, which
has a very high stock turnover.
SITE CHALLENGESWith the site dipping from northeast
to southwest at roughly 1:18, the client
opted to terrace the site in preparation
for the expansion, with CDC2 and the
offi ce structures located on the upper
terrace, adjoining CDC1, and two phases
of the factory component of the operation
located on a lower terrace – some 8 m
lower than CDC2 – to optimise materials
production, handling and distribution.
Th ese terracing operations neces-
sitated lateral support being applied to the
8 m high cut slopes, which took the form
of a mesh-reinforced and shotcreted soil-
nailed wall, half of which was treated as
a permanent structure to support CDC1,
Stuart Morgan Pr Eng
DirectorGeoid Geotechnical Engineers
Alastair Morgan Pr Eng
DirectorGeoid Geotechnical Engineers
David Schultz
Candidate EngineerGeoid Geotechnical Engineers
Ground improvement by compaction grouting in IHC5 and IHC7 dolomitic conditions
Figure 1: The AMKA factory and warehouse site on the corner of the M10 and R55 arterials in Sunderland Ridge
Gatehouse
Offi ces
Retaining wall
interface structure
CDC2
CDC1
Factory 1Factory 2
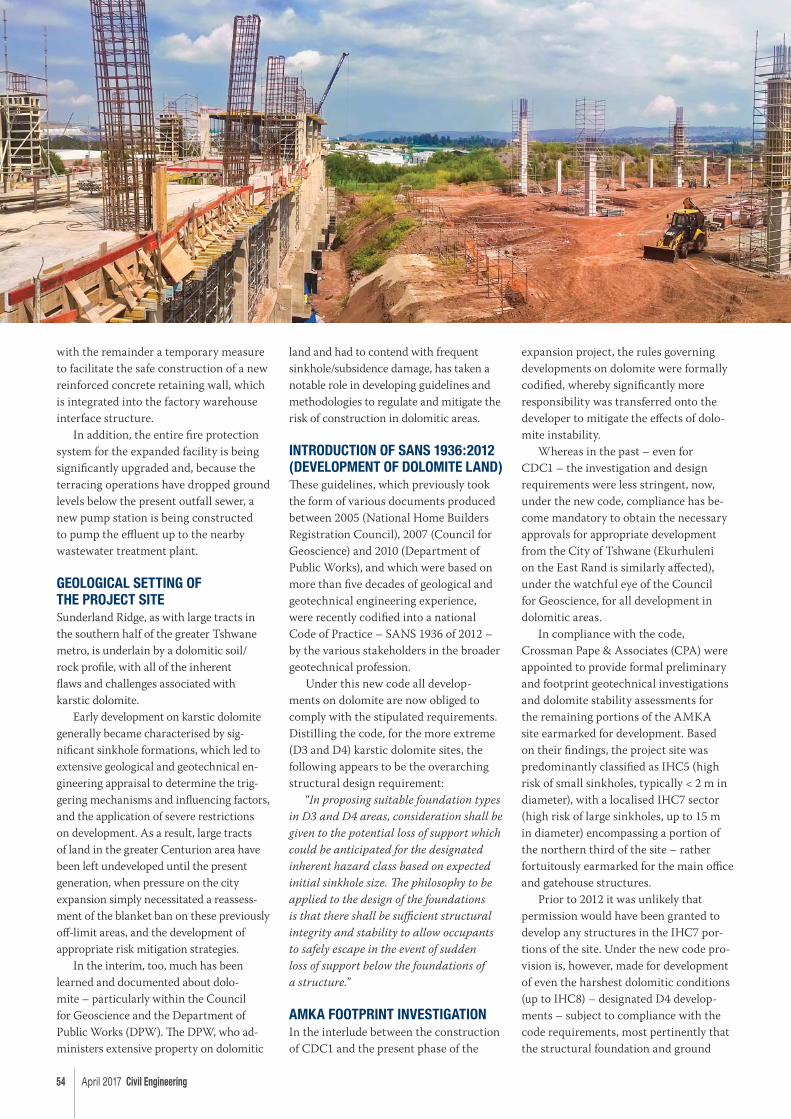
54 April 2017 Civil Engineering
with the remainder a temporary measure
to facilitate the safe construction of a new
reinforced concrete retaining wall, which
is integrated into the factory warehouse
interface structure.
In addition, the entire fi re protection
system for the expanded facility is being
signifi cantly upgraded and, because the
terracing operations have dropped ground
levels below the present outfall sewer, a
new pump station is being constructed
to pump the effl uent up to the nearby
wastewater treatment plant.
GEOLOGICAL SETTING OF THE PROJECT SITESunderland Ridge, as with large tracts in
the southern half of the greater Tshwane
metro, is underlain by a dolomitic soil/
rock profi le, with all of the inherent
fl aws and challenges associated with
karstic dolomite.
Early development on karstic dolomite
generally became characterised by sig-
nifi cant sinkhole formations, which led to
extensive geological and geotechnical en-
gineering appraisal to determine the trig-
gering mechanisms and infl uencing factors,
and the application of severe restrictions
on development. As a result, large tracts
of land in the greater Centurion area have
been left undeveloped until the present
generation, when pressure on the city
expansion simply necessitated a reassess-
ment of the blanket ban on these previously
off -limit areas, and the development of
appropriate risk mitigation strategies.
In the interim, too, much has been
learned and documented about dolo-
mite – particularly within the Council
for Geoscience and the Department of
Public Works (DPW). Th e DPW, who ad-
ministers extensive property on dolomitic
land and had to contend with frequent
sinkhole/ subsidence damage, has taken a
notable role in developing guidelines and
methodologies to regulate and mitigate the
risk of construction in dolomitic areas.
INTRODUCTION OF SANS 1936:2012 (DEVELOPMENT OF DOLOMITE LAND)Th ese guidelines, which previously took
the form of various documents produced
between 2005 (National Home Builders
Registration Council), 2007 (Council for
Geoscience) and 2010 (Department of
Public Works), and which were based on
more than fi ve decades of geological and
geotechnical engineering experience,
were recently codifi ed into a national
Code of Practice – SANS 1936 of 2012 –
by the various stakeholders in the broader
geotechnical profession.
Under this new code all develop-
ments on dolomite are now obliged to
comply with the stipulated requirements.
Distilling the code, for the more extreme
(D3 and D4) karstic dolomite sites, the
following appears to be the overarching
structural design requirement:
“In proposing suitable foundation types
in D3 and D4 areas, consideration shall be
given to the potential loss of support which
could be anticipated for the designated
inherent hazard class based on expected
initial sinkhole size. Th e philosophy to be
applied to the design of the foundations
is that there shall be suffi cient structural
integrity and stability to allow occupants
to safely escape in the event of sudden
loss of support below the foundations of
a structure.”
AMKA FOOTPRINT INVESTIGATIONIn the interlude between the construction
of CDC1 and the present phase of the
expansion project, the rules governing
developments on dolomite were formally
codifi ed, whereby signifi cantly more
responsibility was transferred onto the
developer to mitigate the eff ects of dolo-
mite instability.
Whereas in the past – even for
CDC1 – the investigation and design
requirements were less stringent, now,
under the new code, compliance has be-
come mandatory to obtain the necessary
approvals for appropriate development
from the City of Tshwane (Ekurhuleni
on the East Rand is similarly aff ected),
under the watchful eye of the Council
for Geoscience, for all development in
dolomitic areas.
In compliance with the code,
Crossman Pape & Associates (CPA) were
appointed to provide formal preliminary
and footprint geotechnical investigations
and dolomite stability assessments for
the remaining portions of the AMKA
site earmarked for development. Based
on their fi ndings, the project site was
predominantly classifi ed as IHC5 (high
risk of small sinkholes, typically < 2 m in
diameter), with a localised IHC7 sector
(high risk of large sinkholes, up to 15 m
in diameter) encompassing a portion of
the northern third of the site – rather
fortuitously earmarked for the main offi ce
and gatehouse structures.
Prior to 2012 it was unlikely that
permission would have been granted to
develop any structures in the IHC7 por-
tions of the site. Under the new code pro-
vision is, however, made for development
of even the harshest dolomitic conditions
(up to IHC8) – designated D4 develop-
ments – subject to compliance with the
code requirements, most pertinently that
the structural foundation and ground
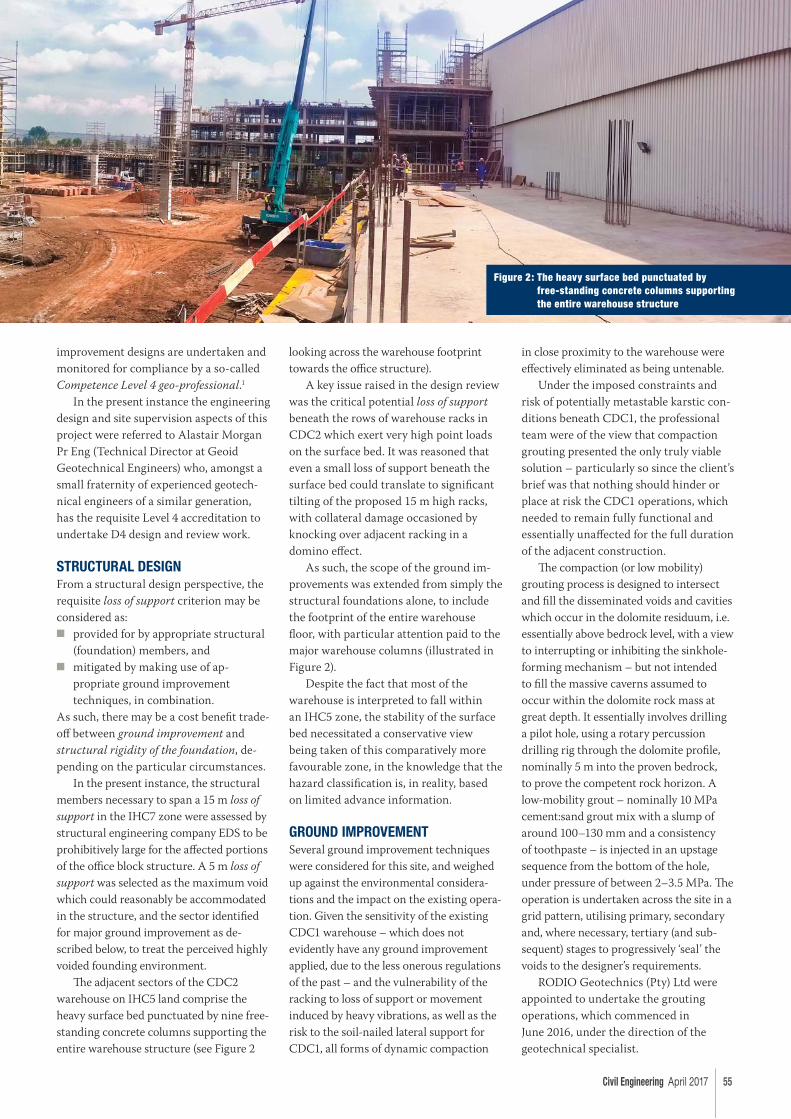
Civil Engineering April 2017 55
improvement designs are undertaken and
monitored for compliance by a so-called
Competence Level 4 geo-professional.1
In the present instance the engineering
design and site supervision aspects of this
project were referred to Alastair Morgan
Pr Eng (Technical Director at Geoid
Geotechnical Engineers) who, amongst a
small fraternity of experienced geotech-
nical engineers of a similar generation,
has the requisite Level 4 accreditation to
undertake D4 design and review work.
STRUCTURAL DESIGNFrom a structural design perspective, the
requisite loss of support criterion may be
considered as:
■ provided for by appropriate structural
(foundation) members, and
■ mitigated by making use of ap-
propriate ground improvement
techniques, in combination.
As such, there may be a cost benefi t trade-
off between ground improvement and
structural rigidity of the foundation, de-
pending on the particular circumstances.
In the present instance, the structural
members necessary to span a 15 m loss of
support in the IHC7 zone were assessed by
structural engineering company EDS to be
prohibitively large for the aff ected portions
of the offi ce block structure. A 5 m loss of
support was selected as the maximum void
which could reasonably be accommodated
in the structure, and the sector identifi ed
for major ground improvement as de-
scribed below, to treat the perceived highly
voided founding environment.
Th e adjacent sectors of the CDC2
warehouse on IHC5 land comprise the
heavy surface bed punctuated by nine free-
standing concrete columns supporting the
entire warehouse structure (see Figure 2
looking across the warehouse footprint
towards the offi ce structure).
A key issue raised in the design review
was the critical potential loss of support
beneath the rows of warehouse racks in
CDC2 which exert very high point loads
on the surface bed. It was reasoned that
even a small loss of support beneath the
surface bed could translate to signifi cant
tilting of the proposed 15 m high racks,
with collateral damage occasioned by
knocking over adjacent racking in a
domino eff ect.
As such, the scope of the ground im-
provements was extended from simply the
structural foundations alone, to include
the footprint of the entire warehouse
fl oor, with particular attention paid to the
major warehouse columns (illustrated in
Figure 2).
Despite the fact that most of the
warehouse is interpreted to fall within
an IHC5 zone, the stability of the surface
bed necessitated a conservative view
being taken of this comparatively more
favourable zone, in the knowledge that the
hazard classifi cation is, in reality, based
on limited advance information.
GROUND IMPROVEMENTSeveral ground improvement techniques
were considered for this site, and weighed
up against the environmental considera-
tions and the impact on the existing opera-
tion. Given the sensitivity of the existing
CDC1 warehouse – which does not
evidently have any ground improvement
applied, due to the less onerous regulations
of the past – and the vulnerability of the
racking to loss of support or movement
induced by heavy vibrations, as well as the
risk to the soil-nailed lateral support for
CDC1, all forms of dynamic compaction
in close proximity to the warehouse were
eff ectively eliminated as being untenable.
Under the imposed constraints and
risk of potentially metastable karstic con-
ditions beneath CDC1, the professional
team were of the view that compaction
grouting presented the only truly viable
solution – particularly so since the client’s
brief was that nothing should hinder or
place at risk the CDC1 operations, which
needed to remain fully functional and
essentially unaff ected for the full duration
of the adjacent construction.
Th e compaction (or low mobility)
grouting process is designed to intersect
and fi ll the disseminated voids and cavities
which occur in the dolomite residuum, i.e.
essentially above bedrock level, with a view
to interrupting or inhibiting the sinkhole-
forming mechanism – but not intended
to fi ll the massive caverns assumed to
occur within the dolomite rock mass at
great depth. It essentially involves drilling
a pilot hole, using a rotary percussion
drilling rig through the dolomite profi le,
nominally 5 m into the proven bedrock,
to prove the competent rock horizon. A
low-mobility grout – nominally 10 MPa
cement:sand grout mix with a slump of
around 100–130 mm and a consistency
of toothpaste – is injected in an upstage
sequence from the bottom of the hole,
under pressure of between 2–3.5 MPa. Th e
operation is undertaken across the site in a
grid pattern, utilising primary, secondary
and, where necessary, tertiary (and sub-
sequent) stages to progressively ‘seal’ the
voids to the designer’s requirements.
RODIO Geotechnics (Pty) Ltd were
appointed to undertake the grouting
operations, which commenced in
June 2016, under the direction of the
geotechnical specialist.
Figure 2: The heavy surface bed punctuated by free-standing concrete columns supporting the entire warehouse structure
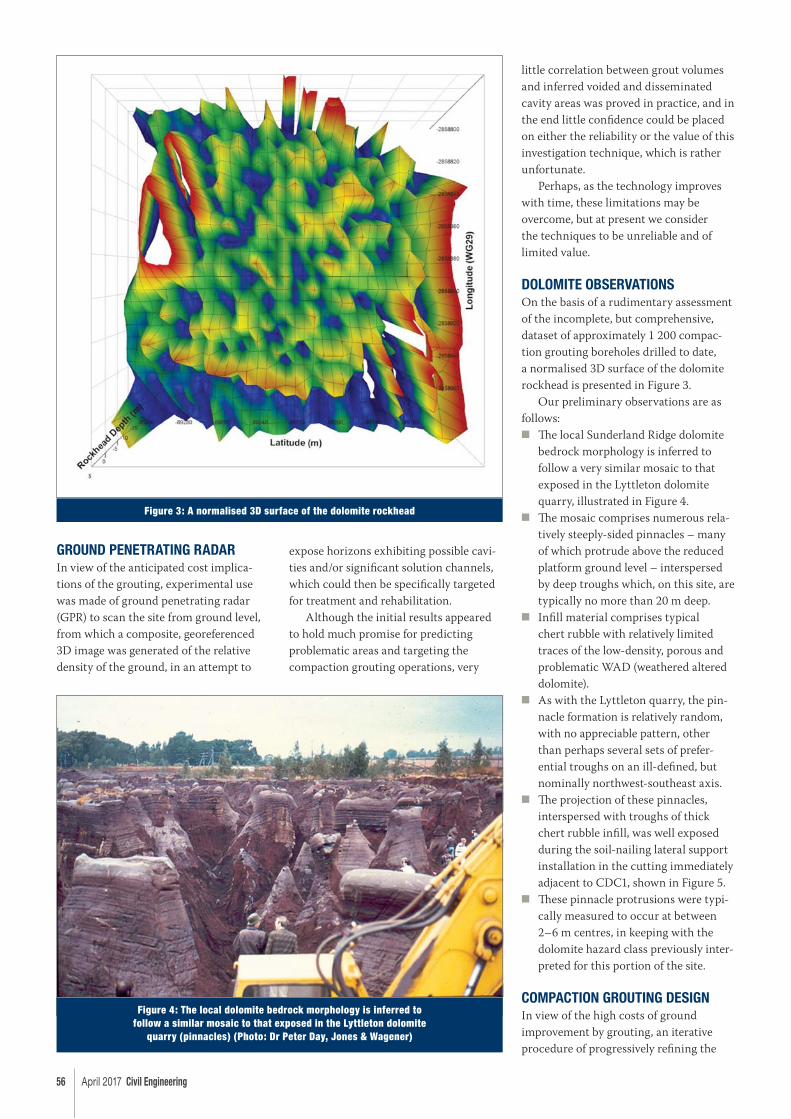
56 April 2017 Civil Engineering
GROUND PENETRATING RADARIn view of the anticipated cost implica-
tions of the grouting, experimental use
was made of ground penetrating radar
(GPR) to scan the site from ground level,
from which a composite, georeferenced
3D image was generated of the relative
density of the ground, in an attempt to
expose horizons exhibiting possible cavi-
ties and/or signifi cant solution channels,
which could then be specifi cally targeted
for treatment and rehabilitation.
Although the initial results appeared
to hold much promise for predicting
problematic areas and targeting the
compaction grouting operations, very
little correlation between grout volumes
and inferred voided and disseminated
cavity areas was proved in practice, and in
the end little confi dence could be placed
on either the reliability or the value of this
investigation technique, which is rather
unfortunate.
Perhaps, as the technology improves
with time, these limitations may be
overcome, but at present we consider
the techniques to be unreliable and of
limited value.
DOLOMITE OBSERVATIONSOn the basis of a rudimentary assessment
of the incomplete, but comprehensive,
dataset of approximately 1 200 compac-
tion grouting boreholes drilled to date,
a normalised 3D surface of the dolomite
rockhead is presented in Figure 3.
Our preliminary observations are as
follows:
■ Th e local Sunderland Ridge dolomite
bedrock morphology is inferred to
follow a very similar mosaic to that
exposed in the Lyttleton dolomite
quarry, illustrated in Figure 4.
■ Th e mosaic comprises numerous rela-
tively steeply-sided pinnacles – many
of which protrude above the reduced
platform ground level – interspersed
by deep troughs which, on this site, are
typically no more than 20 m deep.
■ Infi ll material comprises typical
chert rubble with relatively limited
traces of the low-density, porous and
problematic WAD (weathered altered
dolomite).
■ As with the Lyttleton quarry, the pin-
nacle formation is relatively random,
with no appreciable pattern, other
than perhaps several sets of prefer-
ential troughs on an ill-defi ned, but
nominally northwest-southeast axis.
■ Th e projection of these pinnacles,
interspersed with troughs of thick
chert rubble infi ll, was well exposed
during the soil-nailing lateral support
installation in the cutting immediately
adjacent to CDC1, shown in Figure 5.
■ Th ese pinnacle protrusions were typi-
cally measured to occur at between
2–6 m centres, in keeping with the
dolomite hazard class previously inter-
preted for this portion of the site.
COMPACTION GROUTING DESIGNIn view of the high costs of ground
improvement by grouting, an iterative
procedure of progressively refi ning the
Figure 3: A normalised 3D surface of the dolomite rockhead
Figure 4: The local dolomite bedrock morphology is inferred to follow a similar mosaic to that exposed in the Lyttleton dolomite
quarry (pinnacles) (Photo: Dr Peter Day, Jones & Wagener)
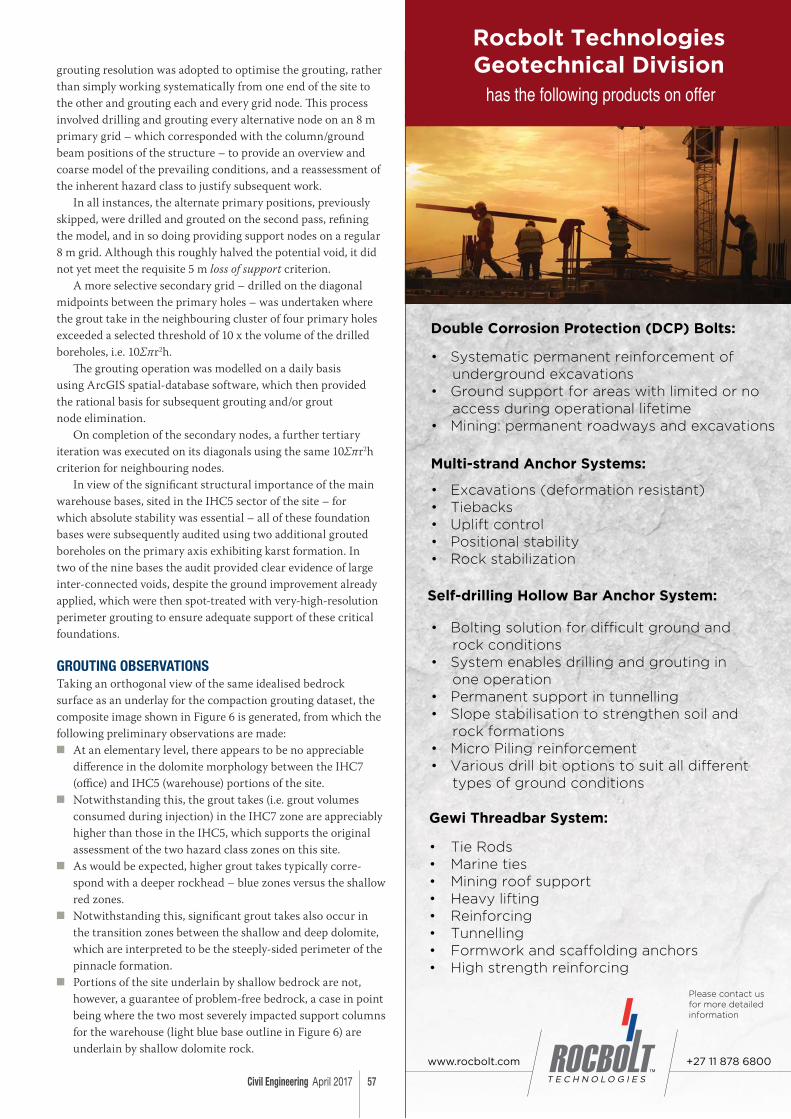
Civil Engineering April 2017 57
ww
grouting resolution was adopted to optimise the grouting, rather
than simply working systematically from one end of the site to
the other and grouting each and every grid node. Th is process
involved drilling and grouting every alternative node on an 8 m
primary grid – which corresponded with the column/ground
beam positions of the structure – to provide an overview and
coarse model of the prevailing conditions, and a reassessment of
the inherent hazard class to justify subsequent work.
In all instances, the alternate primary positions, previously
skipped, were drilled and grouted on the second pass, refi ning
the model, and in so doing providing support nodes on a regular
8 m grid. Although this roughly halved the potential void, it did
not yet meet the requisite 5 m loss of support criterion.
A more selective secondary grid – drilled on the diagonal
midpoints between the primary holes – was undertaken where
the grout take in the neighbouring cluster of four primary holes
exceeded a selected threshold of 10 x the volume of the drilled
boreholes, i.e. 10Σπr2h.
Th e grouting operation was modelled on a daily basis
using ArcGIS spatial-database software, which then provided
the rational basis for subsequent grouting and/or grout
node elimination.
On completion of the secondary nodes, a further tertiary
iteration was executed on its diagonals using the same 10Σπr2h
criterion for neighbouring nodes.
In view of the signifi cant structural importance of the main
warehouse bases, sited in the IHC5 sector of the site – for
which absolute stability was essential – all of these foundation
bases were subsequently audited using two additional grouted
boreholes on the primary axis exhibiting karst formation. In
two of the nine bases the audit provided clear evidence of large
inter-connected voids, despite the ground improvement already
applied, which were then spot-treated with very-high-resolution
perimeter grouting to ensure adequate support of these critical
foundations.
GROUTING OBSERVATIONSTaking an orthogonal view of the same idealised bedrock
surface as an underlay for the compaction grouting dataset, the
composite image shown in Figure 6 is generated, from which the
following preliminary observations are made:
■ At an elementary level, there appears to be no appreciable
diff erence in the dolomite morphology between the IHC7
(offi ce) and IHC5 (warehouse) portions of the site.
■ Notwithstanding this, the grout takes (i.e. grout volumes
consumed during injection) in the IHC7 zone are appreciably
higher than those in the IHC5, which supports the original
assessment of the two hazard class zones on this site.
■ As would be expected, higher grout takes typically corre-
spond with a deeper rockhead – blue zones versus the shallow
red zones.
■ Notwithstanding this, signifi cant grout takes also occur in
the transition zones between the shallow and deep dolomite,
which are interpreted to be the steeply-sided perimeter of the
pinnacle formation.
■ Portions of the site underlain by shallow bedrock are not,
however, a guarantee of problem-free bedrock, a case in point
being where the two most severely impacted support columns
for the warehouse (light blue base outline in Figure 6) are
underlain by shallow dolomite rock.
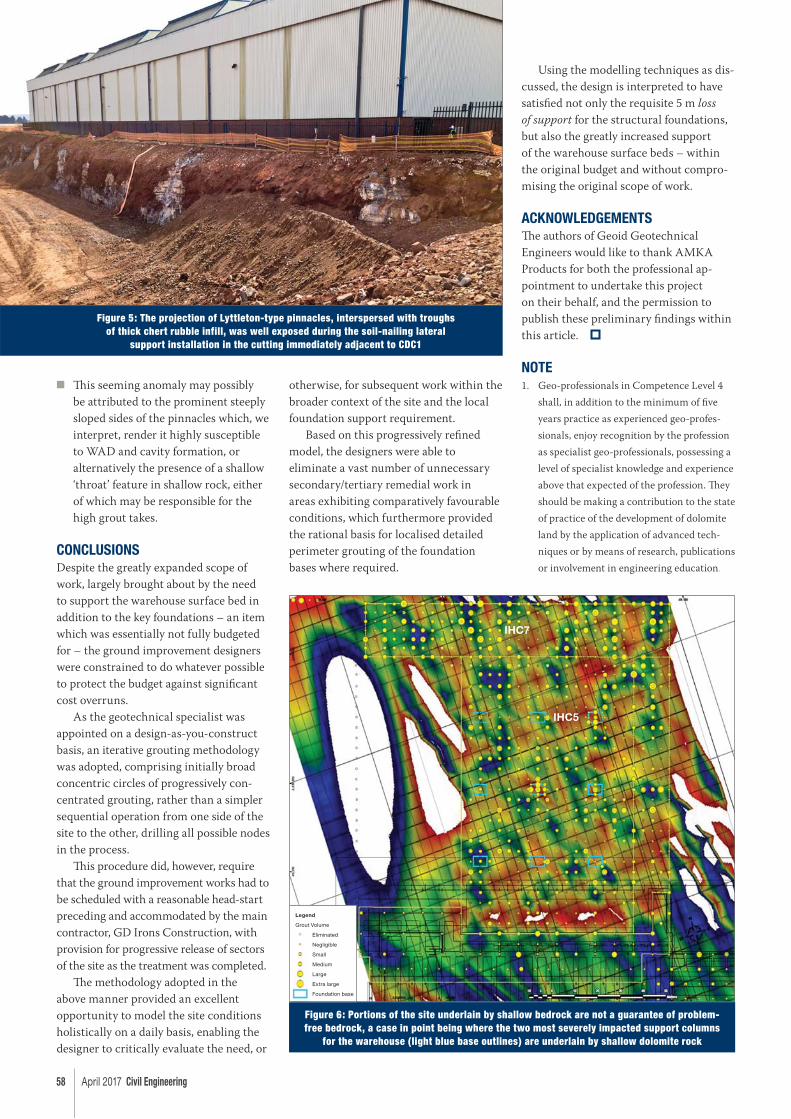
58 April 2017 Civil Engineering
■ Th is seeming anomaly may possibly
be attributed to the prominent steeply
sloped sides of the pinnacles which, we
interpret, render it highly susceptible
to WAD and cavity formation, or
alternatively the presence of a shallow
‘throat’ feature in shallow rock, either
of which may be responsible for the
high grout takes.
CONCLUSIONSDespite the greatly expanded scope of
work, largely brought about by the need
to support the warehouse surface bed in
addition to the key foundations – an item
which was essentially not fully budgeted
for – the ground improvement designers
were constrained to do whatever possible
to protect the budget against signifi cant
cost overruns.
As the geotechnical specialist was
appointed on a design-as-you-construct
basis, an iterative grouting methodology
was adopted, comprising initially broad
concentric circles of progressively con-
centrated grouting, rather than a simpler
sequential operation from one side of the
site to the other, drilling all possible nodes
in the process.
Th is procedure did, however, require
that the ground improvement works had to
be scheduled with a reasonable head-start
preceding and accommodated by the main
contractor, GD Irons Construction, with
provision for progressive release of sectors
of the site as the treatment was completed.
Th e methodology adopted in the
above manner provided an excellent
opportunity to model the site conditions
holistically on a daily basis, enabling the
designer to critically evaluate the need, or
otherwise, for subsequent work within the
broader context of the site and the local
foundation support requirement.
Based on this progressively refi ned
model, the designers were able to
eliminate a vast number of unnecessary
secondary/tertiary remedial work in
areas exhibiting comparatively favourable
conditions, which furthermore provided
the rational basis for localised detailed
perimeter grouting of the foundation
bases where required.
Using the modelling techniques as dis-
cussed, the design is interpreted to have
satisfi ed not only the requisite 5 m loss
of support for the structural foundations,
but also the greatly increased support
of the warehouse surface beds – within
the original budget and without compro-
mising the original scope of work.
ACKNOWLEDGEMENTSTh e authors of Geoid Geotechnical
Engineers would like to thank AMKA
Products for both the professional ap-
pointment to undertake this project
on their behalf, and the permission to
publish these preliminary fi ndings within
this article.
NOTE1. Geo-professionals in Competence Level 4
shall, in addition to the minimum of fi ve
years practice as experienced geo-profes-
sionals, enjoy recognition by the profession
as specialist geo-professionals, possessing a
level of specialist knowledge and experience
above that expected of the profession. Th ey
should be making a contribution to the state
of practice of the development of dolomite
land by the application of advanced tech-
niques or by means of research, publications
or involvement in engineering education.
Figure 5: The projection of Lyttleton-type pinnacles, interspersed with troughs of thick chert rubble infill, was well exposed during the soil-nailing lateral
support installation in the cutting immediately adjacent to CDC1
Figure 6: Portions of the site underlain by shallow bedrock are not a guarantee of problem-free bedrock, a case in point being where the two most severely impacted support columns
for the warehouse (light blue base outlines) are underlain by shallow dolomite rock
IHC7
IHC5
Legend
Grout Volume
Eliminated
Negligible
Small
Medium
Large
Extra large
Foundation base
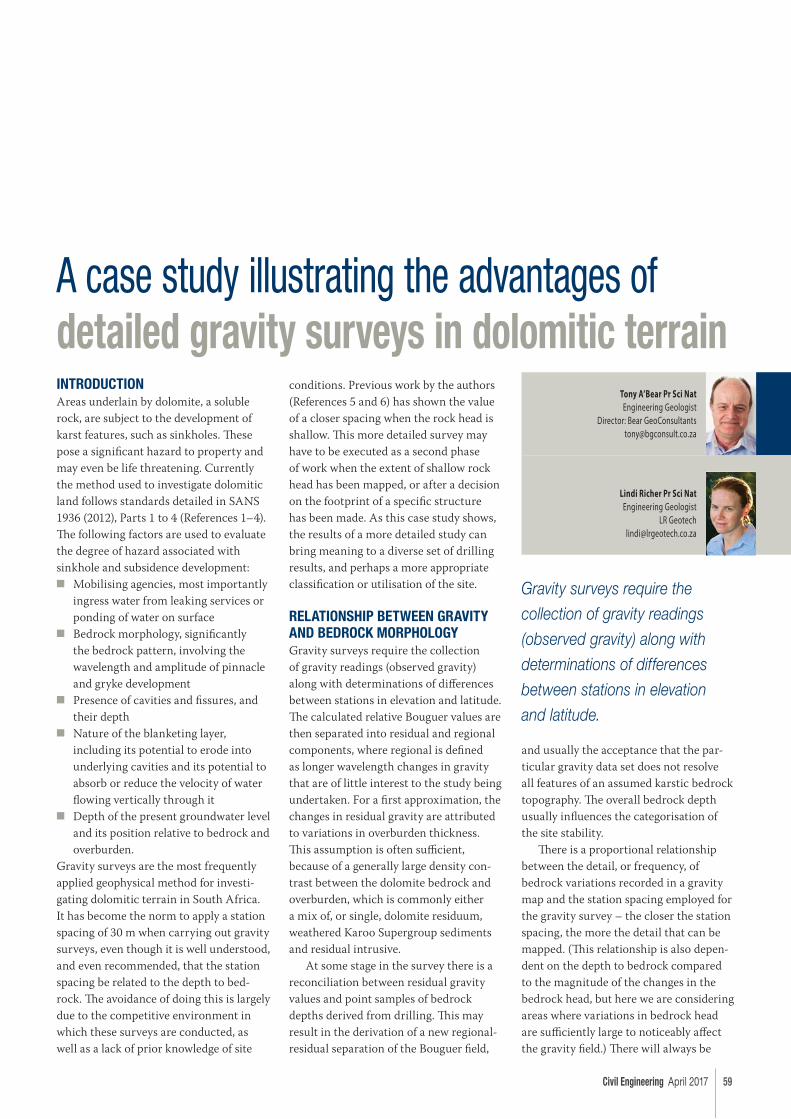
Civil Engineering April 2017 59
INTRODUCTIONAreas underlain by dolomite, a soluble
rock, are subject to the development of
karst features, such as sinkholes. Th ese
pose a signifi cant hazard to property and
may even be life threatening. Currently
the method used to investigate dolomitic
land follows standards detailed in SANS
1936 (2012), Parts 1 to 4 (References 1–4).
Th e following factors are used to evaluate
the degree of hazard associated with
sinkhole and subsidence development:
■ Mobilising agencies, most importantly
ingress water from leaking services or
ponding of water on surface
■ Bedrock morphology, signifi cantly
the bedrock pattern, involving the
wavelength and amplitude of pinnacle
and gryke development
■ Presence of cavities and fi ssures, and
their depth
■ Nature of the blanketing layer,
including its potential to erode into
underlying cavities and its potential to
absorb or reduce the velocity of water
fl owing vertically through it
■ Depth of the present groundwater level
and its position relative to bedrock and
overburden.
Gravity surveys are the most frequently
applied geophysical method for investi-
gating dolomitic terrain in South Africa.
It has become the norm to apply a station
spacing of 30 m when carrying out gravity
surveys, even though it is well understood,
and even recommended, that the station
spacing be related to the depth to bed-
rock. Th e avoidance of doing this is largely
due to the competitive environment in
which these surveys are conducted, as
well as a lack of prior knowledge of site
conditions. Previous work by the authors
(References 5 and 6) has shown the value
of a closer spacing when the rock head is
shallow. Th is more detailed survey may
have to be executed as a second phase
of work when the extent of shallow rock
head has been mapped, or after a decision
on the footprint of a specifi c structure
has been made. As this case study shows,
the results of a more detailed study can
bring meaning to a diverse set of drilling
results, and perhaps a more appropriate
classifi cation or utilisation of the site.
RELATIONSHIP BETWEEN GRAVITY AND BEDROCK MORPHOLOGYGravity surveys require the collection
of gravity readings (observed gravity)
along with determinations of diff erences
between stations in elevation and latitude.
Th e calculated relative Bouguer values are
then separated into residual and regional
components, where regional is defi ned
as longer wavelength changes in gravity
that are of little interest to the study being
undertaken. For a fi rst approximation, the
changes in residual gravity are attributed
to variations in overburden thickness.
Th is assumption is often suffi cient,
because of a generally large density con-
trast between the dolomite bedrock and
overburden, which is commonly either
a mix of, or single, dolomite residuum,
weathered Karoo Supergroup sediments
and residual intrusive.
At some stage in the survey there is a
reconciliation between residual gravity
values and point samples of bedrock
depths derived from drilling. Th is may
result in the derivation of a new regional-
residual separation of the Bouguer fi eld,
and usually the acceptance that the par-
ticular gravity data set does not resolve
all features of an assumed karstic bedrock
topography. Th e overall bedrock depth
usually infl uences the categorisation of
the site stability.
Th ere is a proportional relationship
between the detail, or frequency, of
bedrock variations recorded in a gravity
map and the station spacing employed for
the gravity survey – the closer the station
spacing, the more the detail that can be
mapped. (Th is relationship is also depen-
dent on the depth to bedrock compared
to the magnitude of the changes in the
bedrock head, but here we are considering
areas where variations in bedrock head
are suffi ciently large to noticeably aff ect
the gravity fi eld.) Th ere will always be
Tony A’Bear Pr Sci Nat
Engineering GeologistDirector: Bear GeoConsultants
Lindi Richer Pr Sci Nat
Engineering GeologistLR Geotech
A case study illustrating the advantages of detailed gravity surveys in dolomitic terrain
Gravity surveys require the
collection of gravity readings
(observed gravity) along with
determinations of differences
between stations in elevation
and latitude.

60 April 2017 Civil Engineering
some practical limit to the amount of
detail that can be picked up in a gravity
survey, and thus isolated pinnacles and
very narrow or shallow solution features
may not be detected. Drilling in dolomitic
terrain is therefore always likely to fi nd
anomalous bedrock depths within what
appears to be a uniform gravity feature.
THE CASE STUDYA large area has been investigated for
township development purposes in the
eastern part of Centurion, Pretoria. Th e
site is underlain by dolomite and chert of
the Monte Christo Formation, Malmani
Group, Transvaal Supergroup. An envi-
ronmentally sensitive area was identifi ed
roughly in the centre of the site and this
was excluded from the investigation.
Sinkholes are known to have developed in
the area and fi ve small, old sinkholes were
mapped within the bounds of the site.
Initially a 30 m gravity grid was used
to cover the area, followed by percussion
borehole drilling as is the norm. Th e
initial results were not satisfactory and
it was not possible to clearly demarcate
areas with uniform hazard. Subsequent
investigations resulted in a total of 118
boreholes being drilled under the guid-
ance of three diff erent consultants in
an attempt to refi ne the hazard zones
to a satisfactory level. Typical of many
such investigations, the fi rst attempt
made use of the gravity survey and
borehole results to produce a hazard
zone map. Th e resulting plan contained
large areas of shallow dolomite within
which an unacceptably large number of
boreholes indicated deeper bedrock. Th e
subsequent investigations, involving only
drilling, abandoned the gravity survey as
a guideline, and attempts were made to
create hazard zones by ‘joining the dots’,
creating areas within which boreholes in-
dicating deeper bedrock, with associated
larger sinkhole predictions, seemed to be
common. Zones such as these cut across
the areas in which the gravity survey
was predicting shallow bedrock. Th e end
product (see Figure 1) ultimately made
less sense than the fi rst survey, and the
regulatory authorities were not convinced
that there was suffi cient confi dence in the
results to allow development to proceed.
In an attempt to better understand the
ground conditions and map a way for-
ward, it was decided that detailed gravity
surveys should be carried out across
selected portions of the site. A 10 m grid
Figure 1: Hazard zone plan with borehole and sinkhole positions included
Cadastral boundaries
Inherent hazard zones
Legend
Zone AZone BZone C
Eskom servitudeEnvironmentally sensitive areasSinkholes
Figure 2: The 30 m gravity grid
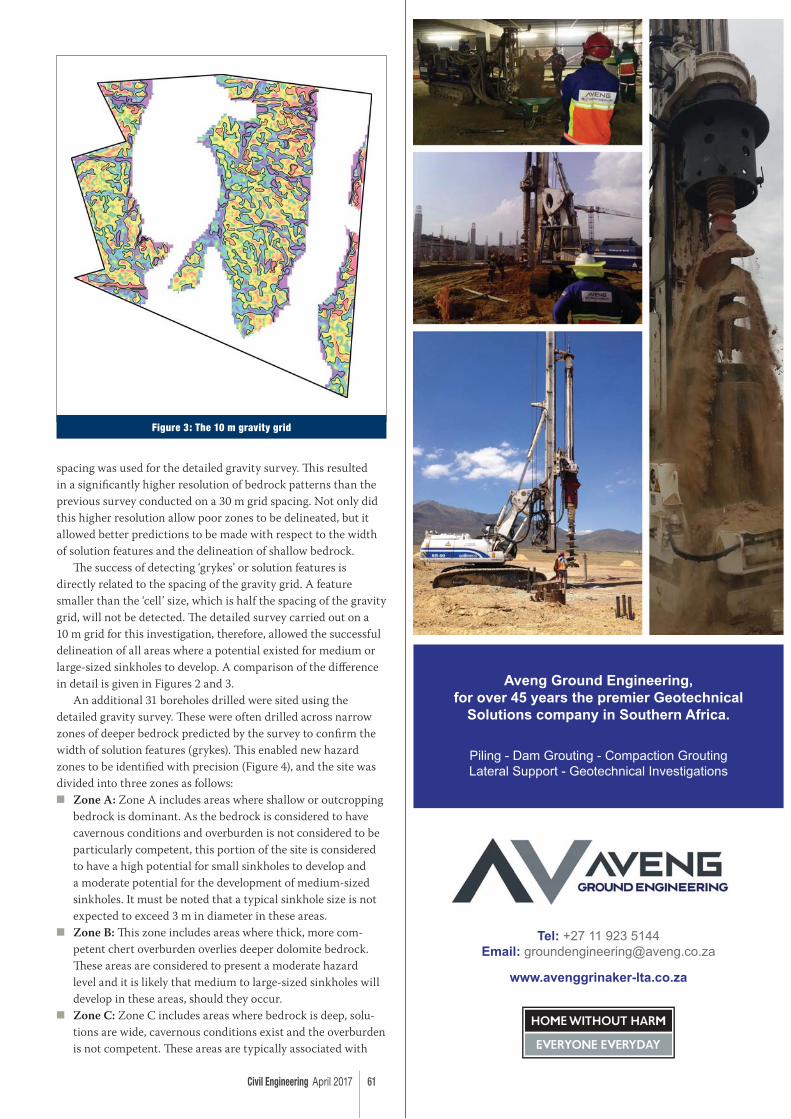
Civil Engineering April 2017 61
spacing was used for the detailed gravity survey. Th is resulted
in a signifi cantly higher resolution of bedrock patterns than the
previous survey conducted on a 30 m grid spacing. Not only did
this higher resolution allow poor zones to be delineated, but it
allowed better predictions to be made with respect to the width
of solution features and the delineation of shallow bedrock.
Th e success of detecting ‘grykes’ or solution features is
directly related to the spacing of the gravity grid. A feature
smaller than the ‘cell’ size, which is half the spacing of the gravity
grid, will not be detected. Th e detailed survey carried out on a
10 m grid for this investigation, therefore, allowed the successful
delineation of all areas where a potential existed for medium or
large-sized sinkholes to develop. A comparison of the diff erence
in detail is given in Figures 2 and 3.
An additional 31 boreholes drilled were sited using the
detailed gravity survey. Th ese were often drilled across narrow
zones of deeper bedrock predicted by the survey to confi rm the
width of solution features (grykes). Th is enabled new hazard
zones to be identifi ed with precision (Figure 4), and the site was
divided into three zones as follows:
■ Zone A: Zone A includes areas where shallow or outcropping
bedrock is dominant. As the bedrock is considered to have
cavernous conditions and overburden is not considered to be
particularly competent, this portion of the site is considered
to have a high potential for small sinkholes to develop and
a moderate potential for the development of medium-sized
sinkholes. It must be noted that a typical sinkhole size is not
expected to exceed 3 m in diameter in these areas.
■ Zone B: Th is zone includes areas where thick, more com-
petent chert overburden overlies deeper dolomite bedrock.
Th ese areas are considered to present a moderate hazard
level and it is likely that medium to large-sized sinkholes will
develop in these areas, should they occur.
■ Zone C: Zone C includes areas where bedrock is deep, solu-
tions are wide, cavernous conditions exist and the overburden
is not competent. Th ese areas are typically associated with
Figure 3: The 10 m gravity grid

62 April 2017 Civil Engineering
large gravity-low anomalies, and are considered to have a
high potential for medium to large-sized sinkholes to develop.
Isolated areas of shallow bedrock are present in Zone C, but
these are considered to be too small to be of signifi cance.
CONCLUSIONTh is case study demonstrates that far better resolution of
bedrock topography is possible using a smaller gravity survey
grid spacing. Appropriately spaced gravity grids allow for better
zonation of sites, as well as better identifi cation and prediction of
the width of solution features within generally shallow bedrock
areas. Th e additional cost of the gravity survey will be off set by
reduced drilling requirements, and the production of a more
confi dent zonation and development plan. In this specifi c case
more land was deemed usable than the original investigations
had indicated.
ACKNOWLEDGEMENTTh e authors wish to gratefully acknowledge the interactions with
and the contributions from Richard Day, geophysicist.
REFERENCES1. SANS 1936: 2012. Development on dolomite land, Part 1, SABS.
2. SANS 1936: 2012. Development on dolomite land, Part 2, SABS.
3. SANS 1936: 2012. Development on dolomite land, Part 3, SABS.
4. SANS 1936: 2012. Development on dolomite land, Part 4, SABS.
5. A’Bear, A G & Richer, L R 2011. Proceedings, 15th African Regional
Conference on Soil Mechanics and Geotechnical Engineering,
626–631.
6. A’Bear, A G, Day, R W & Richer, L R 2015. Proceedings, First Southern
African Geotechnical Conference, 201–204.
Cadastral boundaries
Inherent hazard zones
Legend
Zone AZone BZone C
Eskom servitudeEnvironmentally sensitive areasSinkholes
New boreholesPrevious boreholes
Figure 4: New hazard zoning
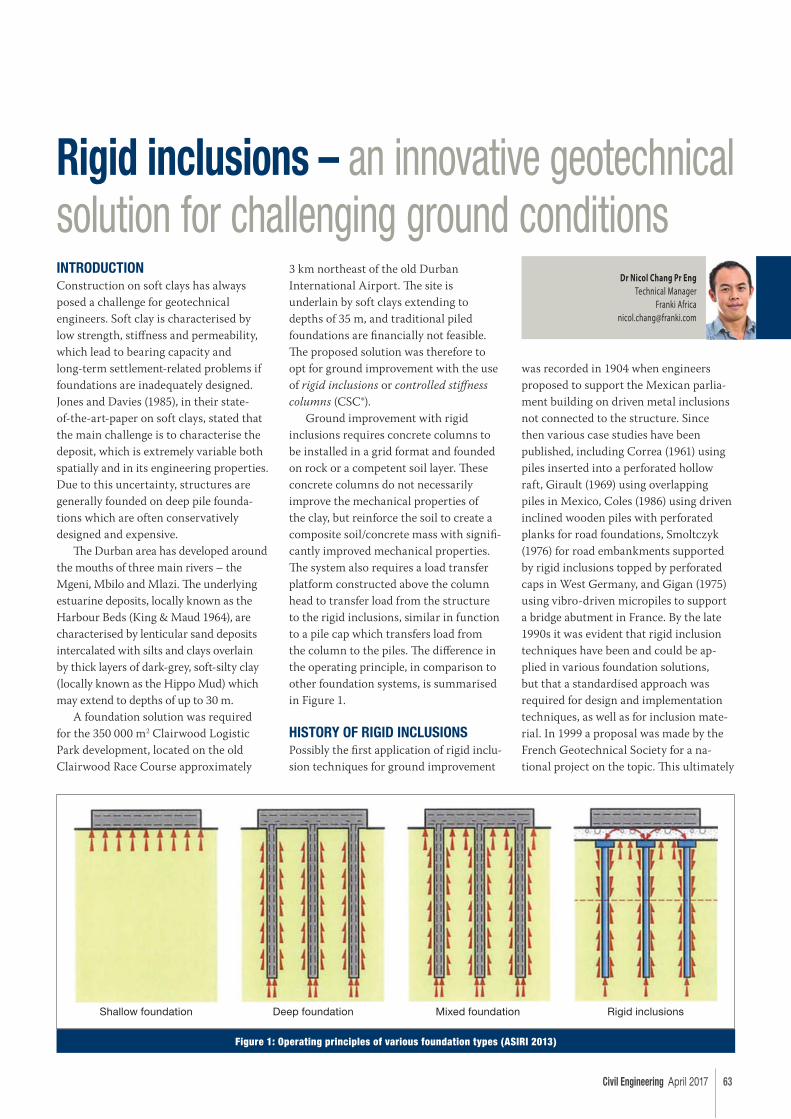
Civil Engineering April 2017 63
INTRODUCTIONConstruction on soft clays has always
posed a challenge for geotechnical
engineers. Soft clay is characterised by
low strength, stiff ness and permeability,
which lead to bearing capacity and
long-term settlement-related problems if
foundations are inadequately designed.
Jones and Davies (1985), in their state-
of-the-art-paper on soft clays, stated that
the main challenge is to characterise the
deposit, which is extremely variable both
spatially and in its engineering properties.
Due to this uncertainty, structures are
generally founded on deep pile founda-
tions which are often conservatively
designed and expensive.
Th e Durban area has developed around
the mouths of three main rivers – the
Mgeni, Mbilo and Mlazi. Th e underlying
estuarine deposits, locally known as the
Harbour Beds (King & Maud 1964), are
characterised by lenticular sand deposits
intercalated with silts and clays overlain
by thick layers of dark-grey, soft-silty clay
(locally known as the Hippo Mud) which
may extend to depths of up to 30 m.
A foundation solution was required
for the 350 000 m2 Clairwood Logistic
Park development, located on the old
Clairwood Race Course approximately
3 km northeast of the old Durban
International Airport. Th e site is
underlain by soft clays extending to
depths of 35 m, and traditional piled
foundations are fi nancially not feasible.
Th e proposed solution was therefore to
opt for ground improvement with the use
of rigid inclusions or controlled stiff ness
columns (CSC®).
Ground improvement with rigid
inclusions requires concrete columns to
be installed in a grid format and founded
on rock or a competent soil layer. Th ese
concrete columns do not necessarily
improve the mechanical properties of
the clay, but reinforce the soil to create a
composite soil/concrete mass with signifi -
cantly improved mechanical properties.
Th e system also requires a load transfer
platform constructed above the column
head to transfer load from the structure
to the rigid inclusions, similar in function
to a pile cap which transfers load from
the column to the piles. Th e diff erence in
the operating principle, in comparison to
other foundation systems, is summarised
in Figure 1.
HISTORY OF RIGID INCLUSIONSPossibly the fi rst application of rigid inclu-
sion techniques for ground improvement
was recorded in 1904 when engineers
proposed to support the Mexican parlia-
ment building on driven metal inclusions
not connected to the structure. Since
then various case studies have been
published, including Correa (1961) using
piles inserted into a perforated hollow
raft, Girault (1969) using overlapping
piles in Mexico, Coles (1986) using driven
inclined wooden piles with perforated
planks for road foundations, Smoltczyk
(1976) for road embankments supported
by rigid inclusions topped by perforated
caps in West Germany, and Gigan (1975)
using vibro-driven micropiles to support
a bridge abutment in France. By the late
1990s it was evident that rigid inclusion
techniques have been and could be ap-
plied in various foundation solutions,
but that a standardised approach was
required for design and implementation
techniques, as well as for inclusion mate-
rial. In 1999 a proposal was made by the
French Geotechnical Society for a na-
tional project on the topic. Th is ultimately
Dr Nicol Chang Pr Eng
Technical ManagerFranki Africa
Rigid inclusions – an innovative geotechnical solution for challenging ground conditions
Figure 1: Operating principles of various foundation types (ASIRI 2013)
Shallow foundation Deep foundation Mixed foundation Rigid inclusions
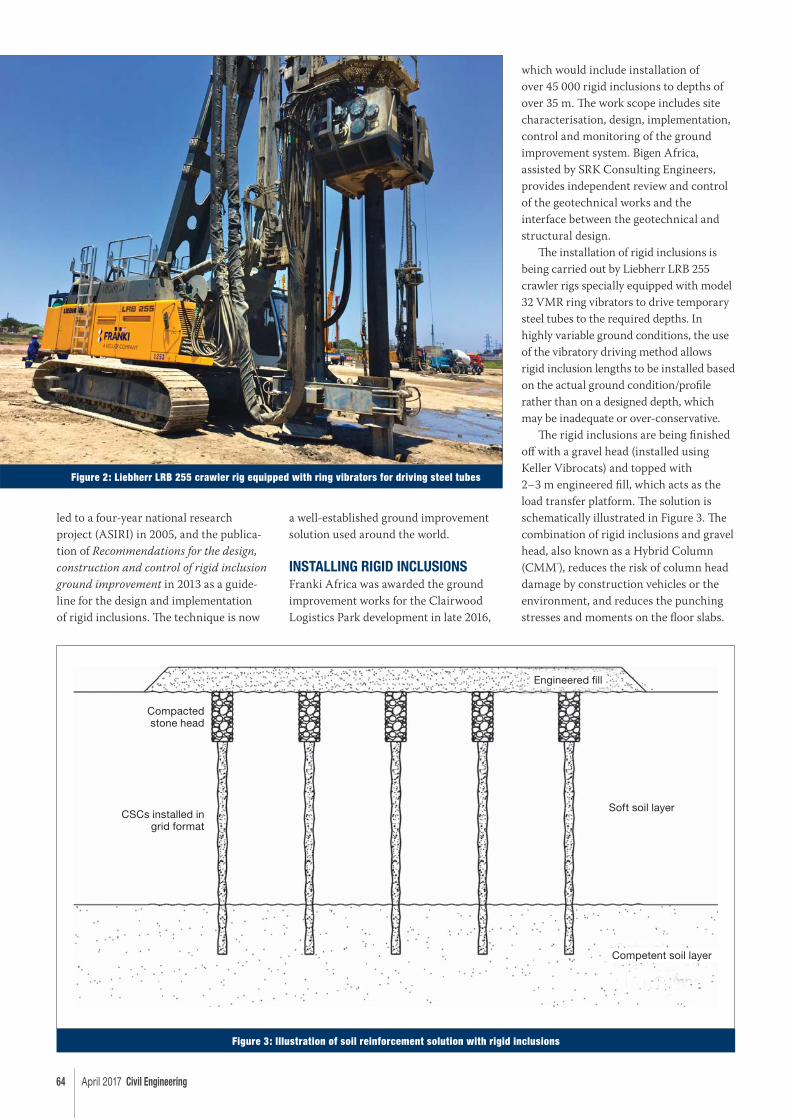
64 April 2017 Civil Engineering
led to a four-year national research
project (ASIRI) in 2005, and the publica-
tion of Recommendations for the design,
construction and control of rigid inclusion
ground improvement in 2013 as a guide-
line for the design and implementation
of rigid inclusions. Th e technique is now
a well-established ground improvement
solution used around the world.
INSTALLING RIGID INCLUSIONSFranki Africa was awarded the ground
improvement works for the Clairwood
Logistics Park development in late 2016,
which would include installation of
over 45 000 rigid inclusions to depths of
over 35 m. Th e work scope includes site
characterisation, design, implementation,
control and monitoring of the ground
improvement system. Bigen Africa,
assisted by SRK Consulting Engineers,
provides independent review and control
of the geotechnical works and the
interface between the geotechnical and
structural design.
Th e installation of rigid inclusions is
being carried out by Liebherr LRB 255
crawler rigs specially equipped with model
32 VMR ring vibrators to drive temporary
steel tubes to the required depths. In
highly variable ground conditions, the use
of the vibratory driving method allows
rigid inclusion lengths to be installed based
on the actual ground condition/profi le
rather than on a designed depth, which
may be inadequate or over-conservative.
Th e rigid inclusions are being fi nished
off with a gravel head (installed using
Keller Vibrocats) and topped with
2–3 m engineered fi ll, which acts as the
load transfer platform. Th e solution is
schematically illustrated in Figure 3. Th e
combination of rigid inclusions and gravel
head, also known as a Hybrid Column
(CMM®), reduces the risk of column head
damage by construction vehicles or the
environment, and reduces the punching
stresses and moments on the fl oor slabs.
Figure 2: Liebherr LRB 255 crawler rig equipped with ring vibrators for driving steel tubes
Figure 3: Illustration of soil reinforcement solution with rigid inclusions
Engineered fi ll
Soft soil layer
Competent soil layer
Compacted stone head
CSCs installed in grid format
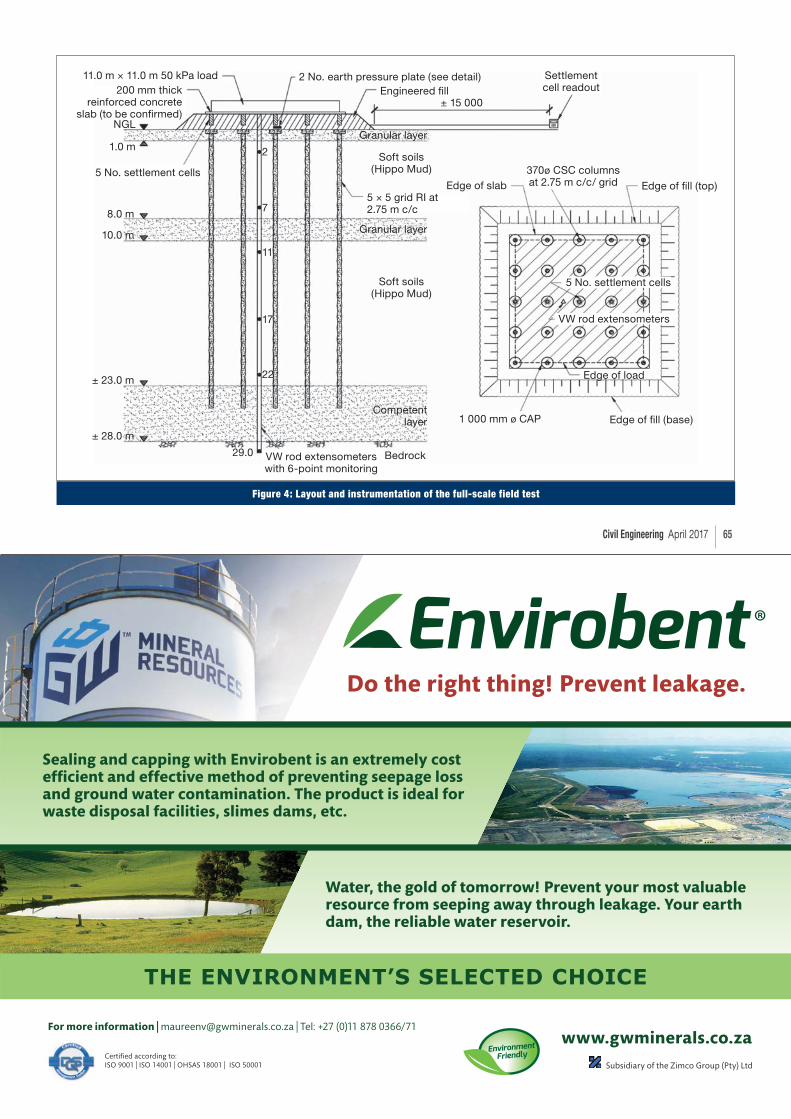
Civil Engineering April 2017 65
Figure 4: Layout and instrumentation of the full-scale field test
11.0 m × 11.0 m 50 kPa load200 mm thick
reinforced concrete slab (to be confi rmed)
NGL
1.0 m
5 No. settlement cells
8.0 m
10.0 m
± 23.0 m
± 28.0 m
2 No. earth pressure plate (see detail)Engineered fi ll
Settlement cell readout
± 15 000
Granular layer
Granular layer
Soft soils (Hippo Mud)
Soft soils (Hippo Mud)
Competent layer
5 × 5 grid RI at 2.75 m c/c
BedrockVW rod extensometers with 6-point monitoring
1 000 mm ø CAP Edge of fi ll (base)
Edge of load
VW rod extensometers
5 No. settlement cells
Edge of slab Edge of fi ll (top)
370ø CSC columns at 2.75 m c/c/ grid
2
7
11
17
22
29.0
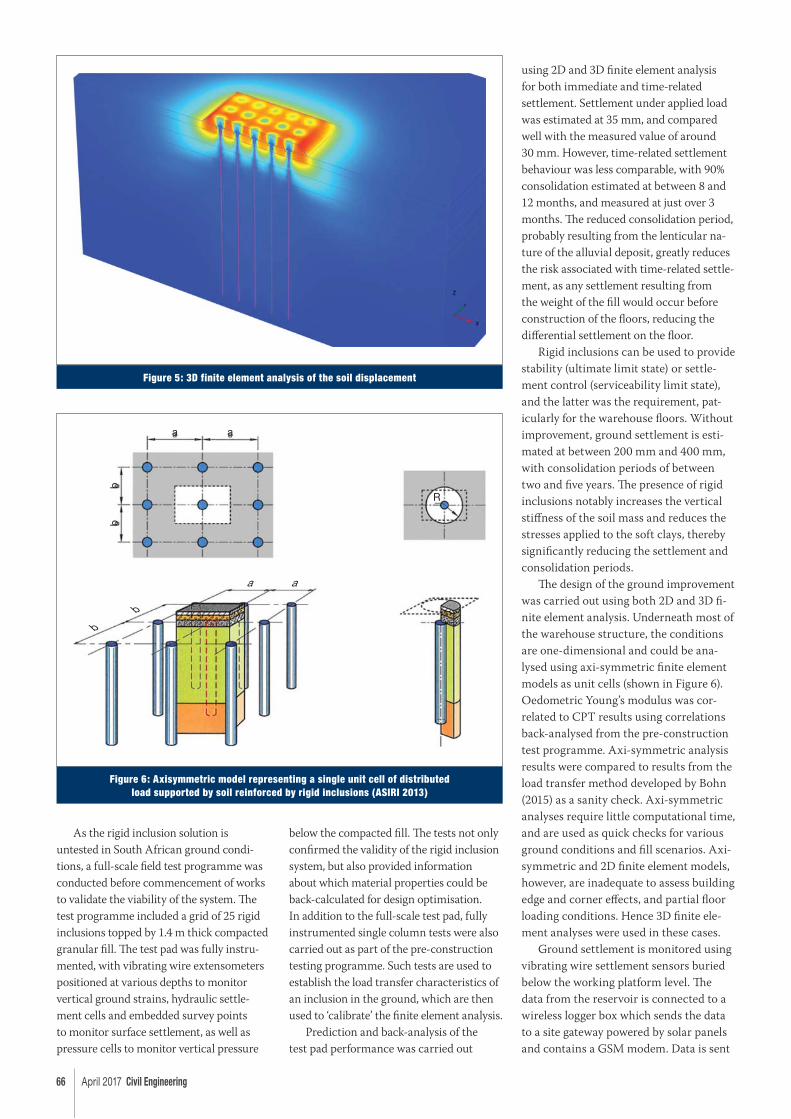
66 April 2017 Civil Engineering
As the rigid inclusion solution is
untested in South African ground condi-
tions, a full-scale fi eld test programme was
conducted before commencement of works
to validate the viability of the system. Th e
test programme included a grid of 25 rigid
inclusions topped by 1.4 m thick compacted
granular fi ll. Th e test pad was fully instru-
mented, with vibrating wire extensometers
positioned at various depths to monitor
vertical ground strains, hydraulic settle-
ment cells and embedded survey points
to monitor surface settlement, as well as
pressure cells to monitor vertical pressure
below the compacted fi ll. Th e tests not only
confi rmed the validity of the rigid inclusion
system, but also provided information
about which material properties could be
back-calculated for design optimisation.
In addition to the full-scale test pad, fully
instrumented single column tests were also
carried out as part of the pre-construction
testing programme. Such tests are used to
establish the load transfer characteristics of
an inclusion in the ground, which are then
used to ‘calibrate’ the fi nite element analysis.
Prediction and back-analysis of the
test pad performance was carried out
using 2D and 3D fi nite element analysis
for both immediate and time-related
settlement. Settlement under applied load
was estimated at 35 mm, and compared
well with the measured value of around
30 mm. However, time-related settlement
behaviour was less comparable, with 90%
consolidation estimated at between 8 and
12 months, and measured at just over 3
months. Th e reduced consolidation period,
probably resulting from the lenticular na-
ture of the alluvial deposit, greatly reduces
the risk associated with time-related settle-
ment, as any settlement resulting from
the weight of the fi ll would occur before
construction of the fl oors, reducing the
diff erential settlement on the fl oor.
Rigid inclusions can be used to provide
stability (ultimate limit state) or settle-
ment control (serviceability limit state),
and the latter was the requirement, pat-
icularly for the warehouse fl oors. Without
improvement, ground settlement is esti-
mated at between 200 mm and 400 mm,
with consolidation periods of between
two and fi ve years. Th e presence of rigid
inclusions notably increases the vertical
stiff ness of the soil mass and reduces the
stresses applied to the soft clays, thereby
signifi cantly reducing the settlement and
consolidation periods.
Th e design of the ground improvement
was carried out using both 2D and 3D fi -
nite element analysis. Underneath most of
the warehouse structure, the conditions
are one-dimensional and could be ana-
lysed using axi-symmetric fi nite element
models as unit cells (shown in Figure 6).
Oedometric Young’s modulus was cor-
related to CPT results using correlations
back-analysed from the pre-construction
test programme. Axi-symmetric analysis
results were compared to results from the
load transfer method developed by Bohn
(2015) as a sanity check. Axi-symmetric
analyses require little computational time,
and are used as quick checks for various
ground conditions and fi ll scenarios. Axi-
symmetric and 2D fi nite element models,
however, are inadequate to assess building
edge and corner eff ects, and partial fl oor
loading conditions. Hence 3D fi nite ele-
ment analyses were used in these cases.
Ground settlement is monitored using
vibrating wire settlement sensors buried
below the working platform level. Th e
data from the reservoir is connected to a
wireless logger box which sends the data
to a site gateway powered by solar panels
and contains a GSM modem. Data is sent
Figure 5: 3D finite element analysis of the soil displacement
Figure 6: Axisymmetric model representing a single unit cell of distributed load supported by soil reinforced by rigid inclusions (ASIRI 2013)
a a
bb
b
b
a a
R
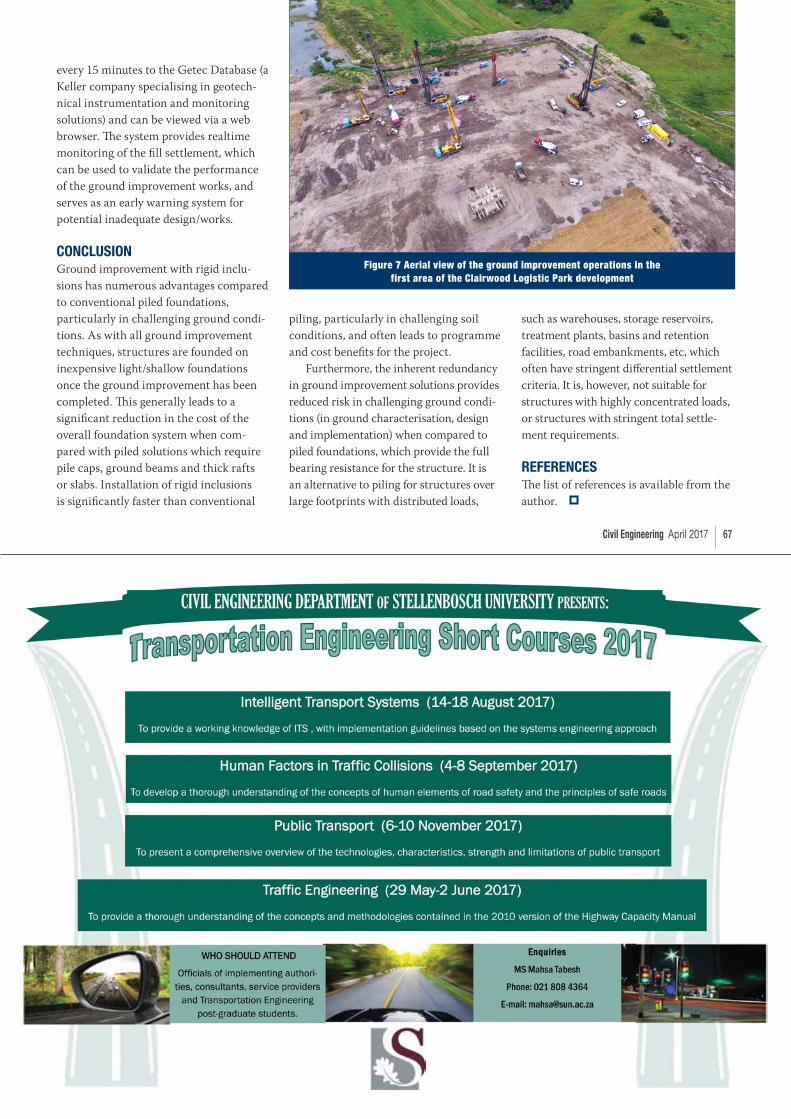
Civil Engineering April 2017 67
every 15 minutes to the Getec Database (a
Keller company specialising in geotech-
nical instrumentation and monitoring
solutions) and can be viewed via a web
browser. Th e system provides realtime
monitoring of the fi ll settlement, which
can be used to validate the performance
of the ground improvement works, and
serves as an early warning system for
potential inadequate design/works.
CONCLUSIONGround improvement with rigid inclu-
sions has numerous advantages compared
to conventional piled foundations,
particularly in challenging ground condi-
tions. As with all ground improvement
techniques, structures are founded on
inexpensive light/shallow foundations
once the ground improvement has been
completed. Th is generally leads to a
signifi cant reduction in the cost of the
overall foundation system when com-
pared with piled solutions which require
pile caps, ground beams and thick rafts
or slabs. Installation of rigid inclusions
is signifi cantly faster than conventional
piling, particularly in challenging soil
conditions, and often leads to programme
and cost benefi ts for the project.
Furthermore, the inherent redundancy
in ground improvement solutions provides
reduced risk in challenging ground condi-
tions (in ground characterisation, design
and implementation) when compared to
piled foundations, which provide the full
bearing resistance for the structure. It is
an alternative to piling for structures over
large footprints with distributed loads,
such as warehouses, storage reservoirs,
treatment plants, basins and retention
facilities, road embankments, etc, which
often have stringent diff erential settlement
criteria. It is, however, not suitable for
structures with highly concentrated loads,
or structures with stringent total settle-
ment requirements.
REFERENCES Th e list of references is available from the
author.
Figure 7 Aerial view of the ground improvement operations in the first area of the Clairwood Logistic Park development
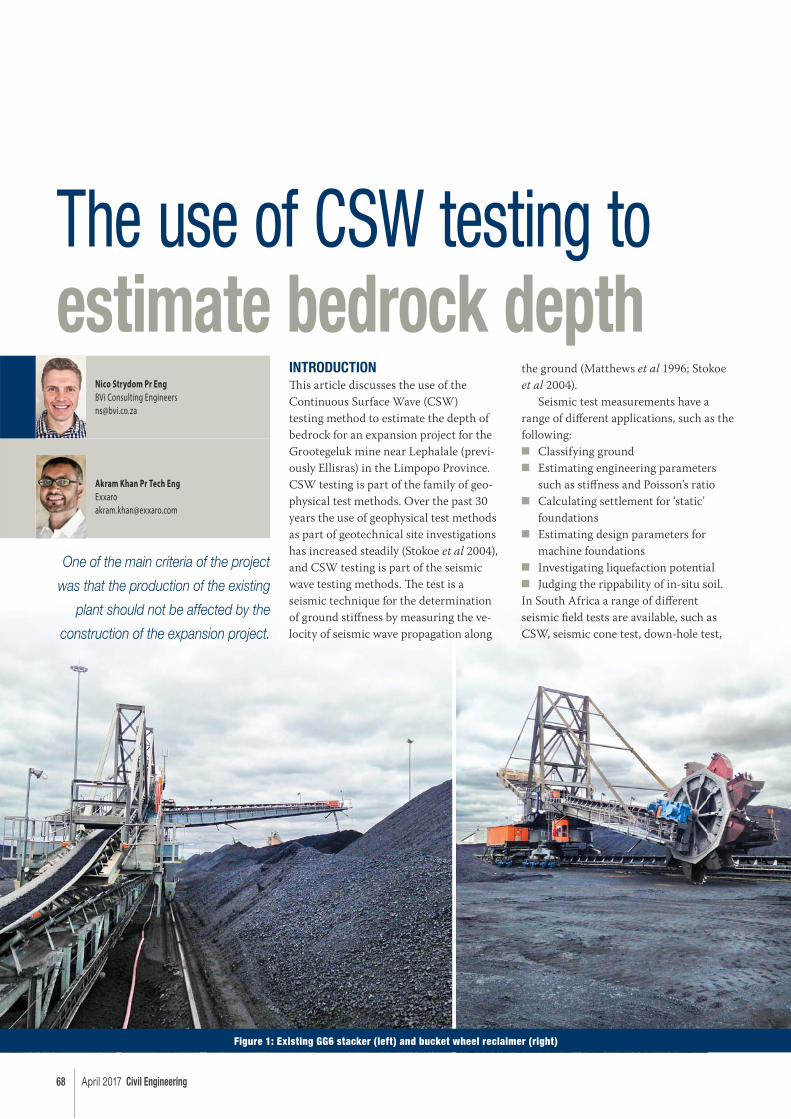
68 April 2017 Civil Engineering
INTRODUCTIONTh is article discusses the use of the
Continuous Surface Wave (CSW)
testing method to estimate the depth of
bedrock for an expansion project for the
Grootegeluk mine near Lephalale (previ-
ously Ellisras) in the Limpopo Province.
CSW testing is part of the family of geo-
physical test methods. Over the past 30
years the use of geophysical test methods
as part of geotechnical site investigations
has increased steadily (Stokoe et al 2004),
and CSW testing is part of the seismic
wave testing methods. Th e test is a
seismic technique for the determination
of ground stiff ness by measuring the ve-
locity of seismic wave propagation along
the ground (Matthews et al 1996; Stokoe
et al 2004).
Seismic test measurements have a
range of diff erent applications, such as the
following:
■ Classifying ground
■ Estimating engineering parameters
such as stiff ness and Poisson’s ratio
■ Calculating settlement for ‘static’
foundations
■ Estimating design parameters for
machine foundations
■ Investigating liquefaction potential
■ Judging the rippability of in-situ soil.
In South Africa a range of diff erent
seismic fi eld tests are available, such as
CSW, seismic cone test, down-hole test,
Nico Strydom Pr Eng
BVi Consulting [email protected]
Akram Khan Pr Tech Eng
The use of CSW testing to estimate bedrock depth
Figure 1: Existing GG6 stacker (left) and bucket wheel reclaimer (right)
One of the main criteria of the project
was that the production of the existing
plant should not be affected by the
construction of the expansion project.
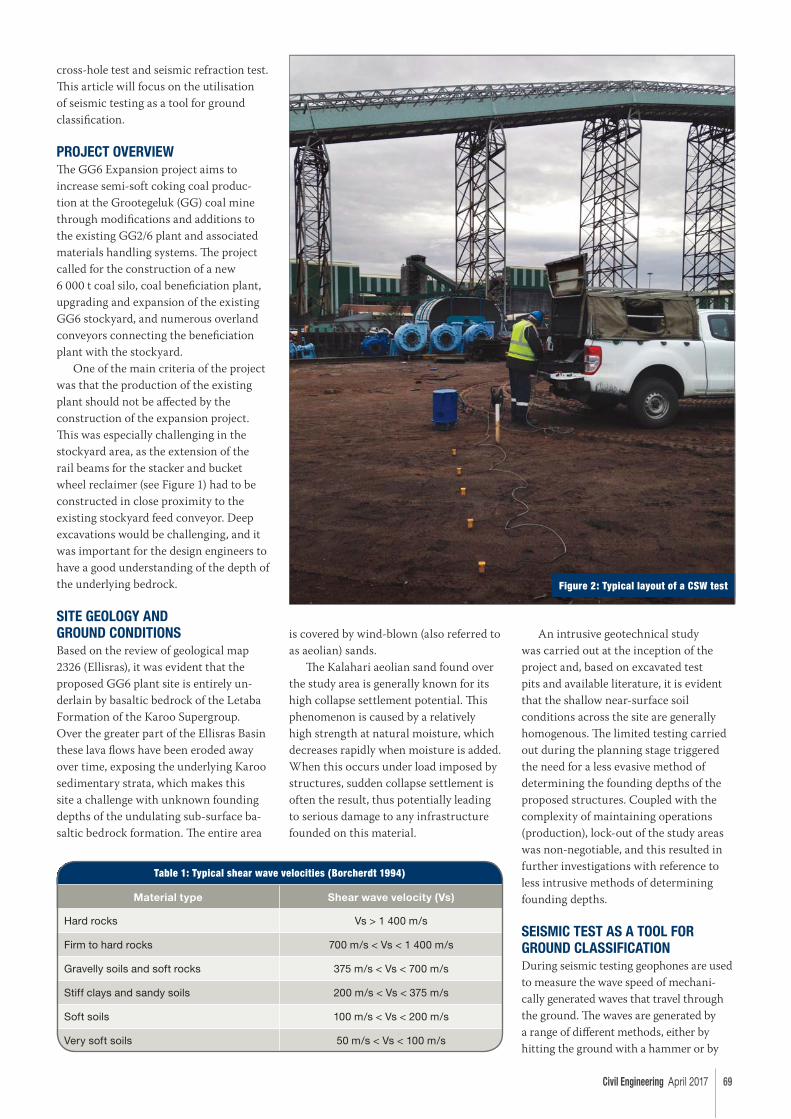
Civil Engineering April 2017 69
cross-hole test and seismic refraction test.
Th is article will focus on the utilisation
of seismic testing as a tool for ground
classifi cation.
PROJECT OVERVIEWTh e GG6 Expansion project aims to
increase semi-soft coking coal produc-
tion at the Grootegeluk (GG) coal mine
through modifi cations and additions to
the existing GG2/6 plant and associated
materials handling systems. Th e project
called for the construction of a new
6 000 t coal silo, coal benefi ciation plant,
upgrading and expansion of the existing
GG6 stockyard, and numerous overland
conveyors connecting the benefi ciation
plant with the stockyard.
One of the main criteria of the project
was that the production of the existing
plant should not be aff ected by the
construction of the expansion project.
Th is was especially challenging in the
stockyard area, as the extension of the
rail beams for the stacker and bucket
wheel reclaimer (see Figure 1) had to be
constructed in close proximity to the
existing stockyard feed conveyor. Deep
excavations would be challenging, and it
was important for the design engineers to
have a good understanding of the depth of
the underlying bedrock.
SITE GEOLOGY AND GROUND CONDITIONSBased on the review of geological map
2326 (Ellisras), it was evident that the
proposed GG6 plant site is entirely un-
derlain by basaltic bedrock of the Letaba
Formation of the Karoo Supergroup.
Over the greater part of the Ellisras Basin
these lava fl ows have been eroded away
over time, exposing the underlying Karoo
sedimentary strata, which makes this
site a challenge with unknown founding
depths of the undulating sub-surface ba-
saltic bedrock formation. Th e entire area
is covered by wind-blown (also referred to
as aeolian) sands.
Th e Kalahari aeolian sand found over
the study area is generally known for its
high collapse settlement potential. Th is
phenomenon is caused by a relatively
high strength at natural moisture, which
decreases rapidly when moisture is added.
When this occurs under load imposed by
structures, sudden collapse settlement is
often the result, thus potentially leading
to serious damage to any infrastructure
founded on this material.
An intrusive geotechnical study
was carried out at the inception of the
project and, based on excavated test
pits and available literature, it is evident
that the shallow near-surface soil
conditions across the site are generally
homogenous. Th e limited testing carried
out during the planning stage triggered
the need for a less evasive method of
determining the founding depths of the
proposed structures. Coupled with the
complexity of maintaining operations
(production), lock-out of the study areas
was non-negotiable, and this resulted in
further investigations with reference to
less intrusive methods of determining
founding depths.
SEISMIC TEST AS A TOOL FOR GROUND CLASSIFICATIONDuring seismic testing geophones are used
to measure the wave speed of mechani-
cally generated waves that travel through
the ground. Th e waves are generated by
a range of diff erent methods, either by
hitting the ground with a hammer or by
Table 1: Typical shear wave velocities (Borcherdt 1994)
Material type Shear wave velocity (Vs)
Hard rocks Vs > 1 400 m/s
Firm to hard rocks 700 m/s < Vs < 1 400 m/s
Gravelly soils and soft rocks 375 m/s < Vs < 700 m/s
Stiff clays and sandy soils 200 m/s < Vs < 375 m/s
Soft soils 100 m/s < Vs < 200 m/s
Very soft soils 50 m/s < Vs < 100 m/s
Figure 2: Typical layout of a CSW test
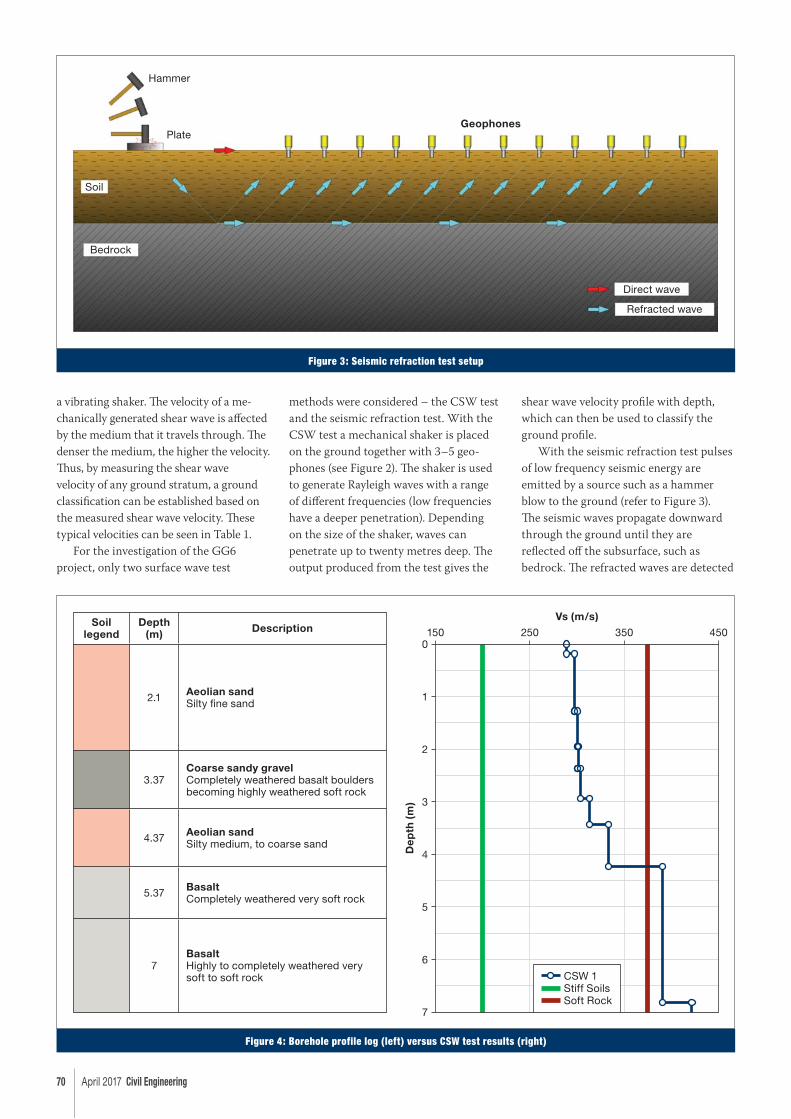
70 April 2017 Civil Engineering
a vibrating shaker. Th e velocity of a me-
chanically generated shear wave is aff ected
by the medium that it travels through. Th e
denser the medium, the higher the velocity.
Th us, by measuring the shear wave
velocity of any ground stratum, a ground
classifi cation can be established based on
the measured shear wave velocity. Th ese
typical velocities can be seen in Table 1.
For the investigation of the GG6
project, only two surface wave test
methods were considered – the CSW test
and the seismic refraction test. With the
CSW test a mechanical shaker is placed
on the ground together with 3–5 geo-
phones (see Figure 2). Th e shaker is used
to generate Rayleigh waves with a range
of diff erent frequencies (low frequencies
have a deeper penetration). Depending
on the size of the shaker, waves can
penetrate up to twenty metres deep. Th e
output produced from the test gives the
shear wave velocity profi le with depth,
which can then be used to classify the
ground profi le.
With the seismic refraction test pulses
of low frequency seismic energy are
emitted by a source such as a hammer
blow to the ground (refer to Figure 3).
Th e seismic waves propagate downward
through the ground until they are
refl ected off the subsurface, such as
bedrock. Th e refracted waves are detected
Figure 4: Borehole profile log (left) versus CSW test results (right)
7
De
pth
(m
)
6
5
4
3
2
1
0
Vs (m/s)
150 250 450350Soil
legendDepth
(m) Description
2.1 Aeolian sandSilty fi ne sand
3.37Coarse sandy gravelCompletely weathered basalt boulders becoming highly weathered soft rock
4.37 Aeolian sandSilty medium, to coarse sand
5.37 BasaltCompletely weathered very soft rock
7BasaltHighly to completely weathered very soft to soft rock CSW 1
Stiff SoilsSoft Rock
Figure 3: Seismic refraction test setup
Direct wave
Refracted wave
Soil
Bedrock
Hammer
PlateGeophones
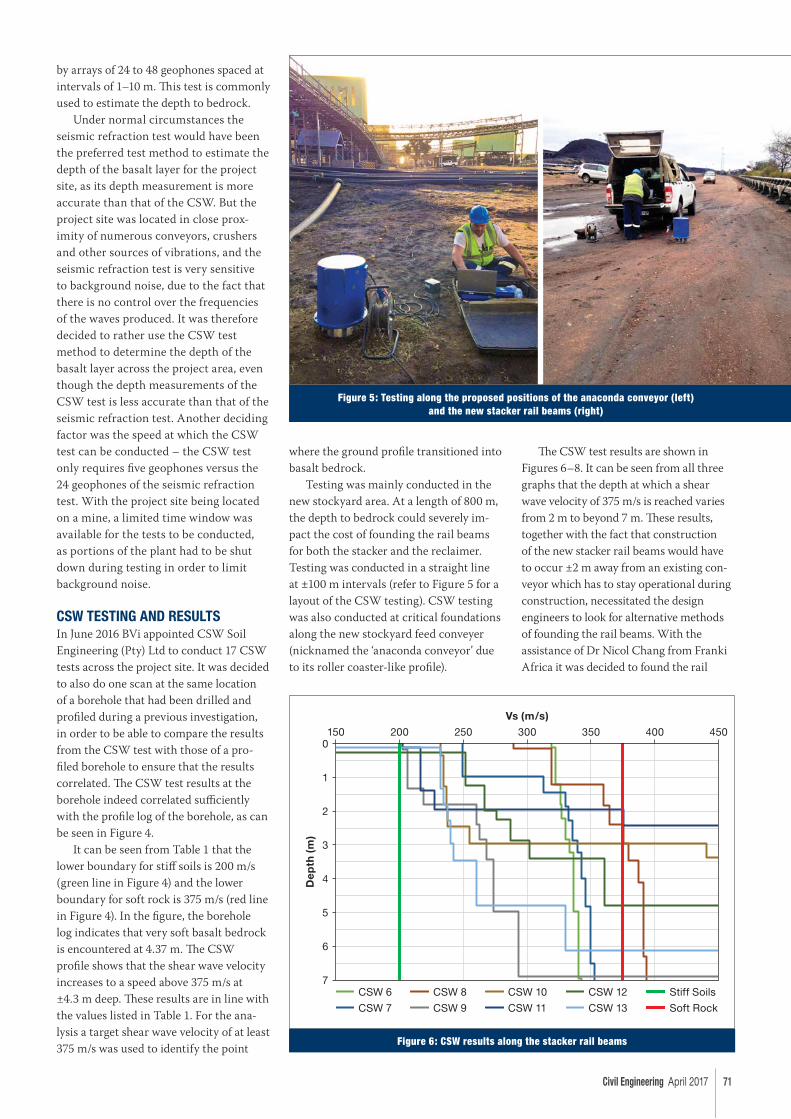
Civil Engineering April 2017 71
by arrays of 24 to 48 geophones spaced at
intervals of 1–10 m. Th is test is commonly
used to estimate the depth to bedrock.
Under normal circumstances the
seismic refraction test would have been
the preferred test method to estimate the
depth of the basalt layer for the project
site, as its depth measurement is more
accurate than that of the CSW. But the
project site was located in close prox-
imity of numerous conveyors, crushers
and other sources of vibrations, and the
seismic refraction test is very sensitive
to background noise, due to the fact that
there is no control over the frequencies
of the waves produced. It was therefore
decided to rather use the CSW test
method to determine the depth of the
basalt layer across the project area, even
though the depth measurements of the
CSW test is less accurate than that of the
seismic refraction test. Another deciding
factor was the speed at which the CSW
test can be conducted – the CSW test
only requires fi ve geophones versus the
24 geophones of the seismic refraction
test. With the project site being located
on a mine, a limited time window was
available for the tests to be conducted,
as portions of the plant had to be shut
down during testing in order to limit
background noise.
CSW TESTING AND RESULTSIn June 2016 BVi appointed CSW Soil
Engineering (Pty) Ltd to conduct 17 CSW
tests across the project site. It was decided
to also do one scan at the same location
of a borehole that had been drilled and
profi led during a previous investigation,
in order to be able to compare the results
from the CSW test with those of a pro-
fi led borehole to ensure that the results
correlated. Th e CSW test results at the
borehole indeed correlated suffi ciently
with the profi le log of the borehole, as can
be seen in Figure 4.
It can be seen from Table 1 that the
lower boundary for stiff soils is 200 m/s
(green line in Figure 4) and the lower
boundary for soft rock is 375 m/s (red line
in Figure 4). In the fi gure, the borehole
log indicates that very soft basalt bedrock
is encountered at 4.37 m. Th e CSW
profi le shows that the shear wave velocity
increases to a speed above 375 m/s at
±4.3 m deep. Th ese results are in line with
the values listed in Table 1. For the ana-
lysis a target shear wave velocity of at least
375 m/s was used to identify the point
where the ground profi le transitioned into
basalt bedrock.
Testing was mainly conducted in the
new stockyard area. At a length of 800 m,
the depth to bedrock could severely im-
pact the cost of founding the rail beams
for both the stacker and the reclaimer.
Testing was conducted in a straight line
at ±100 m intervals (refer to Figure 5 for a
layout of the CSW testing). CSW testing
was also conducted at critical foundations
along the new stockyard feed conveyer
(nicknamed the ‘anaconda conveyor’ due
to its roller coaster-like profi le).
Th e CSW test results are shown in
Figures 6–8. It can be seen from all three
graphs that the depth at which a shear
wave velocity of 375 m/s is reached varies
from 2 m to beyond 7 m. Th ese results,
together with the fact that construction
of the new stacker rail beams would have
to occur ±2 m away from an existing con-
veyor which has to stay operational during
construction, necessitated the design
engineers to look for alternative methods
of founding the rail beams. With the
assistance of Dr Nicol Chang from Franki
Africa it was decided to found the rail
Figure 5: Testing along the proposed positions of the anaconda conveyor (left) and the new stacker rail beams (right)
Figure 6: CSW results along the stacker rail beams
De
pth
(m
)
3
4
5
6
7
2
0
1
Vs (m/s)
150 200 250 300 350 400 450
CSW 7
CSW 8 Stiff Soils
CSW 9 CSW 11 CSW 13 Soft Rock
CSW 6 CSW 10 CSW 12
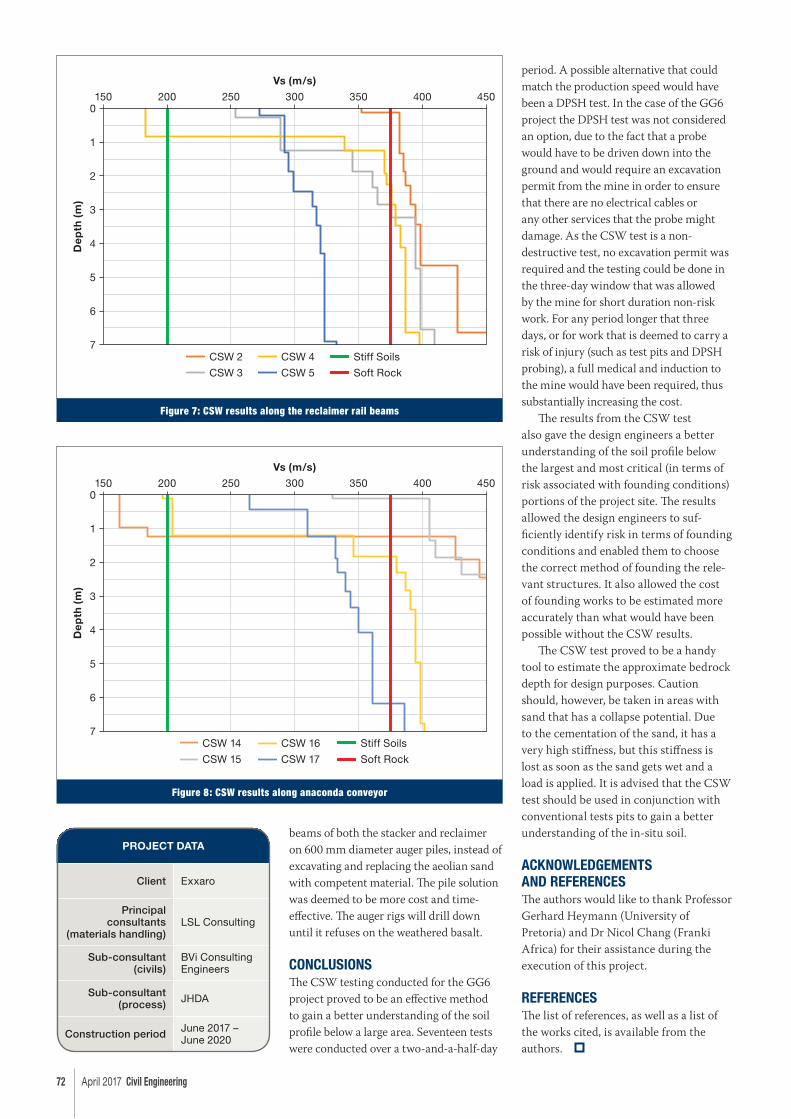
72 April 2017 Civil Engineering
beams of both the stacker and reclaimer
on 600 mm diameter auger piles, instead of
excavating and replacing the aeolian sand
with competent material. Th e pile solution
was deemed to be more cost and time-
eff ective. Th e auger rigs will drill down
until it refuses on the weathered basalt.
CONCLUSIONSTh e CSW testing conducted for the GG6
project proved to be an eff ective method
to gain a better understanding of the soil
profi le below a large area. Seventeen tests
were conducted over a two-and-a-half-day
period. A possible alternative that could
match the production speed would have
been a DPSH test. In the case of the GG6
project the DPSH test was not considered
an option, due to the fact that a probe
would have to be driven down into the
ground and would require an excavation
permit from the mine in order to ensure
that there are no electrical cables or
any other services that the probe might
damage. As the CSW test is a non-
destructive test, no excavation permit was
required and the testing could be done in
the three-day window that was allowed
by the mine for short duration non-risk
work. For any period longer that three
days, or for work that is deemed to carry a
risk of injury (such as test pits and DPSH
probing), a full medical and induction to
the mine would have been required, thus
substantially increasing the cost.
Th e results from the CSW test
also gave the design engineers a better
understanding of the soil profi le below
the largest and most critical (in terms of
risk associated with founding conditions)
portions of the project site. Th e results
allowed the design engineers to suf-
fi ciently identify risk in terms of founding
conditions and enabled them to choose
the correct method of founding the rele-
vant structures. It also allowed the cost
of founding works to be estimated more
accurately than what would have been
possible without the CSW results.
Th e CSW test proved to be a handy
tool to estimate the approximate bedrock
depth for design purposes. Caution
should, however, be taken in areas with
sand that has a collapse potential. Due
to the cementation of the sand, it has a
very high stiff ness, but this stiff ness is
lost as soon as the sand gets wet and a
load is applied. It is advised that the CSW
test should be used in conjunction with
conventional tests pits to gain a better
understanding of the in-situ soil.
ACKNOWLEDGEMENTS AND REFERENCESTh e authors would like to thank Professor
Gerhard Heymann (University of
Pretoria) and Dr Nicol Chang (Franki
Africa) for their assistance during the
execution of this project.
REFERENCESTh e list of references, as well as a list of
the works cited, is available from the
authors.
PROJECT DATA
Client Exxaro
Principal consultants
(materials handling)LSL Consulting
Sub-consultant (civils)
BVi Consulting Engineers
Sub-consultant (process) JHDA
Construction period June 2017 – June 2020
Figure 7: CSW results along the reclaimer rail beams
De
pth
(m
)
3
4
5
6
7
2
0
1
Vs (m/s)
150 200 250 300 350 400 450
CSW 2
CSW 3
CSW 4 Stiff Soils
CSW 5 Soft Rock
Figure 8: CSW results along anaconda conveyor
De
pth
(m
)
3
4
5
6
7
2
0
1
Vs (m/s)
150 200 250 300 350 400 450
CSW 14
CSW 15
CSW 16 Stiff Soils
CSW 17 Soft Rock
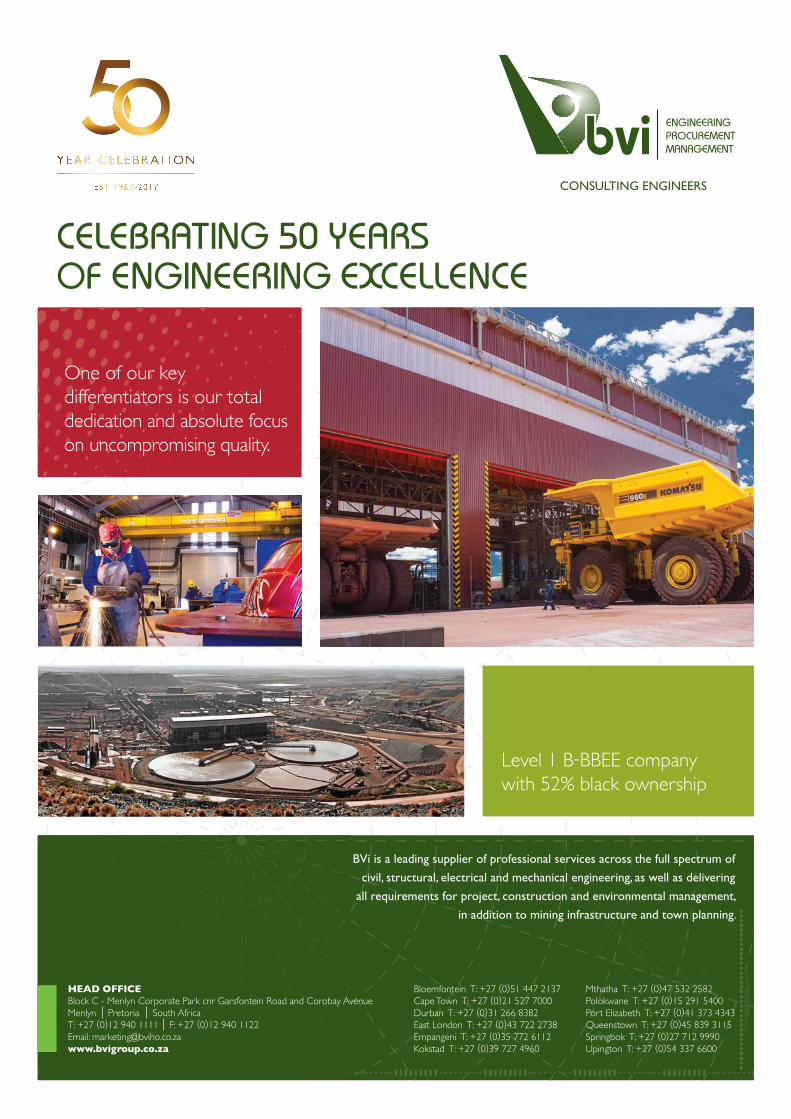
74 April 2017 Civil Engineering
INTRODUCTIONTh e geotechnical group of the Civil
Engineering Department at the University
of the Witwatersrand (WITS) has under-
gone exciting developments in the last
few months. One of the academics of the
group, Dr Luis Torres-Cruz, completed
his PhD last December, and the group
will soon be adding a new member,
Dr Th ushan Ekneligoda, who obtained his
PhD at the Royal Institute of Technology
in Sweden, and previously worked as a
research fellow at Nottingham University
in the UK. Dr Ekneligoda has a keen in-
terest in numerical modelling and under-
ground coal gasifi cation. In the midst of
these developments the group continues
to pursue its research agenda, of which we
provide some highlights below.
INSIGHTS FROM INDEX PROPERTIESTh e importance of soil index properties
has long been recognised in geotechnical
engineering. Classic texts, such as
Terzaghi and Peck (1948), highlight the
practical importance of establishing
approximate correlations between index
properties which are easy to measure (e.g.
fi nes content, limit void ratios, Atterberg
limits) and mechanical parameters whose
direct measurement demands more time
and resources (e.g. steady state line, fric-
tion angle, compressibility). Th e develop-
ment of these correlations is the subject
of intense research worldwide, and at
WITS we are contributing to this ongoing
conversation. For example, fi ndings from
Torres-Cruz (2016) indicate that the
vertical position of the steady state line of
non-plastic soils can be correlated to the
minimum void ratio, and that this correla-
tion is independent of particle angularity
and of the particle size distribution of the
soils. Th ese fi ndings challenge the view
that the steady state line can be explained
in terms of the fi nes content, as has been
suggested by other authors (e.g. Rahman
& Lo 2008).
Similarly, eff orts are also being made
to explore the correlation between the
Atterberg limits and the mechanical be-
haviour of non-plastic soils. Th e starting
point is the fact that the defi nitions of the
liquid and plastic limits, commonly used
for soil classifi cation purposes, are largely
arbitrary. Accordingly one can expect
that the strength with which these limits
correlate to mechanical parameters will
Geotechnical research at WITS
Figure 1: Typical results from variedSB tests investigating internal erosion
Pea
k d
ilati
on
an
gle
ψ: °
16
12
8
4
0–5
Finer fraction F (%)
5 15 3525
Dense coarser particles alone
Loose coarser particles alone
Loss of strength for F > 15% following
particle loss
Dense coarser and fi ner particles with
no particle loss
All-sand-fi nes All-salt-fi nes
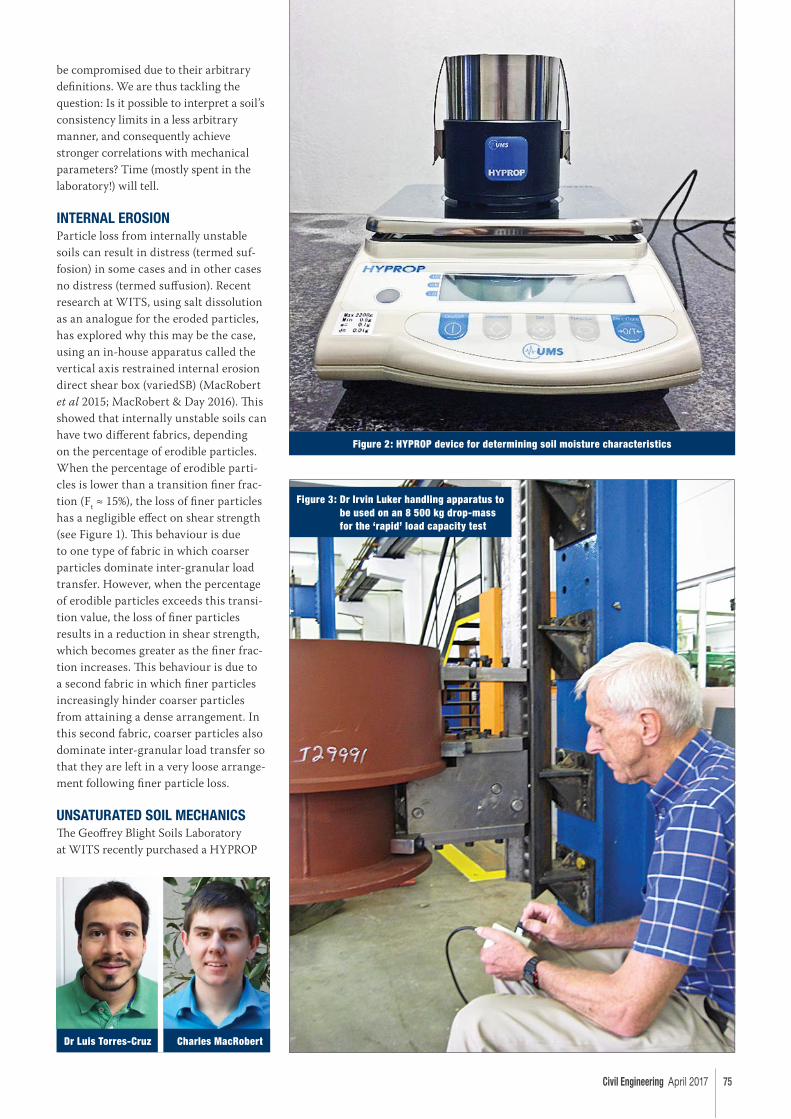
Civil Engineering April 2017 75
be compromised due to their arbitrary
defi nitions. We are thus tackling the
question: Is it possible to interpret a soil’s
consistency limits in a less arbitrary
manner, and consequently achieve
stronger correlations with mechanical
parameters? Time (mostly spent in the
laboratory!) will tell.
INTERNAL EROSIONParticle loss from internally unstable
soils can result in distress (termed suf-
fosion) in some cases and in other cases
no distress (termed suff usion). Recent
research at WITS, using salt dissolution
as an analogue for the eroded particles,
has explored why this may be the case,
using an in-house apparatus called the
vertical axis restrained internal erosion
direct shear box (variedSB) (MacRobert
et al 2015; MacRobert & Day 2016). Th is
showed that internally unstable soils can
have two diff erent fabrics, depending
on the percentage of erodible particles.
When the percentage of erodible parti-
cles is lower than a transition fi ner frac-
tion (Ft ≈ 15%), the loss of fi ner particles
has a negligible eff ect on shear strength
(see Figure 1). Th is behaviour is due
to one type of fabric in which coarser
particles dominate inter-granular load
transfer. However, when the percentage
of erodible particles exceeds this transi-
tion value, the loss of fi ner particles
results in a reduction in shear strength,
which becomes greater as the fi ner frac-
tion increases. Th is behaviour is due to
a second fabric in which fi ner particles
increasingly hinder coarser particles
from attaining a dense arrangement. In
this second fabric, coarser particles also
dominate inter-granular load transfer so
that they are left in a very loose arrange-
ment following fi ner particle loss.
UNSATURATED SOIL MECHANICSTh e Geoff rey Blight Soils Laboratory
at WITS recently purchased a HYPROP
Figure 2: HYPROP device for determining soil moisture characteristics
Figure 3: Dr Irvin Luker handling apparatus to be used on an 8 500 kg drop-mass for the ‘rapid’ load capacity test
Dr Luis Torres-Cruz Charles MacRobert

76 April 2017 Civil Engineering
device – a device that uses the
Wind/ Schindler evaporation method
(Wind 1966; Schindler 1980) to determine
soil water characteristic curves and
unsaturated hydraulic conductivity func-
tions. Th e device utilises two precision
mini-tensiometers to track developing
suctions as a 250 ml soil specimen dries
out on a laboratory scale. Th e device
automatically generates the moisture
characteristics, following initial specimen
setup in shorter periods, than more
traditional methods (Decagon 2017).
Th e purchase of this device, along with
various in-situ soil moisture and suction
sensors, is aimed at developing methods
to make unsaturated soil mechanics more
accessible to local engineers.
TESTING OF FOUNDATION PILESDr Irvin Luker is now fully occupied at
WITS in researching and developing
techniques that are new to South Africa for
testing foundation piles. Th ese include the
‘rapid’ method of measuring the load-car-
rying capacity of any type of pile, integrity
testing of the concrete in cast-in-situ piles,
and a new type of strain rod for measuring
the longitudinal strain in piles during a
load test. Th e latter technique shows in
detail the way in which load is transferred
from any pile into the ground.
Figure 3 shows apparatus to
test a mechanism to be used on an
8 500 kg drop-mass for the ‘rapid’ load
capacity test.
REFERENCES Decagon 2017. HYPROP (online). Decagon
Devices. Available: https://www.decagon.
com/en/soils/benchtop-instruments/
hyprop/ (Accessed 10 March 2017).
Macrobert, C J, Torres-Cruz, L A & Luker, I
2015. Geotechnical research at Wits. Civil
Engineering, 23: 62–63.
Macrobert, C J & Day, P W 2016. Considerations
for using soil-salt mixtures to model
soil fabric changes. In: Jacobz, S W, Ed.
Proceedings, First Southern African
Geotechnical Conference, Sun City, South
Africa. CRC Press, 261–265.
Rahman, M M & Lo, S R 2008. Th e prediction
of equivalent granular steady state line of
loose sand with fi nes. Geomechanics and
Geoengineering: An international Journal,
3: 179–190.
Terzaghi, K & Peck, R B 1948. Soil mechanics
in engineering practice. John Wiley & Sons,
566 pp.
Torres-Cruz, L A 2016. Use of the cone penetra-
tion test to assess the liquefaction potential
of tailings storage facilities. PhD Th esis,
University of the Witwatersrand, 255 pp.
Schindler, U 1980. Ein Schnellverfahren zur
Messung der Wasserleitfahigkeit im teilge-
sattigten Boden und Stechzylinderproben.
Archiv fur Acker-und Pfl anzenbau und
Bodenkunde, 71, 262–288.
Wind, G P 1966. Capillary conductivity data
estimated by a simple method. UNESCO/
IASH Symposium: Water in the unsaturated
zone, Wageningen, Th e Netherlands,
181–191.
INFO
Dr Luis Torres-Cruz
Charles MacRobert
Dr Irvin Luker

Civil Engineering April 2017 77
WHY THE RESEARCH GROUP?Th e problem of founding structures on expansive soils began
receiving considerable attention in South Africa in the late 1950s.
Th e major mining houses were then experiencing heave problems
in accommodation provided for their workforce, particularly at
their mines in the Free State, and they then provided funding for
geotechnical researchers to investigate the problem. Some of the
best soil mechanics experts in the country, including Professors
JE Jennings and K Knight, were involved in this research.
However, funds for such investigations have subsequently largely
dried up, hence little research has been done on this problem
since the 1980s.
Th e question of expansive soils has again come to the fore
in South Africa since the new political dispensation came into
being in 1994. A rapidly emerging black middle class, with aspi-
rations of a home of their own, led to burgeoning construction
of single-storey houses. Attempts by the government to provide
low-cost housing for the poorest section of the community
also led to the construction of millions of small, light houses.
However, large numbers of failures have become common
and many of these houses had to be demolished and replaced.
In many cases, however, the replacements seem to have little
prospect of a signifi cantly longer useful life than the ones they
are replacing.
Communication with Professor Derek Sparks (an expert
in expansive clays at the University of Cape Town), led to the
realisation that soil testing was needed. Literature searches,
however, indicated that satisfactory answers were not readily
available. Th e Department of Civil Engineering at the Central
University of Technology, Free State (CUT), was approached in
2010 for possible involvement through its soil mechanics labora-
tory, and in 2011 the Soil Mechanics Research Group (SMRG)
was formed to examine problems around the foundations of light
structures on expansive clays. Th e late Professor Geoff Blight
from the University of the Witwatersrand kindly agreed at the
time to act as advisor. Th is article introduces the research group,
shows what progress has been made towards understanding why
current procedures appear to be inadequate, and off ers possible
solutions to these problems.
EXAMPLES OF FAILURE DUE TO HEAVING CLAYIn 2013 members of the SMRG visited Kimberley to examine
three housing developments. A number of points of concern
were noted at two sites, which were already at an advanced stage
of construction. Soil samples were taken from these sites, as well
as from a proposed development of 114 rental sites. Analysis of
these samples suggested that the currently used test methods
are inadequate to assess these soils, and that the test sites could
expect expansion problems despite a favourable geotechnical
report. Signifi cant heave damage has indeed been reported –
Photo 1 shows an example of typical damage observed at several
of these sites.
Soil Mechanics Research Group at CUT
Photo 1: Example of a house which became unfit for habitation before receiving its first coat of paint

78 April 2017 Civil Engineering
INEFFECTIVENESS OF PRESENT TESTSFoundation design for most light structures in South Africa, and
in particular for low-cost housing, relies heavily on particle-size
analysis and the determination of Atterberg limits. Th e tests for
these properties were performed in commercial materials testing
laboratories at the time, using the procedures of the CSIR’s
Technical Methods for Highways Part 1 (TMH1). SANS 3001
has now been phased in to replace TMH1. Both are primarily
concerned with road construction, and investigations done
by the SMRG indicated serious shortcomings in both of these
norms in the context of foundation design for light structures.
A paper titled “Shortcomings in the standard procedures for as-
sessing heaving clays in foundation design” was published in 2015
in the Journal of the South African Institution of Civil Engineering
[57(2): 36–44]. In this paper it was indicated that the liquid limit
(LL), in particular, appears to require urgent attention.
SHORTCOMINGS IN THE ESTIMATION OF THE LIQUID LIMIT WITH CASAGRANDE CUPMost engineers rely on values of LL determined by commercial
laboratories. As commercial laboratories strive to make their
services competitive and aff ordable to their clients, they perform
a one-point procedure. Hence they take the specifi ed mixing
time of ten minutes to mean that the total time, from fi rst adding
water to the oven-dried sample until transfer of the mixed
material to the Casagrande Cup for immediate testing, is to
be exactly ten minutes. A team of six testers from the SMRG
measured liquid limit and plasticity index by the one-point and
by the fl ow-curve methods. Test results were compared with
those from an accredited commercial laboratory. For clays with
low heave potential there was little diff erence. As the activity of
the clay increased, however, so did the discrepancies. In the case
Photo 2: Testing by fall cone conducted by research student, Zandri, and research assistant, Charlotte
Photo 3: Post-graduate student, Priscilla Monye, showing the settlement container that was designed to be waterproof while having one side removable for the
extraction of settled samples of sand, silt and clay

Civil Engineering April 2017 79
of very active clay, the discrepancy in liquid limit is severe (one
particular case, LL 50 vs 71, showed a diff erence of 42%) Th e
discrepancy in plasticity index (PI) is even greater (in the above
case the PI was 24 vs 44, a diff erence of 83%). Values for plastic
limit (PL) were in good agreement in all cases, suggesting that
the discrepancy in the PI was due to the LL only. Results from
these tests were used to predict heave using several published
methods. In the case of very active clays, heave predictions based
on the fl ow curve results could be more than double those based
on the one-point method.
LIQUID LIMIT USING THE FALL CONETh e fall cone has become the standard method of determining
liquid limits in many countries, as it is considered to be less
prone to operator error, more consistent in its results and gener-
ally more reliable than the Casagrande Cup. Th ere also seems
to be less scope for operator error than with the Casagrande
apparatus. Th e only immediately obvious operator input prone
to error appears to be adjusting the point of the cone until it just
touches the surface of the sample. Th e Casagrande test on the
other hand has a number of causes for concern which are raised
repeatedly – the question of operator judgement as to when the
specifi ed length of the groove has closed, the problem of keeping
a regular timing of two taps per second, the need for occasional
adjustment of the distance of fall of the cup, the question of the
hardness of the base on which the apparatus stands which aff ects
the severity of each blow, etc. However, one not immediately ap-
parent disadvantage of the fall cone is the large size of the sample
required for the test – about twice as much soil is required as for
the Casagrande test. Another not so obvious problem is the care
needed when fi lling the sample mould. If air is trapped in the
angle between the base and the walls, the resistance to the fall of
the cone is signifi cantly reduced as the entrapped air compresses.
Th e SMRG’s evaluation of the fall cone is being done using
multiple testing for each soil, and although the tests have been
on-going for many months, it will still be quite some time before
enough samples have been tested to meaningfully compare
the old (cup) with the new (cone). Furthermore, an attempt
to address other objections to the use of the fall cone is being
conducted at the same time. Th e possibility of reducing sample
size to something similar to that of the Casagrande apparatus,
simplifying sample preparation, and reducing or eliminating the
problem of air entrapment is being investigated. Th ere is also the
possibility of making the test more attractive to all concerned by
obtaining the PL from the results of the same test. If the PI can
be obtained from one procedure, the rolling of threads could be
dispensed with. Th at procedure is even more severely criticised
as being operator dependent (and hence potentially more unreli-
able than the Casagrande LL procedure). If this aspect of the
investigation proves successful, it could make the fall cone a very
attractive alternative (Photo 2 refers).
SHORTCOMINGS IN ESTIMATION OF PARTICLE-SIZE DISTRIBUTIONSuction tests on samples taken from the housing development
mentioned previously showed considerable heave potential in
spite of a hydrometer analysis showing only 6% clay fraction.
A microscopic investigation was undertaken in an attempt to
understand why this should be. Clay is not normally considered
suitable for analysis by light microscope. Some of the reasons for
this are that dried clay forms dense agglomerations of particles
which are diffi cult to diff erentiate, in suspension Brownian mo-
tion makes clay particles of about 1 μm or less very diffi cult to
observe, high-powered lenses have only a small depth of focus,
and it is diffi cult to distinguish between very small silt particles
and clay particles. Also, Scanning Electron Microscope (SEM)
images of very high magnifi cation, great depth of focus, and
clarity of a high order are available and appear to give an excel-
lent representation of clay particles. However, preparation for
SEM images involves such treatment as drying and gold-plating.
Th e hydrated clay particles in the hydrometer are considerably
diff erent to dry particles. Also, labelling the clay particles with
methylene blue makes it possible to recognise clay minerals and
gain an insight into their behaviour in the hydro meter. Photo 4
shows a typical view of a soil suspension following chemical
dispersion and high-speed mechanical stirring, as specifi ed in
SANS 3001 GR3. Th e large agglomeration of silt and clay-sized
particles appears to be bound together by minute, blue-stained,
high-cation exchange capacity clay particles whose small size
indicates them to be smectite. It appears that for this clay the
standard dispersion procedure is ineff ective, and much of the
clay is therefore unlikely to settle as expected in the hydro meter.
An extended programme of testing suggests that soils which are
not eff ectively dispersed by the standard procedure are not un-
common, and for estimating heave potential, hydrometer results
may be deceptive and may lead to problems.
VARIABILITY OF SOIL PROPERTIESA rather neglected feature of soils which is being examined
by the CUT soils research group is variability. Current testing
methods tend to hide variability of soil properties by specifying
thorough mixing of samples before testing. Th is should give a
good idea of the average properties of a soil sample, but it ensures
that variability in those properties will be hidden.
Investigations by the SMRG suggest that variability of at least
some soil properties may have a fractal distribution in at least
some cases. A mathematical fractal distribution has patterns
Photo 4: The large agglomeration of silt and clay-sized particles appears to be bound together by minute, blue-stained,
high-cation exchange capacity clay particles

80 April 2017 Civil Engineering
which repeat, with only minor diff erences, at diff erent scales
from very small to very large. Real-life fractal distributions diff er
from true mathematical fractal distributions in that the patterns
tend to show somewhat larger diff erences at diff erent scales,
and there are limited ranges of scale over which the fractal
pattern repeats. Th e signifi cance of identifying such a distribu-
tion pattern is that it is reasonably quick and easy to measure
variations on a small scale, for example on the scale of a test
pit. It is far more time-consuming to measure on a larger scale,
such as that of a major construction site. Tests performed at the
SMRG laboratory suggest that heave potential may have a fractal
distribution on a range of scales large enough to be signifi cant for
design purposes.
Th e range of variability of heave potential is surprisingly
large between diff erent soils, and it is not easy to identify which
soils have large variability and which have small variability
without performing tests aimed at assessing this. Some highly
plastic soils, which could be expected to be very troublesome
from a heave perspective, show very small coeffi cient of varia-
tion (CoV) – of the order 2 or even less. Others show such large
CoVs that there are clearly very real risks in using standard
procedures to assess them. CoVs of 15 to 20 are not uncommon,
and CoVs of more than 30 have been found for some soils. Th e
problem here is that a soils test from one place in a test pit
might give a PI of 12, suggesting a material which should give
few problems for foundations, whereas an apparently identical
sample from a short distance away in the same test pit might
give a PI of 40. Th is aspect of soil property variability is now
being taken into account in all the investigations being under-
taken by the SMRG.
MOVEMENT OF MOISTURE UNDER A LIGHT-STRUCTURED HOUSETh e South African government’s attempts to provide aff ordable,
subsidised housing for the very poor has suff ered from a large
number of structural failures, many due to heaving founda-
tions. Th ese houses are particularly susceptible to damage by
heaving clay, because they are exceptionally light and clay can
lift them very easily. Rational design requires knowledge of the
pattern of heave which will occur under the foundation. Th e
pattern of heave depends on the pattern of moisture movement.
Currently available methods of rational design rely on assump-
tions about the shape of the mound which will develop due to
moisture movement under the foundation. Th e shape assumed
is largely guided by measurements made on test foundations.
Instrumentation has been installed under a government subsidy
house in the Free State where the moisture movement is being
monitored. Th ese measurements suggest that currently accepted
patterns of heave are unlikely to provide good guidance for foun-
dation design. Th e instrumentation used in this investigation has
proved itself convenient and reliable, and it is hoped that it will
be possible to instrument several other light structures in order
to work towards a general modelling procedure. Th is should en-
able reliable predictions of the moisture conditions which need
to be designed for in the general case, which in turn should allow
reliable and economic design of a wide range of raft foundations
with the prospect of fewer failures.
EXPANSIVE POWER OF CLAYTh e SMRG is looking into quick and convenient procedures
to measure the pressures against which clays can expand and
the speed at which this expansion takes place. Th is should give
a better indication of the heave potential of clay than indirect
measures such as the PI and clay fraction, and should overcome
some of the diffi culties which have led to the oedometer losing
favour as a preferred testing tool for expansive clay.
INFO
Prof Elizabeth (Lize) Theron
Research Group Leader: Soil Mechanics
Department of Civil Engineering: CUT
051 507 3646
Photo 5: Research assistant, Alan, with the new conmatic auto consolidation apparatus recently acquired to conduct oedometer tests

Civil Engineering April 2017 81
Karl Terzaghi made the following
statement in a speech: “Students take
to gadgets and neat little mathematical
procedures like ducklings to water”
(Hanson 1984). If one assumes that geo-
technical research essentially produces
such “gadgets and neat little mathematical
procedures”, then there is no shortage of
interest for the modern student. Th is is
evidenced by the exponential increase
in Google Scholar search hits for terms
related to geotechnical engineering
(Figure 1). Terzaghi therefore hoped that
university lecturers would “… educate a
generation of foundation engineers who
retain their common sense and their
sense of proportion in spite of having
been fed a dangerous drug – the drug of
higher learning” (Hanson 1984).
Th e terms “common sense” and “sense
of proportion” are essentially interchange-
able with the term “engineering judge-
ment”, which Vick (2002) defi nes as “a
sense of what is important”. Jennings was
perhaps more to the point when he said
during a lecture, “… engineering judge-
ment involves assembling all the facts you
can, doing all the calculations you can,
and then, on the basis of a good bottle of
brandy and a good night’s sleep, making
your decision” (Caldwell 2015). Jennings’
comment points to the core of judge-
ment, which is the ability to match data,
hypotheses, arguments and evidence,
or simply being able to assign meaning
to a calculated quantity (brandy aside!)
(Vick 2002).
An exercise was recently conducted
at the University of the Witwatersrand’s
School of Civil and Environmental
Engineering to help students gain a “sense
of proportion” for slope stability – a key
component of geotechnical engineering
practice. Th e aim of the exercise was to
wean students from the temptation to fl y
straight for neat formulas that are easy
Charles MacRobert
LecturerSchool of Civil and Environmental Engineering
University of the [email protected]
Are you smarter than a student?
Table 1: Strength scenarios
Undrained strength scenarios
Descriptor Very soft Soft Firm Stiff Very
stiff
Undrained shear strengths, su (kPa)† 15 30 60 120 225
Drained strength scenarios
Descriptor Very loose Loose Medium
dense Dense Very dense
Friction angle, φ’ (°)†‡ 25 30 35 40 45
† Unit weight, γ = 20 kN/m3 used in all cases‡ Cohesion intercept (c) = 0 kPa in all cases
Figure 1: Google Scholar search hits for terms related to geotechnical engineering
Go
og
le S
ch
ola
r h
its
120 000
100 000
80 000
60 000
40 000
20 000
0
Geotechnical Engineering Soil Mechanics
Foundation Engineering
Period
1900 to 1920
1921 to 1940
1941 to 1960
1961 to 1980
1981 to 2000
2001 to 2017
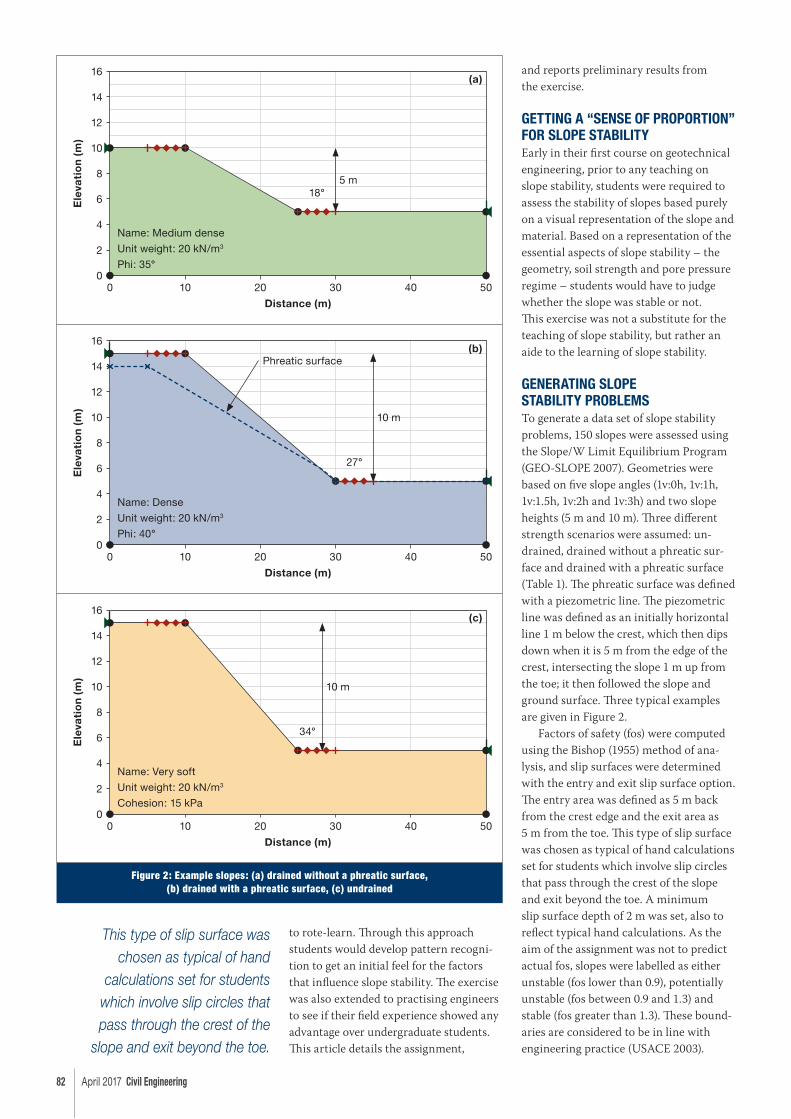
82 April 2017 Civil Engineering
to rote-learn. Th rough this approach
students would develop pattern recogni-
tion to get an initial feel for the factors
that infl uence slope stability. Th e exercise
was also extended to practising engineers
to see if their fi eld experience showed any
advantage over undergraduate students.
Th is article details the assignment,
and reports preliminary results from
the exercise.
GETTING A “SENSE OF PROPORTION” FOR SLOPE STABILITYEarly in their fi rst course on geotechnical
engineering, prior to any teaching on
slope stability, students were required to
assess the stability of slopes based purely
on a visual representation of the slope and
material. Based on a representation of the
essential aspects of slope stability – the
geometry, soil strength and pore pressure
regime – students would have to judge
whether the slope was stable or not.
Th is exercise was not a substitute for the
teaching of slope stability, but rather an
aide to the learning of slope stability.
GENERATING SLOPE STABILITY PROBLEMSTo generate a data set of slope stability
problems, 150 slopes were assessed using
the Slope/W Limit Equilibrium Program
(GEO-SLOPE 2007). Geometries were
based on fi ve slope angles (1v:0h, 1v:1h,
1v:1.5h, 1v:2h and 1v:3h) and two slope
heights (5 m and 10 m). Th ree diff erent
strength scenarios were assumed: un-
drained, drained without a phreatic sur-
face and drained with a phreatic surface
(Table 1). Th e phreatic surface was defi ned
with a piezometric line. Th e piezo metric
line was defi ned as an initially horizontal
line 1 m below the crest, which then dips
down when it is 5 m from the edge of the
crest, intersecting the slope 1 m up from
the toe; it then followed the slope and
ground surface. Th ree typical examples
are given in Figure 2.
Factors of safety (fos) were computed
using the Bishop (1955) method of ana-
lysis, and slip surfaces were determined
with the entry and exit slip surface option.
Th e entry area was defi ned as 5 m back
from the crest edge and the exit area as
5 m from the toe. Th is type of slip surface
was chosen as typical of hand calculations
set for students which involve slip circles
that pass through the crest of the slope
and exit beyond the toe. A minimum
slip surface depth of 2 m was set, also to
refl ect typical hand calculations. As the
aim of the assignment was not to predict
actual fos, slopes were labelled as either
unstable (fos lower than 0.9), potentially
unstable (fos between 0.9 and 1.3) and
stable (fos greater than 1.3). Th ese bound-
aries are considered to be in line with
engineering practice (USACE 2003).
Ele
vati
on
(m)
Ele
vati
on
(m)
Ele
vati
on
(m)
16
16
16
14
14
14
12
12
12
10
10
10
6
6
6
2
2
2
0
0
0
Distance (m)
Distance (m)
Distance (m)
0
0
0
10
10
10
20
20
20
30
30
30
40
40
40
50
50
50
Name: Medium dense
Unit weight: 20 kN/m3
Phi: 35°
Name: Dense
Unit weight: 20 kN/m3
Phi: 40°
Name: Very soft
Unit weight: 20 kN/m3
Cohesion: 15 kPa
5 m
10 m
10 m
18°
27°
34°
8
8
8
Figure 2: Example slopes: (a) drained without a phreatic surface, (b) drained with a phreatic surface, (c) undrained
(a)
4
4
4
(b)
(c)
Phreatic surface
This type of slip surface was chosen as typical of hand
calculations set for students which involve slip circles that pass through the crest of the
slope and exit beyond the toe.
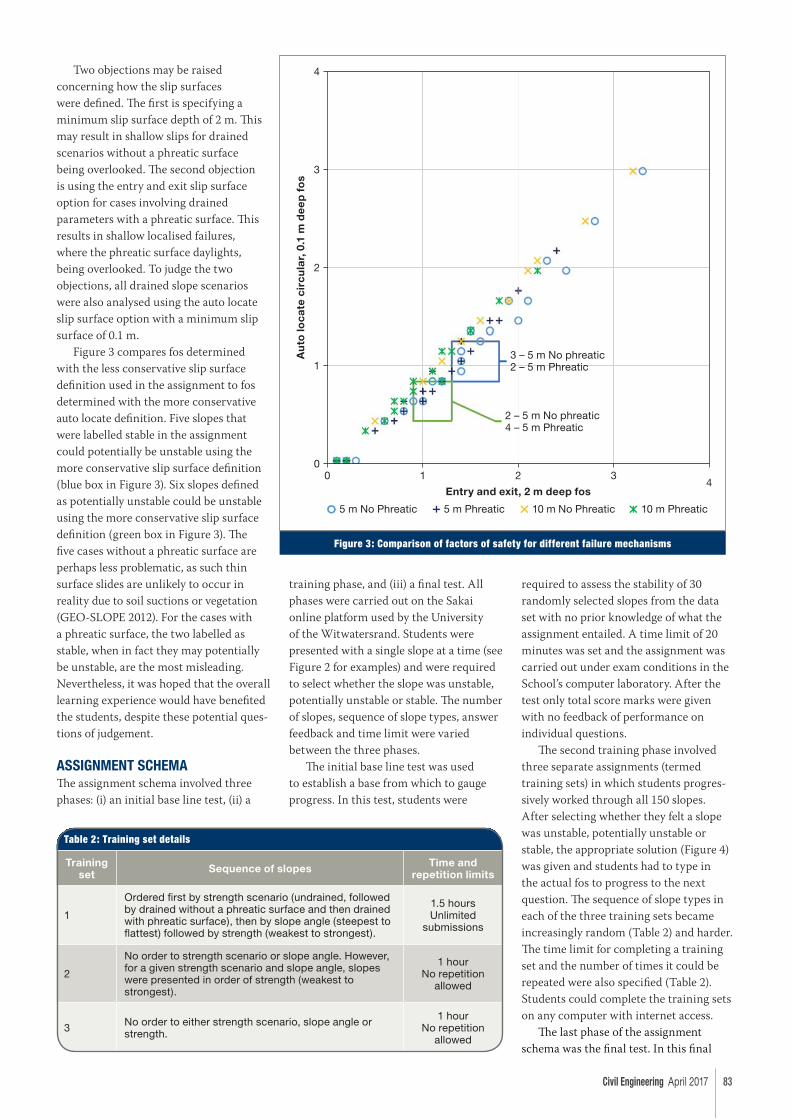
Civil Engineering April 2017 83
Two objections may be raised
concerning how the slip surfaces
were defi ned. Th e fi rst is specifying a
minimum slip surface depth of 2 m. Th is
may result in shallow slips for drained
scenarios without a phreatic surface
being overlooked. Th e second objection
is using the entry and exit slip surface
option for cases involving drained
parameters with a phreatic surface. Th is
results in shallow localised failures,
where the phreatic surface daylights,
being overlooked. To judge the two
objections, all drained slope scenarios
were also analysed using the auto locate
slip surface option with a minimum slip
surface of 0.1 m.
Figure 3 compares fos determined
with the less conservative slip surface
defi nition used in the assignment to fos
determined with the more conservative
auto locate defi nition. Five slopes that
were labelled stable in the assignment
could potentially be unstable using the
more conservative slip surface defi nition
(blue box in Figure 3). Six slopes defi ned
as potentially unstable could be unstable
using the more conservative slip surface
defi nition (green box in Figure 3). Th e
fi ve cases without a phreatic surface are
perhaps less problematic, as such thin
surface slides are unlikely to occur in
reality due to soil suctions or vegetation
(GEO-SLOPE 2012). For the cases with
a phreatic surface, the two labelled as
stable, when in fact they may potentially
be unstable, are the most misleading.
Nevertheless, it was hoped that the overall
learning experience would have benefi ted
the students, despite these potential ques-
tions of judgement.
ASSIGNMENT SCHEMATh e assignment schema involved three
phases: (i) an initial base line test, (ii) a
training phase, and (iii) a fi nal test. All
phases were carried out on the Sakai
online platform used by the University
of the Witwatersrand. Students were
presented with a single slope at a time (see
Figure 2 for examples) and were required
to select whether the slope was unstable,
potentially unstable or stable. Th e number
of slopes, sequence of slope types, answer
feedback and time limit were varied
between the three phases.
Th e initial base line test was used
to establish a base from which to gauge
progress. In this test, students were
required to assess the stability of 30
randomly selected slopes from the data
set with no prior knowledge of what the
assignment entailed. A time limit of 20
minutes was set and the assignment was
carried out under exam conditions in the
School’s computer laboratory. After the
test only total score marks were given
with no feedback of performance on
individual questions.
Th e second training phase involved
three separate assignments (termed
training sets) in which students progres-
sively worked through all 150 slopes.
After selecting whether they felt a slope
was unstable, potentially unstable or
stable, the appropriate solution (Figure 4)
was given and students had to type in
the actual fos to progress to the next
question. Th e sequence of slope types in
each of the three training sets became
increasingly random (Table 2) and harder.
Th e time limit for completing a training
set and the number of times it could be
repeated were also specifi ed (Table 2).
Students could complete the training sets
on any computer with internet access.
Th e last phase of the assignment
schema was the fi nal test. In this fi nal
Au
to lo
cat
e c
ircu
lar,
0.1
m d
ee
p f
os
4
3
2
1
0
Entry and exit, 2 m deep fos4
3210
5 m No Phreatic 5 m Phreatic 10 m No Phreatic 10 m Phreatic
3 – 5 m No phreatic2 – 5 m Phreatic
2 – 5 m No phreatic4 – 5 m Phreatic
Figure 3: Comparison of factors of safety for different failure mechanisms
Table 2: Training set details
Training set Sequence of slopes Time and
repetition limits
1
Ordered fi rst by strength scenario (undrained, followed by drained without a phreatic surface and then drained with phreatic surface), then by slope angle (steepest to fl attest) followed by strength (weakest to strongest).
1.5 hours Unlimited
submissions
2
No order to strength scenario or slope angle. However, for a given strength scenario and slope angle, slopes were presented in order of strength (weakest to strongest).
1 hourNo repetition
allowed
3 No order to either strength scenario, slope angle or strength.
1 hourNo repetition
allowed
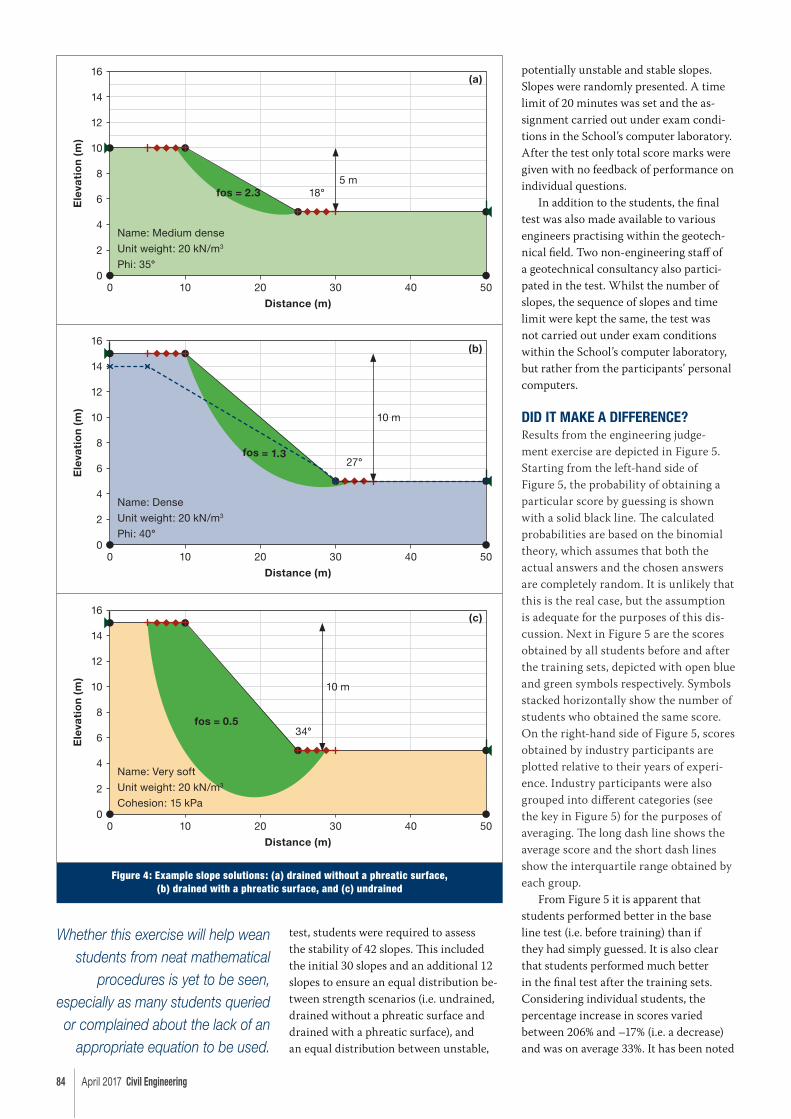
84 April 2017 Civil Engineering
test, students were required to assess
the stability of 42 slopes. Th is included
the initial 30 slopes and an additional 12
slopes to ensure an equal distribution be-
tween strength scenarios (i.e. undrained,
drained without a phreatic surface and
drained with a phreatic surface), and
an equal distribution between unstable,
potentially unstable and stable slopes.
Slopes were randomly presented. A time
limit of 20 minutes was set and the as-
signment carried out under exam condi-
tions in the School’s computer laboratory.
After the test only total score marks were
given with no feedback of performance on
individual questions.
In addition to the students, the fi nal
test was also made available to various
engineers practising within the geotech-
nical fi eld. Two non-engineering staff of
a geotechnical consultancy also partici-
pated in the test. Whilst the number of
slopes, the sequence of slopes and time
limit were kept the same, the test was
not carried out under exam conditions
within the School’s computer laboratory,
but rather from the participants’ personal
computers.
DID IT MAKE A DIFFERENCE?Results from the engineering judge-
ment exercise are depicted in Figure 5.
Starting from the left-hand side of
Figure 5, the probability of obtaining a
particular score by guessing is shown
with a solid black line. Th e calculated
probabilities are based on the binomial
theory, which assumes that both the
actual answers and the chosen answers
are completely random. It is unlikely that
this is the real case, but the assumption
is adequate for the purposes of this dis-
cussion. Next in Figure 5 are the scores
obtained by all students before and after
the training sets, depicted with open blue
and green symbols respectively. Symbols
stacked horizontally show the number of
students who obtained the same score.
On the right-hand side of Figure 5, scores
obtained by industry participants are
plotted relative to their years of experi-
ence. Industry participants were also
grouped into diff erent categories (see
the key in Figure 5) for the purposes of
averaging. Th e long dash line shows the
average score and the short dash lines
show the interquartile range obtained by
each group.
From Figure 5 it is apparent that
students performed better in the base
line test (i.e. before training) than if
they had simply guessed. It is also clear
that students performed much better
in the fi nal test after the training sets.
Considering individual students, the
percentage increase in scores varied
between 206% and –17% (i.e. a decrease)
and was on average 33%. It has been noted
Whether this exercise will help wean students from neat mathematical
procedures is yet to be seen, especially as many students queried or complained about the lack of an
appropriate equation to be used.
Ele
vati
on
(m)
Ele
vati
on
(m)
Ele
vati
on
(m)
16
16
16
14
14
14
12
12
12
10
10
10
6
6
6
2
2
2
0
0
0
Distance (m)
Distance (m)
Distance (m)
0
0
0
10
10
10
20
20
20
30
30
30
40
40
40
50
50
50
Name: Medium dense
Unit weight: 20 kN/m3
Phi: 35°
Name: Dense
Unit weight: 20 kN/m3
Phi: 40°
5 m
10 m
10 m
18°
27°
34°
8
8
8
Figure 4: Example slope solutions: (a) drained without a phreatic surface, (b) drained with a phreatic surface, and (c) undrained
(a)
4
4
4
(b)
(c)
fos = 2.3
fos = 1.3
fos = 0.5
Name: Very soft
Unit weight: 20 kN/m3
Cohesion: 15 kPa
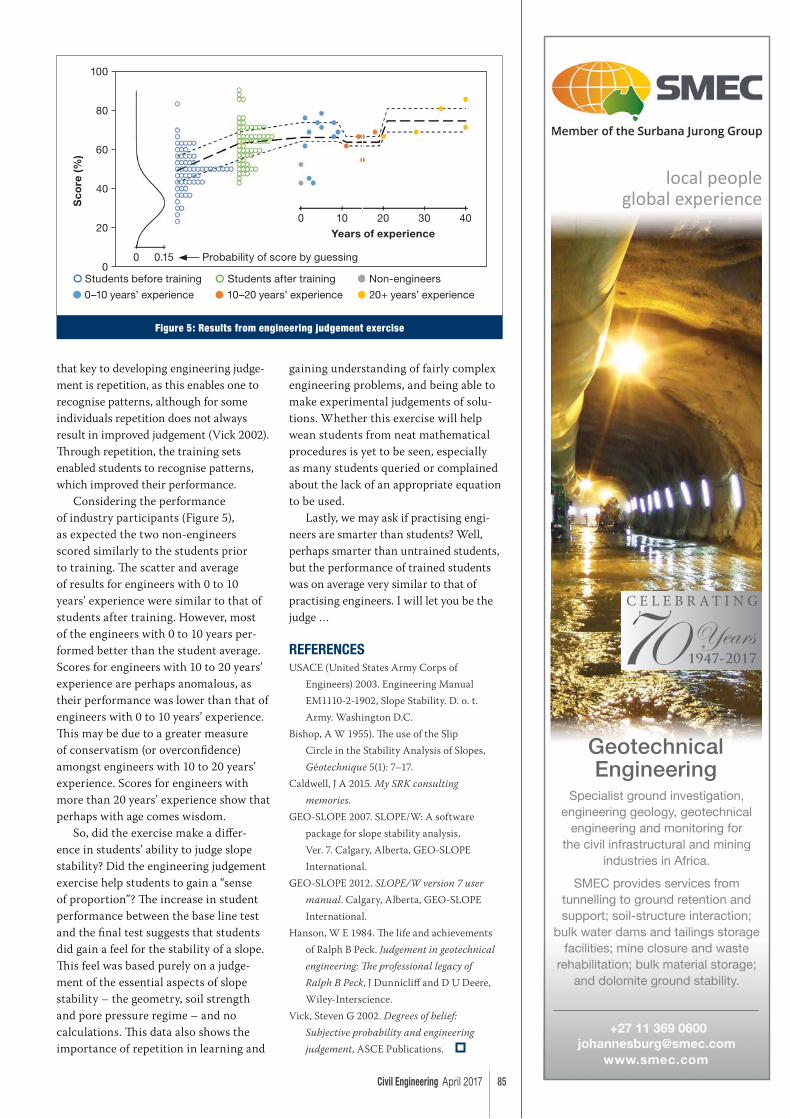
Civil Engineering April 2017 85
that key to developing engineering judge-
ment is repetition, as this enables one to
recognise patterns, although for some
individuals repetition does not always
result in improved judgement (Vick 2002).
Th rough repetition, the training sets
enabled students to recognise patterns,
which improved their performance.
Considering the performance
of industry participants (Figure 5),
as expected the two non-engineers
scored similarly to the students prior
to training. Th e scatter and average
of results for engineers with 0 to 10
years’ experience were similar to that of
students after training. However, most
of the engineers with 0 to 10 years per-
formed better than the student average.
Scores for engineers with 10 to 20 years’
experience are perhaps anomalous, as
their performance was lower than that of
engineers with 0 to 10 years’ experience.
Th is may be due to a greater measure
of conservatism (or overconfi dence)
amongst engineers with 10 to 20 years’
experience. Scores for engineers with
more than 20 years’ experience show that
perhaps with age comes wisdom.
So, did the exercise make a diff er-
ence in students’ ability to judge slope
stability? Did the engineering judgement
exercise help students to gain a “sense
of proportion”? Th e increase in student
performance between the base line test
and the fi nal test suggests that students
did gain a feel for the stability of a slope.
Th is feel was based purely on a judge-
ment of the essential aspects of slope
stability – the geometry, soil strength
and pore pressure regime – and no
calculations. Th is data also shows the
importance of repetition in learning and
gaining understanding of fairly complex
engineering problems, and being able to
make experimental judgements of solu-
tions. Whether this exercise will help
wean students from neat mathematical
procedures is yet to be seen, especially
as many students queried or complained
about the lack of an appropriate equation
to be used.
Lastly, we may ask if practising engi-
neers are smarter than students? Well,
perhaps smarter than untrained students,
but the performance of trained students
was on average very similar to that of
practising engineers. I will let you be the
judge …
REFERENCESUSACE (United States Army Corps of
Engineers) 2003. Engineering Manual
EM1110-2-1902, Slope Stability. D. o. t.
Army. Washington D.C.
Bishop, A W 1955). Th e use of the Slip
Circle in the Stability Analysis of Slopes,
Géotechnique 5(1): 7–17.
Caldwell, J A 2015. My SRK consulting
memories.
GEO-SLOPE 2007. SLOPE/W: A software
package for slope stability analysis,
Ver. 7. Calgary, Alberta, GEO-SLOPE
International.
GEO-SLOPE 2012. SLOPE/W version 7 user
manual. Calgary, Alberta, GEO-SLOPE
International.
Hanson, W E 1984. Th e life and achievements
of Ralph B Peck. Judgement in geotechnical
engineering: Th e professional legacy of
Ralph B Peck, J Dunnicliff and D U Deere,
Wiley-Interscience.
Vick, Steven G 2002. Degrees of belief:
Subjective probability and engineering
judgement, ASCE Publications.
Sco
re (%
)100
80
60
40
20
0Students before training
0–10 years’ experience
Students after training
10–20 years’ experience
Non-engineers
20+ years’ experience
Figure 5: Results from engineering judgement exercise
0 0.15 Probability of score by guessing
0 10 20 30 40
Years of experience

86 April 2017 Civil Engineering
SAICE Training Calendar 2017Course Name Course Dates Location CPD Accreditation
NumberCourse
Presenter Contact
GCC 2015 (Third Edition)
20–21 April 2017 Cape Town
SAICEcon16/01869/19 Benti Czanik [email protected]
15–16 May 2017 Durban
18–19 May 2017 Pietermaritzburg
19–20 June 2017 Port Elizabeth
22–23 June 2017 East London
17–18 July 2017 Pretoria
20–21 July 2017 Polokwane
7–8 September 2017 Midrand
18–19 September 2017 Bloemfontein
9–10 October 2017 Kimberley
GCC 2015 and GCC
2010 Differences
16 August 2017 DurbanSAICEcon16/01890/19 Benti Czanik [email protected]
18 October 2017 Cape Town
Project Management of
Construction Projects
20–21 July 2017 MidrandSAICEcon15/01754/18 Neville Gurry [email protected]
9–10 October 2017 Cape Town
Technical Report Writing
29–30 May 2017 East London
SAICEbus15/01751/18 Les Wiggill [email protected]
31 May–1 June 2017 Port Elizabeth
22–23 May 2017 Polokwane
26–27 June 2017 Nelspruit
27–28 July 2017 Durban
3–4 August 2017 Bloemfontein
28–29 September 2017 Midrand
Structural Steel Design to SANS 10162-1-2005
14 August 2017 Durban
SAICEstr15/01726/18 Greg Parrott [email protected] September 2017 Midrand
23 October 2017 Cape Town
Reinforced Concrete Design to SANS 10100-1-2000
15 August 2017 Durban
SAICEstr15/01727/18 Greg Parrott [email protected] September 2017 Midrand
24 October 2017 Cape Town
Practical Geometric
Design
5–9 June 2017 Cape TownSAICEtr16/01954/19 Tom Mckune [email protected]
6–10 November 2017 Midrand
Business Finances
for Built Environment
Professionals
8–9 June 2017 Midrand
SAICEfi n15/01617/18 Wolf Weidemann [email protected]–10 November 2017 Midrand
Handling Projects in a
Consulting Engineer’s
Practice
5–6 June 2017 Midrand
SAICEproj15/01618/18 Wolf Weidemann [email protected]–7 November 2017 Midrand
Leadership and
Management Principles
and Practice in
Engineering
16–17 August 2017 Midrand SAICEbus15/01784/18 David Ramsay [email protected]
Leadership and
Project Management in
Engineering
6–7 September 2017 Durban
SAICEbus16/01950/19 David Ramsay [email protected]–5 October 2017 Cape Town
Water Law of South
Africa
9–10 May 2017 Durban
SAICEwat16/01955/19Hubert
[email protected]–26 July 2017 Cape Town
19–20 September 2017 Midrand
Earthmoving Equipment,
Technology and
Management for
Civil Engineering and
Infrastructure Projects
17–19 May 2017 Port Elizabeth
SAICEcon15/01840/18Prof Zvi
25–27 October 2017 Midrand

Civil Engineering April 2017 87
SAICE Training Calendar 2017Course Name Course Dates Location CPD Accreditation
NumberCourse
Presenter Contact
The Legal Process
Dealing with
Construction Disputes
30–31 May 2017 Port Elizabeth
SAICEcon16/01956/19
SACPCMP/CPD/15/010
Hubert
1–2 August 2017 Midrand
15–16 August 2017 Cape Town
5–6 September 2017 Durban
7–8 November 2017 Bloemfontein
Sanitary Drainage
Systems for Buildings
18 May 2017 MidrandSAICEwat15/01957/18 Vollie Brink [email protected]
10 October 2017 Midrand
Claims Cast in Concrete 15–16 May 2017 Midrand SAICEcon15/01759/18 Bruce Raath [email protected]
Durability and Repairs of
Concrete Structures14–15 August 2017 Midrand SAICEcon15/01757/18 Bruce Raath [email protected]
Legal Liability
Occupational Health and
Safety Act (OHSA)
Date to be confi rmed TBC
SAICEcon17/02038/20Cecil Townsend
[email protected] to be confi rmed TBC
Date to be confi rmed TBC
Construction
Regulations from a Legal
Perspective
Date to be confi rmed TBC
SAICEcon17/02037/20Cecil Townsend
[email protected] to be confi rmed TBC
Date to be confi rmed TBC
Principles and Practices
of Facility Management
for Engineers
18–19 July 2017 Midrand
SAICEbus17/02042/20
Wynand Dreyer /
Lwandiso
Mgwetyana /
Shane Verster
[email protected]–20 September 2017 Durban
14–15 November 2017 Cape Town
SAICE / South African Road Federation (SARF)Asphalt: An Overview of
Best Practice
30–31 May 2017 Gauteng SAICEtr15/01806/18
SARF15/5001/18J Onraet
[email protected]–20 September 2017 Polokwane
Assessment and
Analysis of Test Data
4–5 July 2017 Bloemfontein SAICEtr15/01805/18
SARF14/0001/17R Berkers
[email protected]–6 October 2017 Cape Town
Stormwater Drainage Date to be confi rmed DurbanSAICEtr15/01808/18
SARF12/0107/15
C Brooker
Matt BrauneAlaster Goyns
Concrete Road Design
and Construction
26 July 2017 Cape TownSAICEtr15/01802/18
CSSA-N-2013-08
B Perrie
Dr P Strauss
[email protected] August 2017 Durban
12 September 2017 Midrand
Traffi c Signals Design
and Optimisation – with
special emphasis on
BRT
19–20 June 2017 GautengSAICEtr15/01803/18
SARF14BRT09/17
Dr John
Sampson
[email protected]–30 August 2017 Bloemfontein
Construction of
G1 Bases19 September 2017 Port Elizabeth
SAICEtr15/01809/18
SARF14/9103/17E Kleyn
SAICE / Mentoring 4 SuccessOne-day Workshop
– Foundations in
Structured Mentoring in
the Workplace
13 June 2017 Gauteng
SAICEbus16/01894/19Philip Marsh /
Celestine [email protected]
12 September 2017 Gauteng
Mentors Masterclass
in Engineering and
Construction
13–14 June 2017 GautengSAICEcon14/01675/17
Philip Marsh /
Celestine [email protected]
12–13 September 2017 Gauteng

88 April 2017 Civil Engineering
If you would like to discuss any topics that you feel are relevant to SAICE members, scan the QR code alongside to access SAICE’s blog.
Candidate AcademyCourse Name Course Dates Location CPD Accreditation
NumberCourse
Presenter Contact
Road to Registration for
Candidate Engineers,
Technologists and
Technicians
6 June 2017 Midrand
CESA-861-05/2019 Allyson Lawless [email protected] June 2017 Upington
24 July 2017 Durban
12 September 2017 Midrand
Pressure Pipeline and
Pump Station Design
and Specifi cation – a
Practical Overview
25–26 May 2017 Midrand
CESA-872-05/2019 Dup van Renen [email protected]–21 September 2017 Cape Town
11–12 October 2017 Midrand
Getting Acquainted with
Geosynthetics in Soil
Reinforcement
16–18 May 2017 Midrand SAICEgeo14/1627/17 Edoardo Zannoni [email protected]
Road to Registration for
Mature Candidates
31 May 2017 Durban
CESA-948-11/2019Peter Coetzee
Stewart [email protected]
27 July 2017 Midrand
20 September 2017 Cape Town
2 November 2017 Durban
23 November 2017 Midrand
Getting Acquainted with
Road Construction and
Maintenance
24–25 July 2017 Midrand CESA-870-05/2019 Theuns Eloff [email protected]
Road to Registration for
Mentors, Supervisors and
HR Practitioners
23 May 2017 Midrand CESA-862-05/2019 Allyson Lawless [email protected]
Getting Acquainted with
General Conditions of
Contract for Construction
Works (GCC 2015)
8–9 June 2017 Midrand
CESA-873-05/2019 Theuns Eloff [email protected]–4 August 2017 Cape Town
14–15 August 2017 Durban
23–24 October 2017 Midrand
Getting Acquainted with
Sewer Design
13–14 June 2017 Midrand
CESA-871-05/2019 Peter Coetzee [email protected]–7 September 2017 Cape Town
21–22 November 2017 Durban
Getting Acquainted
with Basic Contract
Administration and
Quality Control
17–18 August 2017 Midrand CESA-864-05/2019 Theuns Eloff [email protected]
In-house courses are available. To arrange, please contact:
Cheryl-Lee Williams ([email protected]) or Dawn Hermanus ([email protected]) on 011 805 5947.
For Candidate Academy in-house courses, please contact:
Dawn Hermanus ([email protected]) on 011 805 5947 or Lizélle du Preez ([email protected]) on 011 476 4100.
Address: Office 0400, Standard Plaza Building, 440 Hilda Street, Hatfield, Pretoria, 0083
Tel: (011) 805 6742 • Email: [email protected] • Website: www.cma.org.za
IF YOU THINK PRECAST CONCRETE,
THINK CMA PRODUCER MEMBERS.
CO
NC
RE
TE
M
ANUFACTURERS A
SS
OC
IAT
ION
Q
ualit y cast in concrete

www.civildesigner.com
Integrating into your
BIM workflow via
intelligent IFC
data formats
The completely integrated, fit for purpose
infrastructure design system
CIVIL DESIGNER 8.0
Related Documents


