SDMS Document ID 1022097 6.0 UPPER ARKANSAS RIVER BASIN DOWNSTREAM OF THE 11-MILE REACH Consistent with the Work Plan and the Scope of Work, this chapter reviews the existing literature and data sources in order to examine the adequacy of information available for assessing potential natural resource injuries for the upper Arkansas River downstream of the 11-mile reach (Downstream Area). The Downstream Area is defined as the 500-year floodplain below the 11-mile reach, beginning with the confluence of Two-Bit Gulch and continuing for 125 miles to and including Pueblo Reservoir (Figure 6- 1). To accomplish the above-stated objectives, the consulting team developed the following questions about the data in each resource category that would ultimately allow them to make a determination about whether more data might be necessary: • How much data are available, including spatial and temporal coverages? • Is additional information needed in order to make a determination about (1) injury characterization, and/or (2) restoration planning? • If yes to the above question, then what are the types, amounts, and costs of data required to make a determination about injury characterization and restoration planning? The information/data were compiled, reviewed, and evaluated in detail with these questions in mind. Responses to the above questions reflect the consensus views of the consulting team and are based upon the information reviewed, as well as on the experience of the team. Using such an approach it is possible to evaluate whether more data might be of use in making informed decisions about the Downstream Area. In assessing if more data are needed, the consulting team considered the formal definitions of what constitutes injury under the Department of Interior Natural Resource Damage Assessment regulations. In consideration of the high level of review that had occurred, the MOU Parties requested that this chapter also present a characterization of the conditions of the Downstream Area resources and an identification of any injuries that may be attributable to mine-waste. The characterization follows the approach utilized for the 11-mile reach. Given this additional request, the text has been divided to provide an overview of the levels of information available and the relevance of that information to determining injury. This section is followed by a more detailed discussion of that information as it relates to a characterization of injury. A matrix summarizing findings with regard to injury for the Downstream Area is presented at the end of this chapter. J:\OI0004\Task 3 - SCR\SCR_currentl.doc 6-1

Welcome message from author
This document is posted to help you gain knowledge. Please leave a comment to let me know what you think about it! Share it to your friends and learn new things together.
Transcript
SDMS Document ID
1022097
6.0 UPPER ARKANSAS RIVER BASIN DOWNSTREAM OF THE 11-MILE REACH
Consistent with the Work Plan and the Scope of Work, this chapter reviews the existing literature
and data sources in order to examine the adequacy of information available for assessing potential natural
resource injuries for the upper Arkansas River downstream of the 11-mile reach (Downstream Area). The
Downstream Area is defined as the 500-year floodplain below the 11-mile reach, beginning with the
confluence of Two-Bit Gulch and continuing for 125 miles to and including Pueblo Reservoir (Figure 6-
1).
To accomplish the above-stated objectives, the consulting team developed the following
questions about the data in each resource category that would ultimately allow them to make a
determination about whether more data might be necessary:
• How much data are available, including spatial and temporal coverages?
• Is additional information needed in order to make a determination about (1) injury
characterization, and/or (2) restoration planning?
• If yes to the above question, then what are the types, amounts, and costs of data required
to make a determination about injury characterization and restoration planning?
The information/data were compiled, reviewed, and evaluated in detail with these questions in
mind. Responses to the above questions reflect the consensus views of the consulting team and are based
upon the information reviewed, as well as on the experience of the team. Using such an approach it is
possible to evaluate whether more data might be of use in making informed decisions about the
Downstream Area. In assessing if more data are needed, the consulting team considered the formal
definitions of what constitutes injury under the Department of Interior Natural Resource Damage
Assessment regulations.
In consideration of the high level of review that had occurred, the MOU Parties requested that
this chapter also present a characterization of the conditions of the Downstream Area resources and an
identification of any injuries that may be attributable to mine-waste. The characterization follows the
approach utilized for the 11-mile reach. Given this additional request, the text has been divided to
provide an overview of the levels of information available and the relevance of that information to
determining injury. This section is followed by a more detailed discussion of that information as it relates
to a characterization of injury. A matrix summarizing findings with regard to injury for the Downstream
Area is presented at the end of this chapter.
J:\OI0004\Task 3 - SCR\SCR_currentl.doc 6-1
Based on the characterization for the 11-mile reach, surface water was identified as the
fundamental contaminant transport mechanism and exposure pathway for the Downstream Area. The
Downstream Area of the Arkansas River undergoes significant physical and chemical changes from the
bottom of the 11-mile reach to Pueblo Reservoir. The obvious impacts associated with deposition of
historic mine-waste, diminish over this same distance. The river system is influenced by changes in
climate, geology, land-use and resource management. These changes affect water quality characteristics,
flow regimes, and river morphology. In turn, the biological communities and their condition can be
different based on these characteristics alone, making it difficult to determine what, if any, natural
resource injury has occurred as a result of exposure to metals. There are also major changes in the
geomorphology of the river that could influence how mine-wastes are distributed.
6.1 Adequacy of Available Information
The following generally describes the nature and extent of information available to characterize
conditions and potential injuries for the natural resources comprising the Downstream Area. The range of
information for each resource category was reviewed relative to the Work Plan objectives and specific
questions discussed above. Additional supporting information (including specific study/data references)
is presented on a reach-by-reach basis in Section 6.2 in conjunction with a characterization of injury.
Surface Water Resources
Review of the literature and the electronically compiled data shows that a substantial amount of
surface water quality data are available for most reaches in the Downstream Area. The data were
determined to be sufficient to characterize the level of natural resource injury. The review indicates that
the data are well distributed spatially and temporally, including before and after treatment at the Yak
Tunnel and LMDT. Most importantly, sufficient data exists to assess conditions of the surface water
within the last few years. Data are available from both the seasonal high and low flow periods at many of
the reaches. While the data over the 125-mile section of the Downstream Area are not as extensive as
those for the 11-mile reach, the level of resolution provided is consistent with major changes in flow rates
and setting.
Available historical and recent data were compared to Colorado's TVSs for the Arkansas River.
This comparison showed exceedances of the TVSs for cadmium, copper, lead, and zinc within the
Downstream Area, which defines a natural resource injury based on the regulations. On average,
J:\010004\Task 3 - SCR\SCR_currem 1 .doc 6-2
concentrations of dissolved metals decrease from Leadville to Pueblo Reservoir, with the majority of TVS
exceedances occurring primarily upstream of Lake Creek and prior to the treatment of mine drainage in
the Leadville area. It is evident that median concentrations of most metals have decreased significantly
since water treatment began. More recent exceedances of TVSs are infrequent and of a lower magnitude
than historical exceedances. Comparison of the recent data against the State's TVSs provides a
conservative estimate of the potential for aquatic community-level effects. This comparison to the TVSs
along with current biological conditions and further comparision to Reach 0, suggests that acute toxicity
is not occurring in the 125-mile Downstream Area. Based on review of both sediment and water quality
studies, it appears that the most significant source of metals (primarily cadmium, copper, iron, lead,
manganese, and zinc) to the Upper Arkansas River has been, and continues to be, the Leadville Mining
District. Current levels of dissolved metals in the Downstream Area can primarily be related to water
quality in California Gulch.
As stated above, the record of water quality data spans the dynamics of high and low flows across
several years. Some reaches contain more data than others. Comparisons between data sets for upstream
and downstream locations were conducted to observe if changes in water quality occurred within
intermediate reaches. Given the amount of data, as well as its spatial and temporal resolution, it is not
expected that additional surface water quality data would provide any new or different information than
those already available for the purpose of injury determination. Likewise, additional information for
water quality is not expected to provide new thoughts on how restoration might need to proceed. Based
on this evaluation, no additional surface water quality data are recommended for collection to assess
injury or for restoration planning in the Downstream Area.
Sediment Resources
Spatially, the coverage of sediment quality data for the 125-mile Downstream Area is adequate
considering the large distance. Kimball et al. (1995) sampled twice (fall 1988 and spring 1989) at 12 sites
from downstream of the 11-mile reach to just upstream of Canon City. Church etal. (1994) collected
several sediment quality samples during February 1994, including 15 samples from the end of the 11-mile
reach to Pueblo Reservoir. McCulley Frick and Oilman, Inc. (1990) collected 10 samples on one
occasion during April 1989, ranging from the bottom of the 11-mile reach to Florence. Ruse (2000)
sampled one time during fall 1989, sampling 11 sites from the bottom of the 11-mile reach to Portland.
Based on the review of available sediment quality data, the locations where samples were collected
suggest that spatially, a reasonable amount of sediment quality data are available, while temporally, the
amount of data are more limited. More recent sediment quality data (e.g., within the last two years) were
not found. However, the temporal span of the data brackets the period before and after treatment at the
J:\010004\Task 3 - SCR\SCR_currentl.doc 6-3
Yak Tunnel and LMDT, which has been shown to be an important transition in the basin relative to
changes in metals concentrations (Figure 6-2). Generally, sediment metal concentrations show decreasing
trends from upstream to downstream. With respect to Reach 0, concentrations are elevated for most of
the metals to about Reach 6 and from there through Reaches 7 and 8, only zinc is elevated above those
concentrations in Reach 0. By Reach 9, all four metals concentrations in sediments are lower than those
observed in Reach 0.
Kimball et al. (1995) data provide evidence that the current sediment quality is largely a function
of colloidal deposition and resuspension and can therefore be tied to current water quality. California
Gulch is currently the largest source of metals, and sources in that drainage have not yet been fully
remediated. Clearly, mine-wastes have been transported to and within the river to varying downstream
locations, but most all of these (i.e., identifiable deposits) are located within the 11-mile reach (URS
1998). However, overall (and particularly above Canon City), the Arkansas River is a low sediment-
transport system.
Evaluation of available sediment data in terms of their usefulness for defining injury is not as
straightforward as for surface water. Although the regulations do not provide numerical criteria, sediment
concentrations found in the control area (Reach 0) provide a point of reference. However, in a setting like
the Arkansas River, consideration must be given to the fact that large portions of the system with the
greatest potential for elevated sediment concentrations are of high gradient and have limited capacity to
store sediment; therefore, the .importance of this pathway is limited. The work of Kimball et al. (1995)
and others is another consideration when evaluating the need for additional sediment data. It is important
to recognize that future sediment contamination is more likely a function of water quality rather than
erosion of any mine-wastes within and below the 11-mile reach. Releases of metals from the California
Gulch Superfund Site will have the greatest influence on future sediment concentrations.
Correspondingly, water quality monitoring within the 11-mile reach would provide the greatest level of
information on downstream sediment injury potential, as well as on the need for restoration. Given the
present amount of information and its utility in assessing injury and planning for restoration, no additional
sediment quality data are needed.
Groundwater Resources
Limited data were found in the open literature and in the compiled electronic database. Thus, the
spatial and temporal coverages of data are sparse. The Safe Drinking Water Information System
(SDWIS) database contains information that States must report to USEPA as required by the Safe
Drinking Water Act. These requirements take three forms: maximum contaminant levels (the maximum
J:\010004\Task 3 - SCR\SCR_currentl.doc 6-4
level of a specific contaminant that can occur in drinking water), treatment techniques (specific methods
facilities must follow to remove certain contaminants), and monitoring and reporting requirements
(schedules utilities must follow to report testing results). States report any violations of these three types
to USEPA.
Based on knowledge of the hydrology of the 11-mile reach, the lack of significant mine-waste
deposits downstream, and the fact that drinking water supply wells within the 11-mile reach meet MCLs,
groundwater is not a concern for injury in the Downstream Area. The SDWIS database along with
information from the 11-mile reach confirms that groundwater resources have not been injured.
Groundwater data may also be available from other regulatory programs, such as the CERCLA smelter
sites in Salida and Canon City. However, it is not expected that these or any other additional data are
needed for injury determination or restoration planning.
Geologic Resources
The BLM sampled soils in the Downstream Area in July 2000 along transects at 18 separate
locations (Figure 6-3). Total metal concentrations were determined for lead and zinc at all sites and for
cadmium and copper for a subset of these sites. Plant-available metal concentrations were not determined
for soils in the Downstream Area. However, total metal concentration is below levels of concern. The
BLM soils data are limited spatially, since only 18 locations were sampled along 125 miles of river
between Two-Bit Gulch and Pueblo Reservoir. However, it is unlikely that additional soil sampling
would yield different results. Additional soils data are therefore not needed for injury assessment or
restoration planning, except where mine-waste deposits occur in Reach 5.
Vegetation
There are no spatial or temporal data for vegetation. For similar reasons as stated for wildlife
below, there is no realistic concern about injury to this resource. The limited areas for recent deposition
of mine-waste indicate that the potential for storage of metals-enriched soils/sediments is low, hence no
significant pathway for metals transfer to vegetation exists. Additional information is not required for
injury determination or restoration planning.
Benthic Macroinvertebrates
There are no individual macroinvertebrate surveys for the Downstream Area that are both
spatially and temporally comprehensive. The available studies either focus on long term data from a
J:\010004\Task 3 - SCR\SCR_current 1 .doc 6-5
specific station (e.g., station AR-8 in Buena Vista) or were conducted at numerous locations over a
limited time period. Long term monitoring at station AR-8 (Reach 6) near Buena Vista showed dramatic
improvements in benthic macroinvertebrate communities over the past 10 years, corresponding to
significant reductions in metal concentrations (Clements et al. 2002). These data suggest that injury to
benthic macroinvertebrates occurred in the past, but that the system has since recovered with
improvements in water quality. Recent surveys show that community composition and abundance of
sensitive species in Reach 6 are similar to those observed in Reach 0, the control area. Because this
station is located at the upper end of the Downstream Area, it is unlikely that additional monitoring would
detect significant impacts further downstream.
Although several spatially extensive surveys conducted in the Downstream Area showed
differences in community composition as far downstream as Salida, these differences are unlikely due to
metals exposure. Compared to the 11-mile reach, spatially and temporally extensive benthic
macroinvertebrate data in the Downstream Area are limited. Despite these limited data, additional
benthic macroinvertebrate monitoring in the Downstream Area is not required to further define injury or
plan for restoration.
Fish
There are fish population data for various sites in the Downstream Area dating back to 1981, but
not all stations have been sampled consistently, making it difficult to evaluate temporal trends. The most
consistent fish population data have been collected at the Wellsville station below Salida. Evaluation of
population data for the Wellsville station does not show statistically significant differences in total
biomass relative to control values both "before" and "after" water treatment. However, comparisons
among age classes were not done, and further analyses of existing data may be warranted. Based on the
improvements seen in water quality and the potentially confounding influence of regulated flows and
other factors, collecting additional fish population or community data in the Downstream Area would not
be helpful for injury characterization or restoration planning. A general understanding of the ongoing
potential for injury to fish can be derived from comparisons of water quality data to toxicity values from
the published literature. From a restoration perspective, it is quite clear that addressing the large issues of
source control in California Gulch would have the largest potential for restoration benefits in the
Downstream Area.
J:\010004\Task 3 - SCR\SCR_currentl.doc 6-6
Wildlife Resources
Assessment of the existing literature revealed that two bird studies have been conducted for the
Downstream Area. Both studies focused on evaluating metals exposure and potential injury. The tree
swallow study data shows that the birds are being exposed to lead and that ALAD suppression is
occurring, but not to the extent of defined injury. Based on ALAD suppression, injury was documented
in American dippers from Balltown to Granite. At all other sites downstream of Granite, ALAD
suppression is occurring but not to the extent of defined injury.
At present, the only substantive wildlife data available are for birds. Spatially, there is enough
data to define the effect of metals on birds in the Downstream Area. There are one to three years worth of
data, which are expected to be adequate for characterizing current injuries. Based on more detailed
sampling within and above the 11-mile reach, injury to the most sensitive species such as dippers can be
linked to water quality. Additional exposure data would not be more helpful for injury determination or
restoration planning.
No mammalian toxicological data are presently available in the Downstream Area. In addition,
very little data exists that could be used to determine possible exposure and the potential for injures using
a risk-based approach (i.e., soils and vegetation). Additional data are not necessary to assess potential
injury due to the fact that potential for injury in the 11-mile reach is linked to the presence of mine-waste
deposits. The Downstream Area has a lower potential for injury to wildlife resources based on its
distance from the primary source area in Leadville, limited areas of deposition, and diminishing
concentrations in media of concern.
There are many sources of information that are relevant to characterizing the past and present
level of injury in the Downstream Area. As would be expected, the spatial and temporal coverages of the
data vary between resources. Knowledge gained through a detailed characterization of the 11-mile reach
and upstream areas helps to put the question of injury in the Downstream Area into perspective.
Available information for the 11-mile reach indicates that, other than in discrete areas where relatively
undiluted mine-waste deposits have resulted in high floodplain soil/sediment metals concentrations, the
primary potential for injury is to the aquatic system. Absence of significant deposits of mine-waste in the
Downstream Area limits the potential for injury beyond the aquatic system. Available information
indicates that present injuries within the aquatic system would most likely be linked to metals emanating
from the California Gulch Superfund Site and that dilution and attenuation greatly limit the potential for
injury below the confluence with Lake Creek. Therefore, although additional detailed studies in the
Downstream Area may provide some refinement as to the potential for injury, such information would not
J:\010004\Task 3 - SCR\SCR_currentl.doc 6-7
enhance the level of understanding and would not be useful for restoration planning. For these reasons,
additional studies are not recommended. This view is also based on the practical perspective that for such
studies to be of any additional value, they would have to be conducted at a very fine spatial scale over
many years. Even then the ability to place such study results into the overall context of basin conditions
is questionable. The relationship of California Gulch to downstream water quality makes consideration of
long-term monitoring of water quality, a more insightful approach than near-term efforts focused on
defining the potential for a specific injury.
6.2 Characterization of Injury
This section presents a summary of the information available to characterize injury within the
Downstream Area. A determination of injury is first discussed by resource followed by an evaluation of
injury for that resource. Specific studies discussed in this chapter are cited throughout and a bibliography
that provides a complete listing of relevant information is included as Appendix A, Appendix Ci and
Appendix C^.
Approach
This characterization was conducted using the available literature as well as the composite of
chemical and physical data to assess the nature and extent of contamination. Correspondingly, this
characterization builds upon the detailed base of knowledge developed for the 11-mile reach. In terms of
injury to natural resources, information on downstream conditions is considered in conjunction with
findings of injury and the cause of any injuries within the 11-mile reach. Within the 11-mile reach, the
primary cause of any identified injuries are poor water quality attributable to metals from upstream (e.g.,
California Gulch) and fluvial mine-waste deposits. These causes diminish with distance downstream
within and below the 11-mile reach. Consistent with these findings, the primary focus for the
Downstream Area is on water quality and the presence of fluvial mine-waste deposits. These two
resource characteristics provide a fundamental means of assessing the potential for downstream injury.
However, as discussed in the following text, information on related biological resources are considered.
Given the differences in setting, Pueblo Reservoir is discussed separately.
In order to better understand the various environmental settings and flow regimes along the length
of the UARB and as a means of recognizing the areas with larger potential for injury, the geomorphology
of the river was characterized. The characterization focuses on identifying changes in stream flow and
the morphology types that have the highest potential for storing sediments and mine-wastes (i.e.,
J:\OI0004\Task 3 - SCR\SCR_currentl.doc 6-8
significant depositional areas). This approach is based on the findings for the 11-mile reach, where
metals loading from upstream sources and fluvial mine-waste deposits were identified as the primary
pathway for injury. At the same time, the existing literature and supporting data were evaluated by
natural resource category, paying special attention to water quality and aquatic biological resources.
To better characterize surface water quality (cadmium, copper, lead, and zinc concentrations) in
the Downstream Area, the river was divided into reaches based on major changes in hydrology and
geomorphology (Figure 6-1). Based on these attributes, the following reaches were defined:
• Reach 5 - Reach 5 extends from the confluence of Two-Bit Gulch, which is the
downstream limit of the 11-mile reach, to the confluence of Lake Creek. Lake Creek
delivers a large amount of trans-basin water to the Arkansas River. The river in Reach 5is in a narrow valley that is flanked by high terraces.
• Reach 6 - Reach 6 extends from the junction of Lake Creek to the junction of ChalkCreek at the upstream extent of Browns Canyon. The upstream limit of this reach isdetermined by the large discharge contributions from Lake Creek, and the downstreamlimit is based upon the geomorphic change from open valley with terraces to a canyon.
From the Lake Creek confluence to Princeton (Harvard Lakes quadrangle), the river is ina canyon, but from Princeton to Chalk Creek, it flows in an open valley with terraces.
• Reach 7 - Reach 7 extends from Chalk Creek to the junction of the South Fork ArkansasRiver. The upstream limit is determined by the geomorphic control of Browns Canyon,and the downstream limit is determined by the discharge contribution of South ForkArkansas River. The river is in a deep canyon (Browns Canyon) from about 2 milessouth of Chalk Creek to about Browns Canyon (Salida West quadrangle), where it is
confined by terraces to about Squaw Creek, where it then flows in an open valley with afloodplain to Salida and to the confluence of South Fork Arkansas River.
• Reach 8 - Reach 8 extends from the confluence of the South Fork Arkansas River toCanon City. The reach is primarily a canyon composed of the Arkansas River and Royal
Gorge, but the valley widens at Wellsville, between Howard and Coaldale and atParkdale. In the wide sections, the river is flanked by terraces.
• Reach 9 - Reach 9 extends from Canon City to Pueblo Reservoir. This reach ischaracterized by an open valley with a floodplain. The change from canyon to openvalley at Canon City is dramatic.
• Reach 10 -Pueblo Reservoir including the Arkansas River downstream of the reservoir
to approximately 1.5 miles downstream of Pueblo Dam. (This additional area was
J:\010004\Task 3 - SCR\SCR_currentl.doc 6-9
included due to the limited amount of data found for the reservoir and to assess if metals
appear to be transported from the reservoir.)
Using the surface water data compiled into the database and the reaches described above,
summary statistics and graphics were developed to aid in assessing the temporal and spatial trends.
6.3 Geomorphology
The morphology of the Downstream Area is highly variable over it's 125-mile length. However,
based upon study of U.S. Geological Survey (USGS) topographic maps, soil survey maps (Wheeler et al.
1995; Fletcher 1975), and field observations, it was possible to identify different valley types for which a
characterization could be made of the potential for mine-waste storage in each. The river flows through
three diverse valley types:
1. Canyons (Browns Canyon, Arkansas River Canyon, and Royal Gorge);
2. Open valleys with high terraces (north and south of Buena Vista); and
3. Open valleys with floodplains (downstream of Canon City) (the 11-mile reach is of this
type).
Available information and field observations indicate the following:
• Canyons: Resistant bedrock is the dominant factor controlling channel characteristics in
the canyons. Nevertheless, the channel may be flanked by a narrow high terrace and a
low discontinuous bench, and vegetated islands may be present in the channel. However,
the confined channel is an efficient conduit of sand-size and finer sediment, and the
potential for mine-waste storage is low. Of the approximately 125 miles of the
Downstream Area, about 47 miles or 38 percent of linear channel is canyon-bound.
Canyon valley types were identified in the Downstream Area at the following locations:
- Granite Quadrangle, downstream from 1 mile below Kobe;
- South Peak Quadrangle;
- Nathrop Quadrangle, Browns Canyon Quadrangle;
- Salida East Quadrangle, from Cleora downstream;
Howard Quadrangle, downstream to T49N, R10E, Sec 34;
- Cotopaxi Quadrangle, downstream from Gobblers Knob;
Arkansas Mountain Quadrangle;
J:\010004\Task3- SCR\SCR_currentl.doc 6-10
- Echo Quadrangle, downstream from 1 mile below Texas Creek;
- Mclntyre Hills Quadrangle, downstream to Parkdale Siding; and
- Royal Gorge Quadrangle.
• Open Valleys with High Terraces: Canyons lead to broad basins, which contain alluvium
that forms high terraces that confine the river. As in the canyons, discontinuous benches
and islands formed of modern alluvium exist. However, the confined channel is an
efficient conduit of sand and finer sediments, and the potential for mine-waste storage is
low. Of the approximately 125 miles of channel in the Downstream Area, about 45 miles
or 36 percent of linear channel is confined by high terraces. Locations where high
terraces are present are identified below:
- Harvard Lake Quadrangle;
- Buena Vista West Quadrangle;
- Buena Vista East Quadrangle, downstream to T145, R78W, Sec 33;
- Nathrop Quadrangle, downstream to Browns Canyon;
Salida West Quadrangle, downstream to T50N, R8E, Sec 22;
- Salida East Quadrangle, downstream to Cleora;
Howard Quadrangle, downstream from T49N R10E Sec 34;
Coaldale Quadrangle;
- Cotopaxi to Cobblers Knob Quadrangle;
- Echo Quadrangle, downstream to 1 mile below Texas Creek;
- Mclntyre Hills Quadrangle, downstream of Parkdale Siding; and
- Royal Gorge Quadrangle, downstream to Parkdale.
• Open Valleys with Floodplains: In open valleys, where the channel has a floodplain and
the potential for mine-waste storage is high, the channel is adjustable and capable of
shifting laterally. Locations where floodplains are present are identified below:
Buena Vista East Quadrangle, T14S, R78W, Sees. 33, 34 and T15S, R78W, Sees.
4,3;
Salida West Quadrangle from T50N, R8E, Sec. 22 downstream;
- Canon City Quadrangle;
- Florence Quadrangle;
Pierce Gulch Quadrangle; and
- Hobson Quadrangle.
As described above, of the approximately 125 miles of channel in the Downstream Area, about 33 miles
or 26 percent of the distance has a potential for mine-waste storage. These areas include:
J:\010004\Task 3 - SCR\SCR_currentl.doc 6-11
• A 1.6-mile reach downstream of Buena Vista;• A 5-mile reach upstream of Salida; and• Downstream of Canon City into Pueblo Reservoir.
The potential for mine-waste storage is greatest in the lower downstream portion of the 125-mile
reach, including Pueblo Reservoir. With the exception of approximately 1.6 miles of river downstream of
Buena Vista and approximately 5 miles of river upstream of Salida, mine-wastes released from the 11-
mile reach are most likely flushed through the canyon- and terrace-bound reaches of the river to the wide,
alluvial reach downstream of Canon City and to Pueblo Reservoir.
The significant areas of potential sediment (and mine-waste) storage are as follows (Figure 6-4):
Buena Vista East Quadrangle (Figure 6-5): T14S, R78W, Sec. 33; T15S, R78W, Sees. 3,
4 (Champion SWA - Cogan Property).
• Salida West Quadrangle (Figure 6-6): T50N, R8E, parts of Sees. 22, 23, 26, 25, 36, 31,32 (From Spiral Drive upstream for approximately 5 miles).
• Canon City Quadrangle (Figure 6-7): A narrow floodplain flanks the channel from
Canon City to the east.
• Florence Quadrangle (Figure 6-8): A narrow floodplain flanks the channel through
T19S, R69W, Sec. 9, 16, 15, 14. In Section 13, the floodplain widens significantly, and itcontinues to be wide across the Pierce Gulch and Hobson Quadrangles to the Pueblo
Reservoir.
6.4 Surface Water
According to NRDA regulations (43 CFR 11), surface water, suspended sediments, and bed,
bank, and shoreline sediments comprise the surface water natural resource. Although part of the surface
water resource, instream sediments are discussed separately. To the extent possible, water quality data
from the individual studies cited are included in the electronic database and are combined with the data
from other sources (e.g., STORET, CDPHE, and other state and regional data sources) to assess the
spatial attributes and temporal dynamics of the resource.
Summary statistics were calculated and are summarized in Tables 6-1 through 6-6 for dissolved
and total metals to assess the spatial and temporal trends of metals in Arkansas River surface waters.
J:\010004\Task3- SCR\SCR_currentl.doc 6-12
These summary statistics are divided by metal, form of the metal, reach, and flow condition. Metal
concentrations measured during Period 3 were used to assess recent conditions as well as to evaluate
injury potential to surface waters due to exceedances of TVSs. Based on this assessment, the following
trends emerged:
• When data from all time periods for a metal are considered, it appears that seasonal high
flows are accompanied by higher concentrations of metals in Reaches 5 to 9 than those
observed during low flows. When data from all time periods are considered, dissolvedcadmium, copper, and zinc show a steady decline in concentration from upstream to
downstream to Reach 8, followed by an increase in Reach 9. Dissolved lead decreasesfrom Reach 5 to 6, then it gradually increases from Reach 6 to 9.
• In contrast, when only Period 3 (1992-present) data are considered, all high-flow mean
concentrations show a steady decrease in concentration from Reaches 5 to 9.
• Based on the mean concentrations of metals, the frequency and magnitude of TVS
exceedances for all metals generally declines in the Downstream Area reaches when
compared to those exceedances observed in Reaches 1 to 4. No samples for any metalexceed their respective TVSs in Reach 9 upstream of Pueblo Reservoir during Period 3
(1992 to present) and, likewise, no exceedances occurred in the Reservoir after 1992.
Thus, it appears that the combination of attenuation, dilution due to tributary inflows,increased hardness that increases TVSs, and treatment at the Yak Tunnel and LMDT
have all positively affected the Upper Arkansas River.
6.4.1 Supporting Information
The U.S. Geological Survey conducted a water quality assessment of the Arkansas River Basin
that described spatial and temporal variations in water quality during the period 1990-1993 (Ortiz et al.
1998). The data for this assessment are reported separately in Dash and Ortiz (1996). They collected
water quality data between the LMDT and Pueblo Reservoir at 10 mainstem sites, 12 tributaries, and 2
mine drainage sites. Samples were analyzed for dissolved solids, major ions, trace elements, nutrients,
and suspended sediments. Based on previous water quality data, they selected cadmium, copper, iron,
lead, manganese, and zinc as the primary trace elements of concern. In addition, water samples collected
five times at four sites were analyzed for arsenic, chromium, mercury, nickel, selenium, and silver. The
investigators reported that drainage from abandoned mines and mine tailings was the primary cause of
elevated trace element concentrations in the Upper Arkansas River Basin. They concluded that dissolved
trace element concentrations in the upper basin generally decreased from Leadville to Portland.
Following the completion of the water treatment facilities at the LMDT and Yak Tunnel, a statistically
J:\010004\Task 3 - SCR\SCR_currentl .doc 6-13
significant decrease in concentrations of cadmium, copper, manganese, and zinc was observed at several
downstream mainstem sites. Tributaries sampled did not provide significant metals loads to the Arkansas
River. Water quality standards for trace elements were exceeded in several water samples, but the
majority of exceedances occurred prior to water treatment. Other studies reviewed reported water quality
data that generally supported the conclusion of Ortiz et al. (1998). They include Crouch et al. (1984),
McCulley, Frick and Oilman Inc. (1990), Wetherbee et al. (1991), Clark and Lewis (1997), and Ruse et
al. (2000).
Review of the available literature suggests the following:
• Cadmium, copper, iron, lead, manganese, and zinc have been identified as exceeding
either acute or chronic aquatic life standards at one or more locations over the entire
period of record (Dash and Ortiz 1996; Ortiz et al. 1998).
• The Leadville Mining District is the primary source of metals affecting water quality and
sediments in the Downstream Area. While there are local sources contributing metals
loads to tributaries of the Arkansas River, none of the tributaries are currently a
significant source of metals to the mainstem (McCulley, Frick and Oilman Inc. 1990;
Church et al. 1994; Kimball et al. 1995; Ortiz et al.1998; Church et al. 2000).
• The majority of aquatic life water quality standard exceedances occurred prior to water
treatment at the LMDT and Yak tunnel (Dash and Ortiz 1996; Ortiz et al.1998).
• Partitioning of metals in the water column from the aqueous dissolved phase to
particulate phase actively occurs, especially within the first 10-20 miles downstream of
the 11-mile reach, thus decreasing the bioavailability of metals in the water column
(McCulley, Frick and Oilman Inc. 1990; Kimball et al. 1995).
• During high flow, colloids are resuspended and transported downstream and contribute to
the elevated dissolved metals concentrations observed during high flow and storm events.
Colloidal-size particles pass through the filter size, 0.45 urn, used for dissolved metals
samples, but they are not necessarily considered to be bioavailable (Kimball et al. 1995;
Ortiz et all998).
• When compared to aquatic life standards, arsenic, chromium, mercury, nickel, and
selenium do not occur in significant concentrations in the Downstream Area (Dash and
Ortiz 1996; Ortiz et al. 1998).
Review of the surface water data compiled in the database for the four metals for Reaches 5
through 9 are shown below (Tables 6-1 through 6-3).
J:\010004\Task 3 - SCR\SCR_currentl.doc 6-14
JLV^Q ii ^
Given the small size of the reach, limited data are available. Available data were collected from
1975 to 1999 for all four metals from two stations. This represents all of the data available in the
database for cadmium, copper, lead, and zinc regardless of the time period considered. Based on the
mean dissolved metal concentration data for all Periods combined, metals in Reach 5 remain higher than
in the downstream reaches, yet generally remained similar or decreased in concentration compared to
upstream concentrations (measured in Reach 3).
During Period 3, mean concentrations of all dissolved metals were greater during high flow
relative to low flow concentrations. Dissolved cadmium exceeded the TVSs only once during high flow,
and dissolved copper exceeded the chronic TVS in this reach once during low flow. Lead exceeded the
chronic TVS during high flow only, while zinc exceeded acute TVSs during both high and low flows.
Compared to Reach 0 during Period 3, mean dissolved cadmium was lower, copper and lead were slightly
elevated, and zinc was considerably higher in Reach 5 during both flow conditions.
Reach 6
Water quality data were abundant for Reach 6. Almost all the data available in the database for
cadmium, copper, and lead were collected between 1986 and 2000. Zinc data were found as far back as
1968, extending to 2000. A small amount of data are available from 1968 to 1975 and the concentrations
are variable, whereas the largest proportion of the data for zinc were collected between 1986 and 1999.
While no clear trends are observable for zinc, the highest zinc concentrations were collected in 1968-
1969.
Across all time periods and flow conditions, dissolved cadmium, copper, and lead averaged less
than concentrations measured in Reach 5, while zinc averaged slightly greater in Reach 6 relative to
Reach 5.
During Period 3, dissolved concentrations of all four metals exceeded TVSs during both high and
low flows. Copper and lead primarily exceeded the acute TVSs, while cadmium and zinc exceeded the
acute TVSs during high and low flows. Compared to Reach 0 mean dissolved metals concentrations
during Period 3, cadmium, copper, lead, and zinc were lower in Reach 6 during both flow conditions.
Due to inflows from Lake Creek, hardness is reduced during both high and low flows relative to the
J:\010004\Task 3 - SCR\SCR_currcntl.doc 6-15
higher hardness values observed in Reach 0 and other upstream reaches, which results in lower TVSs in
Reach 6.
Reach 7
Across all time periods and flow conditions, data for cadmium, copper, and lead were collected
primarily from 1986 to 2000, while for zinc the same time span applies with additional samples being
collected 1968, 1969, and 1975. Considering all the data, mean dissolved cadmium, copper and lead were
slightly higher in Reach 7 compared to Reach 6, while zinc was slightly lower.
During Period 3, dissolved concentrations of copper, lead, and zinc exceeded TVSs during both
high and low flows on more than one occasion. Cadmium exceeded the TVSs only once during low
flows. Copper exceeded the acute TVSs during both flow conditions, while lead only exceeded the
chronic TVSs during both flow conditions. Zinc exceeded the acute TVSs during high and low flows.
Reach 8
For dissolved cadmium, data were collected from 1981 to 1998. For dissolved copper, lead, and
zinc, data were collected from 1975 to 1998. Across all flow conditions and periods, average dissolved
cadmium, copper, lead, and zinc were lower in Reach 8 than average concentrations in Reach 7.
During Period 3, dissolved concentrations of copper, lead, and zinc exceeded TVSs during high
flows on more than one occasion, while only lead and zinc exceeded TVSs more than once during low
flows. Copper exceeded the acute TVSs during high flow, but only exceeded the chronic TVS once
during low flows. Lead exceeded the chronic TVS during both flow conditions. Zinc exceeded the acute
TVSs during high and low flows.
Reach 9
For all metals, dissolved data were collected from 1979 to 1997. Across all flow conditions and
periods, average dissolved metals concentrations in Reach 9 were higher than metal concentrations in
Reach 8.
During Period 3, dissolved concentrations of cadmium, copper, lead, and zinc did not exceed
TVSs during either high or low flows. Higher hardness values in Reach 9 (resulting in higher TVSs) and
some lower metal concentrations, result in no exceedances.
J:\010004\Task3-SCR\SCR_currentl.doc 6-16
6.4.2 Summary of Injury Findings: Analysis of Exceedances of Table Value Standards (TVSs)
during Period 3
• Surface water resources in Reach 5 are injured primarily due to concentrations of
dissolved lead and zinc during high flows and zinc during low flows.
• The December 2000 CDPHE Status of Water Quality Report indicates that the ArkansasRiver from Lake Fork to Lake Creek is fully supporting its designated recreational and
agricultural uses and partially supporting its aquatic life uses.
• Surface water resources in Reach 6 are injured due to concentrations of dissolved
cadmium, copper, lead, and zinc during both high and low flow conditions.
• The December 2000 CDPHE Status of Water Quality Report indicates that the Arkansas
River below Lake Creek is fully supporting its designated uses.
• Surface water resources in Reach 7 are injured due to concentrations of dissolved copper,
lead, and zinc during both high and low flow conditions.
• Surface water resources in Reach 8 are injured due to concentrations of dissolved copper,lead, and zinc during high flows and lead and zinc during low flows.
• No surface water injury occurs in Reach 9 due to concentrations of cadmium, copper,lead, or zinc during either high or low flow conditions.
• The spatial extent of injury to surface water in the Downstream Area extends from Two-
Bit Gulch to Canon City.
6.5 Instream Sediments
The evaluation of instream sediment information is relative to concentrations observed in the
control area (Reach 0) as well as spatial trends with distance from the Leadville Mining District. Overall,
instream sediments are not viewed to be a significant pathway for injury. The low potential for storage of
instream sediments within Reaches 5, 6, 7, and 8 limits the potential for water quality effects and
biological exposure. This is further supported by the general trend of decreasing metal concentrations
with distance from sources and the good condition of the benthic macroinvertebrate communities.
J:\010004\Task 3 - SCR\SCR_currentl.doc 6-17
6.5.1 Supporting Information
The most comprehensive sediment study was a three phased study conducted by the USGS. This
study documented California Gulch as a metal source to the Arkansas River from Leadville to Pueblo
Reservoir. It further determined that the California Gulch site was the primary metal source to Arkansas
River sediments.
Phase I of this study was initiated in July 1993 to examine the distribution of elements in sediments
from the Arkansas River Basin (Church 1993). The objective of the study was to determine the origin and
time-of-deposition of fluvial mine-waste deposits in the Arkansas River immediately downstream of the
confluence with California Gulch. They sampled the Arkansas River and its major tributaries to evaluate the
contribution of lead from each of the potential sources. Cores of river sediments were taken at selected sites
along the Arkansas River to provide sedimentological and geochronological control. They concluded that the
mine-wastes in the Arkansas River below California Gulch are predominantly from California Gulch.
Studies of lead in cores taken from this same area show sediment intervals beneath the mine-waste deposits
that pre-date mining activity in the Leadville area.
In phase II of the study, geochemical data were retrieved from numerous geologic studies
conducted over the last several decades in order to prepare geochemical maps showing the distribution of
copper, lead, and zinc in the upper Arkansas River Basin (Smith 1994). As a result of this work, they
identified ten additional lead source areas in the Arkansas River Basin which exceed the crustal
abundance of lead by 8-30 times. Potential source areas include historic mining districts and milling and
industrial sites. Using these geochemical maps, they selected seventeen sample sites along the Arkansas
River from Leadville to Pueblo Reservoir for geochemical and lead-isotopic analysis (Church et al. 1994).
They concluded that greater than 90 percent of the lead and zinc load in Arkansas River sediments
between Leadville and the Chalk Creek confluence are from California Gulch NPL site. Lead, zinc,
copper, arsenic, and cadmium were elevated from Leadville to the Chalk Creek confluence compared to
sediments upstream of California Gulch. Lead and zinc are contributed to the Arkansas River by Chalk
Creek, but the total additional metal load is small. Zinc became elevated downstream of Salida,
suggesting an additional zinc source. However, Church (personal communication) later suggested that
because of the lower gradient in the river at this site, the suspended colloidal load partially settles out and
is incorporated into the river bed sediments. Data collected by Kimball et al. (1995) supports this
conclusion.
J:\010004\Task3-SCR\SCR_currentl.doc 6-18
In phase III of the study, tributaries to the Arkansas River were sampled to determine whether
additional sources of metal released from historical mining activities elsewhere in the watershed
contribute to the metals in streambed sediment in the mainstem of the Arkansas River. Whereas local
anthropogenic sources were found in some of the tributaries, the measured chemical and lead-isotopic
compositions determined at the mouths of these tributaries indicate that there are not substantial sources
of metals from the tributaries that impact the streambed sediment in the Arkansas River (Church et al.
2000).
McCulley, Frick and Oilman, Inc. (1990) conducted a study in April 1989 of sediments and water
to determine if trends in metal enrichment were consistent with loading from the Yak Tunnel/California
Gulch mining area. They further evaluated the potential for metals to move between the water columnr
and sediments. They determined that cadmium, copper, and zinc remain elevated in sediments (compared
to Arkansas River sediments from upstream of California Gulch) downstream to about Granite. Lead
concentrations remained elevated down to about Brown's Canyon. They also noted elevated metals
concentrations below Salida. Using sequential extractions of sediments and mass balance calculations,
they determined that varying amounts of the aqueous trace metals discharged from California Gulch are
partitioned from the liquid phase to the sediment phase, but that remobilization of trace metals from the
sediment phase to the liquid phase was probably not significant.
Kimball et al. (1995) conducted studies in fall 1988 and spring 1989 to determine the effects of
colloids on metal transport in the Arkansas River. They determined that iron colloids form in California
Gulch and move downstream in suspension. While iron dominated the colloid composition, arsenic,
cadmium, copper, manganese, lead, and zinc also occurred in the colloids. The colloidal load decreased
by one half in the first 30 miles downstream from California Gulch due to aggregated colloids settling to
the bed sediments. However, they determined that a substantial colloid load was transported through the
entire study reach to Pueblo Reservoir, The dissolved metals were dominated by iron and zinc and the
patterns of colloidal iron and zinc suggested that during low flow, dissolved and colloidal loads decrease
downstream as metals partition to the colloidal fraction and the aggregated colloids settled to the stream.
These colloids are resuspended during high flow at the same time that there is a flushing of metals with
snowmelt runoff, creating the greatest metal loads of the year. This same flushing event could occur
during thunderstorm runoff as was seen by Horowitz et al. (1990).
Kimball et al. (1995) suggest that some metals (cadmium, copper, iron, lead, and zinc) are
remobilized as colloids into the aqueous phase during high flow and transported downstream as far as
Pueblo Reservoir. This partitioning is also confirmed by CDOW water sampling reported by USFWS
(1993) and is represented in the water quality data reported by McCulley, Frick and Oilman (1990). Ortiz
J:\010004\Task 3 - SCR\SCR_currem 1 .doc 6-19
et al. (1998) reported differences in cadmium, copper, lead, manganese and zinc, which can reasonably be
explained by partitioning of colloids between bed sediments and the aqueous phase.
6.5.2 Summary of Injury Findings to Instream Sediments
• Sediment metals data were compiled and found to be present for each of the three periods
of interest. Period 1 and 2 data were only available for Reaches 6-10, while Period 3 data
were available for all of the downstream reaches (Table 6-7).
• Between Periods 1 and 2 there is a substantial shift in metals concentrations. Period 1
data suggest relatively low concentrations of metals compared to upstream concentrations
observed in Reach 0 during the same period as well as during Period 3.
• During Period 2, the shift in metals concentrations, particularly for Reaches 6-8 shows a
sharp increase. For example, Period 1 mean sediment zinc concentrations of 103.2,
195.8, and 98.3 mg/Kg were observed in Reaches 6, 7, and 8 respectively. During Period
2 mean sediment zinc concentrations of 2,813.3, 1,302.5, and 994.2 mg/Kg were
observed in Reaches 6, 7, and 8, respectively. This shift is most likely due to differencesin sampling and analytical techniques.
• Elevated levels of zinc in sediments in the reaches described above are present during
Period 3, but not at the levels observed during Period 2. At Reaches 6, 7, and 8, zinc
concentrations in sediments were 981.1,469.8, and 459.5 mg/Kg, respectively duringPeriod 3.
• During Period 3, the following observations were made for metals compared to those
metals concentrations observed in Reach 0: cadmium, copper, lead, and zinc in sedimentfrom Reach 5 are elevated over those concentrations found in Reach 0; copper, lead, and
zinc in sediments from Reach 6 are elevated over those concentrations found in Reach 0,
but are less than in Reach 5; zinc is the predominant metal in Reach 7 and 8 elevated over
concentrations found in Reach 0, yet is lower than in each subsequent upstream reach;
and by Reach 9 all mean metals concentrations are lower than concentrations observed in
Reach 0.
• It is evident that the overall concentrations of cadmium, copper, lead, and zinc in
sediments are declining, both temporally and spatially. This may be due to the
importance of colloidal metal transport and deposition, which is largely a function of
water quality (Kimball et al. 1995). Metals concentrations in surface waters were
substantially decreased after 1992, due to the implementation of treatment at the LMDT
and the Yak tunnel.
J:\010004\Task3-SCR\SCR_currentl.doc • 6-20
6.6 Groundwater
A query of all the available data in the database yielded a small amount of data for groundwater
resources in the Downstream Area. Of the groundwater quality data found in the database, all were
collected between 1970 and 2000 (or from Periods 1 and 3). There were no data available for period 2.
There were no data available for Reach 5 or Reach 10. For Reaches 6, 7, 8, and 9 most data were
collected from deep groundwater wells (40'-100') that supply communities or groups of houses. The
following provides a brief summary of the data available for Reaches 6, 7, 8, and 9.
6.6.1 Supporting Information
Summary data discussed for the following reaches, along with detailed information on well
location and type, can be found in Table 6-8.
Reach 6
The data for Reach 6 includes statistical information for total concentrations of cadmium, copper
and lead. There was a total of 12 sampling locations from this reach from which data was retrieved.
There were no exceedances of the MCLs for any of the metals discussed. All data were retrieved from
deep groundwater wells.
Reach 7
The data for Reach 7 includes statistical information for all four metals of concern, with data for
both total and dissolved concentrations for copper and lead. Cadmium data only included total
concentration, while zinc data only included dissolved concentrations. There were a total of 2 sampling
locations in this reach from which data was retrieved. There were no exceedances of the MCLs for any of
the metals discussed. All data were retrieved from deep groundwater wells.
Reach 8
The data for Reach 8 includes statistical information for all four metals of concern, with data for
both total and dissolved concentrations for cadmium copper and lead with only dissolved concentrations
for zinc. There were a total of three sampling locations in this reach from which data was retrieved.
There were no exceedances of the MCLs for any of the metals discussed. Data for this reach were
J:\Ol0004\Task 3 - SCR\SCR_currentl.doc 6-21
retrieved primarily from deep groundwater wells with the exception of some data being retrieved from
wells of unknown depth or type.
Reach 9
The data for Reach 9 included statistical information for only copper, lead and zinc. Only
dissolved concentrations were available for the three metals. All data was retrieved from three different
sampling locations. There were no exceedances of the MCLs for the metals discussed. Data was
retrieved from deep groundwater wells.
6.6.2 Summary of Injury Findings to Groundwater
Based on lack of injury to groundwater within the 11-mile reach and on confirming data for the
Downstream Area, no injury to groundwater has occurred.
6.7 Floodplain Soils
Floodplain soils data (BLM 2000) provide a useful indicator of the impact of mine-wastes
released from the 11-mile reach. Soil sampling in the control area (Reach 0) along with the 11-mile reach
provide a basis for determining potential injury in the Downstream Area from mine-waste storage in the
floodplain. Soils data currently available include total concentrations of cadmium, copper, lead and zinc
at 18 separate locations between Two-Bit Gulch and Pueblo Reservoir.
6.7.1 Supporting Information
Limited soils data for the Downstream Area are available from BLM sampling in July 2000
(Figure 6-3). Soil samples were collected along 18 transects, with approximately 5 sites sampled along
each transect. Soil samples were collected at multiple depths and depths varied with location. All
samples were analyzed for lead, zinc, iron, and manganese. A subset of the samples were also analyzed
for arsenic, cadmium, copper and silver. Samples were analyzed for total metals using XRF or a total
digest procedure. There were no soil samples collected in Reach 5, two transects were sampled in Reach
6, one transect was sampled in Reach 7, nine transects were sampled in Reach 8, and six transects were
sampled in Reach 9.
J:\010004\Task 3 - SCR\SCR_currentl.doc 6-22
Table 6-9 presents a summary of the BLM (2000) floodplain soils data by reach for lead and zinc.
These concentrations are compared to floodplain soils in the control area (Reach 0). The only reach
where zinc concentrations are high enough to indicate the presence of mine-waste or some other
anthropogenic influence is in Reach 6. There were two sample sites (CCT1B and CCT1C) where zinc
concentrations were in the range of 2,000 to 4,000 mg/Kg. These sample sites are at the confluence of
Clear Creek and not an area believed to represent a significant potential for mine-waste storage from the
11-mile reach. No other metal concentrations were high enough in any of the downstream reaches to
indicate the possible presence of mine-waste material.
Reach 5
There are no data available for floodplain soils along Reach 5. Some small.mine-waste deposits
exist in Reach 5, but no data has been collected that characterizes the deposits with respect to surface
area, depth, volume, and chemical properties.
Reaches 6-9
Soil chemistry data exists for floodplain soils along Reaches 6-9 (BLM 2000) (Table 6-9). This
data includes total metal concentrations for lead and zinc for all sites sampled and cadmium and copper
for a subset of these sites. There were approximately 17 transects where soils were sampled along these
reaches.
6.7.2 Summary of Injury Findings to Soils
Although there are no floodplain soils data for Reach 5, field reconnaissance of this stretch of
river confirm the presence of small deposits of mine-waste with low plant cover. It is assumed that soil
metal concentrations and/or pH are affecting plant growth on these deposits, indicating injury to soils at
locations where mine-waste deposits occur.
The elevated concentrations of zinc in floodplain soils at the confluence of Clear Creek (Reach 6)
indicate the potential for injury in this location. The source of these metals may be from historical mining
in the Clear Creek drainage. Total metal concentrations are potentially high enough to cause injury to
soils at this location. However, this cannot be confirmed without further soil sampling and analysis.
J:\OI0004\Task 3 - SCR\SCR_currentI.doc 6-23
Other than Reach 5 and two sample sites along Reach 6, there is no other evidence to indicate
injury to floodplain soils in the remaining portions of Reach 6 and Reaches 7-9. Floodplain soils are not
considered injured in most of Reach 6 and Reaches 7-9 because metal concentrations along these reaches
are similar to Reach 0 and riparian vegetation does not show signs of metal toxicity.
6.8 Biological
Consistent with the findings for the 11-mile reach, the potential for mining-related injuries is
greatest in aquatic organisms. Information presented in the following sections describes available
information on fish, benthic macroinvertebrates, and two species of birds that depend upon
macroinvertebrates as a food source, as well as considerations regarding vegetation and terrestrial
wildlife.
6.8.1 Vegetation
Currently there is no quantitative vegetation data available for the Downstream Area. Large-scale
vegetation mapping has been conducted but no sampling has been completed to describe plant cover,
biomass, species composition, or metal tissue concentrations below the 11-mile reach.
6.8.1.1 Supporting Information
Information on vegetation in the Downstream Area is limited to field reconnaissance and large-
scale habitat mapping. Inferences regarding injury are primarily based on an understanding of soil
conditions within the 11-mile reach that cause injury to vegetation.
6.8.1.2 Summary of Injury Findings to Vegetation
Data are not available for vegetation cover, production or tissue metal concentrations along Reach
5. Field observations confirm that vegetation is healthy and shows no signs of injury that could be
associated with elevated metal concentrations in floodplain soils. Mapping conducted by the Colorado
Division of Wildlife also indicates that vegetation cover types are consistent with a floodplain setting for
non-injured areas. However, plant growth has been observed to be limited in cover and production on
J:\Ol0004\Task 3 - SCR\SCR_currentl.doc 6-24
several small mine-waste deposits along Reach 5. This limited plant cover and production indicates
injury to vegetation at the few small areas where mine-waste deposits occur in this reach.
Data are not available for vegetation cover, production or tissue metal concentrations along Reach
6-9. However, injury to vegetation in upstream areas is limited to mine-waste deposits. Field
reconnaissance and geomorphologic analyses indicate a lack of mine-waste deposits along Reach 6-9;
therefore, there is no basis to conclude that injury exists to vegetation growing on floodplain soils along
these reaches. Field observations confirm that vegetation is healthy and shows no signs of injury that
could be associated with elevated metal concentrations in floodplain soils. Mapping conducted by the
Colorado Division of Wildlife also indicates that vegetation cover types are consistent with a floodplain
setting for non-injured areas.
6.8.2 Benthic Macroinvertebrates
Benthic macroinvertebrate data provide a useful indicator of the impact from metals in Upper
Arkansas River water. Extensive work conducted in the control area (Reach 0) along with the 11-mile
reach, provide a basis for understanding the relationship between water and the condition of benthic
macroinvertebrate communities. This understanding enhances the value of the existing studies for the
Downstream Area in terms of characterizing injury.
6.8.2.1 Supporting Information
A number of studies have examined the relationship between the abundance of
macroinvertebrates and heavy metal concentrations in the Upper Arkansas River Basin. Additional
studies have investigated the impacts of flow regime and other habitat characteristics on the abundance of
macroinvertebrates.
Clements et al. (2002) conducted a long-term (10-year) research program investigating the impact
of heavy metals on benthic macroinvertebrate communities in the Downstream Area at station AR-8
(Reach 6) from 1989-1999. This assessment included: 1) quantitative measurements of benthic
community composition along a 70 km reach of the upper Arkansas River between Climax and Buena
Vista; 2) measurements of heavy metal concentrations in water and other physicochemical characteristics;
and 3) measurement of heavy metal concentrations in invertebrates. In addition, limited benthic
J:\Ol0004\Task3-SCR\SCR_currentl.doc 6-25 .
macroinvertebrate data are available from several sampling occasions at station AR-7 in the upper section
of Reach 6 at Granite.
Total macroinvertebrate abundance at station AR-8 in Reach 6 of the Downstream Area varied
between 200 and 2000 individuals per 0.1 m2 and was generally greater than in Reach 0 (Figure 2-15).
Total species richness ranged from 11 to 26.6 species per sample and was similar to Reach 0 (Figure 2-
18). Most other measures of benthic community composition, including abundance of metal-sensitive
heptageniid mayflies, were either similar to or greater at station AR-8 compared to Reach 0. The only
exception to this pattern was for species richness of mayflies, which did not recover downstream from
California Gulch (Figure 2-18).
Temporal variation in benthic community composition was compared to changes in water quality
over a ten-year period in order to assess the influence of improvements in water quality below LMDT and
California Gulch. Metal concentrations at station AR-8 (Reach 6) were seasonally variable, with the
highest concentrations measured in spring (Figure 6-13). Total zinc concentrations at this station were
also significantly lower after remediation of California Gulch and LMDT (Figure 6-10). Abundance of
dominant macroinvertebrate groups showed little seasonal or long- term variation (Figure 6-14). The
only exception was total mayfly abundance and stonefly abundance, which gradually increased after
1995. The increase in abundance of mayflies was primarily a result of a steady increase in the number of
metal-sensitive heptageniids (Figure 6-9), which were significantly greater after remediation in 1992
(Figure 6-10). The most consistent pattern in measures of species richness was a decrease in the seasonal
variability in the later sampling periods (Figure 6-11).
Some evidence of recovery was also observed in the upper section of Reach 6 at Granite (stations
AR-7). Prior to treatment of LMDT and California Gulch, benthic communities at AR-7 were comprised
primarily of caddisflies and chironomids (Figure 6-15). Although these metal-tolerant groups dominated
benthic communities after 1993, abundance of mayflies and stoneflies also increased. In particular,
abundance of baetid mayflies increased by approximately 3 times after 1993 and approached densities
observed in Reach 0. While density of heptageniid mayflies also increased during this period, these
metal-sensitive organisms were much less abundant than in Reach 0 or in the lower section of Reach 6
(Buena Vista). Similar patterns in recovery were observed for measures of species richness (Figure 6-16).
Total species richness and richness of most macroinvertebrate groups increased after treatment of LMDT
and California Gulch. However, these values were significantly lower than those observed in Reach 0.
Exposure of benthic macroinvertebrates to heavy metals in the Downstream Area between 1990
and 1999 was assessed by measuring concentrations of zinc in the caddisfly Arctopsyche grandis
J:\010004\Task3-SCR\SCR_currentl.doc 6-26
(Trichoptera: Hydropsychidae). Concentrations of zinc in Arctopsyche collected from Reach 6 (Buena
Vista) generally declined over time (Figure 6-12). The only exception to this pattern was a large,
unexplained peak in metal levels during spring 1999.
Statistical analyses of metal levels in Arctopsyche among all reaches before (1990-1992) and after
(1993-2000) remediation of LMDT and California Gulch show highly significant spatial and temporal
variation (Figure 6-17). Metal levels in caddisflies were significantly elevated in Reach 1 and declined
downstream. However, metal concentrations at the two stations in Reach 6 (AR-7 and AR-8) were
significantly greater than in Reach 0. In general, metal levels in caddisflies declined after 1992.
Kiffney and Clements (1993) carried out a one-year study to determine the extent of metal
contamination (cadmium, copper, and zinc) in a benthic community from the Arkansas River. Elevated
levels of metals in benthic organisms paralleled elevated concentrations of metals in the water. Levels of
heavy metals in most dominant species of benthic macroinvertebrates were generally lower in Reach 6
compared to the 11-mile reach. For most species and most metals, concentrations in the Downstream
Area were similar to those measured in Reach 0. The concentration of metals in aquatic
macroinvertebrates was a better indicator of metal bioavailabiliry in the Arkansas River than was the
concentration of metals in the water.
Data collected by the U. S. Fish and Wildlife Service in October of 1995 showed that total
abundance of benthic macroinvertebrates at all stations ranged from 176-1,209 individuals per Surber
sample. Benthic communities at the six upstream stations (above Balltown, Granite Bridge, Fisherman's
Bridge, Highway 291 Bridge, and Stockyard Bridge) were dominated by caddisflies (primarily
Brachycentridae and Hydropsychidae) and dipterans (primarily chironomids), which accounted for
greater than 90 percent of total macroinvertebrate abundance. Mayfly and stonefly abundances were
generally quite low at these upstream stations. In particular, heptageniid mayflies, organisms known to be
sensitive to contaminants, were absent or greatly reduced at these upstream sites. There was a gradual
shift in benthic community composition at the three furthest downstream stations (Valley Bridge, Lone
Pine, Flood Plain), reflecting reduced abundance of caddisflies and increased abundance of mayflies.
Stoneflies and mayflies at the three downstream stations accounted for 33-50 percent of total
macroinvertebrate abundance. Mayfly assemblages at these downstream stations were dominated by
Heptageniidae and Baetidae. The spatial patterns in abundance of dominant groups from upstream to
downstream were similar to those reported by Clements et al. 2002 for Reach 6 (stations AR-7 at Granite
and AR-8 in Buena Vista) and suggest that benthic communities were impacted by metals in 1995. The
more recent data indicate that benthic communities are injured in the upper section of Reach 6, but that
recovery has occurred in the lower section at Buena Vista.
J:\010004\Task 3 - SCR\SCR_currentl.doc 6-27
In 1984-1985, Ruse et al. (2000a; 2000b) found that metal-tolerant species were common within
the 11-mile reach. However, overall species composition at a larger spatial scale (Climax to Pueblo) was
primarily influenced by variables related to the longitudinal gradient of the river (distance downstream,
elevation, latitude, temperatun nd caddisflies did not
increase from upstream to dow / attributed the lack of a
downstream increase in specie n\ \Jk_ ^ Dilation, and temperature.
The results of this study are es ,/\J^n^ 259km). However,
patterns observed at any partic r\SX8Is ;ause these analyses were
based on collections of exuviai Ri «a R>£-«XQ eral days after emergence.
As a consequence, organisms < .—> ,. _^-^M~--ty^axs-«. e tnat emerged fromi<^C§S§3SS23c;;&£2es*ssSfefe_-
distant upstream locations.
!
Nelson and Roline (19 macroinvertebrate
community composition and fl ti and downstream from
the confluence with Lake Creek. Results of an extensive literature review showed that most benthic
macroinvertebrates are adapted to highly variable flow regimes and can tolerate a wide range of
discharge. Results of field studies showed that flow augmentation as a result of trans-mountain diversions
have increased stream discharge below Lake Creek. Although subtle differences in benthic communities
between upstream and downstream sites were detected, most taxa were collected from both locations.
However, these investigators reported that the distribution of one dominant species of caddisfly
(Brachycentrus occidentalis) was closely related to streamflow. Because Brachycentrus is a major
component of the diet of brown trout in the Arkansas River (Winters 1988), impacts of flow variation on
this species may have significant consequences for brown trout growth and condition.
There is a limited amount of lexicological data available for the Downstream Area, most of which
has been collected from the upper sections of the Arkansas River (e.g., Lake Creek to Buena Vista).
Single species toxicity tests conducted with cladocerans (Ceriodaphnia dubia) and fathead minnows
(Pimephales promelus) in 1991 showed some acute effects (for fathead minnows) and chronic effects of
water collected from station AR-8 (Reach 6) in Buena Vista (Figure 2-36). In contrast, experiments
conducted by U.S. EPA between 1991-1993 showed little acute toxicity of Arkansas River water (Table
2-21).
Frugis (1995) compared effects of heavy metals on chironomids exposed to sediments collected
from a reference site (Cache la Poudre River) and station AR-8 in Buena Vista. Percent mortality of
chironomids exposed to sediment from AR-8 (40 percent) was higher than control mortality (24.2
J:\010004\Task 3 - SCR\SCR_currentl.doc 6-28
In 1984-1985, Ruse et al. (2000a; 2000b) found that metal-tolerant species were common within
the 11-mile reach. However, overall species composition at a larger spatial scale (Climax to Pueblo) was
primarily influenced by variables related to the longitudinal gradient of the river (distance downstream,
elevation, latitude, temperature). Species richness of chironomids, stoneflies, and caddisflies did not
increase from upstream to downstream as predicted for Colorado streams. They attributed the lack of a
downstream increase in species richness to the effects of heavy metals, flow regulation, and temperature.
The results of this study are especially useful because of the large spatial scale (259 km). However,
patterns observed at any particular location should be interpreted cautiously because these analyses were
based on collections of exuviae, which may remain on the water surface for several days after emergence.
As a consequence, organisms collected at any particular site may represent those that emerged from
distant upstream locations.
Nelson and Roline (1996) investigated the relationship between benthic macroinvertebrate
community composition and flow characteristics in the Arkansas River upstream and downstream from
the confluence with Lake Creek. Results of an extensive literature review showed that most benthic
macroinvertebrates are adapted to highly variable flow regimes and can tolerate a wide range of
discharge. Results of field studies showed that flow augmentation as a result of trans-mountain diversions
have increased stream discharge below Lake Creek. Although subtle differences in benthic communities
between upstream and downstream sites were detected, most taxa were collected from both locations.
However, these investigators reported that the distribution of one dominant species of caddisfly
(Brachycentrus occidentalis) was closely related to streamflow. Because Brachycentrus is a major
component of the diet of brown trout in the Arkansas River (Winters 1988), impacts of flow variation on
this species may have significant consequences for brown trout growth and condition.
There is a limited amount of toxicological data available for the Downstream Area, most of which
has been collected from the upper sections of the Arkansas River (e.g., Lake Creek to Buena Vista).
Single species toxicity tests conducted with cladocerans (Ceriodaphnia dubid) and fathead minnows
(Pimephales promelus) in 1991 showed some acute effects (for fathead minnows) and chronic effects of
water collected from station AR-8 (Reach 6) in Buena Vista (Figure 2-36). In contrast, experiments
conducted by U.S. EPA between 1991-1993 showed little acute toxicity of Arkansas River water (Table
2-21).
Frugis (1995) compared effects of heavy metals on chironomids exposed to sediments collected
from a reference site (Cache la Poudre River) and station AR-8 in Buena Vista. Percent mortality of
chironomids exposed to sediment from AR-8 (40 percent) was higher than control mortality (24.2
J:\010004\Task 3 - SCR\SCR_currentl.doc 6-28
percent); however, this difference was not statistically significant. There was also no significant effect of
metals in sediment on growth of chironomids.
Figure 2-33 shows results of a laboratory experiment in which chironomids (Chironomus tentans)
were exposed to sediments collected from Reach 6. Despite the fact that metal concentrations in
sediments from Reach 6 were similar to those in Reach 0, concentrations of cadmium, copper, lead, and
zinc in chironomids exposed to these sediments were generally higher in the Downstream Area. These
results indicate that physicochemical factors other than bulk metal concentrations (e.g., grain size, percent
organic carbon) determined metal bioavailability in Reach 6.
6.8.2.2 Summary of Injury Findings to Benthic Macroinvertebrates
Available literature indicate the following regarding injury to benthic macroinvertebrates:
• Cadmium, copper, lead, and zinc concentrations in invertebrates have decreased in Reach6 during the period 1995-1998, and concentrations decrease from upstream todownstream (Table 6-10) (Archuleta et al. 2000).
• Lead concentrations in invertebrates remained elevated in Reach 5 compared toconcentrations in Reach 0 (Table 6-10, Table 2-27) (Archuleta et al. 2000).
• Total macroinvertebrate abundance in Reach 6 (Arkansas River at Granite) in theDownstream Area varied between 200 and 900 individuals per 0.1 m2 and was similar tovalues observed in Reach 0. However, unlike Reach 0 benthic communities weredominated by caddisflies and chironomids (Clements, unpublished data).
• Total macroinvertebrate abundance at station AR-8 in the lower section of Reach 6
(Arkansas River at Buena Vista) in the Downstream Area varied between 200 and 2000individuals per 0.1 m2 and was generally greater than in Reach 0 (Figure 2-15) (CDOW
1998).
• There was a gradual increase in abundance of mayflies after 1995 at both downstreamstations. In the downstream section of Reach 6 (Buena Vista) this was primarily a resultof a steady increase in the number of metal-sensitive heptageniids (Figure 6-9), which
were significantly greater after water treatment began upstream in 1992 (Figure 6-10)
(Clements et al. 2002). In contrast, mayflies in the upstream section of Reach 6 (nearGranite) were dominated by baetids. Although heptageniids increased in the upstream
section of Reach 6 after remediation, abundance of these metal-sensitive species wasrelatively low compared to Reach 0 (Clements, unpublished data).
J:\OI0004\Task 3 - SCR\SCR_currentl.doc 6-29
• Measures of species richness exhibited less seasonal variability in the later sampling
periods (Figure 6-11) (Clements et al. 2002).
• Concentrations of zinc in Arctopsyche collected from Reach 6 generally declined overtime and approached levels measured in organisms collected from Reach 0 (Figure 6-12)
(Clements et al. 2002).
• Heptageniid mayflies, organisms known to be sensitive to contaminants, were absent orgreatly reduced at six upstream site stations in Reaches 5, 6 and 7(above Balltown,
Granite Bridge, Fisherman's Bridge, Highway 291 Bridge, and Stockyard Bridge)(USFWS 1995).
• Mayfly assemblages at three downstream stations in Reach 8 (Valley Bridge, Lone Pine,Flood Plain) were dominated by Heptageniidae and Baetidae (USFWS 1995).
• Levels of heavy metals in most dominant species of benthic macroinvertebrates weregenerally lower in Reach 6 (Buena Vista) compared to the 11-mile reach (Kiffney and
Clements 1993).
• Species richness of chironomids, stoneflies, and caddisflies did not increase fromupstream to downstream (i.e., from Tennessee Creek near the Leadville Mine DrainageTunnel downstream to Pueblo Reservoir) as predicted for Colorado streams. This lack ofa downstream increase in species richness may be attributable to the effects of heavy
metals, flow regulation, or temperature (Ruse et al. 2000a; 2000b).
• Most benthic macroinvertebrates are adapted to highly variable flow regimes and cantolerate a wide range of discharge. However, the distribution of one dominant species ofcaddisfly (Brachycentrus occidentalis) was negatively affected by flow regulation.
Benthic macro invertebrate data are lacking from Reach 5. However, because water quality in
Reach 5 is similar to that observed in Reach 3 (where injury was observed) and because metal levels in
Reach 5 exceed site-specific concentrations known to be toxic to metal-sensitive species, it is likely that
benthic macroinvertebrates are injured in Reach 5.
Analysis of community structure for benthic macroinvertebrates collected at stations AR-7
(Granite) and AR-8 (Buena Vista) in Reach 6 shows significant improvement in species richness,
diversity and abundance of some metal-sensitive species, hi particular, abundance of Heptageniidae at
station AR-8 in the lower section of Reach 6 increased 2-3 times since remediation of LMDT and
California Gulch was initiated in 1992. Abundance of these organisms after 1996 was similar to that
observed in Reach 0. Limited recovery of these metal-sensitive species was observed in the upper section
J:\010004\Task 3 - SCR\SCR_currentl.doc 6-30
of Reach 6. Metal concentrations in the caddisfly Arctopsyche grandis collected from Reach 6 have
decreased since 1994 and are similar to those values measured in Reach 0. The only exception to this
pattern is an unexplained spike in zinc concentration in 1999. Zinc levels in periphyton measured at the
downstream portion of Reach 6 (1,031-1,273 p.g/g) in 1995 and 1996 were also within the range of values
observed in Reach 0 (409-4,200 |o.g/g). We conclude that there is no injury to benthic macroinvertebrates
in Reach 6 near Buena Vista.
Despite improvements in water quality and macroinvertebrate communities over time, data
collected from the upper section of Reach 6 near Granite suggest injury to benthic organisms. Abundance
of metal-sensitive mayflies and species richness of mayflies and stoneflies are significantly lower at
station AR-7 than in Reach 0. Based on a comparison of the upper and lower sections of Reach 6, we
conclude that recovery of benthic macroinvertebrates occurs somewhere between Granite and Buena
Vista.
Few data are available from Reaches 7 and 8 of the Arkansas River, However, microcosm
experiments conducted in 1998 showed that exposure of benthic communities to a mixture of cadmium,
copper, and zinc at concentrations similar to those measured at Reaches 7 and 8 had no effect on
community composition, species richness of mayflies, or abundance of metal-sensitive species.
Quantitative collections of benthic macroinvertebrates by the USFWS showed no spatial trends that could
be related to heavy metals in Reaches 7 and 8, as well as further downstream. Based on these results, we
conclude that there is no injury to benthic macroinvertebrates from heavy metals in Reaches 7 and 8.
Furthermore, the dramatic recovery of benthic macroinvertebrates observed in Reach 6 (Buena Vista)
following remediation of upstream metal sources suggests that injury to benthic macroinvertebrates below
Reach 5 is unlikely.
6.8.3 Fish
The Downstream Area of the Arkansas River supports a naturally reproducing brown trout
population and a growing rainbow trout population, which is supported by stocking (CDOW 1998).
Neither brown nor rainbow trout are native to the Arkansas River Basin, but brown trout have been the
primary fishery management focus for the CDOW. Other fish species present in the Arkansas River
include Snake River cutthroat trout, brook trout, white suckers, and longnose suckers. Fishery related
data currently available include population data based on electrofishing surveys, and limited laboratory
toxicity testing.
J:\010004\Task 3 - SCR\SCR_currentl.doc 6-31
6.8.3.1 Supporting Information
The CDOW has reported results of their population sampling efforts at various sampling stations
since 1981. These data include number of each species captured and lengths and weights for each fish
captured. Sampling stations have been located from just upstream of Granite to downstream at Coaldale.
However, not every station has been sampled every year and some stations are sampled during spring
while others are sampled during fall. The preferred approach to evaluating fish population data or natural
resource injury is to compare total abundance, biomass, and length frequency distributions at downstream
locations to a reference location. However, because the Arkansas River changes both physically and
chemically from the bottom of the 11-mile reach to Pueblo Reservoir, it is difficult to compare
populations upstream to those downstream over the 125-mile stretch. In addition, different sampling
techniques were used upstream (backpack shocking) and downstream (boat shocking). Therefore,
evaluation of temporal trends at each sampling station where sufficient data exists is presented. The most
continuous and extensive data set is available for the Wellsville station, which begins at Wellsville and
extends upstream to the Stockyard Bridge just below Salida. With the exception of 1987 and 1989, this
location has been sampled yearly from 1981 to the present, representing the most continuous and
extensive data set available (CDOW 1999). Additional survey sites include: above Granite, Tezak, Loma
Linda, Coaldale, and Big Bend.
Historically, there was an absence of large brown trout in the Downstream Area, which was
attributed to a variety of factors including metal toxicity, post spawning conditions, and the lack of forage
fish (Nehring 1986). Winters (1988) conducted a detailed investigation of brown trout feeding habits,
growth and condition at a single site approximately 30 km downstream from Salida. He reported that
brown trout fry feed extensively on small, drifting invertebrates (especially Baetis), followed by a switch
to caddisflies in older age classes. He characterized the general condition of brown trout in the Arkansas
River as poor. The high rate of mortality observed in older fish and the absence of+4 age class in the
Arkansas River was attributed to poor or unreliable food quality and the lack of forage fish.
More recently, Policky (1998) reported that brown and rainbow trout are living to an approximate
age of 7 in the Downstream Area. Restrictive regulations (e.g., flies and lures only, 2 fish > 14 inches)
and anglers practicing catch and release has maximized the brown trout population to carrying capacity of
the habitat; therefore, some fish in the Wellsville area are in poor condition.
Based on Instream Flow Incremental Methodology analysis (BLM 2000), when optimum flows
are reached at the Wellsville gage they will consistently protect habitat for all life stages and species of
J:\010004\Task 3 - SCR\SCR_current 1 .doc 6-32
trout from Leadville to Canon City. Fish habitat has an optimum value at a certain velocity and depth.
Trout habitat is optimized from 250 - 450 cfs (at Wellsville gage) throughout the year. Useable habitat
rapidly decreases as flows exceed 550 cfs (BLM 2000), which frequently produce unfavorable habitat
conditions for trout. In addition, macroinvertebrate densities are also influenced by high flows - optimum
velocity values are exceeded above 500 cfs.
On 18 and 19 August 1988, a large fish kill occurred in the Arkansas River following water
releases from Clear Creek Reservoir that had been treated with rotenone on 9 August 1988. Colorado
Division of Wildlife personnel were treating the reservoir with rotenone to eliminate an over-population
of suckers. The fish kill was estimated to have eliminated 100 percent of the fish community for 20 miles
downstream and have significant effects for another 15 miles downstream (USFWS 1988). According to
CDOW reports, brown trout recovered within 5 years and rotenone is not considered a limiting factor for
downstream populations.
6.8.3.2 Summary of Injury Findings to Brown Trout
The following information is related to fish population data collected at the Wellsville station:
• Between 1982 and 1999, the number offish per acre at the Wellsville station has
remained at about 200 fish/acre (based on two-sample T-Test a = 0.05 using data from
CDOW 1999).
• There is no significant difference in the average number offish per acre and average
pounds per acre at the Wellsville station from 1992-1999 compared to 1981-1991 (based
on two-sample T-Test a = 0.05 using data from CDOW 1999).
• There is no significant difference in the average number offish per acre greater than 14
inches at the Wellsville station during the period 1992-1998 compared to 1981-1991
(based on two-sample T-Test a = 0.05 using data from CDOW 1999).
• Adult brown trout in the Wellsville area are in poor condition, probably due to
overcrowding and a lack of sizable forage (Krieger 2000; Policky et al. 2000; Winters
1988).
Brown trout data from Reach 5 are lacking. However, because water quality in Reach 5 was
similar to that measured in Reach 3 (where injury was observed), it is concluded that there is injury to
brown trout in this downstream reach.
J:\010004\Task 3 - SCR\SCR_currentl.doc 6-33
Metal concentrations decrease significantly downstream from Lake Creek, and mean values
approach the regulatory threshold levels in Reach 6 and are consistent with concentrations measured in
the control reach (Reach 0). Significant reduction in abundance (71 percent) and biomass (24 percent) of
brown trout was observed in the upper section of Reach 6 (Granite) compared to Reach 0. Inspection of
length frequency distributions of brown trout also showed relatively poor recruitment in Reach 6, with
few juvenile fish present. The brown trout population in Reach 6 was characterized by reduced overall
abundance but somewhat larger individuals compared to the reference reach.
Because of natural and anthropogenic changes in physical characteristics of the Arkansas River,
particularly flow alterations associated with discharge from Lake Creek, it is possible that flow alterations
immediately downstream from Lake Creek impact fish populations. However, there are no quantitative
data showing direct effects of these flow modifications on brown trout. Although metals concentrations
occasionally exceeded the TVSs downstream from Reach 6, there is no indication of injury to brown
trout.
6.8.4 Terrestrial Wildlife
Information directly describing the potential for injury to terrestrial wildlife is not available for
the Downstream Area. Any assessment for the potential for injury must be based upon a comparison to
the 11-mile reach.
6.8.4.1 Supporting Information
Information describing the presence or absence of injury to terrestrial wildlife for the 11-mile
reach is limited to small mammals. This information indicates that small mammals living in and around
discrete deposits of mine waste may have exposure to elevated metals concentrations resulting in injury.
Data for large mammals were not available, however, building upon the information available for small
mammals, an exposure analysis for large mammals was conducted. As for small mammals, the potential
for injury to large mammals is also linked to exposure in and around discrete floodplain deposits of mine
waste.
J:\010004\Task 3 - SCR\SCR_currentl.doc 6-34
6.8.4.2 Summary of Injury Findings to Terrestrial Wildlife
As mine-waste deposits are limited to a few small areas within the floodplain of Reach 5, the
potential for injury to terrestrial wildlife is limited to small mammals residing in those areas. This is
further supported by the fact that for most of the Downstream Area, water quality and floodplain soils
metals concentrations are similar to Reach 0.
Reach 5
Due to the lack of small mammal data for Reach 5, it is not known if there is injury to this
resource. Characterization of the metals concentrations in Reach 5 fluvial deposits, floodplain soils,
vegetation, and terrestrial invertebrates would provide data to evaluate potential injury to small mammals.
Reaches 6-9
There are no small mammal data for Reaches 6-9. Because there are no known fluvial mine-
waste deposits in Reaches 6-9 and because floodplain soils concentrations are relatively low, the potential
for injury to terrestrial wildlife is not present.
6.8.5 Birds
Information on swallows and dippers from recent USFWS & USGS studies provide a basis for
evaluating injury. These species are exposed due to their reliance on various life stages of benthic
macroinvertebrates as a food source. Data from Reach 0 and the 11-mile reach enhance the
understanding of data from the Downstream Area.
6.8.5.1 Supporting Information
The USFWS sampled blood and livers from American dippers at 12 sites in the Downstream area
(Reaches 5-8) between 1995 and 1998 (Archuleta et al. 2000). Blood and liver samples were analyzed for
metals and blood was also analyzed for ALAD. In addition, aquatic invertebrates (dipper food items)
were collected from 19 sites and analyzed for metals. Aquatic invertebrate samples were generally
comprised of one composite sample per nest site per year with the exception of 1998 when a composite
sample was collected in April and a second composite sample collected in October from most sites. The
J:\OI0004\Task 3 - SCR\SCR_cunrcntl.doc 6-35
USGS sampled blood and liver from tree swallows at 4 locations (Reaches 6-9) in the Downstream Area
between 1997 and 1998 (Custer et al. 2003 In Press). Tree swallow liver samples were analyzed for
metals concentrations and blood was analyzed for ALAD activity. Swallow stomach contents were
analyzed for metals and food boli were evaluated to determine diet composition. These are the only
known bird studies that attempt to evaluate metals exposure and effects on migratory birds in the
Downstream Area.
For all Downstream Reaches, dipper blood metal concentrations were similar to concentrations
from Reach 0 with the exception of lead in Reach 5. Blood lead in Reach 5 was approximately two times
the concentration in Reach 0 (Table 6-12). ALAD in dipper samples was reduced in Reaches 5-7
compared to Reach 0 by 17 percent, 28 percent, and 14 percent respectively. Compared to the Study
Reference, ALAD was reduced by 49 percent, 56 percent, 48 percent, and 25 percent in Reaches 5-8
respectively (Table 6-13).
In dipper liver samples, copper concentrations were higher in Reaches 5-7 compared to Reach 0,
but not abnormally high. Lead liver concentrations were significantly higher in Reaches 5 and 6
compared to Reach 0. However, none of the metals in any of the Downstream reaches exceeded
literature-based benchmarks.
Average lead and zinc concentrations in aquatic invertebrate samples were much higher in
Reaches 5 and 6 compared to Reach 0 (Table 6-10). In samples collected between 1995-1998, the highest
average concentrations for each metal of concern occurred in Reach 6 in 1995. Generally, all metal
concentrations decreased from 1995 to 1998 in all reaches. Averaged over all years, Reaches 5 and 6 had
the highest average concentrations for all metals of concern. The most recent samples collected in 1998,
show that lead in Reaches 7 and 8 and zinc in Reaches 5-8 exceed the dietary benchmark for birds (Tables
6-10 and 6-11).
In swallow liver samples, cadmium was at least two times higher in Reaches 6-8 compared to
Reach 0. Copper and zinc concentrations for all reaches were similar to Reach 0 and lower than the study
reference. Lead concentrations in Reach 8 were significantly higher than the other Reaches and Reach 0
(Table 6-15). None of the metals in any of the Downstream reaches exceeded literature-based
benchmarks.
Compared to the Study Reference, ALAD was suppressed in tree swallows by 22 percent, 1
percent, and 35 percent respectively in Reaches 6-8 respectively. None of the Downstream reaches had
suppressed ALAD compared to Reach 0.
J:\010004\Task 3 - SCR\SCR_currentl.doc 6-36
Emergent adult aquatic invertebrates (swallow food items) had metal concentrations which were
generally 2-3 times lower than nymph stage aquatic invertebrates for all metals of concern and only zinc
exceeded the dietary threshold for birds (Custer et al. 2003 In Press).
6.8.5.2 Summary of Injury Findings to Birds
Findings of these studies and those of other investigators, related to the potential for injury, are
presented below:
• Injury is occurring to American dippers from lead exposure in Reaches 5 & 6 (betweenGranite and Balltown). Levels of d-aminolevulinic acid dehydratase (ALAD) activity are
suppressed in American dippers by approximately 50 percent compared to the reference
area (Archuleta et al. 2000).
• At all other downstream sites, ALAD activity is suppressed in American dippers (25-48
percent compared to a reference area) indicating the birds are exposed to lead, but injuryis not occurring (Archuleta et al. 2000).
• For all downstream sites, ALAD activity is suppressed in tree swallows (1-35 percent
compared to reference area), indicating the birds are exposed to lead, but injury is not
occurring (Custer et al. 2003 In Press).
• Migratory birds are exposed to metals (cadmium, lead, zinc) in the Downstream Area, butreported levels are typically below threshold values associated with lethal and sublethal
(e.g., behavioral and/or physiological) effects (Archuleta et al. 2000; Custer et al. 2003 InPress).
Reaches 5-6
• Based on greater than 50 percent ALAD suppression, there is injury to American dippers
when compared to Reach 0 (49 percent suppression for Reach 5 and 56 percent for Reach
6).
• There is no injury to tree swallows based on less than 50 percent ALAD suppression
compared to Reach 0 (28 percent for Reach 6).
• Metal concentrations in liver, blood, and eggs of birds were all below benchmark values.
J:\010004\Task3 -SCR\SCR_currentl.doc 6-37
No reproductive impairment (data for tree swallows only).
Reaches 7-8
There is no injury to American dippers based on less than 50 percent ALAD suppressioncompared to Reach 0 (48 percent for Reach 7 and 25 percent for Reach 8).
There is no injury to tree swallows based on less than 50 percent ALAD suppression
compared to Reach 0 (1 percent for Reach 7).
Metal concentrations in liver, blood, and eggs of birds were all below benchmark values.
No reproductive impairment (data for tree swallows only).
Reach 9
No data are available for migratory birds. However, downstream water and sediment
quality continue to improve and metal concentrations in invertebrates are lower thanReach 0 (Table 6-11). Injury to migratory birds is not expected in Reach 9.
6.9 Pueblo Reservoir (Reach 10)
Pueblo Reservoir is discussed separately because of the many differences in physical setting from
other upstream reaches. Overall, there are few metals data for Pueblo Reservoir relative to the amount of
data collected from upstream sites. In the database, water quality data were found extending from about
the mid 1980s to early in 1990. Most studies reviewed, investigated water and sediment quality, and a
few of those included data on biota. None of the studies reviewed were specifically designed to
determine if injuries to natural resources occur at Pueblo Reservoir. Assessment of injury over all time
periods is limited by the paucity of data for all natural resource categories (per NRDA regulations) for
Pueblo Reservoir. For example, the most recent water quality data are from 1989, and most biological
data are from a reconnaissance study investigating irrigation drainage in 1988. However, limited data on
the fundamental resources of surface water and sediments coupled with upstream data provide the basis
for a reasonable assessment of the potential for injury.
J:\010004\Task 3 - SCR\SCR_currentI.doc 6-38
6.9.1 Supporting Information
Surface Water
Herrmann and Mahan (1977) studied the concentration changes in inorganic chemicals pre-
(1972-1974) and post- (1974-1976) impoundment of Arkansas River at Pueblo Reservoir. Dissolved and
suspended levels of all inorganic constituents (Ag, Cu, Fe, Mn, Zn, Co, Pb, Cd, Li, Na, K, Ni, Mg, Ca,
Hg) averaged less than recommended or maximum permissible limits for beneficial uses of reservoir
water during this study. Seasonal, surface, and spatial trends were also observed for most constituents.
Generally, constituents in water samples had higher winter concentrations and lower summer
concentrations associated with high runoff. Based on spatial and surface trends, evaporation has
somewhat of a concentrating effect on dissolved solids, and certain metals (iron, manganese, zinc and
possibly copper, cadmium, and lead) appeared to be precipitating into the sediments. Although iron,
manganese, and zinc did not follow the general trends, they showed depth profiles (samples taken at 3-5m
intervals from the surface to the bottom) with higher dissolved concentrations in water near the bottom
that indicate an exchange is taking place between the reservoir water and sediments. Additionally,
dissolved oxygen tended to decrease with depth. Zinc concentrations were highly variable (range: 1- 38
p.g/1) and may be related to the concentration of suspended matter carried into the reservoir by the
Arkansas River (Herrmann and Mahan 1977).
Mueller et al. (1991) conducted a reconnaissance investigation of water quality, sediment, and
biota associated with irrigation drainage in the middle Arkansas River Basin, which included a sample
site at Pueblo Reservoir in the spring and fall of 1988. Water quality data show the same seasonal trend
as Herrmann and Mahan (1977) observed, although zinc concentrations were not as variable.
McNight et al. (1991) examined the chemical characteristics of particulate organic carbon in
water from one site in Pueblo Reservoir. Most major elements had comparable dissolved and colloid
concentrations indicating they are primarily dissolved components. However, iron, manganese, and zinc
had significantly greater concentrations in the organic colloid fraction indicating they are associated with
that fraction in some way. Concentration ratios of the filtrate to the organic colloid for iron, manganese,
and zinc exceed 500, 99, and 21 respectively (McNight et al. 1991), also indicating association with the
organic colloid fraction. Based on this and other studies (e.g., Kimball et al. 1989), organic colloids may
be important in the downstream transport of trace elements.
The recommended aquatic life criterion for total-recoverable iron (1,000 (j.g/1) (U.S. EPA 1986)
near the reservoir bottom was exceeded in 12 samples during 1986-1989 (Lewis and Edelmann 1994).
J:\010004\Task3 -SCR\SCR_currentl.doc 6-39
All samples that exceeded water quality standards for iron were collected from June through September,
and the authors attributed the iron concentrations to large concentrations of sediment and iron in the
Arkansas River inflow. The sampling site where 11 exceedances were observed is located in a well-
oxygenated area of the reservoir and it is unlikely that iron released from sediments contributed to the
elevated iron concentrations (Lewis and Edelmann 1994).
The public water-supply standard for dissolved manganese (50 |ig/l) (CDPHE 1990) near the
reservoir bottom was exceeded in 26 samples during 1986-1989 (Lewis and Edelmann 1994). The
authors attributed 14 of those exceedances to elevated concentrations of dissolved manganese in the
Arkansas River during summer runoff and the other 12 exceedances were attributed to the mobilization of
dissolved manganese from reservoir bottom sediments during periods of low dissolved-oxygen. Lewis
and Edelmann (1994) reported that manganese releases from the sediments diminished after fall turnover
mixes the deepest waters of the reservoir with well-oxygenated water from near the surface.
Generally, trace elements occur in relatively low concentrations in water (near surface and near
bottom) of Pueblo Reservoir (Lewis and Edelmann 1994). A comparison of total-recoverable and
dissolved concentrations of the predominant trace elements indicates that < 50 percent of the iron,
manganese, and zinc concentrations are dissolved, which suggests that a large percentage of those
elements in Pueblo Reservoir are sorbed to suspended sediment that is transported by the Arkansas River
(Lewis and Edelmann 1994).
Reach 10 water quality data for cadmium, copper, lead, and zinc are limited to Periods 2 and 3.
The data period of record (POR) is from 1982 to 1998, but is not consistent for each of the metals.
Considering all of the available dissolved data for each metal over the POR, there is a clear decreasing
trend of concentrations for cadmium, copper, and lead through time. No trends were obvious for zinc.
Tables 6-2 and 6-3 show that all TVS exceedances occurred during Period 2 and no TVS exceedance
occurred during Period 3. Cadmium and lead are the only metals that had exceedances of the TVSs
during Period 2.
During Period 3, Reach 10 had not exceeded the TVSs for any of the four metals evaluated.
Mean dissolved cadmium and lead are slightly elevated in Reach 10 compared to Reach 9, while copper is
lower compared to Reach 9. Mean zinc concentrations are virtually identical between Reaches 9 and 10.
Compared to Reach 0, mean dissolved concentrations of all four metals in Reach 10 are lower.
Available literature indicates the following:
J:\010004\Task 3 - SCR\SCR_currentl .doc 6-40
• Overall, few exceedances of water quality standards have occurred (primarily during
Period 2); however, standards were exceeded several times for two trace elements (iron
and manganese) between 1986 and 1989 (Lewis and Edelmann 1994).
• Metals-contaminated sediment and water from the Upper Arkansas River Basin are being
deposited in Pueblo Reservoir; however, concentrations are generally low (Herrmann and
Mahan 1977; Callendar et al. 1988; Church et al. 1994; Lewis and Edelmann 1994).
• Metals concentrations (cadmium, lead, zinc) in water tend to be higher near the sediment
- water interface (within 1m of the bottom) compared to surface samples (Herrmann and
Mahan 1977; Lewis and Edelmann 1994).
• Average metals (cadmium, lead, and zinc) concentrations in tissues of birds tend to be
below threshold values associated with lethal and sublethal (e.g., behavioral and/or
physiological) effects (Mueller et al. 1991; Custer et al. 2003 In Press).
• Certain layers within sediment core samples from the reservoir show deposits that
correspond to discharges from the Yak Tunnel (Callendar et al. 1988; Church et al.
1994).
• Iron, manganese, and zinc appear to be transported to and within the reservoir by colloids
(McKnight et al. 1991).
• Based on the existing data, injuries to natural resources are not currently occurring at
Pueblo Reservoir due to releases of hazardous substances from the Upper Arkansas River
Basin (Herrmann and Mahan 1977; Mueller et al. 1991; Lewis and Edelmann 1994;
Custer et al. 2003 In Press).
• Based on analyses of the data from the electronic database, as of 1990 no measured
metals concentrations have exceeded their respective TVSs in the reservoir. Prior to
1990, TVS exceedances in the reservoir were rare.
Sediments
Callender et al. (1988) collected sediment cores from Pueblo Reservoir for metals analysis and,
based on the vertical distribution of normalized metals data, interpreted the peaks of increased metals to
represent the 1983 and 1985 Yak Tunnel surges. Church et al. (1994) analyzed specific core intervals
from Callender et al.'s (1988) sediment samples and found lead-isotopic compositions that were similar to
mineral deposits at Leadville. For lead, copper, and zinc there is a significant increase in total
concentrations in specific intervals from 2 of 5 sediment cores from Pueblo Reservoir. Church et al.
J:\OI0004\Task 3 - SCR\SCR_currentl.doc 6-41
(1994) concluded that those core intervals contained surge deposits formed as result of releases from the
Yak Tunnel, supporting the interpretation made by Callender et al. (1988).
Herrmann and Mahan (1977) observed some metals (e.g., zinc, copper, cadmium, lead,
manganese, iron) loading of the sediments in Pueblo Reservoir near the inlet. The average zinc
concentration in the sediments was 3-4 times greater than the zinc content of pre-impoundment floodplain
sediments (Table 6-16). Increased metals loading in Pueblo Reservoir was attributed to sediments from
the Leadville Mining District (Herrmann and Mahan 1977). Mueller et al. (1991) collected sediment
samples from one site near the inlet of Pueblo Reservoir. All metals concentrations except zinc were near
pre-impoundment levels (Table 6-16). Lewis and Edelmann (1994) reported elevated lead and zinc
concentrations in reservoir bottom sediments when compared to values from Shacklette and Boerngen
(1984). Those elements are common constituents of mine drainage in the upper Arkansas River Basin.
Weathering of sedimentary rock in the lower half of the Basin is another source of iron and manganese to
the reservoir.
• Sediment metals data were compiled and found to be present for each of the three Periodsof interest for Reach 10, Pueblo Reservoir (Table 6-7). Sediment data for PuebloReservoir were limited for Periods 1 and 3, with only a single sample collected during
either period.
• Mean lead and zinc concentrations were higher in Period 2 over the single measurementpoint available for Period 1, while cadmium and copper are lower during Period 2.
• Compared to Period 2, mean concentrations of cadmium, copper, and lead are slightly
greater during Period 3, while zinc was lower during Period 3.
• Compared to Reach 0, the single sediment sample collected for Reach 10 during Period 3shows that concentrations of cadmium, lead, and zinc are lower in Reach 10 than the
mean values observed for Reach 0.
Biological
Custer et al. (2003 In Press) sampled livers from barn and tree swallows from Pueblo Reservoir in
1997-98. They were able to sample only 3 birds in 1997 and 3 birds in 1998. Average concentrations for
all metals were less than Reach 0 and all samples were less than the literature-based thresholds.
Mueller et al. (1991) sampled adult and juvenile waterfowl and shorebirds from Pueblo Reservoir
and analyzed livers for metals. Only cadmium in adult birds exceeded the concentrations from Reach 0,
J:\010004\Task3-SCR\SCR_currentl.doc ' 6-42
but it did not exceed the literature-based benchmark. However, adult birds sampled from Pueblo
Reservoir are not a valid indicator of exposure from Pueblo Reservoir as the birds may have been exposed
at another site. Cadmium and lead in juvenile birds were all less than the detection limit. Some juvenile
birds had zinc concentrations that were higher than Reach 0, but the average zinc concentration was less
than the literature-based benchmark.
Mueller et al. (1991) also sampled fish in June and October from Pueblo Reservoir. They
analyzed whole-body composite samples of several different species (bluegill, common carp, gizzard
shad, channel catfish, and small mouth bass). Neither cadmium nor lead had detectable concentrations
and zinc concentrations were below benchmark values.
6.9.2 Summary of Injury Findings for Pueblo Reservoir
• Available information on water quality indicates that injury to surface water is notpresent within Pueblo Reservoir. Surface water quality data do not show exceedances of
the TVSs.
• The December 2000 CDPHE Status of Water Quality Report indicates that the PuebloReservoir and the Arkansas River downstream of the reservoir is fully supporting itsdesignated uses.
• Sediment concentrations also indicate lack of injury. Although limited in numbers, datafrom about 20 years suggests that Pueblo Reservoir sediments are of similar or betterquality than those found in the upstream reference, Reach 0.
• Corresponding to the lack of injury in surface water and sediment, no injuries wereobserved or are expected for aquatic or terrestrial biological resources within Pueblo
Reservoir.
6.10 Baseline Considerations
There are many land use and resource management factors influencing the condition of the
Downstream Area. This overview makes no attempt to characterize those influences. It should be noted
that there are several historic mining districts located in the Downstream Area within the Arkansas River
Basin. They include the Twin Lakes Mining District located above Twin Lakes, the Monarch Mining
District located in the Chalk Creek area, the Rosita Hills Mining District located near Westcliff, and the
Cripple Creek Mining District near Cripple Creek and Victor. In addition, there are three hazardous
J:\010004\Task 3 - SCR\SCR_current 1 .doc 6-43
waste sites that are either on the National Priorities List or proposed for listing. They include
Smeltertown located just North of Salida, Lincoln Park located southwest of Canon City, and College of
the Canons located southwest of Canon City. The influences of any of these mining districts or sites on
the condition of the UARB resources were not explored.
There have been numerous attempts by state and federal agencies to evaluate the role of non-
mining impacts on the physical, chemical, and biological resources of the Upper Arkansas River. The
Downstream Area is heavily managed, influenced by a variety of factors that have an effect on water
quality, including:
• Trans-mountain diversions and flow augmentation from various tributaries;• Urban development;
• Irrigation for agricultural uses;• Hydroelectric power generation;• Treatment of municipal and industrial waste;• Recreational uses;
• Flood control; and• Maintenance of the fishery.
Five major population centers are located in the Arkansas River Basin: Leadville; Colorado
Springs; Pueblo; Las Animas; and Lamar. The Colorado Department of Public Health and Environment
reported 88 permitted point source discharges in the Arkansas Basin, not including those covered by
general permits: 55 domestic waste treatment facilities, twelve hardrock and mine dewatering permits,
eleven industrial plants, six power plants, two hot springs pools, one water treatment plant, and two fish
hatcheries (CDPHE 2002).
Particular emphasis has been placed upon flow regulation as it relates to recreation and influences
on aquatic life (BLM 2000). The situation is then further complicated by the extensive use of the river
between Buena Vista and the Pueblo Reservoir for recreational purposes. This stretch of the Arkansas
River is reportedly the most widely used river in Colorado (CDPHE 2002). The main issue is how water
delivery (scale and timing) influences recreational uses (i.e., rafting) versus the quality of the fishery.
There is a difference between water releases to promote maintenance of the fishery versus flows
appropriate for recreational rafting. A suitable hydrograph for brown trout was illustrated earlier in this
report. The timing of peak flows and lower summer flows for fish does not necessarily correspond with
those flows more suitable for good Whitewater rafting in the mid to late summer. These are conflicting
management issues that not only affect water quality due to dilution and flushing, but also the biological
resources due to quality of water as well as quantity.
J:\OI0004\Task 3 - SCR\SCR_currentl .doc 6-44
TABLES
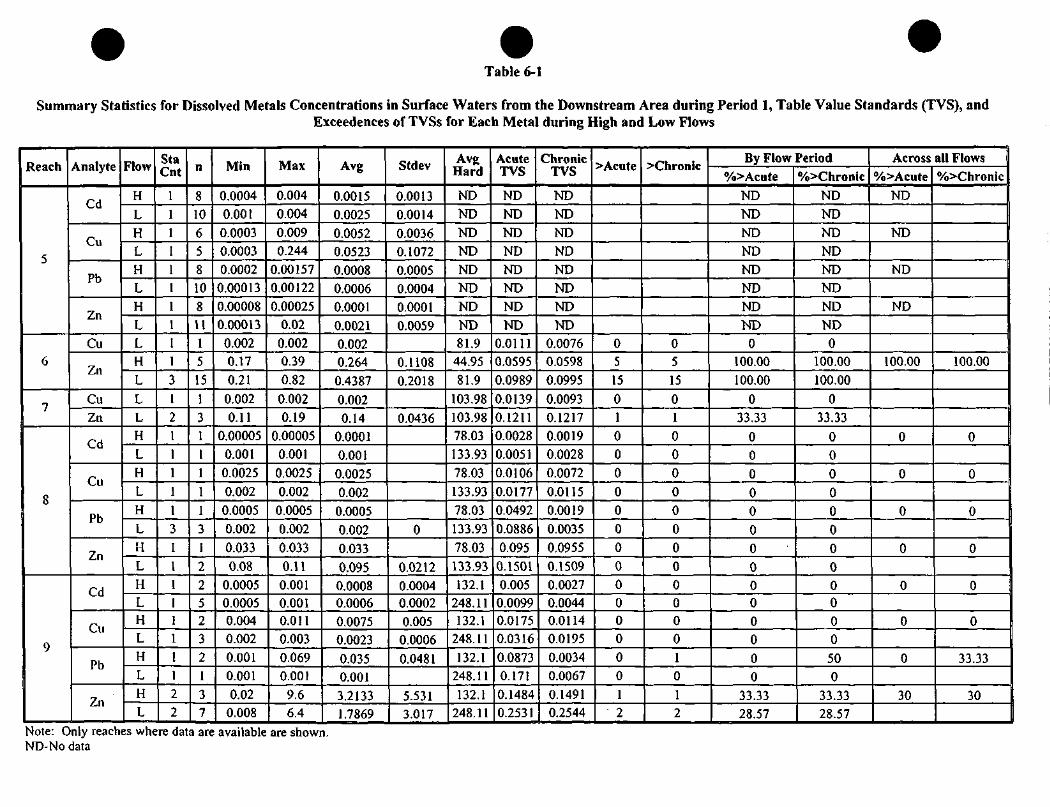
Table 6-1
Summary Statistics for Dissolved Metals Concentrations in Surface Waters from the Downstream Area during Period 1, Table Value Standards (TVS), andExceedences of TVSs for Each Metal during High and Low Flows
Reach
5
6
7
8
9
Analyte
Cd
Cu
Pb
Zn
Cu
Zn
CuZn
Cd
Cu
Pb
Zn
Cd
Cu
Pb
Zn
Flow
H
LHLHLHLLH
L
LLHLH
LH
L
HLHLHLHL
HL
StaCnt
1111111111
31
21111
131
11111
11
22
n
81065810
8111515
13111
11
31
2252321
37
Min
0.0004
0.0010.00030.00030.0002
0.00013
0.000080.00013
0.0020.17
0.21
0.002
0.110.00005
0.001
0.00250.002
0.00050.002
0.0330.08
0.00050.00050.0040.0020.0010.0010.02
0.008
Max
0.0040.004
0.0090.244
0.001570.00122
0.000250.02
0.0020.39
0.82
0.0020.19
0.000050.001
0.00250.002
0.00050.002
0.0330.11
0.0010.0010.0110.0030.0690.0019.66.4
Avg
0.00150.0025
0.00520.0523
0.00080.0006
0.00010.00210.0020.264
0.4387
0.0020.14
0.00010.0010.0025
0.002
0.00050.002
0.033
0.0950.00080.00060.00750.0023
0.0350.0013.21331.7869
Stdev
0.00130.0014
0.00360.1072
0.00050.00040.0001
0.0059
0.1108
0.2018
0.0436
0
0.02120.00040.00020.0050.0006
0.0481
5.5313.017
AvgHard
NDND
NDNDNDNDNDND81.9
44.9581.9
103.98103.9878.03
133.9378.03133.93
78.03133.93
78.03
133.93132.1
248.11132.1
248.11
132.1248.11132.1
248.11
AcuteTVS
NDNDNDNDNDNDNDND
0.01110.0595
0.09890.01390.1211
0.00280.00510.0106
0.01770.04920.0886
0.0950.15010.0050.00990.01750.03160.08730.1710.14840.2531
ChronicTVS
NDND
NDNDNDNDND
ND0.00760.0598
0.0995
0.00930.12170.00190.00280.0072
0.0115
0.00190.00350.0955
0.15090.00270.00440.01140.01950.00340.00670.14910.2544
>Acute
05
15
01
000
0000
000000012
>Chronic
0515
01
00
000
00000001012
By Flow Period
%>Acute
ND
NDNDNDNDNDNDND
0100.00100.00
0
33.33
000
0000
00000
00
33.3328.57
%>Chronic
NDND
NDNDNDNDNDND0
100.00
100.00
033.33
000
000
000000
500
33.3328.57
Across all Flows
%>Acute
ND
ND
ND
ND
100.00
0
0
0
0
0
0
0
30
%>Chronic
100.00
0
0
0
0
0
0
33.33
30
Note: Only reaches where data are available are shown.ND-No data
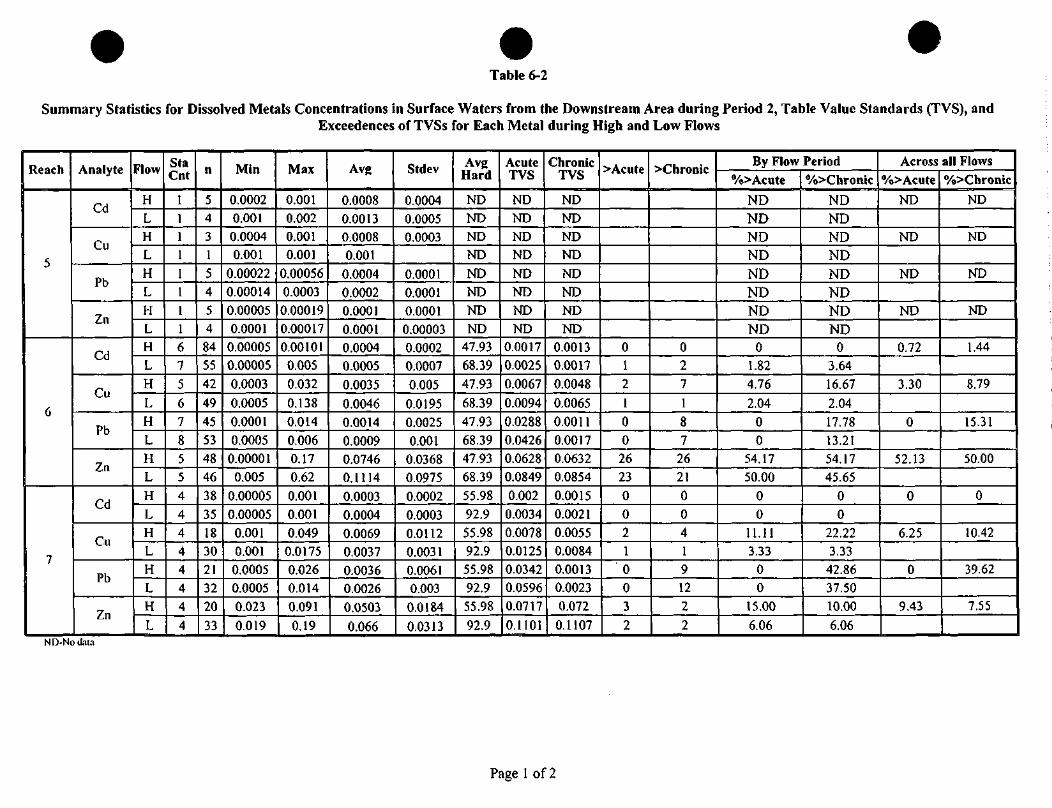
Table 6-2
Summary Statistics for Dissolved Metals Concentrations in Surface Waters from the Downstream Area during Period 2, Table Value Standards (TVS), andExceedences of TVSs for Each Metal during High and Low Flows
Reach
5
6
7
Analyte
Cd
Cu
Pb
Zn
Cd
Cu
Pb
Zn
Cd
Cu
Pb
Zn
Flow
HLHLHLHLHL
H
LH
LHLH
LHLHLH
L
StaCnt
1111
111167
5
67855
4444444
4
n
5431
54
54845542
49
4553
4846
38
351830213220
33
Min
0.00020.0010.00040.001
0.000220.000140.000050.0001
0.000050.00005
0.0003
0.00050.0001
0.00050.00001
0.005
0.000050.00005
0.0010.0010.00050.00050.023
0.019
Max
0.0010.0020.0010.001
0.000560.00030.000190.00017
0.001010.0050.032
0.1380.014
0.0060.170.62
0.0010.0010.0490.01750.0260.014
0.091
0.19
AVR
0.00080.00130.00080.001
0.00040.00020.00010.00010.00040.0005
0.0035
0.00460.0014
0.00090.07460.1114
0.00030.00040.00690.00370.00360.00260.0503
0.066
Stdev
0.00040.00050.0003
0.00010.00010.00010.000030.00020.00070.005
0.01950.00250.001
0.03680.09750.0002
0.00030.01120.00310.00610.003
0.0184
0.0313
AvgHard
NDNDNDND
NDNDNDND
47.9368.3947.93
68.3947.93
68.3947.9368.3955.98
92.955.9892.955.9892.955.98
92.9
AcuteTVS
NDNDNDND
NDNDNDND
0.00170.00250.0067
0.0094
0.02880.04260.06280.08490.002
0.00340.00780.01250.03420.05960.0717
0.1101
ChronicTVS
NDNDNDND
NDNDNDND
0.00130.0017
0.0048
0.0065
0.00110.00170.06320.0854
0.00150.00210.00550.00840.00130.00230.072
0.1107
>Acute
01
21
00
2623
0021003
2
>Chronic
02
71
87
2621
0041
912
2
2
By Flow Period
%>Acute
NDNDNDNDNDNDNDND
01.82
4.76
2.04
00
54.1750.00
00
11.113.33
00
15.00
6.06
%>Chronic
NDNDNDNDNDNDNDND
03.64
16.67
2.0417.7813.2154.1745.65
00
22.223.33
42.8637.5010.00
6.06
Across all Flows%>Acute
ND
ND
ND
ND
0.72
3.30
0
52.13
0
6.25
0
9.43
%>Chronic
ND
ND
ND
ND
1.44
8.79
15.31
50.00
0
10.42
39.62
7.55
ND-Nodnta
Page 1 of 2
Table 6- tinued
Reach
8
9
10
Analyte
Cd
Cu
Pb
Zn
Cd
Cu
Pb
Zn
Cd
Cu
Pb
Zn
Flow
HLHLHLHLHLHLHLHLHLHLHLHL
StaCnt
81068910682323232244444444
n
606229525061325437523955375138509699819295957591
Min
0.000050.00005
0.0010.00050.00050.00050.0050.006
0.000050.000050.00050.00050.000250.00025
0.0010.00150.000050.000050.00050.00050.000250.000250.00050.0005
Max
0.010.0020.022
0.01410.0250.0090.0670.1150.0030.0040.0340.0280.0140.0130.160.120.0240.0040.0090.0130.0060.0220.060.12
Avg
0.00070.00040.00470.00330.00270.00190.03010.03320.00060.00070.00770.00420.00240.00130.01940.0240.00160.0010.00230.00270.00180.0020.00850.0094
Stdev
0.00140.00050.00460.00340.00430.00210.01760.02340.00060.0010.00770.00450.00330.00210.02620.02140.00340.001
0.00150.00210.00130.00290.01080.0154
AYRHard
70.51109.370.51109.370.51109.370.51109.3113.92189.94113.92189.94113.92189.94113.92189.94170.27184.52170.27184.52170.27184.52170.27184.52
AcuteTVS
0.00250.00410.00970.01460.04410.07110.08720.12640.00430.00740.01520.02460.07440.12890.13090.20180.00660.00720.02220.02390.11470.1250.184
0.1969
ChronicTVS
0.00170.00240.00660.00970.00170.00280.08760.1270.00250.0036
0.010.01550.00290.005
0.13150.20280.00330.00350.01410.01510.00450.00490.18490.1979
>Acute
303000000041001030000000
>Chronic
4045181700137272101040021100
By Flow Period%>Acute
5.000.0010.340.000.000.000.000.000.000.0010.261.820.000.002.630.003.130.000.000.000.000.000.000.00
%>Chronic6.670.0013.799.6236.0027.870.000.002.705.7717.953.6418.923.922.630.0010.424.040.000.002.1111.580.000.00
Across all Flows%>Acute
2.46
3.70
0.00
0.00
0.00
5.32
0.00
1.14
1.54
0.00
0.00
0.00
%>Chronic3.28
11.11
31.53
0.00
4.49
9.57
10.23
1.14
7.18
0.00
6.84
0.00
Note: Only reaches where data are available are shown.
Page 2 of 2
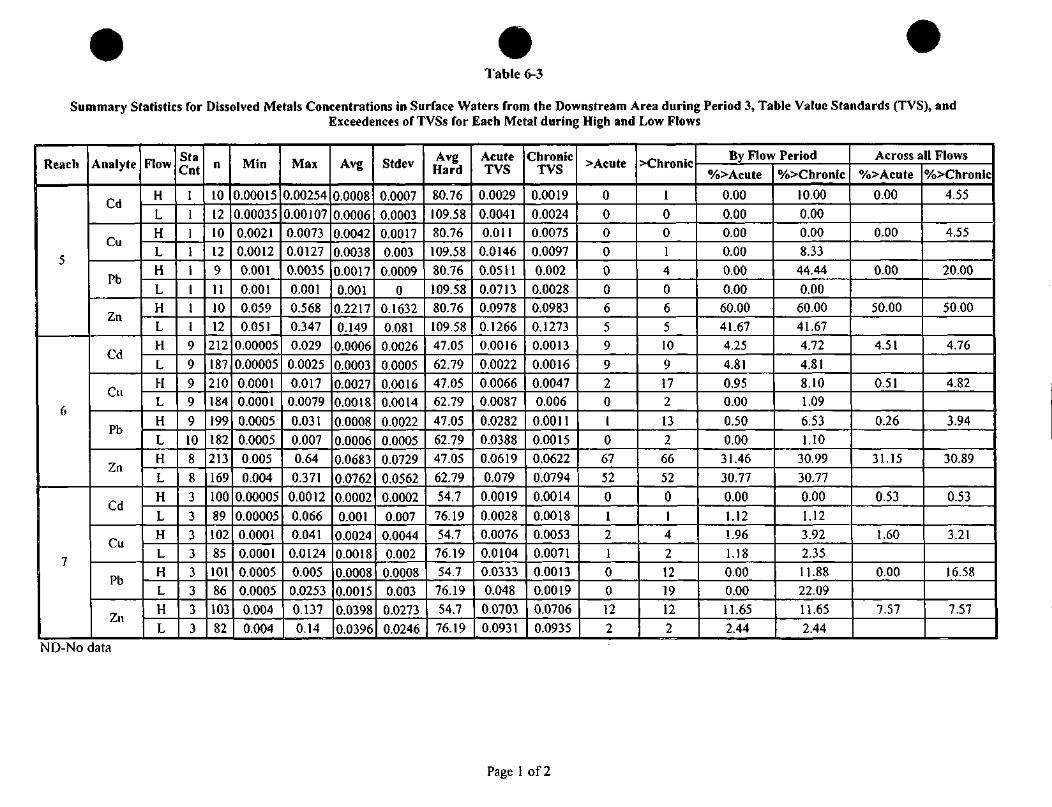
Table 6-3
Summary Statistics for Dissolved Metals Concentrations in Surface Waters from the Downstream Area during Period 3, Table Value Standards (TVS), andExceedences of TVSs for Each Metal during High and Low Flows
c
7
C(\
Pll
Ph
7n
PH
PHuu
Ph
7n
PH
p.,
Ph
7n
171 nu;
H
LHLH
LH
LH
LHL
H
L
H
L
H
LHL
HL
H
L
StaCnt
1
11
9
9
99
9
108833333333
101210129111012
212187210184
19918221316910089102851018610382
Min
0.00015
0.000350.00210.00120.0010.0010.0590.051
0.00005
0.00005
0.00010.0001
0.0005
0.00050.0050.004
0.000050.00005
0.00010.00010.00050.00050.004
0.004
0.00254
0.001070.00730.01270.0035
0.0010.5680.3470.029
0.00250.0170.0079
0.0310.0070.640.371
0.0012
0.0660.0410.01240.0050.02530.1370.14
AVg
0.00080.00060.00420.0038
0.00170.001
0.22170.1490.0006
0.00030.00270.0018
0.00080.00060.0683
0.0762
0.0002
0.0010.00240.00180.00080.00150.03980.0396
Cfripv
0.0007
0.00030.00170.003
0.0009
00.1632
0.0810.00260.00050.00160.0014
0.0022
0.00050.0729
0.05620.0002
0.0070.00440.0020.00080.0030.02730.0246
AvgHard
80.76
109.5880.76109.5880.76
109.5880.76
109.5847.05
62.7947.0562.79
47.0562.7947.05
62.7954.776.1954.776.1954.776.1954.776.19
AcuteTVS
0.00290.00410.011
0.01460.0511
0.07130.0978
0.12660.0016
0.00220.00660.0087
0.0282
0.03880.0619
0.0790.0019
0.00280.00760.01040.03330.0480.0703
0.0931
ChronicTVS
0.0019
0.00240.00750.00970.002
0.00280.09830.12730.0013
0.00160.00470.006
0.00110.00150.0622
0.07940.0014
0.00180.00530.00710.00130.00190.07060.0935
000000659920106752012100122
10014065109172
132
665201421219122
By Flow
%>Acute
0.000.000.000.000.000.0060.0041.674.254.810.950.000.500.0031.4630.77
0.001.121.961.180.000.0011.652.44
Period
%>Chronic
10.000.000.008.33
44.44
0.0060.0041.674.724.818.101.096.531.10
30.99
30.77
0.001.123.922.3511.8822.09
11.652.44
Across a
%>Acute
0.00
0.00
0.00
50.00
4.51
0.51
0.26
31.15
0.53
1.60
0.00
7.57
11 Flows
%>Chronic
4.55
4.55
20.00
50.00
4.76
4.82
3.94
30.89
0.53
3.21
16.58
7.57
ND-No data
Page 1 of 2
Table 6- itinued
Reach
8
9
10
Analyte
Cd
Cu
Pb
Zn
Cd
Cu
Pb
Zn
Cd
Cu
Pb
Zn
Flow
HLHLHLHLHLHLHLHLHLHLHLHL
StaCnt
686767672323232322222222
n
19419918719719620419117812231225112812202120212022201817
Min
0.000050.000050.00010.00010.00050.00050.0030.001
0.000050.000050.00030.00010.000250.000250.00150.00150.000050.000050.00050.00020.00050.00050.0030.003
Max
0.00090.00210.0390.01010.01310.16770.2260.175
0.000250.00020.004
0.00770.0020.0010.0610.05
0.00010.00030.0030.0020.0020.00050.0470.048
Avg
0.00010.00010.00190.00120.00080.00170.04070.0360.00070.00060.00120.00130.00060.00050.02410.01480.00010.00010.00070.00070.00060.00050.02160.0143
Stdev
0.00010.00020.00330.00130.00140.0120.03430.0250.0001
0.000030.00120.00190.00050.00020.01920.01330.000020.00010.00060.00040.0004
00.01550.0143
AvgHard
75.72107.4875.72107.4875.72107.4875.72107.48118.61159.76118.61159.76118.61159.76118.61159.76167.59200.38167.59200.38167.59200.38167.59200.38
AcuteTVS
0.00270.004
0.01030.01440.04760.06990.09260.12460.00450.00620.01580.02090.07770.10710.13540.17430.00650.00790.02190.02590.11280.13640.18150.2112
ChronicTVS
0.00180.00240.00710.00950.00190.00270.09310.12520.00250.00320.01040.01340.0030.00420.13610.17520.00330.00370.01390.01620.00440.00530.18240.2123
>Acute
0020011640000000000000000
>Chronic
0031
1251540000000000000000
By Flow Period%>Acute
0.000.001.070.000.000.498.382.25
0000000000000000
%>Chronic0.000.001.600.516.122.457.852.25
0000000000000000
Across all Flows%>Acute
0.00
0.52
0.25
5.42
0
0
0
0
0
0
0
0
%>Chronic0.00
1.04
4.25
5.15
0
0
0
0
0
0
0
0
Note: Only reaches where data are available are shown.ND-No data
Page 2 of 2
Table 6-4
Summary Statistics for Surface Water Concentrations of Total Cadmium, Copper, Lead, and Zinc in theDownstream Area during Period 1
Reach
7
8
9
Analyte
Cd
Cu
Pb
Zn
Cd
Cu
Pb
Zn
Cd
Cu
Pb
Zn
Flow
HLHLHLHLHLH
LHLHLHLHLHLHL
StaCnt
1111111132212121
32222222
n
2102135106
269167188171127713618618619
Min
0.0010.0004
0.0130.002
0.0070.004
0.080.05
0.00019
0.00030.0047
0.0020.00050.007
0.0590.02
0.000150.00015
0.0030.0025
0.0045
0.0020.040.01
Max
0.009
0.0014
0.0210.015
0.0390.040.480.220.0490.004
0.039
0.0460.14
0.1050.860.65
0.00410.01
0.0580.033
0.120.0940.770.27
Avg
0.005
0.00080.0170.007
0.02260.0116
0.20170.12580.0079
0.00130.0137
0.00910.04210.0205
0.24810.1341
0.0020.0012
0.02250.0073
0.0579
0.01190.3483
0.0826
StdDev
0.0057
0.00030.0057
0.0033
0.01150.0115
0.15180.04510.01550.0012
0.0123
0.00960.0528
0.02750.2508
0.14390.00160.0027
0.01960.0072
0.0501
0.02150.269
0.065ND-No data
Table 6-5
Summary Statistics for Surface Water Concentrations of Total Cadmium, Copper, Lead,and Zinc in the Downstream Area during Period 2
Reach
6
7
8
9
irt
Analyte
Cd
Cu
Pb
Zn
Cd
Cu
Pb
Zn
Cd
Cu
Pb
Zn
Cd
Cu
Pb
Zn
Ce\
fnV_U
Ph
7n
Flow
HLHLHLHLHLHLHLHLHLHLHLHLHLHLHLHLHLHLHLHL
StaCnt
77674561444444447969696834343434444444
44
n
916447
59395351615064235120552758647938703574
4376244320341935203684858889858592103
Min
0.000050.000050.00050.00050.00050.00050.0190.005
0.000050.000050.00230.00110.00050.00050.040.045
0.000050.000050.00180.00050.00050.00050.0030.02
0.000050.000050.005
0.00220.004
0.00050.0050.005
0.000050.000220.001
0.00120.00050.00050.001
0.0025
Max
0.010.010.0640.1750.0430.0380.840.940.0050.010.06
0.01580.05
0.0210.670.270.010.010.080.180.0530.0430.820.3
0.0050.0050.070.0260.098
10.790.240.010.010.430.0480.0250.08
0.5150.1
Avg
0.00120.00140.00810.006
0.00850.00430.16010.13290.0010.00090.01330.00560.01680.00610.19010.12360.00150.00110.01260.01070.01490.006
0.18790.08140.00250.00160.02230.00790.02090.03460.187
0.06820.00270.00310.01030.00720.00420.00550.01740.0162
StdDev
0.00170.00240.01070.02260.01180.00780.17140.14120.00110.00180.01250.00270.01560.00480.14690.05060.00220.00220.01390.02610.01420.00730.18920.05490.00210.00210.01780.006
0.02130.16810.16420.05560.003
0.00290.04550.00720.00390.009
0.05350.0169
Table 6-6
Summary Statistics for Surface Water Concentrations of Total Cadmium, Copper, Lead,and Zinc in the Downstream Area during Period 3
ReachJAoalyte
5
6
7
8
Cd
Cu
Pb
Zn
Cd
Cu
Pb
Zn
Cd
Cu
Pb
Zn
Cd
Cu
Pb
Zn
Flow
HLHLHLHLHLHLHLHLHLHLHLHLHLHLHLHL
StaCnt
1
11
11111989898982222222266666666
n
10
12101210121012
21618921418720417621818910057100551005710157
220207218202221205218200
Min
0.000340.000420.00280.00140.00380.0010.0820.052
0.000050.000050.00050.00050.00050.0005
0.010.005
0.000050.000050.00050.00050.00050.00050.0050.005
0.000050.000050.00050.00050.00050.00050.0050.005
Max
0.003490.00119
0.0150.00520.0450.00740.6920.3930.0280.0080.0750.00660.04080.013
10.4610.00550.0010.055
0.01112.7210.02640.3540.2680.005
0.002180.0890.0450.0703
0.20.4820.45
Avg
0.00130.00080.00580.00290.01230.00480.27620.18130.00090.00050.00470.00230.00630.00.140.12260.09020.00050.00030.00530.00290.03070.00190.0760.05870.00040.00020.00530.00360.00690.00290.102
0.0551
StdDev
0.00110.00020.00380.001
0.01250.002
0.20920.08710.00240.00080.00570.00120.00880.00220.11980.07180.00080.00030.00920.00210.27190.00480.06890.0450.00050.00040.00780.00470.01030.01490.08460.053
Page 1 of 2
Table 6-6 ContinuedReach|Analyte
9
10
Cd
Cu
Pb
Zn
Cd
Cu
Pb
Zn
FlowHLHLHLHLHLHLHLHL
StaCnt2323232322222222
n142814
281329142821
25212521252125
Min0.000050.000050.00260.00150.00050.00050.0250.011
0.000050.000050.00050.00050.00050.00050.0050.005
Max0.0020.0020.02930.0340.04
0.0430.3230.14
0.0010.0010.00680.00410.00610.0030.06
0.056
Avg
0.00040.00030.00840.00460.00810.00330.09760.03490.00020.00030.00230.00150.00130.00070.02430.014
StdDev0.00050.00040.00740.0060.01240.0080.09530.023
0.00030.00040.00150.00090.00150.00050.01550.0127
Page 2 of 2
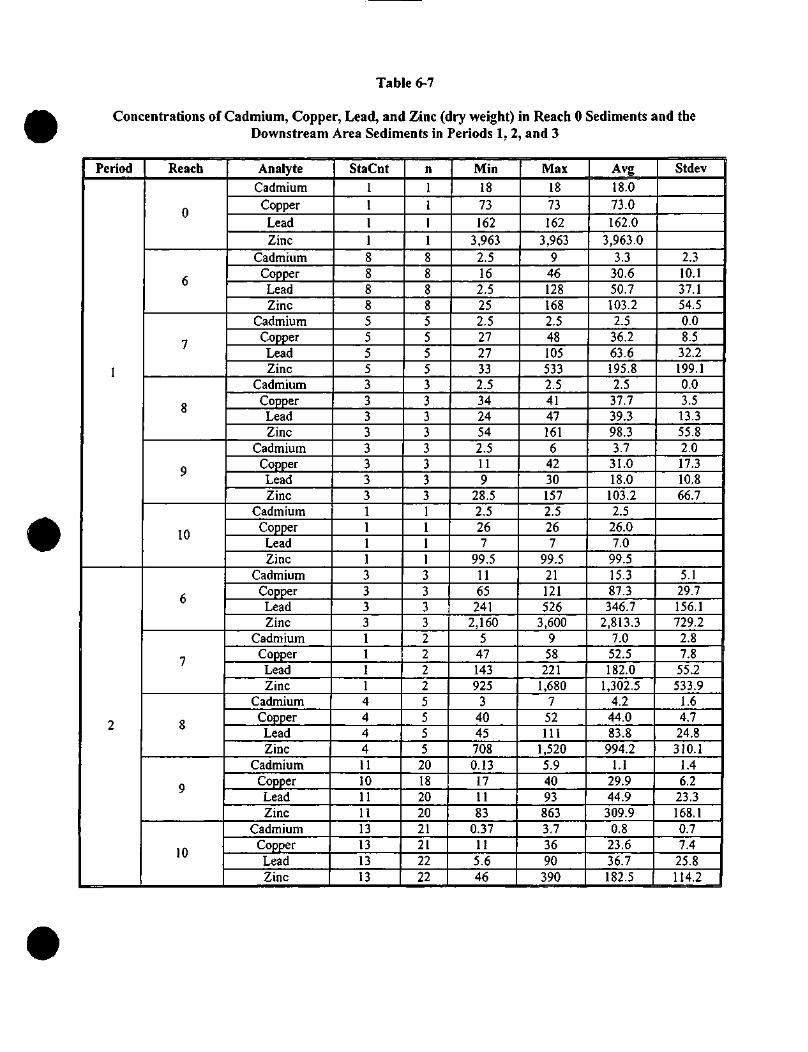
Table 6-7
Concentrations of Cadmium, Copper, Lead, and Zinc (dry weight) in Reach 0 Sediments and theDownstream Area Sediments in Periods 1, 2, and 3
Period
1
2
Reach
0
6
7
8
9
10
6
7
8
9
10
AnalyteCadmiumCopperLeadZinc
CadmiumCopperLeadZinc
CadmiumCopperLeadZinc
CadmiumCopperLeadZinc
CadmiumCopperLeadZinc
CadmiumCopperLeadZinc
CadmiumCopperLeadZinc
CadmiumCopperLeadZinc
CadmiumCopperLeadZinc
CadmiumCopperLeadZinc
CadmiumCopperLeadZinc
StaCnt1111888855553333333311113333111144441110111113131313
n111188885555333333331111333322225555
2018202021212222
Min1873162
3,9632.5162.5252.52727332.53424542.5119
28.52.5267
99.51165
2412,160
5471439253
40457080.13
171183
0.37115.646
Max1873162
3,9639
461281682.5481055332.541471616
42301572.5267
99.521121526
3,6009
58221
1,6807
52111
1,5205.940938633.73690390
Avg18.073.0162.0
3,963.03.3
30.650.7103.22.5
36.263.6195.82.5
37.739.398.33.7
31.018.0
103.22.5
26.07.0
99.515.387.3
346.72,813.3
7.052.5182.0
1,302.54.2
44.083.8
994.21.1
29.944.9309.9
0.823.636.7182.5
Stdev
2.310.137.154.50.08.5
32.2199.10.03.513.355.82.017.310.866.7
5.129.7156.1729.22.87.8
55.2533.9
1.64.724.8
310.11.46.2
23.3168.10.77.4
25.8114.2
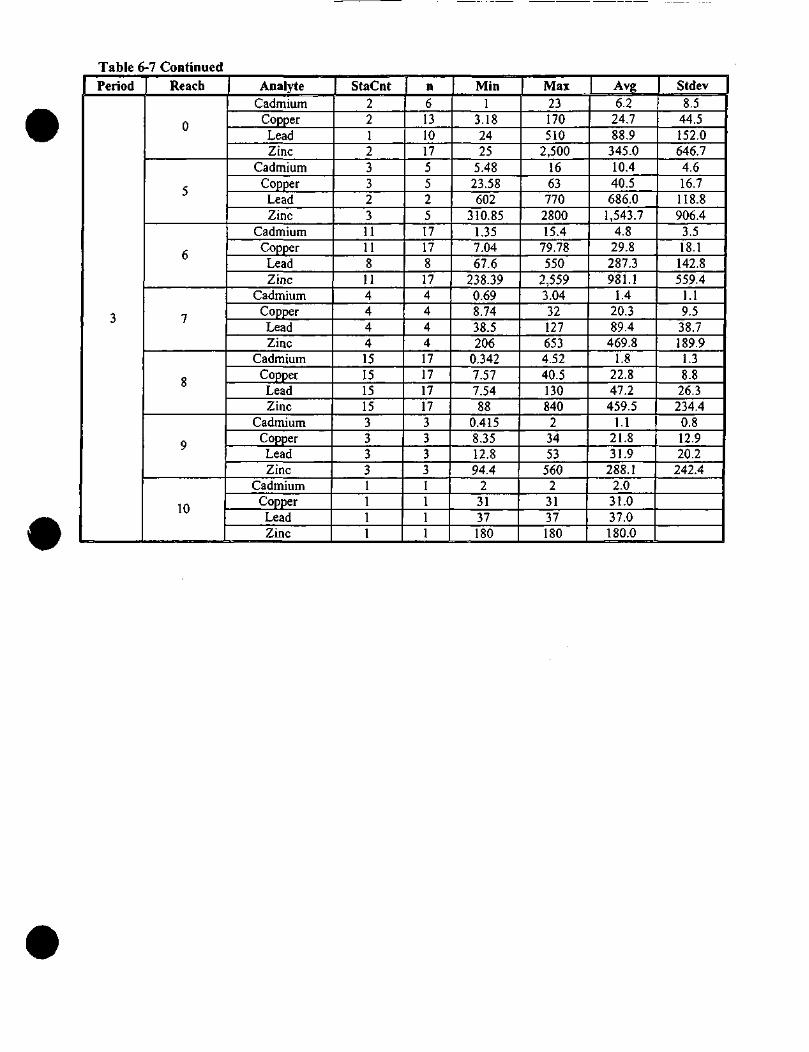
Table 6-7 ContinuedPeriod
3
Reach
0
5
6
7
8
9
10
Analyte | StaCntCadmium
CopperLeadZinc
CadmiumCopperLeadZinc
CadmiumCopper
LeadZinc
CadmiumCopperLeadZinc
CadmiumCopperLeadZinc
CadmiumCopperLeadZinc
CadmiumCopperLeadZinc
22123323111181144441515151533331111
n61310175525171781744441717171733331111
Min1
3.182425
5.4823.58602
310.851.357.0467.6
238.390.698.7438.5206
0.3427.577.5488
0.4158.3512.894.4
23137180
Max23170510
2,5001663770
280015.4
79.78550
2,5593.04321276534.5240.513084023453
5602
3137180
Avg6.2
24.788.9
345.010.440.5686.0
1,543.74.8
29.8287.3981.1
1.420.389.4
469.81.8
22.847.2
459.51.1
21.831.9
288.12.0
31.037.0180.0
Stdev8.5
44.5152.0646.74.616.7
118.8906.4
3.518.1
142.8559.4
1.19.5
38.7189.9
1.38.8
26.3234.40.812.920.2
242.4
Table 6-8
Summary Table of Groundwater Data (mg/L) in Reaches 5 through 10 for Periods 1, 2, and 31
Deep WellsReach
6666
66666666
6666666666666666
677777888888888999
Date
6/4/852/16/883/26/913/26/91
12/17/925/10/935/10/946/3/946/8/94
6/19/946/29/947/19/94
7/27/949/9/965/12/975/20/976/16/976/17/976/23/976/26/976/7/991/31/001/31/004/27/005/9/00
5/10/005/18/005/31/00
6/21/004/27/735/12/925/2/94
6/18/974/24/004/26/734/27/734/29/735/4/946/29/944/7/97
6/16/976/19/006/26/004/15/724/26/735/26/73
Cadmium
0.000040.00005 <
0.0025 <
0.0005 <0.0001 25 <
0.0005 <
0.000125 <
0.0005 <
0.000125 <
0.0001 5 <0.0001 5 <0.0001 5 <0.00005 <0.00005 <0.0001 5 <0.0001 5 <0.00005 <
0.000125 <0.000125 <0.000 15 <
0.000125 <0.000125 <0.000125 <
0.00040.00015 <
Copper'
0.020.0060.0070.080.0040.0010.0080.012
0.020.017
0.020.0005 <
0.0040.0040.0070.0350.16
0.002 <
0.00120.01 <0.14
0.0760.015
O.OK
0.002 <0.2
0.0130.393
0.01
0.03
Lead'0.016
0.0010.009
0.01 <
0.0005 <0.0025 <
0.002
0.002
0.0050.0005 <
0.004
0.0005 <0.002
0.0005 <
0.0020.0005 <0.0005 <
0.003
0.0025 <0.0005 <
0.001 <0.0030.002
0.0025 <0.0025 <0.0005 <
0.002
Zinc'
0.03
0.250.120.09
0.030.030.06
Well-ID1 08800-00 1 @ Shangri La TC, Well ft 1
108550-001 @ Mt Princeton MHP & RVP, Well #1108450-001 @ Collegiate Valley MV, Block Well
108550-001 @ Mt Princeton MHP & RVP, Well #1108100-001 ©Snowy Peaks RV& MHP, Well #1 -
Irrigation only108350-001 @ Buena Vista Correctional Fac., Cistern
108950-001 @ Valley MHP, Blend Tank #1108050-001 @ Pinon Pines MHP, Well #1
108800-001 @ Shangri La TC, Well #1108100-002 @ Snowy Peaks RV & MHP, Well #2108450-001 @ Collegiate Valley MV, Block Well
108550-001 @ Mt Princeton MHP & RVP, Well #11081 00-004 @ Snowy Peaks RV & MHP, Well #4 (aka
NEW WELL)108350-001 @ Buena Vista Correctional Fac., Cistern
1 08800-00 1 @ Shangri La TC, Well # 1108100-002 @ Snowy Peaks RV & MHP, Well #2
108950-001 @ Valley MHP, Blend Tank #1108550-001 @ Mt Princeton MHP & RVP, Well #1
108050-001 @ Pinon Pines MHP, Well #1108450-001 @ Collegiate Valley MV, Block Well
108350-001 @ Buena Vista Correctional Fac., Cistern208200-OOJjg Chateau Chaparral CG, Well #1208200-002 @ Chateau Chaparrel CG, Well #2
108550-001 @ Mt Princeton MHP & RVP, Well #11 08950-00 1 @ Valley MHP, Blend Tank # 1
1 08800-00 1 @ Shangri La TC, Well # 1108050-001 @ Pinon Pines MHP, Well #1
1 08450-001 @ Collegiate Valley MV, Block Well108100-005 @ Snowy Peaks RV & MHP, Pipeline for
Wells #2 & #4383254 1 060 1 0200 @ NA0500093 1 BAB
108400-001 @ Fesslers MHP, Well #1 / West108400-001 @ Fesslers MHP, Well #1 / West108400-001 @ Fesslers MHP, Well #1 / West
1 08400-003 @ Fesslers MHP, Wells #1 and #238291 2 105225200® SCI 8-71-1 8BBB
382310105460800 @ NA04801 129ACC3822 15 10541 2000 @ NA04801231BBD
108600-001 @ Mountain Vista Village, Pump House Tank108200-001 @ Big Springs TP, Big Spring
108600-001 @ Mountain Vista Village, Pump House Tank1 08200-00 1 @ Big Springs TP, Big Spring1 08200-00 1 @ Big Springs TP, Big Spring
108600-001 @ Mountain Vista Village, Pump House Tank382359105070900 @ SC01906916BAD33820361 04555600 @ SC02006706BAD381846104514100 @ SC02006714BAC
Data Source68686868
6868686868686868
68686868686868686868686868686868
683168686868313131686868686868313131
Other (springs, etc)Reach
888
Date9/29/7510/10/756/2/1976
Cadmium
0.001 <
Capper0.001 <
Lead0.0045 <
Zinc0.02
0.01 <0.02
Well-ID382557 105 1 54600 @ CANON CITY HOT SPRING
382907105544100 @ WELLSVILLE WARM SPRINGS382849105532500 @ SWISSVALE WARM SPRING A
Data Source313131
Well Depth UnknownReach
88
Date | Cadmium4/27/734/27/73
Copper0.01 <
Lead0.0070.005
Zinc0.020.38
Well-ID382842 1 055341 00 @ NA49-1 0-20CDD382843105534300 @ NA49-IO-20CDC
Data Source
3131
Data is from Consulting Team database.:MCL = 0.005 mg/L.3There is no MCL for copper, but it has a drinking water supply standard of 1.3 mg/L in Colorado.JTher is no MCL for lead, but it has an action level of 0.015 mg/L in Colorado.5MCL = 5.0 mg/L.< Indicates non-detect. For non-detects. one half of the detection l imit is shown in this table as the data value.For data set 68 CDPHE data, values are for total metals concentrations. For all other data sets, values are dissolved metals concentrations.
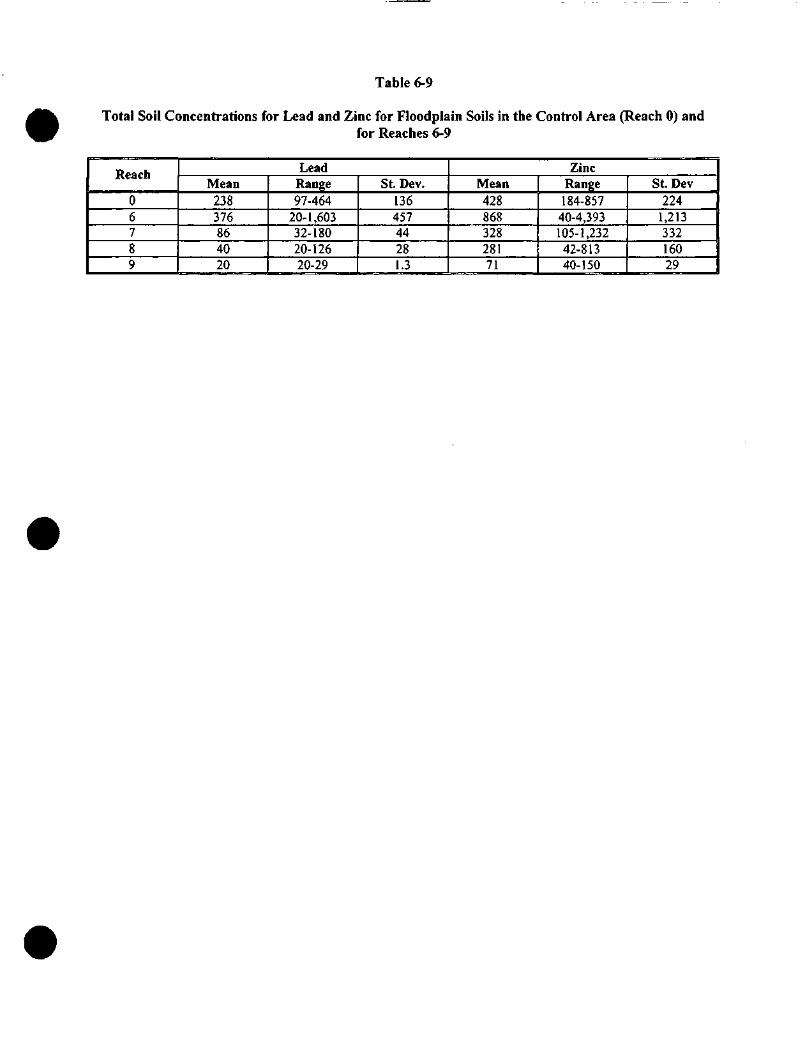
Table 6-9
Total Soil Concentrations for Lead and Zinc for Floodplain Soils in the Control Area (Reach 0) andfor Reaches 6-9
Reach
06789
LeadMean238376864020
Range97-464
20-1,60332-18020-12620-29
St. Dev.13645744281.3
ZincMean42886832828171
Range184-857
40-4,393105-1,23242-81340-150
St. Dev224
1,21333216029
Table 6-10
Average Metals Concentrations in Mixed Invertebrate Speciesby Reach and by Year from the Downstream Area (ppm, wet weight)'
Year (sample size) Cadmium Copper Lead ZincReach 5
1995 (n=l)1996 (n=l)1997(n=l)1998 (n=3)
2.13.20.30.8
12.07.99.67.4
20.525.31.9
12.8
244.5338.0108.6198.0
Reach 61995(n=l)1996 (n=4)1997 (n=2)1998 (n=4)
3.83.50.80.8
13.112.27.76.4
88.234.98.711.0
671.8352.8143.6170.3
Reach 71998 (n=3) 0.6 6.6 | 1.7 153.7
Reach 81995 (n=3)1996 (n=3)1997 (n=7)1998 (n=17)
0.51.50.90.3
5.67.68.96.7
6.96.24.91.3
142.5184.3188.6109.3
Reach 91998 (n=2) 0.1 4.9 1.5 41.4
'Data from Archuleta ct al. (2000)
Table 6-11
Average Metal Concentrations in Mixed Invertebrate Speciesby Downstream Reach Compared to Reach 0 (ppm, wet weight)'
Reach (sample size)Reach 0 (n= 12)Reach 5 (n=6)Reach 6 (n= 11)Reach 7 (n=3)Reach 8 (n=30)Reach 9 (n=2)
Benchmark
Cadmium1.61.32.10.60.60.12.0
Copper5.68.59.36.67.14.9NR
Lead2.514.326.31.73.21.52.0
Zinc119.7214.2277.4153.7138.641.450.0
NR - Not Reported
Table 6-12
Average Metals Concentrations in American Dipper Bloodand Liver Samples From Reaches 5-8 (ppm, wet weight)1
BloodReach 5Reach 6Reach 7ReachSReach 0
StudyReference
BenchmarkLiver
Reach 5Reach 6Reach 7ReachSReach 0
StudyReference
Benchmark
n51043014
27
--
242134
14
--
Cadmium0.040.010.010.010.04
0.01
NR-1
Copper0.290.160.070.130.23
0.16
NR
Lead0.220.130.040.050.11
0.04
0.20
1 10.142.000.030.170.84
0.21
40.00
10.008.0910.005.865.39
6.90
NR
0.610.840.040.090.19
0.01
2.00
Zinc6.293.772.884.0013.93
4.09
60.00
25.8629.7922.1825.5734.31
21.38
60.00
2Study Reference Site: Poudre River, Colorado3NR - Not Reported
Table 6-13
American Dipper ALAD for Reaches 5, 6, 7, 8, 0 and the Study Reference1
Location
Reach 5Reach 6Reach 7Reach 8Reach 0
Study Reference
N
494
- 241023
ALAD Activity
6125306299037351203
% ALAD ReductionCompared to theStudy Reference2
4956482539
% ALAD ReductionCompared to Reach 0
1728140
'From Archuleta et al. 20002Study Reference Site: Poudre River, Colorado
Table 6-14
Tree Swallow ALAD for Reaches 7, 8, 0 and the Study Reference1
Location
Reach 7Reach 8Reach 0
Study Reference2
N
626
2120
ALAD Activity
65485574
% ALAD ReductionCompared to theStudy Reference
124031-
% ALAD ReductionCompared to Reach 0
013—0
2Study Reference Site: Casper, WY, Pueblo, CO, and Agassiz National Wildlife Refuge, Minnesota
Table 6-15
Average Metals Concentrations in Tree SwallowLiver Samples from Reaches 6-8 (ppm, wet weight)1
LiverReach 6Reach 7ReachSReach 0
StudyReference
Benchmark
n109310
30
--
Cadmium | Copper0.160.130.120.05
<dl
40.00
5.955.649.045.16
17.71
NR
Lead0.060.050.210.06
<dl
2.00
Zinc22.4521.1720.7721.09
70.8
60.00
NR - Not Reported< - Less Than Detection Limit
Table 6-16
Average Metals Concentrations (M-g/g) in Sediment Samples at Pueblo Reservoir from1972 to 1988
Pre-impoundment ( 1972- 1974) '
Post-impoundment (1974-1976) 'Mueller etal. (1991) 2
Lewis and Edelmann (1994) 3
Cadmium
4.20
4.40
2.0
—
Copper
31.1
37.2
40
35
Lead
65.0
99.9261
52
Zinc
113394
360
2781 Data from Herrmann and Mahan (1977)1 One Sampling Site1 Mean From All Samples

FIGURES
Color Map(s)
The following pagescontain color that does
not appear in thescanned images.
To view the actual images, pleasecontact the Superfund Records
Center at (303) 312-6473.
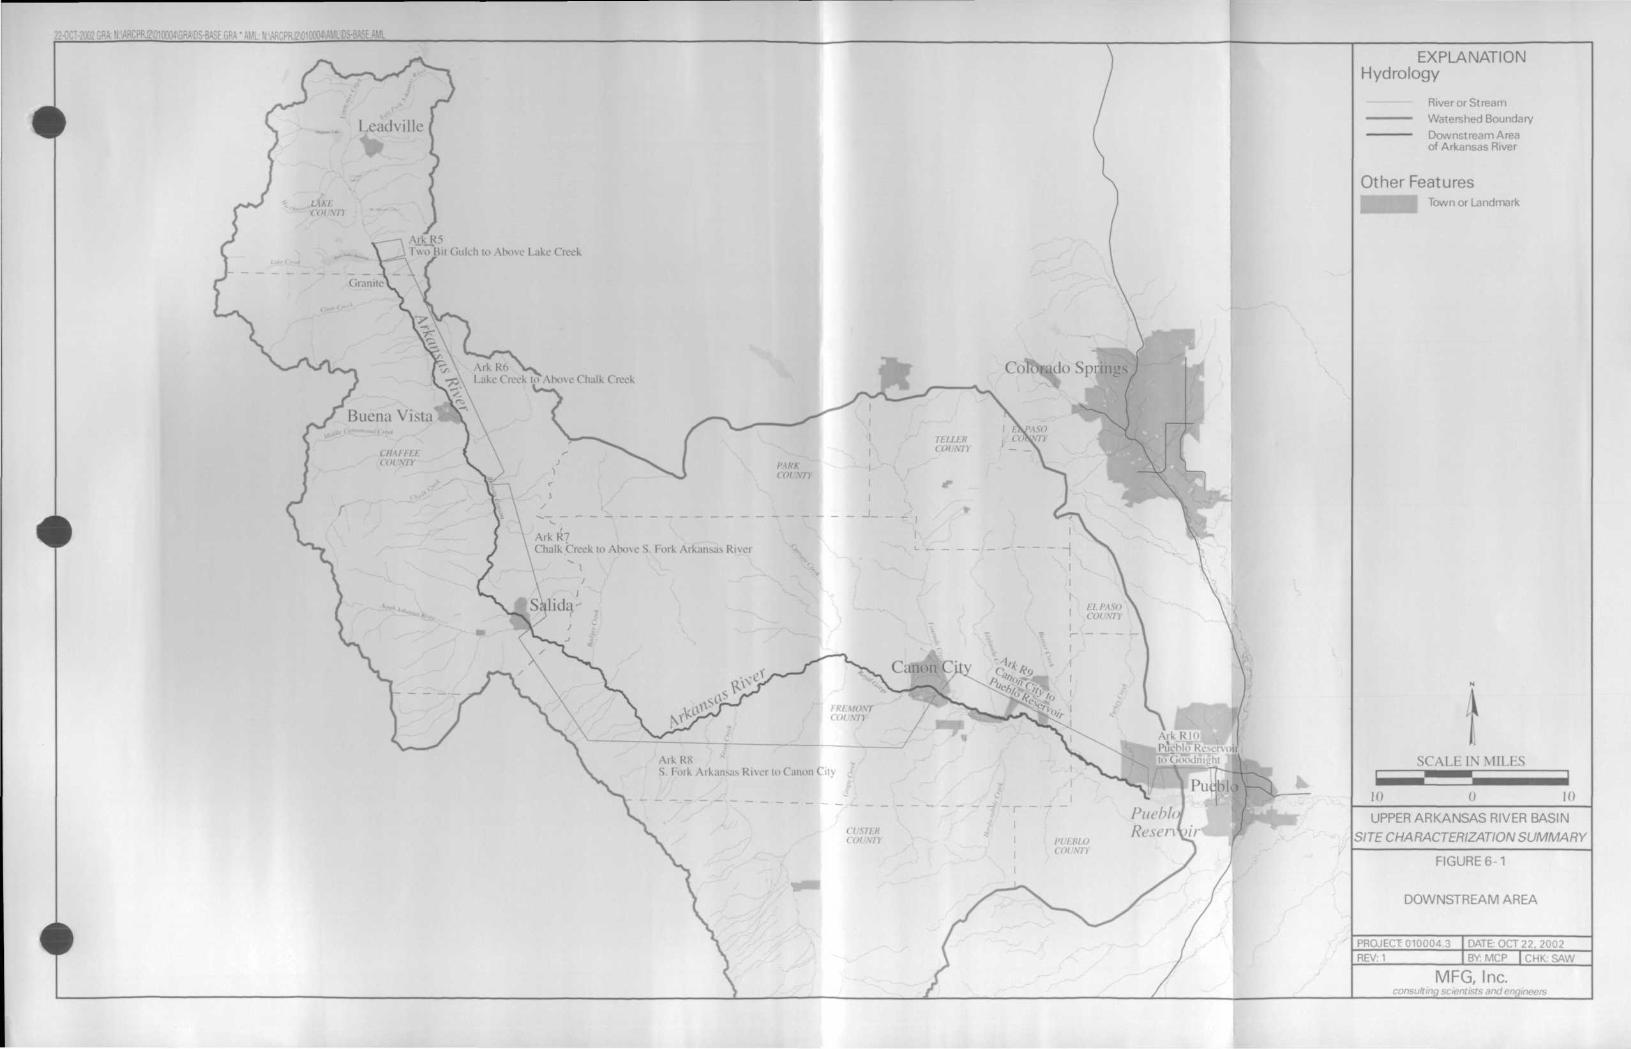
-J : -RA\DS-BASE.G;
ArkR5Two Hi i ( i i i l c h to Above l .ak
Lake Creek lo Above Chalk Creek
Buena V i s t a
Ark R7Chalk Creek 10 Ahcne S. I ork Arkansas R i \ c r
PuebURe sen
EXPLANATIONHydrology
River or Stream^^— Watershed Boundary•^^^^— Downstream Area
of Arkansas River
Other FeaturesTown or Landmark
10
S C A I . H 1 N M i l . I S
10
UPPER ARKANSAS RIVER BASIN
SITE CHARACTERIZATION SUMMARY
FIGURE 6-1
DOWNSTREAM AREA
PROJECT 010004.3 DATE: OCT 22, 2002REV: 1 BY: MCP I CHK: SAW
MFC, Inc.consulting scientists and engineers
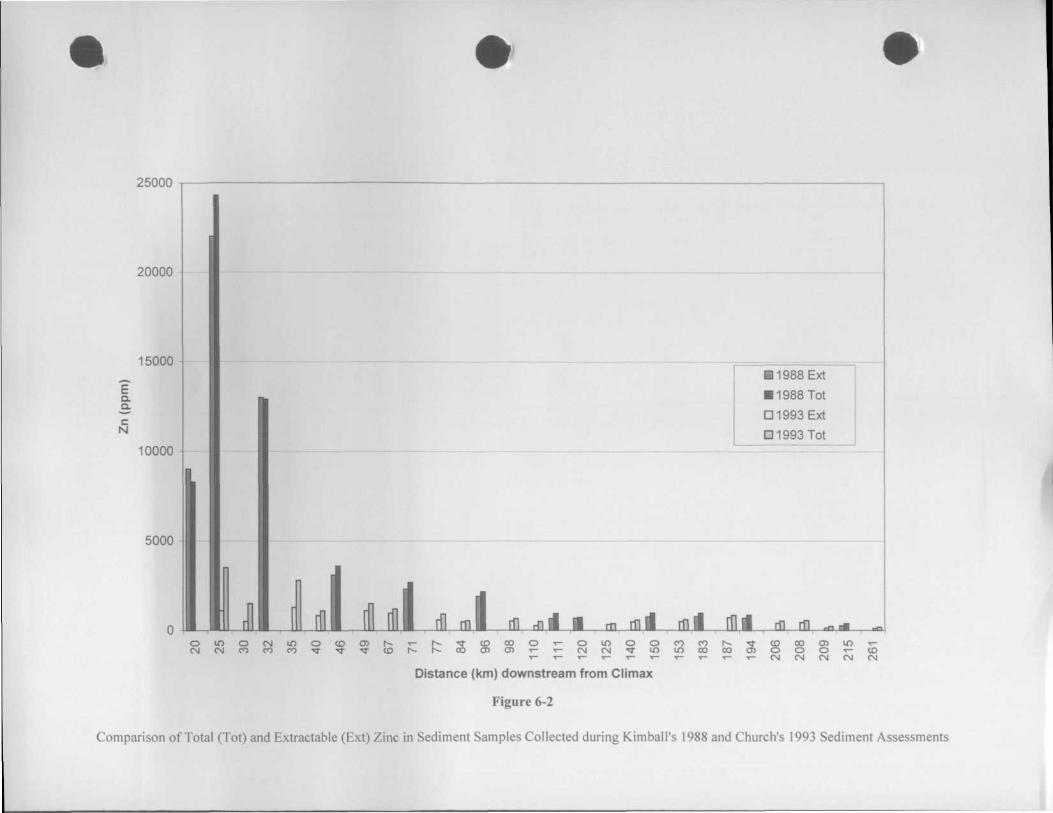
25000
20000
15000 -
a
N
10000
5000
D 1o m oCN CN OO
• 1988 Ext
• 1988 Tot
D 1993 Ext
D 1993 Tot
I I 1(H itll HI ml ril rfifl • m ml ml fill rfi m
CM CM CM CM CM
Distance (km) downstream from Climax
Figure 6-2
Comparison of Total (Tot) and Extractable (Ext) Zinc in Sediment Samples Collected during Kimball's 1988 and Church's 1993 Sediment Assessments
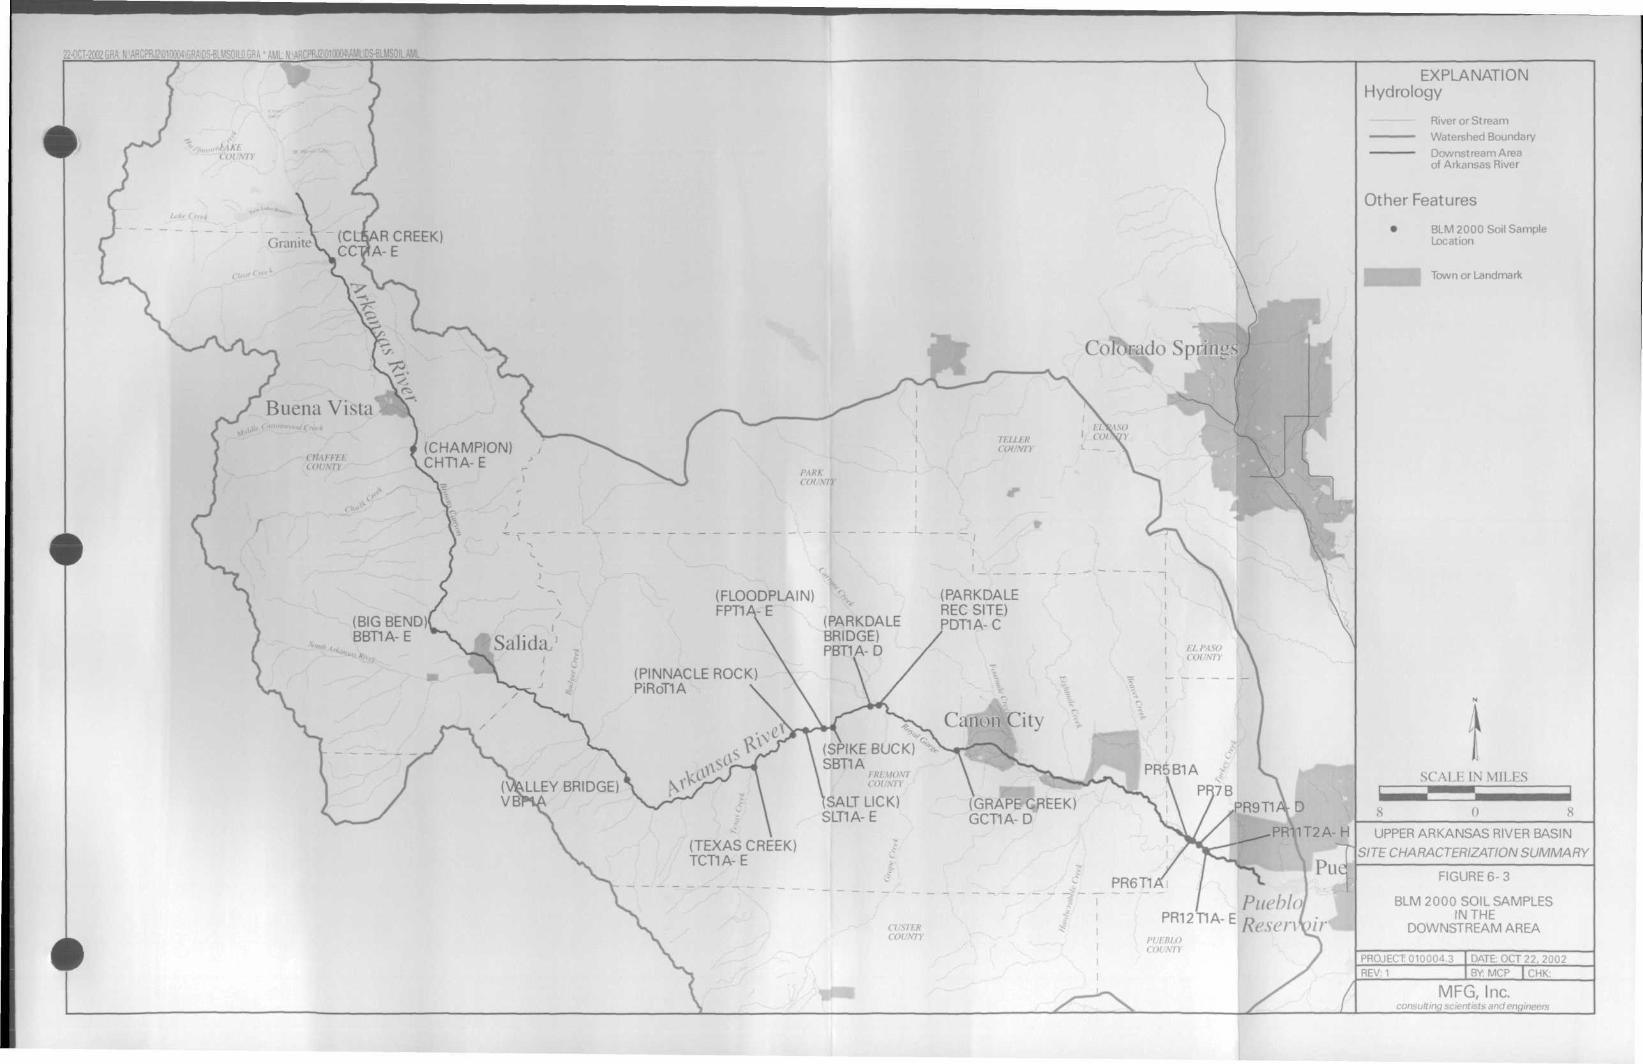
22-01T-: ;ML: N: ARCPRffOIOOMMlDS-BLMSOILAML
I
EXPLANATIONHydrology
River or Stream
Watershed Boundary
Downstream Areaof Arkansas River
< \A/
Other Features
• BLM 2000 Soil SampleLocation(CLEAR CREEK)
CCHA- E
Town or Landmark
Colorado Spri'ngs^- !
Buena Vista
(CHAMPION)CHT1A-E
(PARKDALEREC SITE)PDT1A-C
(FLOODPLAIN)FPT1A-E
(BIG BEND)BBT1A- E
(PARKDALEBRIDGE)PBT1A-DSaliday
i(PINNACLE ROCK)PiRoTIA
Canon City(SPIKE BUCK)SBT1A
FBI SCALE IN MILES5
(VALLEY BRIDGE)VB SALT LICK)
SLT1A-E(GRAPE CREEK)GCT1A- D
T2A-H UPPER ARKANSAS RIVER BASIN(TEXAS CREEK)TCT1A-E
SITE CHARACTERIZATION SUMMARY
BLM 2000 SOIL SAMPLESIN THE
DOWNSTREAM AREA
PROJECT 010004.3 DATE: OCT22, 2002BY: MCP | CHK:
MFC, Inc.consulting scientists and engineers
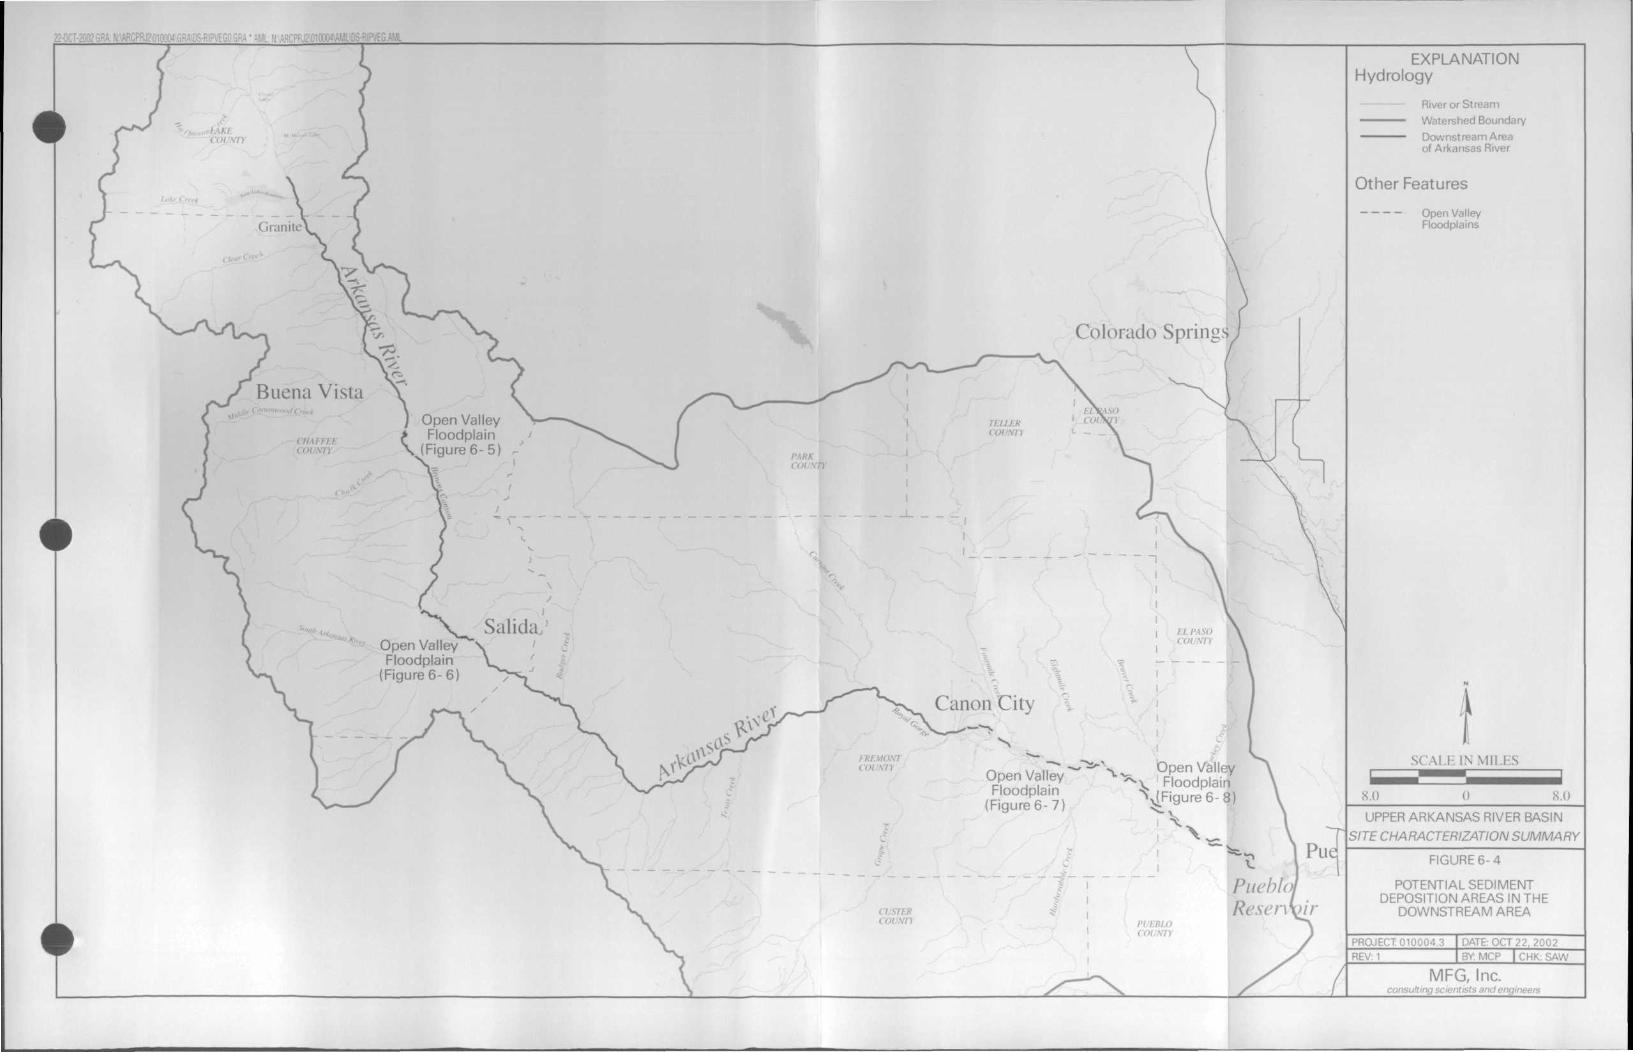
22-OCT-2CC- II - :VEG.AML
f
Colorado Springs
Buena VistaOpen Valley
> Floodplain\ (Figure 6 -5 ) .-''
Open ValleyFloodplain
(Figure 6 -6 )
Canon City
Open Valley; Floodplain
\(Figure 6- 8)
Open ValleyFloodplain
(Figure 6 - 7 )
EXPLANATIONHydrology
River or StreamWatershed BoundaryDownstream Areaof Arkansas River
Other Features
Open ValleyFloodplains
8.0
SCALE I N M I L H S
8.0
UPPER ARKANSAS RIVER BASIN
SITE CHARACTERIZATION SUMMARY
FIGURE 6-4
POTENTIAL SEDIMENTDEPOSITION AREAS IN THE
DOWNSTREAM AREA
PROJECT 010004.3 DATE: OCT 22. 2002REV: 1 BY: MCP | CHK: SAW
MFC, Inc.consulting scientists and engineers
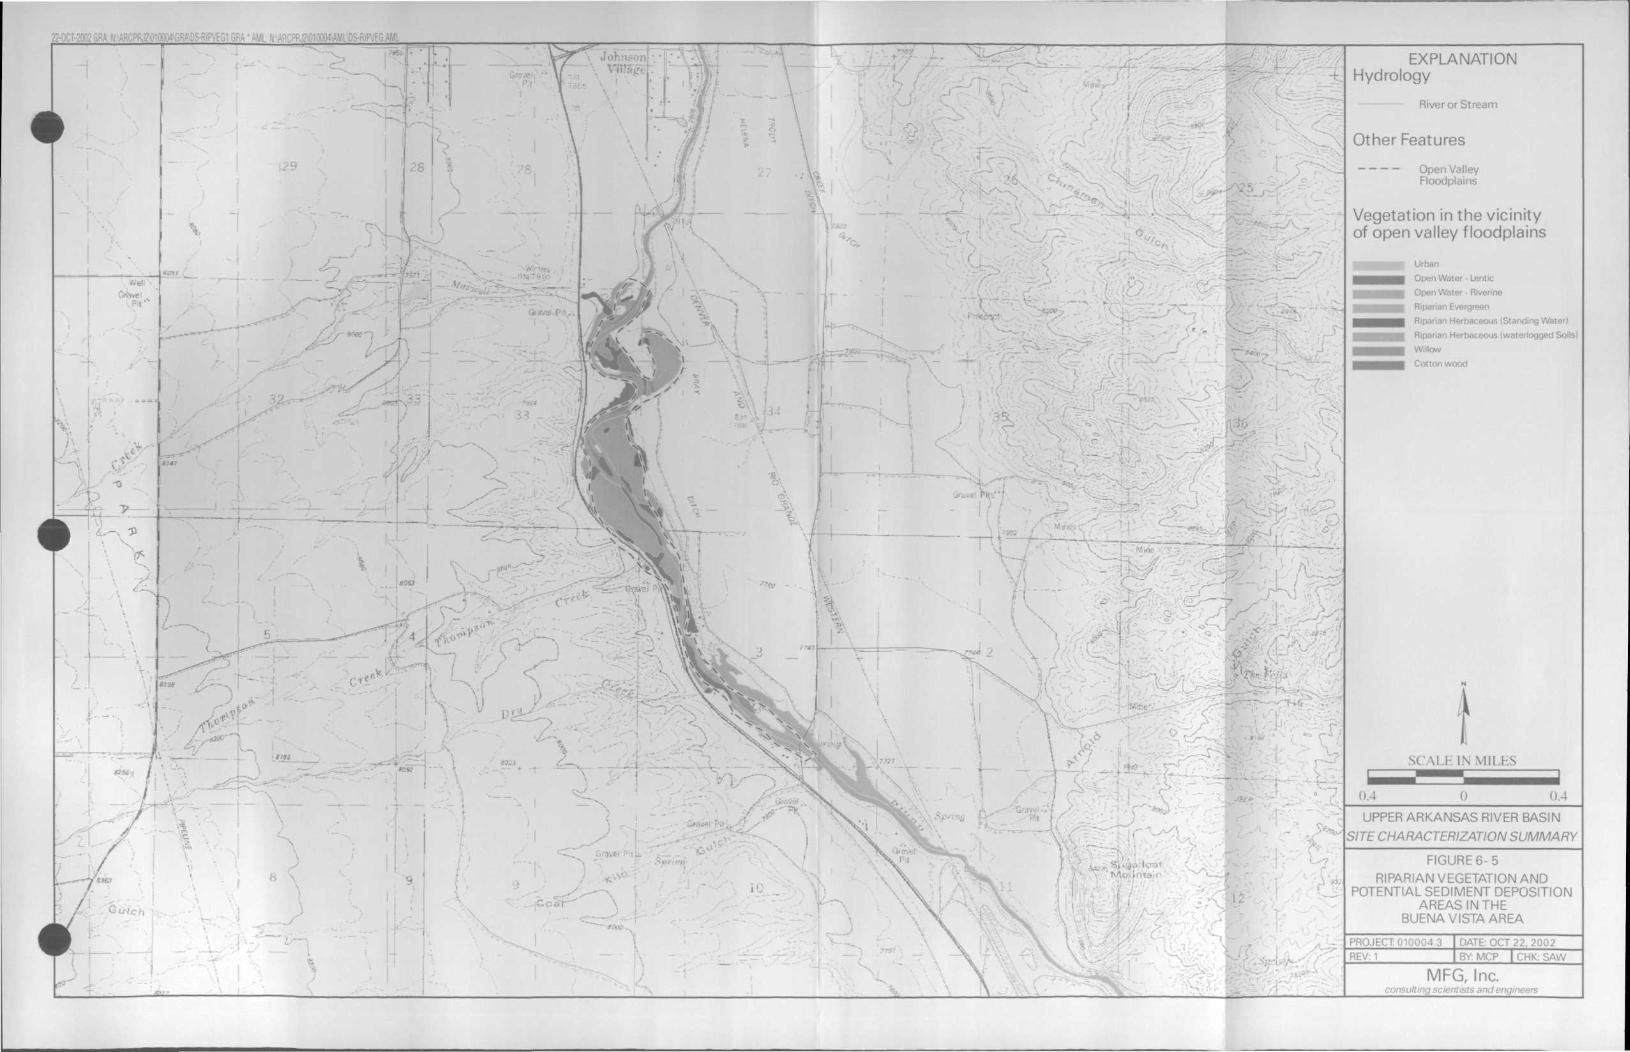
22-OCT-2002 GRA: NMRCPRJMIOOMGRffiDS-Ri". - 3VEG.AML
EXPLANATIONHydrology
xx«, •
" .
Open ValleyFloodplains
Vegetation in the vicinityof open valley f loodplains
Urban
Open Water - Lentic
Open Water • Riverine
Riparian Evergreen
Riparian Herbaceous (Standing Water
Riparian Herbaceous (waterlogged Soils]
Willow
Cotton wood
-
-
-..
•
I
. I •--;-•
.'
- - '
" - ' ; • • •
-
\ r~ •*
•
UPPER ARKANSAS RIVER BASIN
SITE CHARACTERIZATION SUMMARY
FIGURE 6-5RIPARIAN VEGETATION AND
POTENTIAL SEDIMENT DEPOSITIONAREAS IN THE
BUENA VISTA AREA
- m7 '••;"/; I -
PROJECT 010004.3 DATE: OCT 22, 2002
2?M>•;'.-».-
consulting scientists and enqineers
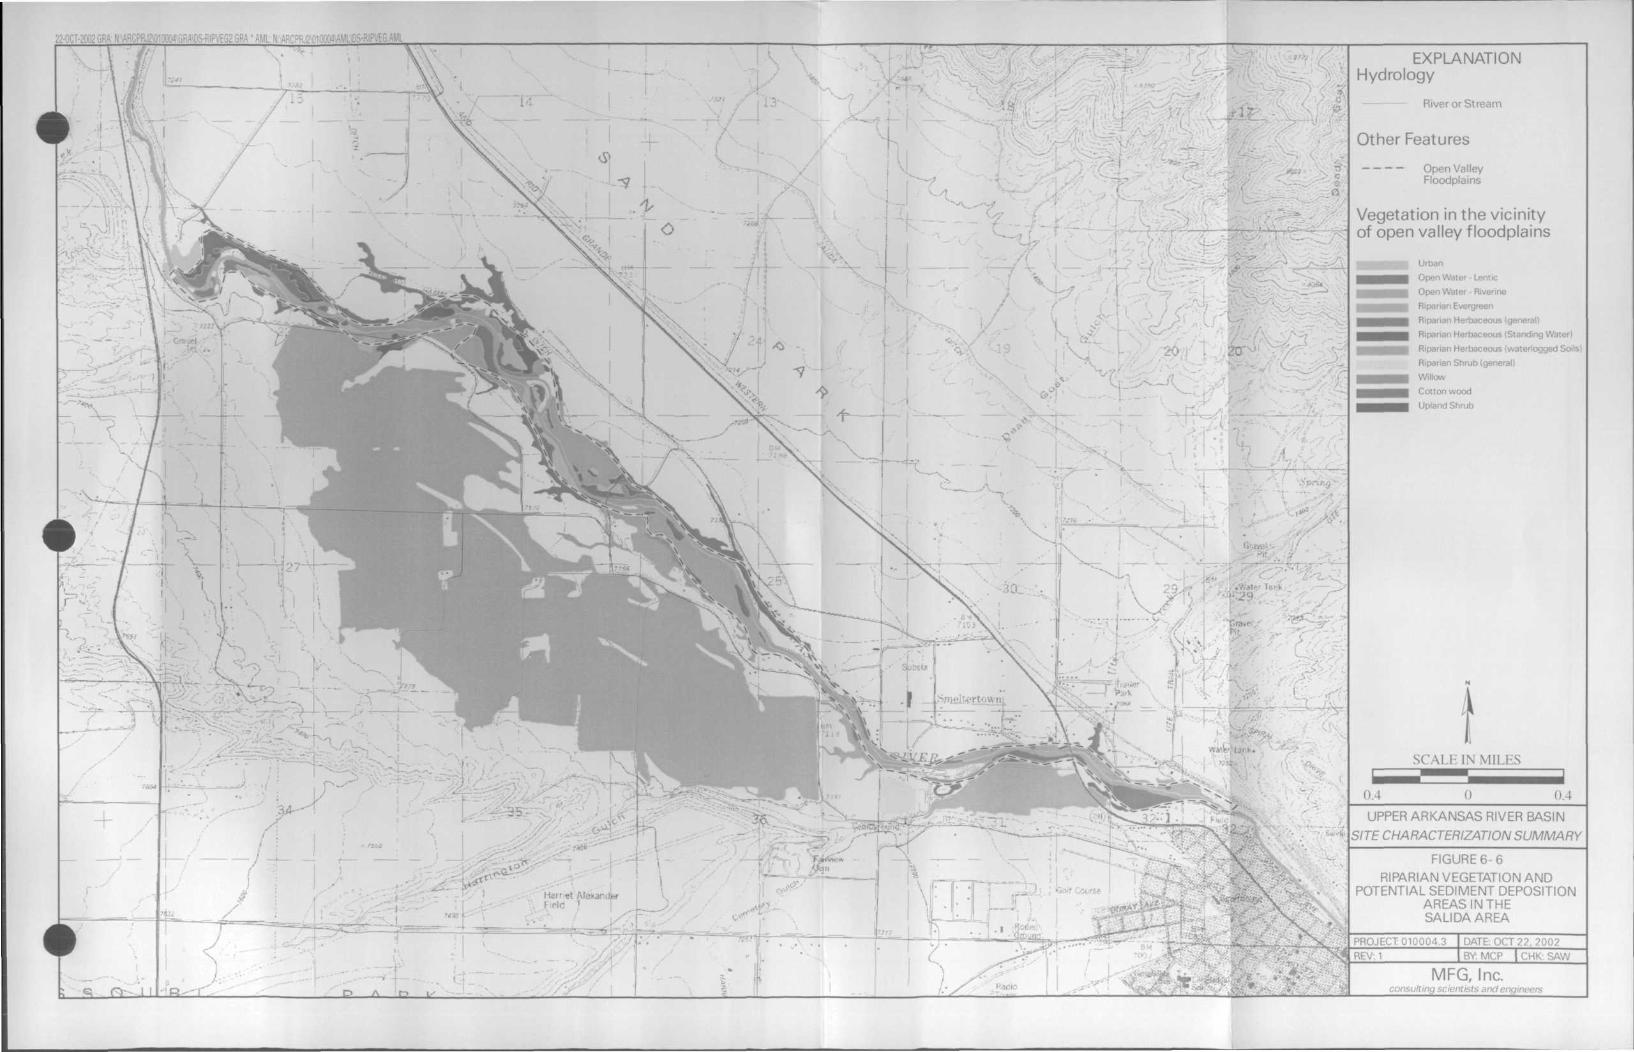
224CT-2002GRA:NttRCPRJM1'>: . ::RJ2010004W.' '_fn
<s>
-:\\
\\
i t \-
•**\
11D
-
o
x^>
^
^
I
\2T
Vffl
*
'•
.
v.-«'
;-
,—"'
. '
I
Mar ret Alexand1 I'lr I
.
J.••-••]
. I
.'
!
EXPLANATIONHydrology
River or Stream
Other Features
Open ValleyFloodplains
Vegetation in the vicinityof open valley f loodplains
Open Water • Lentic
Open Water - Riverine
Riparian Evergreen
Riparian Herbaceous (general)
Riparian Herbaceous (Standing Water)
Riparian Herbaceous (waterlogged Soils)
Riparian Shrub (general)
Willow
Cotton wood
Upland Shrub
SCALE IN MILES
0.4 0.4
UPPER ARKANSAS RIVER BASIN
SITE CHARACTERIZATION SUMMARY
FIGURE 6-6
RIPARIAN VEGETATION ANDPOTENTIAL SEDIMENT DEPOSITION
AREAS IN THESALIDAAREA
PROJECT 010004.3 DATE: OCT 22, 2002REV:1 BY: MCP | CHK: SAW
MFG, Inc.
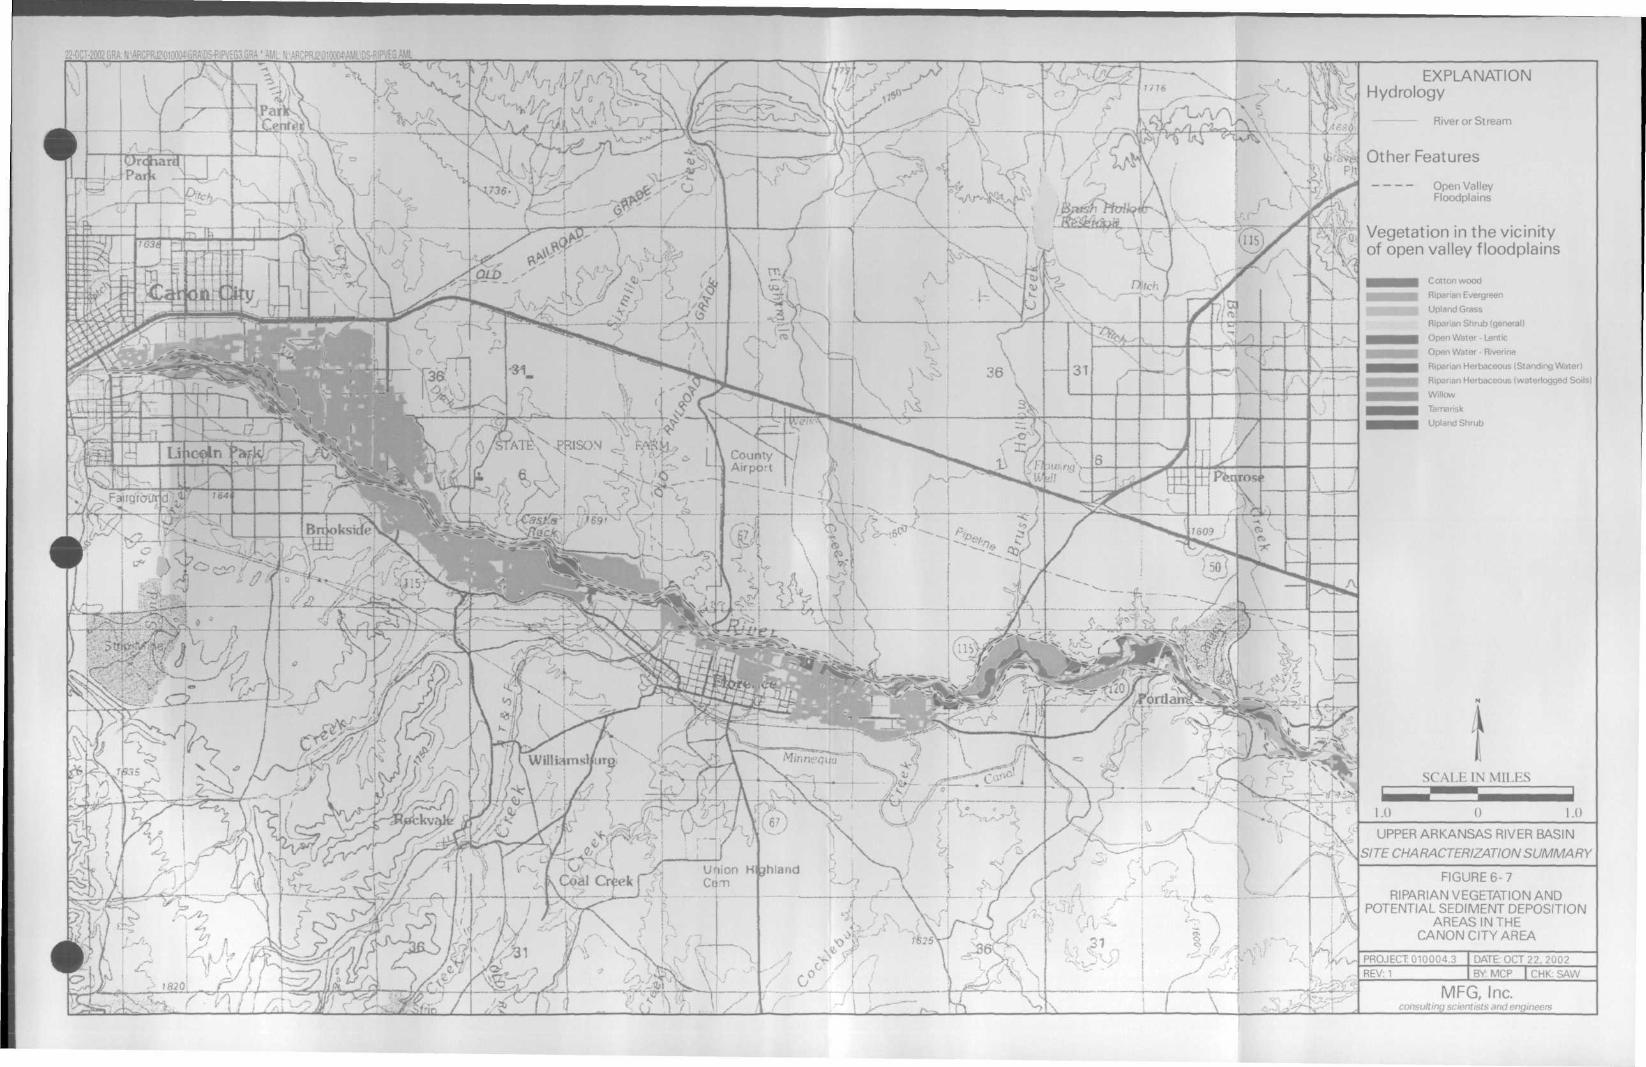
22-OCT-20026RA:NJ'ARCPRJ2\0100M'£RA\DS-RIPVEG3.6r- - ____
EXPLANATIONHydrology
---- Open ValleyFloodplains
Vegetation in the vicinityof open valley f loodplains
Cotton woodRiparian Evergreen
Upland Grass
Riparian Shrub (generall
Open Water - Lentic
Open Water - Riverine
Riparian Herbaceous (Standing Waterl
Riparian Herbaceous (waterlogged Soils)
WillowTamarisk
Upland Shrub
i r if •*. >;
~\' - r . .S
CountyAirpo-t14
-:^v
^\
fssyl T^S
^m&z/>
UPPER ARKANSAS RIVER BASIN
SITE CHARACTERIZATION SUMMARY! i\
,---'
. I /•- --- p
Union H jhlandIM _^, UOlO\ Coal Cr$ek T COTI
j
FIGURE 6-7RIPARIAN VEGETATION AND
POTENTIAL SEDIMENT DEPOSITIONAREAS IN THE
CANON CITY AREA9 _/
PROJECT 010004.3 DATE: OCT 22. 2002
- o -^^ ^ ,r \j ^ . j>-'~~ ^ - consulting scientists and engineers
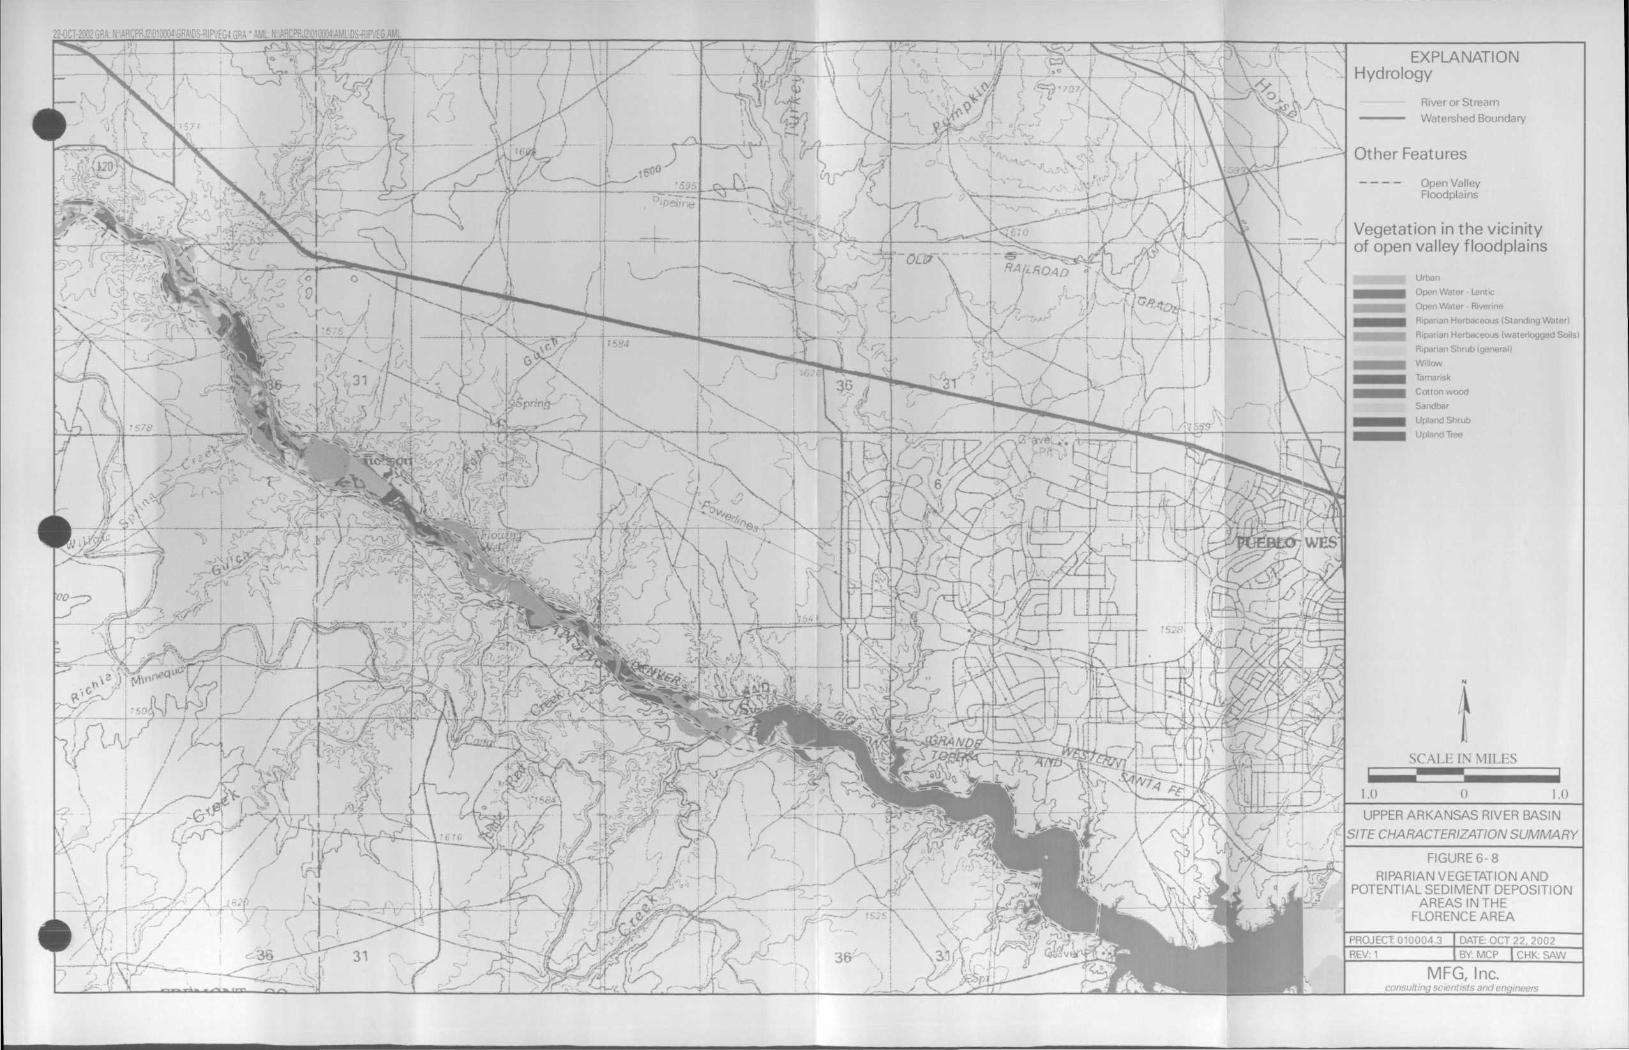
22-OCT-2002GRAN:iARC-
[
ra1
S t -v -•>
1 / ^ - -
:^v5
f".
' :.yi •&"••} " '~Z,~^-~~ '^--
\ Jr
l .-e^i ;-
EXPLANATIONHydrology
River or Stream
•^^^^— Watershed Boundary
Other Features
Open ValleyFloodplains
Vegetation in the vicinityof open valley f loodplains
Urban
Open Water - Lentic
Open Water - Riverine
Riparian Herbaceous (Standing Water)
Riparian Herbaceous (waterlogged Soils)
Riparian Shrub (general)
Willow
Tamarisk
Cotton wood
Sandbar
Upland Shrub
Upland Tree
SCALI: IN MILES
UPPER ARKANSAS RIVER BASIN
SITE CHARACTERIZATION SUMMARY
FIGURE 6-8
RIPARIAN VEGETATION AND
POTENTIAL SEDIMENT DEPOSITION
AREAS IN THE
FLORENCE AREA
PROJECT 010004.3
REV: 1DATE: OCT22, 2002
BY: MCP | CHK: SAW
MFC, Inc.consulting scientists and engineers
Downstream of the 11 mile reach (station AR8)
600
soor-J
^ 400dj° 300
£| 200D
100
35
30
NE 25
° 20s.I 1S
I 10
3l
j: 2d
NE 3
Baetidae
Chloroperlidae
Rhyacophilidae
Elmidae
200
1BO
160.
140
120
100
80
60
40
20
160 i
140
120
100
BO
60
40
20
0250
200
150
100
50
o1400
1200.
1000.
600
600-
400-
200.
0
Heptageniidae
Brachycentridae
Date
Hydropsychidae
Chironomidae
Date
Figure 6-9
Abundance of Dominant Macroinvertebrate Taxa in the Arkansas River Downstream of the11-Mile Reach (Station AR-8).
10000 n
D)
CoS
-4— »
0)O
ooN
1000 -
10EF5 AR1 AR3 AR5 AR8
EF5 AR1 AR3
Station
AR5 AR8
Figure 6-10
Changes in Total Zn Concentration and Number of Heptageniidae in Reach 0 (EF-5, AR-1),Reach 1 (AR-3), and Reach 3 (AR-5) before and after Remediation of LMDT and California
Gulch. These Values are Compared to Data Collected below the 11-Mile Reach (AR-8).
Downstream of the 11 mile reach (station AR8)
10
<uo.L_
(D.a
D
CN
0)Q.
O 6
4
2
CM 20
0 15
0)Q.i_ 10<U
JD
U s
z
MayflyRichness
CaddisflyRichness
EPT
8 i
6
2
StoneflyRichness
Date
DipteranRichness
Total SpeciesRichness
Date
Figure 6-11
Species Richness of Major Macroinvertebrate Groups in the Arkansas River Downstreamof the 11-Mile Reach (Station AR-8).
1400 n
1200-
.£> 1000D)
Cg'•4—<
CO
"c
co
800 ^
600-
200-
0 1 1 1 1 1 1 1 1 1 11990 1991 1992 1993 1994 1995 1996 1997 1998 1999 2000
Year
Figure 6-12
Metal Concentrations in the Caddisfly Arctopsyche grandis Collected fromStations AR-1 (Reach 0) and AR-8 (Downstream Area) of the Arkansas River.
1000 n
800 -
O)
cg*5ra
'c0)ocoocN
600
400 -
200 -
4?Date
Figure 6-13
Total Zn Concentration (ug/L) Measured from 1989 to 1999 at Station AR-8 in theDownstream Reach.
Downstream of the 11 mile reach (station AR8)
600
CM 500
T 400
« 300
jj 200
EJ| 100
0
300
CM 250-
MayflyAbundance
0)Q.
(5.0E
z
200-
150-
too
50-
ET-CDi_
Q.
0
35 i
30
25
20
15
10
5
0
CaddisflyAbundance
OtherAbundance
100,
80
60
40
20 •
0
1600
1400
1200
1000
800.
600
400.
200.
0
2200,
2000.1600.
1600
1400 •
1200
1000
800-
600400200
0
StoneflyAbundance
DipteranAbundance
Total Abundance
Date Date
Figure 6-14
Abundance of Major Macroinvertebrate Groups in the Arkansas River Downstream of the11-Mile Reach (Station AR-8).
180
160
140
® 120Q.E03
COl_0)
05
100 -
80 -
60
40
20
0
600
500 -
V 400Q.
03CO
300
C03(U
200 -
100 -
0 -1-
• BaetidaeD Heptageniidae• ChloroperlidaeZO Brachycentridae• Hydropsychidae
Chironomidae
1989-1992
EphemeropteraPlecopteraTrichopteraTotal Abundance
1993-1999
1989-1992 1993-1999
Treatment
Figure 6-15
hanges in Abundance of Dominant Macroinvertebrate Groups in Reach 6 (station AR-7 near Granite) before
(1989-1992) and after (1993-1999) Treatment of LMDT and California Gulch
7 -i
6 -
5 -
CL
CO 4<r>i_0)Q.c 3CO(D
2 -
1 -
0
25
20 -
_CDQ.E 15-1CO
C/Di_CDQ.
TO 10CD
5 -
Mayfly TaxaStonefly TaxaCaddisfly TaxaDiptera Taxa
1989-1992
EPT TaxaTotal Taxa
SiSH
^J-^i-.aV.:-'•n
1993-1999
1989-1992 1993-1999
Treatment
Figure 6-16
Changes in Species Richness of Dominant Macroinvertebrate Groups in Reach 6 (station AR-7 near Granite)
before (1989-1992) and after (1993-1999) Treatment of LMDT and California Gulch
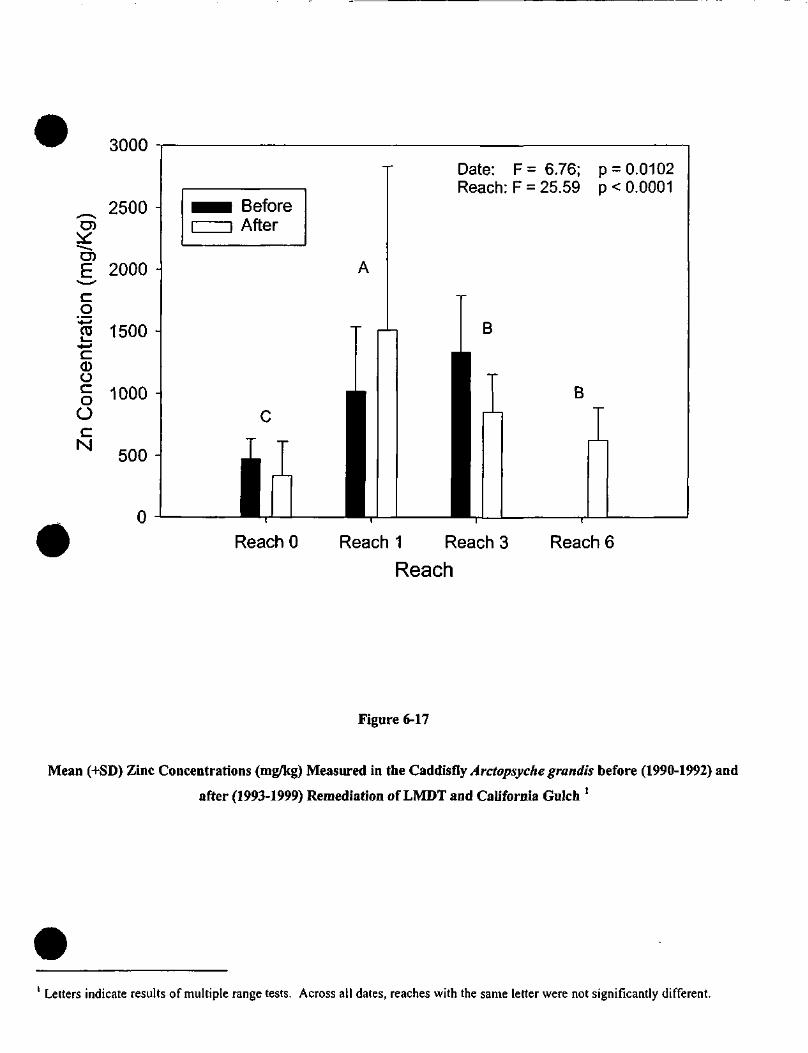
c0)ocoocN
3000
2500 -
2000 -
O)
coro 1500 -
1000 -
500 -
0
Date: F= 6.76; p = 0.0102Reach: F = 25.59 p < 0.0001
B
I
Reach 0 Reach 1 Reach 3
ReachReach 6
Figure 6-17
Mean (+SD) Zinc Concentrations (rag/kg) Measured in the Caddisfly Arctopsyche grandis before (1990-1992) and
after (1993-1999) Remediation of LMDT and California Gulch 1
1 Letters indicate results of multiple range tests. Across all dates, reaches with the same letter were not significantly different.
MATRIX SUMMARIZING INJURY CHARACTERIZATIONFOR THE DOWNSTREAM AREA OF THE
UPPER ARKANSAS RIVER BASIN
1. Surface Water Resources:
A. Surface WaterB. Sediments
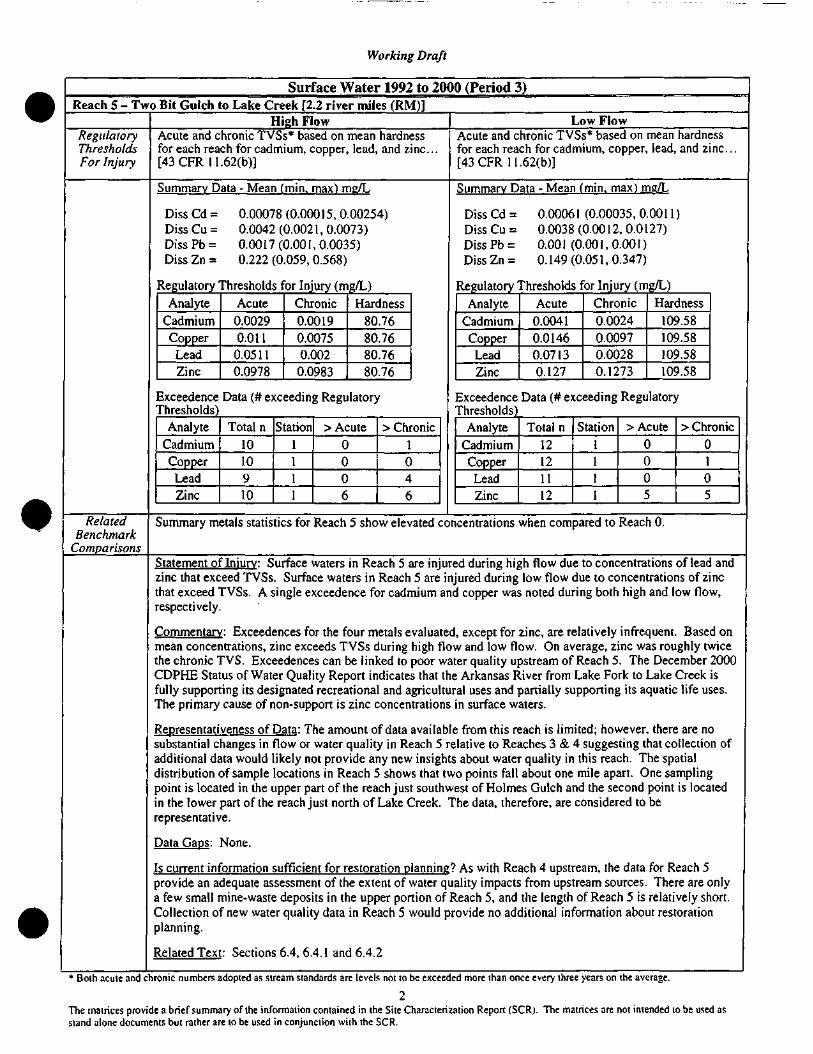
Working Draft
Surface Water 1992 to 2000 (Period 3)Reach 5 - Two Bit Gulch to Lake Creek [2.2 river miles (RM)]
RegulatoryThresholdsFor Injury
High FlowAcute and chronic TVSs* based on meanfor each reach for cadmium, copper, lead,[43CFR 11.62(b)]
hardnessand zinc...
Summary Data - Mean (min, max) me/L
Diss Cd = 0.00078 (0.000 1 5, 0.00254)Diss Cu = 0.0042 (0.002 1 , 0.0073)DissPb= 0.0017(0.001,0.0035)Diss Zn = 0.222 (0.059, 0.568)
Regulatory Thresholds for Injury (mg/L)Analyte
CadmiumCopper
LeadZinc
Acute0.00290.011
0.05110.0978
Chronic0.00190.00750.0020.0983
Hardness80 .7680.7680.7680.76
Exceedence Data (# exceeding RegulatoryThresholds)
AnalyteCadmiumCopper
LeadZinc
Total n1010910
Station1111
> Acute0006
> Chronic1046
Low FlowAcute and chronic TVSs* based onfor each reach for cadmium, copper[43 CFR 1 .62(b)]
Summary Data - Mean
meanlead,
hardnessand zinc.. .
(min. max) mg/L
Diss Cd = 0.0006 1 (0.00035, 0.00 1 1 )DissCu= 0.0038(0.0012,0.0127)DissPb= 0.001(0.001,0.001)DissZn= 0.149(0.051,0.347)
Regulatory Thresholds for Injury (mg/L)Analyte
CadmiumCopper
LeadZinc
Acute0.00410.01460.07130.127
Chronic0.00240.00970.00280.1273
Exceedence Data (# exceedingThresholds)
AnalyteCadmiumCopperLeadZinc
Total n12121112
Station1111
Hardness109.58109.58109.58109.58
Regulatory
> Acute0005
> Chronic0105
RelatedBenchmark
Comparisons
Summary metals statistics for Reach 5 show elevated concentrations when compared to Reach 0.
Statement of Injury: Surface waters in Reach 5 are injured during high flow due to concentrations of lead andzinc that exceed TVSs. Surface waters in Reach 5 are injured during low flow due to concentrations of zincthat exceed TVSs. A single exceedence for cadmium and copper was noted during both high and low flow,respectively.
Commentary: Exceedences for the four metals evaluated, except for zinc, are relatively infrequent. Based onmean concentrations, zinc exceeds TVSs during high flow and low flow. On average, zinc was roughly twicethe chronic TVS. Exceedences can be linked to poor water quality upstream of Reach 5. The December 2000CDPHE Status of Water Quality Report indicates that the Arkansas River from Lake Fork to Lake Creek isfully supporting its designated recreational and agricultural uses and partially supporting its aquatic life uses.The primary cause of non-support is zinc concentrations in surface waters.
Representativeness of Data: The amount of data available from this reach is limited; however, there are nosubstantial changes in flow or water quality in Reach 5 relative to Reaches 3 & 4 suggesting that collection ofadditional data would likely not provide any new insights about water quality in this reach. The spatialdistribution of sample locations in Reach 5 shows that two points fall about one mile apart. One samplingpoint is located in the upper part of the reach just southwest of Holmes Gulch and the second point is locatedin the lower part of the reach just north of Lake Creek. The data, therefore, are considered to berepresentative.
Data Gaps: None.
Is current information sufficient for restoration planning? As with Reach 4 upstream, the data for Reach 5provide an adequate assessment of the extent of water quality impacts from upstream sources. There are onlya few small mine-waste deposits in the upper portion of Reach 5, and the length of Reach 5 is relatively short.Collection of new water quality data in Reach 5 would provide no additional information about restorationplanning.
Related Text: Sections 6.4, 6.4.1 and 6.4.2
* Both acute and chronic numbers adopted as stream standards are levels not to be exceeded more than once every three years on the average.
2The matrices provide a brief summary of the information contained in the Site Characterization Report (SCR). The matrices are not intended to be used asstand alone documents but rather are to be used in conjunction with the SCR.
Working Draft
Surface Water 1992 to 2000 (Period 3)Reach 6 - Lake Creek to Chalk Creek (29.5 RM)
RegulatoryThresholdsFor Injury
High FlowAcute and chronic TVSs* based on mean hardness foreach reach for cadmium, copper, lead, and zinc... [43CFR11.62(b)]
Summary Data - Mean (min, max) me/L
Diss Cd = 0.00064 (0.00005, 0.029)Diss Cu = 0.0027 (0.000 1 , 0.0 1 7)Diss Pb = 0.0008 (0.0005, 0.03 1 )Diss Zn = 0.068 (0.005, 0.64)
Regulatory Thresholds for Injury (mg/L)Analyte
CadmiumCopperLeadZinc
Acute
0.00160.00660.02810.0618
Chronic
0.00130.0047
0.00110.0621
Exceedence Data (# exceedingThresholds)
AnalyteCadmiumCopperLead
Zinc
Total n212210199213
Stations
9998
Hardness47.05
47.0547.0547.05
Regulatory
> Acute
921
67
> Chronic10171366
Low FlowAcute and chronic TVSs* based on mean hardness foreach reach for cadmium, copper, lead, and zinc... [43CFR ll.62(b)]
Summarv Data - Mean (min, max) me/L
Diss Cd = 0.0003 (0.00005, 0.0025)DissCu= 0.00176(0.0001,0.0079)Diss Pb = 0.00062 (0.0005, 0.007)Diss Zn = 0.076 1 (0.004, 0.371)
Regulatory Thresholds for Injury (mg/L)Analyte
CadmiumCopper
Lead
Zinc
Acute0.0022
0.00870.03880.079
Chronic0.0016
0.0060.00150.0794
Exceedence Data (# exceedingThresholds)
AnalyteCadmium
CopperLeadZinc
Total n187184182169
Stations99108
Hardne
62.79
62.7962.7962.79
ss
; Regulatory
> Acute >900
52
Chronic
92252
RelatedBenchmark
Comparisons
Lake Creek discharges a substantial volume of water to the Arkansas River and alters the hydrology as well asthe water chemistry. As a result, zinc concentrations in Reach 6 are one half of those in Reach 5 and aresimilar to Reach 0.
Statement of Injury: Surface waters in Reach 6 are injured during high and low flow due primarily toconcentrations of zinc that exceed TVSs. Occasional exceedences were identified for surface waters in Reach6 during high and low flow for cadmium, copper, lead, and zinc.
Commentary: Hardness values during both high and low flows are lower in this reach of the Arkansas River,resulting in lower TVSs. During both high and low flows, the frequency of exceedences for cadmium, copper,and lead is very low (8% or less), and high flow exceedences are more frequent than low flow exceedences.Zinc exceeds both the acute and chronic TVSs in about 30% of the samples during both high and low flows;however, on average, concentrations of zinc during high and low flow are very close to the TVSs. TheDecember 2000 CDPHE Status of Water Quality Report indicates that the Arkansas River below Lake Creek isfully supporting its designated uses. The South Fork of Lake Creek is listed as partially supporting its aquaticlife use due to metals. Discharge of this creek is through Twin Lake Reservoir, which is listed as fullysupporting its designated uses. Additional metals may come from this drainage, although loading is expectedto be small.
Representativeness of Data: The spatial and temporal distribution (1992-1999) of the sample data for this reachis the best of all of the downstream reaches with between 7 and 10 sample stations covering most of the reach.The spatial distribution of sample locations in Reach 6 shows there are multiple sample points that fall both inthe upper and lower sections of the reach. Data are spatial and temporally representative for the reach.
Data Gaps: None.
Is current information sufficient for restoration planning? Yes.
Related Text: Sections 6.4, 6.4.1 and 6.4.2
' Both acute and chronic numbers adopted as stream standards are levels not to be exceeded more than once every three years on the average.
The matrices provide a brief summary of the information contained in the Site Characterization Report (SCR). The matrices are not intended to be used asstand alone documents but rather are to be used in conjunction with the SCR.
Working Draft
Surface Water 1992 to 2000 (Period 3)Reach 7 - Chalk Creek to South Fork Arkansas River (21.2 RM)
RegulatoryThresholdsFor Injury
High FlowAcute and chronic TVSs* based on mean hardness foreach reach for cadmium, copper, lead, and zinc.. . [43CFR 11.62(b)]
Summary Data - Mean (min, max) me/L
DissCd= 0.0002(0.00005,0.0012)DissCu= 0.0024(0.0001,0.041)Diss Pb = 0.00078 (0.0005, 0.005)Diss Zn = 0.0398 (0.004, 0. 1 37)
Regulatory Thresholds for Injury (mg/L)Analyte
CadmiumCopper
LeadZinc
Acute0.00190.00760.03330.0703
Chronic0.00140.00530.00130.0706
Exceedence Data (# exceedingThresholds)
AnalyteCadmiumCopper
LeadZinc
Total n100102101103
Stations3333
Hardness54.754.754.754.7
Regulatory
> Acute02012
> Chronic041212
Low FlowAcute and chronic TVSs* based on mean hardness foreach reach for cadmium, copper, lead, and zinc.. . [43CFR 11.62(b)]
Summary Data - Mean (min, max) me/L
Diss Cd = 0.000997 (0.00005, 0.066)Diss Cu = 0.00 1 82 (0.000 1 , 0.0 1 24)Diss Pb = 0.0015 1 (0.0005, 0.0253)DissZn= 0.0396(0.004,0.14)
Regulatory Thresholds for Injury (mg/L)Analyte
CadmiumCopperLeadZinc
Acute0.00280.0104
0.0480.0931
Chronic0.00180.00710.00190.0935
Hardne76.1976.1976.1976.19
ss
Exceedence Data (# exceeding RegulatoryThresholds)
AnalyteCadmiumCopperLeadZinc
Total n89858682
Stations3333
> Acute >1102
Chronic12192
RelatedBenchmark
Comparisons
Compared to Reach 6 upstream, average concentrations of zinc during high and low flow typically decrease inReach 7. This is consistent with the trend observed from upstream reaches for zinc. Mean cadmium, copper,and lead in Reach 7 are similar to concentrations in Reach 6 during low flows and decrease during high flows.Mean concentrations are less than Reach 0.
Statement of Injury: Surface waters in Reach 7 are injured during high flow primarily due to concentrations oflead and zinc that exceed TVSs. Surface waters in Reach 7 are injured during low flow due primarily toconcentrations of lead that exceed TVSs. Occasional exceedences of cadmium and copper were also identifiedduring high flow, while occasional exceedences of cadmium, copper, and lead were observed during low flow.
Commentary: The number of high and low flow exceedences of acute TVSs in Reach 7 for cadmium, copper,and lead is smaller than that observed in Reach 6, indicating that the concentrations of these metals aredecreasing. No acute or chronic exceedences of TVSs were observed for cadmium during high flow, and onlyone each was observed during low flow. Zinc exceedences during high flow were greater than during lowflow. Exceedences of TVSs in Reach 7 are slightly lower for both flow conditions than those observed forReach 6. Mean concentrations are below the TVSs for both high and low flows. The December 2000 CDPHEStatus of Water Quality Report indicates that the Arkansas River below Lake Creek is fully supporting itsdesignated uses. Chalk Creek may serve as an additional source of metals in this reach due to historicalmining, and is listed as partially supporting its aquatic life use.
Representativeness of Data: Reach 7 data are considered to be representative both temporally and spatially forthe reach. Data are temporally well distributed from 1992 to 1997. No post-1997 data were available. Thespatial distribution of sample locations in Reach 7 shows that there are approximately nine points locatedthroughout the middle and lower section of the reach, however, there are no sample points in the upper quarterof the reach, which covers approximately 6 miles.
Data Gaps: None.
Is current information sufficient for restoration planning? Yes.
Related Text: Sections 6.4, 6.4.1 and 6.4.2
* Both acute and chronic numbers adopted as stream standards are levels not to be exceeded more than once every three years on the average.
4The matrices provide a brief summary of the information contained in the Site Characterization Report (SCR). The matrices are not intended to be used asstand alone documents but rather are to be used in conjunction with the SCR.
Working Draft
Surface Water 1992 to 2000 (Period 3)Reach 8 - South Fork Arkansas River to Canon City (58.1 RM)
RegulatoryThresholdsFor Injury
High FlowAcute and chronic TVSs* based on mean hardnessfor each reach for cadmium, copper, lead, andzinc... [43CFR 11.62(b)]
Summary Data - Mean (min, max) mg/L
Diss Cd = 0.0001 1 (0.00005, 0.0009)DissCu= 0.0019(0.0001,0.039)Diss Pb = 0.0008 (0.0005, 0.0131)Diss Zn = 0.041 (0.003, 0.226)
Regulatory Thresholds for Injury (mg/L)Analyte
CadmiumCopperLeadZinc
Acute0.00270.01030.04760.0926
Chronic0.00180.00710.00190.0931
Hardness75.7275.7275.7275.72
Exceedence Data (# exceeding RegulatoryThresholds)
AnalyteCadmiumCopperLeadZinc
Total n194187196191
Stations6666
> Acute02016
> Chronic031215
Low FlowAcute and chronic TVSs* based on mean hardness foreach reach for cadmium, copper, lead, and zinc... [43CFR 1 1 .62(b)]
Summary Data - Mean (min, max) mg/L
Diss Cd = 0.0001 1 (0.00005, 0.0021)DissCu= 0.00124(0.0001,0.0101)DissPb= 0.0017(0.0005,0.1677)DissZn= 0.036(0.001,0.175)
Regulatory Thresholds for Injury (mg/L)Analyte
CadmiumCopperLeadZinc
Acute0.004
0.01440.06990.1246
Chronic0.00240.00950.00270.1252
Hardnes107.48107.48107.48107.48
s
Exceedence Data (# exceeding RegulatoryThresholds)
AnalyteCadmiumCopper
LeadZinc
Total n199197204178
Stations8777
> Acute >0014
Chronic0154
RelatedBenchmark
Comparisons
Compared to Reach 7, mean concentrations of the metals evaluated in Reach 8 are typically similar to, orless than, those observed in Reach 7 during both high and low flows. Mean zinc concentrations between thetwo reaches are almost identical. Hardness increased in Reach 8 when compared to Reach 7, suggestinginputs from tributaries and effects of local land uses.
Statement of Injury: Surface waters in Reach 8 are injured during high flow due to concentrations of leadand zinc that exceed TVSs. Surface waters in Reach 8 are injured during low flow due to concentrations oflead, and zinc that exceed TVSs. Copper was also identified as occasionally exceeding the TVS.
Commentary: Cadmium does not exceed TVSs during either high or low flows. Copper exceedences areinfrequent. Lead exceedences of the chronic TVSs were measured more frequently during high versus lowflows. Occurrences of zinc exceedences are similar to Reach 7. Average values for cadmium, copper, lead,and zinc are well below the TVS. Based on mean concentrations, none of the evaluated metals exceed TVSsduring either high or low flows. The December 2000 CDPHE Status of Water Quality Report indicates thatthe Arkansas River below Lake Creek is fully supporting its designated uses.
Representativeness of Data: Reach 8 data for Period 3 are temporally well distributed. Reach 8 is one of thelongest of the downstream reaches evaluated. The spatial distribution of sample locations in Reach 8 showsthere are multiple points that fall throughout the reach, however, there are two considerable gaps in betweensample locations. One, located below Badger Creek, is 12 miles long and another, that is approximately 18miles in length, is located between Texas Creek and Currant Creek. However, spatial distribution of thesample locations is adequate. Data are considered to be representative for the reach.
Data Gaps: None.
Is current information sufficient for restoration planning? Yes.
Related Text: Sections 6.4, 6.4.1 and 6.4.2
1 Both acute and chronic numbers adopted as stream standards are levels not to be exceeded more than once every three years on the average.
The matrices provide a brief summary of the information contained in the Site Characterization Report (SCR). The matrices are not intended to be used asstand alone documents but rather are to be used in conjunction with the SCR.
Working Draft
Surface Water 1992 to 2000 (Period 3)Reach 9 - Canon City to Pueblo Reservoir (29 RM)
High Flow Low FlowRegulatoryThresholdsFor Injury
Acute and chronic TVSs* based on mean hardness foreach reach for cadmium, copper, lead, and zinc... [43CFR11.62(b)]
Acute and chronic TVSs* based on mean hardness foreach reach for cadmium, copper, lead, and zinc... [43CFR 1
Summary Data - Mean (min. max) mg/L
Diss Cd =Diss Cu =Diss Pb =Diss Zn =
0.00007 (0.00005, 0.00025)0.0012 (0.0003, 0.004)0.00061 (0.00025,0.002)0.0241 (0.0015,0.061)
Regulatory Thresholds for Injury (mg/L)Analyte
CadmiumCopper
LeadZinc
Acute
0.00450.01580.07770.1354
Chronic
0.00250.0104
0.0030.1361
Hardness
118.61118.61
118.61118.61
Summary Data - Mean (min. max) mg/L
Diss Cd = 0.00006 (0.00005, 0.0002)Diss Cu = o.OO 133 (0.0001, 0.0077)Diss Pb = 0.00046 (0.00025, 0.001)Diss Zn = o.0148 (0.0015, 0.05)
Regulatory Thresholds for Injury (mg/L)Analyte
CadmiumCopper
LeadZinc
Acute0.00620.0209
0.10710.1743
Chronic0.00320.0134
0.00420.1752
Hardness159.76159.76159.76159.76
Exceedence Data (# exceeding RegulatoryThresholds)
AnalyteCadmiumCopper
LeadZinc
Total n
12121112
Stations2222
> Acute0000
> Chronic
0000
Exceedence Data (# exceeding RegulatoryThresholds)
AnalyteCadmiumCopper
LeadZinc
Total n
23252820
Stations3333
> Acute
0000
> Chronic
0000
RelatedBenchmark
Comparisons
Hardness and, correspondingly, the TVSs increase relative to Reach 8. At the same time, average andmaximum concentrations decreased relative to upstream reaches.
Statement of Injury: Surface waters in Reach 9 are not injured during high or low flow.
Commentary: Within Reach 9 the Arkansas River changes from a high gradient, canyon stream to a widefloodplain stream. The December 2000 CDPHE Status of Water Quality Report indicates that the ArkansasRiver below Lake Creek is fully supporting its designated uses.
Representativeness of Data: The temporal distribution is limited (1992-1996) during the period, with most ofthe data collected closer to 1992. The spatial distribution of sample locations in Reach 9 shows there aremultiple points that are located throughout the reach. There are three sample points in the upper section of thereach, two in the middle section and the remainder in the lower section. Available data are consistent with thedownstream trend of improving water quality.
Data Gaps: None.
Is current information sufficient for restoration planning? Yes.
Related Text: Sections 6.4, 6.4.1 and 6.4.2
* Both acute and chronic numbers adopted as stream standards are levels not to be exceeded more than once every three years on the average.
The matrices provide a brief summary of the information contained in the Site Characterization Report (SCR). The matrices are not intended 10 be used asstand alone documents but rather are to be used in conjunction with the SCR.
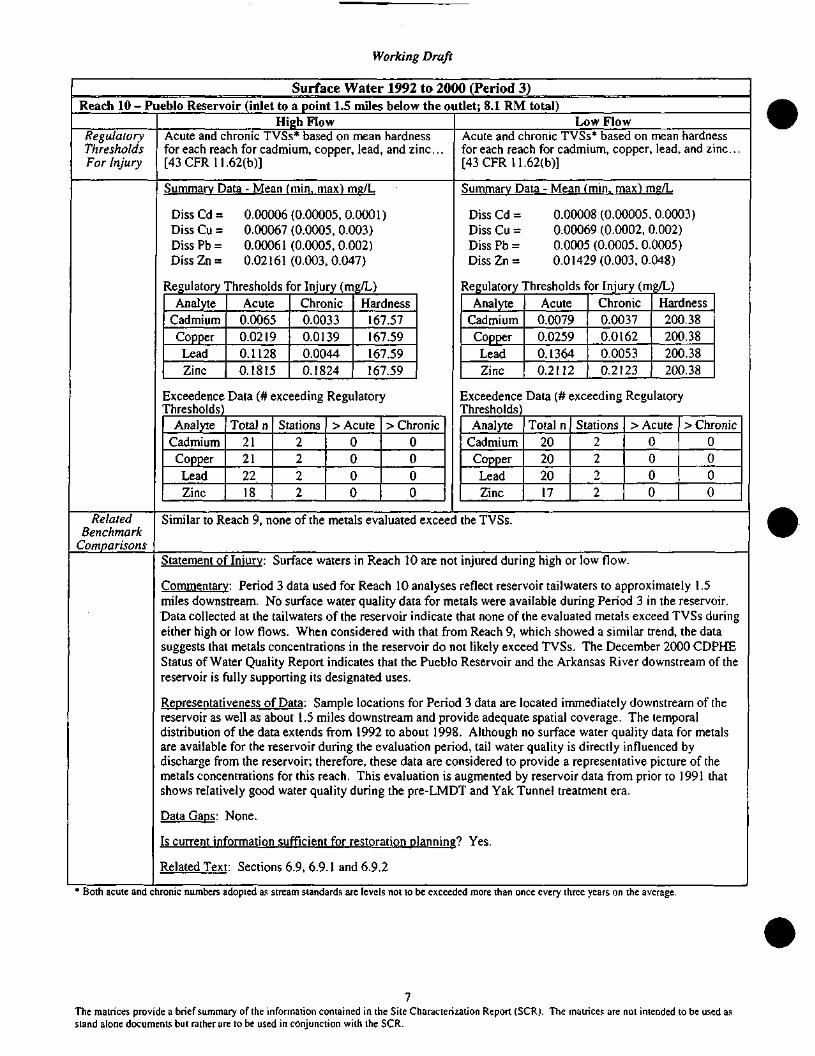
Working Draft
Surface Water 1992 to 2000 (Period 3)Reach 10 - Pueblo Reservoir (inlet to a point 1.5 miles below the outlet; 8.1 RM total)
High Flow Low FlowRegulatoryThresholdsFor Injury
Acute and chronic TVSs* based on mean hardnessfor each reach for cadmium, copper, lead, and zinc.[43CFR11.62(b)]
Acute and chronic TVSs* based on mean hardnessfor each reach for cadmium, copper, lead, and zinc.[43CFR11.62(b)]
Summary Data - Mean (min, max) mg/L
DissCd= 0.00006(0.00005,0.0001)Diss Cu = 0.00067 (0.0005, 0.003)Diss Pb = 0.00061 (0.0005, 0.002)Diss Zn = 0.02161 (0.003, 0.047)
Regulatory Thresholds for Injury (mg/L)Analyte
CadmiumCopperLeadZinc
Acute0.00650.0219O.H280.1815
Chronic0.00330.01390.00440.1824
Hardness167.57167.59167.59167.59
Summary Data - Mean (min. max) mg/L
Diss Cd = 0.00008 (0.00005, 0.0003)Diss Cu = 0.00069 (0.0002, 0.002)Diss Pb = 0.0005 (0.0005, 0.0005)DissZn= 0.01429(0.003,0.048)
Regulatory Thresholds for Injury (mg/L)Analyte
CadmiumCopperLeadZinc
Acute0.00790.02590.13640.2112
Chronic0.00370.01620.00530.2123
Hardness200.38200.38200.38200.38
Exceedence Data (# exceeding RegulatoryThresholds)
AnalyteCadmiumCopperLeadZinc
Total n21212218
Stations2222
> Acute0000
> Chronic0000
Exceedence Data (# exceeding RegulatoryThresholds)
AnalyteCadmiumCopperLeadZinc
Total n20202017
Stations2222
> Acute0000
> Chronic0000
RelatedBenchmark
Comparisons
Similar to Reach 9, none of the metals evaluated exceed the TVSs.
Statement of Injury: Surface waters in Reach 10 are not injured during high or low flow.
Commentary: Period 3 data used for Reach 10 analyses reflect reservoir tailwaters to approximately 1.5miles downstream. No surface water quality data for metals were available during Period 3 in the reservoir.Data collected at the tailwaters of the reservoir indicate that none of the evaluated metals exceed TVSs duringeither high or low flows. When considered with that from Reach 9, which showed a similar trend, the datasuggests that metals concentrations in the reservoir do not likely exceed TVSs. The December 2000 CDPHEStatus of Water Quality Report indicates that the Pueblo Reservoir and the Arkansas River downstream of thereservoir is fully supporting its designated uses.
Representativeness of Data: Sample locations for Period 3 data are located immediately downstream of thereservoir as well as about 1.5 miles downstream and provide adequate spatial coverage. The temporaldistribution of the data extends from 1992 to about 1998. Although no surface water quality data for metalsare available for the reservoir during the evaluation period, tail water quality is directly influenced bydischarge from the reservoir; therefore, these data are considered to provide a representative picture of themetals concentrations for this reach. This evaluation is augmented by reservoir data from prior to 1991 thatshows relatively good water quality during the pre-LMDT and Yak Tunnel treatment era.
Data Gaps: None.
Is current information sufficient for restoration planning? Yes.
Related Text: Sections 6.9, 6.9.1 and 6.9.2
1 Both acute and chronic numbers adopted as stream standards are levels not to be exceeded more than once every three years on the average.
The matrices provide a brief summary of the information contained in the Site Characterization Report (SCR). The matrices are not intended to be used asstand alone documents but rather are to be used in conjunction with the SCR.
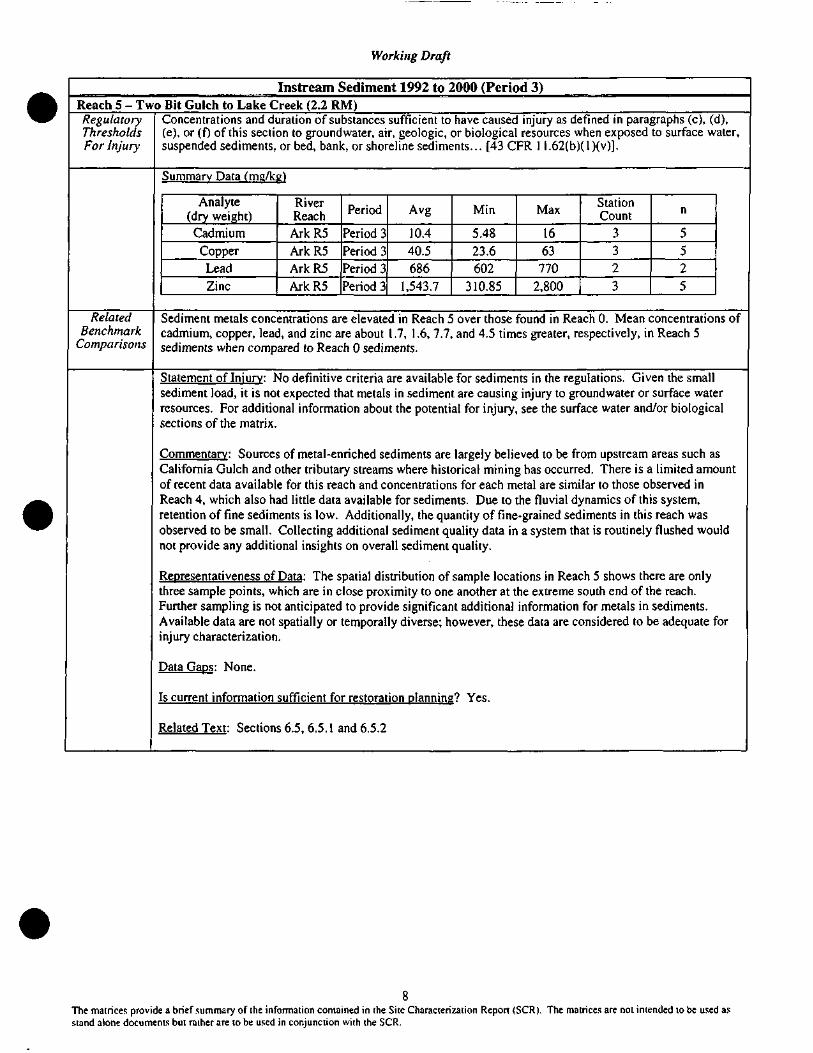
Working Draft
Instream Sediment 1992 to 2000 (Period 3)Reach 5 - Two Bit Gulch to Lake Creek (2.2 RM)RegulatoryThresholdsFor Injury
RelatedBenchmark
Comparisons
Concentrations and duration of substances sufficient to have caused injury as defined in paragraphs (c), (d),(e), or (f) of this section to groundwater, air, geologic, or biological resources when exposed to surface water,suspended sediments, or bed, bank, or shoreline sediments... [43 CFR 1 1.62(b)(l)(v)].
Summary Data (mg/kg)
Analyte River D • A \ **• **(dry weight) Reach Penod AvS Mm Max
Cadmium ArkRS Periods 10.4 5.48 16Copper ArkRS Period 3 40.5 23.6 63Lead Ark R5 Period 3 686 602 770Zinc ArkRS Periods 1,543.7 310.85 2,800
StationCount n
3 53 52 23 5
Sediment metals concentrations are elevated in Reach 5 over those found in Rescadmium, copper, lead, and zinc are about 1.7, 1.6, 7.7, and 4.5 times greater, r<sediments when compared to Reach 0 sediments.
Statement of Injury: No definitive criteria are available for sediments in the regsediment load, it is not expected that metals in sediment are causing injury to grresources. For additional information about the potential for injury, see the surisections of the matrix.
Commentary: Sources of metal-enriched sediments are largely believed to be frCalifornia Gulch and other tributary streams where historical mining has occumof recent data available for this reach and concentrations for each metal are simiReach 4, which also had little data available for sediments. Due to the fluvial d;retention of fine sediments is low. Additionally, the quantity of fine-grained secobserved to be small. Collecting additional sediment quality data in a system thnot provide any additional insights on overall sediment quality.
Representativeness of Data: The spatial distribution of sample locations in Rea(three sample points, which are in close proximity to one another at the extreme sFurther sampling is not anticipated to provide significant additional informationAvailable data are not spatially or temporally diverse; however, these data are cinjury characterization.
Data Gaps: None.
Is current information sufficient for restoration planning? Yes.
Related Text: Sections 6.5. 6.5.1 and 6.5.2
ich 0. Mean concentrations of:spectively, in Reach 5
ulations. Given the smalloundwater or surface waterace water and/or biological
om upstream areas such as;d. There is a limited amountlar to those observed in/namics of this system,iments in this reach wasat is routinely flushed would
;h 5 shows there are onlyouth end of the reach,for metals in sediments.Dnsidered to be adequate for
The matrices provide a brief summary of the information contained in the Site Characterization Report (SCR). The matrices are not intended to be used asstand alone documents but rather are to be used in conjunction with the SCR.
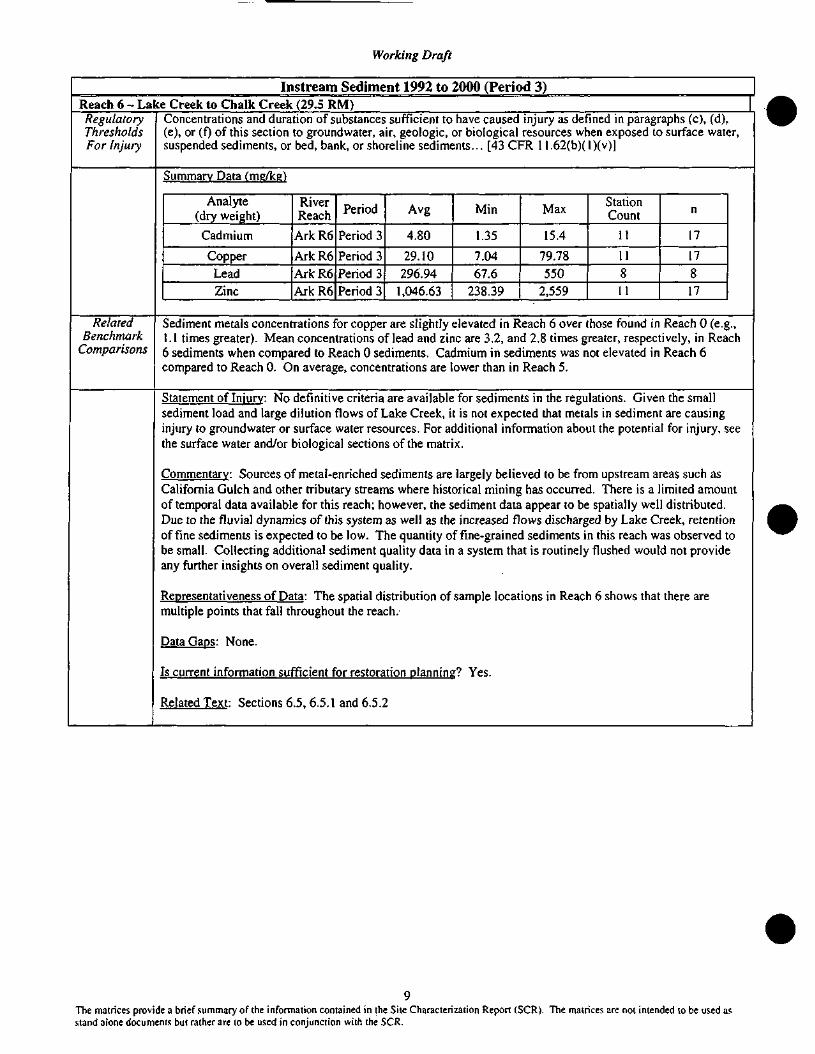
Working Draft
Instream Sediment 1992 to 2000 (Period 3)Reach 6 - Lake Creek to Chalk Creek (29.5 RM)RegulatoryThresholdsFor Injury
RelatedBenchmark
Comparisons
Concentrations and duration of substances sufficient to have caused injury as defined in paragraphs (c), (d),(e), or (f) of this section to groundwater, air, geologic, or biological resources when exposed to surface water,suspended sediments, or bed, bank, or shoreline sediments... [43 CFR 1 1.62(b)(l)(v)]
Summary Data (mp/kg)
Analyte River ., . , . »,. A, Station(dry weight) Reach Penod Av§ Min Max Count
Cadmium Ark R6 Period 3 4.80 1.35 15.4 11 17
Copper Ark R6 Period 3 29.10 7.04 79.78 11 17Lead Ark R6 Period 3 296.94 67.6 550 8 8Zinc Ark R6 Period 3 1,046.63 238.39 2,559 11 17
Sediment metals concentrations for copper are slightly elevated in Reach 6 over those found in Reach 0 (e.g.,1.1 times greater). Mean concentrations of lead and zinc are 3.2, and 2.8 times greater, respectively, in Reach6 sediments when compared to Reach 0 sediments. Cadmium in sediments was not elevated in Reach 6compared to Reach 0. On average, concentrations are lower than in Reach 5.
Statement of Injury: No definitive criteria are available for sediments in the regulations. Given the smallsediment load and large dilution flows of Lake Creek, it is not expected that metals in sediment are causinginjury to groundwater or surface water resources. For additional information about the potential for injury, seethe surface water and/or biological sections of the matrix.
Commentary: Sources of metal-enriched sediments are largely believed to be from upstream areas such asCalifornia Gulch and other tributary streams where historical mining has occurred. There is a limited amountof temporal data available for this reach; however, the sediment data appear to be spatially well distributed.Due to the fluvial dynamics of this system as well as the increased flows discharged by Lake Creek, retentionof fine sediments is expected to be low. The quantity of fine-grained sediments in this reach was observed tobe small. Collecting additional sediment quality data in a system that is routinely flushed would not provideany further insights on overall sediment quality.
Recresentativeness of Data: The spatial distribution of sample locations in Reach 6 shows that there aremultiple points that fall throughout the reach.
Data Gaps: None.
Is current information sufficient for restoration planning? Yes.
Related Text: Sections 6.5, 6.5.1 and 6.5.2
The matrices provide a brief summary of the information contained in the Site Characterization Report (SCR). The matrices are not intended to be used asstand alone documents but rather are to be used in conjunction with the SCR.
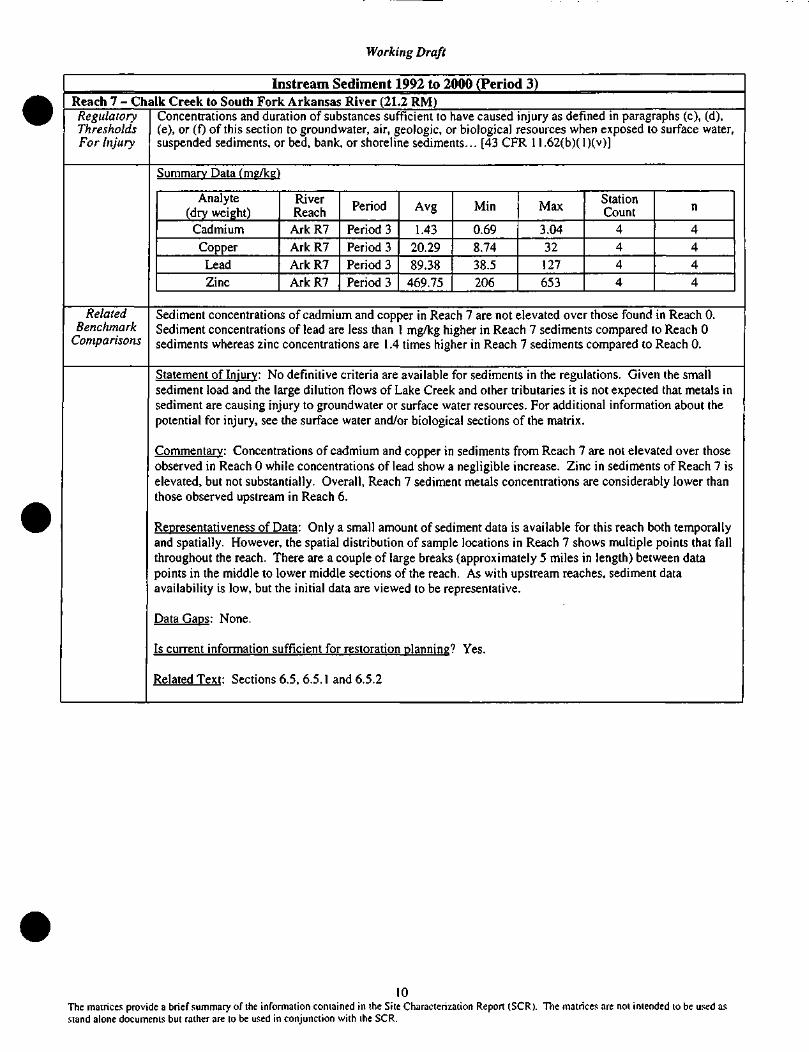
Working Draft
Instream Sediment 1992 to 2000 (Period 3)Reach 7 - Chalk Creek to South Fork Arkansas River (21.2 RM)RegulatoryThresholdsFor Injury
RelatedBenchmark
Comparisons
Concentrations and duration of substances sufficient to have caused injury as defined in paragraphs (c), (d),(e), or (0 of this section to groundwater, air, geologic, or biological resources when exposed to surface water,suspended sediments, or bed, bank, or shoreline sediments... [43 CFR 1 l.62(b)(l)(v)]
Summary Data (mg/k^)
Analyte River D . . . „. A/r Station(dry weight) Reach Penod Av§ Min Max Count
Cadmium Ark R7 Period 3 1.43 0.69 3.04 4 4Copper ArkR7 Period 3 20.29 8.74 32 4 4Lead Ark R7 Period 3 89.38 38.5 127 4 4Zinc ArkR7 Periods 469.75 206 653 4 4
Sediment concentrations of cadmium and copper in Reach 7 are not elevated over those found in Reach 0.Sediment concentrations of lead are less than 1 mg/kg higher in Reach 7 sediments compared to Reach 0sediments whereas zinc concentrations are 1.4 times higher in Reach 7 sediments compared to Reach 0.
Statement of Injury: No definitive criteria are available for sediments in the regulations. Given the smallsediment load and the large dilution flows of Lake Creek and other tributaries it is not expected that metals insediment are causing injury to groundwater or surface water resources. For additional information about thepotential for injury, see the surface water and/or biological sections of the matrix.
Commentary: Concentrations of cadmium and copper in sediments from Reach 7 are not elevated over thoseobserved in Reach 0 while concentrations of lead show a negligible increase. Zinc in sediments of Reach 7 iselevated, but not substantially. Overall, Reach 7 sediment metals concentrations are considerably lower thanthose observed upstream in Reach 6.
Representativeness of Data: Onlv a small amount of sediment data is available for this reach both temporallyand spatially. However, the spatial distribution of sample locations in Reach 7 shows multiple points that fallthroughout the reach. There are a couple of large breaks (approximately 5 miles in length) between datapoints in the middle to lower middle sections of the reach. As with upstream reaches, sediment dataavailability is low, but the initial data are viewed to be representative.
Data Gaps: None.
Is current information sufficient for restoration planning? Yes.
Related Text: Sections 6.5, 6.5.1 and 6.5.2
10The matrices provide a brief summary of the information contained in the Site Characterization Report (SCR). The matrices are not intended to be used asstand alone documents but rather are to be used in conjunction with the SCR.
Working Draft
Instream Sediment 1992 to 2000 (Period 3)Reach 8 - South Fork Arkansas River to Canon City (58.1 RM)RegulatoryThresholdsFor Injury
RelatedBenchmark
Comparisons
Concentrations and duration of substances sufficient to have caused injury as defined in paragraphs (c), (d),(e), or (0 of this section to groundwater, air, geologic, or biological resources when exposed to surface water,suspended sediments, or bed, bank, or shoreline sediments... [43 CFR 1 1.62(b)(l)(v)j
Summary Data (mg/kg)
Analyte River „ . . . x,. x* Station(dry weight) Reach Penod Av§ Mm Max CountCadmium ArkR8 Periods 1.76 0.342 4.52 15 17Copper ArkRS Periods 22.78 7.57 40.5 15 17
Lead ArkRS Period 3 47.22 7.54 130 15 17Zinc ArkRS Period 3 459.53 88 840 15 17
Mean sediment concentrations of cadmium, copper, and lead in Reach 8 are not elevated over those found inReach 0. The mean zinc concentration in sediments in Reach 8 is 1.3 times greater than the mean value forzinc observed in Reach 0.
Statement of Injury: No definitive criteria are available for sediments in the regulations. For additionalinformation about the potential for injury, see the surface water and/or biological sections of the matrix.
Commentary: Concentrations of cadmium, copper, and lead in sediments from Reach 8 are lower thanconcentrations of metals in sediments from Reach 0 while zinc is only slightly elevated. Compared to Reach7, there are substantially more sediment quality data in Reach 8 than in Reach 7, yet on average sedimentmetals concentrations in Reach 8 are lower than those observed in Reach 7. The geomorphologicalassessment suggests that a 5-mile stretch of river upstream of Salida in Reach 8 has morphologicalcharacteristics for sediment retention.
Representativeness of Data: The spatial distribution of sample locations in Reach 8 shows there are manysample points in the upper section of the reach, but there is a large break between sample points startingabove Texas Creek and ending around Currant Creek. Other than this break the points are well distributed.As with upstream reaches, sediment data availability is low, but it is assumed that these data arerepresentative.
Data Gaps: None.
Is current information sufficient for restoration planning? Yes.
Related Text: Sections 6.5. 6.5.1 and 6.5.2
11The matrices provide a brief summary of the information contained in the Site Characterization Report (SCR). The matrices are not intended to be used asstand alone documents but rather are to be used in conjunction with the SCR.
Working Draft
Instream Sediment 1992 to 2000 (Period 3)Reach 9 - Canon City to Pueblo Reservoir (29 RM)RegulatoryThresholdsFor Injury
Concentrations and duration of substances sufficient to have caused injury as defined in paragraphs (c), (d),(e), or (f) of this section to groundwater, air, geologic, or biological resources when exposed to surface water,suspended sediments, or bed, bank, or shoreline sediments... [43 CFR 11.62 (b)(l)(v)]
Summary Data (mg/kg)
Analyte(dry weight)
CadmiumCopperLeadZinc
RiverReach
ArkR9ArkR9ArkR9ArkR9
Period
Period 3Period 3Period 3Period 3
Avg
1.1421.7831.93
288.13
Min
0.4158.3512.894.4
Max
23453
560
StationCount
3333
n
3333
RelatedBenchmark
Comparisons
Sediment metals concentrations in Reach 9 are not elevated over those found in Reach 0. Moreover,concentrations of metals in Reach 9, except for copper, are considerably lower than mean metalconcentrations in Reach 0.
Statement of Injury: No definitive criteria are available for sediments in the regulations; however,concentrations are lower than those found in Reach 0.
Commentary: Concentrations of metals in sediments from Reach 9 are considerably lower thanconcentrations of metals in sediments from Reach 0; however, only a small amount of sediment data areavailable for this reach both temporally and spatially. Below Canon City, the canyons and high gradientstream system gives way to a broader floodplain that extends to Pueblo Reservoir. Despite this lowergradient and higher potential for sediment deposition downstream of Canon City, all sediment metalsconcentrations evaluated are less than Reach 0 as well as the immediately upgradient reaches.
Representativeness of Data: The three sample locations in Reach 9 are distributed throughout the reach.There is an approximate 10-mile stretch from above Beaver Creek to just above Turkey Creek where data arenot available. As with upstream reaches, sediment data availability is low, but it is assumed that these dataare representative.
Data Gaps: None.
Is current information sufficient for restoration planning? Yes.
Related Text: Sections 6.5, 6.5.1 and 6.5.2
12The matrices provide a brief summary of the information contained in the Site Characterization Report (SCR). The matrices are not intended to be used asstand alone documents but rather are to be used in conjunction with the SCR.
Working Draft
Instream Sediment 1992 to 2000 (Period 3)Reach 10 - Pueblo Reservoir (inlet to a point 1.5 miles below the outlet; 8.1 RM total)RegulatoryThresholdsFor Injury
RelatedBenchmark
Comparisons
Concentrations and duration of substances sufficient to have caused injury as defined in paragraphs (c), (d),(e), or (f) of this section to groundwater, air, geologic, or biological resources when exposed to surface water,suspended sediments, or bed, bank, or shoreline sediments... [43 CFR 1 1.62 (b)(l)(v)]
Summary Data (mg/kg)
Analyte(dry weight)
CadmiumCopperLeadZinc
River „ . , . ,,. ,, StationReach Penod Av& Min Max Count n
A r k R I O Period 3 2.00 2 2 1 1Ark RIO Period 3 31.00 31 31 1 1Ark RIO Period 3 37.00 37 37 1 1Ark RIO Period 3 180.00 180 180 1 1
Sediment metals concentrations in Reach 10, except for copper, are not elevated over those found in Reach 0.Moreover, concentrations of cadmium, lead, and zinc in Reach 10 are considerably lower than mean metalconcentrations in Reach 0. Copper is 1.3 times higher in Reach 10 sediments compared to Reach 0sediments.
Statement of Injury: I*metal concentrations apotential for injury, se
Commentary: Pueblo Ielevated concentrationcontinued sediment de
Representativeness ofdownstream. Sedimenrepresentative. Upstrecovered by new, clean
Data Gaps: Althoughreservoir and in Reachidentified as a data gap
Is current information
Jo definitive criteria are available for sediments in the regulations. However, sedimentre not elevated when compared to Reach 0. For additional information about the2 the surface water and/or biological sections of the matrix.
leservoir is a sediment sink. Studies conducted prior to 1992 indicate somewhats of metals in the delta of the reservoir relative to pre-reservoir sediments. However,livery to the reservoir reflects improvements in water quality.
Data: This reach includes the reservoir and its tail waters to about 1.5 milest data were only found for the reservoir during Period 3. One sample point is notam sediment data suggest that Pueblo Reservoir sediments are continually being;r sediments.
current sediment data are limited, given the relatively low concentrations in thees 7-9 sediment quality is not a focus. Therefore lack of sediment sample results is not».
sufficient for restoration planning? Yes.
Related Text: Sections 6.9. 6.9.1 and 6.9.2
13The matrices provide a brief summary of the information contained in the Site Characterization Report (SCR). The matrices are not intended to be used asstand alone documents but rather are to be used in conjunction with the SCR.
Working Draft
2. Ground water Resources:
A. Groundwater
14
Working Draft
Groundwater 1992 to 2000Reaches 5-10 - Two-Bit Gulch to a Point 1.5 Miles below the Outlet of Pueblo Reservoir (148.1 RM)
High Flow I Low FlowRegulatoryThresholdsFor Injury
Exceedence of the maximum contaminant levels.[43CFR 11.62(c)]
Exceedence of the maximum contaminant levels.[43CFR 11.62(c)]
Summary Data - Mean (min, max) mg/L
No groundwater data available during Period 2 or 3.
Regulatory Thresholds for Injury (mg/L)Analyte
CadmiumCopper
Lead
Zinc
MCL0.0051.0*0.05
5.0
Summary Data - Mean (min. max) mg/L
No groundwater data available during Period 2 or 3
Regulatory Thresholds for Injury (mg/L)Analyte
CadmiumCopperLeadZinc
MCL0.005
1.0*0.05
5.0
Exceedence Data (# exceeding RegulatoryThresholds)
Exceedence Data (# exceeding RegulatoryThresholds)
No groundwater data available for Periods 2 or 3 tocompare to Regulatory thresholds
No groundwater data available for Periods 2 or 3 tocompare to Regulatory thresholds
RelatedBenchmark
ComparisonsStatement of Injury: No injury.
Commentary: The finding of no injury is in large part based upon a review of data for the 11-mile reach.Data for the 11-mile reach indicate that water quality in the valley fill system is not measurably influenced bysources within the 11-mile reach or upstream (e.g., California Gulch). Although metals are contributed to thegroundwater system from those sources, a combination of attenuation and dilution result in a rapid reductionin metals concentration. Domestic wells within the 11-mile reach are not in exceedence of the relevantcriteria. Given the increasing downstream dilution, no injury is expected below the 11-mile reach. There areseveral public and municipal wells located in the basin in the downstream area. Information reported fromEPA's Safe Drinking Water Information System (SDWIS) indicates that of the wells monitored by the Statein Chaffe and Fremont county, none were found to exceed MCLs during Period 3.
Representativeness of Data: Data provide adequate spatial coverage to confirm water quality is meeting therelevant criteria.
Data Gaps: None
Is current information sufficient for restoration planning?
Related Text: Sections 6.6, 6.6.1, 6.6.2 6.9, 6.9.1 and 6.9.2
There is no MCL for copper, but copper has a drinking water supply standard of 1.0 mg/L in Colorado. Zinc value is asecondary standard to address staining.
15The matrices provide a brief summary of the information contained in the Site Characterization Report (SCR). The matrices are not intended to be used asstand alone documents but rather are to be used in conjunction with the SCR.
Working Draft
3. Geologic Resources:
A. Floodplain Soils (including floodplain mine-waste deposits)
16
Working Draft
Floodplain SoilsReach 5 - Two Bit Gulch to Lake Creek (2.2 RM)RegulatoryThresholdsFor Injury
1. Concentrations of metals in soils sufficient to cause a phytotoxic response... [43 CFR 11.62(e)(10)]2. Soil pH... [43 CFR 11.62(e)(2)]
Summary Data: No data are available for floodplain soils in Reach 5. Some small mine-waste deposits existin Reach 5; however, they have not been quantified with respect to surface area, volume, and chemicalproperties.
RelatedBenchmark
Comparisons
There are no data for plant-available metal concentrations for comparative purposes.
Statement of Injury: Field observations indicate low vegetation cover on several small mine-waste depositsin the upper portion of Reach 5. Soil pH and/or metal concentrations may be influencing plant growth onthese deposits, reflecting injury to soils at those locations. No other injury has been observed from fieldreconnaissance conducted in 2001.
Commentary: Vegetation growing in floodplain soils along this reach is productive, but plant growth onmine-waste deposits is poor. The potential for mine-waste deposits to influence metals concentrations inboth surface and groundwater is limited by the corresponding small loading potential relative to the largevolume of surface and groundwater moving through the valley.
Representativeness of Data: No data are available.
Data Gaps: The primary data gap is a lack of mapping of floodplain mine-waste deposits. Correspondingly,there are no data regarding the physical and chemical properties of soils and mine-waste deposits.
Is current information sufficient for restoration planning? No. Mapping of the deposits is necessary andphysical and chemical data on mine-waste deposits would also be helpful for restoration planning.
Related Text: Sections 6.7, 6.7.1 and 6.7.2
17The matrices provide a brief summary of the information contained in the Site Characterization Report (SCR). The matrices are not intended to be used asstand alone documents but rather are to be used in conjunction with the SCR.
Working Draft
Floodplain SoilsReach 6 - Lake Creek to Chalk Creek (29.5 RM)RegulatoryThresholdsFor Injury
1. Concentrations of metals in soils sufficient to cause a phytotoxic response... [43 CFR 11.62(e)(10)]2. Soil pH... [43 CFR 11.62(e)(2)]
Summary Data: Floodplain soils data exist for Reach 6. This includes total metal concentrations for lead andzinc for all sites sampled and cadmium and copper for a subset of these sites. There is some evidence ofanthropogenic influence in Reach 6.
RelatedBenchmark
Comparisons
There are no data for plant-available metal concentrations for comparative purposes.
Statement of Injury: The elevated concentrations of zinc in floodplain soils at the confluence of Clear Creek(Reach 6) indicated the potential for injury in this location. The source of these metals is unknown becausethis is not an area where mine-waste deposits were predicted to occur, based on stream morphology.Regardless of the source, total metal concentrations are potentially high enough to cause injury to soils at thislocation. However, this cannot be confirmed without further soil sampling and analysis.
Commentary: Other than the sample sites along Reach 6, there is no other evidence to indicate injury tofloodplain soils in the remaining portions of Reach 6. Floodplain soils are not considered injured in most ofReach 6 because total metal concentrations along these reaches are similar to Reach 0 and riparian vegetationdoes not show signs of metal toxicity.
Representativeness of Data: BLM data from 2000 includes samples from floodplain soils in Reach 6.However, data are for total metals and no data exists for plant-available concentrations.
Data Gaps: None.
Is current information sufficient for restoration planning? Yes.
Related Text: Sections 6.7, 6.7.1 and 6.7.2
18The matrices provide a brief summary of the information contained in the Site Characterization Report (SCR). The matrices are not intended to be used asstand alone documents but rather are to be used in conjunction with the SCR.
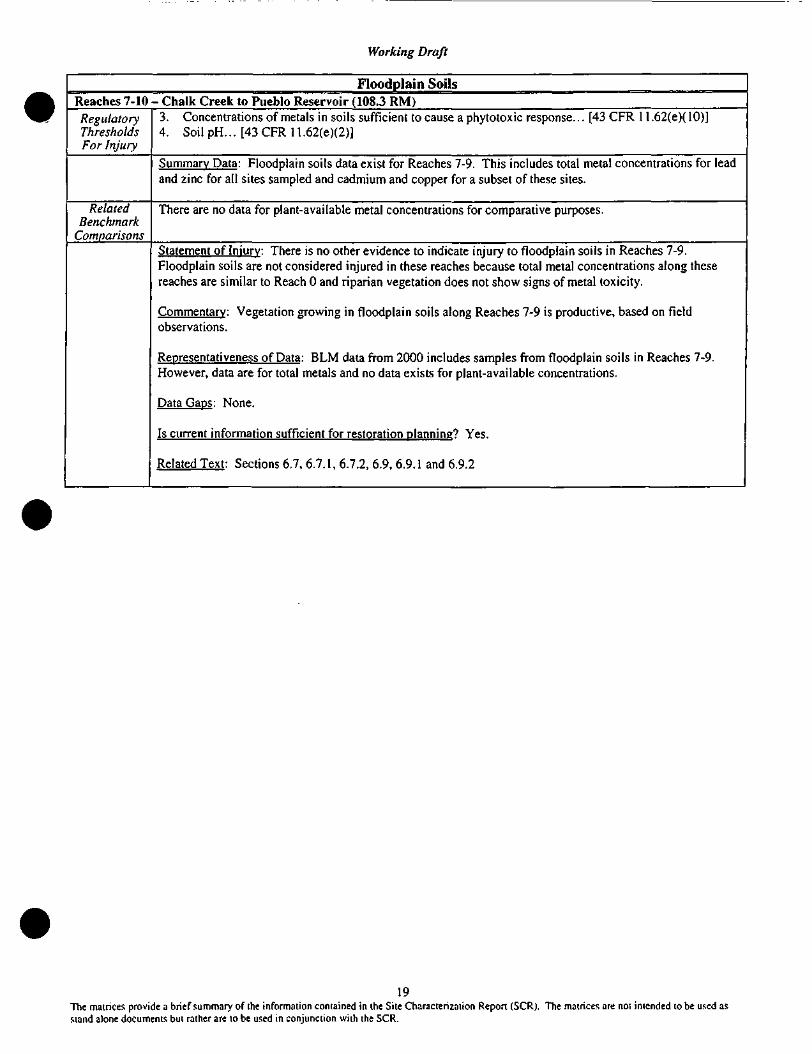
Working Draft
Floodplain SoilsReaches 7-10 - Chalk Creek to Pueblo Reservoir (108.3 RM)RegulatoryThresholdsFor Injury
3. Concentrations of metals in soils sufficient to cause a phytotoxic response... [43 CFR 11.62(e)(10)]4. Soil pH... [43 CFR 11.62(e)(2)]
Summary Data: Floodplain soils data exist for Reaches 7-9. This includes total metal concentrations for leadand zinc for all sites sampled and cadmium and copper for a subset of these sites.
RelatedBenchmark
Comparisons
There are no data for plant-available metal concentrations for comparative purposes.
Statement of Injury: There is no other evidence to indicate injury to floodplain soils in Reaches 7-9.Floodplain soils are not considered injured in these reaches because total metal concentrations along thesereaches are similar to Reach 0 and riparian vegetation does not show signs of metal toxicity.
Commentary: Vegetation growing in floodplain soils along Reaches 7-9 is productive, based on fieldobservations.
Representativeness of Data: BLM data from 2000 includes samples from floodplain soils in Reaches 7-9.However, data are for total metals and no data exists for plant-available concentrations.
Data Gaps: None.
Is current information sufficient for restoration planning? Yes.
Related Text: Sections 6.7, 6.7.1, 6.7.2, 6.9, 6.9.1 and 6.9.2
19The matrices provide a brief summary of the information contained in the Site Characterization Report (SCR). The matrices are not intended to be used asstand alone documents but rather are to be used in conjunction with the SCR.
Working Draft
4. Biological Resources:
A. VegetationB. Benthic MacroinvertebratesC. Brown TroutD. Terrestrial Wildlife - Small MammalsE. Terrestrial Wildlife - Migratory Birds
20
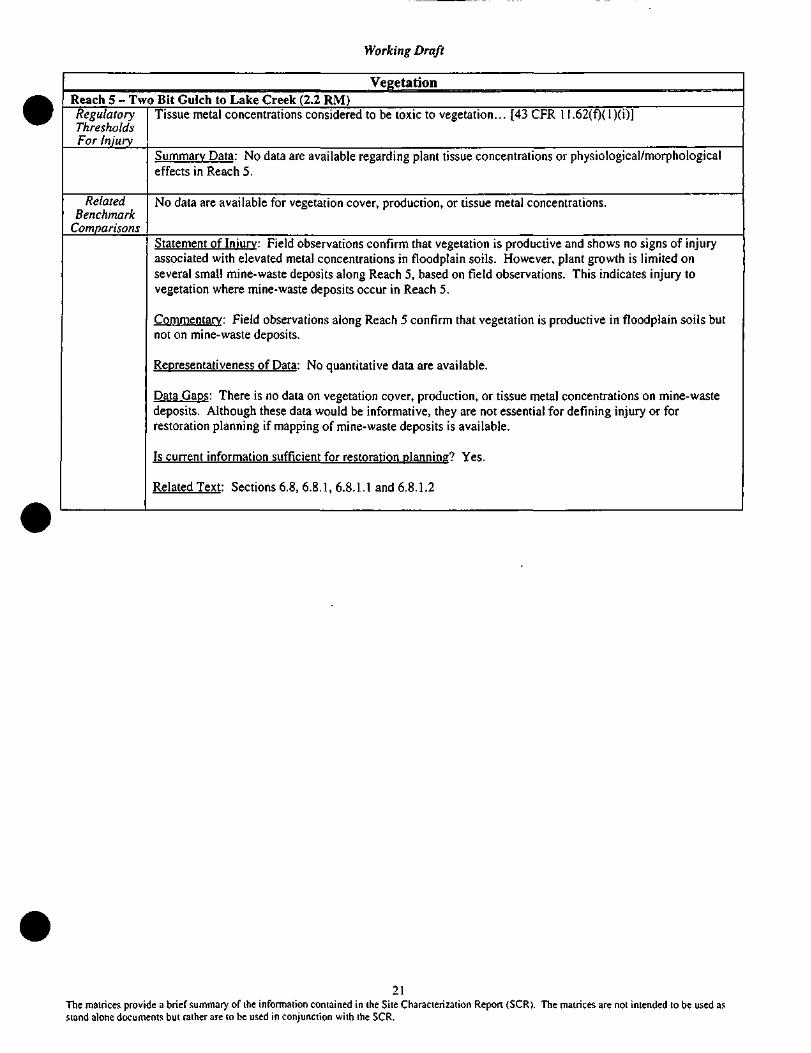
Working Draft
VegetationReach 5 - Two Bit Gulch to Lake Creek (2.2 RM)RegulatoryThresholdsFor Injuiy
Tissue metal concentrations considered to be toxic to vegetation... [43 CFR 11.62(f)( 1 )(i)]
Summary Data: No data are available regarding plant tissue concentrations or physiological/morphologicaleffects in Reach 5.
RelatedBenchmark
Comparisons
No data are available for vegetation cover, production, or tissue metal concentrations.
Statement of Injury: Field observations confirm that vegetation is productive and shows no signs of injuryassociated with elevated metal concentrations in floodplain soils. However, plant growth is limited onseveral small mine-waste deposits along Reach 5, based on field observations. This indicates injury tovegetation where mine-waste deposits occur in Reach 5.
Commentary: Field observations along Reach 5 confirm that vegetation is productive in floodplain soils butnot on mine-waste deposits.
Representativeness of Data: No quantitative data are available.
Data Gaps: There is no data on vegetation cover, production, or tissue metal concentrations on mine-wastedeposits. Although these data would be informative, they are not essential for defining injury or forrestoration planning if mapping of mine-waste deposits is available.
Is current information sufficient for restoration planning? Yes.
Related Text: Sections 6.8, 6.8.1, 6.8.1.1 and 6.8.1.2
21The matrices provide a brief summary of the information contained in the Site Characterization Report (SCR). The matrices are not intended to be used asstand alone documents but raiher are to be used in conjunction with the SCR.
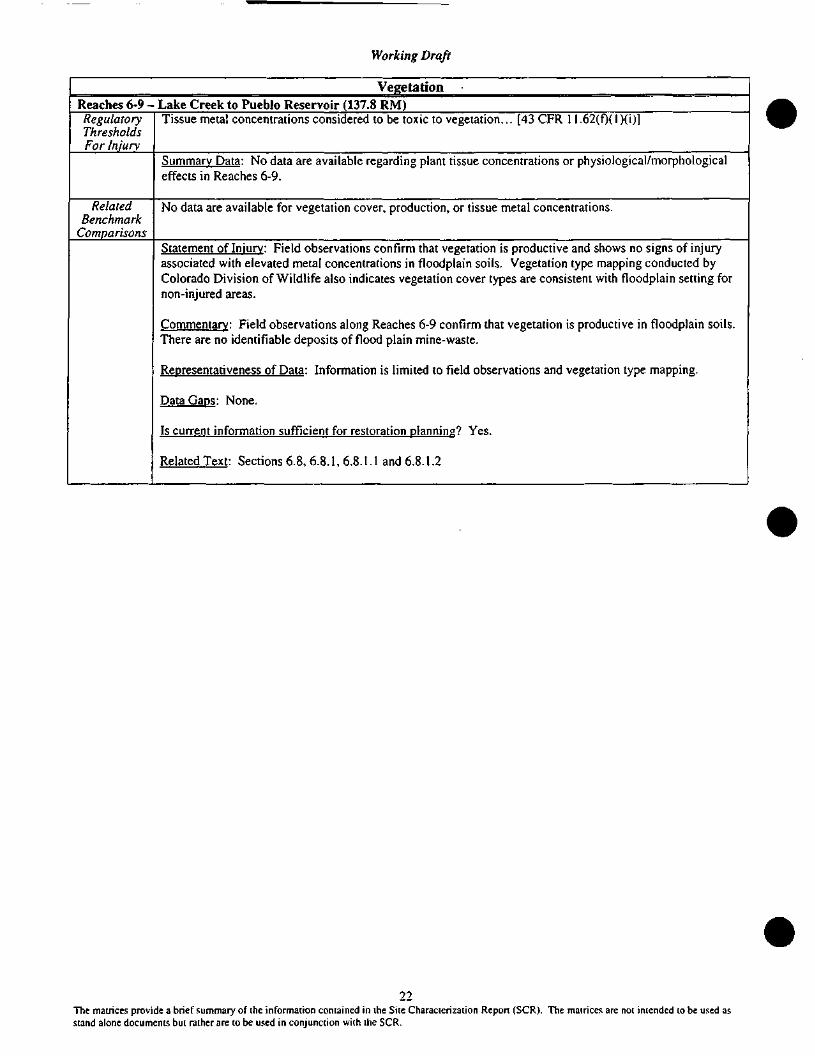
Working Draft
VegetationReaches 6-9 - Lake Creek to Pueblo Reservoir (137.8 RM)RegulatoryThresholdsFor Injury
Tissue metal concentrations considered to be toxic to vegetation... [43 CFR 11.62(0(0(0]
Summary Data: No data are available regarding plant tissue concentrations or physiological/morphologicaleffects in Reaches 6-9.
RelatedBenchmark
Comparisons
No data are available for vegetation cover, production, or tissue metal concentrations.
Statement of Injury: Field observations confirm that vegetation is productive and shows no signs of injuryassociated with elevated metal concentrations in floodplain soils. Vegetation type mapping conducted byColorado Division of Wildlife also indicates vegetation cover types are consistent with floodplain setting fornon-injured areas.
Commentary: Field observations along Reaches 6-9 confirm that vegetation is productive in floodplain soils.There are no identifiable deposits of flood plain mine-waste.
Representativeness of Data: Information is limited to field observations and vegetation type mapping.
Data Gaps: None.
Is current information sufficient for restoration planning? Yes.
Related Text: Sections 6.8, 6.8.1, 6.8.1.1 and 6.8.1.2
22The matrices provide a brief summary of ihe information contained in the Site Characterization Report (SCR). The matrices are not intended to be used asstand alone documents but rather are to be used in conjunction with the SCR.
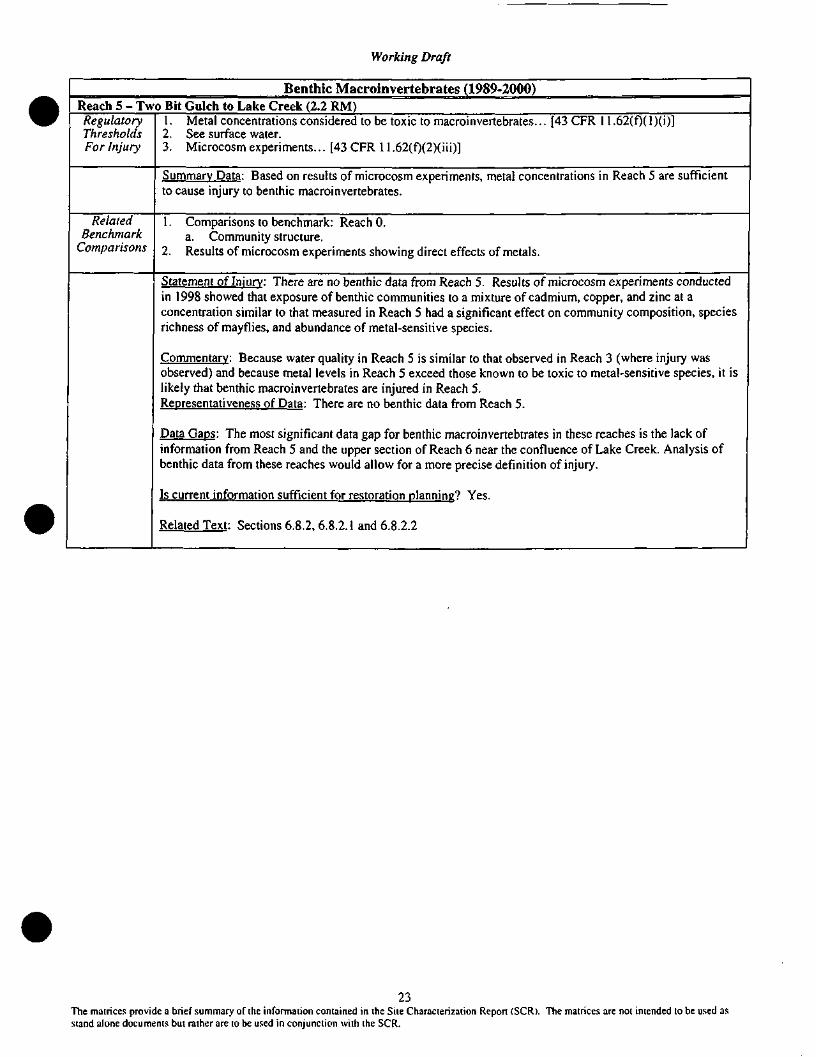
Working Draft
Benthic Macroinvertebrates (1989-2000)Reach 5 - Two Bit Gulch to Lake Creek (2.2 RM)RegulatoryThresholdsFor Injury
\. Metal concentrations considered to be toxic to macroinvertebrates... [43 CFR 11.62(f)(l)(0]2. See surface water.3. Microcosm experiments... [43 CFR 11.62(f)(2)(iii)]
Summary Data: Based on results of microcosm experiments, metal concentrations in Reach 5 are sufficientto cause injury to benthic macroinvertebrates.
RelatedBenchmark
Comparisons
1. Comparisons to benchmark: Reach 0.a. Community structure.
2. Results of microcosm experiments showing direct effects of metals.
Statement of Injury: There are no benthic data from Reach 5. Results of microcosm experiments conductedin 1998 showed that exposure of benthic communities to a mixture of cadmium, copper, and zinc at aconcentration similar to that measured in Reach 5 had a significant effect on community composition, speciesrichness of mayflies, and abundance of metal-sensitive species.
Commentary: Because water quality in Reach 5 is similar to that observed in Reach 3 (where injury wasobserved) and because metal levels in Reach 5 exceed those known to be toxic to metal-sensitive species, it islikely that benthic macroinvertebrates are injured in Reach 5.Representativeness of Data: There are no benthic data from Reach 5.
Data Gaps: The most significant data gap for benthic macroinvertebtrates in these reaches is the lack ofinformation from Reach 5 and the upper section of Reach 6 near the confluence of Lake Creek. Analysis ofbenthic data from these reaches would allow for a more precise definition of injury.
Is current information sufficient for restoration planning? Yes.
Related Text: Sections 6.8.2, 6.8.2.1 and 6.8.2.2
23The matrices provide a brief summary of the information contained in the Site Characterization Report (SCR). The matrices are not intended to be used asstand alone documents but rather are to be used in conjunction with the SCR.
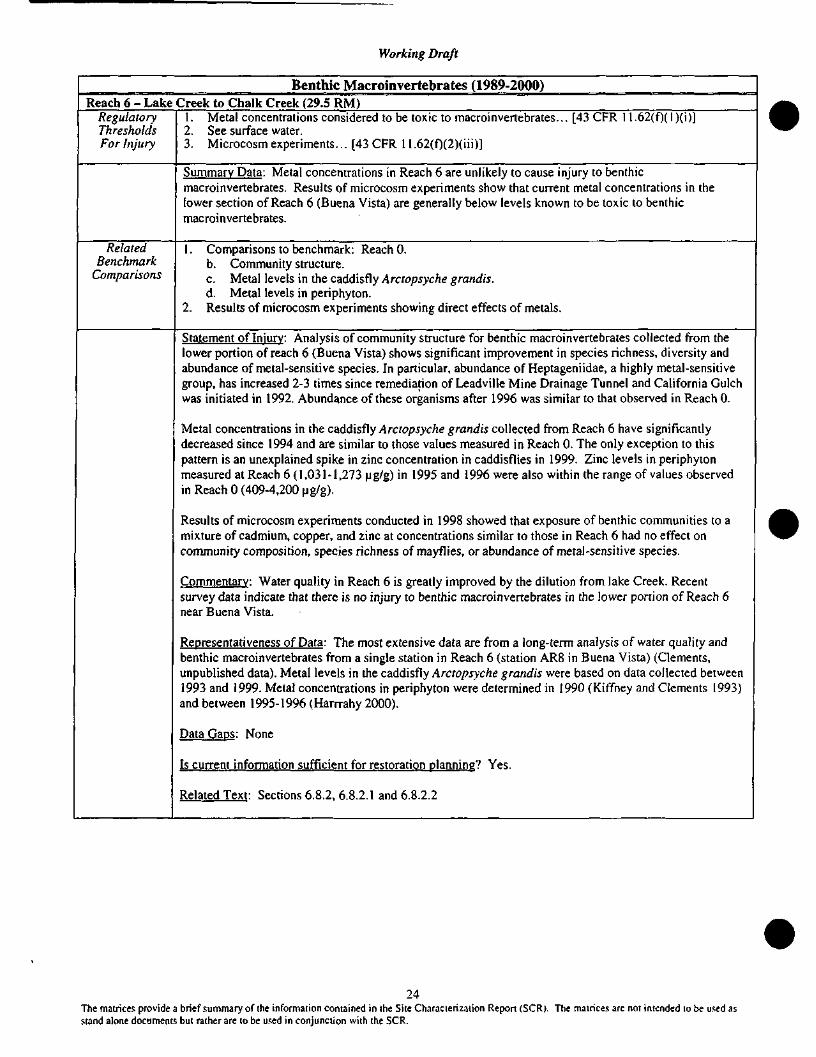
Working Draft
Benthic Macroinvertebrates (1989-2000)Reach 6 - Lake Creek to Chalk Creek (29.5 RM)
RegulatoryThresholdsFor Injury
1. Metal concentrations considered to be toxic to macroinvertebrates... [43 CFR2. See surface water.3. Microcosm experiments... [43 CFR 1 l.62(f)(2)(iii)]
1.62(0(1)0)]
Summary Data: Metal concentrations in Reach 6 are unlikely to cause injury to benthicmacroinvertebrates. Results of microcosm experiments show that current metal concentrations in thelower section of Reach 6 (Buena Vista) are generally below levels known to be toxic to benthicmacroinvertebrates.
RelatedBenchmark
Comparisons
2.
Comparisons to benchmark: Reach 0.b. Community structure.c. Metal levels in the caddisfly Arctopsyche grandis.d. Metal levels in periphyton.Results of microcosm experiments showing direct effects of metals.
Statement of Injury: Analysis of community structure for benthic macroinvertebrates collected from thelower portion of reach 6 (Buena Vista) shows significant improvement in species richness, diversity andabundance of metal-sensitive species. In particular, abundance of Heptageniidae, a highly metal-sensitivegroup, has increased 2-3 times since remediation of Leadville Mine Drainage Tunnel and California Gulchwas initiated in 1992. Abundance of these organisms after 1996 was similar to that observed in Reach 0.
Metal concentrations in the caddisfly Arctopsyche grandis collected from Reach 6 have significantlydecreased since 1994 and are similar to those values measured in Reach 0. The only exception to thispattern is an unexplained spike in zinc concentration in caddisflies in 1999. Zinc levels in periphytonmeasured at Reach 6 (1,031-1,273 ug/g) in 1995 and 1996 were also within the range of values observedin Reach 0 (409-4,200 |jg/g).
Results of microcosm experiments conducted in 1998 showed that exposure of benthic communities to amixture of cadmium, copper, and zinc at concentrations similar to those in Reach 6 had no effect oncommunity composition, species richness of mayflies, or abundance of metal-sensitive species.
Commentary: Water quality in Reach 6 is greatly improved by the dilution from lake Creek. Recentsurvey data indicate that there is no injury to benthic macroinvertebrates in the lower portion of Reach 6near Buena Vista.
Representativeness of Data: The most extensive data are from a long-term analysis of water quality andbenthic macroinvertebrates from a single station in Reach 6 (station AR8 in Buena Vista) (Clements,unpublished data). Metal levels in the caddisfly Arctopsyche grandis were based on data collected between1993 and 1999. Metal concentrations in periphyton were determined in 1990 (Kiffney and Clements 1993)and between 1995-1996 (Harrrahy 2000).
Data Gaps: None
Is current information sufficient for restoration planning? Yes.
Related Text: Sections 6.8.2, 6.8.2.1 and 6.8.2.2
24The matrices provide a brief summary of the information contained in the Site Characterization Report (SCR). The matrices are not intended to be used asstand alone documents but rather are to be used in conjunction with the SCR.
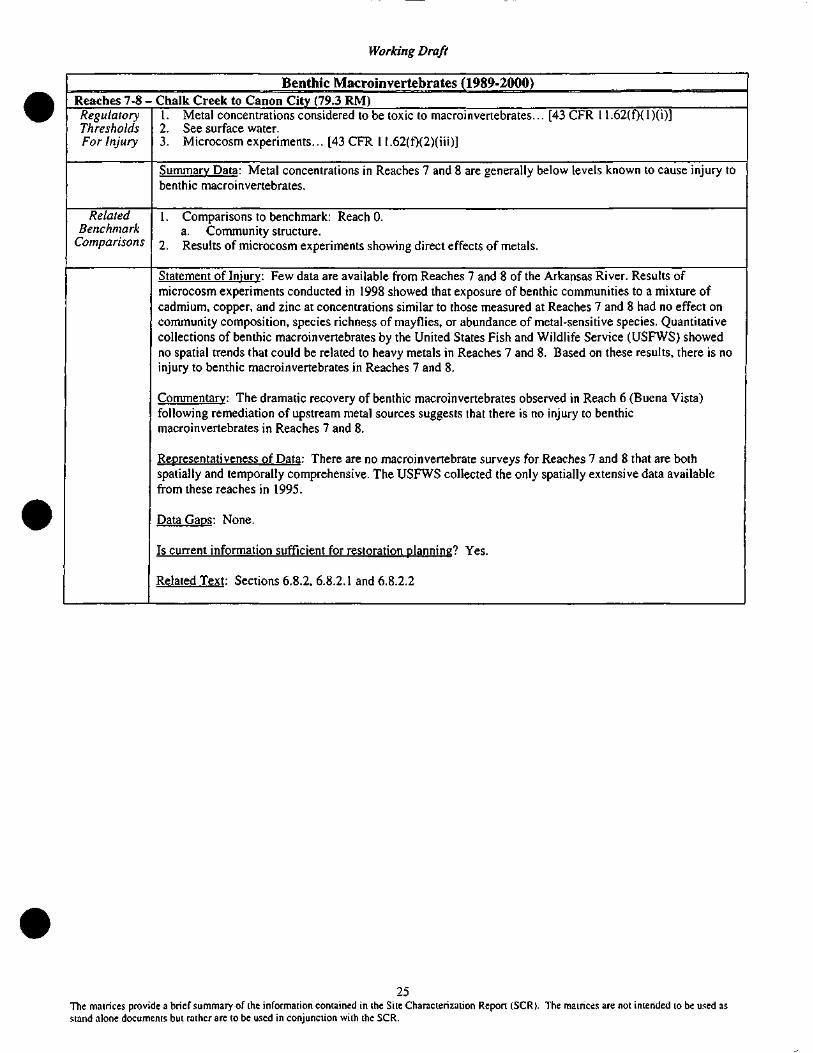
Working Draft
Benthic Macroinvertebrates (1989-2000)Reaches 7-8 - Chalk Creek to Canon City (79.3 RM)RegulatoryThresholdsFor Injury
1. Metal concentrations considered to be toxic to macroinvertebrates... [43 CFR2. See surface water.3. Microcosm experiments... [43 CFR 11.62(f)(2)(iii)]
Summary Data: Metal concentrations in Reaches 7 and 8 are generally below levels known to cause injury tobenthic macroinvertebrates.
RelatedBenchmark
Comparisons
1. Comparisons to benchmark: Reach 0.a. Community structure.
2. Results of microcosm experiments showing direct effects of metals.
Statement of Injury: Few data are available from Reaches 7 and 8 of the Arkansas River. Results ofmicrocosm experiments conducted in 1998 showed that exposure of benthic communities to a mixture ofcadmium, copper, and zinc at concentrations similar to those measured at Reaches 7 and 8 had no effect oncommunity composition, species richness of mayflies, or abundance of metal-sensitive species. Quantitativecollections of benthic macroinvertebrates by the United States Fish and Wildlife Service (USFWS) showedno spatial trends that could be related to heavy metals in Reaches 7 and 8. Based on these results, there is noinjury to benthic macroinvertebrates in Reaches 7 and 8.
Commentary: The dramatic recovery of benthic macroinvertebrates observed in Reach 6 (Buena Vista)following remediation of upstream metal sources suggests that there is no injury to benthicmacroinvertebrates in Reaches 7 and 8.
Representativeness of Data: There are no macroinvertebrate surveys for Reaches 7 and 8 that are bothspatially and temporally comprehensive. The USFWS collected the only spatially extensive data availablefrom these reaches in 1995.
Data Gaps: None.
Is current information sufficient for restoration planning? Yes.
Related Text: Sections 6.8.2, 6.8.2.1 and 6.8.2.2
25The matrices provide a brief summary of the information contained in the Site Characterization Report (SCR). The matrices are not intended to be used asstand alone documents but rather are to be used in conjunction with the SCR.
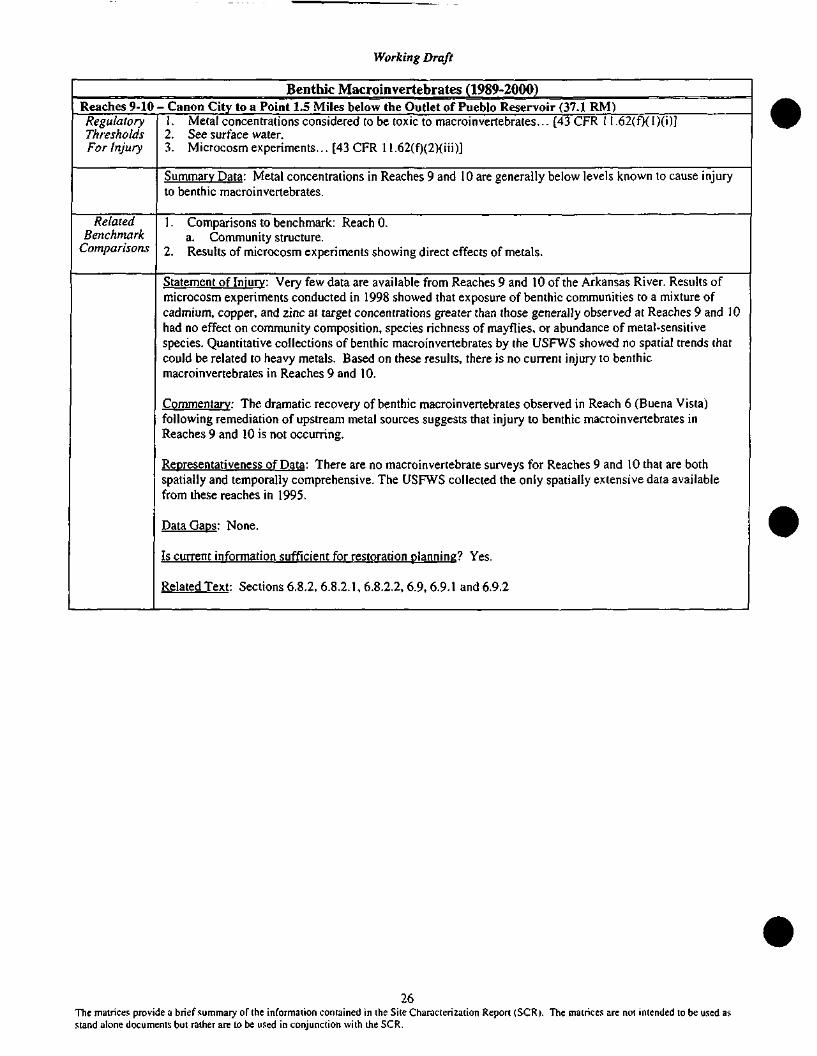
Working Draft
Benthic Macroinvertebrates (1989-2000)Reaches 9-10 - Canon City to a Point 1.5 Miles below the Outlet of Pueblo Reservoir (37.1 RM)RegulatoryThresholdsFor Injury
1. Metal concentrations considered to be toxic to macroinvertebrates... [43 CFR 11.62(f)(l)(0]2. See surface water.3. Microcosm experiments... [43 CFR 11.62(f)(2)(iii)]
Summary Data: Metal concentrations in Reaches 9 and 10 are generally below levels known to cause injuryto benthic macroinvertebrates.
RelatedBenchmark
Comparisons
1. Comparisons to benchmark: Reach 0.a. Community structure.
2. Results of microcosm experiments showing direct effects of metals.
Statement of Injury: Very few data are available from Reaches 9 and 10 of the Arkansas River. Results ofmicrocosm experiments conducted in 1998 showed that exposure of benthic communities to a mixture ofcadmium, copper, and zinc at target concentrations greater than those generally observed at Reaches 9 and 10had no effect on community composition, species richness of mayflies, or abundance of metal-sensitivespecies. Quantitative collections of benthic macroinvertebrates by the LTSFWS showed no spatial trends thatcould be related to heavy metals. Based on these results, there is no current injury to benthicmacroinvertebrates in Reaches 9 and 10.
Commentary: The dramatic recovery of benthic macroinvertebrates observed in Reach 6 (Buena Vista)following remediation of upstream metal sources suggests that injury to benthic macroinvertebrates inReaches 9 and 10 is not occurring.
Representativeness of Data: There are no macroinvertebrate surveys for Reaches 9 and 10 that are bothspatially and temporally comprehensive. The USFWS collected the only spatially extensive data availablefrom these reaches in 1995.
Data Gaps: None.
Is current information sufficient for restoration planning? Yes.
Related Text: Sections 6.8.2, 6.8.2.1, 6.8.2.2, 6.9, 6.9.1 and 6.9.2
26The matrices provide a brief summary or the information contained in the Site Characterization Report (SCR). The matrices are not intended to be used asstand alone documents but rather are to be used in conjunction with the SCR.
Working Draft
Brown TroutReach 5 - Two Bit Gulch to Lake Creek (2.2 RM)RegulatoryThresholdsFor Injury
1. Metal concentrations considered to be toxic to fish... [43 CFR 11.62(f)(l)(i)]2. See surface water.
Summary Data: Aqueous metal concentrations in Reach 5 are sufficient to cause injury to brown trout.Maximum metal concentrations, especially during high flow conditions, exceed levels known to be toxic tobrown trout based on results of laboratory toxicity tests. Surveys of brown trout show reduced abundance andbiomass in Reach 5 compared to Reach 0.
RelatedBenchmark
Comparisons
1. Comparisons to benchmark: Reach 0a. Abundance (number per acre) and biomass (pounds per acre); andb. Length-frequency distributions.
2. Results of acute and chronic toxicity tests.
Statement of Injury: Metal concentrations in Reach 5 exceed levels known to be toxic to brown trout. Thebrown trout population in Reach 5 was characterized by reduced overall abundance but somewhat largerindividuals compared to the reference reach.
Commentary: Brown trout data from Reach 5 relatively sparse; however, because water quality in Reach 5was similar to that measured in Reach 3 (where injury was observed), we conclude that there is also injury tobrown trout in this reach.
Metal concentrations in Reach 5 exceed levels known to be toxic to brown trout. Abundance, biomass, andlength frequency distributions of brown trout from Reach 3 and Reach 5 were generally similar. The lowerabundance and biomass of brown trout in Reach 5 compared to Reach 0 is consistent with metal impacts.
Representativeness of Data: All brown trout data were obtained from the Colorado Division of Wildlife.Relatively few data are available in Reach 5 prior to remediation of the Leadville Mine Drainage Tunnel andCalifornia Gulch, and therefore it is difficult to assess temporal variation in brown trout biomass andabundance.
Data Gaps: Few data are available on brown trout populations in Reach 5.
Is current information sufficient for restoration planning? Yes.
Related Text: Sections 6.8.3, 6.8.3.1 and 6.8.3.2
27The matrices provide a brief summary of the information contained in the Site Characterization Report (SCR). The matrices are not intended to be used asstand alone documents but rather are to be used in conjunction with the SCR.
Working Draft
Brown TroutReach 6 - Lake Creek to Chalk Creek (29.5 RM)RegulatoryThresholdsFor Injury
1. Metal concentrations considered to be toxic to fish... [43 CFR 11.62(f)(l)(i)]2. See surface water.
Summary Data: Aqueous metal concentrations in Reach 6 are unlikely to cause injury to brown trout. Metalconcentrations decrease significantly downstream from Lake Creek, and mean values approach the regulatorythreshold levels in Reach 6. However, maximum metal concentrations, especially during high flowconditions, may exceed levels known to be toxic to brown trout.
RelatedBenchmark
Comparisons
1. Comparisons to benchmark: Reach 0a. Abundance (number per acre) and biomass (pounds per acre); andb. Length-frequency distributions.
2. Results of acute and chronic toxicity tests.Statement of Injury: The brown trout population in Reach 6 was characterized by reduced overall abundancebut somewhat larger individuals compared to the reference reach.
Commentary: Because of natural and anthropogenic changes in physical characteristics of the ArkansasRiver, particularly flow alterations associated with discharge from Lake Creek and poor instream habitat,quantifying the importance of metals relative to other habitat features is difficult in this reach.
Representativeness of Data: All brown trout data were obtained from the Colorado Division of Wildlife.Relatively few data are available in Reach 6 prior to remediation of the Leadville Mine Drainage Tunnel andCalifornia Gulch, and therefore it is difficult to assess temporal variation in brown trout biomass andabundance.
Data Gaps: Uncertainty associated with the relative influence of heavy metals and flow alterations in Reach6 immediately downstream from Lake Creek results in a data gap. Discharge from Lake Creek significantlydilutes heavy metals (a positive effect), but may also influence brown trout recruitment and growth. It ispossible that flow alterations immediately downstream from Lake Creek impact fish populations; howeverthere are no quantitative data showing direct effects of these flow modifications on brown trout. Aquantitative sampling effort of brown trout upstream and downstream from Lake Creek that examinesseasonal and annual variation in both flow and water quality may reduce uncertainty regarding the relativeimportance of these two stressors.
Is current information sufficient for restoration planning? Yes.
Related Text: Sections 6.8.3, 6.8.3.1 and 6.8.3.2
28The matrices provide a brief summary of the information contained in the Site Characterization Report (SCR). The matrices are not intended to be used asstand alone documents but rather are to be used in conjunction with the SCR.
Working Draft
Brown TroutReaches 7-8 - Chalk Creek to Canon City (79.3 RM)RegulatoryThresholdsFor Injury
1. Metal concentrations considered to be toxic to fish... [43 CFR 11.62(00X0]2. See surface water.
Summary Data: Aqueous metal concentrations in Reach 7 and 8 occasionally exceed levels sufficient tocause injury to brown trout.
RelatedBenchmark
Comparisons
1. Comparisons to benchmark: Reach 0a. Abundance (number per acre) and biomass (pounds per acre); andb. Length-frequency distributions.
2. Results of acute and chronic toxicity tests.
Statement of Injury: Brown trout biomass and abundance improved significantly in Reach 8 (Wellsville)compared to Reaches 3 and 6. Although overall abundance is lower compared to Reach 0, total biomass isgenerally similar to or greater than at the reference reach. The significant improvement in biomass andabundance of brown trout in Reach 8 and the similarity to the reference reach suggests there is no injury tobrown trout in Reach 8.
Commentary: Conditions within Reach 7 (e.g., water quality) are essentially the same as Reach 8, therefore,no injury is expected within Reach 7.
Representativeness of Data: All data were obtained from the Colorado Division of Wildlife. Relatively fewdata are available from Reaches 7 and 8 prior to remediation of the Leadville Mine Drainage Tunnel andCalifornia Gulch, and therefore it is difficult to assess temporal variation in brown trout biomass andabundance.
Data Gaps: None.
Is current information sufficient for restoration planning? Yes.
Related Text: Sections 6.8.3, 6.8.3.1 and 6.8.3.2
29The matrices provide a brief summary of the information contained in the Site Characterization Report (SCR). The matrices are not intended to be used asstand alone documents but rather are to be used in conjunction with the SCR.
Working Draft
Brown TroutReaches 9-10 - Canon City to a Point 1.5 Miles below the Outlet of Pueblo Reservoir (37.1 RM)RegulatoryThresholdsFor Injury
1. Metal concentrations considered to be toxic to fish... [43 CFR 11.62(f)(l)(i)]2. See surface water.
Summary Data: Aqueous metal concentrations in Reach 9 and 10 do not exceed levels sufficient to causeinjury to brown trout.
RelatedBenchmark
Comparisons
1. Comparisons to benchmark: Reach 0a. Abundance (number per acre) and biomass (pounds per acre); andb. Length-frequency distributions.
2. Results of acute and chronic toxicity tests.
Statement of Injury: Brown trout biomass and abundance improved significantly in Reach 8 at the Wellsvillestation. Although overall abundance is lower compared to Reach 0, total biomass is generally similar to orgreater than at the reference reach. The significant improvement in biomass and abundance of brown trout inReach 8 and the similarity to the reference reach suggests there is no injury further downstream in Reaches 9and 10.
Commentary: Natural longitudinal changes in the physicochemical and habitat characteristics of theArkansas River complicate comparisons with upstream reaches. Correspondingly, it should be noted thatwithin Reach 9 the Arkansas River transitions from a brown trout fishery.
Representativeness of Data: All data were obtained from the Colorado Division of Wildlife. Relatively fewdata are available from Reaches 9 and 10 prior to remediation of the Leadville Mine Drainage Tunnel andCalifornia Gulch, and therefore it is difficult to assess temporal variation in brown trout biomass andabundance.
Data Gaps: None.
Is current information sufficient for restoration planning? Yes.
Related Text: Sections 6.8.3, 6.8.3.1,6.8.3.2, 6.9, 6.9.1 and 6.9.2
30The matrices provide a brief summary of the information contained in the Site Characterization Report (SCR). The matrices are not intended to be used asstand alone documents but rather are to be used in conjunction with the SCR.
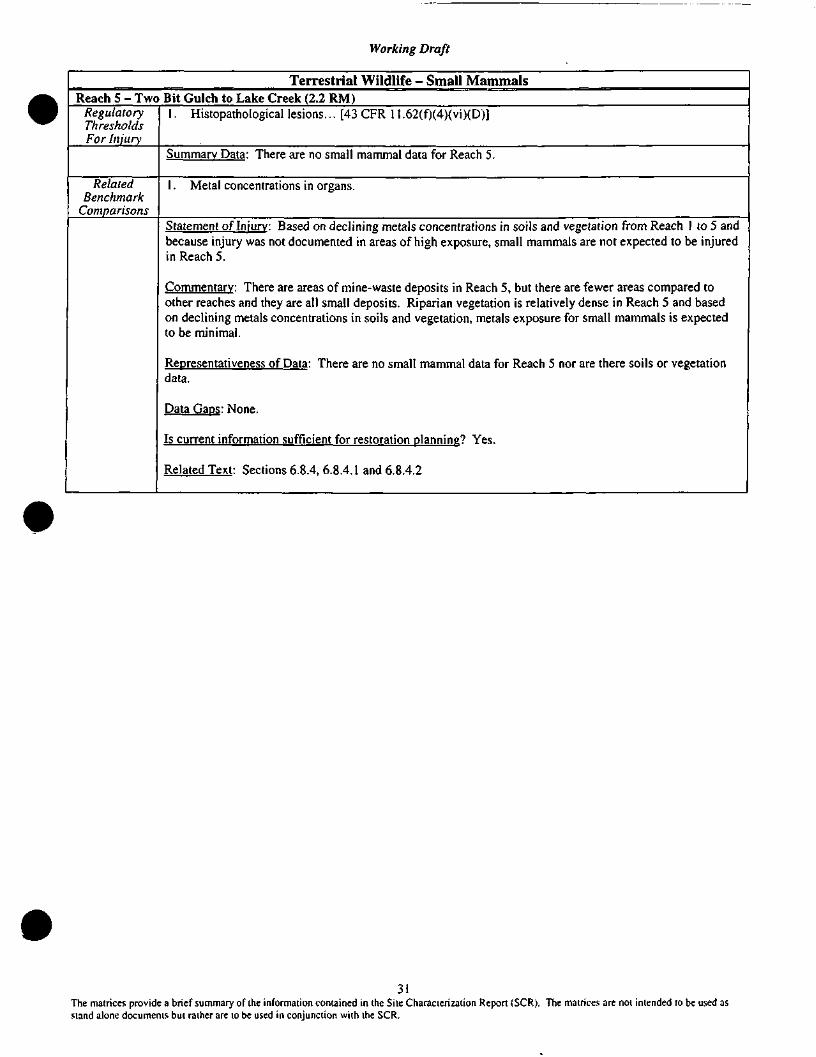
Working Draft
Terrestrial Wildlife - Small MammalsReach 5 - Two Bit Gulch to Lake Creek (2.2 RM)
RegulatoryThresholdsFor Injury
1. Histopathological lesions... [43 CFR 11.62(f)(4)(vi)(D)]
Summary Data: There are no small mammal data for Reach 5.
RelatedBenchmark
Comparisons
1. Metal concentrations in organs.
Statement of Injury: Based on declining metals concentrations in soils and vegetation from Reach 1 to 5 andbecause injury was not documented in areas of high exposure, small mammals are not expected to be injuredin Reach 5.
Commentary: There are areas of mine-waste deposits in Reach 5, but there are fewer areas compared toother reaches and they are all small deposits. Riparian vegetation is relatively dense in Reach 5 and basedon declining metals concentrations in soils and vegetation, metals exposure for small mammals is expectedto be minimal.
Representativeness of Data: There are no small mammal data for Reach 5 nor are there soils or vegetationdata.
Data Gaps: None.
Is current information sufficient for restoration planning? Yes.
Related Text: Sections 6.8.4, 6.8.4.1 and 6.8.4.2
31The matrices provide a brief summary of ihe information contained in the Site Characterization Report (SCR). The matrices are not intended to be used asstand alone documents but rather are to be used in conjunction with the SCR.
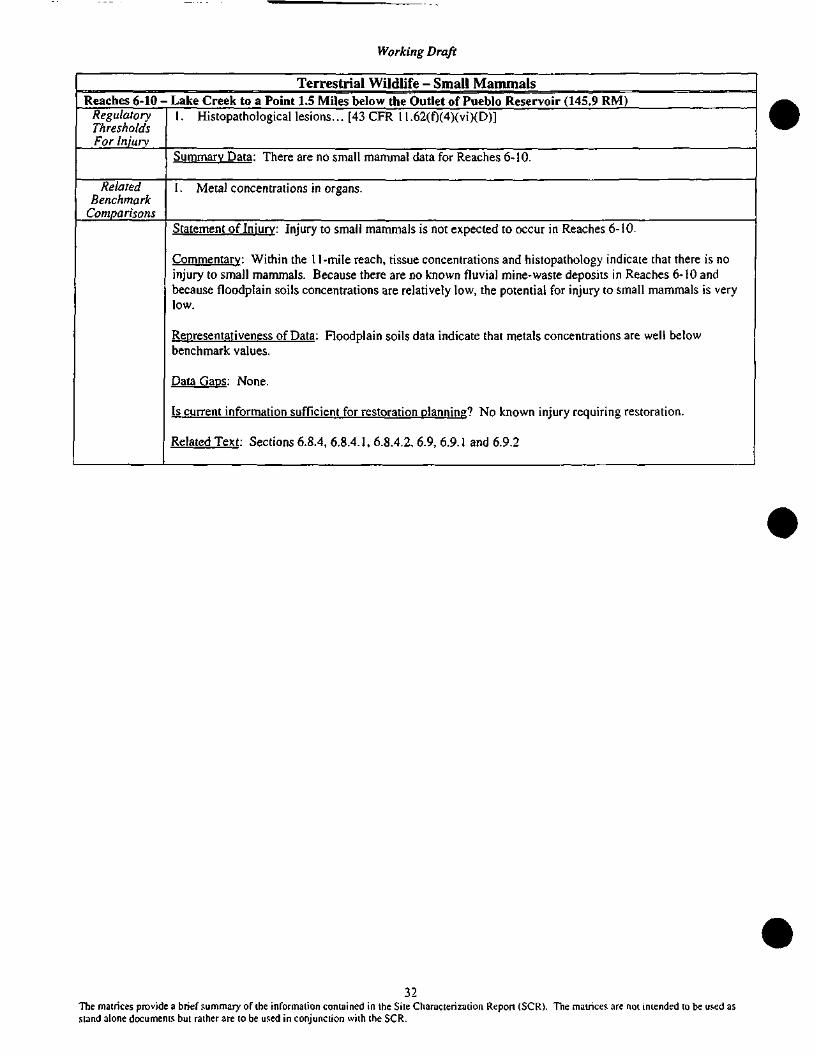
Working Draft
Terrestrial Wildlife - Small MammalsReaches 6-10 - Lake Creek to a Point 1.5 Miles below the Outlet of Pueblo Reservoir (145.9 RM)
RegulatoryThresholdsFor Injury
1. Histopathological lesions... [43 CFR 11.62(f)(4)(vi)(D)]
Summary Data: There are no small mammal data for Reaches 6-10.
RelatedBenchmark
Comparisons
1. Metal concentrations in organs.
Statement of Injury: Injury to small mammals is not expected to occur in Reaches 6-10.
Commentary: Within the 11-mile reach, tissue concentrations and histopathology indicate that there is noinjury to small mammals. Because there are no known fluvial mine-waste deposits in Reaches 6-10 andbecause floodplain soils concentrations are relatively low, the potential for injury to small mammals is verylow.
Representativeness of Data: Floodplain soils data indicate that metals concentrations are well belowbenchmark values.
Data Gaps: None.
Is current information sufficient for restoration planning? No known injury requiring restoration.
Related Text: Sections 6.8.4, 6.8.4.1, 6.8.4.2, 6.9, 6.9.1 and 6.9.2
32The matrices provide a brief summary of the information contained in the Site Characterization Report (SCR). The matrices are not intended to be used asstand alone documents but rather are to be used in conjunction with the SCR.
Working Draft
Terrestrial Wildlife - Migratory BirdsReach 5 - Two-Bit Gulch to Lake Creek (31.7 RM)
RegulatoryThresholdsFor Injury
1. ALAD activity in assessment area is significantly less (alpha <0.05) than mean values for the control area andALAD suppression of at least 50 percent was measured... [43 CFR 11.62(f)(4)(v)(D)]
2. Reduced reproduction... [43 CFR 11.62(f)(4)(v)(B)]
Summary Data
Average Blood Metal Concentrationsin American Dippers (mg/kg wet weight)
Average Liver Metal Concentrationsin American Dippers (mg/kg wet weight)
BloodReach 5Reach 0
StudyReference
Benchmark
14
27
Cadmium
0.040.04
0.01
NR
Copper
0.290.23
0.16
NR
Lead
0.220.11
0.04
0.20
Zinc
6.2913.93
4.09
60.00
Liver
Reach 5Reach 0
StudyReference
Benchmark
14
Cadmium
0.140.84
0.21
40.00NR - Not Reported
% ALAD Reduction Compared to the Study Reference
Copper
10.005.39
6.90
NR
Lead
0.610.19
0.01
2.00
Zinc
25.8634.31
21.38
60.00NR - Not Reported
Average Metal Concentrations In mixed InvertebrateSpecies (ppm, wet weight)
Reach
Reach 5Reach 0
n
410
%ALADReduction
Compared toStudy Reference
4939
%ALADReduction
Compared toReach 0
170
Reach(sample size)
Reach 0(n=12)
Reach 5(n=6)
Benchmark
Cadmium
1.6
1.3
2.0
Copper
5.6
8.5
NR
Lead
2.5
14.3
2.0
Zinc
119.7
214.2
50.0NR- Not Reported
RelatedBenchmark
Comparisons
1. Metal concentrations in organs.2. Metal concentrations in blood.
Statement of Injury: ALAD suppression in American dippers was 49 percent compared to the Study Reference.This is representative of a significant exposure to lead. Blood lead exceeds the literature-based benchmark and liverlead is elevated compared to Reach 0. Invertebrates exceed the dietary benchmark for migratory birds. There isinjury to migratory birds in Reach 5.
Commentary: Aquatic invertebrates continue to accumulate lead which results in significant environmentalexposure for dippers.
Representativeness of Data: The American dipper studies were conducted to evaluate metals exposure and ALADsuppression. Depressed ALAD is consistent with the elevated lead in blood and liver.
Data Gaps: These data represent potential metals exposure to migratory birds via the aquatic food chain; however,they do not represent exposure via terrestrial food chains that could result from fluvial deposits present in Reach 5.There are no data available that represent migratory birds with a terrestrial food base.
Is current information sufficient for restoration planning? Yes, the current information is sufficient for restorationplanning. The current information indicates that the fluvial deposits are a source of metals and represent potentialexposure pathway for terrestrial feeding migratory birds. Injury specific data for terrestrial feeding migratory birdswould not influence restoration planning.
Related Text: Sections 6.8.5, 6.8.5.1 and 6.8.5.2
33The matrices provide a brief summary of the information contained in the Site Characterization Report (SCR). The matrices are not intended to be used asstand alone documents but rather are to be used in conjunction with the SCR.
Working Draft
Terrestrial Wildlife - Migratory BirdsReach 6 - Lake Creek to Chalk Creek (31.7 RM)
RegulatoryThresholdsFor Injury
1. ALAD activity in assessment area is significantly less (alpha <0.05) than mean values for the control area andALAD suppression of at least 50 percent was measured... [43 CFR 11.62(f)(4)(v)(D)]
2. Reduced reproduction... [43 CFR 11.62(f)(4)(v)(B)]
Summary Data
Average Blood Metal Concentrationsin American Dippers (mg/kg wet weight)
Average Liver Metal Concentrationsin American Dippers (mg/kg wet weight)
BloodReach 6Reach 0Study
ReferenceBenchmark
n1014
27
--
Cadmium0.010.04
0.01
NR
Copper0.160.23
0.16
NR
Lead0.130.11
0.04
0.20
Zinc3.7713.93
4.09
60.00
LiverReach 6Reach 0
StudyReference
Benchmark
n44
14
-
Cadmium2.000.84
0.21
40.00
Copper
8.095.39
6.90
NR
Lead0.840.19
0.01
2.00
Zinc
29.7934.31
21.38
60.00NR - Not Reported
% ALAD Reduction Compared to the Study Reference
NR - Not Reported
Average Metal Concentrations In mixed InvertebrateSpecies (ppm, wet weight)
Reach
Reach 6Reach 0
n
910
%ALADReduction
Compared toStudy Reference
5639
%ALADReduction
Compared toReach 0
280
Reach(sample size)
Reach 0(n=12)
Reach 6(n= l l )
Benchmark
Cadmium
1.6
2.1
2.0
Copper
5.6
9.3
NR
Lead
2.5
26.3
2.0
Zinc
119.7
277.4
50.0
1. Metal concentrations in organs.2. Metal concentrations in blood.
INK- Not ReportedRelated
BenchmarkComparisons
Statement of Injury: ALAD in American dippers is suppressed by 56 percent compared to the Study Reference.Blood and liver lead are elevated, but do not exceed the benchmark. Lead concentrations in invertebrates exceedthe dietary benchmark for migratory birds. There is injury to migratory birds in Reach 6.
Commentary: American dipper data are from the Granite area and the tree swallow data are from near Buena Vista.Blood and liver lead concentrations decrease compared to Reach 5, but continue to be elevated compared to Reach0. The tree swallow colony sampled in Reach 6 is located in the open valley floodplain-a potential sedimentdeposition area. However, none of the swallow data exceeded benchmark values.
Representativeness of Data: Both the tree swallow data and the American dipper studies were conducted toevaluate metals exposure and ALAD suppression. The swallow and dipper data provide a good representation ofmetals exposure from aquatic invertebrates.
Data Gaps: None.
Is current information sufficient for restoration planning? Yes, the current information is sufficient for restorationplanning.
Related Text: Sections 6.8.5, 6.8.5.1 and 6.8.5.2
34The matrices provide a brief summary of the information contained in the Site Characterization Report (SCR). The matrices are not intended to be used asstand alone documents but rather are to be used in conjunction with the SCR.
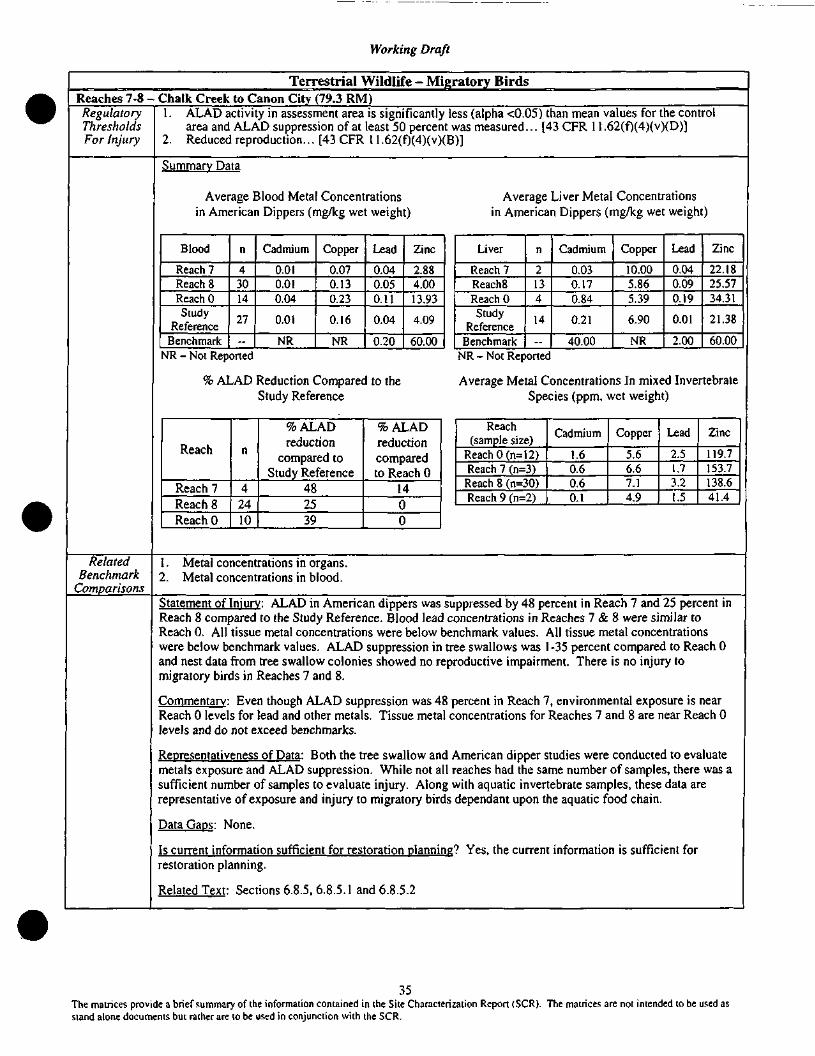
Working Draft
Terrestrial Wildlife - Migratory BirdsReaches 7-8 - Chalk Creek to Canon City (79.3 RM)RegulatoryThresholdsFor Injury
1. ALAD activity in assessment area is significantly less (alpha <0.05) than mean values for the controlarea and ALAD suppression of at least 50 percent was measured... [43 CFR 11.62(f)(4)(v)(D)]
2. Reduced reproduction... [43 CFR 11.62(f)(4)(v)(B)]
Summary Data
Average Blood Metal Concentrationsin American Dippers (mg/kg wet weight)
Average Liver Metal Concentrationsin American Dippers (mg/kg wet weight)
Blood
Reach 7Reach 8Reach 0Study
ReferenceBenchmark
3014
27
Cadmium
0.010.010.04
0.01
NR
Copper
0.070.130.23
0.16
NR
Lead
0.040.050.11
0.04
0.20
Zinc
2.884.0013.93
4.09
60.00
Liver
Reach 7ReachSReach 0
StudyReference
Benchmark
13
14
Cadmium
0.030.170.84
0.21
40.00
Copper
10.005.865.39
6.90
NR
Lead
0.040.090.19
0.01
2.00
Zinc
22.1825.5734.31
21.38
60.00NR - Not Reported
% ALAD Reduction Compared to theStudy Reference
NR - Not Reported
Average Metal Concentrations In mixed InvertebrateSpecies (ppm, wet weight)
Reach
Reach 7Reach 8Reach 0
n
42410
%ALADreduction
compared toStudy Reference
482539
%ALADreductioncomparedto Reach 0
1400
Reach(sample size)
Reach 0(n= 12)Reach 7 (n=3)
Reach 8 (n=30)Reach 9 (n=2)
Cadmium
1.60.60.60.1
Copper
5.66.67.14.9
Lead
2.51.73.21.5
Zinc
119.7153.7138.641.4
RelatedBenchmark
Comparisons
1. Metal concentrations in organs.2. Metal concentrations in blood.
Statement of Injury: ALAD in American dippers was suppressed by 48 percent in Reach 7 and 25 percent inReach 8 compared to the Study Reference. Blood lead concentrations in Reaches 7 & 8 were similar toReach 0. All tissue metal concentrations were below benchmark values. All tissue metal concentrationswere below benchmark values. ALAD suppression in tree swallows was 1-35 percent compared to Reach 0and nest data from tree swallow colonies showed no reproductive impairment. There is no injury tomigratory birds in Reaches 7 and 8.
Commentary: Even though ALAD suppression was 48 percent in Reach 7, environmental exposure is nearReach 0 levels for lead and other metals. Tissue metal concentrations for Reaches 7 and 8 are near Reach 0levels and do not exceed benchmarks.
Representativeness of Data: Both the tree swallow and American dipper studies were conducted to evaluatemetals exposure and ALAD suppression. While not all reaches had the same number of samples, there was asufficient number of samples to evaluate injury. Along with aquatic invertebrate samples, these data arerepresentative of exposure and injury to migratory birds dependant upon the aquatic food chain.
Data Gaps: None.
Is current information sufficient for restoration planning? Yes, the current information is sufficient forrestoration planning.
Related Text: Sections 6.8.5, 6.8.5.1 and 6.8.5.2
35The matrices provide a brief summary of the information contained in the Site Characterization Report (SCR). The matrices are not intended to be used asstand alone documents but rather are to be used in conjunction with the SCR.
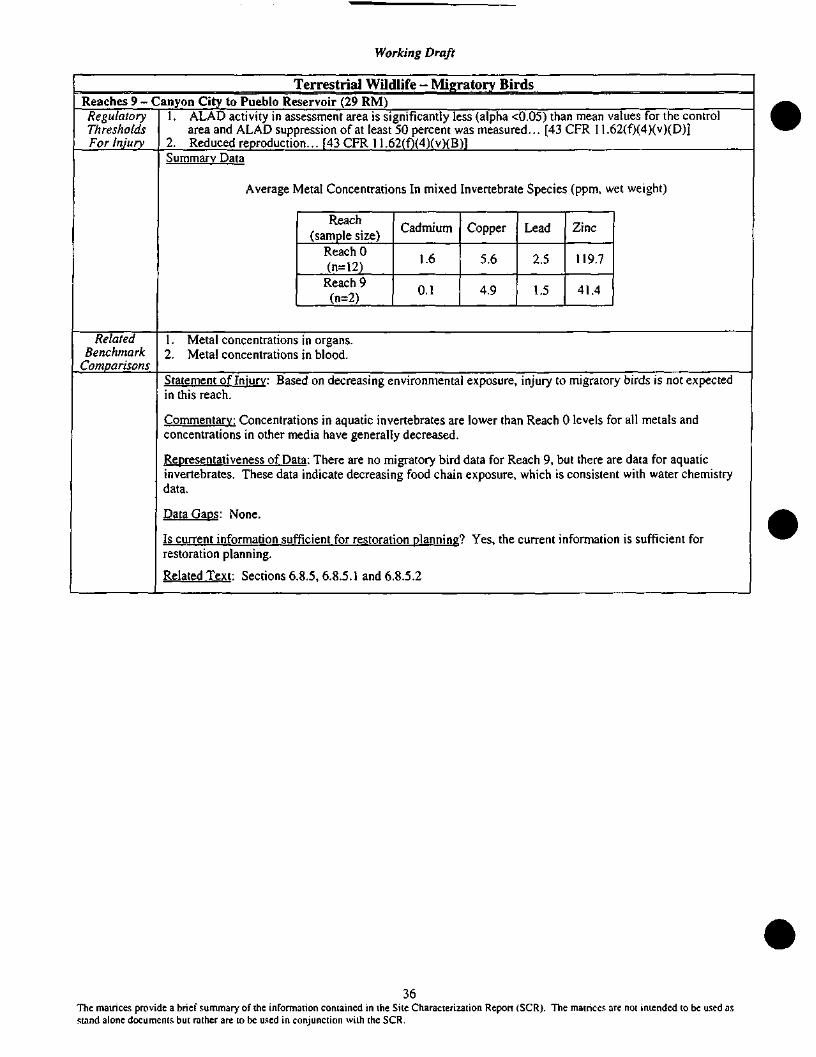
Working Draft
Terrestrial Wildlife -Migratory BirdsReaches 9 - Canyon City to Pueblo Reservoir (29 RM)RegulatoryThresholdsFor Injury
1. ALAD activity in assessment area is significantly less (alpha <0.05) than mean values for the controlarea and ALAD suppression of at least 50 percent was measured... [43 CFR 11.62(f)(4)(v)(D)]
2. Reduced reproduction... [43 CFR 11.62(f)(4)(v)(B)]Summary Data
Average Metal Concentrations In mixed Invertebrate Species (ppm, wet weight)
Reach(sample size)
Reach 0(n=12)
Reach 9(n=2)
Cadmium
1.6
0.1
Copper
5.6
4.9
Lead
2.5
1.5
Zinc
119.7
41.4
RelatedBenchmark
Comparisons
1. Metal concentrations in organs.2. Metal concentrations in blood.
Statement of Injury: Based on decreasing environmental exposure, injury to migratory birds is not expectedin this reach.
Commentary: Concentrations in aquatic invertebrates are lower than Reach 0 levels for all metals andconcentrations in other media have generally decreased.
Representativeness of Data: There are no migratory bird data for Reach 9, but there are data for aquaticinvertebrates. These data indicate decreasing food chain exposure, which is consistent with water chemistrydata.
Data Gaps: None.
Is current information sufficient for restoration planning? Yes, the current information is sufficient forrestoration planning.
Related Text: Sections 6.8.5, 6.8.5.1 and 6.8.5.2
36The matrices provide a brief summary of the information contained in the Site Characterization Report (SCR). The matrices are not intended to be used asstand alone documents but rather are to be used in conjunction with the SCR.
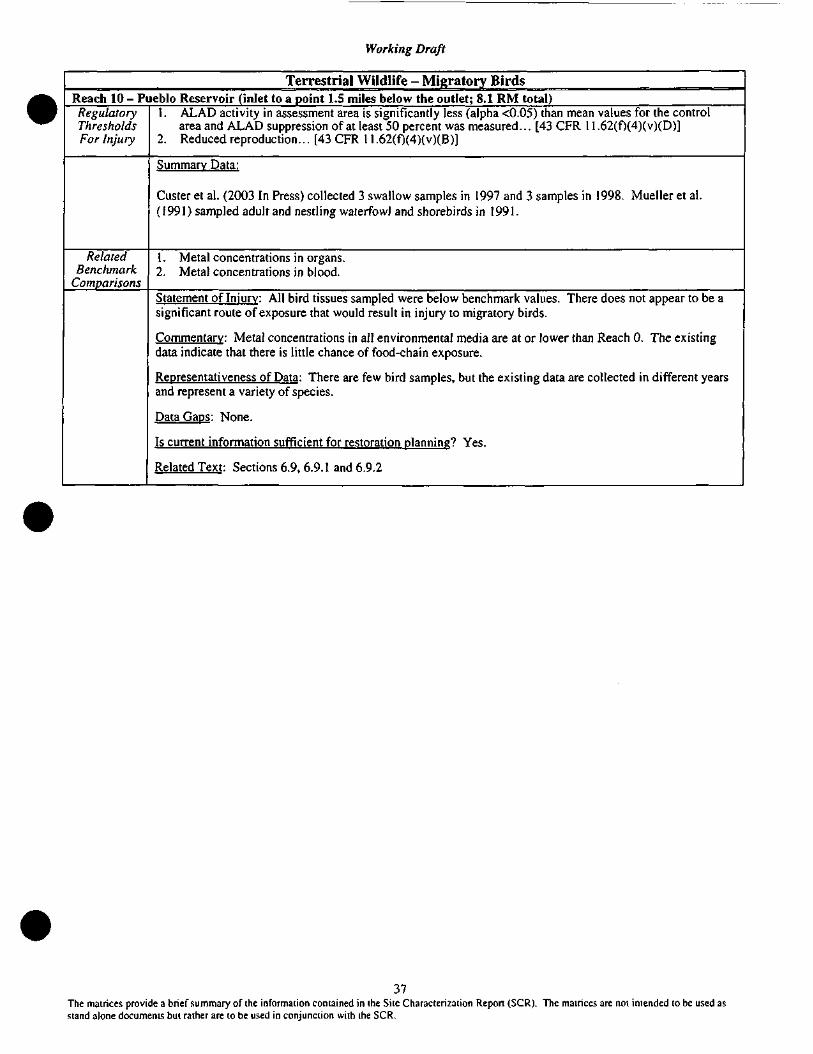
Working Draft
Terrestrial Wildlife - Migratory BirdsReach 10 - Pueblo Reservoir (inlet to a point 1.5 miles below the outlet; 8.1 RM total)RegulatoryThresholdsFor Injury
1. ALAD activity in assessment area is significantly less (alpha <0.05) than mean values for the controlarea and ALAD suppression of at least 50 percent was measured... [43 CFR 11.62(f)(4)(v)(D)]
2. Reduced reproduction... [43 CFR 11.62(f)(4)(v)(B)]
Summary Data:
Custer et al. (2003 In Press) collected 3 swallow samples in 1997 and 3 samples in 1998. Mueller et al.(1991) sampled adult and nestling waterfowl and shorebirds in 1991.
RelatedBenchmark
Comparisons
1. Metal concentrations in organs.2. Metal concentrations in blood.
Statement of Injury: All bird tissues sampled were below benchmark values. There does not appear to be asignificant route of exposure that would result in injury to migratory birds.
Commentary: Metal concentrations in all environmental media are at or lower than Reach 0. The existingdata indicate that there is little chance of food-chain exposure.
Representativeness of Data: There are few bird samples, but the existing data are collected in different yearsand represent a variety of species.
Data Gaps: None.
Is current information sufficient for restoration planning? Yes.
Related Text: Sections 6.9, 6.9.1 and 6.9.2
37The matrices provide a brief summary of the information contained in the Site Characterization Report (SCR). The matrices are not intended to be used asstand alone documents but rather are to be used in conjunction with the SCR.
7.0 SMELTER-EMISSIONS AIRSHED
7.1 Purpose and Objectives of Airshed Survey
Deposition of airborne stack emissions from historic smelter operations occurred in areas
surrounding the smelters within the Leadville Mining District. Smelter emissions consisted of gasses and
particles. The residue of gaseous emissions has dissipated over time; however, particulate deposition is
still evident. Particulate smelter emissions contain metals derived primarily from ore. Predominant
metals that would have been associated with historic smelter emissions in the Leadville area include
arsenic, cadmium, copper, lead, and zinc. Delineation of the area of deposition of smelter-stack emissions
(or the smelter "Airshed" as defined by the Work Plan) is of interest in evaluating the potential for
specific smelter-related impacts to the natural resources of the UARB,
The objectives of the airshed delineation are to identify the information available to characterize
the smelter-emissions depositional zone and to determine if additional data are needed to define the
boundaries of the smelter airshed. To meet these objectives, surficial soil metals concentrations from
existing data sources were mapped using a GIS. The GIS mapping results were further considered with
regard for the potential for injury to natural resources from historic smelter deposition. Because of the
overlap of smelter deposition with areas of mining disturbance it is important to consider the
characteristics that distinguish smelter-emission deposition from other mining-related impacts to soils
and/or vegetation.
7.2 Approach
The majority of the smelting activities in and around Leadville occurred during the late 1800s and
very early 1900s. Smelters in the UARB have not operated for many years. Metals delivered to soil via
airborne emissions may have since been influenced by water and/or wind erosion or by dissolution in and
transport by infiltrating water. For these reasons, the entire area of smelter-emissions deposition may no
longer be readily apparent. Investigations at other historical smelter sites (e.g., Black and Veatch 1988;
Wixson et al. 1988; Dames and Moore 1991; Bechtel 1992) have shown that areas of smelter deposition
may be identified from the relative concentrations of metals found in undisturbed, or minimally disturbed,
surficial soils. Those studies have also confirmed that the total metals content of undisturbed soils
decreases with increasing distance from smelter-emission sources, as expected for an air emissions
source. Metals concentrations at the outer extent of the deposition area, where relatively small amounts
of particulate emissions were deposited, may be indistinguishable from their background concentrations
J:\010004\Task 3 - SCR\SCR_current1.doc 7-1
in soil. Therefore, delineation of the airshed must focus on the areas where soil conditions due to smelter-
emissions deposition are readily distinguishable from natural variability.
Relatively insoluble metals with limited mobility in the soil environment (e.g., lead), serve as the
best indicators of historical smelter emissions because their distributions in soil are the least likely to
change over time. Lead contamination of soil is expected to be persistent due to lead's low solubility and
mobility in soil. For this reason, the lead concentration in undisturbed soil often serves as a useful
indicator of past deposition of emissions from smelters. The other metals found in Leadville district ores,
such as arsenic, cadmium, copper, and zinc, may also be useful for identifying soil impacted by smelter
emissions. Data describing the concentrations of these metals in soil are included in the project database.
As described in prior report sections, there are a number of other sources of lead to the soils in
Leadville in addition to smelter emissions. These sources include the natural (or background) sources of
lead to soils; mining-related sources such as ore and waste rock piles, mine-waste and slag; and other
sources not related to mining activities such as historic automobile emissions and deteriorated lead-based
paint. In order to delineate an area of smelter-emissions deposition using lead concentrations in soil, it is
important to be able to distinguish smelter-emmissions from other sources of lead.
Several types of information may be used to assess the relative importance of smelter emissions
compared to other source emissions in contributing to the current levels of soil contamination and
delineating the smelter airshed in the UARB, including:
• Locations and operating histories of smelters;
• Long-term meteorological data describing predominant wind directions and wind speeds;
• Metals concentrations, especially lead, in shallow undisturbed soils; and
• Characterization of the solid-phase (i.e., mineral) associations of metals, especially lead,
related to smelter emissions as opposed to metals from other sources.
The following section identifies the data that are currently available to provide the information
listed above.
J:\010004\Task 3 - SCR\SCR_currentl.doc 7-2
7.3 Existing Sources of Relevant Data
A review of existing reports and data lead to several sources of information that are relevant to
delineation of the smelter airshed. The data discovered and compiled through this effort originate
primarily, although not exclusively, from investigations of the California Gulch Superfund/NPL Site (the
Site). A summary of the information found in existing sources is provided below.
7.3.1 Historical Smelter Information
The Site includes a number of former smelters where lead-silver and lead-zinc ores were
processed. A report prepared by Jacobs Engineering for the USEPA (Jacobs 1991) contains a brief
history of each of 17 smelters identified within the Site, including information describing the smelter
facilities, smelting methods, and dates of operation. This information, summarized in the Jacobs report,
was used to develop sampling plans for remedial investigations within the Site (Table 7-1).
Smelters previously operating in the vicinity of Leadville processed primarily lead-sliver and
lead-zinc ores from the Leadville Mining District. Smelting operations in this area started in 1875, and by
1879 there were 15 smelters in operation in the immediate vicinity of Leadville. However, most of the
smelting operations were relatively short-lived, and by 1900 there were only three operating smelters
remaining. The last smelter to cease operation was the Arkansas Valley (AV) Smelter, which operated
nearly continuously from 1879 to 1961.
Several smelters were located along California Gulch west of the City of Leadville (Grant/Union,
Leadville, Western Zinc, La Plata, American, AV, California, Lizzie, and Malta Smelters, listed from east
to west). Among these, the AV Smelter, the longest operating smelter in the area, was located on the
north side of California Gulch at Stringtown. Smelters were also located along Evans Gulch (Ohio and
Missouri, Cummings and Finn, Gage-Hagaman, and Raymond, Sherman and MacKay Smelters), within
the City of Leadville (Harrison Reduction Works) and east of Leadville (Adelaide and Little Chief
Smelters). The locations of these smelters are shown on Figure 7-1 (Walsh 1993a, adapted from Jacobs
1991).
When operating, smelters generated slag, flue dust, fugitive emissions, and stack emissions. Dust
chambers were typically used to retain dust before furnace gases were vented through a stack. Dust
retention was later improved through the use of bag houses. By approximately the mid 1890s, bag
houses, which reduced the amount of dust in stack emissions, were used by most of the Leadville-area
J:\010004\Task 3 - SCR\SCR_currentl.doc 7-3
smelters. Stack emissions also contained metallic and sulfur vapors. In addition, the smelter stacks were
"blown" when furnaces needed repair or cleaning or were shut down. When the stacks were blown the
emissions would have also contained the smelting residue coating the furnace walls and stack.
7.3.2 Remedial Investigation of California Gulch Soils
A soil investigation study was performed to obtain the data necessary to conduct feasibility
studies and baseline risk assessments for the NPL site (CDM 1994). These data were used to determine
the concentrations of the elements of potential concern (identified by USEPA as arsenic, cadmium, lead,
mercury, and zinc) and their distribution in soil, as well as to identify the source(s) of the elements of
potential concern.
A total of 3,589 soil samples were collected from 719 locations during 1991 and 1992. At most
locations, samples were collected from five depth intervals (0 to 1 inch, 1 to 2 inches, 2 to 6 inches, 6 to
12 inches, and 12 to 18 inches). Soil sample locations were dictated by a grid pattern that extended over
the entire site and some adjacent areas. At each sampling location, the soil was classified according to
location, surface cover, and soil type (native, fill, or mine-waste). Native soils were also described as
undisturbed or disturbed.
All samples were dried and sieved prior to analysis for eleven elements (silver, arsenic, barium,
calcium, cadmium, copper, iron, manganese, nickel, lead, zinc) by x-ray fluorescence spectrometry
(XRF). Selected samples were also submitted to CLP laboratories for analysis of the same elements plus
potassium, magnesium, aluminum, and mercury. For each sample, two size fractions (less than 2 mm and
less than 250 um in diameter) were analyzed. Data analyses were performed using the results from XRF
analyses. A metals speciation study was conducted independent of the soil investigation using a subset of
the samples collected for the soil investigation study. The results from the speciation are presented
elsewhere (see below).
The distributions of metals in soils were presented on two sets of contour maps using data from
(1) all soils, and (2) undisturbed native soils. Kriging analysis was used to generate the iso-concentration
maps presented in the report.
The lead iso-concentration contour map for "all soils" (Figure 7-2, from CDM 1994) shows
elevated concentrations in several areas of the site, including: east of the City of Leadville, where mine-
waste piles are present; northeast of Leadville near the historic Evans Gulch smelter area; lower
J:\010004\Task 3 - SCR\SCR_currentl.doc 1A
California Gulch around Stringtown and the AV Smelter site; extending north and south from California
Gulch; and near Colorado Mountain College at Georgia Gulch. An iso-concentration contour map for
lead in relatively undisturbed native soils only (Figure 7-3, from COM 1994) shows more limited areas of
elevated lead concentrations. Evans Gulch and lower California Gulch — are revealed as the dominant
areas of elevated lead concentrations in the top 1 inch of undisturbed native soil likely associated with
former smelting activities.
7.3.3 Smelter Remedial Investigation
The focus of the Smelter Remedial Investigation (RI) (Walsh 1993a) was to collect data to
identify and evaluate the impacts of historical smelting operations on human health and the environment
within the boundaries of the California Gulch NPL Site. The Smelter RI was performed concurrently
with the Soil Investigation (COM 1994) discussed above, and data from both studies were used to support
this investigation.
The purpose of the Smelter RI was to describe the geographic distribution of soil metals
(primarily arsenic, cadmium, lead, and zinc) originating from the smelter facilities. The Smelter RI
consisted of several tasks including: literature and document review; site reconnaissance of smelter sites
to identify potentially contaminated areas (e.g., historic bag houses and dust chambers); air-dispersion
modeling to establish probable wind depositional patterns and the potential extent of airborne emissions;
soil sampling and laboratory testing and analysis; and data evaluation and summary.
Air-dispersion modeling was performed to evaluate historic depositional patterns and identify
potential locations for sampling associated with maximum deposition of airborne emissions from the 17
historical smelter operations identified by Jacobs. The Industrial Source Complex Short Term (ISCST)
model was used to estimate the contributions of four metals (arsenic, cadmium, lead, and zinc) in historic
smelter emissions to their concentrations in soil across the site. This model requires meteorological data
and information to describe stack emissions from the various historical smelters.
The meteorological data used to define the model input parameters were collected for a one-year
period in 1990 and 1991 at two locations, the Yak Tunnel and Colorado Mountain College. These data
indicate that wind directions and wind speeds vary seasonally and that the annual prevailing wind
directions, in order of greatest duration, are expected to be from: (1) northwest to northeast 35 percent of
the time, (2) east northeast to east southeast 31 percent of the time, and (3) south to west southwest less
than 20 percent of the time.
J:\010004\Task 3 - SCR\SCR_currentl .doc 7-5
The information available to describe past smelter operations and stack emission characteristics
was extremely limited. The types, durations and rates of historic emissions from stacks associated with
the 17 smelters identified in the Leadville area were variable over time and among the different smelters.
Input parameters used in the ISCST model were generally based on assumptions about operations rather
than documented practices.
Given these inputs, the resultant model predicted metals concentrations across a rectangular grid
of emission receptor points that extended 15.5 kilometers (km) north to south and 18.5 km east to west
across the study area. These results are presented on metals distribution maps showing the cumulative
total metals (sum of arsenic, cadmium, lead and zinc) contribution to soil from all smelter emissions
combined. These results were then used to select the locations and extent of soil sampling used to support
the Smelter RI. Given the uncertainty in the model inputs and resulting output, the model results were not
used to delineate the airshed area without field confirmation through soil sampling and analysis.
Soil samples (3,589) were collected from 719 locations during the soil investigation study (Camp
Dresser & McKee (COM) 1994), and Walsh analyzed an additional 276 samples that they collected from
80 new locations. The area where soil sampling was performed lies roughly within the boundaries of the
California Gulch NPL Site except to the south of Smeltertown in California Gulch and also immediately
south of the East Fork Arkansas River where additional soil samples were collected outside the NPL site
boundaries. The additional soil samples were analyzed for arsenic, cadmium, lead, and zinc by XRF.
The same sample depths and sample preparation and analysis methods were used by CDM and Walsh,
and the results from these two studies are considered comparable. During soil sampling, each sample
location was evaluated by a soil scientist, and the soil was described as either disturbed or undisturbed
based on whether or not mine-waste, fill material, or human artifacts were present.
The largely undisturbed area to the south of California Gulch and downwind of the former AV,
California, La Plata, and American smelters was presumed to be an area impacted exclusively by smelter
emissions and was used as the control area. The smelter-emissions control area is bounded by Georgia
Gulch to the east, California Gulch to the north, Highway 24 to the west, and the southern boundary of
the study area. Most of this area lacks any evidence of historic mining activities, yet metals
concentrations in soils are high relative to other undisturbed areas. The smelter-emissions control area is
predominantly forested but also includes bare ground immediately south of the former AV Smelter.
Metals ratios in soils from the smelter-emissions control area were used to characterize a
signature associated with soils that contain smelter-emissions fallout. The data from the less than 2-mm
J:\010004\Task 3 - SCR\SCR_currentl .doc 7-6
size fraction and 0- to 1-inch depth interval were used to characterize the smelter-emissions signature.
The control-area approach is based on the assumption that the chemical and physical changes that have
taken place at the control site are representative of chemical and physical changes that have occurred in
other areas where smelter emissions have been the primary source of metals to soils. Given this
assumption, the signatures of the smelter-emissions control area reflect both the effects of smelter-
emission fallout and the chemical and physical changes that have occurred since the cessation of smelting
in this area.
Linear-regression methods were used to describe co-variation of lead concentrations with the
concentrations of other metals in soils from the smelter-emissions control area. The linear relationships
identified were then used as the basis for comparison to metals concentrations in soils from other parts of
the study area. For control sites, regression analysis was used to identify metal pairs having significantly
correlated (99 percent confidence) concentrations. The metal signature was then described for
significantly correlated combinations, plus or minus one standard deviation of the regression equation. A
total of nine metals correlations were found to be significant in 0- to 1-inch depth soils from the smelter-
emissions control area.
Using the metals signature from control-area soils at the 0- to 1-inch depth, the metals contents of
0- to 1-inch deep soils from the other sites were tested for positive or negative agreement with the
smelter-emissions signature. For example, the results of comparison of the control lead:zinc ratios to the
same ratio in undisturbed soils across the study are shown on Figure 7-4 (Walsh 1993a). In cases where
at least seven of nine of the metals ratios were shown to have metals contents consistent with the control-
area signature, the soil from that location was considered to share the smelter-emissions signature, as
shown on Figure 7-5 (Walsh 1993a). As shown on Figure 7-4, there are a number of locations where the
lead:zinc ratio in undisturbed surface soil does not match the smelter-emissions control-area signature,
even though the location clearly lies within the expected boundaries of the smelter airshed. These
examples likely result from the difficulties in predicting a smelter signature that would apply to emissions
from numerous smelter operations that operated differently and at different periods of time within the
same area. For this reason, the accuracy of the smelter-signature approach developed by Walsh for this
study remains unknown.
Results obtained from the smelter-signature comparison method were used to delineate an area
impacted by smelter emissions as shown on Figure 7-6 (Walsh 1993a). The shaded area on Figure 7-6
represents the distribution of sampled sites that have a metals signature resembling the smelter-emissions
control area, including both undisturbed and disturbed sites. The undisturbed locations resembling the
control area are also shown individually. The shaded area was delineated using a 750-foot buffer zone
J:\010004\Task 3 - SCR\SCR_currentl .doc 7-7
around each sample site that resembled the control area. The width of the buffer zone is appropriate to
the sampling grid dimensions of 1,000 ft2 in unpopulated areas and 500 ft2 in populated areas.
Based on these results, the areas exhibiting smelter-emission signatures include:
• Areas south of U.S. Highway 24 and between upper California Gulch and the Arkansas
River;
• The west and northwest portions of the study areas; and
• Portions of Evans Gulch that correspond to the former smelter sites in the gulch and a
small area near the Little Chief Smelter site.
Areas determined to be impacted primarily by sources of metals other than smelter emissions
(e.g., mine-waste, mine-waste slag) include:
• Much of the City of Leadville, which contains various types of fill;
• The eastern portion of the study area, which contains alluvial mine-waste and mine-wasterock;
• California and Malta Gulches, which contain alluvial mine-waste and/or mine-wasterock;
• Hecla mine-waste area;
• Lake Fork Trailer Park area, which consists of fill material; and
• Channels and low terrace deposits along the Arkansas River at California Gulch, whichare impacted by fluvial mine-waste.
This empirical approach was described as having several benefits over a modeling approach in
delineating the deposition airshed, as follows:
• Model input parameters were estimates and subject to error; and
• Observed metals concentrations relative to a control site are good indicators of smelter-emission deposition because the metals contents of soils are not expected to have
changed significantly following deposition, except possibly in areas subject to erosion
(steep slopes, stream channels, etc.).
J:\010004\Task 3 - SCR\SCR_currentl .doc 7-8
7.3.4 Characterization of Pre-Mining Soil Conditions
In support of the smelter investigations, Walsh also performed a study to describe pre-mining soil
geochemistry within the Leadville Mining District (Walsh 1994). The data used for this study were
primarily from other soils investigations of the California Gulch Site, including the Smelter RI (Walsh
1993 a) and Soils Investigation (COM 1994), but they also included metals data for soils collected from
undisturbed sites within the mineralized areas around the Site. Statistical methods (cumulative
probability plots) were used to differentiate between the "pre-mining" concentrations of metals, or
background concentrations, and their concentrations in soils disturbed by mining activities. Detailed soil
and surficial geology maps were also produced as part of this study. Information from the detailed soil
and surficial geology maps was used to identify and define seven soil-geologic units, which are
consequently tied to both the geomorphology and geochemistry of the soil parent materials.
The soil-geologic-unit map shows the locations of these seven general units. Areas of native,
undisturbed soils are shown as well as soils containing construction fill, mine-waste, waste rock and slag,
mechanically altered soils, eroded soils, and areas covered by buildings and parking lots. The native,
undisturbed soils have all soil horizons present and no evidence of man-made disturbance.
Pre-mining (or background) metals concentrations are presented for soils by "landscape position"
and by soil-geologic unit. The landscape position refers to either upland or alluvial soils. The findings
(Table 7-2) show that metals contents in alluvial soils are generally higher than those in upland soils,
primarily due to natural weathering and transport processes that concentrate heavier minerals, such as
common metallic-ore minerals, in depositional environments. In upland areas, background metals
concentrations were generally found in soil below the A horizon, suggesting that the downward transport
of metals is not a very active process in upland landscape positions. The metals concentrations of alluvial
soil horizons are more variable than the upland horizons, perhaps due to greater mobility of metals in the
alluvial soils. The pre-mining metals contents of soils from upland areas are within the low end of the
ranges of metals contents reported by Schacklette and Boemgen (1984) for soils of the western United
States. The arsenic and lead contents of pre-mining alluvial soils, however, appear greater than those
reported for western U.S. soils.
Walsh (1994) also identified background metals concentration ranges for each of the soil-
geologic units, but concluded that the ranges given for upland and alluvial landscape positions may better
represent pre-mining metal ranges over the entire site. Interestingly, the mean arsenic, cadmium, copper,
J:\010004\Task 3 - SCR\SCR_currentl.doc 7-9
and lead concentrations of the top 1 inch of undisturbed soils are generally higher than in the top 1 inch of
disturbed soils for a number of the soil-geologic units described. Walsh explained that the elevated
metals contents in the top 1 inch of undisturbed soils relative to disturbed soils may be due to:
• The relative immobility of metals in arid climates with soils of near neutral pH, such asLeadville;
• The higher organic matter content of surficial soils, which leads to greater sorption of
positively charged metal cations such as copper and lead; and
• Surficial soil contamination by non-disruptive processes, such as air deposition of metals.
7.3.5 Lead Speciation Studies
Several studies were performed to describe the solid-phase associations of metals present in soils
and other environmental media from the California Gulch NPL Site. The information provided by these
studies is useful for distinguishing soils where elevated metals contents have resulted from smelter-
emissions deposition rather than from other mining, or non-mining, related sources.
Selected soil samples from the studies described above were included in a site-wide metals
speciation investigation. The final metals speciation report was prepared jointly by CDM, University of
Colorado and the R.J. Lee Group (CDM et al. 1994; Drexler and Weston 1995) and includes raw data
from a total of 320 samples of soil, mine-waste (waste piles and mine-waste), environmental sample types
(residential soils and interior dust), and. fluvial deposits/stream sediments. Approximately 15 of the soil
samples included in this study are from locations within the area delineated by Walsh (1993 a) as impacted
by smelter emissions. Maps included in this report show that the lead mass in surficial soils from these
areas is primarily associated with iron and manganese oxides, phosphate, and organic carbon phases, with
minor amounts of lead in silicate and "slag" phases.
Walsh also performed a lead speciation study (Walsh 1993b), to support the selection of the
hillside south of the AV Smelter site as a control area for smelter emissions and to provide additional
characterization data for identification of soils containing metals derived from smelter emissions. Soils
from the hillside south of the AV Smelter site have lead levels ranging from several hundred mg/Kg to
almost 9,000 mg/Kg in surface samples. Other metals are also enriched compared to their concentrations
observed in the other parts of the study area (Walsh 1993a). The AV hillside soils lie downwind from the
smelter site and are likely to have been impacted primarily by airfall products from the AV Smelter.
J:\010004\Task 3 - SCR\SCR_currentl.doc 7-10
These soils have a low pH (4.5 to 6) due to the low buffering capacity of the soils and the past deposition
of S02 gases from smelter emissions. The undisturbed soil surface on this hillside has a dark, sooty
coating that resembles desert varnish. This coating is thin but high in lead-carbon-oxygen compounds.
The majority of the lead-bearing particles observed in these soils consist of various carbonaceous and
siliceous fly-ash particles, some of which can be up to several millimeters in diameter. Walsh described
an ash particle with a siliceous, low-iron, glassy matrix (in contrast to the high-iron matrix of slag)
containing numerous small particles of lead oxide and sulfate.
In the samples considered representative of soils containing stack fallout, Walsh observed a small
proportion of lead in organic and high-silica materials (carbonaceous and siliceous ash), a larger
proportion of lead in relatively soluble forms, such as lead oxide (PbO) and lead sulfate (PbSO4), and/or
readily exchangeable surface sorption sites and the highest proportion either chemically sorbed to soil
minerals, such as iron and manganese oxides, and contained in oxide and phosphate phases, or bound
with more resistant mineral phases, such as sulfides and silicates. The presence of carbonaceous and
siliceous ash particles, even in small amounts, appears indicative of the presence of smelter-emissions
fallout.
7.3.6 Baseline Risk Assessments
The Baseline Human Health Risk Assessment (Weston 1996) and the Ecological Risk
Assessment for the Terrestrial Ecosystem (Weston and Terra 1997) rely on soils data collected by Walsh
(1993a and 1994) and CDM (1994) in the studies described above as well as data from other sources for
residential environmental media, mine-wastes, and plant and animal tissue. The lead dataset used to
perform the risk assessments is described in Consolidated Findings of Soil-Lead Investigations at the
California Gulch NPL Site (Weston 1994). Human health risks were evaluated using data describing the
metals concentration from the top 6 inches of soil (as a depth-weighted average) from residential areas.
Ecological risks were evaluated primarily using data describing the metals contents (arsenic, cadmium,
copper, lead, and zinc) in the top 2 inches of soil from nonresidential areas.
The ecological risk assessment also utilized data for waste rock, mine-waste piles, slag, fluvial
mine-waste, and sediment from nonresidential areas and biological data (small mammals and vegetation)
collected by Asarco and Resurrection (Stoller 1996). The metals concentration data for co-located
surficial soil and vegetation samples are included in the project database. Data collected for Resurrection
from the upper California Gulch area show little correlation between total metals contents and surface
soils and plant ecosystem diversity or plant metals content. In addition, AB-DTPA extractable metals (a
J:\OI0004\Task 3 - SCR\SCR_currentI.doc 7-11
potential measure of bioavailable metals) contents are not correlated with the total metals contents in soils
or co-located plant metals contents (Stoller 1996). Stoller (1996) reported that the only areas in upper
California Gulch showing evidence of phytotoxic stress are areas adjacent to mine-wastes. Evidence of
phytotoxic stress is absent from other areas remote from mine-waste.
7.3.7 Other Investigations
In addition to the studies performed to support investigations of the California Gulch Superfund
Site, there are several other studies that provide data that are useful to delineate the smelter airshed.
Those data are described below.
7.3.7.1 BLM Soils Investigation
During the summer of 2000, the BLM collected soil samples from the upper 1 inch of soil at
approximately 70 locations within the UARB. Thirteen of those were upland locations within Iowa
Gulch, approximately 1.5 miles south of California Gulch. These samples were referred to as the
"airshed" samples. Soils were also collected from a variety of 2- to 6-inch depth intervals to a maximum
depth of 26 inches at locations predominantly within riparian areas along the Arkansas River from
California Gulch downstream to Pueblo. All of the soil samples were analyzed for iron, lead, manganese,
and zinc. The locations, sample depths, and soil lead concentrations for samples collected in the vicinity
of former smelters within California Gulch are shown on Figures 7-7 and 7-8 along with data from the
other sources described in this report.
The lead concentrations in the Iowa Gulch samples are generally lower than in soil collected
approximately one mile north and within the California Gulch drainage. The southernmost soil samples
from California Gulch have lead contents ranging from 713 to 2,223 mg/Kg. The lead concentrations in
the Iowa Gulch soils range from 252 to 924 mg/Kg. All of the Iowa Gulch soils have lead concentrations
greater than Walsh's characterization of background concentrations in upland soils (150 mg/Kg, Table 7-
2).
Samples collected north of Leadville, along the East Fork of the Arkansas River and upstream of
Evans Gulch, have lead concentrations within the range for background soils. West of the Arkansas
River, near the confluence with California Gulch, lead concentrations range from 20 to 1,824 mg/Kg but
only exceed the background concentration in alluvial soils (870 mg/Kg, Table 7-2) at one location.
J:\010004\Task 3 - SCR\SCR_currentl .doc 7-12
These data demonstrate a trend of decreasing lead concentrations in undisturbed surface soil with
increasing distance from the historic smelter operations in the Leadville area.
7.3.7.2 Levy Study
In the summer of 1988, Levy and others (Levy et al. 1992) sampled surface soils (upper 1 inch) at
one location in Tennessee Park. The sample was analyzed for a suite of metals, including lead. The total
lead concentration at this location was 275 mg/Kg, which further supports the conclusion of decreasing
lead concentrations in undisturbed surface soils with increasing distance form the historic smelter
operations in the Leadville area.
7.3.7.3 National Uranium Resource Evaluation Program Data
The U.S. Geological Survey's National Uranium Resource Evaluation (NURE) program provides
geochemical data for sediment and water samples collected from across the United States. More than
1,700 sediment samples were collected from the Leadville Quadrangle (2 degree sheet) and sediments
from approximately 30 locations within the UARB were analyzed for metals, including arsenic and lead.
The NURE sampling locations extend beyond the area where soil samples have been collected in support
of the various investigations described above. However, because the metals contents were measured in
sediment samples, these data are not directly comparable to the metals data for upland soils. For this
reason, the NURE data were not used to assist in airshed delineation and are not included in the GIS used
to prepare the map figures in this section.
7.3.7.4 U.S.G.S. Investigation of Fluvial Tailings
The U.S. Geological Survey, in cooperation with USEPA and the Bureau of Reclamation, studied
the effects of fluvial tailings deposits on soils, surface water and groundwater along a 3-mile reach of the
Upper Arkansas River (Walton-Day et al. 2000). The study area is located approximately 6 to 9 miles
downstream of the confluence of California Gulch with the Arkansas River. This work included
collection and analysis of 13 soil samples. Eleven of the soil samples were collected from the floodplain
in areas expected to have elevated metals concentrations due to fluvial deposition of visible tailings
J:\010004\Task 3 - SCR\SCR_currentl.doc 7-13
deposits. The remaining two samples were collected from above the floodplain in areas apparently
unaffected by fluvial tailings deposits; these two samples are referred to as background samples.
The samples were analyzed for 13 metals/metalloids, including arsenic and lead. The arsenic
concentrations in both background samples were 10 mg/Kg. Lead concentrations in these samples were
180and200mg/Kg.
7.3.7.5 USGS Remote Sensing Studies
Remotely sensed multi-spectral reflectance data were collected by the U.S. Geological Survey
(Swayze et al. 1996) and processed to characterize and identify localized sources of acid mine drainage
and contamination from waste rock piles within the California Gulch NPL Site. The interpretive map
developed from the Airborne Visible/Infrared Imaging Spectrometer (AVIRIS) reflectance data shows an
area of "smelter effluent ground coating" on the hillside south of the AV smelter site, the same area as
used in the Smelter RJ (Walsh 1993 a) as the control area for smelter impacted soils. This area was
spectrally mapped as an area where amorphous iron-hydroxide is present at the surface. Field
investigation of the area showed rocks coated with a grayish coating of material described as condensed,
arsenic-rich "effluent" that reportedly originated from the nearby AV Smelter stacks. Although multi-
spectral reflectance data were useful for identifying probable smelter-related mineral phases in soils from
a largely unvegetated area, their usefulness in more heavily vegetated areas has not yet been
demonstrated.
7.3.8 Summary of Findings to Delineate Smelter Airshed
Based on results from the previous studies described above, the following understanding is
provided:
• The smelter airshed may be delineated using data describing the metals content in
undisturbed surface soils in the areas surrounding former smelter operations. The lead
distribution map provided by CDM (1994) shows the areas where lead concentrations in
the upper 1-inch of undisturbed soil are relatively high. The areas highlighted based onthis map are: (1) an area south of the former Malta, Lizzie, California, AV, and American
smelter sites that extends south outside the California Gulch site boundaries, and (2) a
smaller area to the northeast of the former Elgin, Raymond, Sherman and McKay, Gage-
J:\010004\Task 3 - SCR\SCR_current 1 .doc 7-14
Hagaman, Cummings and Finn and Ohio and Missouri Smelter sites north of the City of
Leadville.
Similar areas were identified by Walsh (1993a) in the Smelter RI based on comparisons
of the relative abundances of metals to their relative abundances in soils from a smelter-
emissions control area. The control area for soils within the smelter airshed is located
due south of the former AV Smelter site and is believed to have received smelter-
emissions fallout from several smelters over an extended period, but it has not been
subject to other mining-related disturbances. The area identified by Walsh (1993a) as
impacted by smelter emissions is based on empirical data describing the metals content
and metals ratios in the top 1-inch of soil. These areas are delineated on Figure 7-6 (from
the Smelter RI) and include the same areas south of the AV Smelter site and northeast of
Leadville as described above, as well as broader areas to the north and south of the
former Malta, Lizzie, California, AV, American, La Plata, Grant Union, Western Zinc,
and Leadville smelter sites. The smelter airshed shown by Walsh extends south of the
NPL site boundary.
An air-dispersion model was also developed for the Smelter RI using limited
meteorological data and uncertain smelter-operations information. The resultant
predicted, or modeled, metals contents in soil were not consistent with observed metals
contents in soil. The lack of correlation between predicted and observed results is likely
due to uncertainty in the input parameters used for the model and the complexity of
modeling emissions from multiple smelters across this site each with different operatinghistories.
Data collected by the BLM demonstrate a trend of decreasing lead concentration in
undisturbed surface soil with increasing distance south, north, and west of the former
smelter locations. Lead concentrations approach their background ranges at the locations
sampled by BLM to the south in Iowa Gulch and north and west of California Gulch.
7.4 Description of Airshed Based on Existing Data
All of the studies described above provide data relevant to delineation of the smelter airshed, and
the best approach for defining the extent of the airshed utilizes the combined data from these various
sources.
The following data compilation and analysis steps were performed to assemble the best available
dataset for use in delineating the smelter airshed:
J:\010004\Task 3 - SCR\SCR_current 1 .doc 7-15
1. All available data describing metals concentrations in soil samples (less than 2-mm size
fraction) collected from the 0- to 1-inch or 0- to 2-inch depth intervals of undisturbed native
soils were compiled in an electronic database along with any available information describing
sample locations and soil characteristics (e.g., upland vs. alluvial soils). Based on the
findings of previous studies (CDM 1991; Walsh 1993a; and Walsh 1994), these are the
sample types that are considered most appropriate for delineating an area of smelter
deposition. In addition, metals concentrations data for soil samples collected from other
surface depth intervals (e.g., 0 to 6 inches from Keammerer data set) were also included in
the electronic database. Sample depth information was retained for each metals concentration
result included in the database to distinguish true surface soils from the uppermost 2 inches of
soil, from deeper soil sections.
2. The samples collected from undisturbed native soils were identified using GIS methods to
select the sample locations within areas delineated on Walsh's (1994) detailed soil map as
undisturbed, native soil types. For samples collected outside the extent of Walsh's soil map
(and with no information provided to describe the soil type or soil disturbance), the sampling
locations were assumed to be undisturbed native soil.
3. Maps showing the lead and arsenic concentrations at each of the locations within undisturbed,
native-soil types were generated (Figures 7-7 and 7-9). These maps also identify locations
where lead or arsenic concentrations exceed their background concentration in upland soil
(Pb>150 mg/Kg, As>30 mg/Kg) and in alluvial soil (Pb>870 mg/Kg and As>120 mg/Kg).
Note that for the locations within a 500-year floodplain, the comparison to the upland
background is conservative because the background lead and arsenic concentrations
determined by Walsh for alluvial soils are actually much higher.
4. The area where lead and/or arsenic concentrations in the 0- to 2-inch depth interval exceed
upland background concentrations was delineated using a 750-foot buffer zone around each
sampling location where surface soil exceeded the background value, and these areas were
shown together in map view (Figure 7-11). This mapping approach is consistent with that
used by Walsh in the Smelter RI. The area of overlap was highlighted.
The maps produced from these steps are included as Figures 7-7 through 7-11. The area that
includes soils containing higher than background concentrations of lead and arsenic is shown along with
areas defined as higher than background based on lead or arsenic alone. The area identified from lead
concentrations is nearly the same as the area identified using arsenic concentrations. As shown on Figure
7-7 and 7-9, the background concentrations of lead and arsenic are exceeded at the majority of locations
where undisturbed native soils have been sampled and analyzed. The combined area where undisturbed
soil lead or arsenic concentrations exceed their respective background concentrations is the area likely to
lie within the smelter airshed.
J:\010004\Task 3 - SCR\SCR_currentl.doc 7-16
The area identified as likely to be within the smelter airshed (Figure 7-11) is also shown over a
perspective view of the region, including the Leadville Mining District, on Figure 7-12. The view is from
the west side of the UARB looking east towards the Tenmile Range. This view is helpful when
considering the effects of prevailing wind directions and topography on the shape and extent of the
smelter-emission airshed. Prevailing wind directions are from the north-northwest and from the east-
northeast. As a result, a relatively large amount of smelter emissions would have been transported south-
southeast and west-southwest from the former smelter locations than in the other directions; the effects on
soil from the resultant airshed would also be most evident in these directions. This effect is borne out
immediately south of the AV Smelter where the hillside along the south side of California Gulch has
higher metals concentrations in soil and sparser vegetation than the neighboring hillsides. In addition,
because the smelters were located primarily in relatively low topographic positions along California
Gulch, the surrounding valley topography would be expected to trap smelter emissions during calm or
low-wind conditions. As a result, the California Gulch valley would have received a relatively larger
amount of smelter-emission deposition than higher, outlying topographic positions. The areas with the
highest metals concentrations shown on Figures 7-11 and 7-12 are consistent with the shape of a smelter
airshed expected to develop within the meteorologic and topographic conditions described here.
Although Figures 7-11 and 7-12 delineate a general area considered to lie within the smelter
airshed, they do not delineate the airshed boundaries. Defining an absolute boundary for an airshed
associated with a point source or multiple point sources would be misleading as air emissions travel
considerable distances at gradually lower and lower atmospheric concentrations that eventually approach
zero at some distance from the source. Because a condition of zero smelter-emissions deposition cannot
be accurately defined, or measured in soils, it is not possible to make an absolute delineation of the
airshed boundaries. Instead, a general pattern of decreasing metals concentrations, approaching the
background conditions, with distance from the source may be used as a more practical indicator of the
measurable extent of the airshed.
Figures 7-13 and 7-14 show the areas where lead and/or arsenic concentrations in soil are greater
than their background concentrations in upland soils as well as the locations where lead and/or arsenic
concentrations in soil are within the background range. Figure 7-13 is based on comparisons to the
upland background range, whereas Figure 7-14 is based on comparisons to the alluvial background.
Given the difficulty in distinguishing the outer edges of the airshed from true background conditions,
results shown on Figure 7-14 provide a clearer picture of the metals concentration gradient with distance
from the former smelters. Based on either of these representations of the data, it is clear that the
incidence of metals concentrations greater than background is highest in close proximity to the smelters
and that incidence declines with distance in all directions (north, south, east, and west). The existing data
J:\010004\Task 3 - SCR\SCR_currentl.doc 7-17
best characterize the extent of the airshed, as defined by estimated background conditions, to the north
and west of California Gulch. South of California Gulch, existing data show that soil metal
concentrations approach their background ranges in the vicinity of Iowa Gulch. Directly east of
Leadville, there are some locations where soil metals concentrations are within their background range,
but there is no consistent trend with distance west from the former smelter locations. The lack of a
recognizable trend toward lower metals concentrations may be due to the effects of large-scale mining
disturbances and the presence of the ore-grade mineral deposits within the upper portions of Evans Gulch,
Stray Horse Gulch, and California Gulch on soil metals contents. These additional factors make airshed
delineation east of Leadville particularly difficult.
7.5 Summary
In general, the available data allow for identification of the smelter airshed. For the purposes of
evaluating natural resource injury, the airshed boundaries may be defined by the areas where soil metals
concentrations, specifically lead and arsenic, are distinct from expected background concentrations in
undisturbed, upland soils. This is a conservative approach because the metals present in soil may
originate from numerous sources other than historical smelter-emissions deposition and some of the soil
samples used in this process are from alluvial soils, which have higher background metals concentrations.
The area where the airshed has been identified with highest confidence is the area shown on
Figures 7-11 and 7-12 as the highlighted area of overlap for locations with both lead and arsenic
concentrations in soil above their expected background concentrations at upland locations. This includes
most of the NPL site as well as areas south and west of the NPL-site boundaries. Although there is no
absolute delineation of the airshed boundary on these figures, Figures 7-13 and 7-14 show areas where the
soil metals concentrations do not exceed their background concentrations. If these areas lie within the
airshed, they are likely to be at its periphery where the soil conditions are not readily distinguishable from
those outside the airshed. These locations may be used from Figures 7-13 and 7-14 to identify the
approximate outer extent of the airshed.
7.6 Potential for Natural Resource Injury within Airshed
A specific concern was raised by USFWS regarding the potential for injury to Penland alpine fen
mustard (Eutrema penlandii), a rare species found in the Mosquito Range in central Colorado. Its
preferred habitat is characterized by wet, organically rich soils at elevations above 12,000 feet. There are
;.-\010004\Task 3 - SCR\SCR_currentl .doc 7-18
no reported populations of this species within the airshed and no evidence to indicate that previous
smelter emissions would have impacted any populations of these species.
The existing total metals data for surficial soils provide an estimate of the extent of historic
metals deposition from smelter emissions. In order to fully evaluate the potential for injury to other
resources within the airshed boundaries, additional data may be appropriate to describe the plant
availability of metals in surface soils and the possible phytotoxic effects of soils within the airshed. Total
metals concentrations could be used as a conservative guide in identifying locations for plant-available
sampling and evaluating the current extent of smelter deposition that may represent potentially phytotoxic
conditions. Review of existing total metals data indicate that the currently defined Airshed reasonably
bounds the area of potential phytotoxic concern. Therefore, any sampling for the purpose of evaluating
phytotoxicity would be limited to the area defined in Figures 7-11,7-13, and 7-14.
Figures 7-13 and 7-14 are used to define the potential for injury to natural resources within the
airshed boundaries. These figures show the airshed soil concentration gradients for lead using
background concentrations of >150 mg/Kg (Figure 7-13) and >870 mg/Kg (Figure 7-14). The boundaries
of the airshed are defined by the areas where lead concentrations are distinct from expected background
concentrations in undisturbed, upland soils (150 mg/Kg) and undisturbed alluvial soils (870 mg/Kg).
This is a conservative approach for delineating the airshed boundary because metals may originate from
numerous sources other than depositions from historical smelter emissions. It is clear that the occurrence
of metals concentrations greater than background is highest in close proximity to the former smelter
locations and these concentrations decline with distance from the smelters in all directions. There are
only two exceptions to this general trend that can be found northeast of Crystal Lakes (1 sample site) and
west of the Arkansas River and north of the Lake Fork drainage (1 sample site). Each exception is one
location among a larger group of sample sites (1 site out of 13 and 1 site out of 30) from the BLM (2000)
data set. It is highly unlikely that the lead concentrations reported for these sites are from smelter
emissions because the lead concentrations in soils surrounding each site are at or below background.
Figures 7-13 and 7-14 establish the boundaries that represent the areas of smelter deposition and
therefore establish the boundaries of potential injury. These boundaries are highly correlated with
existing conditions in the field. For example, the area with the highest soils concentrations of lead are
found south of California Gulch. This area is most likely devoid of vegetation because of elevated
concentrations of arsenic and zinc. It is important to note that the area of injury associated with smelter
emissions is contained within the NPL site.
J:\010004\Task 3 - SCR\SCR_currentt .doc 7-19
TABLES
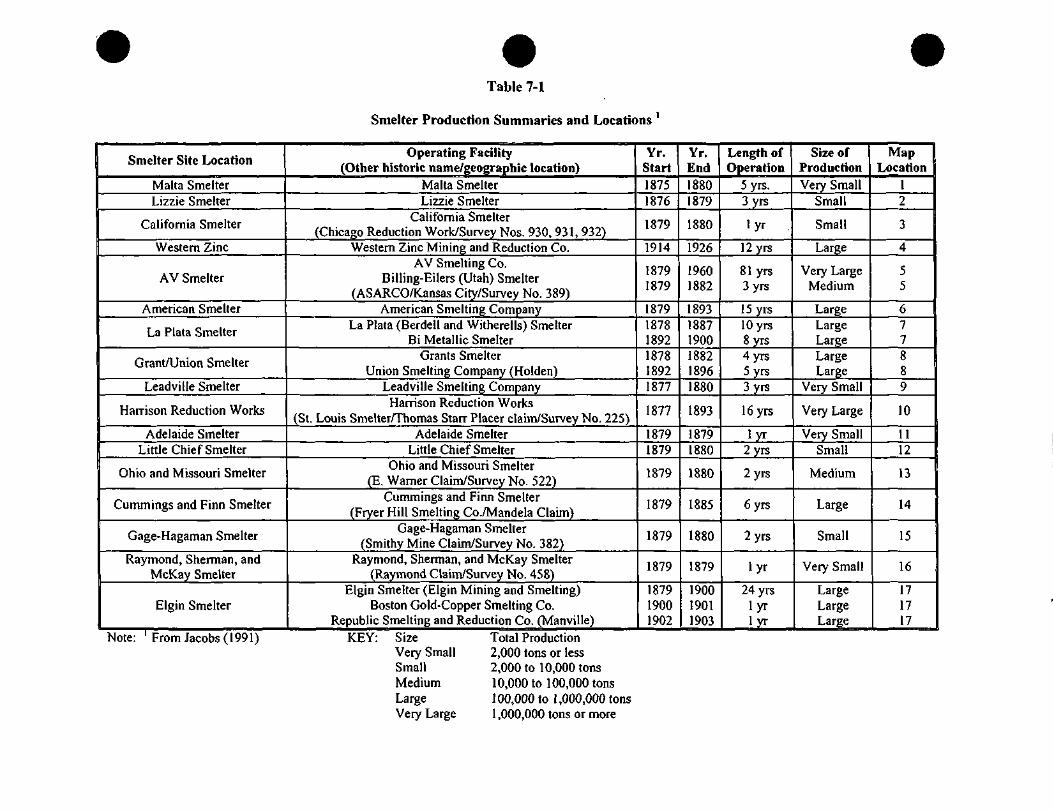
Table 7-1
Smelter Production Summaries and Locations '
Smelter Site Location
Malta SmelterLizzie Smelter
California Smelter
Western Zinc
AV Smelter
American Smelter
La Plata Smelter
Grant/Union Smelter
Leadville Smelter
Harrison Reduction Works
Adelaide SmelterLittle Chief Smelter
Ohio and Missouri Smelter
Cummings and Finn Smelter
Gage-Hagaman Smelter
Raymond, Sherman, andMcKay Smelter
Elgin Smelter
Operating Facility(Other historic name/geographic location)
Malta SmelterLizzie Smelter
California Smelter(Chicago Reduction Work/Survey Nos. 930, 931, 932)
Western Zinc Mining and Reduction Co.AV Smelting Co.
Billing-Eilers (Utah) Smelter(ASARCO/Kansas City/Survey No. 389)
American Smelting CompanyLa Plata (Berdell and Witherells) Smelter
Bi Metallic SmelterGrants Smelter
Union Smelting Company (Holden)Leadville Smelting Company
Harrison Reduction Works(St. Louis Smelter/Thomas Starr Placer claim/Survey No. 225)
Adelaide SmelterLittle Chief Smelter
Ohio and Missouri Smelter(E. Warner Claim/Survey No. 522)
Cummings and Finn Smelter(Fryer Hill Smelting CoTMandela Claim)
Gage-Hagaman Smelter(Smithy Mine Claim/Survey No. 382)
Raymond, Sherman, and McKay Smelter(Raymond Claim/Survey No. 458)
Elgin Smelter (Elgin Mining and Smelting)Boston Gold-Copper Smelting Co.
Republic Smelting and Reduction Co. (Manville)
Yr.Start18751876
1879
1914
18791879
187918781892187818921877
1877
18791879
1879
1879
1879
1879
187919001902
Yr.End18801879
1880
1926
19601882
189318871900188218961880
1893
18791880
1880
1885
1880
1879
190019011903
Length ofOperation
5 yrs.3 yrs
i y r12 yrs
81 yrs3 yrs
15 yrs10 yrs8 yrs4 yrs5 yrs3 yrs
16 yrs
iy r2 yrs
2 yrs
6 yrs
2 yrs
Iyr
24 yrsiy riyr
Size ofProductionVery Small
Small
Small
Large
Very LargeMedium
LargeLargeLargeLargeLarge
Very Small
Very Large
Very SmallSmall
Medium
Large
Small
Very Small
LargeLargeLarge
MapLocation
12
3
4
55
677889
10
1112
13
14
15
16
171717
Note: ' From Jacobs (1991) KEY: Size Total ProductionVery Small 2,000 tons or lessSmall 2,000 to 10,000 tonsMedium 10,000 to 100,000 tonsLarge 100,000 to 1,000,000 tonsVery Large 1,000,000 tons or more
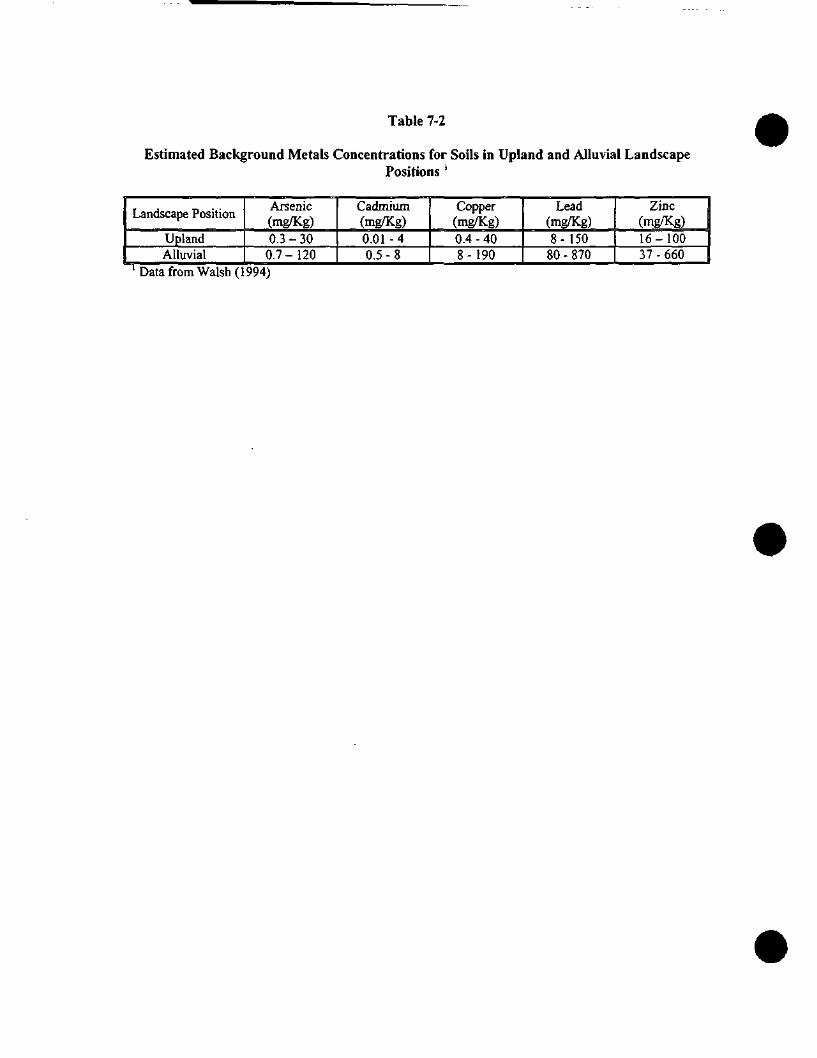
Table 7-2
Estimated Background Metals Concentrations for Soils in Upland and Alluvial LandscapePositions '
Landscape Position
UplandAlluvial
Arsenic(mg/Kg)0.3-30
0.7-120
Cadmium(mg/Kg)0.01-40.5-8
Copper(mg/Kg)0.4 - 408-190
Lead(mg/Kg)8- 150
80 - 870
Zinc(mg/Kg)16-10037 - 660
'Data from Walsh (1994)
FIGURES
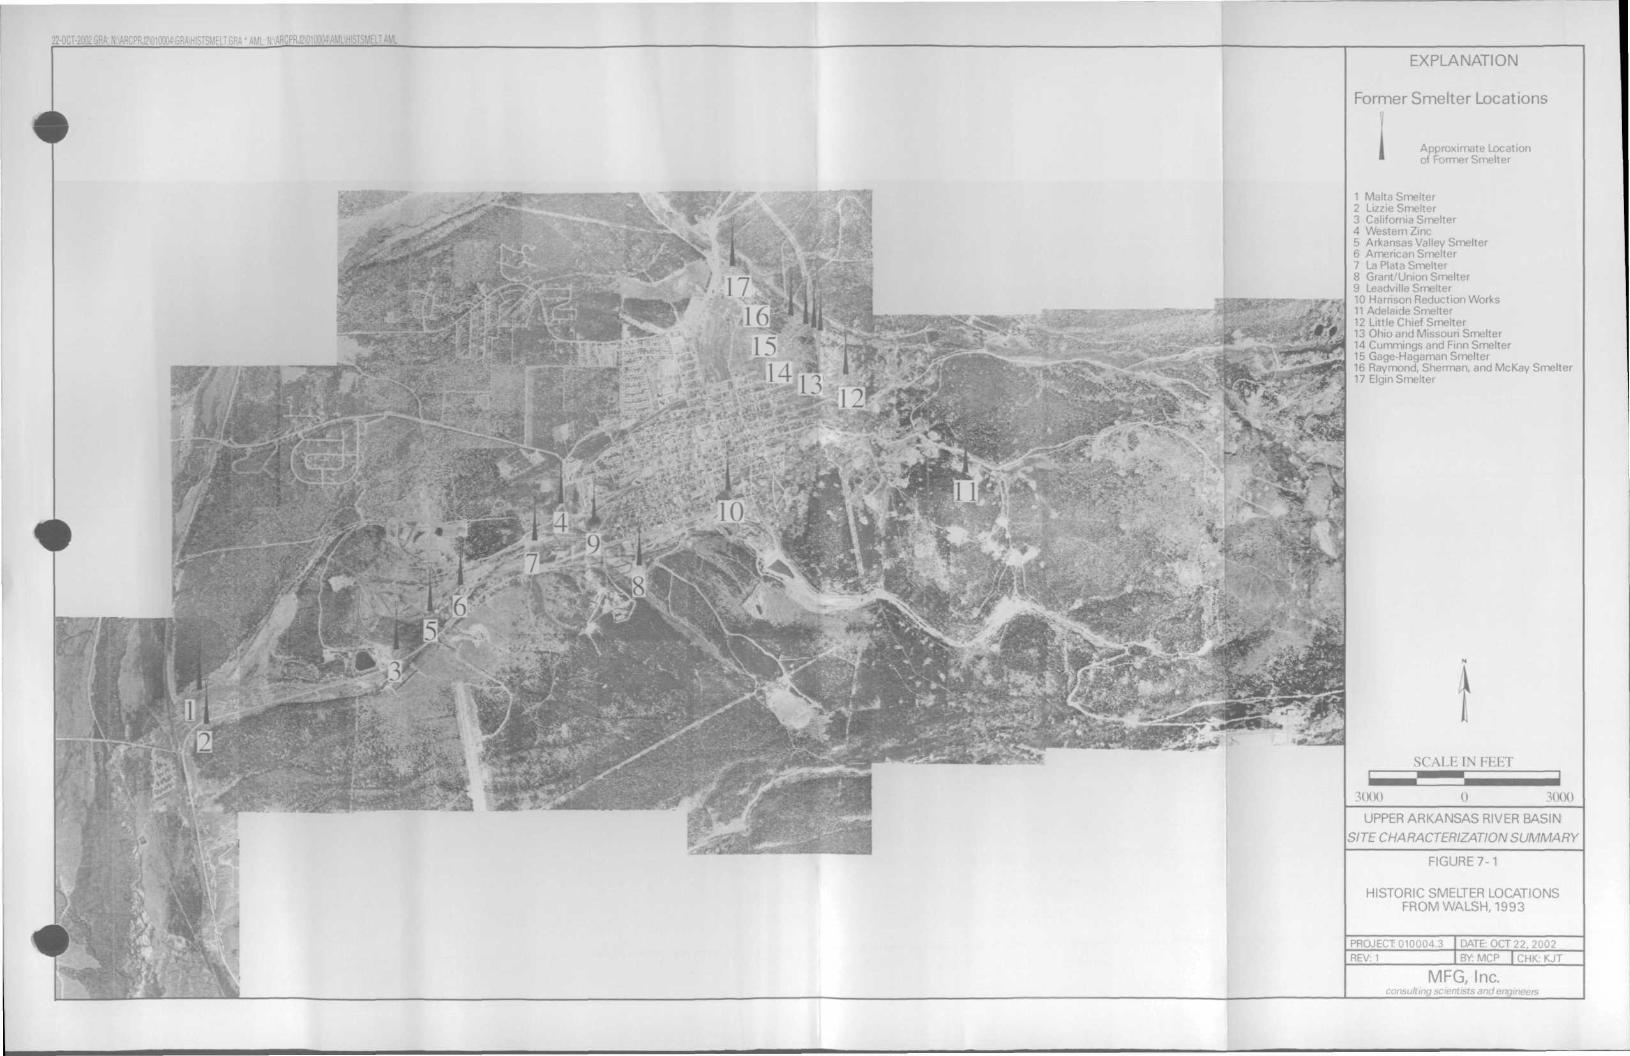
22-OCT-201:- --MELT.AML
?->"
EXPLANATION
Former Smelter Locations
Approximate Locationof Former Smelter
1 Malta Smelter2 Lizzie Smelter3 California Smelter4 Western Zinc5 Arkansas Valley Smelter6 American Smelter7 La Plata Smelter8 Grant/Union Smelter9 Leadville Smelter10 Harrison Reduction Works11 Adelaide Smelter12 Little Chief Smelter13 Ohio and Missouri Smelter14 Cummings and Finn Smelter15 Gage-Hagaman Smelter16 Raymond, Sherman, and McKay Smelter17 Elgin Smelter
3000
SCALE IN FEET
3000
UPPER ARKANSAS RIVER BASIN
SITE CHARACTERIZATION SUMMARY
FIGURE 7-1
HISTORIC SMELTER LOCATIONSFROM WALSH, 1993
PROJECT 010004.3 DATE: OCT 22, 2002REV: 1 BY: MCP | CHK: KJT
MFC, Inc.it iny scientists and engineers
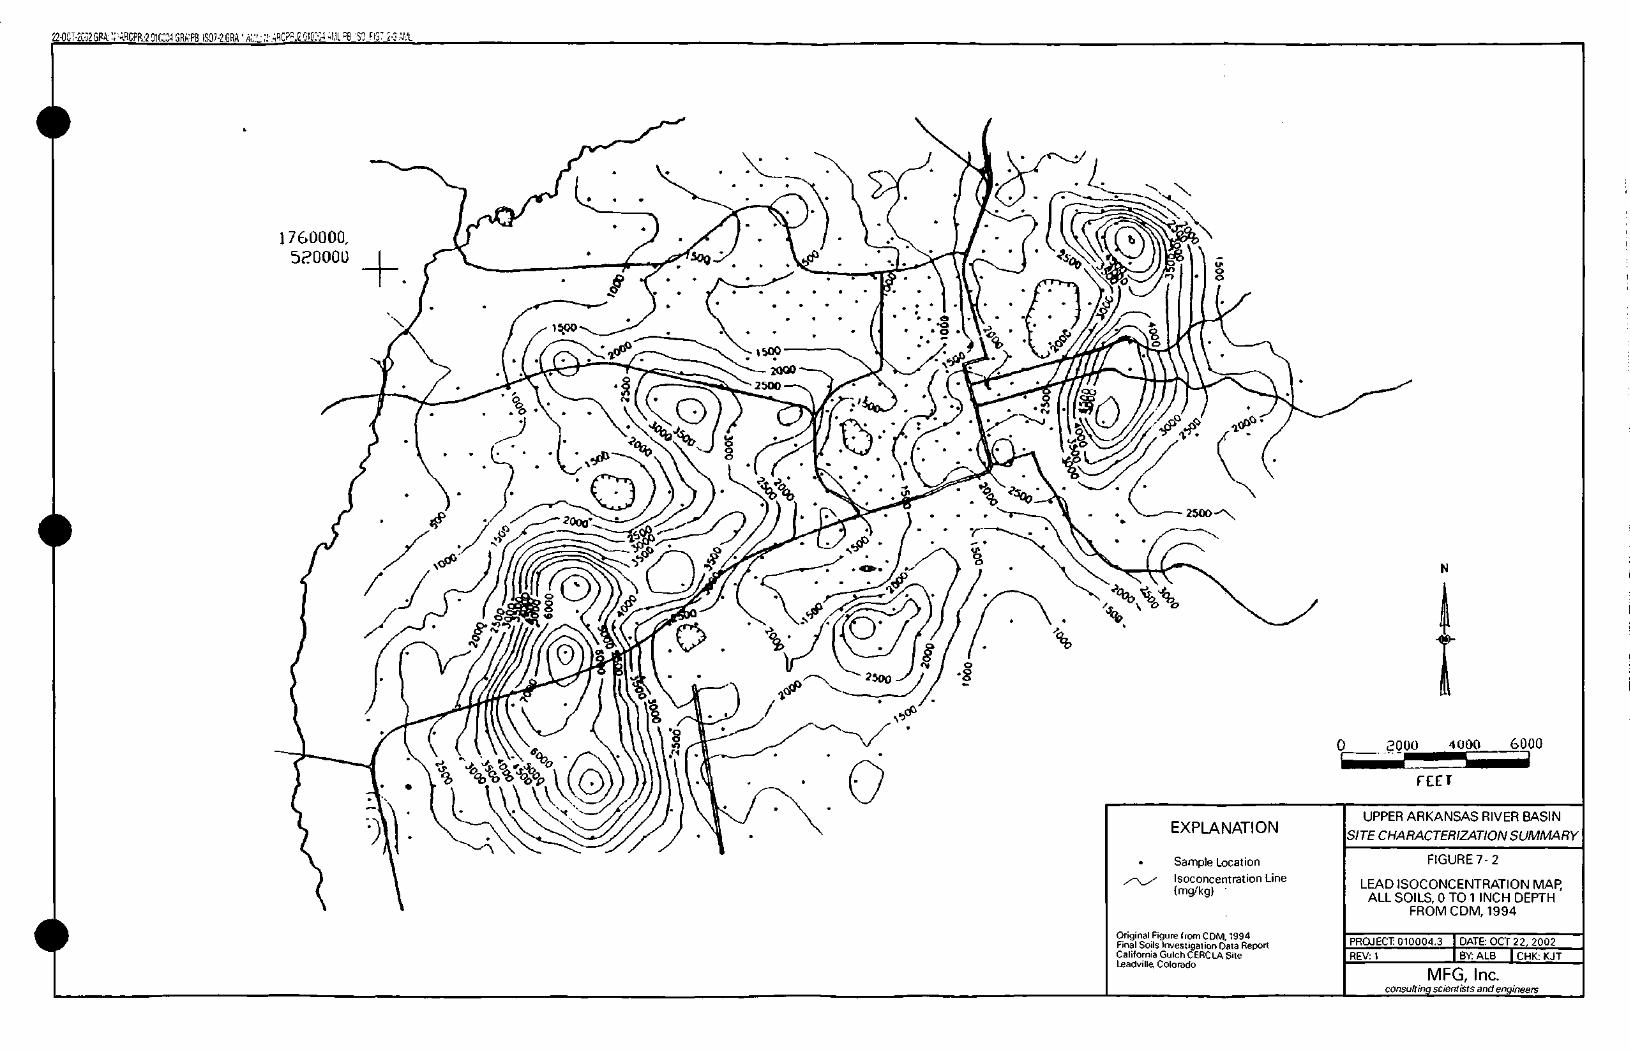
22-OCT-2ii2GPA:';-'H.RCPR.'2 91O GRA'FB IS07-2.GRA ' AM: 'SO FI37 2-3 AMi
1760000,
EXPLANATION
Sample LocationIsoconcentration Line(mg/kg) '
Original Figure from COM, 1994Final Soils Investigation Data ReportCalifornia Gulch CERCLA SiteLeadville, Colorado
000 4000 6000
FEET
UPPER ARKANSAS RIVER BASIN
SITE CHARACTERIZATION SUMMARY
FIGURE 7-2
LEAD ISOCONCENTRATION MAP,ALL SOILS, 0 TO 1 INCH DEPTH
FROM COM, 1994
PROJECT 010004.3 DATE: OCT 22, 2QQ2REV:1 BY: ALB | CHK: KJT
MFG, Inc.consulting scientists and engineers
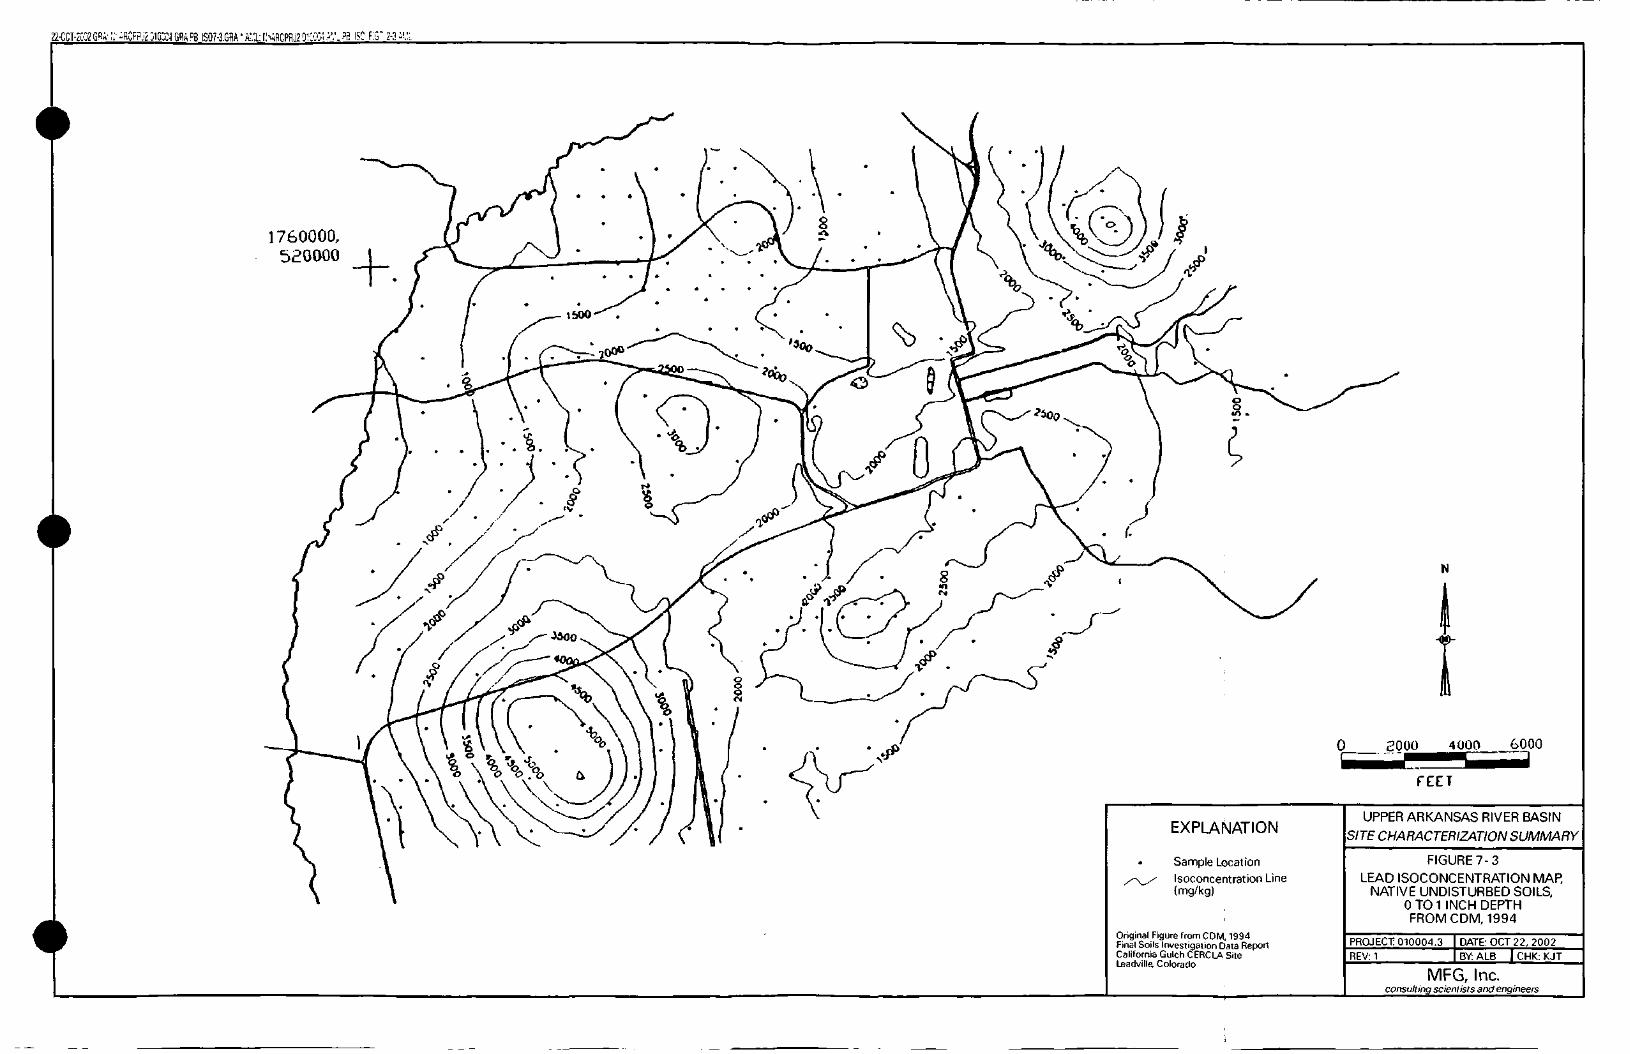
IS07-3.GRA'A'l:C->ARCPRJ2 OICi&A'.'.i'B I S C _ F : G ' 2 - 3 -
1760000,520000
EXPLANATION
Sample Location
Isoconcentration Line(mg/kg)
Original Figure from COM, 1994Final Soils Investigation Data ReportCalifornia Gulch CERCLA SiteLeadville, Colorado
o 2000 4000 6000
TEET
UPPER ARKANSAS RIVER BASIN
SITE CHARACTERIZATION SUMMARY
FIGURE 7-3LEAD ISOCONCENTRATION MAP,
NATIVE UNDISTURBED SOILS,0 TO 1 INCH DEPTHFROM COM, 1994
PROJECT 010004.3 DATE: OCT 22, 2002
REV:1 BY: ALB ] CHK: KJT
MFG, Inc.consulting scientists and engineers
Color Map(s)
The following pagescontain color that does
not appear in thescanned images.
To view the actual images, pleasecontact the Superfund Records
Center at (303) 312-6473.
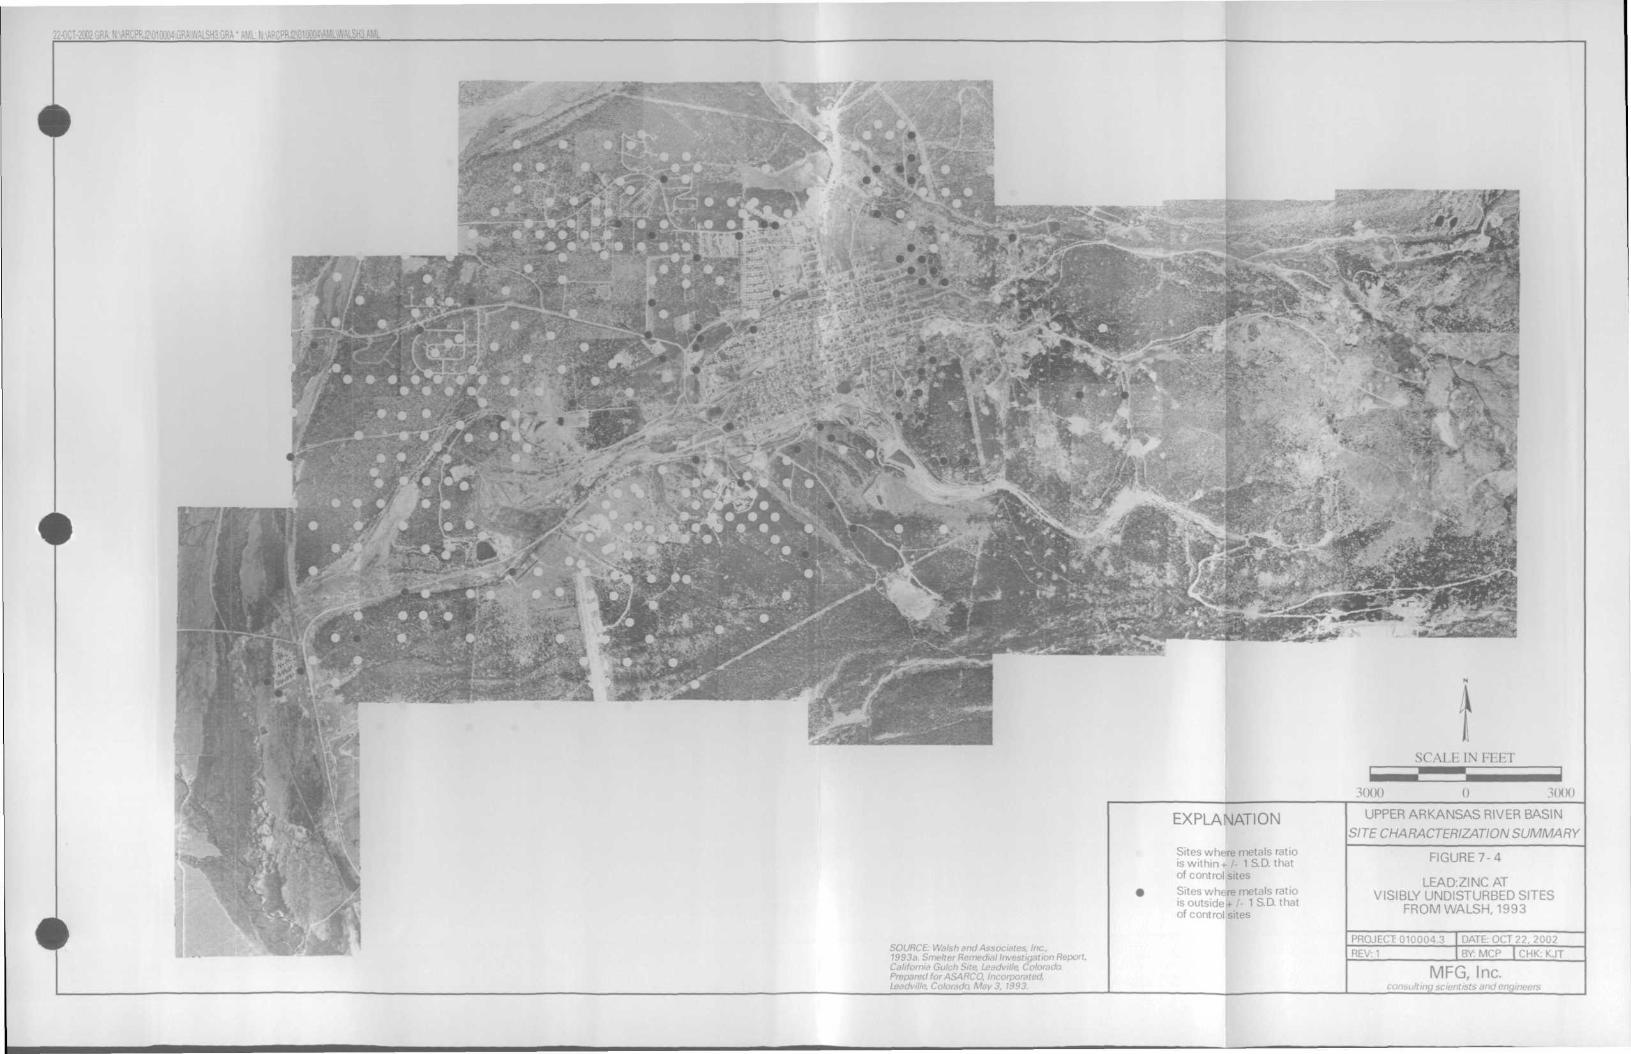
22-OCT-2002 GL _
•'
SCALE IN FEET
UPPER ARKANSAS RIVER BASIN
SITE CHARACTERIZATION SUMMARYEXPLANATION
SOURCE: Walsh and Associates, Inc.,1993a. Smelter Remedial Investigation Report.California Gulch Site, Leadville, Colo1
Prepared for ASARCO, Incorporated,Leadville, Colorado. May 3, 1993.
Sites where metals ratiois within-t-/- 1 S.D. thatof control sitesSites where metals ratiois outside If /- 1 S.D. thatof control sites
FIGURE 7-4
LEAD:ZINC ATVISIBLY UNDISTURBED SITES
FROM WALSH, 1993
PROJECT 010004.3 DATE: OCT22, 2002
REV: 1 BY: MCP | CHK: KJT
MFG, Inc.tltingscienti :neers
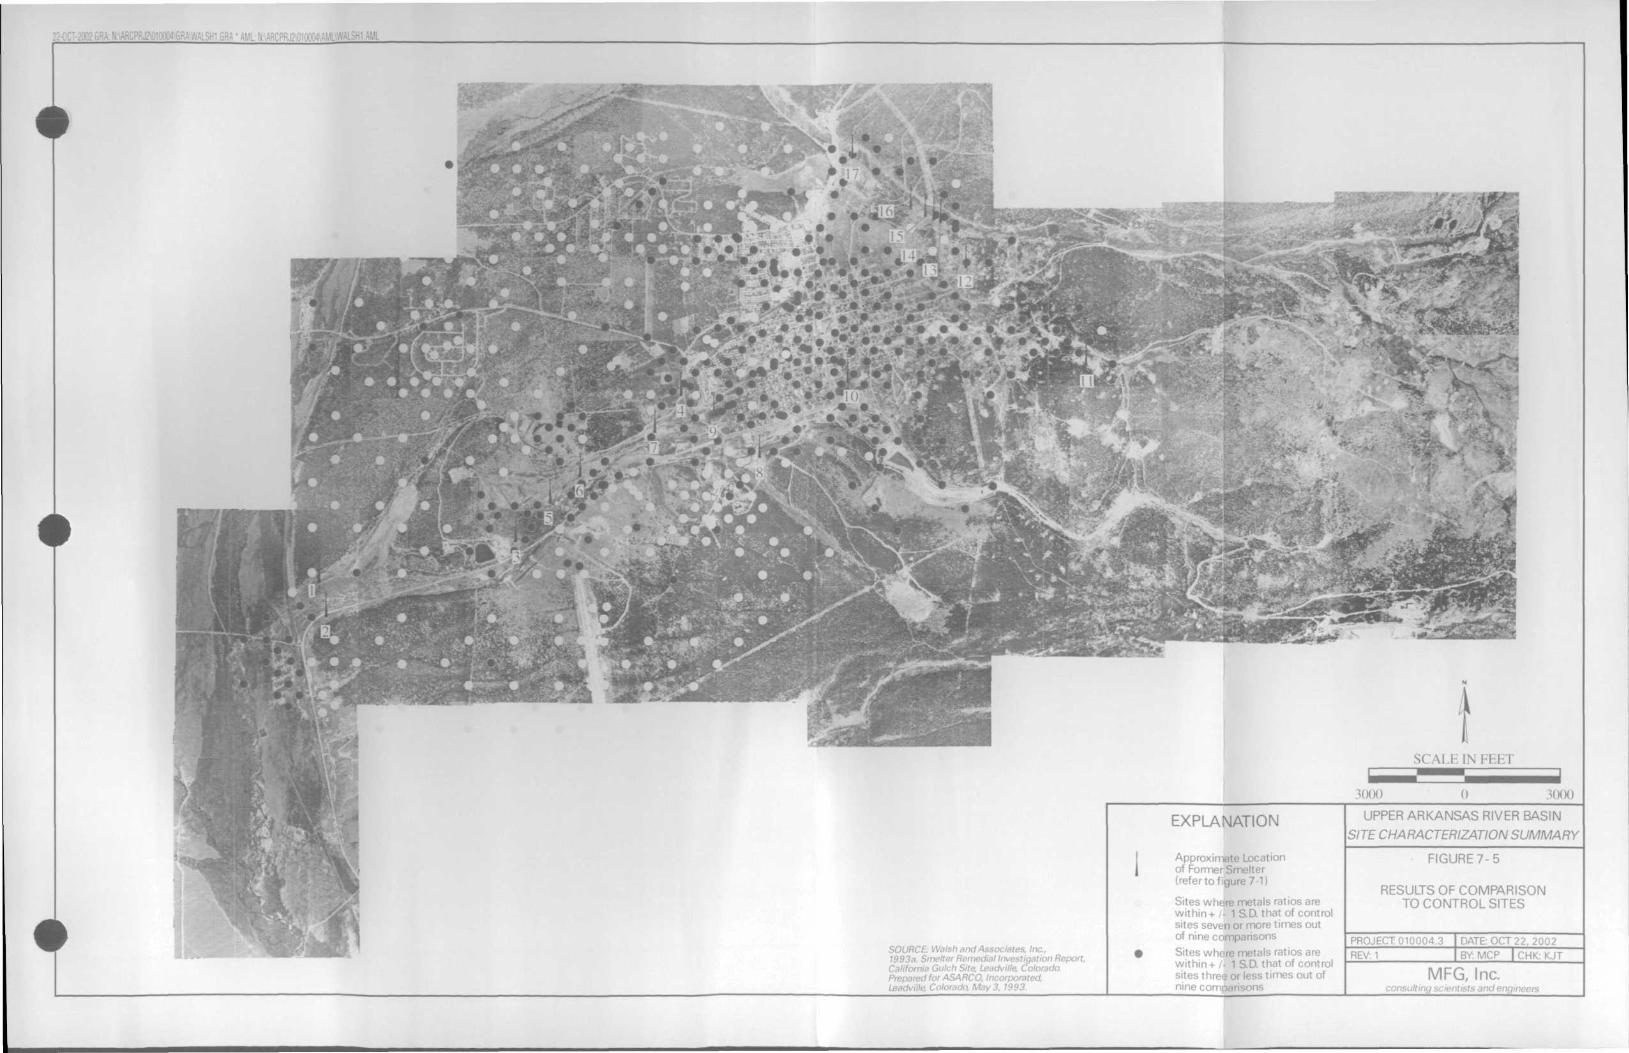
22-OCT-2002G[ ___^__ -"
4
3000
SOURCE: Walsh and Associates, Inc.,1993a. Smelter Remedial Investigation Report,California Gulch Site, Leadville, Colorado.
it for ASARCO, Incorporated,May 3, 1993.
EXPLANATION
Approximate Locationof Former Smelter(refer to figure 7-1)
Sites where metals ratios arewithin + - 1 S.D. that of controlsites seven or more times outof nine comparisonsSites where metals ratios arewithin + /- 1 S.D. that of controlsites three or less times out ofnine comparisons
UPPER ARKANSAS RIVER BASIN
SITE CHARACTERIZATION SUMMARY
FIGURE 7-5
RESULTS OF COMPARISONTO CONTROL SITES
PROJECT 010004.3 DATE: OCT 22, 2002
REV:1 BY: MCP | CHK: KJT
MFC, Inc.consi.

22-OCT-2002GRA:N:\ARCF!
3000
SOURCE: Walsh and Associate*1993a, Smelter Remedial Investigation Report,California Gulch Site, Leadville, ColoradoPrepared for ASARCO, incorporated,Leadville, Colorado, May 3. 1993.
Areal extent of sites wheremetals ratios are within+ /- 1 S.D. that of controlsites in seven or more timesout of nine comparisons
Undisturbed sites
UPPER ARKANSAS RIVER BASIN
SITE CHARACTERIZATION SUMMARY
FIGURE 7-6
EXTENT OF SITESIMPACTED BY
SMELTER EMISSIONS ONLY
PROJECT 010004.3 DATE: OCT 22. 2002REV: 1 BY: MCP |CHK:KJT
MFC, Inc.consulting scienti'-:
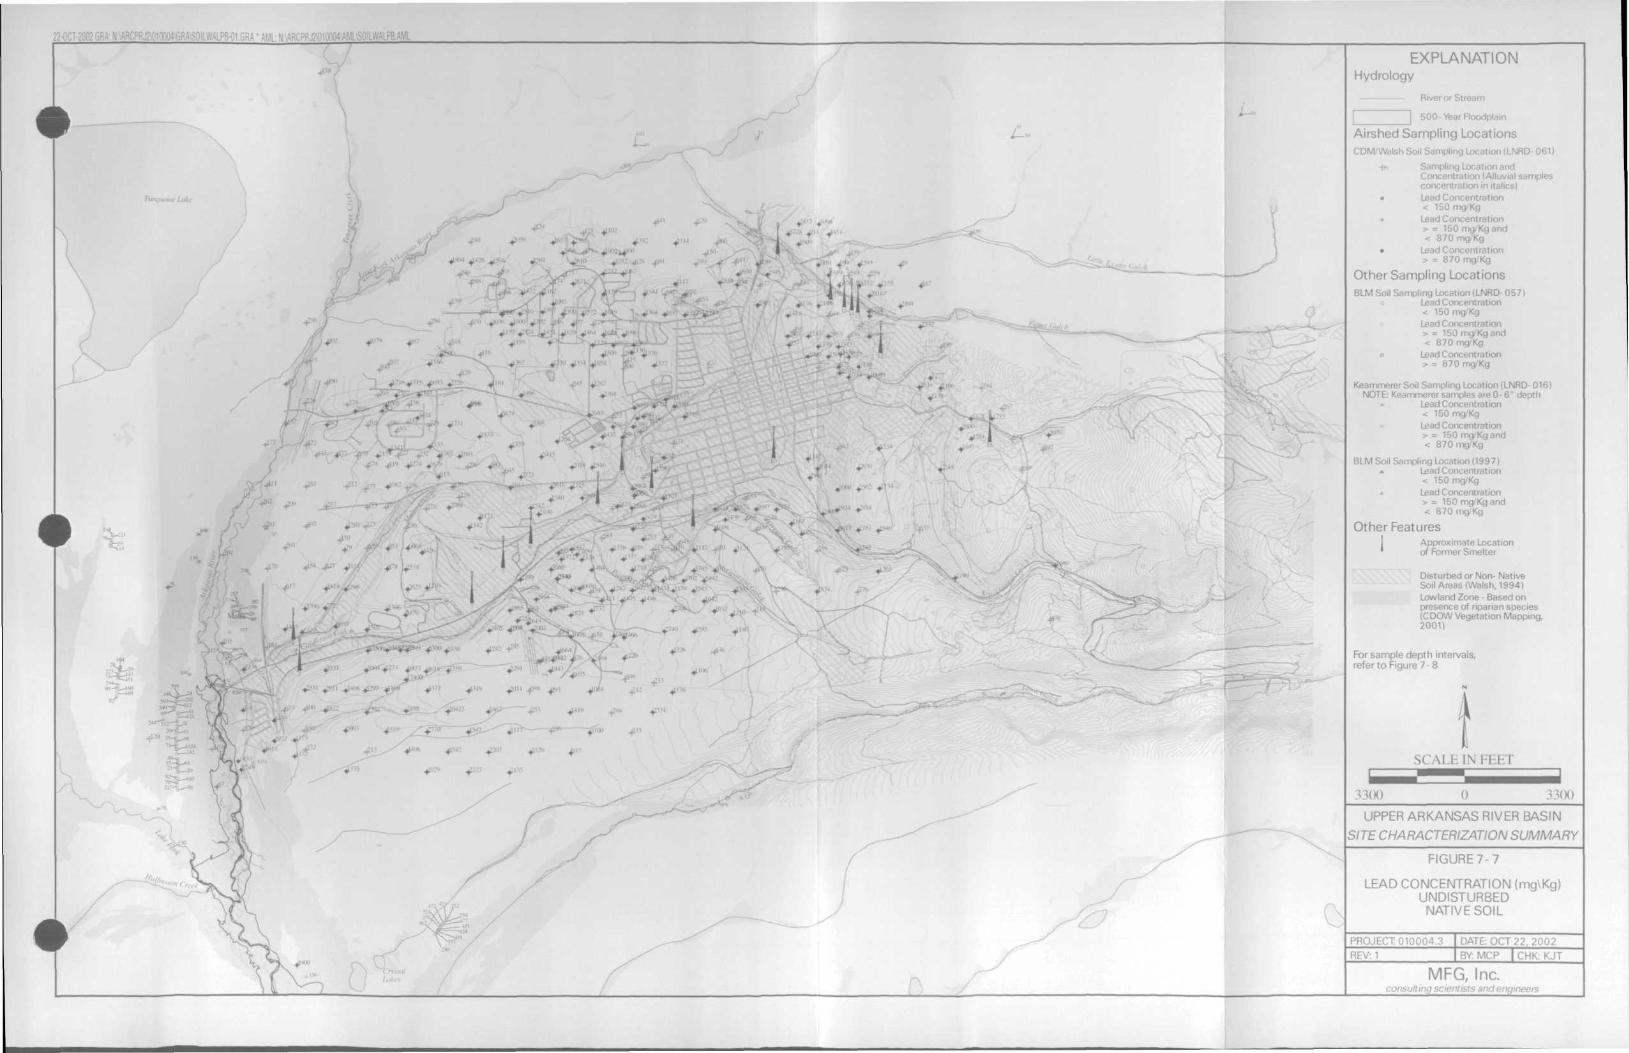
4» •
.
- •j . . .
* » »
.
.. . . . .
•... • . .
•.
. . ... v *• • knra •. . . in .
• * » » * * •• *v rr * *
.-
; - .• ». . i0 . . ..i.- p
^ .
•. .. .. » » . .. ,
.
» • . . ' . . •. j.--*- -f •• *. .. . . . . . » .•. . . • . . V"1 •'" . .
^ -
. ^ .
. » »
EXPLANATIONHydrology
River or Stream
500-Year Floodplain
Airshed Sampling LocationsCOM-Walsh Soil Sampling Location (LNRD- 061)
Sampling Location andConcentration (Alluvial samplesconcentration in italics)
• Lead Concentration< 150 mg/KgLead Concentration> = 150 mg/Kg and< 870 mg/Kg
• Lead Concentration> = 870 mg/Kg
Other Sampling LocationsBLM Soil Sampling Location (LNRD- 057)
Lead Concentration< 150 mg/KgLead Concentration> = 150 mg/Kg and< 870 mg/Kg
o Lead Concentration> = 870 mg/Kg
Keammerer Soil Sampling Location (LNRD- 016)NOTE: Keammerer samples are 0-6" depth
Lead Concentration< 150 mg/KgLead Concentration> = 150 mg/Kg and< 870 mg/Kg
BLM Soil Sampling Location (1997)» Lead Concentration
< 150 mg/KgLead Concentration> = 150 mg/Kg and< 870 mg/Kg
Other FeaturesApproximate Locationof Former Smelter
Disturbed or Non- NativeSoil Areas (Walsh, 1994)Lowland Zone - Based onpresence of riparian species(CDOW Vegetation Mapping,2001)
For sample depth intervals,refer to Figure?- 8
SCALE IN I-FHT
UPPER ARKANSAS RIVER BASINSITE CHARACTERIZATION SUMMARY
FIGURE7-7
LEAD CONCENTRATION (mg\Kg)UNDISTURBED
NATIVE SOIL
PROJECT 010004.3 DATE: OCT 22, 2002
REV: 1 BY: MCP I CHK: KJT
MFC, Inc.ting scientists an
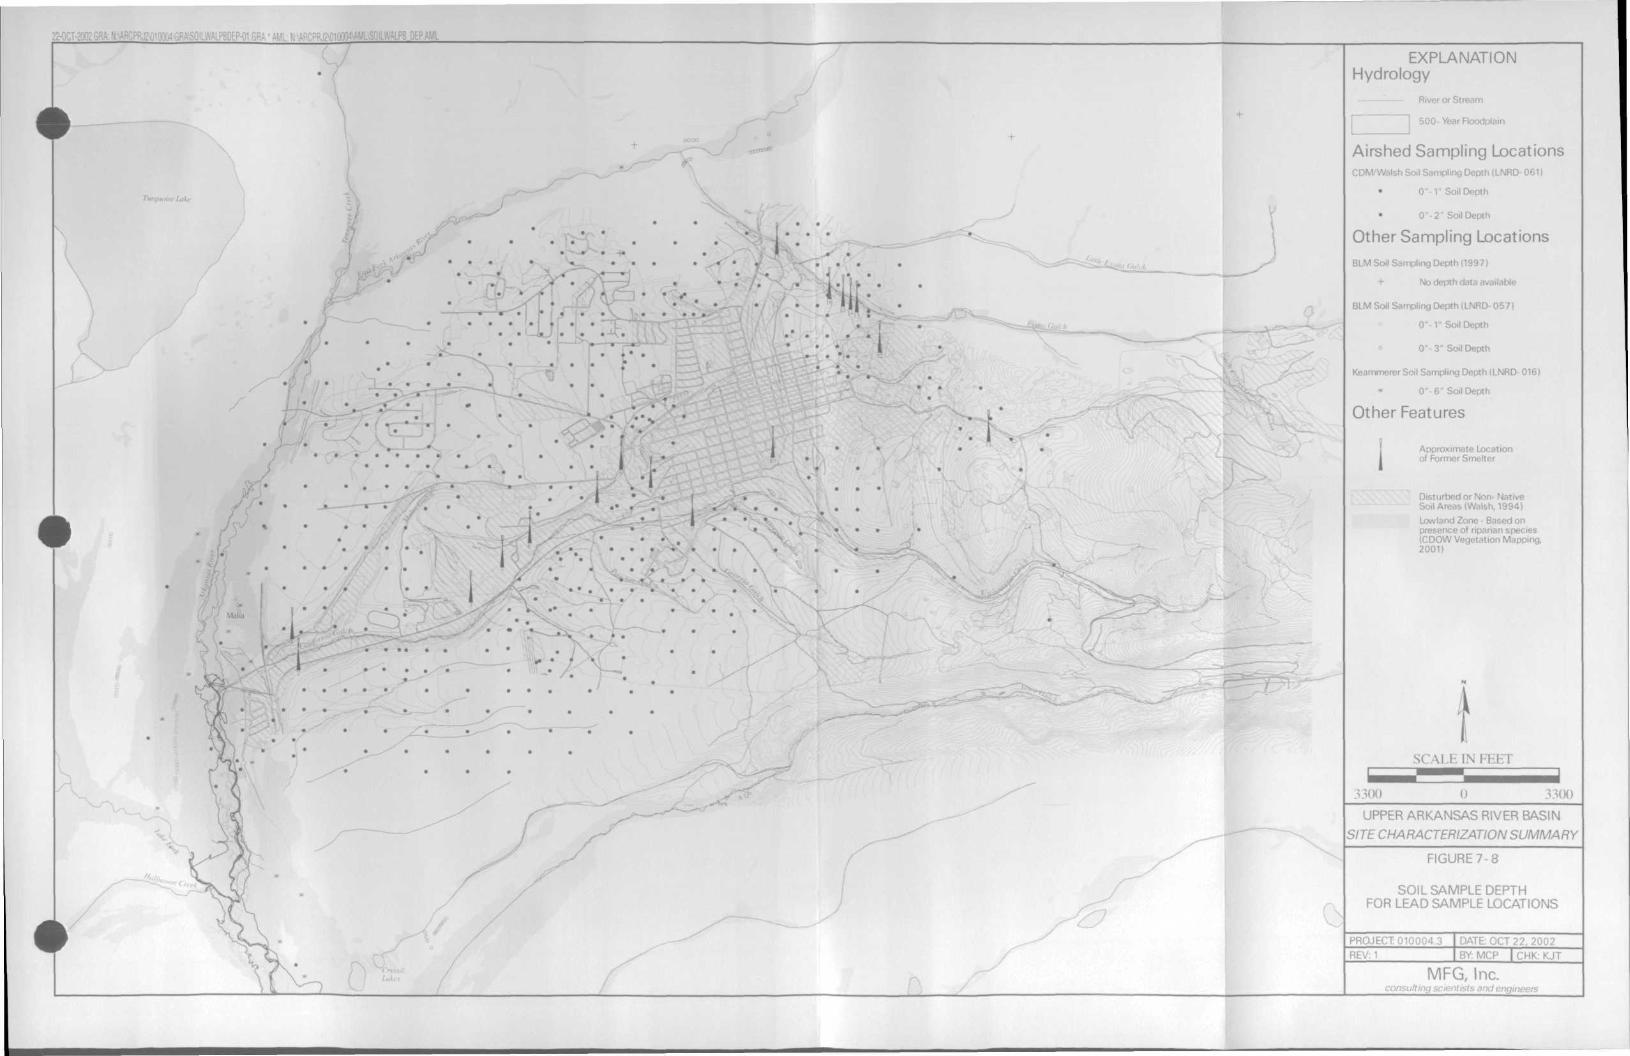
22-OCT-2002GR.- . .,VALPBDEP-01.G: '.'L'.SOILWALPB DEP.AML
• • • I . . .• • • • • .
• • • ^* • • •
• .• i '
• i • • • •. . .
.
EXPLANATIONHydrology
River or Stream
500- Year Floodplain
Airshed Sampling LocationsCDM/Walsh Soil Sampling Depth (LNRD- 061)
• 0" -1" Soil Depth
• 0 " - 2 " Soil Depth
Other Sampling LocationsBLM Soil Sampling Depth (1997)
+ No depth data av,
BLM Soil Sampling Depth (LNRD- 057)
0" - V Soil Depth
0"-3" Soil Depth
Keammerer Soil Sampling Depth (LNRD- 016)
0"-6" Soil Depth
Other Features
Approximate Locationof Former Smelter
Disturbed or Non- NativeSoil Areas (Walsh, 1994)
Lowland Zone - Based onpresence of riparian species(CDOW Vegetation Mapping,2001)
3300
SCALE IN FEET
33 (X)
UPPER ARKANSAS RIVER BASIN
SITE CHARACTERIZATION SUMMARY
FIGURE 7-8
SOIL SAMPLE DEPTHFOR LEAD SAMPLE LOCATIONS
PROJECT 010004.3 DATE: OCT 22, 2002
REV: 1 BY: MCP ICHK: KJT
MFC, Inc.consulting scienli- -meers
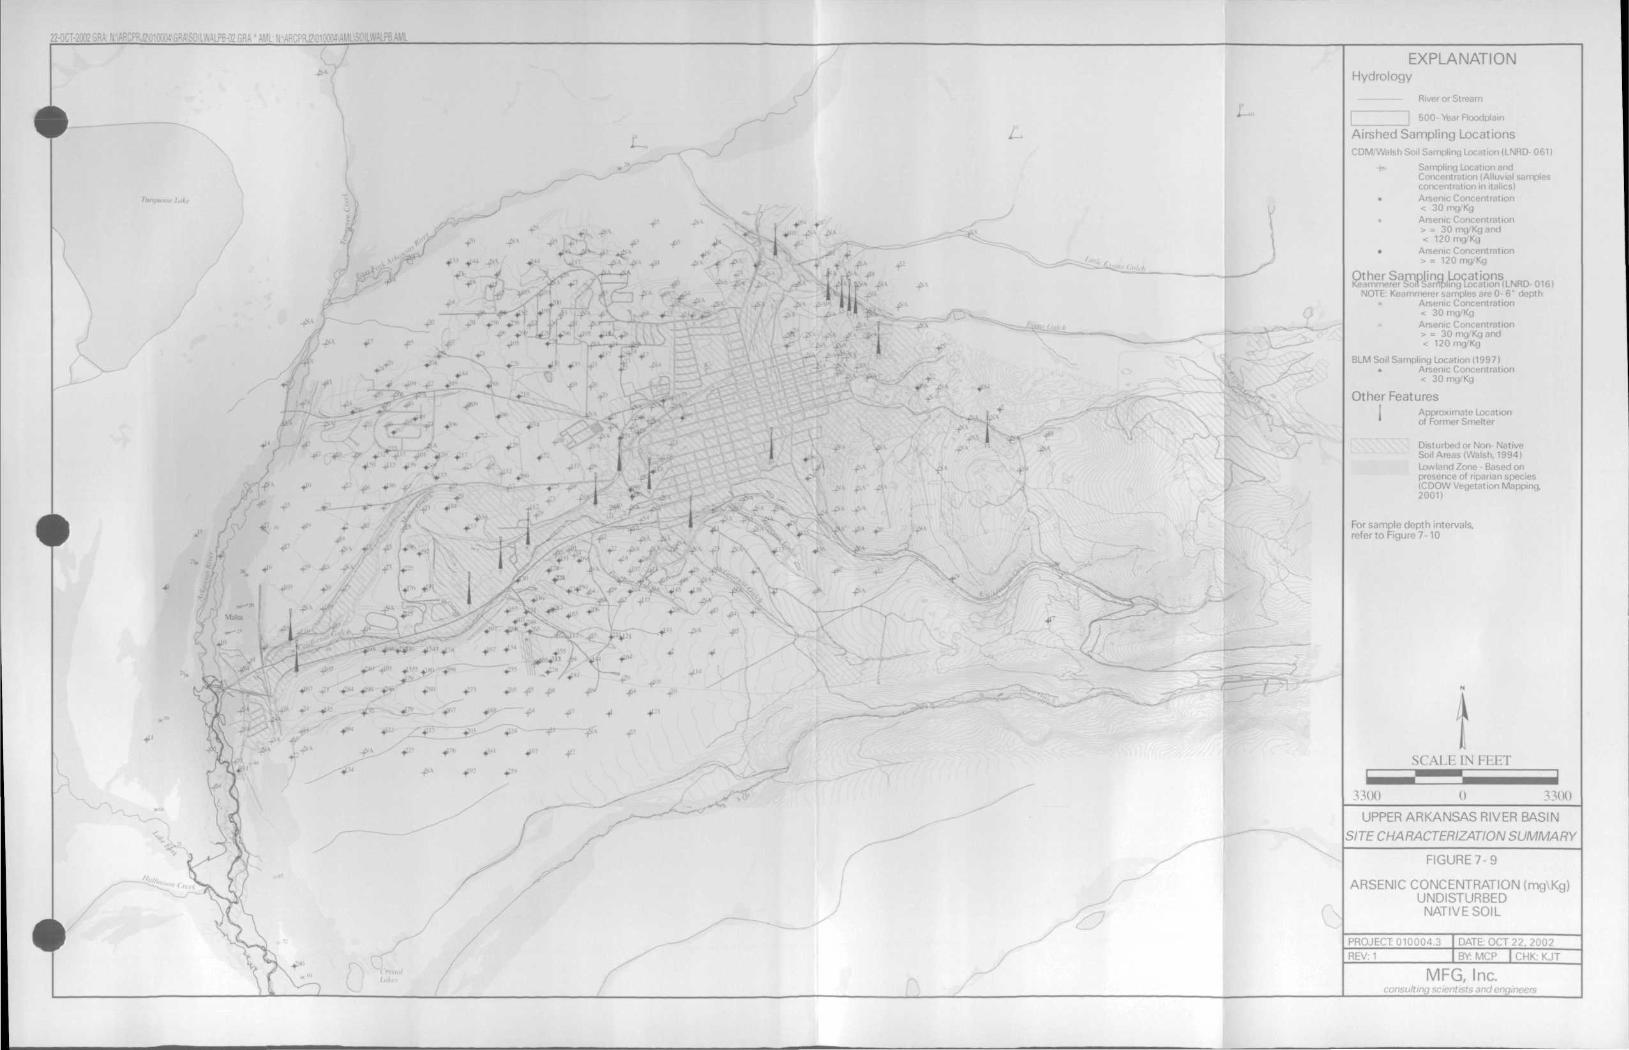
-
. .
,. ..
» » » » .
EXPLANATIONHydrology
River or Stream
500-Year Floodplain
Airshed Sampling LocationsCDIWWalsh Soil Sampling Location (LNRD- 061)
Sampling Location andConcentration (Alluvial samplesconcentration in italics)
• Arsenic Concentration< 30 mg/Kg
• Arsenic Concentration> = 30 mg/Kg and< 120 mg/Kg
• Arsenic Concentration> = 120 in
Other Sampling LocationsKeammerer Soil Sarflphng Location (LNRD- 016)
NOTE: Keammerer samples are 0- 6" depthArsenic Concentration< 30 mg'KciArsenic Concentration> = 30 mg/Kg and< 120 mg/Kg
BLM Soil Sampling Location (1997)« Arsenic Concentration
< 30 mg/Kg
Other FeaturesApproximate Locationof Former Smelter
Disturbed or Non- NativeSoil Areas (Walsh, 1994)Lowland Zone - Based onpresence of riparian species(CDOW Vegetation Mapping,2001)
For sample depth intervals,refer to Figure 7-10
3300
SCALE IN H.HT
0 3300
UPPER ARKANSAS RIVER BASINSITE CHARACTERIZATION SUMMARY
FIGURE 7-9
ARSENIC CONCENTRATION (mg\Kg)UNDISTURBED
NATIVE SOIL
PROJECT 010004.3 DATE: OCT 22, 2002
REV: 1 BY: MCP [ CHK: KJT
MFC, Inc.consulting scientists an :
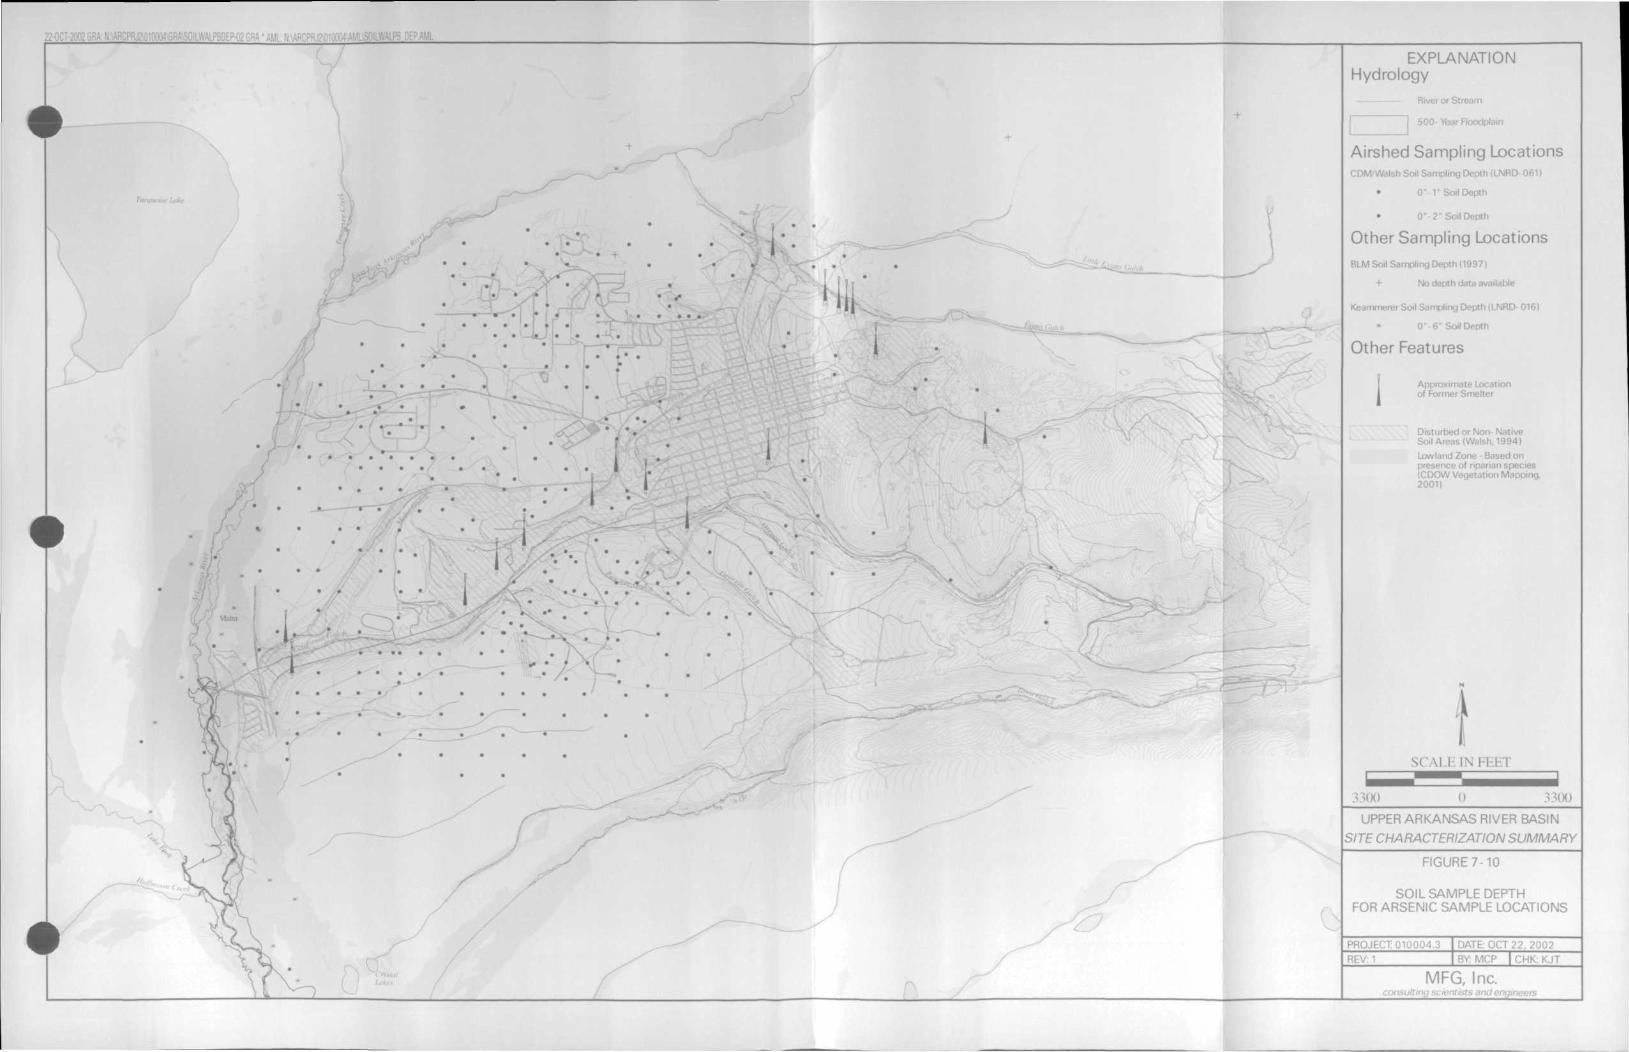
22-OCT-.
4
EXPLANATIONHydrology
River or Stream
500- Year Floodplain
Airshed Sampling LocationsCOM;Walsh Soil Sampling Depth (LNRD- 01
• Soil Depth
• 0 " - 2 " Soil Depth
Other Sampling LocationsBLM Soil Sampling Depth (19971
No depth data available
Keammerer Soil Sampling Depth (LNRD- 016)
0 " -6 " Soil Depth
Other Features
Approximate Locationof Former Smelter
Disturbed or Non- NSoil Areas (Walsh, 1994)
Lowland Zone - Based onpresence of riparian species(CDOW Vegetation Mapping,2001)
SCALE IN FEET
0 3300
UPPER ARKANSAS RIVER BASIN
SITE CHARACTERIZATION SUMMARY
FIGURE 7-10
SOIL SAMPLE DEPTHFOR ARSENIC SAMPLE LOCATIONS
PROJECT 010004.3 DATE: OCT 22, 2002
REV:1 BY: MCP |CHK:KJT
MFC, Inc.consult/up MH'ntixts amii'ngineers
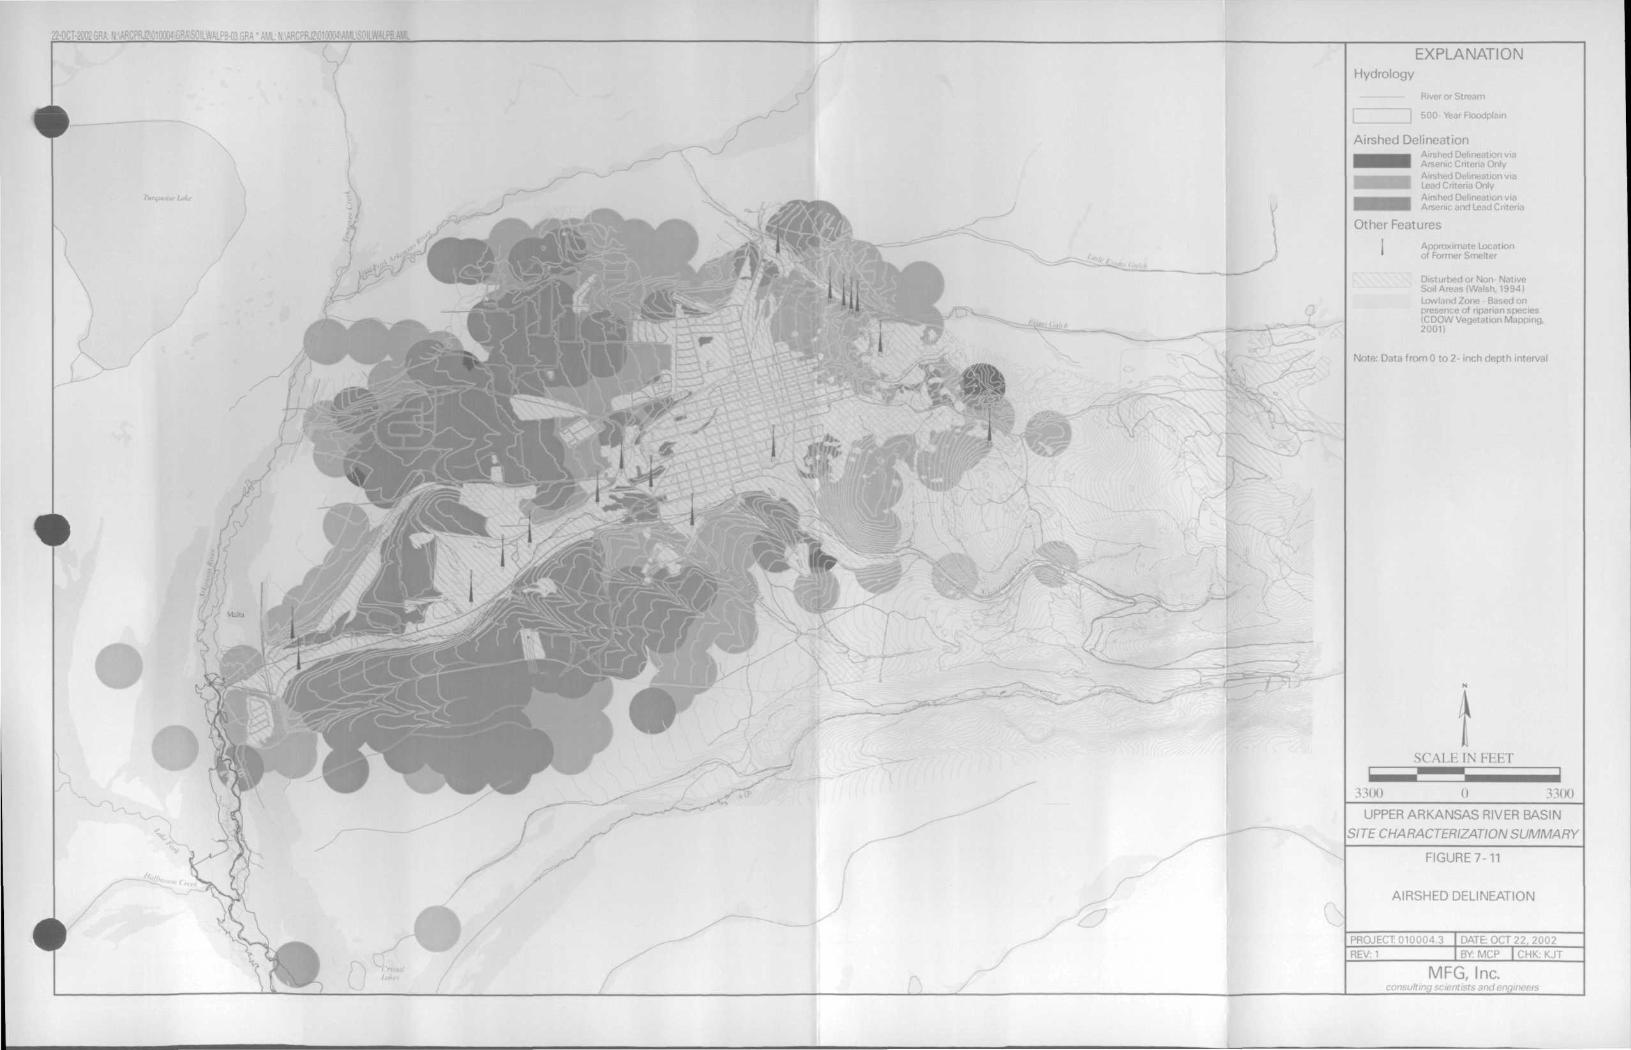
22-OC' •
Hydrology
EXPLANATION
River or Str-
500- Year Floodplain
Airshed DelineationAirshed Delineation viaArsenic Criteria OnlyAirshed Delineation viaLead Criteria OnlyAirshed Delineation viaArsenic and Lead Criteria
Other Features
Approximate Locationnier Smelter
Disturbed or Non- NativeSoil Areas (Walsh, 1994)Lowland Zone - Based onpresence of riparian species(CDOW Vegetation Mapping,2001)
Note: Data from 0 to 2- inch depth interval
3300
SCALE IN FEET
0
UPPER ARKANSAS RIVER BASIN
SITE CHARACTERIZATION SUMMARY
FIGURE7-11
AIRSHED DELINEATION
PROJECT 010004.3 DATE: OCT 22, 2002
REV: 1 BY: MCP | CHK: KJT
MFC, Inc.consulting scientists andenti
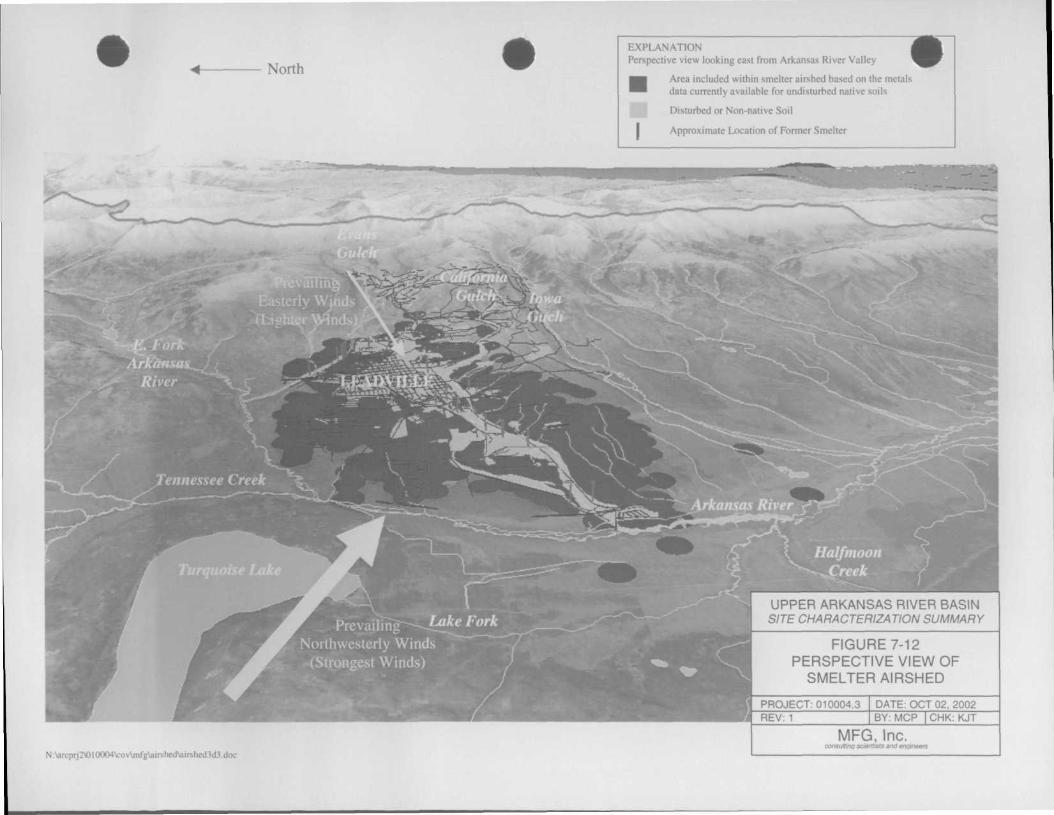
North
EXPLANATIONPerspective view looking east from Arkansas River Valley
•Area included within smelter airshed based on the metalsdata currently available for undisturbed native soils
Disturbed or Non-native Soil
Approximate Location of Former Smelter
UPPER ARKANSAS RIVER BASINSITE CHARACTERIZATION SUMMARY
FIGURE 7-12PERSPECTIVE VIEW OF
SMELTER AIRSHED
REV: 1ROJECT: 010004.3 DATE: OCT 02, 2002
BY: MCP CHK: KJT
N:\arcprj2\010004\cov\mfgViirshedViirshcd3d3.doc
MFG, Inc.consulting scientists and engineers
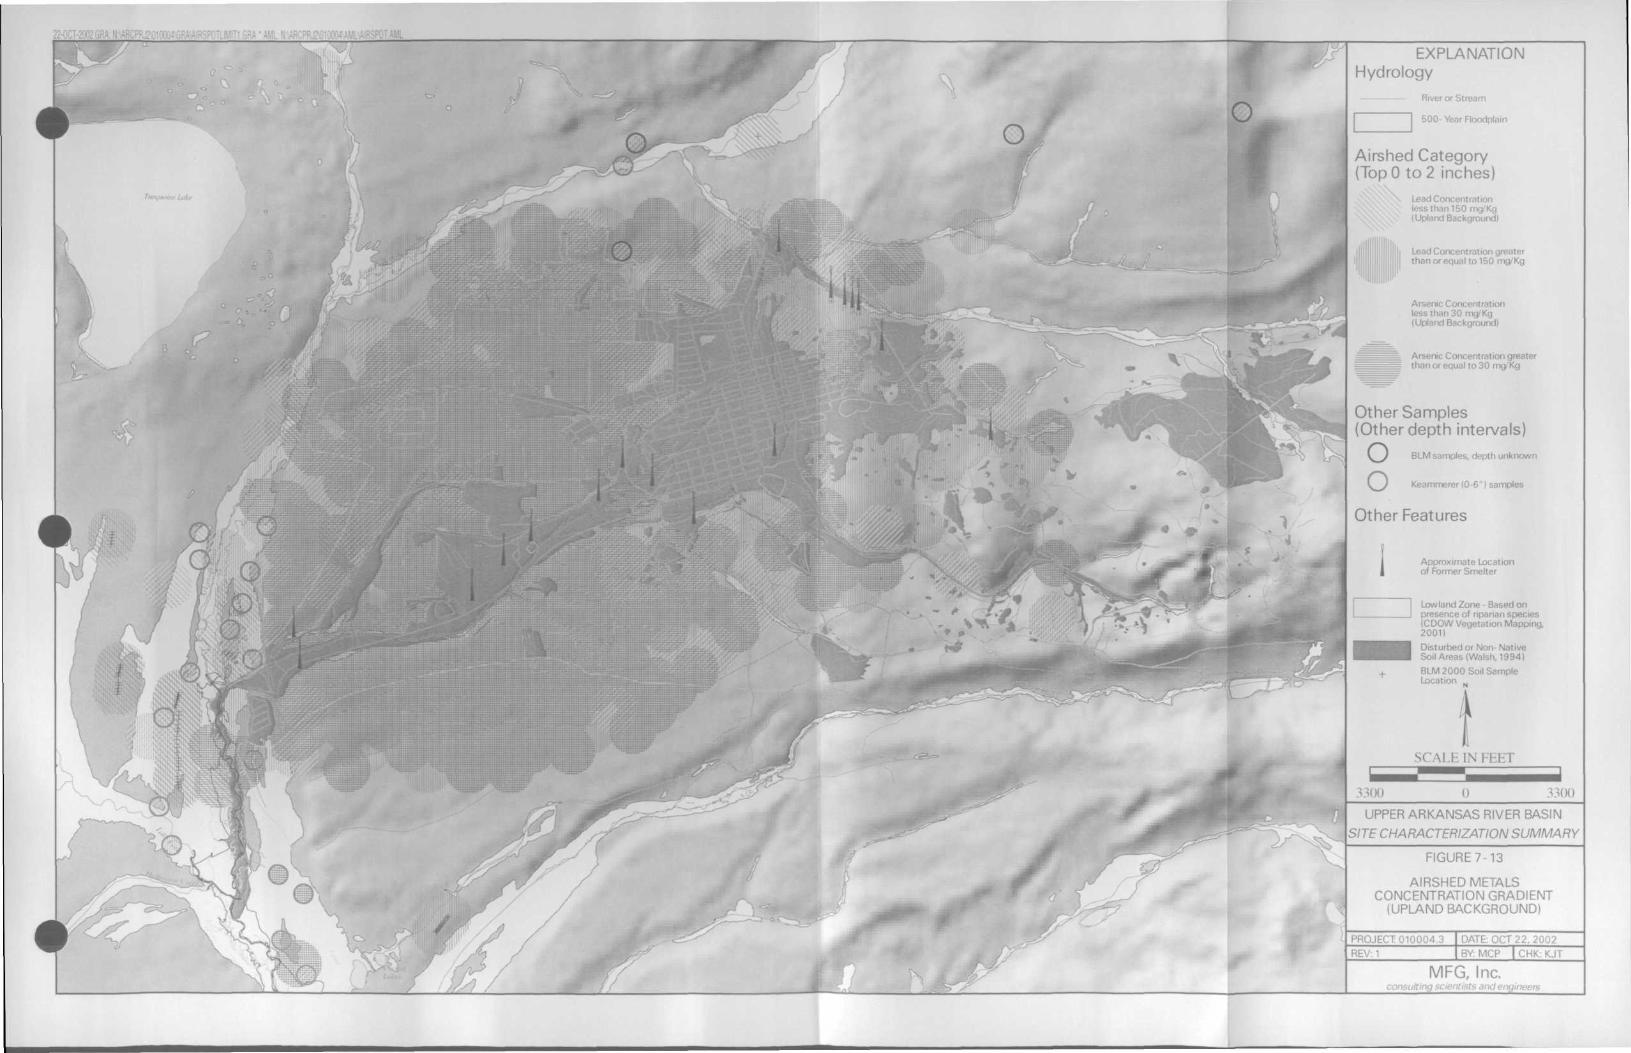
22-OCT-2Q02GP
f o
i
o o
&
EXPLANATIONHydrology
River or Stream
500-Year Floodplain
Airshed Category(TopO to 2 inches)
Lead Concentless than 150 mg/Kg
! Background)
Lead Concentration greaterthan or equal to 150 mg/Kg
Arsenic Concentrationless than 30 mg/Kg(Upland Background)
Arsenic Concentration greaterthan or equal to 30 mg/Kg
Other Samples(Other depth intervals)
BLM samples, depth unknown
Keammerer (0-6" I samples
Other Features
Approximate Locationof Former Smelter
Lowland Zone - Based onpresence of riparian species(CDOW Vegetation Mapping,2001}
Disturbed or Non- NativeSoil Areas (Walsh, 1994)
BLM 2000 Soil SampleLocation „
3300
SCALE IN FLHT
UPPER ARKANSAS RIVER BASIN
SITE CHARACTERIZATION SUMMARY
FIGURE7-13
AIRSHED METALSCONCENTRATION GRADIENT
(UPLAND BACKGROUND)
PROJECT 010004.3 DATE: OCT 22, 2002REV:1 BY: MCP I CHK: KJT
MFC, Inc.consulting scientists arn,
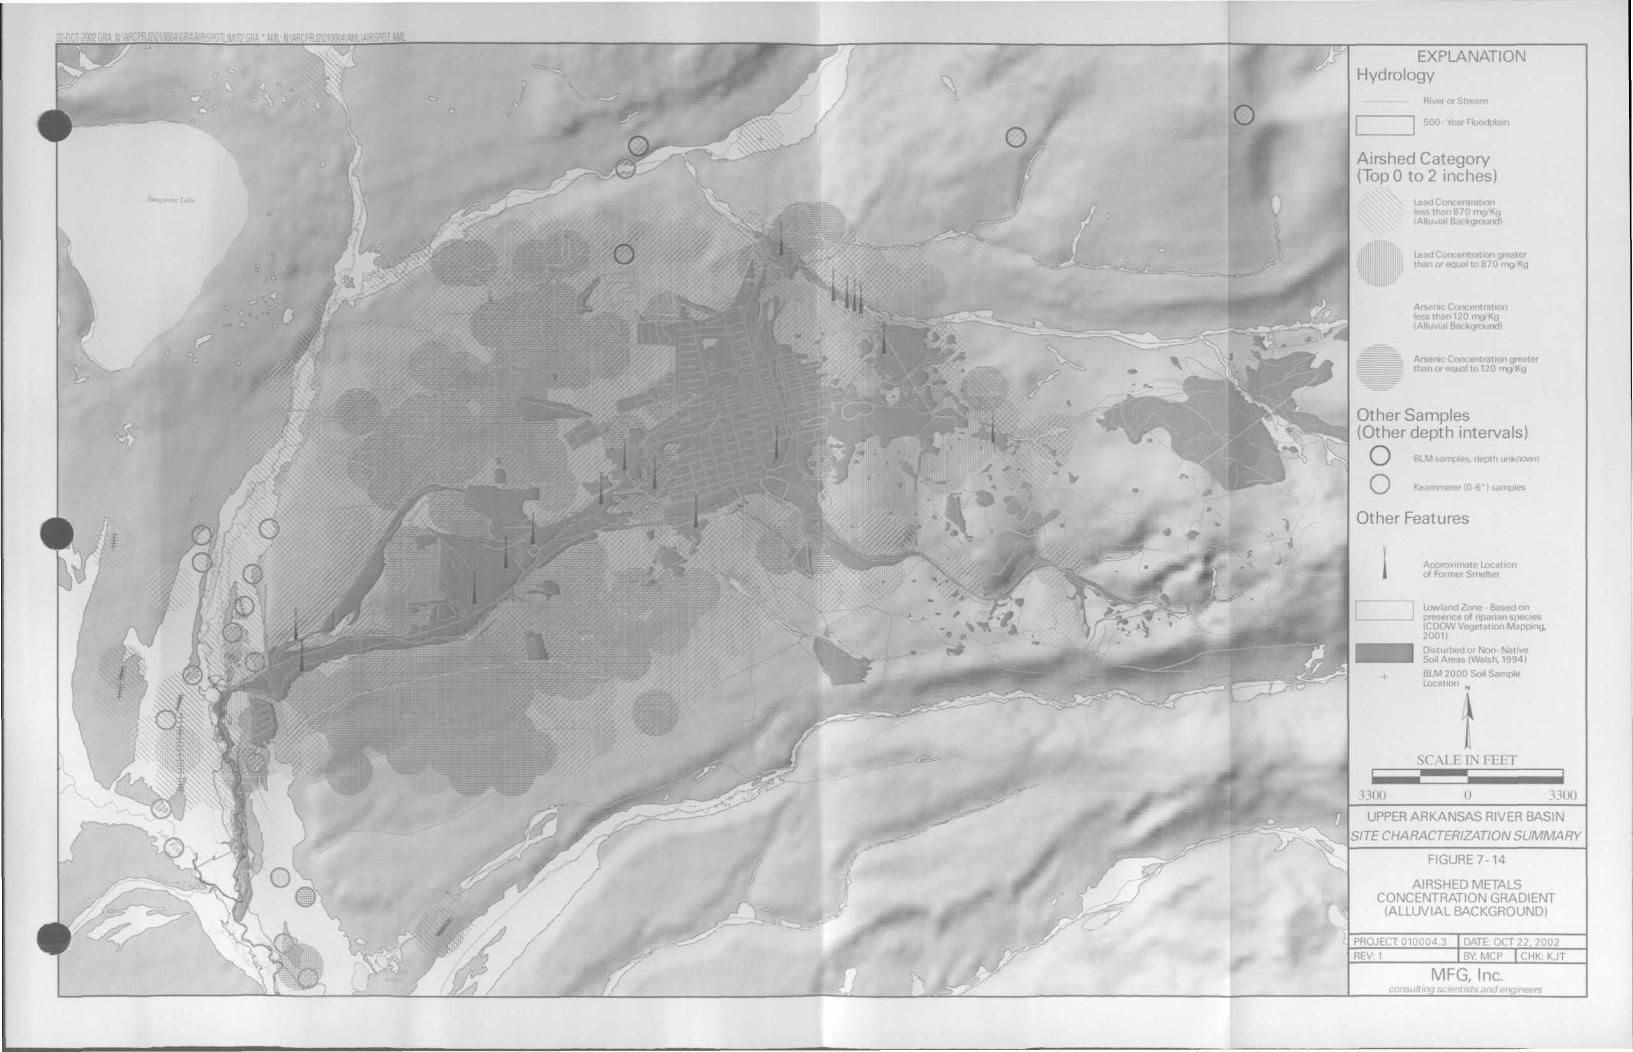
o o
otit
EXPLANATIONHydrology
River or Stream
500-Year Floodplain
Airshed Category(TopO to 2 inches)
Lead Concentrationless than 870 mg/Kg(Alluvial Background)
Lead Concentration greaterthan or equal to 870 mg/Kg
Arsenic Concentrationless than 120 mg/Kg(Alluvial Background)
Arsenic Concentration greaterthan or equal to 120 mg/Kg
Other Samples(Other depth intervals)
BLM samples, depth unknown
Keammerer (0-6") samples
Other Features
Approximate Locationof Former Smelter
Lowland Zone - Based onpresence of riparian species(CDOW Vegetation Mapping,2001)
Disturbed or Non- NativeSoil Areas (Walsh, 1994)
BLM 2000 Soil SampleLocation
SCAl.F. IN U
3300
UPPER ARKANSAS RIVER BASIN
SITE CHARACTERIZATION SUMMARY
FIGURE 7-14
AIRSHED METALSCONCENTRATION GRADIENT
(ALLUVIAL BACKGROUND)
PROJECT 010004.3 DATE: OCT 22, 2002
REV: 1 BY: MCP | CHK: KJT
MFC, Inc.consulting sclent i , neers
8.0 REFERENCES/LITERATURE CITED
Alldredge, A.W., J.F. Lipscomb, and F.W. Wicker. 1974. Forage Intake Rates of Mule Deer Estimatedwith Fallout Cesium-137. J. Wildl. Manage. 38:508-816.
Amdur, M.O., J. Doull, and C.D. Klassen. 1991. Casarett and Doull's Toxicology: The Basic Science ofPoisons. 4th Edition. Pergamon Press. New York, NY.
Aquatic Associates. 1993. Aquatic Sampling Program Results, California Gulch Site, Leadville,Colorado, 1991.
Archuleta, A.S., L.C. Coppock, and C. Ronish. 2000. American Dippers as Indicators of Water Quality.Draft Report, Environmental Contaminants Program, Colorado Field Office, U.S. Fish andWildlife Service.
Bechtel Environmental, Inc (Bechtel). 1992. Remedial Investigation Draft Report for the Ruston/NorthTacoma RI/FS, Volume 1 and 2. Prepared for U.S. Environmental Protection Agency, Region10, San Francisco, CA, November 1992.
Beyer, W.N., E.E. Connor, and S. Gerould. 1994. Estimates of Soil Ingestion by Wildlife. J. Wildl.Manage. 58:375-382.
Beyer, W.N. and G. Storm. 1995. Ecotoxicological Damage from Zinc Smelting at Palmerton,Pennsylvania. In: Handbook of Ecotoxicology. Hoffman, D.J., B.A. Rartner, G.A. Burton, Jr.,and J. Cairns, Jr. (eds.). pp. 596-607. Lewis Publishers.
Beyer, W., G Heinz, and A. Redmond-Norwood (Eds.). 1996. Environmental Contaminants in Wildlife,Interpreting Tissue Concentrations. Society of Environmental Toxicology and Chemistry SpecialPublication Series. CRC Press Inc. Boca Raton, Florida.
Binns, N.A. and F.M. Eiserman. 1979. Quantification of Fluvial Trout Habitat in Wyoming.Transactions of the American Fisheries Society.
Black and Veatch. 1988. Final Field Investigation Report Ruston/Vashon Island Area. State ofWashington Department of Ecology, Olympia, WA, September 1988.
Blinn, D.W., J.P. Shannon, L.W. Stevens, and J.P. Carder. 1995. Consequences of Fluctuating Dischargefor Lotic Communities. Journal of the North American Benthological Society 14(2): 233-248.
Callendar, E., W.H. Ficklin, B.A. Kimball, and P.R. Edelmann. 1988. Heavy-Metal Geochemistry ofSediments in the Pueblo Reservoir, Colorado. In: U.S. Geological Survey, Toxic SubstancesHydrology Program- Proceedings of the Technical Meeting, Phoenix, Arizona, September 26-30,1988.
CDM. 1991. Final Work Plan Soils Investigation, California Gulch Study Area, Leadville, Colorado.Prepared for Resurrection Mining Company, September 1991.
CDM. 1994. Final Soils Investigation Data Report, California Gulch CERCLA Site, Leadville,Colorado, July 1994.
CDM; J. Drexler; Roy F. Weston, Inc. and R.J. Lee Group. 1994. Draft Metal Speciation Data Report,Leadville, CO. Prepared for Resurrection Mining Company, USEPA and ASARCO, July 1994.
J:\010004\Task 3 - SCR\SCR_currentl.doc 8-1
Cereghino, R. and P. Lavandier. 1988. Influence of Hypolimnetic Hydrospeaking on the Distribution andPopulation Dynamics of Ephemeroptera in a Mountain Stream. Freshwater Biology 40: 385-399.
Chadwick, J.W. 1999. Information Collected During 1994 Field Season on the Arkansas River and it'sTributaries. Chadwick Ecological Consultants, Inc.
Chadwick Ecological Consultants, Inc. 1998. Aquatic Biological Assessment Data for the UpperArkansas River Basin, near Leadville, Colorado. Appendices A-D. September 1998.
. 1999. 1998 Aquatic Biological Assessment Data for the Upper Arkansas River Basin, nearLeadville, Colorado. September 1999.
Church, D.C. 1988. The Ruminant Animal-Digestive Physiology and Nutrition. Prentice Hall, NewJersey.
Church, S.E. 1993. Geochemical and Lead-Isotope Data from Stream and Lake Sediments, and Coresfrom the Upper Arkansas River Drainage: Effects of Mining at Leadville Colorado on Heavy-Metal Concentrations in the Arkansas River, Colorado, 1990-1993.
Church, S.E., S.A. Wilson, R.B. Vaughn and D.L. Fey. 1994. Geochemical and Lead Isotopic Studies ofRiver and Lake Sediments, Upper Arkansas River Drainage Basin, Twin Lakes to PuebloReservoir, Colorado: U.S. Geological Survey, Administrative Report, 40 p.
Church S.E., D.L. Fey, D.M. Unruh. 2000. Geochemical and Lead-Isotopic Studies of River Sedimentfrom Major Tributaries, Upper Arkansas River Watershed, Colorado. U.S.G.S. Open File Report00-337.
Clark, Melanie L. and Michael E. Lewis. 1997. Metal Speciation in the Upper Arkansas River,Colorado, 1990-1993: U.S. Geological Survey Water Resources Investigation Report 96-4282.
Clements, W.H. 1994. Benthic Invertebrate Community Responses to Heavy Metals in the UpperArkansas River Basin, Colorado. Journal of North American Benthological Society, 1993,13 (1)50-66.
Clements, W. and P. Kiffney. 1994. Integrated Field and Laboratory Approach for Assessing Impacts ofHeavy Metals at the Arkansas River, Colorado. Environmental Toxicology and Chemistry13:397-404.
Clements, W.H. and D.E. Rees. 1997. Effects of Heavy Metals on Prey Abundance, Feeding Habits, andMetal Uptake of Brown Trout hi the Arkansas River, Colorado. Transactions of the AmericanFisheries Society 126: 774-785.
Clements, W.H., D.M. Carlisle, L.A. Courtney, and E.A. Harrahy. 2002. Integrating Observational andExperimental Approaches to Demonstrate Causation hi Stream Biomonitoring Studies. Environ.Toxiocol. Chem. 21:1138-1146.
Colby, W.F. 1988. Heavy Metal Analysis: Baseline Study for Edith Seppi. Colorado Mountain College,Leadville, Colorado.
Colorado Department of Public Health and Environment (CDPHE). 1990. Cleer Creek Phase IIRemedial Investigation-Final. Colorado Department of Health, Hazardous Materials & WasteManagement Division in Cooperation with U.S. Environmental Protection Agency, Prepared by:Camp Dresser & McKee Inc., Denver, Colorado.
J:\010004\Task 3 - SCR\SCR_current 1 .doc 8-2
-. 1999. Results of the Lincoln Park Superfund Site Ecological Risk Assessment in CommunityHealth News for Colorado Newsletter.
-. 2001. 1984-2001 Groundwater Data Provided to MFG, Inc. in Electronic Format on 8/24/2001.(Metals.dbf and Colo_src.dbf).
-. 2002. Classifications and Numeric Standards for Arkansas River Basin. Effective 4/24/02.CDPHE, 86 pp.
Colorado Division of Wildlife (CDOW). 1988. Colorado Division of Wildlife, Natural DiversityInformation Source, Denver, CO. 1988 to 1998 1:24000 Scale-Electronic Riparian VegetationQuadrangles.
. 1993. Unpublished Data: Episodic Water Quality Sampling Event Associated withThunderstorm Runoff at California Gulch, near Leadville.
. 1998. Fisheries Inventories: Upper Arkansas River Basin. Prepared by Greg Policky. State ofColorado Department of Natural Resources, Division of Wildlife. Salida, CO.
. 1999. Listing of Colorado Division of Wildlife Holdings, including Easements, along theArkansas River from Leadville to Pueblo. Letter via Colorado Attorney General's Office.
Converse, Y.K., C.P. Hawkins, and R.A. Valdez. 1998. Habitat Relationships of Subadult HumpbackChub in the Colorado River through Grand Canyon: Spatial Variability and Implications of FlowRegulation. Regulated Rivers: Research and Management 14: 267-284.
Cooke, J.A. and M.S. Johnson. 1996. Cadmium in Small Mammals. Environmental Contaminants inWildlife: Interpreting Tissue Concentrations. Beyer, W.N., G.H. Heinz, and A.W. Redmon-Norwood.
Crouch, T.M., D. Cain, P.O. Abbott, R.D. Penley and R.T. Hurr. 1984. Water-Resources Appraisal ofthe Upper Arkansas River Basin from Leadville to Pueblo, Colorado. U.S. Geological Survey,Water-Resource Investigations Report 82-4114.
Custer, C.M., C.T. Custer, A.S. Archuleta, L.C. Coppock, C.D. Swartz, and J.W. Bickham. In Press. AMining Impacted Stream: Exposure and Effects of Lead and Other Trace Elements on TreeSwallows (Tachycineta bicolor) Nesting in the Upper Arkansas River Basin, Colorado. Pages781-806. In: Hoffman, D.J., B.A. Rattner, G.A. Burton Jr., J. Cairns Jr., 2003. Handbook ofEcotoxicology. 2nd Edition, CRC Press, Inc, Boca Raton, Florida.
Dames and Moore, Inc. 1991. RI/FS for Bunker Hill Superfund Site: Draft Remedial InvestigationReport, June 1991.
Dash, R.G., and R.F. Oritz. 1996. Water Quality Data for the Arkansas River Basin, SoutheasternColorado, 1990-1993: U.S. Geological Survey Open File Report 95-464.
Davies, Patrick H, and Stephen Brinkman. 1990. Aquatic Data Analysis-Federal Aid Project F-33.Colorado Division of Wildlife, Fish Research Section and; Federal Aid in Fish & WildlifeRestoration, Job Progress Report.
J:\010004\Task 3 - SCR\SCR_currentl.doc 8-3
. 1994. Investigation of Acute and Long-Term Toxicity of Metals to Brown Trout. ColoradoDivision of Wildlife. Arkansas River Research Study, 1994 Annual Progress Report, PeriodOctober 1, 1993 to September 30,1994. Job 1.
. 1999. Water Pollution Studies. Federal Aid Project #F-243R-6. Colorado Division of Wildlife,Fish Research Station, Fort Collins, CO.
Davies, P.H., W.H. Clements, and J.D. Stednick. 1994. Arkansas River Research Study, 1994 AnnualProgress Report, Period May 1, 1993 to September 30, 1993. U. S. Bureau of Reclamation.
Davies, P.; M. Mclntyre; and J. Stednick. 1997. Arkansas River Research Study - 1995 Annual ProgressReport.
Davies, P.H., S.F. Brinkman, M.W. Mclntyre, and W.H. Clements. 2000. Arkansas River ResearchStudy: 1999 Annual Progress Report; Period October 1, 1994 to September 30, 1995. ColoradoDivision of Wildlife. Prepared for U.S. Bureau of Reclamation.
Davis, G. and W. Mertz. 1987. Copper. In Walter Mertz (ed.) Trace Elements in Human and AnimalNutrition, 5th Edition, Volume 2. Academic Press. Orlando, Florida.
Dominick S. DeWitt and Michael P. O'Neill. 1998. Effects of Flow Augmentation on Stream ChannelMorphology and Riparian Vegetation: Upper Arkansas River Basin, Colorado. Wetlands. Vol.18. No. 4. December 1998. pp. 591-607. The Society of Wetland Scientists.
Drexler, J.W and Roy F. Weston, Inc. 1995. Draft Final Findings of Metal Speciation Investigations atthe California Gulch NPL Site. Prepared for U.S. EPA, Region Vffl, Denver, CO, October 1995.
Eisler, R. 2000. Handbook of Chemical Risk Assessment: Health Hazards to Humans, Plants, andAnimals. Lewis Publishers, pp 1903.
Enserink, E.L., J.L. Maas-Diepeveen, and C.J. Van Leeuwan. 1991. Combined Effects of Metals: AnEcotoxicological Evaluation. Water Research 25:679-687.
Evans G.W., P.F. Majors, and W.E. Cornatzer. 1970. Mechanisms for Cadmium and Zinc Antagonismof Copper Metabolism. Biochemistry. Biophysics. Res. Commun. 40:1142-1148.
Farrington, William. 1985. Affadavit from Bill Farrington of Buena Vista, Colorado. Dated February22,1985.
Fisher, K.T. 1999. Revegetation of Fluvial Tailing Deposits on the Arkansas River Near Leadville,Colorado. M. S. Thesis. Colorado State University. Fort Collins, CO.
Fitzgerald, J.P., C.A. Meaney, and D.M. Armstrong. 1994. Mammals of Colorado. Denver Museum ofNatural History, University Press of Colorado 467 pp.
Fletcher, L.A. 1975. Soil Survey of Chafee-Lake Area, Colorado: Soil Conservation Services, 78 p.
Franson, J.C. 1996. Cadmium in Small Mammals. In: Environmental Contaminants in Wildlife:Interpreting Tissue Concentrations. Beyeer, W.N., G.H. Heinz, and A.W. Redmond-Norwood(eds.). SETAC Special Publication Series. Lewis Publishers.
J:\Ol0004\Task 3 - SCR\SCR_currentl.doc 8-4
Frugis, M. 1995. Bioavailability of Metal Mixtures in Natural and Synthetic Sediments. Masters Thesis,Colorado State University, Fort Collins, CO.
Harrahy, E.A. 2000. Ecotoxicological and Genetic Effects of a Mixture of Heavy Metals on SelectedAquatic Macroinvertebrates. A Ph.D. Dissertation Submitted to Colorado State University, FortCollins, CO.
Hambidge, M.K., C.E. Casey, and N.F. Kiebs. 1986. Zinc. In Walter Mertz (ed.) Trace Elements inHuman and Animal Nutrition. 5th Edition, Volume 2. Academic Press. Orlando, Florida.
Herrmann, S.J. and K.I. Mahan. 1977. Effects of Impoundment on Water and Sediment in the ArkansasRiver at Pueblo Reservoir. U. S. Bureau of Reclamation, Lower Missouri Region, Fryingpan-Arkansas Project, Colorado.
Hoffman, D.J., B.A. Rattner, G.A. Burton Jr., and J. Cairns Jr. 1995. Handbook of Ecotoxicology. CRCPress Inc., Boca Raton, Florida. 1995.
Horwitt, M.K. and C.R. Cowgill. 1931. The Effects of Ingested Lead on the Organism: II. Studies onthe Dog. J. Pharmacol. Exper. Therapy. 66:289-301.
Horowitz, A.J., F.A. Rinella, P. Lamothe, T.L. Miller, T.K.. Edwards, R.L. Roche, and D.A. Rickert.1990. Variations in Suspended Sediment and Associated Trace Element Concentrations inSelected Riverine Cross Sections. Environmental Science & Technology, Volume 24, Number 9,pages 1313-1320.
InterFluve, Inc and FLO Engineering, Inc (InterFluve). 1999. Fluvial Geomorphology Assessment ofUpper Arkansas River: Final Report. Unpublished Report Prepared for URS Operating Services,110 p. plus appendices.
Jacobs Engineering Group, Inc (Jacobs). 1991. Historical Mineral Processing Operations of theLeadville Mining District, California Gulch Superfund Site, Leadville, Colorado. Prepared forU.S. Environmental Protection Agency, Region VIII, May 1991.
Jordan, D.S. 1889. Report of Explorations in Colorado and Utah During the Summer of 1889, with anAccount of the Fishes Found in Each of the River. United States Fish Commission, Vol. DC,Washington Government Printing Office, 1891.
Kabata-Pendias, A. 2001. Trace Elements in Soils and Plants. Third Edition. CRC Press, Boca Raton,Florida.
Keammerer, W. 1987. Unpublished Soils and Vegetation Data. Leadville, CO.
Kiffney, P.M. and W.H. Clements. 1993. Bioaccumulation of Heavy Metals by Benthic Invertebrates atthe Arkansas River, Colorado. Environmental Toxicology and Chemistry, Vol. 12, pp. 1507-1517, 1993.
Kimball, B.A., K.E. Bencala, D.M. McKnight. 1989. Research on Metals in Acid Mine Drainage in theLeadville Colorado Area. U.S. Geological Survey Toxic Substances Hydrology Program -Proceedings of the Technical Meeting, Phoenix, Arizona, September 26.
Kimball, B.A., E. Callender, and E.V. Axtmann. 1995. Effects of Colloids on Metal Transport in a RiverReceiving Acid Mine Drainage, Upper Arkansas River, Colorado, U.S.A. Applied Geochemistry10: 285-306.
J:\010004\Task 3 - SCR\SCR_currentl.doc 8-5
Klima, K., and B. Scherer. 2000. Draft: Baseline Ecosystem Setting Characterization of the LeadvilleArea. Natural Resource Management Department, Colorado Mountain College. Leadville, CO.
Krieger, D. 2000. Personal Communication with Andrew Archuleta. Doug Krieger Fishery Biologist,Colorado Division of Wildlife, Colorado Springs, CO
Lancia, R.A., J.D. Nichols, and K.H. Pollock. 1994. Estimating the Number of Animals in WildlifePopulations. Pages 215-253. In: T.A. Bookhout, ed. Research and Management Techniques forWildlife and Habitats. Fifth ed. The Wildlife Society, Bethesda, Md.
Levy, D. B., K.A. Barbarick, E.G. Siemer, and L.E. Sommers. 1992. Distribution and Partitioning ofTrace Metals in Contaminated Soils near Leadville, Colorado. J. Envir. Quality 21:185-195.
Lewis, M.E. and P. Edelmann. 1994. Physical, Chemical, and Biological Characteristics of PuebloReservoir, Colorado, 1985-1989. U.S. Geological Survey, Water-Resources InvestigationsReport 94-4097.
Ma, W. 1996. Lead in Mammals. Environmental Contaminants in Wildlife: Interpreting TissueConcentrations. Beyer, W.N., G.H. Heinz, and A.W. Redmon-Norwood (eds).
Ma, W. and S. Talmage. 2001. Insectivora. In: Ecotoxicology of Wild Mammals. Shore, R.F. and B.A.Rattner (eds.). pp. 123-158. John Wiley & Sons Ltd.
Marr, J.C.A., H.L. Bergman, M. Parker, J. Lipton, D. Cacela, W. Erickson, and G.R. Phillips. 1995.Relative Sensitivity of Brown and Rainbow Trout to Pulsed Exposures of an Acutely LethalMixture of Metals Typical of the Clark. Canadian Journal of Fisheries and Aquatic Science 52:2005-2015.
Mayack, L.A., P.B. Bush, O.J. Fletcher, R.K. Page and T.T. Fendley. 1981. Tissue Residues of DietaryCadmium in Wood Ducks. Archives of Environmental Contamination and Toxicology 10: 637-645.
McCulley, Frick, & Oilman, Inc. 1990. Arkansas River Sediment and Water Quality Assessment -FinalReport. For Rocky Mountain Consultants.
McRnight, D.M., Ranville, J.F., and Hamish, R.A., 1991, Particulate and Colloidal Organic Material andAssociated Trace Metals in Pueblo Reservoir, Colorado, in Mallard, G.E., and Aronson, D.A.,eds., U.S. Geological Survey Toxic Substances Hydrology Program-Proceedings of theTechnical Meeting, Monterey, California, March 11-15, 1991: U.S. Geological Survey Water-Resources Investigations Report 91-4034, p. 428-433.
Medley, C.N., and W.H. Clements. 1998. Responses of Diatom Communities to Heavy Metals inStreams: The Influence of Longitudinal Variation. Ecol. Appl. 8:631-644.
Melancon, M.J. 1995. Bioindicators Used in Aquatic and Terrestrial Monitoring. In: Handbook ofEcotoxicology. Hoffman, D.J., B.A. Rattner, G.A. Burton, Jr., and J. Cairns, Jr. (eds.). pp. 220-240. Lewis Publishers.
Mueller, D.K., L.R. DeWeese, AJ. Garner, and T.B. Spruill. 1991. Reconnaissance Investigation ofWater Quality, Bottom Sediment, and Biota Associated with Irrigation Drainage in the MiddleArkansas River. U.S. Geologic Survey, Water-Resources Investigations Report 91-4060.
J:\010004\Task 3 - SCR\SCR_currentl.doc 8-6
Natural Resources Conservation Service (NRCS). 1997. NRCS Report, NRCS, Alamosa, CO.
Nehring, R.B. 1986. Stream Fisheries Investigations, Federal Aid Project F-51-R, Job 1. Fish FlowInvestigations, Job 3. Special Regulations Evaluation. Colorado Division of Wildlife, Ft. Collins,Colorado, Federal Aid in Fish and Wildlife Restoration Job Progress Report F-51-R.
Nehring, R.B. and G. Policky. 2002. Evaluation of 16 Years of Trout Population Biometrics in theUpper Arkansas River. Colorado Division of Wildlife.
Nelson, S.M. and R.A. Roline. 1996. Distribution of Aquatic Macroinvertebrates in Relation to StreamFlow Characteristics in the Arkansas River. U. S. Bureau of Reclamation, Technical ServiceCenter, Denver, CO. Technical Memorandum 8220-96-19.
Nelson, S.M. and R.A. Roline. 1999. Relationships Between Metals and Hyporheic InvertebrateCommunity Structure in a River Recovering from Metals Contamination. Hydrobiologia397:211-226(1999).
Norrdin, R.W. 1987. Correspondence between R. Norrdin, College of Veterinary Medicine, ColoradoState University and D. Schweitzer, Colorado State University Diagnostic Lab, Grand Junction,Colorado. Letters from January 8 and 13, 1987.
Ortiz, R.F., M.E. Lewis, and M.J. Radell. 1998. Water-Quality Assessment of the Arkansas River Basin,Southeastern Colorado, 1990-93. U.S. Geological Survey, Water-Resources InvestigationsReport 97-4111.
Overton, C.K., S.P. Wollrab, B.C. Roberts and M.A. Radko. 1997. R1/R4 (Nothern/IntermountainRegions) Fish and Fish Habitat Standard Inventory Procedures Handbook. USDA Forest Service,Intermountain Research Station, INT-GTR-346.
PRC Environmental Management, Inc. 1992. Investigation of the Potential for a Relationship BetweenOsteochondrosis in the Horse and Heavy Metal Exposure. Report No. 012-C08096.
Pain, D.J. 1995. Lead in the Environment. In: Handbook of Ecotoxicology. Hoffman, D.J., B.A.Rattner, G.A. Burton, Jr. and J. Caims, Jr. (eds.). pp. 356-391. Lewis publishers.
Pain, D.J. 1996. Lead in Waterfowl. In: Environmental Contaminants in Wildlife, Interpreting TissueConcentrations. Beyer, W., G. Heinz, and A. Redmond-Norwood (eds.). pp. 251-264, CRCPress Inc. Boca Raton, Florida.
Paschke, M. W., E. F. Redente, and D. B. Levy. 2000. Zinc Toxicity Thresholds for ImportantReclamation Grass Species of the Western United States. Environmental Toxicology andChemistry 19:2751-2756.
Paschke, M.W. and E.F. Redente. 2002. Copper Toxicity Thresholds for Important Reclamation GrassSpecies of the Western United States. Environmental Toxicology and Chemistry (In Press).
Pickering, F.R. 1995. Food Chain Transfer and the Relative Importance of Aqueous & DietaryExposures to Metals in Rainbow Trout. A Master of Science Thesis Submitted to Colorado StateUniversity, Fort Collins, CO.
Policky, G. 1998. Fisheries Inventories, Upper Arkansas River Basin. State of Colorado, Department ofNatural Resources, CDOW, Salida, CO.
J:\010004\Task 3 - SCR\SCR_currentl .doc 8-7
Policky et al. 2000. -(Policky, CDOW Fishery Biologist, Salida Colorado). Personal Communicationwith A. Archuleta.
Rabeni, C.G., and M.A. Smale. 1995. Effects of Siltation on Stream Fishes and the Potential MitigatingRole of Buffering Riparian Zone. Hydrobiologia 303: 211-219.
Redente, E. F. and D. A. Baker. 1996. Direct Revegetation of Mine Tailing: A Case Study in Colorado,pp. 183-191. In F. F. Munshower and S. E. Fisher (eds.) Planning, Rehabilitation, and Treatmentof Disturbed Lands. Reclamation Research Unit Publication No. 9603. Montana StateUniversity, Bozeman, Montana.
Robertson, R.J., BJ. Stutchbury and R.R. Cohen. 1992. The Birds of North America, No. 11, 26 pp.
RooneyJ.R. 1975. The Equine Practitioner. Osteochondrosis in the Horse. Modem Vet. Practice.56:113-116.
Ruse, L. P., and S.J. Hermann. 2000a. Plecoptera and Trichoptera Species Distribution Related toEnvironmental Characteristics of the Metal-Polluted Arkansas River, Colorado. Western NorthAmerican Naturalist 60(1): 57-65.
Ruse, L.P., S.J. Herrmann, and I.E. Sublette. 2000b. Chironomidae (Dipter) Species Distribution Relatedto Environmental Characteristics of the Metal-Polluted Arkansas River, Color. Western NorthAmerican Naturalist 60(1): 34-56.
Sample, B.E., D.M. Opresko, and G.W. Suter H. 1996. Toxicological Benchmarks for Wildlife. 1996Revision. Prepared for the U.S. Department of Energy by Lockheed Martin Energy Systems, Inc.ES/ER/TM-86/R3.
Scheidegger, K.J. and M.B. Bain. 1995. Larval Distribution and Mircrohabitat Use in Free-Flowing andRegulated Rivers. Copeia 1: 12-135.
Shacklette, H.T. and J.G. Boemgen. 1984. Element Concentrations in Soil and Other Surficial Materialsof the Continuous United States. U.S. Geological Survey Professional Paper 1270.
Shore, R.F. and B. A. Rattner (Editors). 2001. Ecotoxicology of Wild Mammals. John Wiley and Sons,West Sussex, England.
Smith, B. 1992. Retired Veterinarian, Leadville, Colorado. Personal Communication with MaryMcKinley, PRC Environmental Management, Inc. August 18 and October 27.
Smith, S.M. 1994. Geochemical Maps of Copper, Lead, and Zinc, Upper Arkansas River DrainageBasin, Colorado. U. S. Geological Survey, Open-File Report 94-408.
Smith, R. and L.M. Hill, eds. 1999. Arkansas River Water Needs Assessment Report. USDI Bureau ofLand Management, USDI Bureau of Reclamation, USD A Forest Service, and ColoradoDepartment of Natural Resources.
Sommers, L.E., K.A. Barbarick, and D.B. Levy. 1991. Behavior of Trace Metals in Mountain MeadowSoils. Proceedings of the Third Intermountain Meadow Symposium. Steamboat Springs, CO.Colorado State University, Fort Collins, CO.
J:\010004YTask 3 - SCR\SCR_currentI.doc 8-8
Sotou, S., K. Yamamoto, H. Sendota, and M. Sugiyama. 1980. Toxicity, Fertility, Teratogenicity, andDominant Lethal Tests in Rats Administered Cadmium Subchronically. I. Fertility,Teratogenicity, and Dominant Lethal Tests. Ecotoxicol. Environ. Safety. 4:51-56.
Spehar, R.L., and J.T Fiandt. 1986. Acute and Chronic Effects of Water Quality Criteria-Based MetalMixtures to Three Aquatic Species. Environmental Toxicology and Chemistry. 5:917-931.
S.M. Stoller Corporation (Stoller). 1996. Screening Level Ecological Risk Assessment, Operable UnitNo. 4, California Gulch Superfund Site. Prepared for Resurrection Mining Company, December19,1996.
Strom, S.M. 2000. The Utility of Metal Biomarkers in Assessing the Toxicity of Metals in the AmericanDipper (Cinclus mexicanus). Unpublished Thesis, Colorado State University, Ft. Collins, CO.
Studzinski. 1997. A Summary of Environmental Studies Done in the Upper Arkansas River Basin asthey Pertain to Streambank Erosion in the Area. University College, University of Denver,Denver, CO (Unpublished Data).
Swayze, G.A., R.N. Clark, R.M. Pearson, and K.E. Livo, 1996. Mapping Acid Generating Minerals atthe California Gulch Superfund Site in Leadville, Colorado using Imaging Spectroscopy.Prepared by U.S. Geological Survey Spectroscopy Laboratory, Denver, CO and U.S. Bureau ofReclamation, Denver, CO, Summaries of the 6th Annual JPL Airborne Earth Science Workshop,March 4-8, 1996.
Swyers, J.A. 1990. Metal Contamination of a High Altitude Mountain Valley Meadow Due to HeavyMetal Mining of a World Class Ore Body. Colorado Mountain College. Leadville, CO.
United States Environmental Protection Agency (USEPA). 1986. Quality Criteria for Water (The GoldBook). Report #440/5-86-001.
United States Fish and Wildlife Service (USFWS). 1988. Clear Creek Reservoir Reclamation andArkansas River Fish Kill: A Review and Evaluation of the Use of Rotenone.
. 1993. Assessment of the Trout Population in the Upper Arkansas River Basin of CentralColorado. U.S. Bureau of Reclamation, Eastern Colorado Projects Office, Loveland, CO
. 1995. Unpublished Invertebrate Data Collected by Environmental Contaminants Program,Colorado Field Office.
URS Operating Services, Inc. 1997. Sampling Activities Report Upper Arkansas River Fluvial TailingsLake County, Colorado. TDD No. 9609-0005. Prepared for USEPA START. Contract No. 68-W5-0031.
. 1998. Sampling Activites Report Fall 1997 & June 1998. Upper Arkansas River FluvialTailings Lake County, Colorado. TDD No. 9702-0025. Prepared for USEPA START. ContractNo. 68-W5-0031.
Walsh and Associates, Inc (Walsh). 1993a. Smelter Remedial Investigation Report, California GulchSite, Leadville, Colorado. Prepared for ASARCO, Incorporated, Leadville, Colorado, May 3,1993.
. 1993b. Lead Speciation Study, Leadville, Colorado. Prepared for ASARCO, Incorporated,Denver, Colorado, October 1993.
J:\010004\Task 3 - SCR\SCR_currentl.doc 8-9
. 1994. Pre-Mining Soils Geochemistry Report, California Gulch Study Area, Leadville,Colorado. Prepared for ASARCO, Incorporated, Leadville, Colorado, March 21, 1994.
Walton-Day, K., R.W. Healy, F.B. Maestas, and A. Ranalli. 2000. Effects of Remediation onGeochemistry and Hydrology of the Unsaturated Zone of Fluvial Tailings Deposits in theFloodplain of the Upper Arkansas River, Colorado. In: Proceedings from the Fifth InternationalConference on Acid Rock Drainage, Denver, CO, May 21-24, 2000: Littleton, Colorado, Societyfor Mining, Metallurgy, and Exploration, pp 1443-1450.
Walton-Day, K., F.J. Rossi, L.J. Gerner, J.B. Evans, T.J. Yager, J.F. Ranville and K.S. Smith. 2000.Effects of Fluvial Tailings Deposits on Soils and Surface- and Ground-Water Quality, andImplications for Remediation - Upper Arkansas River, Colorado, 1992-1996. U.S. GeologicalSurvey Water Resources Investigations Report 99-4273, 100 p.
Water Quality Control Division. 1998. Status of Water Quality in Colorado. Colorado Department ofPublic Health and the Environment. December.
Wetherbee, Gregory A., Briant A. Kimball, Wendy S. Maura. 1991. Selected Hydrologic Data for theUpper Arkansas River Basin, Colorado 1986-1989.
Roy F. Weston, Inc. (Weston). 1994. Consolidated Findings of Soil Investigations from the CaliforniaGulch NPL Site. Draft Report, Prepared for U.S. EPA Region Vm.
. 1996. Baseline Human Health Risk Assessment for the California Gulch NPL Site. Prepared forU.S. EPA, Region Vm, Denver, CO, May 1996
Roy F. Weston, Inc. and Terra Technologies (Weston and Terra). 1997. Ecological Risk Assessment forthe Terrestrial Ecosystem, California Gulch NPL Site, Leadville, Colorado. Prepared for U.S.EPA, Region Vm, Denver, CO, January 1997.
Wheeler, T.J., D.L. Anderson, S. Engle, A.M. Hogan, L.S. Larren, L.A. Neve, and R.R. Romano. 1995.Soil Survey of Fremont County Area, Colorado: Natural Resources Conservation Service, 338 p.
Willingham, Tom, and Allen Medine. Unpublished. Water Resource Management Strategies forRestoring & Maintaining Aquatic Life Uses. Second International Joint EPA-Peoples Republicof China Symposium on Fish Toxicology, Physiology and Water Quality Management. May1992.
Winters, D.S. 1988. Seasonal Relationships Between the Benthos, Invertebrate Drift and Brown TroutPredation. Colorado State University, Fort Collins, Colorado, M. S. Thesis.
Wixson, B.G., B.E. Davies, and T.E. Clevenger. 1988. Environmental Impacts of Lead in SoilAssociated with Primary Lead Smelters in Missouri. Presented at 1988 SEM Annual Meetingand Exhibit, Phoenix, Arizona.
Woodling, J. 1990. Use Attainability Study, California Gulch, Colorado. Colorado Department ofPublic Health and Environment, and U.S. Environmental Protection Agency Report.
Woodward Clyde. 1993. Terrestrial Ecosystem Evaluation-Sampling and Analysis Plan-Final. Preparedfor ASARCO, Inc.
J:\010004\Task 3 - SCR\SCR_currentl .doc 8-10
Zhang, Y., B. Malmquist, and G. Englund. 1998. Ecological Processes Affecting Community Structureof Blackfly Larvae in Regulated and Unregulated Rivers: A Regional Study. Journal of AppliedEcology 35: 673-686.
J:\010004\Task 3 - SCR\SCR_currentl.doc 8-11
APPENDIX A
Bibliography
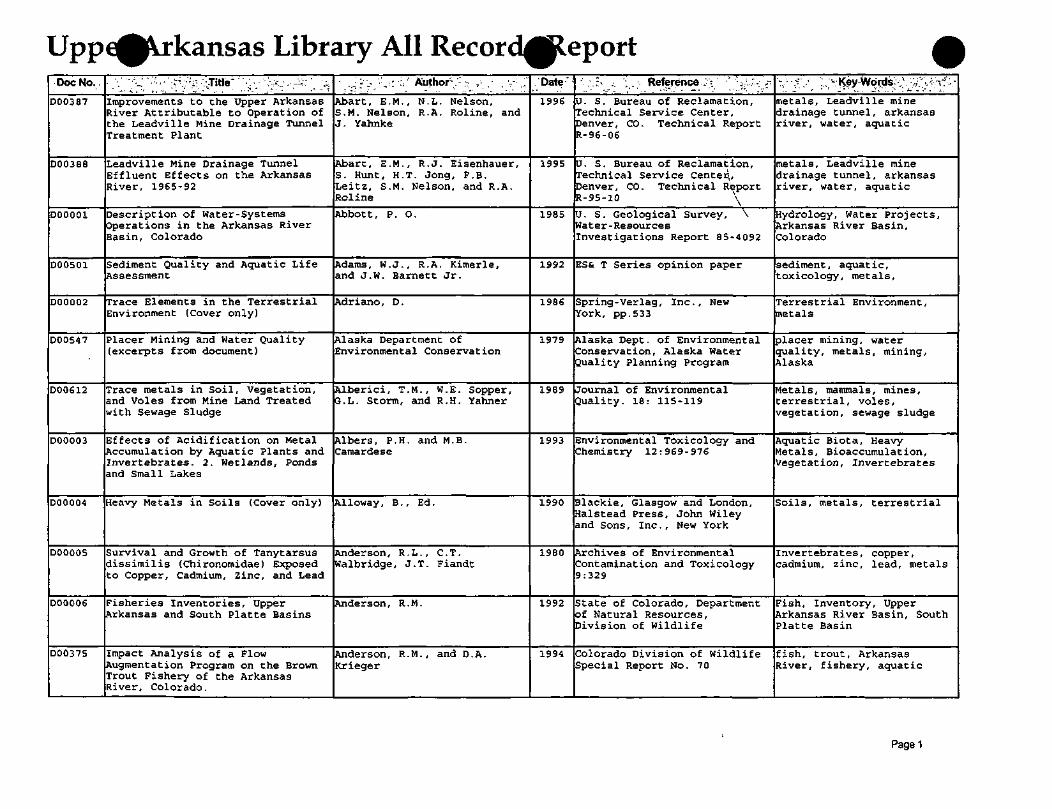
Uppe^lVrkansas Library All RecorcM^eportDoc No..
D00387
D00388
D00001
D00501
D00002
D00547
D00612
D00003
D00004
D00005
D00006
D00375
- .'•' V:<';:;'-':v-;;>v'-Vrit1e" : '•.;•.• %..•••:--" '. ;>•Improvements to the Upper ArkansasRiver Attributable to Operation ofthe Leadville Mine Drainage TunnelTreatment Plant
Leadville Mine Drainage TunnelEffluent Effects on the ArkansasRiver, 1965-92
Description of Water-SystemsOperations in the Arkansas RiverBasin, Colorado
Sediment Quality and Aquatic LifeAssessment
Trace Elements in the TerrestrialEnvironment (Cover only)
Placer Mining and Water Quality(excerpts from document)
Trace metals in Soil, Vegetation,and Voles from Mine Land Treatedwith Sewage Sludge
Effects of Acidification on MetalAccumulation by Aquatic Plants andInvertebrates. 2. Wetlands, Pondsand Small Lakes
Heavy Metals in Soils (Cover only)
Survival and Growth of Tanytarsusdissimilis (Chironomidae) Exposedto Copper, Cadmium, Zinc, and Lead
Fisheries Inventories, UpperArkansas and South Platte Basins
Impact Analysis of a FlowAugmentation Program on the BrownTrout Fishery of the ArkansasRiver, Colorado.
.,.• '- '_• •'•'•, • : "'••. Author'1 - ~ - T • . • '-~- ,'
Abart, E.M., N.L. Nelson,S.M. Nelson, R.A. Roline, andJ. Yahnke
Abart, E.M., R.J. Eisenhauer,S. Hunt, H.T. Jong, F.B.Leitz, S.M. Nelson, and R.A.Roline
Abbott, P. 0.
Adams, W.J., R.A. Kimerle,and J.W. Barnett Jr.
Adriano, D.
Alaska Department ofEnvironmental Conservation
Alberici, T.M. , W.E. Sopper,G.L. Storm, and R.H. Yahner
Albers, P.H. and M.B.Camardese
Alloway, B. , Ed.
Anderson, R.L., C.T.Walbridge, J.T. Fiandt
Anderson, R.M.
Anderson, R.M., and D.A.Krieger
Date"
1996
1995
1985
1992
1986
1979
1989
1993
1990
1980
1992
1994
•';.;-;. ''..-- Reference;-. '''''*;*''-<?
U. S. Bureau of Reclamation,Technical Service Center,Denver, CO. Technical ReportR-96-06
CJ. S. Bureau of Reclamation,Technical Service Center^Denver, CO. Technical ReportR-95-10 \
U. S. Geological Survey, \Water -ResourcesInvestigations Report 85-4092
ES& T Series opinion paper
Spring-Verlag, Inc., NewYork, pp.533
Alaska Dept . of EnvironmentalConservation, Alaska WaterQuality Planning Program
Journal of EnvironmentalQuality. 18: 115-119
Environmental Toxicology andChemistry 12:969-976
Blackie, Glasgow and London,Halstead Press, John Wileyand Sons , Inc . , New York
Archives of EnvironmentalContamination and Toxicology9:329
State of Colorado, Departmentof Natural Resources,Division of Wildlife
Colorado Division of WildlifeSpecial Report No. 70
V : ?::•', ':-..; ?y-Wor«Js>\ •:.;••,. ::-•?-:-metals, Leadville minedrainage tunnel , arkansasriver, water, aquatic
metals, Leadville minedrainage tunnel, arkansasriver, water, aquatic
Hydrology, Water Projects,Arkansas River Basin,Colorado
sediment, aquatic,toxicology, metals,
Terrestrial Environment,metals
placer mining, waterquality, metals, mining,Alaska
Metals, mammals, mines,terrestrial, voles,vegetation, sewage sludge
Aquatic Biota, HeavyMetals, Bioaccumulation,Vegetation, Invertebrates
Soils, metals, terrestrial
Invertebrates, copper,cadmium, zinc, lead, metals
Fish, Inventory, UpperArkansas River Basin, SouthPlatte Basin
fish, trout, ArkansasRiver, fishery, aquatic
Pagel
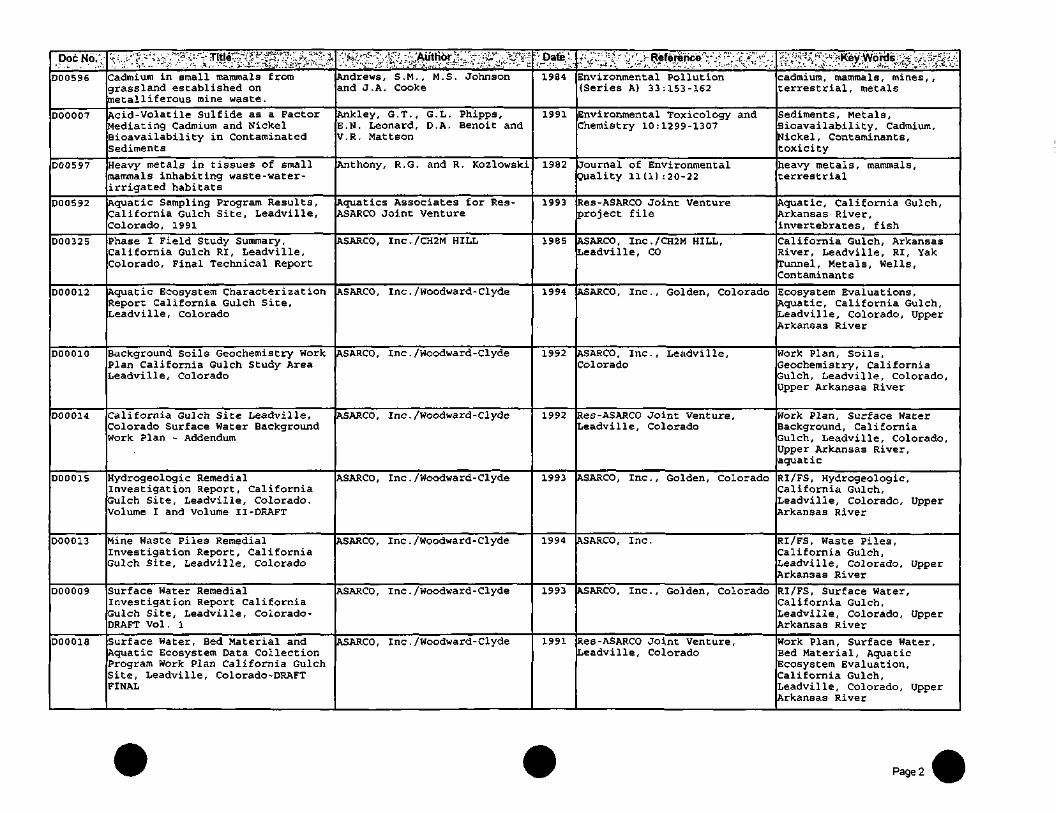
Doc N6.V
D00596
D00007
D00597
D00592
D00325
D00012
D00010
D00014
D00015
D00013
D00009
D00018
-. • !-ji. .;; - . • v.-.'if : ; ,—" Tl*l * ""~ v".3?.j1**'~(.c'~.' l '• , •- •;•-<,*';•$••>'. : • t-.- --i-'-Vi .?.'.• --Title-.-c-j.;~-vii, .•/-;,?•-•;. ;.-v.'.i.-. ':; • -.,•-. . .--.'.ir. --•..-..••- .*.., -••'.•.: £ r.:WL-i;.>iV.rv'<:'1.~.-;-.-Cadmium in small mammals fromgrassland established onmetalliferous mine waste.
Acid-Volatile Sulfide as a FactorMediating Cadmium and NickelBioavailability in ContaminatedSediments
Heavy metals in tissues of smallmammals inhabiting waste-water-irrigated habitats
Aquatic Sampling Program Results,California Gulch Site, Leadville,Colorado, 1991
Phase I Field Study Summary,California Gulch RI, Leadville,Colorado, Final Technical Report
Aquatic Ecosystem CharacterizationReport California Gulch Site,Leadville, Colorado
Background Soils Geochemistry WorkPlan California Gulch Study AreaLeadville, Colorado
California Gulch Site Leadville,Colorado Surface Water BackgroundWork Plan - Addendum
Hydrogeologic RemedialInvestigation Report, CaliforniaGulch Site, Leadville, Colorado.Volume I and Volume I I -DRAFT
Mine Waste Piles RemedialInvestigation Report, CaliforniaGulch Site, Leadville, Colorado
Surface Water RemedialInvestigation Report CaliforniaGulch Site, Leadville, Colorado-DRAFT Vol . 1
Surface Water, Bed Material andAquatic Ecosystem Data CollectionProgram Work Plan California GulchSite, Leadville, Colorado-DRAFTFINAL
'.'Vi-K- ':f"\s£?j "AiftHori'viV? •';U?';; . >:?
Andrews, S.M., M.S. Johnsonand J.A. Cooke
Ankley, G.T., G.L. Phipps,E.N. Leonard, D.A. Benoit andV.R. Mattson
Anthony, R.G. and R. Kozlowski
Aquatics Associates for Res-ASARCO Joint Venture
ASARCO, Inc./CH2M HILL
ASARCO, Inc. /Woodward-Clyde
ASARCO, Inc. /Woodward-Clyde
ASARCO , Inc . /Woodward- Clyde
ASARCO , Inc . /Woodward- Clyde
ASARCO, Inc. /Woodward-Clyde
ASARCO, Inc. /Woodward -Clyde
ASARCO, Inc. /Woodward-Clyde
jJafe;1984
1991
1982
1993
1985
1994
1992
1992
1993
1994
1993
1991
j'Vv;-]' » -;' :£'.'.> ??ferepce -r V* ~v '.t£: ••':. . ':
Environmental Pollution(Series A) 33:153-162
Environmental Toxicology andChemistry 10:1299-1307
Journal of EnvironmentalQuality 11(1) :20-22
Res -ASARCO Joint Ventureproject file
ASARCO, Inc./CH2M HILL,Leadville, CO
ASARCO, Inc., Golden, Colorado
ASARCO, Inc., Leadville,Colorado
Res -ASARCO Joint Venture,Leadville, Colorado
ASARCO, Inc., Golden, Colorado
ASARCO, Inc.
ASARCO, Inc., Golden, Colorado
Res -ASARCO Joint Venture,Leadville, Colorado
•:f ;':- Key.mitasW VK ;i * -" ._: L ,'.• ...„>• -. - - -:•. ./.•-,; '. ,-v:, -yrfe- -,•,-- :'..} •£..>•„•-
cadmium, mammals, mines,,terrestrial, metals
Sediments, Metals,Bioavailability, Cadmium,Nickel, Contaminants,toxicity
heavy metals, mammals,terrestrial
Aquatic, California Gulch,Arkansas River,invertebrates, fish
California Gulch, ArkansasRiver, Leadville, RI, YakTunnel, Metals, Wells,Contaminants
Ecosystem Evaluations,Aquatic, California Gulch,Leadville, Colorado, UpperArkansas River
Work Plan, Soils,Geochemistry, CaliforniaGulch, Leadville, Colorado,Upper Arkansas River
Work Plan, Surface WaterBackground, CaliforniaGulch, Leadville, Colorado,Upper Arkansas River,aquatic
RI/FS, Hydrogeologic,California Gulch,Leadville, Colorado, UpperArkansas River
RI/FS, Waste Piles,California Gulch,Leadville, Colorado, UpperArkansas River
RI/FS, Surface water,California Gulch,Leadville, Colorado, UpperArkansas River
Work Plan, Surface Water,Bed Material, AquaticEcosystem Evaluation,California Gulch,Leadville, Colorado, UpperArkansas River
Page 2
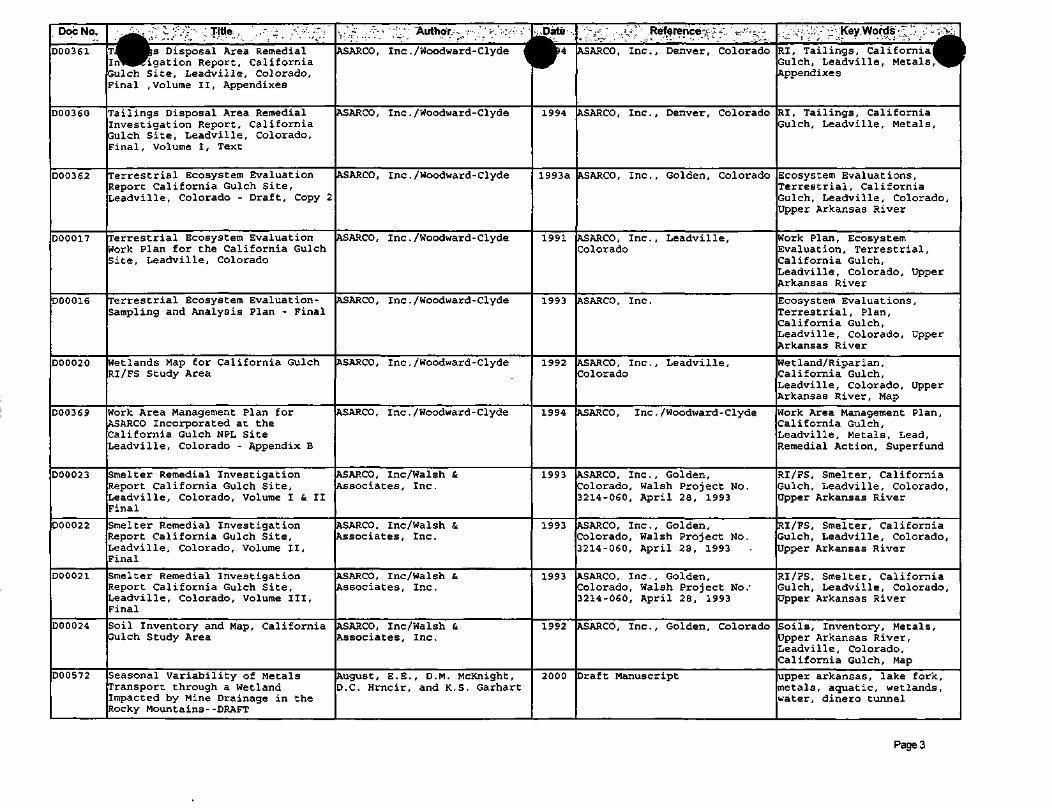
Doc No.
D00361
D00360
D00362
D00017
D00016
D00020
D00369
D00023
D00022
D00021
D00024
D00572
. r S -ntie, !--^:-~ ;.:;-T ^ ps Disposal Area RemedialInl^Beigation Report, CaliforniaGulch Site, Leadville, Colorado,Final , Volume II, Appendixes
Tailings Disposal Area RemedialInvestigation Report, CaliforniaGulch Site, Leadville, Colorado,Final, Volume I, Text
Terrestrial Ecosystem EvaluationReport California Gulch Site,Leadville, Colorado - Draft, Copy 2
Terrestrial Ecosystem EvaluationWork Plan for the California GulchSite, Leadville, Colorado
Terrestrial Ecosystem Evaluation-Sampling and Analysis Plan - Final
Wetlands Map for California GulchRI/FS Study Area
Work Area Management Plan forASARCO Incorporated at theCalifornia Gulch NPL SiteLeadville, Colorado - Appendix B
Smelter Remedial InvestigationReport California Gulch Site,Leadville, Colorado, Volume I & IIFinal
Smelter Remedial InvestigationReport California Gulch Site,Leadville, Colorado, Volume II,Final
Smelter Remedial InvestigationReport California Gulch Site,Leadville, Colorado, Volume III,Final
Soil Inventory and Map, CaliforniaGulch Study Area
Seasonal Variability of MetalsTransport through a WetlandImpacted by Mine Drainage in theRocky Mountains --DRAFT
S;'.': -' '."I-."' "J thofc -:-'.' >.'•.•:.;-:•;• '
ASARCO, Inc. /Woodward-Clyde 1
ASARCO, Inc . /Woodward-Clyde
ASARCO, Inc . /Woodward-Clyde
ASARCO , Inc . /Woodward- Clyde
ASARCO, Inc . /Woodward-Clyde
ASARCO, Inc . /Woodward-Clyde
ASARCO , Inc . /Woodward- Clyde
ASARCO, Inc/Walsh &Associates, Inc.
ASARCO, Inc/Walsh &Associates, Inc.
ASARCO, Inc/Walsh &Associates, Inc.
ASARCO, Inc/Walsh &Associates, Inc.
August, E.E., D.M. McKnight,D.C. Hrncir, and K.S. Garhart
.Date .
^V4
1994
1993a
1991
1993
1992
1994
1993
1993
1993
1992
2000
•'-^: .-,..I,V References V'-^vASARCO, Inc., Denver, Colorado
ASARCO, Inc., Denver, Colorado
ASARCO, Inc., Golden, Colorado
ASARCO, Inc., Leadville,Colorado
ASARCO, Inc.
ASARCO, Inc., Leadville,Colorado
ASARCO, Inc. /Woodward -Clyde
ASARCO, Inc., Golden,Colorado, Walsh Project No.3214-060, April 28, 1993
ASARCO, Inc., Golden,Colorado, Walsh Project No.3214-060, April 28, 1993
ASARCO, Inc., Golden,Colorado, Walsh Project No/3214-060, April 28, 1993
ASARCO, Inc., Golden, Colorado
Draft Manuscript
•.:.- :-';::- ••' :: ;tey.Words ;:- v -^vj
RI, Tailings, Calif ornia ^ lGulch, Leadville, Metals ^^BAppendixes
RI , Tailings, CaliforniaGulch, Leadville, Metals,
Ecosystem Evaluations,Terrestrial, CaliforniaGulch, Leadville, Colorado,Upper Arkansas River
Work Plan, EcosystemEvaluation, Terrestrial,California Gulch,Leadville, Colorado, UpperArkansas River
Ecosystem Evaluations,Terrestrial, Plan,California Gulch,Leadville, Colorado, UpperArkansas River
Wetland/Riparian,California Gulch,Leadville, Colorado, UpperArkansas River, Map
Work Area Management Plan,California Gulch,Leadville, Metals, Lead,Remedial Action, Superfund
RI/FS, Smelter, CaliforniaGulch, Leadville, Colorado,Upper Arkansas River
RI/FS, Smelter, CaliforniaGulch, Leadville, Colorado,Upper Arkansas River
RI/FS, Smelter, CaliforniaGulch, Leadville, Colorado,Upper Arkansas River
Soils, Inventory, Metals,Upper Arkansas River,Leadville, Colorado,California Gulch, Map
upper arkansas, lake fork,metals, aquatic, wetlands,water, dinero tunnel
Page 3
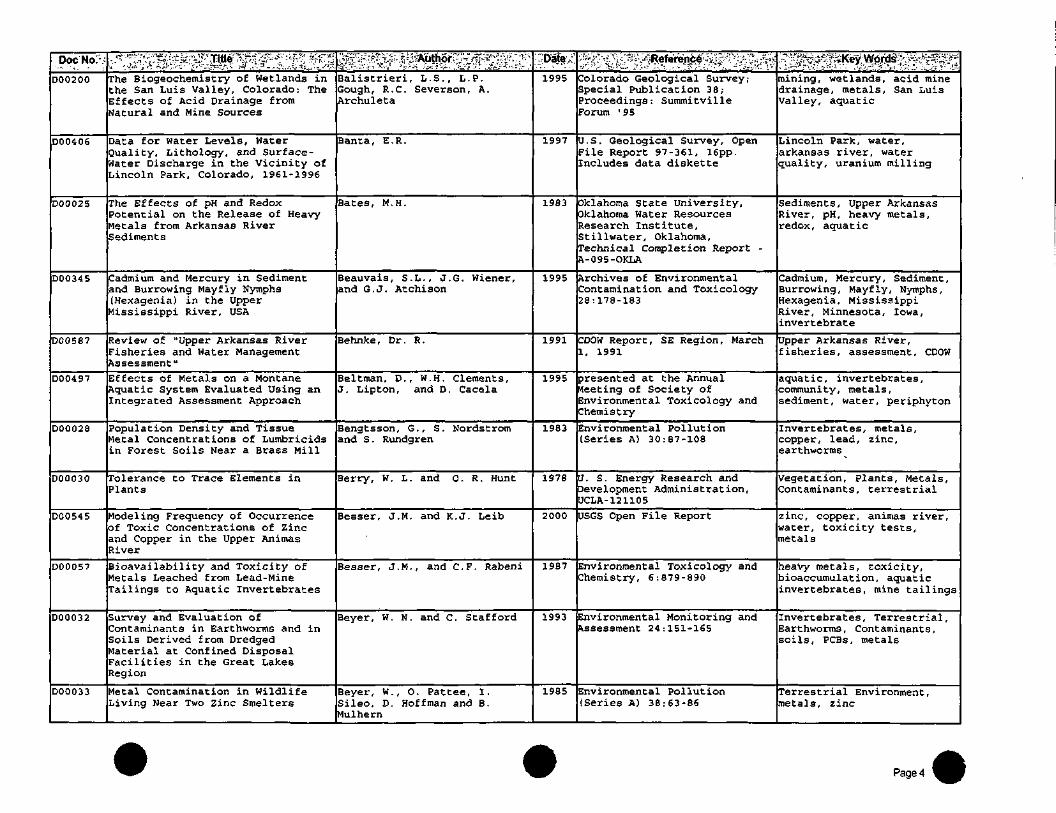
Doc No;-.;
D00200
D00406
D00025
D00345
D00587
D00497
D00028
D00030
D00545
D00057
D00032
D00033
.5 f:V J~- Title? ££A -•&*:*?•?. W*?:,. v>.5 j ;•; i:;!vH."';:?:-.::JT<-,:; >¥ .:--.-.a- f:..-X--isi,"i.'<?The Biogeochemistry of Wetlands inthe San Luis Valley, Colorado: TheEffects of Acid Drainage fromNatural and Mine Sources
Data for water Levels, WaterQuality, Lithology, and Surface-Hater Discharge in the Vicinity ofLincoln Park, Colorado, 1961-1996
The Effects of pH and RedoxPotential on the Release of HeavyMetals from Arkansas RiverSediments
Cadmium and Mercury in Sedimentand Burrowing Mayfly Nymphs(Hexagenia) in the UpperMississippi River, USA
Review of "Upper Arkansas RiverFisheries and Water ManagementAssessment"
Effects of Metals on a MontaneAquatic System Evaluated Using anIntegrated Assessment Approach
Population Density and TissueMetal Concentrations of Lumbricidsin Forest Soils Near a Brass Mill
Tolerance to Trace Elements inPlants
Modeling Frequency of Occurrenceof Toxic Concentrations of Zincand Copper in the Upper AnimasRiver
Bioavailability and Toxicity ofMetals Leached from Lead-MineTailings to Aquatic Invertebrates
Survey and Evaluation ofContaminants in Earthworms and inSoils Derived from DredgedMaterial at Confined DisposalFacilities in the Great LakesRegion
Metal Contamination in WildlifeLiving Near Two Zinc Smelters
^»^X-tertMtir^rZ^r!;y :.:*:•:••i£vt;.- •,-,•*-•/ ;'«:•;•; i«.?s~. .SyT* r :.s£.*> ---••-.•Balistrieri, L.S., L.P.Gough, R.C. Severson, A.Archuleta
Banta, E.R.
Bates, M.H.
Beauvais, S.L., J.G. Wiener,and G.J. Atchison
Behnke, Dr. R.
Beltman, D., W.H. Clements,J. Lipton, and D. Cacela
Bengtsson, G., S. Nordstromand S . Rundgren
Berry, W. L. and 0. R. Hunt
Besser, J.M. and K.J. Leib
Besser, J.M., and C.F. Rabeni
Beyer, W. N. and C. Stafford
Beyer, W., O. Pattee, I.Sileo, D. Hoffman and B.Mulhern
~Date,:
1995
1997
1983
1995
1991
1995
1983
1978
2000
1987
1993
1985
• .'•--v •-?:'- "SV-;AiRiBferencei-.'s.':-F'-.''-' '.':- , ,-V-wr. :V ".'.•i- ;i;.> ;:.":. ', !•'.'?•':•'•.:.*':?',..•'•':&•'?.••'-Colorado Geological Survey;Special Publication 38;Proceedings: SummitvilleForum ' 95
U.S. Geological Survey, OpenFile Report 97-361, 16pp.Includes data diskette
Oklahoma State University,Oklahoma Water ResourcesResearch Institute,Stillwater, Oklahoma,Technical Completion Report -A-095-OKLA
Archives of EnvironmentalContamination and Toxicology28:178-183
CDOW Report, SE Region, March1, 1991
presented at the Annualfleeting of Society ofEnvironmental Toxicology andChemistry
Environmental Pollution(Series A) 30:87-108
0. S. Energy Research andDevelopment Administration,UCLA- 12 1105
USGS Open File Report
Environmental Toxicology andChemistry, 6:879-890
Environmental Monitoring andAssessment 24:151-165
Environmental Pollution(Series A) 38:63-86
••v ^ Key;y s;: ; ?fmining, wetlands, acid minedrainage, metals, San LuisValley, aquatic
Lincoln Park, water,arkansas river, waterquality, uranium milling
Sediments, Upper ArkansasRiver, pH, heavy metals,redox, aquatic
Cadmium, Mercury, Sediment,Burrowing, Mayfly, Nymphs,Hexagenia, MississippiRiver, Minnesota, Iowa,invertebrate
Upper Arkansas River,fisheries, assessment, CDOW
aquatic, invertebrates,community, metals,sediment, water, periphyton
Invertebrates, metals,copper, lead, zinc,earthworms
Vegetation, Plants, Metals,Contaminants, terrestrial
zinc, copper, animas river,water, toxicity tests,metals
heavy metals, toxicity,bioaccumulation, aquaticinvertebrates, mine tailings
Invertebrates, Terrestrial,Earthworms, Contaminants,soils, PCBs, metals
Terrestrial Environment,metals, zinc
Page 4
Doc No.
D00034
D00031
D00162
D00083
D00112
D00548
D00035
D00036
D00207
D00488
D00624
000037
D00038
D00039
:: jii:,:-:-; J-J-v-;; ;Tltle : '.-- :-. '.v /:••i ^ Metal Concentrations inEa forms from Soil Amended withSewage Sludge
Evaluating Soil Contamination
Estimates of Soil Ingestion byWildlife
Relation of Waterfowl Poisoning toSediment Lead Concentrations inthe Coeur d'Alene River Basin
Lead Poisoning in Six CaptiveAvian Species
The Role of Sediment Ingestion inExposing Wood Ducks to Lead
Biotic Factors That EffectBioaccumulation of Metals in Fish
Effects of Copper and Zinc onOlfaction of Colorado Squawfish asEstimated by Behavioral Assay(Draft Final Report)
Water Pollution Studies FederalAid in Fish Restoration Project F-33-R-2
Water Pollution Studies, JobCompletion Report, Federal AidProject F-33-R-1
Quantification of Fluvial TroutHabitat in Wyoming (Andrew has)
Aquatic Toxicity of Trace Elementsof Coal and Flyash. ProceedingsDOE Symposium, University ofGeorgia, Athens.
Sensitivity of Vertebrate Embryosto Heavy Metals as a Criterion ofWater Quality
The Induction of Tolerance toHeavy Metals in Natural andLaboratory Populations of Fish
r. •••: vvft~V7v Author ;•;"••. •'•"••••—- -'-••Beyer, W., R. Chaney and B. 1Mulhern "
Beyer, W.N.
Beyer, W.N. , E.E. Connor, S.Gerould
Beyer, W.N., D.J. Audet, G.H.Heinz, D.J. Hoffman, D. Day
Beyer, W.N., J.W. Spann, L.Sileo, J.C. Franson
Beyer, W.N., L.J. Blus, C.J.Henny, and D. Audet
Beyers, D.W.
Beyers, D.W. and M.S. Farmer
Bingham, D.A.
Bingham, D.A.
Binns, N.A. and P.M. Eiserman
Birge, W.
Birge, W.J. and J.J. Just
Birge, W.J., W.H. Benson,J.A, Black
a^V2
1990
1994
2000
1988
1996
1990
1994
1967
1966
1979
1978
1973
1983
':••' y-W^ ''V Reference" &•!-:•>•. ';-"'. •'-••:
Journal of EnvironmentalQuality 2:381-382
U. S. Fish and WildlifeService, Biological Report 90(2)
Journal of WildlifeManagement 58 (2) :375-382
Ecotoxicology, 9(31:217-218
Archives of EnvironmentalContamination and Toxicology17:121-130
Ecotoxicolgy 6:181-186
Colorado State University,Department of Fishery andWildlife Biology, FortCollins, Colorado
Colorado State University,Department of Fishery andWildlife Biology, Larval FishLaboratory, Fort Collins,Colorado
Colorado Game, Fish and ParksDepartment Report
Colorado Division of WildlifeReport
Transactions of the AmericanFisheries Society 108(31:215-228
In J.H. Thorp and J.W.Gibbons (eds.) Energy andEnvironmental Stress inAquatic Systems. DOE Sym.Series; 4 8
University of Kentucky, WaterResources Institute,Lexington, Kentucky
University of Kentucky, WaterResources Research Institute
.*.'""".". :•'.?*. Keywords; '-;'/---' •'"'"•]Invertebrates, soil, heai Hmetals, terrestrial ^^H
Soils, terrestrial, metals,sediment, invertebrates
contaminants, diet,nutrients, risk assessment,scat, sediments, soilingestion
waterfowl, sediment,toxicity, mining, ALAD,lead, metals
lead, birds, metals, ALAD
wood ducks, waterfowl,metals, lead, soilingestion, idaho, exposure
Fish, Metals, Effects,Bioaccumulation, aquatic
Fish, Metals, Effects,Olfaction, aquatic
water, pollution, oreprocessing. Summit County,Arkansas River, mines, fish
arkansas river, fish,metals, aquatic, climax,California gulch
trout, Wyoming, habitat
Aquatic Environment, pH,aquatic, coal, fly ash,metals
Toxicology, VertebrateEmbryos, Heavy Metals,Water Quality, aquatic
Fish, Heavy Metals,Effects, Tolerance,aquatic, bioaccumulation,water quality
Pages
Doe No.;
D00478
D00337
D00040
D00618
D00029
D00042
D00483
D00528
D00625
D00525
D00417
D00088
D00096
< .S S -i'S .^™3K2-$$&y&^ S•:-•••.'. -o •:••»•.£-• "_. •*'i.'J.-r'"'j.a—"">;.".i's:.-i ;<* u^---*?-Gold Mining Effects on StreamHydrology and Water Quality,Circle Quadrangle, Alaska
EPA's Proposed Metal SedimentCriteria: Good News for Industry
Lead Toxicosis in Tundra SwansNear a Mining and Smelting Complexin Northern Idaho
Concentrations of Metals in Minkand Other Mammals from Washingtonand Idaho
Accumulation in and Effects ofLead and Cadmium on Waterfowl andPasserines in Northern Idaho
Lead in the Environment (CoverOnly)
Assessing the Potential Toxicityof Resuspended Sediment
Ecological Complexity of Wetlandswithin a River Landscape
Stream Habitat Analysis Using theInstream Flow IncrementalMethodology (Andrew has)
Avian Use of Native and ExoticRiparian Habitats on the SnakeRiver, Idaho (Abstract & portionsof thesis in library)
High Altitude Tailing ReclamationProjects
RTDF I INERT - Progress Report
Effect of Biosolids Processing onthe Bioavailability of Pb in urbanSoils
£ : ^ H .f ;fgBjerklie, D.M. and J.D.LaPerriere
Bleiler, J.A.
Blus, L., C. Henny, D.Hoffman, and R. Grove
Blus, L.J., C.J. Henny, andB.M. Mulhern
Blus, L.J., C.J. Henny, D.J.Hoffman, R.A. Grove
Boggess, W. and R. Wison, eds .
Bonnet, C., M. Babut, J.F.Ferard, L. Martel, J. Garric
Bornette, G., C. Amoros, H.Piegay, J. Tachet, and T. Hein
Bovee, K.D., B.L. Lamb, J.M.Barholow, c.B. Stalnaker, J.Taylor, J. Henriksen
Brown, C.R.
Brown, L.F. and M.J. Trlica
Brown, S.
Brown, S., and R. Chaney
. Date,- '•*- - : •_-]•;1985
1996
1991
1987
1995
1977
2000
1998
1998
1990
1995
2000
1997
?-Jr-£. ?-%•' . Refereric# A' T f;- , ^
Hater Resources Bulletin21(2) : 235-243
Environmental SolutionsSeptember 1996
Archives of EnvironmentalContaminants and Toxicology21:549-555
Environmental Pollution 44 :307-318
Environmental Pollution89(3) :311-318
National Science FoundationReport NSF:/RA-770214. 272 pp.
Environmental Toxicology andChemistry 19(51:1290-1296
Biological Conservation 85:35-45
USGS, Biological ResourcesDivision Information andTechnology Report USGS/BRD-1998-0004
Unpublished Thesis, ColoradoState University, Ft.Collins, CO
Proceedings High AltitudeVegetation
U.S. EPA
In Biosolids ManagementInnovative TreatmentTechnologies and Processes,Water Environment ResearchFoundation, Workshop #104Proceedings
'^^^m^^ismplacer mining, waterquality, hydrology,aquatic, sediments, alaska,stream
EPA, Metals, Sediment,Industry, Bioavailability,Equilibrium Partitioning
Birds, mining, lead,metals, smelter
mammals, metals, mining,terrestrial
birds, lead, cadmium,metals, ALAD
Heavy Metals, lead
sediments, toxicity,metals, aquatic,resuspension, riskassessment, invertebrates,pore water
wetlands, river, riparian,geomorphology, vegetation,habitat, floodplain
IFIM, stream, habitat,flow, water quality, aquatic
avian, riparian, habitat,birds
tailings, reclamation,metals, revegetation
Joplin, MO, in situtreatment, soil,terrestrial, biosolids
biosolids, terrestrial,lead, metlas, soil
Page 6
Doc No.
D00072
D00513
D00071
D00503
D00043
D00044
D00045
D00046
D00047
D00343
D00589
•- ;.,-':, ;*:--, :yritiev . . y- fe-^ ^ k-* •• - — . . - - . - . - • /*-•:. r.f. •- ' . <"
Bt HHill Ecological RestorationPr m Status Report- Draft
USFS Abandoned Mine Land InventoryProject: Final Summary Report forthe San Isabel National ForestLeadville Ranger District
Using Municipal Biosolids inCombination with Other Residualsto Restore a Vegetative Cover onHigh Metal Mine Tailings
Using Municipal Biosolids inCombination with Other Residualsto Restore Metal -ContaminatedMining Areas
Aspects of Heavy Metals Toxicityin Fresh Water
Chemical Characterization ofSediments and Pore Water from theUpper Clark Fork River andMilltown Reservoir, Montana
Effects of Lead Shot Ingestion onCaptive Mourning DoveSurvivability and Reproduction
Comparative Toxicity of InorganicContaminants Released by PlacerMining to Early Life Stages ofSalmonids
Water Uptake in Woody RiparianPhraetophytes of the SouthwesternUnited States: A Stable IsotopeStudy
Wildlife Studies on the HanfordSite: 1994 Highlights Report
Heavy Metal Contamination and ItsRelationship to Osteochondrosis inHorses - Draft
•I'-i stliK f ••?-., *ut ?'j. :- ': v-S"-' - u . 'Brown, S., C. Henry, H. ICompton "
Brown, S.D., A.J. Flurkey,R.H. Wood II, and J. P. CannIV
Brown, S.L., C.L. Henry, H.Compton, P. DeVolder
Brown, S.L., C.L. Henry, H.Compton, R.L. Chaney, and P.DeVolder
Brown, V. M.
Brumbaugh , W . G . , C . G .Ingersoll, N. E. Kemble, T.W. May, J. L. Zahcek
Buerger, T., R. Mirarchi andM. Lisano
Buhl, Kevin J. and Steven J.Hamilton
Busch, David E., Neil L.Ingraham and Stanley D. Smith
Cadwell, L.L.
Calabrese, E. J.
££-:•jsT
1996
2000
2000
1976
1994
1986
1990
1992
1995
1999
:-• .::.-•.'• j1 -vijieference" _ . Y-;.:\*.
University of Washington andUS EPA ERT
Colorado Geological Survey
National Meeting of theAmerican Society for SurfaceMining and Reclamation,Tampa , FL
Unpublished report
in Toxicity to Biota of MetalForms in Natural Water:Proceedings of a workshopheld in Duluth, MN, ed. ByR.W. Andrew, P.V. Hodson,D.E. Konasewich
Environmental Toxicology andChemistry, 13 (12) : 1971-1983
Journal of WildlifeManagement 50:1-8
Ecotoxicology andEnvironmental Safety 20:325-342
Ecological Application3(4) :450-459
U.S. Dept. of Energy, PacificNorthwest Laboratory,Contract DE-A06-76RLO
University of MassachusettsSchool of Public Health
•-•:- > •- : : v V Keywords;; JlV.> .--V j•-• --i:. -.•-.•- ~v -V • 'i; --•-.-- -"-- • *j H
Bunker Hill, metals, ^^Bvegetation, terrestrial, ^Hbiosolids
arkansas river, tailings,11-mile reach, metals,soils, water, CIS maps
biosolids, mines,vegetation, metals
arkansas river, biosolids,vegetation, metals, soils,amendments, fluvial, 11-mile reach, tailings
Aquatic Biota, HeavyMetals, Water Quality,toxicity, fish
Sediments, Metals, PoreWater, Upper Clark ForkRiver, Milltown Reservoir,Montana , AVS
Birds, lead
Fish, Metals, Toxicity,placer mining, aquatic
wetland/Riparian, Wateruptake, aquatic, terrestrial
Wildlife, Hanford, Monitor,Washington, Threatened,Endangered
metals, toxicity,terrestrial, mammals
Page 7
•Dob NOi/
D00536
D00048
D00049
D00050
D00397
D00346
D00541
D00271
D00411
D00617
D00095
; .-; v rr'-:KkV::V-;"[?Fitfe'* V ,.f: . --.f,'• :• -..;•.. •-. -•. -. •;<'.;& inpff1-'*;'.!'::',. -:,-_•,' ?,•?;.•:•;.• v»«.-Transition Metal Geochemistry ofthe Upper Arkansas River, Colorado
Heavy-Metal Geochemistry ofSediments in the Pueblo Reservoir,Colorado. In: U. S. GeologicalSurvey, Toxic Substances HydrologyProgram- -Proceedings of theTechnical Meeting, Phoenix,Arizona, September 26-30, 1988
Effects of Arsenate on Growth andPhysiology in Mallard Ducklings
Acidification and Toxicity ofMetals to Aquatic Biota
Use of Benthic InvertebrateCommunity Structure and theSediment Quality Triad to EvaluateMetal -Contaminated Sediment in theUpper Clark Fork River, Montana
Solutions to Erosion Along theUpper Arkansas River
Sensitivity and Variability ofMetrics used in BiologicalAssessments of Running Waters
Aquatic Biological Data - 1995-1998 - Electronic Format
Migration and GeochemicalEvolution of Ground Water Affectedby Uranium-Mill Effluent nearCanon City, Colorado
Correlation of Cadmium- InducedNephropathy and the Metabolism ofEndogenous Copper and Zinc in Rats
The Ruminant Animal: DigestivePhysiology and Nutrition
ivJj'f -C -V AUtK ;,,/.;- ; !!:-/' :
Callender, E., B.A. Kimball,and E.V. Aztmann
Callender, E., W.H. Ficklin,B.A. Kimball, P.R. Edelmann
Camardese, M., D. Hoffman, L.LeCaptain and G. Pendleton
Campbell, P. G. C. and P. M.Stokes
Canfield, T.J., N.E. Kemble,W.G. Brumbaugh, F.J. Dwyer,C.G. Ingersoll, and J.F.Fairchild
Capouch, J., J. Diekmann, N.Pawley, T. Schenk, R. Zakaria
Carlisle, D.M., and W.H.Clements
Chadwick EcologicalConsultants, Inc.
Chafin, D.T. and E.R. Banta
Chmielnicka, J., T. Halatek,and U. Jedlinska
Church, D.C. editor
ilJate.
1991
1988
1980
1985
1994
1994
1999
2000
1999
1989
1993
-•', '•: i= -:' ;;' Jriv- - Reference: S';- v-'. -V.-i" "•'.•• .,V'. ,:•>..•--:: (.';-*.'.''-V.- :>.•:.•::....'--.-- ...--.• . .--•••.'-:••
in Mallard, G.E. and Aronson,D.E. (eds.) USGS ToxicSubstances Hydrology Program;proceedings of the technicalmeeting, Monterey CA, March11-15, 1991, WRI 91-4034, p.392-397
U. S. Geological Survey,Hater ResourcesInvestigations Report 88-4220
Environmental Toxicology andChemistry 9:783-795
Canadian Journal of Fish andAquatic Science, 42:2034-2049
Environmental Toxicology andChemistry 13 (12) : 1999-2012
Colorado School of Mines
Environmental Toxicology andChemistry 18 (2) :285-291
Chadwick EcologicalConsutants, Inc. Littleton,CO
U.S. Geological Survey, Water-Resources InvestigationsReport 98-4228
Ecotoxicology andEnvironmental Safety 18: 268-276
Prentice Hall, EnglewoodCliffs, New Jersey
•• W ''^&^W°!^^*?*?i&upper arkansas, metals,water, aquatic, sediment,water quality
Pueblo Reservoir, Metals,Arkansas River, Colorado,Sediments, Contaminants,Geochemistry
Birds, ducks, arsenic,physiology, metals
Aquatic Biota, WaterQuality, Acidification,metals, toxicity
aquatic, fish, clark forkriver, metals uptake,invertebrates
Erosion, Upper ArkansasRiver, Lake County, Soil,Water Quality, Streambank
invertebrates, metals,water, aquatic,biomonitoring
aquatic, arkansas river,data,
water quality, arkansasriver, uranium milling,ground water, lincoln park
metals, copper, zinc,mammals, cadmium
physiology, metals
PageS
Doc No.
D00053
D00054
D00336
D00538
D00455
D00055
D00026
D00423
D00159
D00056
D00058
D00059
•-.• ^ --- -- Tltle-;/ '.-:•- -l-'-i:.-• .•fey :.•••:--•"-»•;•,- •:••-••*•.• -. • ..-^ • • :—".r ••-.•Ge ^ ical and Lead-Isotope Datafra^^Rream and Lake Sediments,and Cores from the Upper ArkansasRiver drainage: Effects of Miningat Leadville Colorado on Heavy-Metal Concentrations in theArkansas River
Geochemical and Lead-isotopicStudies of River and LakeSediments, Upper Arkansas RiverDrainage Basin, Twin Lakes toPueblo Reservoir, Colorado -Preliminary Report
Source, Transport, andPartitioning of Metals betweenWater, Colloids, and Bed Sedimentsof the Animas River, Colorado
Geochemical and lead-isotopicstudies of river sediment frommajor tributaries, upper ArkansasRiver watershed, Colorado
Determination of Pre-MiningGeochemical Conditions andPaleoecology in the Animas RiverWatershed, Colorado
Lead Concentrations: Bats vs.Terrestrial Small MammalsCollected Near a Major Highway
The Variability of MetalConcentrations and MetalSpeiciation in the Arkansas River,Colorado
Metal Speciation in the UpperArkansas River, Colorado, 1990-93
Lead Poisoning in Small Animals
Integrated Field and LaboratoryApproach for Assessing Impacts ofHeavy Metals at the ArkansasRiver, Colorado
Benthic Invertebrate CommunityResponses to Heavy Metals in theUpper Arkansas River Basin,Colorado
Fate and Effects of Heavy Metalson the Arkansas River
>,.:-1 ; V Author v^v'-: v—;'.-">:•: •'•*'. ": ":-l-— •'- .-.' -.'•-'-. --V*.-T',-; •• • •' """
Church, S. E. I
Church, S. E. , S. A. Wilson,R. B. Vaughn and D. L. Fey
Church, S.E., B.A. Kimball,D.L. Fey, D.A. Ferderer, T.J.yager, and R.B. Vaughn
Church, S.E., D.L. Fey, andD.M. Unruh
Church, S.E., D.L. Fey, E.M.Brouwers, C.W. Holmes, and R.Blair
Clark, D., Jr.
Clark, M.L.
Clark, M.L. and M.E. Lewis
Clarke, E.G.C.
Clements, W. and P. Kiffney
Clements, W. H.
Clements, W. H.
'^*_
•3
1994
1997
2000
2000
1979
1996
1997
1973
1994
1994
1991
•>• ••^"..':'~~. • ..',• ' Reference '>.;;<••.'•>; '••;•?•/-;•. •U. S. Geological Survey, Open-File Report 93-534
U. S. Geological Survey,Administrative Report
U.S. Geological Survey Open-File Report 97-151, Denver, CO
USGS Open File Report 00-337
U.S. Geological Survey, OpenFile Report 99-0038(Preliminary Draft)
Environmental Science andTechnology 13:338-341
Master's Thesis, ColoradoState University
U.S. Geological Survey, Water-Resources InvestigationReport 96-4282
Journal Small Animal Practice14:183-193Environmental Toxicology andChemistry 13:397-404
Journal of North AmericanBenthological Society, 1993,13 (1) 50-66
Colorado State University,Colorado Water ResourcesResearch Institute,Completion Report No. 163,Fort Collins, Colorado
•~ :f". , -^:<: Keywords- -^.: is l.r' "-.^-:^:' ?::..;. r--. •'•-.-.- .-,--.--.-.jMMetals, Contamination, j HUpper Arkansas River Basi BLeadville, Colorado,Sediments, Lead
Metals, Contamination,Upper Arkansas River Basin,Lead, Sediments,Geochemistry, Colorado
Metals, Animas River,Colorado, Colloids, Water,Sediments, aquatic
upper arkansas, metals,sediment, water, aquatic,water quality, tributaries,other source areas
pre-mining, watershed,baseline, background,Colorado, historic mining,sediments, metals,geochemical, fluvial,geomorphology, animas river
Mammals, lead, metals
Arkansas River, Metals,aquatic, copper, iron,lead, cadmium, zinc
water quality, metals,arkansas river
lead, metals, mammals, leadpoisoningFish, heavy metals,aquatic, Arkansas River,invertebrates, toxicity,bioaccumulation
Invertebrates, Aquatic,Metals, mining,biomonitoring
Invertebrates, Aquatic,heavy metals, CaliforniaGulch, Leadville
Page 9
• :DOC NO.:
D00219
D00211
D00540
D00555
D00393
D00539
D00019
D00553
D00236
D00060
D00576
D00061
"•'^-'^yf-'^K^^^^f^^i^^-y^i^.f^-Benthic Community Responses toheavy Metals in the ArkansasRiver: Structural AlterationBioaccumulation, and Acute Toxicity
Bioaccumulation of Heavy Metals byBrown Trout (Salmo Trutta) in theArkansas River: Importance ofFood Chain Transfer
Metal Tolerance and Predator-PreyInteractions in BenthicMacroinvertebrate StreamCommunities
The Influence of Elevation onBenthic Community Responses toHeavy Metals in Rocky MountainStreams
Effects of Heavy Metals on PreyAbundance, Feeding Habits, andMetal Uptake of Brown Trout in theArkansas River, Colorado
Heavy Metals Structure BenthicCommunities in Colorado MountainStreams
Integrating observational andexperimental approaches toquantify stressor-responserelationships in metal -pollutedstreams
Structural Alterations in AquaticInsect Communities Exposed toCopper in Laboratory Streams
Structural and FunctionalResponses of Benthic Communitiesto Heavy Metals: Variation AlongLongitudinal Stream Gradients
Sensitivity of Brook Trout to LowpH, low calcium and elevatedaluminum concentrations DuringLaboratory Pulse Exposures
Accumulation of Heavy Metals byVegetables Grown in Mine Wastes
Technical Manual for the Designand Operation of a Passive MineDrainage Treatment System
_ jjfc
Clements, W.H.
Clements, W.H.
Clements, W.H.
Clements, W.H. and P.M.Kiffney
Clements, W.H., and D.E. Rees
Clements, W.H., D.M.Carlisle, J.M. Lazorchak, andP . C . Johnson
Clements, W.H., D.M,Carlisle, L.A. Courtney, E.A.Harrahy
Clements, W.H., D.S, Cherry,and J. Cairns Jr.
Clements, W.H., P.M. Kiffney,and C.N. Medley
Cleveland, L., E.E. Little,C.G. Ingersoll, R.H.Wiedmeyer and J.B. Hunn
Cobb, G.P., K. Sands, M.Waters, B.G. Wixson, E.Dorward-King
Cohen, R.R.H. and M.W. Staub
'.vJDate:-;1991
1992
1999
1995
1997
2000
2000
1988
1993
1991
2000
1992
_
t ;!-,? 'i T '&Reference/.: * ;;,.'*1; .:
U.S. EPA, Region 8, Denver, CO
Colorado Water Resources Res.Institute, CSU, Ft. Collins,CO, Grant No. 14-08-0001-2008
Ecological Applications9(3) :1073-1084
Canadian Journal of Fisheriesand Aquatic Sciences52(9) :1966-1977
Transactions of the AmericanFisheries Society 126: 774-785
Ecological Applications10(2) :626-638
Department of Fishery andWildlife Biology, ColoradoState University
Environmental Toxicology andChemistry 7:715-722
U.S.G.S., Annual TechnicalReport, 14-08-0001-G2099, 1993
Aquatic Toxicology 19 (1991)303-318
Environmental Toxicology andChemistry 19 (3) : 600-607
U. S. Bureau of Reclamationand Colorado School of Mines,Department of EnvironmentalScience and Engineering
:- vY<X' Key:W6«s dW:&:rH'•fl. -•< . iv-\-»;V rvS;..,s,3?;v~; X.-)
heavy metals, arkansasriver, benthos,bioaccumulation, toxicity,invertebrates, periphyton
heavy metals, trout, fish,arkansas river, Californiagulch, bioaccumulation,
invertebrates, metals,water, aquatic, community
aquatic, invertebrates,metals, elevation,community structure,Colorado, upper arkansas,rocky mountain streams
aquatic, fish, arkansasriver, metals uptake
invertebrates, metals,water quality, aquatic,biomonitoring
streams, water, metals,aquatic
metals, aquatic,invertebrates, copper,community structure
Benthos , HeavyMetals, Stream, ArkansasRiver , Colorado
Fish, Trout, pH, calcium,aluminum, metals
Plant, Metal, Uptake, Humanhealth, vegetation
Metals, Acid Mine Drainage,Treatment, Big Five Tunnel,Idaho Springs, Colorado,Control
Page 10
Doc No.
D00363
D00364
D00064
D00330
D00065
D00062
D00322
D00066
D00067
D00570
D00070
" '.• ••J-vV. ' .litie :.;;•:;':;. V : -: - ,',.Cl ^ Breek Phase II RemedialInv^^Kgation - Final
Clear Creek Phase II RemedialInvestigation - Final, Volume 2,Appendices
Colorado Nonpoint AssessmentReport (Cover Only)
Guidance on Data Requirements andData Interpretation Methods Usedin Stream Standards andClassification Proceedings
Leadville Heavy Metal ExposureAssessment Brief Description
The Basic Standards andMethodologies for Surface Water3.1.0 (5 CCR 1002-8)
Classifications and NumericStandards for Arkansas River BasinRegulation No. 32
Yak Tunnel/California GulchEndangertnent Assessment
Leadville/Stringtown SoilsInvestigation
Results of the Lincoln ParkSuperfund Site Ecological RiskAssessment
Episodic Metal Contamination ofthe Arkansas River by NonpointPollution from California Gulch
;- . - -} ,• : .i--h Author ---.'.' :-\--.' :;_"' '
Colorado Department of Health 1
Colorado Department of Health
Colorado Department of Health
Colorado Department of Health
Colorado Department of Health
Colorado Department of Health
Colorado Department of Healthand Environment Water QualityControl Commission
Colorado Department of Law
Colorado Department ofLaw/Engineering-Science, Inc.
Colorado Department of PublicHealth and Environment
Colorado Division of Wildlife
2S*_
*"1990
1989
1992
1986
1993
2002
1986
1986
1999
1992
,-'-"•-. • • • " • • Reference"'';.',";' -..-
Colorado Department ofHealth, Hazardous Materialsand Waste Management Divisionin Cooperation with U.S.Environmental ProtectionAgency, Prepared by: CampDresser & McKee Inc., Denver,Colorado
Colorado Department ofHealth, Hazardous Materialsand Haste Management Divisionin Cooperation with U.S.Environmental ProtectionAgency, Prepared by: CampDresser & McKee Inc., Denver,Colorado
Colorado Department ofHealth, Colorado WaterQuality Control Division,Denver, Colorado
Colorado Department ofHealth, Water Quality ControlDivision
State of Colorado, ColoradoDepartment of Health
Colorado Department ofHealth, Water Quality ControlCommission
Colorado Department ofHealth, Water Quality ControlCommission
Colorado Department of Law
Colorado Department of Law
Colorado Department of PublicHealth and EnvironmentCommunity Health News forColorado Newsletter, July 1999
Colorado Division ofWildlife, January, 1992
•:'; ; 'V ."'•••. ;.-.-; KeyVVords^ ;£:vKV l
Clear Creek, RI, Metals, ^HCentral City, NPL, FS, ^HMining, Tunnel
Clear Creek, RI, Metals,Central City, NPL, FS,Mining, Tunnel, Appendices
Water Quality
Water Quality, DataRequirements, StreamStandards, ClassificationProceedings
Soils, Metals, Lead, RiskAssessment, Human Health,Leadville, Colorado
Water Quality Standards,Surface Water, aquatic
Water Quality Standards,Arkansas River Basin
Yak Tunnel, CaliforniaGulch, Leadville, metals
Soils, Metals,Contaminants, Leadville,Colorado, Stringtown,terrestrial
lincoln park, downstream,risk assessment, superfund,arkansas river
Water Quality, CaliforniaGulch, Arkansas River,trout, fish, aquatic
Page 11
:DdcNo.
D00068
D00444
D00069
D00201
D00273
D00074
D00073
D00351
D00598
D00599
..y --A;-:?: Hi;f v Title ; »-M3?m V- - .•.- --.*%\.r.'; .•>-,.- *-v\ f--:,,v •-.-;: i-i-5. -.wi: >. ;';Impact Analysis of a FlowAugmentation Program on the BrownTrout Fishery of the ArkansasRiver, Colorado
Listing of Colorado Division ofwildlife Holdings, includingeasements, along the ArkansasRiver from Leadville to Pueblo
Upper Arkansas River Fisheries andWater Management Assessment
Water Pollution Studies
Draft Biosolids Study
Wetland Resources of ArkansasHeadwaters State Park, October 1995
Wetland Resources of Lake PuebloState Park, August, 1995
Two Colorado Rivers Among Nation'sWorst Polluted
Cadmium in small mammals
Lead, zinc, cadmium and fluoridein small mammals from contaminatedgrassland established on fluorspartailings
~s-iW&*.&?.!? Aut :!fe~i]|sKV •*;•:*--V'ltni .to"-:-.'.!*1- .<-•'•'.•* •'••'•.•.•'•x-"~iT~. •»*•;-•Colorado Division of Wildlife
Colorado Division of Wildlife
Colorado Division of Wildlife
Colorado Game, Fish, andParks Division
Colorado Mountain College
Colorado Natural AreasProgram, Colorado Departmentof Natural Resources,Division of Parks and OutdoorRecreation
Colorado Natural AreasProgram, Colorado Departmentof Natural Resources,Division of Parks and OutdoorRecreation
Colorado Rivers Alliance
Cooke, J.A. and M.S. Johnson
Cooke, J.A. and S.M. Andrews
Pafe'l1992
1999
1991
1969
1999
1995
1995
1996
1996
1990
v'.'-r i/'i.- n -'Referehce>-i- j!r;;':£ --''?-' '>ii•"••*> V; '•••>:•-.•• .••«-.•-•/•.•••.. -,-r:-.-u :.•;•' '.'V-: •••••:State of Colorado, Departmentof Natural Resources, Denver,Colorado, March 13, 1992
letter via Colorado AttorneyGeneral's Office
Colorado Division of WildlifeSoutheast Region
Job Progress Report, FederalAid Project F-33-R-4
Colorado Mountain College
Colorado Natural AreasProgram, Colorado Departmentof Natural Resources,Division of Parks and OutdoorRecreation, Inventory,Delineation and Protection ofWetlands on Colorado StateParks, U.S. EnvironmentalProtection Agency, GrantSCD998116011
Colorado Natural AreasProgram, Colorado Departmentof Natural Resources,Division of Parks and OutdoorRecreation, Inventory,Delineation and Protection ofWetlands on Colorado StateParks, U.S. EnvironmentalProtection Agency, Grant#CD998116011
Confluence 2 (3)
Environmental Contaminants inWildlife: Interpreting TissueConcentrations. Beyer, W.N.,G.H. Heinz, and A.W. Redmon-Norwood (eds.). SETACSpecial Publication Series.Lewis Publishers
Water, Air, and SoilPollution 51:43-54
^ ^ KeyV is- v ft SiFish, Flow Augmentation,Trout, Arkansas River,aquatic
land ownership,terrestrial, CDOW, realty,arkansas river, property,maps
Fish, Water Management,Upper Arkansas River,aquatic
Water, Arkansas River,Climax, Zinc, metal
biosolids, invertebrates,mine waste
Wetland/Riparian, ArkansasRiver, Vegetation, Colorado
Wetland/Riparian, PuebloReservoir, vegetation,Colorado
Colorado, Rivers, Polluted,Cache la Poudre, ArkansasRiver
cadmium, mammals, toxicity,terrestrial, metals
metals, mammals, grassland,terrestrial
Page 12
Doc No.
D00076
D00077
D00078
D00420
D00079
D00586
D00484
D00399
D00081
D00080
.^! .y. :: . Title -"- :< '- •?. :•'.'. •.-.: Bk' •--•••••• r • .•••-.--. '. '• "- :- - • . • - - .C ^ Bi, Metal -binding Proteins,ana^rowth in Bluegill (Lepomismacrochirus) Exposed toContaminated Sediments from theUpper Mississippi River Basin
Acute and Sub-Chronic Toxicity ofLead to the Early Life Stages ofSmallmouth Bass (Micropterusdolomieui) (cover page only)
Water-Resources Appraisal of theUpper Arkansas River Basin fromLeadville to Pueblo, Colorado
water Resources Data, Colorado,Water Years 1989-2000 MissouriRiver Basin, Arkansas River Basin,Rio Grande Basin (on other shelf)
Effects of pH on the Toxicities ofCadmium, Copper, and Zinc toSteelhead Trout (Salmo gairdneri)
In Press . A Mining ImpactedStream: Exposure and Effects ofLead and Other Trace Elements onTree Swallows (TachycinetaDicolor) Nesting in the UpperArkansas River Basin, Colorado
Strategies of Heavy Metal Uptakeby Three Plant Species GrowingNear a Metal Smelter
The Importance of ContaminatedFood for the Uptake of HeavyMetals by Rainbow Trout (Salmogairdneri) : A Field Study
Ecotoxicology of Metals inInvertebrates
Contaminated Food and Uptake ofHeavy Metals by Fish: A Review anda Proposal for Further Research
.-'•.. v •-.•'.-•••: -'.•Author'-- ...:-rv ,-:. .-,".'1 • ' "• •• •" •• ; "•- •- • -• " • • ' iCope, W.G., J.G. Wiener, M.T.iSteingraeber, G. J. Atchison '
Coughlan, D.J., S.P. Gloss
Crouch, T.M., D.Cain, P.O.Abbott, R.D. Penley and R.T.Hurr
Crowfoot, R.M., A.V. Paillet,G.R. Ritz, M.E. Smith, R.D.Steger, and G.B. O'Neill
Cusimano, R.F., D.F. Brakkeand G.A. Chapman
Custer, C.M., C.T. Custer,A.S. Archuleta, L.C. Coppock,C.D. Swart z, and J.W. Bickham
Dahmani-Muller, H., F. vanOort, B. Gelie, M. Balabane
Dallinger, R. and H. Kautzky
Dallinger, R. and P.S. Rainbow
Dallinger, R. , F. Prosi, H.Segner, and H. Back
.Jtete :fr
1986
1984
389-200
1986
2003
2000
1985
1991
1987
.' ]'- ••'-•'• ''' .'- Reference-." V.; =.-;-/. . '-1-!V
' • \ '-.'. ' ' " -.-" \ . " - • ' . . V • ' • " - . . .
Canadian Journal of Fish andAquatic Science 51:1356-1367
Waste, Air, and SoilPollution 18: 265-275
CJ. S. Geological Survey,Water-Resource InvestigationsReport 82-4114
U.S. Geological Survey, Water-Data Report CO-96-1
Canadian Journal of Fish andAquatic Science 43:1497-1503
In: Hoffman, D.J., B.A.Rattner, G.A. Burton Jr., J.Cairns Jr., Handbook ofEcotoxicology. 2nd Edition,CRC Press, Inc, Boca Raton,Florida
Environmental Pollution 109:231-238
Oecologia 67: 82-89
Proceedings of a Session Heldat the First SETAC-EuropeConference Sheffield, UnitedKingdom, April 7-10, 1991
Oecologia (Berlin) 73:91-98
',;- :?V:. vKey Worts . 0-f.
Fish, Metals, Cadmium, ^^HEffects, aquatic ^^H
Fish, Metals, Lead, aquatic
Hydrology, Upper ArkansasRiver Basin, aquatic, waterquality
water quality, upperarkansas
Fish, Metals, Trout, pH,Effects, aquatic
Upper Arkansas River, lead,trace elements, Mining,California Gulch, treeswallows, metals, sediment
terrestrial, smelter,metals, soils,phytoremediation, plants,vegetation
aquatic, fish, metalsuptake, clark fork river
Invertebrates, Metals,Criteria
Fish, Metals, Effects,Foodchain, Bioaccumulation,aquatic
Page 13
;.D6c-H6.''
D00075
D00084
D00085
D00443
D00086
D00243
D00082
D00087
D00329
^'- •^••J:;^f^r^^^f^^^^K-The Need to Establish Heavy MetalStandards on the Basis ofDissolved Metals
Use of Dialysis Tubing in Definingthe Toxic Fractions of HeavyMetals in Natural Waters
Acute and Chronic Toxicity of Leadto Rainbow Trout Salmo gairdneri .in Hard and Soft Water (cover pageonly)
Arkansas River Research Study -1995 Annual Progress Report,Period 1 Oct. 1993 - 30 Sept. 1994
Arkansas River Research Study,1994 Annual Progress Report,Period October 1, 1993 toSeptember 30, 1994, Job 1:Investigation on Acute and Long-term Toxicity of Metals to BrownTrout
Bioavailability and Toxicity ofMetals and Metal Colloids
Importance of Laboratory-DerivedMetal Toxicity Results inPredicting In-Stream Response ofResident Salmonids
Aquatic Data Analysis - FederalAid Project F-33
Aquatic Life - Water QualityRecommendations for Heavy metaland Other Inorganic Toxicants
; '•^•-•^^•^ Author^ Vy z-f'^-:??.J-.i-';i- x;XvV ''t-r,- :-4 £•:•. ••#.-."> ' ,•.""••.•"*Davies, P.
Davies, P.
Davies, P. H., J. P. Goettl,Jr., J. R. Sinley, and N. F.Smith
Davies, P.H, W.H. Clements,and J.D. Stednick
Davies, P.H.
Davies, P.H.
Davies, P.H. and J.D. Woodling
Davies, P.H. and S. Brinkman
Davies, P.H., and Goettl,Jr., J.P.
'tipste
1976
1976
1976
1995
1994
2001
1980
1990
1976
$ K^&t's.^lfan&^&Qf* '&&In: Toxicity to Biota ofMetal Forms in Natural Water,pp. 93-104, R.W. Andrew, P.Hodson, and D. Konasewich,Eds. Proc. Workshop, Duluth,Minnesota, October 7-8, 1975.Great Lakes Res . AdvisoryBoard, International JointComm
In: Toxicity to Biota ofMetal Forms in Natural Water,pp. 110-117, R.W. Andrew, P.Hodson, and D. Konasewich,Eds. Proc. Workshop, Duluth,Minnesota, October 7-8, 1975.Great Lakes Res . AdvisoryBoard, International JointComm
Water Research Vol. 10: 199-206
Report for U.S. Bureau ofReclamation
U. S. Bureau of Reclamation
Unpublished report to theUpper Arkansas Consulting Team
In.- Aquatic Toxicology, STP707. J. Eaton, P. Parrish,and A. Hendricks, Eds. ASTM.pp. 281-299
Colorado Division ofWildlife, Fish ResearchSection and Federal Aid inFish and WildlifeRestoration, Job ProgressejjuiL
Colorado Division of Wildlifefor Water Quality StandardsRevision Committee andColorado Water QualityControl Commission
' •" feTK Wortisl" -1 ;~ • • ,-•" L? ~-, "-:'• -• Av,:' >v"v*. ''•-r '-':"*-; ;r."-',' J:->
metals, toxicity, fish,aquatic
Water Quality, dialysis,metals, toxicity, aquatic
Fish, Metals, Lead, Trout,aquatic
water quality, aquatic,fish, toxicity tests,invertebrates, metals,dinero tunnel, lake fork,sugar loaf gulch
Fish, Trout, Metals, Lead,Toxicity, aquatic
heavy metals, toxicity,metal colloids,bioavailability. UpperArkansas River
Fish, metals, cadmium,copper, zinc, trout,aquatic toxicology
Water Quality Standards,Aquatic Biota, Toxicology,pH, Colorado
Water Quality, AquaticLife, Metals, Toxicants
Page 14
Doc No.
D00244
D00408
D00630
D00622
D005BO
D00089
D00479
D00090
D00091
D00092
D00093
v \ "• • - .• -%™*$ |fe w;«Wj ^ B'ollution Studies - FederalAi^BKject #F-33: CadmiumToxicity to Rainbow Trout:Bioavailability and Kinetics inWaters of High and low ComplexingCapacities
Arkansas River Research Study:1995 Annual Progress Report,Period October 1, 1994 toSeptember 30, 1995
Arkansas River Research Study:1999 Annual Progress Report;Period October 1, 1996 toSeptember 30, 1999
East Fork Arkansas River ResearchStudy, Annual Contract Summary,Period: October, 1997 toSeptember, 1999
Arkansas River Basin ResearchStudy: 5 Year Grant Summary,October 1997 to September, 2002
Arkansas River Research Study,1994 Annual Progress Report,Period May 1, 1993 to September30, 1993
Environmental Factors Influencingthe Natural Revegetation of PlacerMine Tailings in Interior Alaska
Sensitivity of Early-Life-StageGolden Trout to Low pH andElevated Aluminum
Toxic Effects of Lead and LeadCompounds on Human Health, AquaticLife, Wildlife, Plants, andLivestock
Draft Ordered Rankings for HomeRanges of Migratory BirdsPotentially Inhabiting theCalifornia Gulch, Leadville,Colorado Superfund Site
Toxicity of Cadmium in Sediments:The Role of Acid Volatile Sulfide
•3Jf?M-«j>.'-£ ;..,>?. Author ,-.-. .•/ -:;-!1 — ;_"• •-•-••;?;•. .-*• T'rv- -' ' •- -f- '• ..''--- " •, •. "-•*•* ; .-•-,'•' ,
Davies, P.M., and S. Brinkmani
Davies, P.H., M.W. Mclntyre,J.D. Stednick
Davies, P.H., S.F. Brinkman,M.W. Mclntyre, and W.C.Clements
Davies, P.H., T.G. Powell,E.E. Kochman, W.H. Clements,P. Kiffiney
Davies, P.H., T.G. Powell,E.E. Kochman, W.H. Clements,P. Kiffiney, H. Ramsdell
Davies, P.H., W.H. Clements,J.D. Stednick
Deans , A .
DeLonay, A.J., E.E. Little,D. F. Woodward, W.G.Brumbaugh, A.M. Farag andC.F. Rabeni
DeMayo, A., M.C. Taylor, K.W.Taylor, and P.V. Hodson
DeWeese, R. and J. Wegrzyn
Di Toro, D.M., J.D. Mahony,D.J. Hansen, K.J. Scott, M.B.Hicks, S.M. Mayr and M.S.Redmond
ate ,
B4
1997
2000
1999
1999
1994
1992
1993
1982
1992
1990
; "..;% .-'v.-'. •-:.'.'•.• Reference-^ Y^>' -r:Colorado Division ofWildlife, Fish ResearchSection, Job Final Report
Report for U.S. Bureau ofReclamation
Arkansas River ResearchStudy: 1999 Annual ProgressReport
Report for U.S. Bureau ofReclamation
Colorado Division ofWildlife, Fisheries Research
U. S. Bureau of Reclamation
M.S. Thesis, Colorado Schoolof Mines
Environmental Toxicology andChemistry 12:1223-1232
CRC Critical Reviews inEnvironmental Control 12(4):257-305
0. S. Fish and WildlifeService/FWE/Colorado StateOffice, Golden, Colorado
Environmental Toxicology andChemistry 9:1487-1502
.•:..• .x.; ;::v~ -Key «6rds;>: :i;; ,. ]
Cadmium, water, aquatic, Htoxicity, bioavailabilityT^Bmetals
arkansas river, waterquality, metals,invertebrates, fish,toxicity, sediments,bioaccumulation, aquatic
Arkansas River, fish,invertebrates, benthos,trout, water, sediments,metals, toxicity, aquatic
water quality, aquatic,Leadville Mine DrainageTunnel, fish, ArkansasRiver, metals, toxicity
aquatic life, LeadvilleMine Drainage Tunnel, YakTunnel, metals, CaliforniaGulch, Arkansas River,fish, toxicity
water Quality, UpperArkansas River, Colorado,lead, sediment, aquatic
placer mining,revegetation, alaska,stream, aquatic, riparian,soils
Fish, Metals, Aluminum, pH,aquatic
Metals, Lead, Toxicology,Human Health, AquaticBiota, Plants, DomesticLivestock
Birds, Mammals, UpperArkansas River, CaliforniaGulch, Colorado, lead
Sediments, Metals,Toxicology, Cadmium,Transport
Page 15
. Doc No/"
D00094
D00358
D00600
D00601
D00379
D00402
D00594
D00097
D00542
D00413
D00400
^&:&m?m^^MmsMolybdenum and CopperRelationships in Animal Nutrition
Hanford Site Environmental Reportfor Calendar Year 1994
Ecological effects of heavy metalpollution (Pb, Cd, Zn) on smallmammal populations and communities
Trace metal accumulation by theshrew Sorex araneus II. Tissuedistribution in kidney and liver
Effects of Flow Augmentation onChannel Morphology and RiparianVegetation in the Upper ArkansasRiver Basin, CO
Effects of a Mine Tailings Spillon Feeding and MetalConcentrations in Yellow Perch(Perca flavescens)
Acute Toxicity of Ambient ArkansasRiver Water Samples to the FatheadMinnow (Pimephales promelas) andCeriodaphnia dubia
Cadmium and Mercury in EmergentMayflies (Hexagenia bilineata)from the Upper Mississippi River
Toxicity and Bioaccumulation of aMixture of Heavy Metals inChironomus tentans (Diptera:Chironomidae) in Synthetic Sediment
Reconnaissance of Water Quality ofPueblo Reservoir, Colorado- -Maythrough December 1985
Compilation of Water-Quality Datafor Pueblo Reservoir and the UpperArkansas River Basin, Colorado,1985-87 (cover only)
;?V?- ^a> £ Hd'i£ 'W7 :HK -#*•..!•>•;•>!••::-•?*,••'.?'«£;>*»- :-i.>_ <'•' ;'-,S .;".'-;'. .-' -..&&•?.
Dick, A. T.
Dirkes, R.L., and R.W. Hanf
Dmowski, K. , M. Kozakiewiczand A. Kozakiewicz
Dodds-Smith, M.E., M.S.Johnson and D.J. Thompson
Dominick, D.S.
Draves, J.F. and M.G. Fox
Drottar, K.R.
Dukerschein, J.T., J.G.Wiener, R.G. Rada, and M.T.Steingraeber
E.A. Harrahy and W.H. Clements
Edelmann, P.
Edelmann, P., J.A. Scaplo,D.A. Colalancia, B.B. Elson
iibateS1987
1995 |
1995
1992
1997
1998
1989
1992
1997
1989
1991
iii:~>>U -;:Refererice 5&. \ ;:,".•': ;•:--• : "•„•-:.••'•.•;•.-.••••. :•'••••.' :••'••- v.rir -.:./.-In: Inorganic NitrogenMetabolism, Animal HealthResearch Laboratory,Commonwealth Scientific andIndustrial ResearchOrganization, Melbourne,Victoria, Australia
U.S. Department of Energyunder Contract DE-AC06-76RLO1830, Pacific NorthwestLaboratory, Richland,Washington
Bulletin of the PolishAcademy of SciencesBiological Sciences 43:1-10
Ecotoxicology andEnvironmental Safety 24:118-130
MS Thesis, Watershed ScienceProgram, Utah State University
Environmental Toxicology andChemistry 17 (8) : 1626-1632
Res-ASARCO Joint Ventureproject file
Archives of EnvironmentalContamination and Toxicology23:109-116
Environmental Toxicology andChemistry 16 (2) : 317-327
U.S. Geological Survey, Water-Resources InvestigationsReport 88-4118
USGS Open-File Report 91-506(Contaminants database #4011)
r 3£iv,; '" Keywords U*^flzpt%?v1-',:-. ... -. --;',-W ".t-.i-: :--.!---. - ;?."*•••Metals, Molybdenum, Copper,Animal Nutrition
Hanford Site, Washington,Nuclear, Cleanup
metals, mammals, toxicity,terrestrial
metals, mammals, toxicity,terrestrial
flow, water, arkansasriver, hydrology, vegetation
aquatic, fish, metals,metals uptake
Arkansas River, Toxicity,fathead minnow, fish,aquatic
Invertebrates, Aquatic,Metals, Upper MississippiRiver
invertebrates, metals,sediment, bioaccumulation,aquatic
pueblo reservoir,downstream, water quality,arkansas river, metals,phytoplankton, zooplankton
water quality, upperArkansas River, PuebloReservoir, aquatic
Page 16
Doc No.
D00098
D00529
D00099
D00517
D00593
D00419
D00616
D00590
D00437
D00409
D00518
v p; ••^^•m^mm$^T ^ Bleavy Metals in Groundwaterof ffortion of the Front RangeMineral Belt - Final CompletionReport
Defining the Limits ofRestoration: The Need forRealistic Goals
Handbook of Chemical RiskAssessment: Health Hazards toHumans, Plants, and Animals
Environmental Report for theCotter Uranium Mill, Canon City,Colorado
Characterization of Adult BrownTrout Growth and Survival in theArkansas River
Focused Feasibility Study, FormerKoppers Wood Treating Site,Salida, Colorado
Letter report on the status of thebrown trout fishery in theArkansas River in the vicinity ofaccidental CDOW rotenone fish kill
An Evaluation of Metal Standardsin the Upper Arkansas River andTheir Relationship to the Survivaland Growth of Brown Trout
Final Report, College of the Canons
Post Removal Site Control Plan,College of the Canons, Canon City,Colorado
Evaluation of the Arkansas RiverNear and Below the Cotter UraniumMill Site, Canon City, Colorado
M3$&j?eipf.k&. Author v> :-'r^-. *-•.-£$
Edwards, K.W. and R. Klusman •
Ehrenfeld, J.G.
Eisler, R.
Ellis, D. B., and B. G.Johnson
ENSR
ENSR
ENSR Consulting andEngineering
ENSR Consulting andEngineering, for: Bradley,Campbell and Carney
ENTACT
ENTACT
EPA
JJatei
•76~
2000
2000
1977
1989
1997
1988
1989
1998
1998
1992
/ ;_•'.' •'.••'• " v v-. Reference. '•••;y^' ./;;>;Colorado State University,Fort Collins, ColoradoCompletion Report Series No.72
Restoration Ecology 8(l):2-9
Lewis Publishers pp. 1903
Nalco Environmental Sciences,Northbrook, Illinois
Res-ASARCO Joint Ventureproject file
Beazer East Inc. Doc. No.0845-036-640
Res-ASARCO Joint VentureCalifornia Gulch CERCLA SiteCentral Project File
Bradley, Campbell and Carney,Document number 1020-001, Res-ASARCO Cal Gulch CentralProject File
ENTACT
Post Removal Site Control Plan
Remedial Action Plan, Section30, Final Report
•..,. '.-•••.,.-•:-::-;•. Key-Worts: ••!'&;: \-'....,.• . ..•••— v'- • -'•- -f.-- •--•..•:'.-»,'.-fc|Heavy Metals ^^H
^riparian, restoration,goals, wetlands, ecosystemmanagement, conservation
cadmium, copper, zinc,arsenic, lead, vegetation,invertebrates, metals
Lincoln Park, Cotter Mill,arkansas river, Canon City,tailings, uranium, radon,molybdenum, radioactivity,water, ground-water, soils,biota, vegetation, birds,mammals, metals
Brown Trout, ArkansasRiver, fish, aquatic
smeltertown, koppers,metals, downstream,arkansas river,remediation, metals, woodtreatment
fish, Arkansas River,rotenone, trout, aquatic
Metals, Brown Trout, UpperArkansas River, fish
college of the canons,arkansas river, downstream,metals, smelter,remediation, soils, air.
College of the Canons,remediation, downstream,arkansas river, minetailings
Lincoln Park, Cotter Mill,arkansas river, Canon City,water, sediment, biota,fish, birds,microinvertebrates ,mammals.
Page 17
-Doc No/
D00519
D00564
D00102
D00103
D00104
D00105
D00106
D00421
D00448 .
D00341
D00107
•^i^^mfim^^i^^^Evaluation of the Willow LakesNear the Cotter Uranium Mill Site,Canon City, Colorado
St . Kevin Gulch : Letter fromUSGS to USFWS Re: invertebrate &cowpie metal concentrations
Analytical Results for SedgeSamples Collected on the WetlandReceiving Acid Mine DrainageWaters from St. Kevin Gulch,Leadville, Colorado
Status Report on a Study of theEffects of Acid Mine Drainage onVegetation Near Leadville,Colorado. In: U.S. GeologicalSurvey, Toxic Substances HydrologyProgram- -Proceedings of theTechnical Meeting, Phoenix,Arizona, September 26-30, 1988
The Interactions of Water Hardnessand pH with the Acute Toxicity ofZinc to the Brown Trout, Salmotrutta
Physiological Changes and TissueMetal Accumulation in RainbowTrout Exposed to Foodborne andWaterborne Metals
The Effects of Low pH and ElevatedAluminum on Yellowstone CutthroatTrout (Oncorhynchus clarkiDouvieri)
Dietary Effects of Metals-Contaminated Invertebrates fromthe Coeur d'Alene River, Idaho, onCutthroat Trout
The Physiological Impairment ofFree -rang ing Brown Trout Exposedto Metals in the Clark Fork River,Montana
Fish Communities as Indicators ofEnvironmental Degradation
Geochemical Classification of MineDrainages and Natural Drainages inMineralized Areas
£g?3£f*J± W -Authoc'fe& i'xi ; ;;r-Sf.1.- tts/'-Ajj v,i_ " • ;-• •.-!'-??: .C' :'; ' ••*: •"•--- vs* &EPA
Erickson, B.
Erickson, B. M., p. H,Briggs, K. R. Kennedy and T.R. Peacock
Erickson, B.M.
Everall, N.C., N.A.A.MacFarlane and R.W. Sedgwick
Farag, A.M., C.J. Boese, D.F. Woodward, and H.L. Bergman
Farag, A.M., D.F. Woodward,E.E. Little, B. Steadman andF.A. Vertucci
Farag, A.M., D.F. Woodward,W. Brumbaugh, J.N. Goldstein,E. MacConnell, C. Hogstrand,and F.T. Barrows
Farag, A.M., M.A. Stansbury,C. Hogstrand, E. MacConnell,and H.L. Bergman
Fausch, K.D., J. Lyons, J.R.Karr, and P.L. Angermeier
Ficklin, W. H., G. S.Plumlee, K. S. Smith and J.B . McHugh
:'Date'~'•* ::•;.>. T"1993
1991
1991
1988
1989
1994
1993
1999
1995
1990
1992
vni-'K .- .:' 'jRstetBhce>?. ->--'-:.\.>;:.v:
Remedial Action Plan, Section26, Final Report
Letter from USGS to USFWS
U. S. Geological Survey,Denver Federal Center,Denver, Colorado, Open-FileReport 91-126
U. S. Geological Survey,Hater ResourcesInvestigations Report 88-4220
Journal of Fish Biology 35:27-36
Environmental Toxicology andChemistry 13(121:2021-2029
Environmental Toxicology andChemistry 12:719-731
Transactions of the AmericanFisheries Society 128: 578-592
Canadian Journal of Fisheriesand Aquatic Science 52: 2038-2050
American Fisheries SocietySymposium 8:123-144
Water Rock Interaction,Kharaka and Maest (eds) ,Balkema, Rotterdam. ISBN 905410 0753
???£ •? ; y»Woras>x ? i ,:?5
Lincoln Park, Cotter Mill,arkansas river, Canon City,water, sediment, algae,fish, microinvertebrates,
St. kevin gulch,invertebrates, terrestrial,metals
Wetland/Riparian, Metals,Plants, Vegetation, UpperArkansas River Basin, St.Kevin Gulch, Leadville,Colorado, Acid MineDrainage, aquatic
Vegetation, Acid MineDrainage, Leadville,Colorado, St. Kevin Gulch,terrestrial
Fish, trout, zinc, pH,water hardness, metals,aquatic
Fish, Metals, Trout,Effects, Physiology, aquatic
Fish, Trout, Cutthroat, pHEffects, aquatic
fish, coeur d'alene, idaho,invertebrates, trout,metals, aquatic
clark fork, metals,aquatic, water quality,fish, metallothionein,tissue residues
Fish, Communities,Indicators, EnvironmentalDegradation, aquatic
Geochemistry, Acid MineDrainage, metals, pH
Page 18
Doc No. -
D00108
D00109
D00456
D00569
D00110
D00452
D00111
D00113
D00169
D00521
D00114
D00115
- : Bfc !-v:;: .T™M" v:;;v> r &•'•Fr^^^Ban-Arkansas Studies. In:CoSlRlo Fisheries ResearchReview, 1972
Coldwater Reservoir and High LakesStudies
Revegetation of Fluvial TailingDeposits on the Arkansas Rivernear Leadville, Colorado
Interactive Effects of SoilAmendments and Depth ofIncorporation on Geyer Willow
Landscape Geochemistry: Retrospectand Prospect - 1990
Aspects of Leadville Area MineDrainage Affecting the UpperArkansas River
Molybdenum - A ToxicologicalAppraisal
Bioavailability of Metal Mixturesin Natural and Synthetic Sediments
Ingestion of Soil by hispid CottonRats, White-Footed Mice, andEastern Chipmunks
Cotter Corporation Uranium MillSite
Water Quality of Impoundments onSurface-Mined Sites
Gaining Perspective on AquaticHabitat Restoration
'•' •-"•:- .. - ;v,'-.~. 'Author-Vv--- -•'.-.. ;;•' - ..-•••:'-• •-•-' • •-. . •---. • ,-. ••-•--.•. -
Finnell, L.M. J
Finnell, L.M. and G.L. Bennett
Fisher, K.T.
Fisher, K.T., J.E. Brummer,W.C. Leininger, and D.M. Heil
Fortescue, J.A.C.
Frank, W.
Friberg, L. , p. Boston, G.Nordberg, M. Piscator and K.-H. Robert
Frugie, M.
Garten, C.T.
Geotrans, Inc., RockyMountain Consultants, Inc.,and ERI Logan, Inc.
Gilley, J. E., G. W. Gee, A.Bauer, W.O. Willis, and R.A.Young
Gillian, S.
Jgtev
P-
1975
1999
2000
1992
1980
1975
1995
1980
1986
1976
1995
•:'-:•: Av;; :j Reference-. V:'~ 'v /jv:--.:
Colorado Division of Game,Fish and Parks, ColoradoFisheries Research Review,1972, Review No. 7, FisheriesResearch Section
In: Colorado FisheriesResearch Review 1972-1975.Colorado Division ofWildlife, Review No. 8,Fisheries Research Section
M.S. Thesis, Colorado StateUniversity
Journal of EnvironmentalQuality 29 (6) : 1786-1793
Applied Geochemistry 7:1-52
report obtained from E . Seppi
4 01, Stockholm 60, Sweden,EPA-60011-75-004, ContractNo. 68-024210
Colorado State University,Fishery and Wildlife BiologyDepartment, Fort Collins,Colorado, Master's Thesis
Journal of Mammalogy61(1) :136-137
Remedial Investigation forThe State of ColoradoDepartment of Law Office ofthe Attorney General
North Dakota Farm Research34(2)
Land and Water Sept/Oct: 30-33
••!:• --:' ' - '- .-KW Words; v ; ••,•• ... \-, \Aquatic Biota, Fryingpan-^BBArkansas Project, Arkansal^BRiver, Colorado, HunterCreek
CDOW-Fish, aquatic,Arkansas River
revegetation, arkansasriver, tailings, willows,fluvial, soils, amendments,metals, phytotoxic
upper arkansas,terrestrial, restoration,remediation, willows,vegetation, 11-mile reach,tailings, fluvial, riparian
Geochemistry
history, arkansas river,water quality, Californiagulch, metals
Metals, Molybdenum,Toxicology
Sediments, Bioavailability,Metals, Invertebrates,Arkansas River, CaliforniaGulch, Leadville, Colorado
hispid cotton rats, white-footed mice, soil,ingestion, mammals,terrestrial
Lincoln Park, Cotter Mill,arkansas river, Canon City,tailings, uranium, radon,molybdenum, radioactivity,water, ground-water, soils,biota, vegetation, birds,mammals
Water Quality, soils, mining
Restoration, Aquatic Habitat
Page 19
. Doc No.
D00531
D00116
D00117
D00118
D00119
D00349
D00120
D00121
D00122
D00123
D00275
D00124
:•_, :,;V; - t^ttg^T$^j^fy:fe-^. £>i
Letter regarding results fromBreeding Bird Surveys in the UpperArkansas Basin
Colorado Trout
Status and Management of InteriorStocks of Cutthroat Trout
Factors Affecting mercuryAccumulation in Fish I the UpperMichigan Peninsula
Summary: Developing a Biotic Indexfor Colorado Stream Quality
Automated Global PositioningSystem Charting of EnvironmentalAttributes: A Limnologic Study
Environmental Zinc and CadmiumPollution Associated withGeneralized Osteochondrosis,Osteoporosis, and Nephrocalcinosisin Horses
Effects of Municipal Sludge onLocomotor Activity and ExploratoryBehavior of Meadow Voles (Microtuspennsylvanicus)
Zinc
Safety Assessment of SelectedInorganic Elements to Fry ofChinook Salmon (Oncorhynchustshawytscha
Wetlands Ecosystems: Natural WaterPurifiers?
The Interactions Between theSurface of Rainbow Trout,Oncorhynchus mykiss, andWaterborne Metal Toxicants
g] :tfe :. :A hpr ;; ?-*if6f ::
Gillihan, S.
Greene, W.
Gresswell, R.E., Editor
Grieb, T.M., C.T. Driscoll,S.P. Glos, C.L. Schofield,G.L. Bowie and D.B. Porcella
Grotheer, S.A.
Gubala, C.P., C. Branch, N.Roundy, D. Landers
Gunson, D., D. Kowalczyk, C.Shoop and C. Ramberg
Hall, A., D. Taylor and P.Woods
Hambridge, M., C. Casey andN. Krebs
Hamilton, S.J. and K.J. Buhl
Hammer, D.A. and R.K. Bastian
Handy, R. and F. Eddy
ViDafe;i
1995
1937
1988
1990
1995
1994
1982
1990
1986
1990
1989
1990
' V ^ f ferehcie? '-;"-- ^ ^letter to FWS
Colorado Museum of NaturalHistory. Popular Series No. 2.
American Fisheries SocietySymposium 4
Environmental Toxicology andChemistry 9:919-930
Colorado State University, CEResource Center, Summary ofCWRRI Completion Report No.187, Fort Collins, Colorado
The Science of the TotalEnvironment 148:83-92
Journal of AmericanVeterinary MedicalAssociation 180:295-299
Environmental Toxicology andChemistry 9:31-36
In: Trace Elements in Humanand Animal Nutrition, Ed. 5.Vol. 2 Academic Press, Inc.,Orlando, Florida. 499 pp.
Ecotoxicology andEnvironmental Safety 20: 307-324
In Constructed Wetlands forWaste Water Treatment:Municipal, Industrial andAgricultural, edited by D.Hammer: 5-19
Functional Ecology 4:385-392
y*-f:2::^^Wott?^£¥abirds, upper arkansas,riparian,
Fish, aquatic, trout
Fish, Trout, Cutthroat,aquatic
Fish, Metals, Mercury,Acclimation, aquatic,Michigan, pH
Aquatic Biota, WaterQuality, Bio-Monitoring,Colorado, Cache La PoudreRiver
Global Positioning System,Limnology, GPS
Mammals, zinc, cadmium,metals, Osteochondrosis,osteoporosis
Mammals, sludge, heavymetals, voles, copper,cadmium, lead, zinc
Mammals, zinc, metals
Fish, Metals, Salmon,Effects, Toxicity, aquatic
wetlands, metals, aquatic
Fish, trout, metals,toxicity, zinc, aquatic
Page 20
Doc No.-
D00359
D00125
D00127
D00128
D00332
D00602
D00129
D00474
D00603
D00130
D00523
D00132
••' fc .V:.: - :-W™!?' : : "';'•' ••'••J;^;:':":V:>Su ^ B of the Hanford SiteEnv?Bromental Report for CalendarYear 1994
The Erosion Control Letters: Weare What We Teach
Lead in Mule Deer Forage in RockyMountain National Park, Colorado
Metal Contamination in Liver andMuscle of Northern Pike (EsoxLucius) and White Sucker(Catostomus comraersoni) and inSediments from Lakes Near theSmelter at Flin Flon, Manitoba
Dietary Exposure of Mink to Carpfrom Saginaw Bay, Michigan. 1.Effects on Reproduction andSurvival, and the Potential Risksto Wild Mink Populations.
Heavy metal accumulation in smallmammals following sewage sludgeapplication to forests
Altered Avoidance Behavior ofYoung Black Ducks Fed Cadmium
Mining in Colorado: A History ofDiscovery, Development, andProduction (Section on Lake Countyonly)
Modelling and monitoringorganochlorine and heavy metalaccumulation in soils, earthworms,and shrews in Rhine-Deltaf loodplains
Lead in Hawks, Falcons and OwlsDownstream from a Mining Site onthe Coeur D'Alene River, Idaho
Restoration Ecology of RiverineWetlands: I. A Scientific Basis
Effects of Impoundment on Waterand Sediment in the Arkansas Riverat Pueblo Reservoir
,;•;', ."y*:. ';v<.; : .AllthOr ; -"il; '-rJi-.. :.:.-'~ ''-' .
Hanf, R.W., R.E. Schrempf, fand R.L. Dirkes
Harding, M.V.
Harrison, P. and M. Dyer
Harrison, S. E. and J. F.Klaverkamp
Heaton, S.N., S.J. Bursian,J.P. Giesy, D.E. Tillitt,J.A. Render, P.O. Jones, D.A.Verbrugge, T.J. Kubiak, R.J.Aulerich
Hegstrom, L. J. and S. D. West
Heinz, G., S. Haseltine andL. Sileo
Henderson, C.W.
Hendriks, A.J., W.-C. Ma,J.J. Brouns, E.M. de Ruiter-Dijkman and R. Cast
Henny, C.J., L.J. Blus, D.J.Hoffman and R.A. Grove
Henry, C.P. and C. Amoros
Herrmann, S. J. and K. I Mahan
Jjate
w1995
1984
1990
1995
1989
1983
1926
1995
1994
1995
1977
'•' ':. ' '.' , y :•;, '"Jtefereijce ' vv .'/
U.S. Department of Energyunder Contract DE-AC06-76RLO1830, Pacific NorthwestLaboratory, Richland,Washington
Land and WaterSeptember/October : 9-10
Journal of WildlifeManagement, 48:510-517
Environmental Toxicology andChemistry 9:941-956
Archives of EnvironmentalContamination and Toxicology28:334-343
Journal of EnvironmentalQuality 18:345-349
Environmental Toxicology andChemistry 2:419-421
U.S. Geological Survey,Professional Paper 138
Archives of EnvironmentalContamination and Toxicology29:115-127
Environmental Monitoring andAssessment 29: 267-288
Environmental Management19(6) :891-902.
CJ. S. Bureau of Reclamation,Lower Missouri Region,Fryingpan-Arkansas Project,Colorado
... > - -.:-;;>p > .Keywords:, % ; >> J
Hanford Site, Washington , BNuclear, Cleanup ^^1
Streambank Erosion
Mammals, lead, metals,terrestrial
Fish, Metals, Sediments,Smelters, deposition
Carp, Mink, Michigan,Reproduction, Survival,Diet, PCBs
metals, mammals, terrestrial
Birds, cadmium, metals
arkansas river, lakecounty, mining history,mining, production,development, placer,hydraulic
metals, mammals,invertebrates, terrestrial
Birds, Raptors, Mining,Metals, Lead, Coeur D'AleneRiver, Idaho, terrestrial
restoration, river,wetlands, stream, monitoring
Sediments, aquatic,Arkansas River, Pueblo River
Page 21
=-D6c No.D00051
D00133
D00623
D00134
D00135
D00136
D00137
D00138
D00581
D00139
D00571
D00140
•;•,;+ >;*l^Z-&:jm^*'-:&':^ff ?;-<•£.. .-•••'.; •••-•t"J\?:i----.vt!;>:..5--.'?-:"..'i-w--":- "vv«-- £$".-<x*"&Nutrient Uptake and CommunityMetabolism in Streams DrainingHarvested and Old GrowthWatersheds: A PreliminaryAssessment
Survival, Growth, and Accumulationof Ingested Lead in NestingAmerican Kestrels (Falcosparverius)
Accumulation of cadmium, copperand zinc in the liver of somepasserine species wintering inCentral Norway
Long-Term Effects of Lead Exposureon Three Generations of BrookTrout (Salvelinusfontinalis) (cover page only)
An Investigation of Trout andBenthic Macro invertebratePopulations in the Mainstem ofChalk Creek, Chaffee County,Colorado
The Use of Automatically CollectedPoint Samples to EstimateSuspended Sediment and AssociatedTrace Element Concentrations forDetermining Annual Mass Transport
Cross-sectional Variability inSuspended Sediment and AssociatedTrace Element Concentration inSelected Rivers in the US
Variation in Suspended Sedimentand Associated Trace ElementConcentrations in SelectedRiverine Cross Sections
Variations in Suspended Sedimentand Associated Trace ElementConcentrations in SelectedRiverine Cross Sections
Copper Lethality to Rainbow Troutin Waters of Various Hardness andPH
Photochemical and Seasonal Cyclingof Manganese in Lake Fork
Use of Watershed Characteristicsto Select Control Streams forEstimating Effects of Metal MiningWastes on Extensively DisturbedStreams
Hill, B.H., F.H. McCormick
Hoffman, D., J. Franson, O.Pattee, C. Bunck and A.Anderson
Hogstad, 0.
Holcombe, G. W., D. A.Benoit, E. N. Leonard, and J.M . McKim
Horn, B.J.
Horowitz, A. J., K. A.Elrick, P. B. Von Guerard, N.0. Young, G. R. Buell and T.L. Miller
Horowitz, A.J., F.A. Rinella,P. Lamothe, T.L. Miller, T.K.Edwards, R.L. Roche and D.A.Rickert
Horowitz, A.J., F.A. Rinella,P. Lamothe, T.L. Miller, T.K.Edwards, R.L. Roche and D.A.Rickert
Horowitz, A.J., F.A. Rinella,P. Lamothe, T.L. Miller, T.K.Edwards, R.L. Roche, D.A.Rickert
Howarth, R. S. and J. B.Sprague
Hrncir, D. and D. McKnight
Hughes, Robert M.
i-jDate2000
1985
1996
1976
1993
1992
1989
1990
1990
1978
2000
1985
••^ ?:^fc #$^fc?^£%j$££&Hill and McCormick, ResearchEcologists, U.S. EPA,National Exposure ResearchLaboratory, EcologicalExposure Research Division,Cincinnati, OH
Comprehensive Biochemistryand Physiology, 80C:431-439
The Science of the TotalEnvironment 183:187-194
Journal of Fish ResourcesBoard Can. 33: 1731-1741
Colorado Division ofWildlife, 1993
Erosion and SedimentTransport MonitoringProgrammes in River Basins(Proceedings of the OsloSymposium, August 1992) IAHSPubl. No. 210, 1992
Sediment and the Environment(Proceedings of the BaltimoreSymposium, May 1989) , IAHSPubl. No. 18: 1989
Environmental Science andTechnology 24(91:1313-1320
Environmental Science &Technology 24(91:1313-1320
Water Research, 12:455-462
NCERQA Grant Annual Report
Environmental Management9(3) :253-262
nutrient uptake, streams,water, metabolism, aquatic
Birds, lead, metals,kestrels
heavy metals, liver,cadmium, zinc, copper,pollution, passerines, parus
Fish, Metals, Trout, Lead,aquatic
Aquatic Biota, Trout,Invertebrates, Chalk Creek,Colorado
Metals, Transport, Sediments
Metals, Transport,Sediments, U. S. Rivers
Metals, Transport,Sediments, U.S. Rivers
sediment, trace elementconcentrations
Fish, Metals, Trout,Copper, aquatic
upper arkansas, lake fork,metals, water, aquatic
Metals, Impacts, StudyTechniques, Mining,Watershed, aquatic
Page 22
Doc No,
D00041
D00141
D00142
D00143
D00457
D00549
D00626
D00144
D00543
D00145
D00146
D00147
•Vilfct.:. fiV: Title r:-.-.-V:>; ':->--•- ^^m-"--. .',-- '•":•---.• --.;..-; "--•--• -:;".
Fo ^ H in Relationships of Copperand^Hamium in ContaminatedGrassland Ecosystems
Review of the EPA California GulchPhase I Remedial InvestigationReport
Testing Sediment Toxicity withHyalella azteca (Amphipoda) andChironomus riparius (Dipter)
Bioaccumulation of Metals byHyalella azteca Exposed toContaminated Sediments from theUpper Clark Fork River, Montana
Fluvial Geomorphologic Assessmentof Upper Arkansas River: FinalReport
On the Need to Select an Ecosystemof Reference, However Imperfect:A Reply to Pickett & Parker
Linkage of Effects to TissueResidues: Development of aComprehensive Database for AquaticOrganisms Exposed to Inorganic andOrganic Chemicals (Andrew has)
Biological Monitoring of ToxicTrace Elements
Lead Exposure in PasserinesInhabiting Lead-ContaminatedFloodplains in the Coeur D'AleneRiver Basin, Idaho, USA
Report of Explorations in Coloradoand Utah During the Summer of1889, with an Account of theFishes Found in Each of the RiverBasins Examined
Trace Elements in Soils and Plants
Development of High Mountain PlantCommunities as Wetland MitigationSystems for Copper Mine Effluent -Project End Report
••. . -,-v .: -Authoivr. - •--"•;.' --• --••-•••--• .•-•.- :•-..':• -•••-•• -'•' •--'-• ":
Hunter, B.A. and M.S. Johnson j
Hydrometrics, Inc.
Ingersoll, C. G. and M. K.Nelson
Ingersoll, Chris G., WilliamG. Brumbaugh, F. James Swyer,Nile E. Kemble
Inter-Fluve, Inc. and FLOEngineering, Inc
J. Aronson, S. Dhillion, E.Le Floc'h
Jarvinen, A.W., G.T. Ankley
Jenkins, Dale W.
•jf£
W1987
1990
1994
1999
1995
1999
1981
Johnson, G.D., D.J. Audet,J.W. Kern, L.J. LeCaptain, M.D. Strickland, D.J. Hoffman,and L.L. McDonald
Jordan, D.S.
Kabata-Pendias, A. and H.Pendias
Kastning-Culp, Larry DeBreyand J. Lockwood
1999
1889
1984
1993
.-:---i:.' ::?':. /; Reference-; •. .' ..:J-Oikos 38:108-117
Counsel for Defendants inCivil Action No. 86-C-1675
American Society for Testingand Materials, Philadelphia,PA, Standard TechnicalPublication 1096 - 1990
Environmental Toxicology andChemistry 13 (12) :2013-2020
Prepared for URS OperatingServices, Inc.
Restoration Ecology 3(1): 1-3
SETAC technical publicationsseries
U. S. EnvironmentalProtection Agency,Environmental MonitoringSystems Laboratory, LasVegas, NV, Research andDevelopment, EPA-600/S3-80-
Environmental Toxicology andChemistry 18 (6) : 1190-1194
United States FishCommission, Vol. IX,Washington GovernmentPrinting Office 1891
CRC Press, New York, NewYork, 278 pp.
University of Wyoming,Department of Plant, Soil andInsect Sciences 4 June, 1993
:c..:7.: --••- -:: Keywords : "^r--' ^grasslands, copper, ^^Bcadmium, metals, mammals, Minvertebrates
RI/FS, California Gulch
Invertebrates, sediment,metals
Sediments, Bioaccumulation,Invertebrates, Upper ClarkFork River, Montana, fish,aquatic, metals
arkansas river, flows,hydrology, geomorphology,11-mile reach, OU-11,sediments
reference, restoration,monitoring.
tissues, aquatic organisms,chemicals, water quality,bioaccumulation
Metals, Bio-Monitoring
metals, birds, floodplain,lead, American robin, Songsparrow, idaho
Fish, Colorado, aquatic
Vegetation
Wetland/Riparian, Plants,Bioaccumulation, LittleSnake River, Wyoming, Metals
Page 23
Doc Na '
D00481
D00148
D00354
D00149
D00150
D00151
D00554
D00152
D00516
D00153
D00154
D00155
: : • ? 1° /" 'K ff v^ vr." *-Cadmium Accumulation and ProteinBinding Patterns in Tissues of theRainbow Trout, Salmo gairdneri
High Plains Reclamation andRestoration at Black Thunder Mine
Upper Arkansas River ResearchProjects: A Compilation ofSummaries Presented to the UpperArkansas River Research Workshop
Toxicity of Metal-ContaminatedSediments from the Upper ClarkFork River, Montana, to AquaticInvertebrates and Fish inLaboratory Exposures
Effects of Chronic Lead Ingestionon Reproductive Characteristics ofRinged Turtle Doves (Streptopeliarisoria) and Tissue LeadConcentrations Adults and TheirProgeny
Identification of Heavy metalConcentrations in Surface WatersThrough Coupling of GIS andHydrochemical Models
Effects of Heavy Metals on aMacroinvertebrate Assemblage froma Rocky Mountain Stream inExperimental Microcosms
Bioaccumulation of Heavy Metals byBenthic Invertebrates at theArkansas River, Colorado
Effects of Metals on StreamMacroinvertebrate Assemblages fromDifferent AltitudesUpper Arkansas River Surface-waterToxics Projects, Selected ExcerptsFrom: Physical, Chemical, andBiological Processes in WatersAffected by Acid Mine Drainage:From Headwater Streams toDownstream Reservoirs
Metal Partitioning andPhotoreduction of Iron inFiltrates of Acid Streamwater, St.Kevin Gulch, CO
Effects of Colloids on MetalTransport in a River ReceivingAcid Mine Drainage, Upper ArkansasRiver, Colorado, U.S. A. In: MetalTransport in an Acid Mine ImpactedRIWM^^
'&*^?t&^$^0£^&'^:y-ps+-'Kay, J., D.G. Thomas, M.W.Brown, A. Cryer, D. Shurben,J.F. Solbe, and J.S. Garvey
Keammerer, W. R. and R.L.Moore , Jr .
Keidel, J.
Kemble, N.E., W.G. Brumbaugh,E.L. Brunson, F.J. Dwyer,C.G. Ingersoll, D.P. Mondanand D . F . Woodward
Kendall, R. and P. Scanlon
Kern, T. J. and J. D. Stednick
Kiffney, P.J. and W.H.Clements
Kiffney, P.M. and W.H.Clements
Kiffney, P.M. and W.H.Clements
Kimball, B.A.
Kimball, B.A. and D.M.McKnight
Kimball, B.A., E. Callenderand E.V. Axtmann
,
ifrDate :1986
1995
1995
1994
1981
1993
1994
1993
1996
1991
1988
1995
m^
^ - /r fRetei c iT yV'- ..*:.;
Environmental HealthPerspectives 65: 133-139
Land and WaterSeptember/October, 1995
Upper Arkansas River ResearchWorkshop April 17 & 18, CanonCity, Colorado
Environmental Toxicology andChemistry, Vol 13, No. 12,pp. 1985-1997, 1994, 0730-7268 (94) 00147-2
Environmental Pollution(Series A) 26:203-213
Proceedings of the ViennaConference, April 1993, IAHSPub. 50, 211, 1993.
Journal of the North AmericanBenthological Society 13(4):511-523
Environmental Toxicology andChemistry 12:1507-1517
Ecological Applications6(2) :472-481
U. S. Geological Survey,Upper Arkansas River Surface-water Toxics Projects
U. S. Geological Survey,Water ResourcesInvestigations Report 88-4220
Applied Geochemistry 10:285-305
*•'•. ~.&j ; i* i Keyr Woijais' Wf Fn.r.5-1.-.---.: ,••:-/; ;r."r- :;';-.;:;;••:• •ST'-fe-VS? !'.'fish, cadmium, aquatic,protein binding, trout,metals
Restoration, Reclamation,Mining
Upper Arkansas River
Invertebrates, Aquatic,Metals, Sediments, Montana,Upper Clark Fork River, Fish
Birds, lead, metals
Water Quality, Modeling,Upper Arkansas River,Colorado, aquatic, metals
aquatic, invertebrates,metals, communitystructure, upper arkansas,biomonitoring
Invertebrates, Aquatic,Metals, Arkansas River,Colorado, bioaccumulation
arkansas river, metals,invertebrates, streams,aquaticMetals, Transport, UpperArkansas River Basin, AcidMine Drainage, St. KevinGulch, Colorado
Metals, Transport, AcidMine Drainage, Leadville,Colorado, St. Kevin Gulch
Metals, Transport, AcidMine Drainage, UpperArkansas River, Colorado
^Page 24
Doc No;
D00157
D00158
D00348
D00527
D00524
D00485
D00160
D00246
D00052
D00340
D00477
..; •vor;:£S!v;:Tlt!«j. -:\:';/-;;. v£::-;;VvIn HBm Chemical Reactions ofAc^^wlne Water Entering a NeutralStream Near Leadville, Colorado
Research on Metals in Acid MineDrainage in the Leadville ColoradoArea
CNHP Memorandum RE: PublishingSub-committee Meeting Minutes, andResults
Montane Riparian Vegetation inRelation to Elevation andGeomorphology Along the Cache laPoudre River, Colorado (ThesisAbstract Only)
Five Elements for EffectiveEvaluation of Stream Restoration
The Effects of Natural Exposure toHigh Levels of Zinc and Cadmium inthe Immature Pony as a Function ofAge
Bibliography of Selected water-Resources Information for theArkansas River Basin in ColoradoThrough 1985
Assessment of Heavy MetalsPollution in the Upper ArkansasRiver of Colorado
Estimating the Number of Animalsin Wildlife Populations
Geosynthetically ReinforcedVegetation: A Soft ArmorAlternative to Riprap
Gold Mining Effects on HeavyMetals in Streams, CircleQuadrangle, Alaska
!v- ,•";:" /-V/v ••Airthor -;.'•;• ; Vv- ,:L "•Kimball, B.A., G.A. Wetherbeel
Kimball, B.A., K.E. Bencala,D.M. McKnight
Kittel, G.M.
Kittel, G.M.
Kondolf, G.M.
Kowalczyk, D.F., D.E. Gunson,C. R. Shoop, and C.F. RambergJr.
Kuzmiak, J.M. and H.H.Strickland
LaBounty, J.F., J.J.Sartoris, L.S. Klein, E.F.Monk and H.A. Salman
Lancia, R.A., J.D. Nichols,and K.H. Pollock
Langford, R.
LaPerriere, J.D., S.M.Wagener, and D.M. Bjerklie
Jater
Hfi~
1989
1996
1994
1995
1986
1994
1975
1994
1996
1985
; '•<.'"^-} "^Reference A .'.- \-'~''^"-i
U.S. Geological Survey ToxicSubstances Hydrology Program- -Proceedings of the TechnicalMeeting, Phoenix, Arizona,September 26-30. WaterInvestigations Report 88-4220
U.S. Geological Survey ToxicSubstances Hydrology Program- -Proceedings of the TechnicalMeeting, Phoenix, Arizona,September 26-30, WaterInvestigations Report 88-4220
Colorado Natural HeritageProgram 4/15/96
Unpublished Thesis,University of Wyoming,Laramie, WY.
Restoration Ecology 3(2):133-136.
Environmental Research 40:285-300
U. S. Geological Survey incooperation with theSoutheastern Colorado WaterConservancy District, Denver,Colorado, Open-File Report 94-331
U. S. Bureau of Reclamation,Engineering and ResearchCenter, Denver, CO, ERC-75-5
In: T.A. Bookhout, ed.Research and managementtechniques for wildlife andhbitats. Fifth ed. TheWildlife Society, Bethesda,Md.
Land and Water July/August1996
Hater Resources Bulletin21(2) : 245-252
, v; .; v /,:Key Wordsr ; y-' J
Metals, Transport, Acid ^^HMine Drainage, Water ^^BQuality, Leadville,Colorado, St. Kevin Gulch,Upper Arkansas River
Metals, Transport, UpperArkansas River, Leadville,Colorado
Riparian Task Force,Publishing Sub-committee,Riparian Booklet
riparian, habitat,vegetation, river,elevational gradient
restoration, stream, river,monitoring.
terrestrial, horse, metals,smelter, plants, lameness,tissues, trace elementnutrition, osteochondrosis,mammals
Bibliography, ArkansasRiver Basin
Heavy Metals, contaminants,Upper Arkansas River,Colorado
terrestrial wildlife,populations
Geosynthetic, Vegetation,Riprap, terrestrial
placer mining, waterquality, metals, aquatic,stream, alaska
Page 25
:,D6cNp4-
D00163
D00614
D00164
D00165
D00591
D00168
D00166
D00535
D00412
D00167
D00496
D00499
•-..-." ••i'---,'p.;-3.-':s!W-'.::?rT|»|a'.-'i-~: nV*?i.l- «>.. •':.;.";:!:.: ;.-*,;;5;:;-,jLl :€?;"? T 'M--.:--:- ££?Relationships Among Observed MetalConcentrations, Criteria, andBenthic Community StructuralResponses in 15 Streams
Copper, Zinc, and CadmiumConcentrations in Peromyscusraaniculatus Samples Near anAbandoned Copper MineClear Creek Basin: The Effects ofMining on Water Quality and theAquatic Ecosystem
Heavy Metal Contamination in Soilsand Plant Species of the ArkansasValley Near Leadville, Colorado
Distribution and Partitioning ofTrace metals in Contaminated SoilsNear Leadville, CO
Heavy Metal Contamination in Soilsand Plant Species of the ArkansasValley Near Leadville, Colorado
Aquatic Inhabitants of a MineWaste Stream in Arizona
How Does Streamflow Affect Metalsin the Upper Arkansas River?
Physical, Chemical, and BiologicalCharacteristics of PuebloReservoir, Colorado, 1985-1989
An Evaluation of Mining RelatedMetals Pollution in the UpperArkansas River Basin (Abstract)
Modelling Growth Responses ofRainbow Trout Fry as a Function ofTissue Copper Concentration andExposure Duration
Impacts of Smelter Emissions onVegetation - The Identification ofCausal Mechanisms
\ sft'. i' -A'' t bpr l&r -?^f-LaPoint, T. W., S. M.Melancon, M. K. Morris
Laurinolli, M., and L.I.Bendell- Young
Lehnertz, C.S.
Levy, D.B.
Levy, D.B., K.A. Barbarick,E.G. Siemer, and L.E. Sommers
Levy, D.B., K.A. Barbarick,E.G. Siemer, L.E. Sommers
Lewis, M.
Lewis, M.E. and M.L. Clark
Lewis , M.E. and P . Edelmarvn
Lewis, W.
Lipton, J., J. Marr, D.Cacela, J. Hansen, and H.L.Bergman
Lipton, J., K. Le Jeune, D.Cacela, H. Galbraith, T.Podrabsky
"jDatiL-i
1984
1996
1991
1990
1992
1989
1977
1997
1994
1987
1995
1995
^ ••5 - •"References ^ s -VJ'.-"'-•< --. ~:. "1" -.-'.^~ ' -''-JO . • ••".«.t->,--.;.\ -•''..-•. "-
Journal WPCF, 56 (9) :1030-1038
Archives of EnvironmentalContamination and Toxicology.30:481-486.
Colorado Division ofWildlife, March, 1991
Colorado State University,Fort Collins, Colorado, M. S.Thesis
Journal of EnvironmentalQuality 21(2)
Colorado State UniversityDepartment of AgronomyTechnical Report TR89-7
USDA Forest Service, RockyMountain Forest and RangeExperiment Station, ResearchNote, RM-849
USGS Fact Sheet FS-226-96
U.S. Geological Survey, Water-Resources InvestigationsReport 94-4097
Colorado School of Mines,Golden, Colorado. M.S. ThesisT-3442
presented at the AnnualMeeting of Society ofEnvironmental Toxicology andChemistry
presented at the AnnualMeeting of Society ofEnvironmental Toxicology andChemistry
.-oSW '; Ke WoiSds s ;;; :i>;"-•Xk:-'. ..-•rtrj-Ai-.f/i— ; .XLj rS'-.-f <<.•;-:.••*Invertebrates, Aquatic,Metals, Criteria
metals, mines, mammals,terrestrial
Aquatic Biota, WaterQuality, Heavy Metals,Mining, Clear Creek,Colorado
Soils, aquatic, metals,vegetation, Leadville,Arkansas River, CaliforniaGulchMetals, Leadville, Soils,California Gulch,terrestrial
Soils, aquatic, metals,vegetation, Leadville,Arkansas River, CaliforniaGulchAquatic Biota, WaterQuality, mine waste
upper arkansas, metals,water, flow, water quality,arkansas river, downstream,aquaticpueblo reservoir,downstream, arkansas river,water quality, sediment,metals, phytoplankton
Heavy Metals, mining, UpperArkansas River
fish, copper, trout,aquatic, tissue, toxicity,growth, metals
smelter, emissions,vegetation, soils, metals,terrestrial
Page 26
, Doc No. : -
D00565
D00174
D00267
D00606
D00604
D00605
D005B5
D00170
D00495
D00447
D00171
.. •.•-•v :-:" -' -.-. l*fr ?« - fei£frfr£I ^ Bretive Report: Surface andGr B&rfater InvestigationCalifornia Gulch, Leadville,Colorado (do not have full report--only some results tables)
Summary of Metal Toxicity by Group
A brief history of the Yak Tunnel
Lead in mammals
Effect of soil pollution withmetallic lead pellets on leadbioaccumulation and organ/bodyweight alterations in small mammals
Hazardous exposure of ground-living small mammals to cadmiumand lead in contaminatedterrestrial ecosystems
Development and Evaluation ofConsensus -Based Sediment QualityGuidelines for FreshwaterEcosystems
Differences in RelativeSensitivity of Native and Metals-Acclimated Brown and Rainbow TroutExposed to Metals Representativeof the Clark Fork River, Montana
Acute Lethality andBioavailability of Copper in thePresence of Dissolved OrganicCarbon
Relative Sensitivity of Brown andRainbow Trout to Pulsed Exposuresof an Acutely Lethal Mixture ofMetals Typical of the Clark ForkRiver, Montana
Mycorrhizae: Fungal Tools forEstablishing Trees on Mined-Lands
•s,g 7 v> ,; Author; •.-;; .'.Vyp: .'•_Ljungberg, C. and M.L. Glaze M
Luckey, T.D. and B. Venugopal
Luke, J.
Ma, W
Ma, W.
Ma, W. , W. Denneman, and J.Faber
MacDonald, D.D., C.G.Ingersoll, T.A. Berger
Marr, J. C. A., H. L.Bergman, C. Hogstrand and J.Lipton
Marr, J., J. Lipton, A.Maest, D. Cacela, J.S. Meyer,J. Hansen, and H.L. Bergman
Marr, J.C., H.L. Bergman, M.Parker, J. Lipton, D. Cacela,W. Erickson, and G.R. Phillips
Marx, D.H. and C.E. Cordell
K3~
1977
1970s
1996
1989
1991
1999
1994
1995
1995
1995
•.? .'- y' ; ,: . -Reference -;-/.-•" '; V'--~-;
EPA Site ID COD-980 717-938,TDD # R8-8303-11
In Metal Toxicity in Mammals1: Physiologic and ChemicalBasis for Metal Toxicity.Plenum Press
Resurrection Mining Company,US v. ASARCO case file
Environmental Contaminants inWildlife: Interpreting TissueConcentrations. Beyer, W.N.,G.H. Heinz, and A.W. Redmon-Norwood (eds.) . pp. 281-296. SETAC SpecialPublication Series. LewisPublishers
Archives of EnvironmentalContamination and Toxicology18:617-622
Archives of EnvironmentalContamination and Toxicology20:266-270
Archives of EnvironmentalContamination and Toxicology
University of Wyoming,Department of Zoology andPhysiology, McMasterUniversity, Hamilton,Ontario, Canada andRCG/Hagler Bailly, Boulder,
presented at the AnnualMeeting of Society ofEnvironmental Toxicology andChemistry
Canadian Journal of Fisheriesand Aquatic Science 52: 2005-2015
Land and Water,July/August : 12-13
C,VV-vM.' ./Key Words .*;~.--''.-7;i|, ' •=•.-,--•, • • ; - . . ' - - • . . • ,-.---" .- H|
upper arkansas, metals, ^^Hwater, California gulch ^^W
metals, mammals, toxicity,heavy metals, terrestrial
Yak Tunnel, Leadville,mining
lead, metals, mammals
metals, bioaccumulation,mammals, terrestrial
metals, lead, cadmium,mammals, terrestrial
Sediment qualityguidelines, sediment,toxicity, metals, PAHs,PCBs, pesticides,freshwater, aquatic
Fish, Metals, Trout,Acclimation, aquatic
fish, copper, doc, aquatic,bioassay, toxicity, metals
clark fork, metals,aquatic, water quality, fish
Restoration, Mining,Mycorrhizae, fungi,terrestrial
Page 27
DpcNbftD00347
D00620
D00577
D00335
D00172
D00241
D00173
D00552
D00498
D00515
D00156
D00175
D00494
-: ^ >':" ^ Titiris 5®? >f v•? \ •• .~~ £'.":- ' •' 'V>v -*7«-~.v>> fL<'"-'"?".''--*v ::. "~":- ? '~-." r~J
Fish Kill Doesn't Sway the EPA
Tissue Residues o£ Dietary Cadmiumin Wood Ducks
Arkansas River Sediment and WaterQuality Assessment -Final Report
Hanford: Your Environment andYour Health
Behavioral Responses of LakeWhitefish (Coregonus clupeaformis)to Cadmium During Preference-Avoidance Testing
Upper Arkansas Assessment
Conceptual Model and theDevelopment of a ContaminantTransport Model for Metals inCalifornia Gulch
Responses of Diatom Communities toHeavy Metals in Streams: theInfluence of Longitudinal Variation
Use of Geochemical and ToxicityModeling to Predict Lethality ofCopper in a Metals-Impacted Stream
Analytical Results Report forFocused Site Inspection: chalkCreek Watershed, Chaffee County,Colorado
Summitville Site Water QualityCharacterization and Modeling
The Effects of Hardness,Alkalinity and pH of Test Water onthe Toxicity of Copper to RainbowTrout (Salmo gairdneri)
Faded Glory
Matthews, M.
Mayack, L.A., P.B. Bush, O.J.Fletcher, R.K. Page and T.T.Fendley
McCulley, Frick, & Oilman,Inc . for Rocky MountainConsultants
McMakin, Andrea, and MindyStrong
McNicol, R. and E. Scherer
McNicoll, C., D. Gilbert, W.Hann, L. Klock, D. Long, M.Rowan, M. Sugaski
Medine, A.J.
Medley, C.N. and W.H. Clements
Meyer, J.S., D. Beltman, A.Maest, J. Marr, J. Lipton, C.Cors, D. Cacela, and R. MacRae
Miller, J.
Miller, S.H., D.J.A. Van Zyl,McPherson, P.
Miller, T. G. and W. C. Mackay
Miniclier, K.
iVDafcr*
1996
1981
1990
1995
1991
1999
1994
1998
1995
2000
1995
1980
1996
•.; i ' y "f • ?f-^Rtt!$P&%£-¥*i&&:'£
High Country News: 4/29/96
Archives of EnvironmentalContamination and Toxicology10: 637-645
McCulley, Frick & Oilman,Inc. Boulder, Colorado
U.S. Dept . of Energy, PacificNorthwest Laboratory,Washington
Environmental Toxicology andChemistry 10:225-234
U.S. BLM, Royal GorgeResource Area, Leadville andSalida Ranger Districts Pikeand San Isabel National Forest
Cal Gulch Superfund SiteDraft Technical Memorandum
Ecological Applications8(3) :631-644
presented at the AnnualMeeting of Society ofEnvironmental Toxicology andChemistry
URS Operating Services, Inc.for U.S. EPA, CERCLIS ID #C00006875906
Colorado Geological Survey;Special Publication 38;Proceedings: SummitvilleForum '95
Water Research 14:429-433
14 April 1996, The DenverPost, Empire Magazine
^ g Ke rtf s;Fish Kill, EPA, Mining,Sediments, Toxic, ClarkFork River, Montana
Cadmium, wood ducks,tissues, metals, birds
arkansas River, waterquality, metals,contaminant, yak tunnel,aquatic
Hanford, Environment,Health, Washington
Fish, cadmium, metals,aquatic
Upper Arkansas River,watershed, fish, habitat,wildlife
Metals, Transport, UpperArkansas River Basin,California Gulch
metals, diatoms, rockymountains, water quality,benthic, longitudinalvariation, elevation,aquatic
copper, metals, aquatic,fish, toxicity
arkansas river, metals,soils, sediment, waterquality, water, ground-water
water quality, Summitville,copper, metals
Fish, Metals, Trout,Copper, pH, toxicity,alkalinity
leadville, history, mining
Page 28
-Doc-No.'-.
D00177
D00176
D00178
D00181
D001B2
D001B3
D00180
D00179
D00567
.-;; '-.:.;-c-:j :ntie/ ;-vv-,./y-:--.Ef ^ V of Metal -Mine Drainage onWa^H^uality in Selected Areas ofColorado, 1972-73
Variations in Metal Content of theKerber Creek Drainage, Colorado:An Area Affected by Mining
Final Report for Lead Slag PileRemedial Investigation at theCalifornia Gulch Site Leadville,Colorado (Administrative Order onConsent CERCLA-VII-92-06) , Volume1 of 3
Final Report for Lead Slag PileRemedial Investigation at theCalifornia Gulch Site Leadville,Colorado (Administrative Order onConsent CERCLA-VII-92-06), Volume2 of 3
Final Report for Lead Slag PileRemedial Investigation at theCalifornia Gulch Site Leadville,Colorado (Administrative Order onConsent CERCLA-VII-92-06), Volume3 of 3
Final Report for Zinc Slag PileRemedial Investigation at theCalifornia Gulch Site Leadville,Colorado (Administrative Order onConsent CERCLA-VIII-92-06) ,Appendices
Final Report for Zinc Slag PileRemedial Investigation at theCalifornia Gulch Site Leadville,Colorado (Administrative Order onConsent CERCLA-VIII-92-06), Volume1 of 2
Final Report for Zinc Slag PileRemedial Investigation at theCalifornia Gulch Site Leadville,Colorado (Administrative Order onConsent CERCLA-VIII-92-06) , Volume2 of 2
Reconnaissance Investigation ofWater Quality, Bottom Sediment,and Biota Associated withIrrigation Drainage in the MiddleArkansas River Basin, Colorado andKansas, 1988-89
•"' •••-.- ~ -VV,:v':v.-!Autho_r.- -.,-; ';.-••. >-•- ;_•'.-•• ' * "''• J- • ' •'''' :' •" *' '• "•"• '• •'•"•'Moran, R.E. and D.A. Wentz j
Moran, R.E. and D.A. Wentz
Morrison Knudsen Corporation
Morrison Knudsen Corporation
Morrison Knudsen Corporation
Morrison Knudsen Corporation
Morrison Knudsen Corporation
Morrison Knudsen Corporation
Mueller, O.K., L.R. DeWeese,A.J. Garner, and T.B. Spruill
gw1974
1992
1992
1992
1992
1992
1992
1991
•' >„'>.-.-." Reference ; -'V -•.'•-"•"*• '. '. .- • ' ' -: •.'.'-:.- -(," ; •-. " . ' '.:•-.. ;' •
U. S. Geological Survey inCooperation with the ColoradoWater Pollution ControlCommission, Denver, Colorado,Colorado Water ResourcesCircular No. 25
U. S. Geological Survey,Denver, Colorado,Proceedings: InternationalSymposium on Water-RockInteraction Czechoslavakia
Denver & Rio Grand WesternRailroad Company, December11, 1992
Denver & Rio Grand WesternRailroad Company, December11, 1992
Denver & Rio Grand WesternRailroad Company, December11, 1992
Denver & Rio Grand WesternRailroad Company, December11, 1992
Denver & Rio Grand WesternRailroad Company, December11, 1992
Denver t Rio Grand WesternRailroad Company, December11, 1992
U.S. Geologic Survey, Water-Resources InvestigationsReport 91-4060
."••. -•;:::•- --; Key Words '^••\:^-i.--lf.\••,- -.:-.-. .:••'. ''•-^••: .•'.,- • "'-JmWater Quality, metals, i Hmining, Arkansas River, ^HCalifornia Gulch ^1
Metals, Transport, AcidMine Drainage, WaterQuality, Colorado, aquatic,Kerber Creek
RI/FS, lead, metals,California Gulch,Leadville, Colorado
RI/FS, lead slag, metals,California Gulch,Leadville, Colorado
RI/FS, lead slag, metals,California Gulch,Leadville, Colorado
RI/FS, lead slag, metals,California Gulch,Leadville, Colorado
RI/FS, zinc, metals,California Gulch,Leadville, Colorado
RI/FS, zinc, metals,California Gulch,Leadville, Colorado
water, birds, metals,pueblo reservoir, sediment,
Page 29
Doc No. •
D00350
D00161
D00422
D00184
D00629
D00327
D00342
D00185
D00186
D00187
D00382
D00374
^ . . ^ g? ':i/ritle: i:« fer %.• ;• -..-- .+ .3-,? .'..•?.:/.'• ,'!--•* .--.•;•-• f-?.£*X-z>'-<?\ :•*-.£••, ••*•>•-.'Evaluation of Lead in Sediment andBiota, East and West Page Swamps,Bunker Hill Superfund Site, Idaho(1019.3180)
Metals in Soft Tissues of MuleDeer and Antelope
The Effects of Flow Augmentationon Channel Geometry of theUncompahgre River
Arsenic (Cover Only)
Mineral Tolerance of DomesticAnimals (cadmium, copper, lead,zinc)
Contaminants and Tree Swallows inthe Fox River Drainage, Green Bay,Wisconsin
Influence of Metal Concentrationsand pH on the Toxicity ofContaminated Floodplain Soils,Grant -Kohrs Ranch N.H.S., Montana
Prediction of Toxicity ofSediments Containing ComplexContaminant Mixtures
Seasonal Effects of the McLarenTailings on Soda Butte Creek andYellowstone National Park, Montana
The Potential for BiologicalEffects of Sediment-SorbedContaminants Tested in theNational Status and Trends Program
Upper Arkansas River VegetationAssessment
Determination of Population-limiting Critical SalmonidHabitats in Colorado Streams Usingthe Physical Habitat SimulationSystem
'^^^^^^^^^^^Mullins, W.H., S.A. Burch
Munshower, P.F., and D.R.Neuman
Mussetter, R.A. and M.D.Harvey
National Academy of Science,Committee on Medical andBiologic Effects ofEnvironmental Pollution
National Academy of Sciences,subcommittee on MineralToxicity in Animals
National Biological Service
National Biological Service
National Biological Service
National Biological Service
National Oceanic andAtmospheric Administration
Natural ResourcesConservation Service
Nehring, B.R., and R.M.Anderson
iSateJ-
1994
1979
1995
1977
1980
1995
1995
1995
1995
1990
1997
1993
!r ^ /yi feren 5 p|U.S. Fish and WildlifeService, Memorandum,Portland, Oregon
Bulletin of EnvironmentalContaminant Toxicology
unpublished report
National Academy of Sciences,Washington, D.C. 332 pp.
Mineral Tolerance of DomesticAnimals
U.S. National BiologicalService, NBS InformationBulletin
U.S. National BiologicalService, NBS InformationBulletin No. 29
U. S. National BiologicalService, U. S. Department ofthe Interior, NBS InformationBulletin, No. 23 1995
U. S. National BiologicalService, U. S. Department ofthe Interior, NBS InformationBulletin, No. 25 1995
National Oceanic andAtmospheric Administration,National Ocean Service, NOAATechnical Memorandum NOS OMA52, Seattle, Washington
NRCS Report, NRCS Alamosa, CO
Rivers 4:1-19
^•f/X^f&lfyWo^g^^'SLead, Sediment, Biota,Swamps, Idaho, Bunker Hill,metals
heavy metals, mammals, muledeer, antelope
geomorphology, flows,hydraulic, hydrology,channel stability, erosion,flow augmentation
Heavy Metals, arsenic
mammals, toxicity, metals,cadmium, copper, lead, zinc
Birds, Tree Swallows,Contaminants, Sediments,Wisconsin, Green Bay, PCB,terrestrial
Metals, pH, Toxicity,Contamination, Floodplain,Soils, Montana, terrestrial
Sediments, Metals, Model,Contaminants, Pore Water
Aquatic Biota, Mining,Montana, Heavy Metals
Sediments, Metals,Contaminants, Effects,Aquatic Biota
vegetation, riparian,arkansas river, lakecounty, terrestrial
Brown Trout, HabitatLimitations, Instream Flow,Rainbow Trout, aquatic, fish
Page 30
Doc No.
D00441
D00372
D00288
D00575
D00633
D00189
D00568
D00194
D00558
D00384
D00390
•-^.^^y --• , :Title: -.!j-.;U.vr-'.:V-.-• •j,.. -;-.---- •-- -•• ' ± •~:T~:t*:- •' . •/^i-
Ar ^ Buation of the PossibleIm^MK of Heavy Metal Pollutionon the Brown Trout Population ofthe Upper Arkansas River
Stream Fisheries Investigations,Federal Aid Project F-51-R, Job 1.Fish Flow Investigations, Job 2.Wild Trout Introductions
Stream Fisheries Investigations,Federal Aid Project F-51-R, Job 1.Fish Flow Investigations, Job 2.Wild Trout Introductions, Job 3.Technical and ProfessionalPublications
Stream Fisheries Investigations,Federal Aid Project F-51-R, Job 1.Fish Flow Investigations, Job 3.Special Regulations Evaluations,Job 4. Wild Trout Introductions,Job 6 . Colorado River AquaticInvertebrate Investigations
Evaluation of 16 Years of TroutPopulation Biometrics in the UpperArkansas River
Stream Fisheries Investigations,Job Progress Report, Project F-51-R-6
Letter from NRCS to USFWS re:forage samples in Lake County
Aquatic Macrophytes of ShadowMountain Reservoir, Grand Lake,and Lake Granby, Colorado,Technical Report
Comparison of Two Sampling Methodsfor Measuring the Impact of Metalson Benthic Communities in aRegulated River
Leaf Pack Breakdown andMacroinvertebrate Colonization:Bioassessment Tools for a HighAltitude Regulated System?
Monitoring of Heavy MetalConcentrations in the ArkansasRiver Using Transplanted AquaticBryophytes
• '•• :-•;':. ' r- ; '" "iV" Author. >• -;^~- ./^ '-•;- •
Nehring, R.B. T
Nehring, R.B.
Nehring, R.B.
Nehring, R.B.
Nehring, R.B. and G. Policky
Nehring, R.B. and R. Anderson
Nelson, J.
Nelson, P.C.
Nelson, S.M.
Nelson, S.M.
Nelson, S.M.
;JB£.
1988
1989
1986
2002
1981
2001
1982
2000
1999
1996
_c .-;•;;'- -Reference -vj- '.uf""!'-SS:
Colorado Division of Wildlife
Colorado Division ofWildlife, Ft. Collins,Colorado, Federal Aid in Fishand Wildlife Restoration JobProgress Report F-51
Colorado Division ofWildlife, Ft. Collins,Colorado, Federal Aid in Fishand Wildlife Restoration JobProgress Report F-51-R
Colorado Division ofWildlife, Ft. Collins,Colorado, Federal Aid in Fishand Wildlife Restoration JobProgress Report F-51-R
Colorado Division of wildlife
Colorado Division ofWildlife, Fish ResearchSection, Ft. Collins, Colorado
NRCS Letter to USFWS,February 13, 2001
Colorado State University,Fort Collins, Colorado,Department of Fishery andWildlife Biology, Master'sThesis
U. S. Bureau of Reclamation,Technical Service Center,Denver, CO. TechnicalMemorandum No. 8220-00-3
Environmental Pollution
U. S. Bureau of Reclamation,Technical Service Center,Denver, CO. TechnicalMemorandum 8220-96-18
-••;-.-> -'-..-'Keywords' ..,-- •.•Jj-.-.J-..*>: ;--.-- .: -••••-• -.....-. "• B
arkansas river, aquatic, ••!fish, metals, brown trout JIwater quality, contaminants]
Stream Fisheries, Flow,Trout, aquatic, fish
Stream Fisheries, flow,trout, fish
Stream Fisheries, Flow,Trout, AquaticInvertebrate, fish
Upper Arkansas River,trout, aquatic, heavymetals, fish
Fish, Colorado, aquatic,Arkansas River
forage, upper arkansas,lake county, terrestrial,metals
Wetland/Riparian,Vegetation, Macrophytes,Shadow Mountain Reservoir,Grand Lake, Lake Granby,Colorado, aquatic
invertebrates, benthic,tiyporheic, communitystructure, upper arkansas,metals, lake fork, aquatic
aquatic, invertebrates,metals, arkansas river,lake fork, bioassessment
aquatic, bryophytes,metals, water, arkansasriver, biomonitoring
Page 31
, Doc No/ '
D00237
D00551
D00195
D00392
D00386
D00391
D00563
D00383
D00385
D00191
D00192
•: ••• -v';.V v *- ' TltlifrlW". &:&i¥:'AJi"•:"...•„•• .-..:•, \' -.<>-3:'*>j-i"-S.'-.-:'l -s> i •;';•-•-«;£?"•'••.>;••••'.Observed Field Tolerance ofCaddisfly Larvae (Hesperophylaxsp.) to High Metal Concentrationsand Low pH
Progress Report for Upper ArkansasRiver Water Quality andMacroinvertebrate Studies, AppliedScience Referral Memorandum No. 92-2-1
An Assessment of RiparianEnvironmental Quality by usingButterflies and DisturbanceSusceptibility Scores
Aquatic MacroinvertebrateCommunities and Probable Impactsof Various Discharges, UpperArkansas River
Assessment of Leadville MineDrainage Tunnel Impacts on theUpper Arkansas River usingHyporheic Pot Samples
Distribution of AquaticMacroinvertebrates in Relation toStream Flow Characteristics in theArkansas River
Effects of Multiple Stressors onHyporheic Invertebrates in a LoticSystem- -DRAFT
Relationships Between Metals andHyporheic Invertebrate CommunityStructure in a River Recoveringfrom Metals Contamination
Relationships between Metals andHyporheic Invertebrate CommunityStructure in a River Recoveringfrom Metals Contamination
Results of MacroinvertebrateSurveys in the Upper ArkansasRiver Related to the LeadvilleMine Drainage Tunnel Discharge -1994
Selection of an Indicator Organismfor Biological Monitoring of MetalPollution on the Upper ArkansasRiver
>:w r/toh6 ":< > ' :•::: -wSos-f& -.y- .-vi«\-.:,.-.r<..s'._ •"•:-- ;viNelson, S.M.
Nelson, S.M.
Nelson, S.M. and D.C. Andersen
Nelson, S.M. and R.A. Roline
Nelson, S.M. and R.A. Roline
Nelson, S.M. and R.A. Roline
Nelson, S.M. and R.A. Roline
Nelson, S.M. and R.A. Roline
Nelson, S.M. and R.A. Roline
Nelson, S.M. and R.A. Roline
Nelson, S.M. and R.A. Roline
•' -•£?%••
1994
1991
1994
1995
1997
1996
2000
1999
1998
1994
1993
;:: ;,v;/,-;--;Trenc!Bfc::; $%g?
Journal of Freshwater Ecology9(2) :169-170
Progress Report, US BOR,Applied Science Referral MemoNo. 92-2-1
The Southwestern Naturalist39(2) 137-142
U. S. Bureau of Reclamation,Technical Service Center,Denver, CO. TechnicalMemorandum 8220-95-4
U. S. Bureau of Reclamation,Technical Service Center,Denver, CO. TechnicalMemorandum No . 8220-97-10
U. S. Bureau of Reclamation,Technical Service Center,Denver, CO. TechnicalMemorandum 8220-96-19
Ecological Research andInvestigations Group,Technical Services Center,Bureau of Reclamation,Denver, CO 80225
Hydrobiologia 397:211-226(1999)
0. S. Bureau of Reclamation,Technical Service Center,Denver, CO. TechnicalMemorandum No. 8220-98-7
U. S. Bureau of Reclamation,Denver Office
U. S. Bureau of Reclamation,Denver Office, AppliedSciences Referral MemorandumNo. 93-2-5
• ;£s£;2>#; ;;K«0fv°#f S >caddisfly, metals, pH, minetailings
upper arkansas, box creek,water quality, metals, lakefork, half moon, tributaries
Wetland/Riparian,Invertebrates, Butterflies,Bio-Monitoring, ColoradoRiver, Arizona, aquatic
aquatic, invertebrates,arkansas river, flow,water, hydrology
aquatic, invertebrates,metals, Leadville minedrainage tunnel, arkansasriver, water, east fork,
aquatic, invertebrates,flow, water, arkansasriver, hydrology
upper arkansas, lake fork,invertebrates, metals,regulated river, hyporheic,aquatic
aquatic, invertebrates,metals, arkansas river,water, east fork
aquatic, invertebrates,metals, arkansas river,water, east fork
Invertebrates, Aquatic,Metals, Upper ArkansasRiver, Leadville MineDrainage Tunnel
Invertebrates, Aquatic,Metals, Upper ArkansasRiver, Bio-Monitoring,Leadville Mine DrainageTunnel
Page 32
Doc No.
D00190
D00389
D00238
D00193
D00396
D00196
D00197
D00100
D00198
D00533
D00534
:• -••— ' :'- : : -TIHO .:- " -•-••-.-••.::• :•.-••• •- fc;— ' ''-•• •• — •••*-• ••^••--•.- - =.'..-V; ::V
Se ^ pbn of the Mayfly Rithrogenahag r as an Indicator of MetalPollution in the Upper ArkansasRiver
Results of MacroinvertebrateSampling on Lake Fork and SomeRecommendations for MonitoringDinero Tunnel Impacts on Lake Fork
Leaf Litter Breakdown in aMountain Stream Impacted by aHypolimnetic Release Reservoir
Use of Hyporheic Samplers inAssessing Mine Drainage Impacts
Assessment of Effects of AlteredStream Flow Characteristics onFish and Wildlife Part A: RockyMountains and Pacific NorthwestFINAL REPORT
Metals Mining and Milling ProcessProfiles with Environmental Aspects
The Fish Populations and Fisheryof the Upper Arkansas River 1977-1980, Final Report, Fryingpan-Arkansas Fish ResearchInvestigations
Effects of Suspended Sediments onAquatic Ecosystems
Metals in Riparian Wildlife of theLead Mining District ofSoutheastern Missouri
Influences of water and substratequality for periphyton in amontane stream affected by acidmine drainage
Effects of Stress from MineDrainage on Ecosystem Functions inRocky Mountain Streams
"v.-T/i1'?" ;'.'-• TAuthor - y •: 1/.4v-'J
;-::•..•--<::.: •-.«s-"'V-^ •-.:• ..•--•-• . « - - -
Nelson, S.M. and R.A. Roline |
Nelson, S.M. Nelson and R.A.Roline
Nelson, S.M., and R.A. Roline
Nelson, S.M., R.A. Roline,A.M. Montana
Nelson, W., G. Horak, M.Lewis, J. Colt
Nerkervis, R. J. and J. B.Hallowell
Nesler, T.P.
Newcombe, C.P., D.D. MacDonald
Niethammer, R.D. Atkinson,T.S. Basket t, and F.B. Samson
Niyogi, D., D.M. McKnight,and W.M. Lewis Jr.
Niyogi, D.K.
1996
2000
1993
1976
1976
1982
1991
1985
1999
1999
-,-'•'••' ;'';'f. '-Re^l*n<-erv:-'K:X- - .-'."•Journal of FreshwaterEcology 8 (2) : 111-119
U. S. Bureau of Reclamation,Technical Service Center,Denver, CO. TechnicalMemorandum No. 8220-96-17
Journal of Freshwater Ecology15(4) :479-490
Journal of Freshwater Ecology8 (2) :103-110
US FWS Biological ServicesProgram FWS/OBS-76/29
U. S. EnvironmentalProtection Agency, Office ofResearch and DevelopmentIndustrial EnvironmentalResearch Laboratory ResearchTriangle Park, N.C.
U. S. Bureau of Reclamation,Contract No. 7-07-83-V0701
North American Journal ofFisheries Management 11:72-82
Archives of EnvironmentalContaminants and Toxicology14:213-223
Limnol . Oceanogr. 44(3 part2) :804-809
Ph. D. Dissertation,University of Colorado,Boulder, CO
:---.:.-•-• •>• --Key Words.--;:.'-: .'..v-J,?• :.-.-. ..., ,.*,-*-.•;; -:. .-_-... v,.-.:'-rg*|Invertebrates, Aquatic, ^^BMetals, Upper Arkansas |lRiver, Colorado, LeadvilleMine Drainage Tunnel
aquatic. Lake Fork, metals,Dinero Tunnel, arkansasriver, invertebrates, water
aquatic, invertebrates,leaves. Lake Fork, ArkansasRiver
Invertebrates, Aquatic,Metals, Sediments, UpperArkansas River, Colorado,Leadville Mine DrainageTunnel
stream flow, aquatic, fish
Heavy Metals, mining
USER, fish, Upper ArkansasRiver, aquatic, metals
sediments, aquatic,
Wetland/Riparian, Lead,Cadmium, Zinc, WadingBirds, Amphibians,Reptiles, Missouri, metals,terrestrial
st. Kevin's gulch, upperarkansas, acid minedrainage, periphyton, waterquality, metals, mining,
upper arkansas, metals,water, st. Kevin's gulch,acid mine drainage, waterquality, mining, ecosystemfunctions
Page 33
-Doc No. >
D00561
D00188
D00381
D00380
D00131
D00410
D00621
D00008
D00199
D00546
D00562
Experimental Diversion of AcidMine Drainage and the Effects on aHeadwater Stream
California Gulch Project: yakTunnel Connections and Geology
Identifying and Setting Priorityfor Riparian Wetland RestorationSites: Upper Arkansas RiverBasin, CO
Description of Physical(Hydrologic/Geomorphic)Characteristics: Upper ArkansasRiver Basin, CO
Identifying Sites for RiparianWetland Restoration: Applicationof a Model to the Upper ArkansasRiver Basin
Water-Quality Assessment of theArkansas River Basin, SoutheasternColorado, 1990-93
Epidemiology of Lead Poisoning inAnimals
Haematological Parameters asPredictors of Blood Lead andIndicators of Lead Poisoning inthe Black Duck (Anas rubripes)
Molybdenum
Various Water Rights in theLeadville Area Memo
Zinc Toxicity Thresholds forImportant Reclamation GrassSpecies of the Western UnitedStates
'. ttrr' pAirthor sb j V v\ 3-•fc-L-V/v iM-. :,;*1: v-r^-1 '-jA'; <-.,;:;. VrNiyogi, D.K., D.M. McKnight,W.M. Lewis, and B.A. Kimball
Noble, Alan C.
O'Neill, M.P.
O'Neill, M.P., J.C. Schmidt,C.P. Hawkins, J.P.Dobrowolski, and C.M.U. Neale
O'Neill, M.P., J.C. Schmidt,J.P. Dobrowolski, C.P.Hawkins, C.M.U. Neale
Ortiz, R.F., M.E. Lewis, andM.J. Radell
Osweiler, G.D., G.A. VanGelder, and W.B. Buck
Pain, D.J.
Parker, G.A.
Parkville Water District
Paschke, M.W., E.F. Redente,and D . B . Levy
*$$£*1999
1985
1997
1997
1997
1998
1978
1989
1986
1986
2000
4"'-%' > , ';R#ererice ;.:: £ry<: -_?.•. :'_::;r i.:1?.:' .-!.-..• •?£?:•?•" ,'••-•'• ..••PiW.".-Li?:. ":in Morganwalp, D.W. andBuxton, H.T., eds., USGeologic Survey ToxicSubstances Hydrology Program- -Proceedings of the TechnicalMeeting, Charleston, SC,March 8-12, 1999- -Volume 1 of3--USGS Water-ResourcesInvestigations Report 99-4018A, p. 123-130
California Gulch Case FileBox 4 Of 136
Final Report submitted to EPAWetlands Research Branch
Interim Report submitted toEPA Wetlands Research Branch
Restoration Ecology 5(4S):85-102
U.S. Geological Survey, Water-Resources InvestigationsReport 97-4111
In Toxicity of Heavy metalsin the Environment. Oehme,F.W. (ed.) pp. 143-171
Environmental Pollution 60:67-81
In: The Handbook ofEnvironmental Chemistry, Vol3 Part D, AnthropogenicCompounds, ed. D. Hutzinger,Published by Springer -Verlag
Asarco Memo
Environmental Toxicology andChemistry, 19 (11) : 2751-2756
ps ^ UKepVbiys f JjSjr;<•" -~ry~'s;'-'-~:- -:•'• * ";v V7~1:*. ?::'1?~:.l ?' '--vst. kevin gulch, metals,water, upper arkansas,tracers, algae, pH, acidmine, aquatic
Yak Tunnel, geology. Ironhill
riparian, water, flow,arkansas river, wetlands,aquatic
hydrology, flow, water,arkansas river,geomorphology, aquatic
Upper Arkansas River,riparian, wetland,restoration
water quality, arkansasriver, metals, traceelements, sediment
Lead, mammals, metals,terrestrial
lead poisoning, metals,slood, birds
Metals, Molybdenum
water rights, upperarkansas, parkville waterdistrict, ditches
reclamation, grasses,terrestrial, metals, zinc,phytotoxicity, riskassessment, restoration,vegetation
Page 34 3
Doc No.
D00559
D00560
D00607
D00615
D00398
D00526
D00506
D00425
D00426
D00254
D00395
D00378
D00424
• ^=r ...v- -.'.:-:• _ Title •;• ':. ; /-•- :-••.--; :;v.•- J ^ K. ':: ' : • . • - • • • - • • - •,-•.'*- :"•.(_- : . .
Ef ^ p of Acidic Recharge onGroW^Water at the St . KevinGulch Site, Leadville, Colorado
Planning and Implementation of aComprehensive Ecological RiskAssessment at the MilltownReservoir-Clark Fork RiverSuperfund Site, Montana
Bioavailability of metals andarsenic to small mammals at amining waste-contaminated wetland
Food Chain Analysis of Exposuresand Risks to Wildlife at a Metals-Contaminated Wetland
Characterization of EcologicalRisks at the Milltown Reservoir-Clark Fork River SedimentsSuperfund Site, Montana
Grazing History and OverstoryCanopy Affect Understory Diversityin a Montane Riparian Ecosystem(Thesis Abstract Only)
Mechanisms of GroundwaterContamination at a FluvialTailings Site, Leadville, Colorado
Fisheries Inventories: UpperArkansas Basin, 1996
Fisheries Inventories: UpperArkansas Basin, 1997
Brown Trout Survey Results forArkansas River - 1993, 1994, 1995
Fisheries Inventories Data: UpperArkansas Basin, 1999
Fisheries Inventories, UpperArkansas River Basin
Fisheries Inventories: UpperArkansas and South Platte Basins,1994
.-.:r"'j-; .v-; -'• Author \_ ' -,. '.•-:"-
Paschke, S.S., W.J. Harrison,!and K. Walton-Day ™
Pascoe, G.A. and J.A.DalSoglio
Pascoe, G.A., R.J. Blanchetand G. Linder
Pascoe, G.A., R.J. Blanchet,G. Linder
Pascoe, G.A., R.J. Blanchet,G. Linder, D. Palawski, W.G.Brumbaugh, T.J. Canfield,N.E. Kemble, C.G. Intersoll,A, Farag, and J.A. DalSoglio
Peck, L.E.
Peebles, T.H.
Policky, G
Policky, G
Policky, G.
Policky, G.
Policky, G.
Policky, G.
1994
1994
1996
1994
1999
2000
1996
1997
1995
1999
1998
1994
;!••:?'••'•• :• •'•'•-;:r- Reference :-';i :-.,:'- •"••."•""C — .-:•-• : • ---* '• < "'•• " . "- -• •-..•<- •-.'- .
Journal of Geochemistry,Exploration, Environment,Analysis (in press)
Environmental Toxicology andChemistry, 13 (12) : 1943-1956
Archives of EnvironmentalContamination and Toxicology27:44-50
Archives of EnvironmentalContamination and Toxicology30:306-318
Environmental Toxicology andChemistry 13 (12) : 2043-2058
Unpublished Thesis, ColoradoState University, Ft.Collins, CO
Unpublished Thesis, ColoradoSchool of Mines, Golden, CO
Colorado Division of Wildlife
Colorado Division of Wildlife
Colorado Division of Wildlife
Colorado Division of Wildlife
State of Colorado, Departmentof Natural Resources, CDOW,Salida, CO
Colorado Division of Wildlife
, _ •'- > .:,:.,„;• Key Words •;-.> :£. ?r l
upper arkansas, ^^Hgroundwater, st . kevin ^^Bgulch, metals, water,aquatic, acid mine drainage,
clark fork river,sediments, risk assessment,metals, water, wetlands
metals, mammals, wetland,mines, arsenic, terrestrial
metals, wetland, mammals,wildlife, terrestrial
aquatic, fish, clark forkriver, metals uptake,ecological risk, sediments
grazing, riparian, habitat,Colorado
arkansas river,groundwater, fluvial, 11-mile reach, tailings,water, metals, biosolids
fish, arkansas river, fishpopulations, aquatic
fish, arkansas river, fishpopulations, aquatic
trout, fish, arkansasriver, populations, aquatic
fish, arkansas river,populations, aquatic
fish, arkansas river,aquatic
fish, arkansas river, fishpopulations, aquatic
Page 35
Doc No..
D00126
D00202
D00608
D00442
D00338
D00326
D00203
D00204
D00205
D00209
D00208
Summitville Mine/Alamosa River:Livestock Exposure Investigation
Colloidal Properties ofFlocculated Bed Material in aStream Contaminated by Acid MineDrainage, St. Kevin Gulch, Colorado
The effect of heavy metals onpopulations of small mammals fromwoodlands in Avon (England) withparticular emphasis on metalconcentrations in Sorex araneus L.and Sorex minutus L
Direct Revegetation of MineTailing: A Case Study in Colorado
Status of Instream FlowLegislation and Practices in NorthAmerica
Work Area Management Plan for theCalifornia Gulch Superfund Site,Implementation by ResurrectionMining Company, Appendix D
Final Work Plan, Metal Speciationand Source CharacterizationCalifornia Gulch
The Transport of Heavy MetalsWithin a Small Urban Catchment
Dispersal of Heavy Metals fromAbandoned Mine Workings and TheirTransference Through TerrestrialFood Chains
Effects of Diversions on WaterQuality and MacroinvertebratePopulations in the Upper ArkansasRiver
The Effects of Heavy MetalsPollution of the Upper ArkansasRiver on the Distribution ofAquatic Macroinvertebrates
Ramsdell, H., S. Zylstra
Ranville, J.F., K.S. Smith,D.L. Macalady and T.F. Rees
Read, H.J. and M.H. Martin
Redente, E.F. and D.A. Baker
Reiser, D.W., T.A. Weshe, andC. Estes
Resurrection Mining Company
Resurrection MiningCompany/Camp Dresser & McKee
Revitt, D. M., R. S.Hamilton, and R. S. Warren
Roberts, R. D. and M. S.Johnson
Roline, R.A.
Roline, R.A.
VvDatiB^;1999
1988
1993
1996
1989
1992
1990
1978
1983
1988
•rAl' ' iJ.'Reterelic ?";; 1/;-?. -."V.C. "./.'•' f> ' • •':"*.• ••'•/.. £j;.,'"r' •. .'".•- '-.r "•,.- . . . .'.'v-' ' .
Department of EnvironmentalHealth and Center forEnvironmental Toxicology andTechnology Colorado stateUniversity
U. S. Geological Survey,Hater ResourcesInvestigations Report 88-4220
Chemosphere 27:2197-2211
In: Proceedings ofPlanning, Rehabilitation andTreatment of Disturbed Lands,7th Billings Symposium,Reclamation Research UnitPublication No. 9603, pp!83-191
Fisheries 14:22-29
Resurrection Mining Company
Resurrection Mining Company
The Science of the TotalEnvironment 93 (1990) 359-373
Environmental Pollutants 16:293-310
U. S. Bureau of Reclamation,Environmental SciencesSection, Applied SciencesReferral No. 83-2-18
Hydrobiologia 160:3-8
^W??:^y^.Xmi:;:Summitville, Alamosa,copper, metals, sheep,mammals, vegetation, soil
Metals, Transport, AcidMine Drainage, St. KevinGulch, Colorado, aquatic
metals, mammals, woodlands,terrestrial
tailings, idarado,revegetation, metals,reclamation, terrestrial,soils, soil amendments,plants
Legislation, Flow,Instream, aquatic
California Gulch,Resurrection MiningCompany, Asarco, EPA, RI ,Leadville, Arkansas River,Yak Tunnel, Contaminants,Metals
Heavy Metals, CaliforniaGulch
Metals, Transport
Metals, Transport, Mining,Terrestrial Foodchain
Invertebrates, Aquatic,Metals, Flow Modifications,Upper Arkansas River,Colorado
Invertebrates, Aquatic,Metals, Upper ArkansasRiver, Colorado
Page 36
Doc No.
D00210
D00212
D00627
D00401
D00213
D00583
D00440
D00439
D00373
D00214
"-. -••IvrvVTltle.- .:- ••:•--."-- -\ '^ .•:'.•• ^^^ . . -. . -M. -,•:.;. .': ...> - '...:, •He ^ Betals Pollution of theUppe^^rkansas River, Colorado,and Its Effects on theDistribution of Aquatic Macrofauna
Metal Retention by the SugarloafGulch Wetland, Lake County,Colorado - Abstract of Thesis
Ecological Risk Assessment for theTerrestrial Ecosystem; CaliforniaGulch NPL Site, Leadville, Colorado
Relative Importance of Water andFood as Cadmium Sources to thePredatory Insect Sialis velata(Megaloptera)
Contaminants, Fish, and Hydrologyof the Missouri River and WesternTributaries. In: Proceedings ofthe Symposium on RestorationPlanning for the Rivers of theMississippi River Ecosystem
Metals in Water: DeterminingNatural Background Concentrationsin Mineralized Areas
Plecoptera and Trichoptera SpeciesDistribution Related toEnvironmental Characteristics ofthe Metal-Polluted Arkansas River,Colorado
Chironomidae (Dipter) SpeciesDistribution Related toEnvironmental Characteristics ofthe Metal-Polluted Arkansas River,Colorado
The Canada Geese of SoutheasternColorado
Active-, Inactive-, and Abandoned-Mine Information and SelectedGeochemical Data for the State ofColorado
.'- .'.; ••,:•:- ,i ' : Author -V -<:-:-. ;.- •.'•. j-'Roline, R.A. and J.R. Boehmke j
Rowe, C.
Roy F. Weston, Inc. & TerraTechnologies
Roy, I. And L. Hare
Ruelle, R., R. Koth and C.Stone
Runnells, D.D. , T.A. Sheperd,E.E. Angino
Ruse, L.P. and S.J. Herrmann
Ruse, L.P., S.J. Herrmann,and J.E. Sublette
Rutherford, W.H.
Ryder, J.
te_
9^
1994
1997
1999
1993
1992
2000
2000
1970
1994
•'..•-' iv.v'- •'•-• Reference ";'.• ''-'^••--:-'U. S. Bureau of Reclamation,Engineering Research Center,Denver, Colorado, REC-ERC-81-15
Colorado State University,Department of EarthResources, Fall, 1994
US EPA Region 8, EPA WorkAssignment No. 04601-032;Document Control No. 4800-32-0118
Canadian Journal of Fisheriesand Aquatic Sciences 56:1143-1149
U. S. National BiologicalSurvey, Biological Report 19,October 1993
Environmental Science &Technology 26 (12) : 2316-2323
Western North AmericanNaturalist 60(1): 57-65
Western North AmericanNaturalist 60(11:34-56
Colorado Game, Fish and ParksDivision, Department ofNatural Resources, MigratoryBird Investigations, ProjectW-88-R, Federal Aid inWildlife Restoration
U. S. Geological Survey, Open-file Report 94-579, DisketteVersion, Denver, Colorado
-•• V. ;l ~: \ Keywords^ -'.. .> ' ;vj• >>; .-•- •' - - • -"•' •*""--. -:--'r H
Aquatic Biota, Upper ^HArkansas River, Colorado, ^HHeavy Metals, Water ^Quality, Contaminants
Wetland/Riparian, Metals,Lake Fork, Sugar Loaf,Upper Arkansas River,Colorado, aquatic
California Gulch, NPL site,risk assessment, Leadville,soils
aquatic, invertebrates,cadmium, metals uptake,metals
Fish, aquatic, MissouriRiver, metals, contaminants
metals, concentrations,mining, aquatic
arkansas river,invertebrates, aquatic,diptera, trichoptera,metals, sediments
arkansas river,invertebrates, aquatic,chironomidae, metals,sediments
Canada Geese, SoutheasternColorado, Hunting,Waterfowl, Arkansas RiverValley, Migratory Birds,terrestrial
Geochemistry, mining
Page 37
:-Dp.cNorD00520
D00434
D00584
D00216
D00215
D00631
D00632
D00217
D00027
D00218
Lincoln Park Superfund Site
Lincoln Park Superfund Site,Ecological Risk Assessment, Draft
Screening-Level Ecological RiskAssessment Operable Unit No. 4,California Gulch Superfund Site
Twin Lakes Colorado (PreliminaryReport) (Introduction Only)
Historical, Physical, and ChemicalLimnology of Twin Lakes, Colorado(Partial Article)
Derivation of Soil QualityCriteria Using Predicted ChemicalSpeciation of Pb and Cu
Chemical Speciation, Solubilityand Bioavailability of Lead,Copper, and Cadmium incontaminated Soils
Acute Oral Toxicity and Repellencyof 933 Chemicals to House and DeerMiceErythrocyte a-aminolevulinic aciddehydratase in birds. I. TheEffects of Lead and Other Metalsin Vitro
Biomonitoring of Lead-ContaminatedMissouri Streams with an Assay forErythrocyte ?-Aninolevulinic AcidDehydratase Activity in Pish Blood
S. M. Stoller Corporation,Boulder, CO, and Schager &Associates, Inc., Golden, CO
S.M. Stoller Corp. andSchafer & Assoc. for CotterCorp.
S.M. Stoller Corporation forResurrection Mining Company
Sartoris, J.J. and J.W. Yahnke
Sartoris, J.J., J.F. LaBountyand H. D. Newkirk
Sauve, S., A. Dumestre, M.McBride, and W. Hendershot
Sauve , S . F .
Schafer, E. W., Jr., and W.A. Bowles, Jr.
Scheuhammer, A.M.
Schmitt, C. J., M. L.Wildhaber, J. B. Hunn, T.Nash, M. N. Tieger and B. L.Steadman
a*fr(1998
1998
1996
1987
1977
1998
1999
1985
1987
1993
v ~S'&'&-:?' ' *L Rs rence"-- :' ;? ;;'-";:Ecological Risk Assessmentfor Cotter Corporation,Lakewood, CO
Ecological Risk Assessment
Ecological Risk Assessment,for Resurrection MiningCompany
U. S. Bureau of Reclamation,Denver Federal Center,Denver, Colorado
U. S. Bureau of Reclamation,Engineering and ResearchCenter, Denver, Colorado, REC-ERC-77-13, September 1977
Environmental Toxicology andChemistry 17 (8) : 1481-1489
bissertation presented to thefaculty of the GraduateSchool of Cornell Universityin Partial Fulfillment of theRequirements for the Degreeof Doctor of Philosophy
Archives of EnvironmentalContamination and Toxicology14:111-129
Toxicology 45:155-163
Archives of EnvironmentalContamination andToxicology 25:464-475
Lincoln Park, Cotter Mill,arkansas river, Canon City,tailings, uranium, radon,molybdenum, radioactivity,water, ground-water, soils,biota, vegetation, birds,mammals
lincoln park, ecologicalrisk assessment, arkansasriver, downstream, uranium,water quality, terrestrial,aquatic, sediment, soil,birds, mammals, metals,radionuclides
California Gulch, riskAssessment, Resurrection,Leadville, metals,tailings, soils,phytotoxicity
USER, aquatic, Twin Lakes
Water Management, TwinLakes, Colorado, Metals,Sediments, aquatic
lead, copper, soil quality,toxicology, free metalactivity, Speciation, metals
lead, copper, cadmium,soils, Speciation,bioavailability, metals
Mammals, Oral Toxicity,House Mice, Deer Mice,Metals
metals, birds, pH, blood
Fish, Metals, Lead, Bio-Monitoring, aquatic
Page 38
Doc. No.
D00220
D00221
D00573
D00482
D00222
D00223
D00224
D00225
D00609
D00226
D00505
-"•- :;-: : •' ; -Title*.-,"-- J> - '•:;;,- .-• - ^ »' " v '• - .•"••'r . ^•--••:*-- '.•; , - . - • •• ',-.---• ••
Ge ^ Bum, Tin and Arsenic inRaS^^ffects on Growth, Survival,pathological Lesions, and Life Span
pH-Dependent Toxicity of Cd, Cu,Mi, Ph, and Zn to Ceriodaphniadubia, Pimephales promelas,Hyalella Azteca and Lumbriculusvariegatus)
Status Report on Eutrema PenlandiiRollins as a result of FieldInvestigations in Park, Summit,Gunnison, Chafee, and Clear CreekCounties, Colorado in July andAugust 1991
Responses of Folsomia Fimetaria(Collembola: Isotomidae) to CopperUnder Different Soil CopperContamination Histories inRelation to Risk Assessment
Element Concentrations in Soilsand Other Surficial Materials ofthe Conterminous United States
Trace Metals in Ecosystems:Relationships of the Residues ofCopper, Molybdenum, Selenium, andZinc in Animal Tissues to Those inVegetation and Soil in theSurrounding Environment
Final Work Plan for theEngineering Evaluation/CostAnalysis for Stream Sedimentswithin Oregon Gulch Operable Unit10 (Partial)
Ingested Soil: Bioavailability ofSorbed Lead, Cadmium, Cesium,Iodine, and Mercury
Predicting cadmium, lead andfluoride levels in small mammalsfrom soil residues and by species-species extrapolation
Effects of Acid-Mine Drainage onthe Chemical and BiologicalCharacter of an Alkaline HeadwaterStream
Agronomic Investigations for theUpper Arkansas River RestorationProject -- Part 2 (year 2000)
-v.,:«vvv , /Author •*£;. ' :V.;4-- •..•- - .- - -.. - -.-v -.:••-....• = <: - ••-
Schroeder, H., M. Kanisawa, 1D. Frost and M. Mitchener
Schubauer-Berigan, Mary K. ,Joseph R. Dierkes, Philip D.Monson, Gerald T. Ankley
Schwendinger, R.B., G.K.Carlson, and C.O. Spielman,Jr.
Scott -Fordsmand, J.J., P.H.Krogh, and J.M. Weeks
Shacklette, H.T. and J.G.Boerngen
Sharma, R. P. and J. L. Shupe
Shepherd Miller,Inc . /TerraMatrix
Sheppard, S. C., W. G.Evenden and W. J. Schwartz
Shore, R.F.
Short, T.M., J.A. Black andW.J. Birge
Siemer, E.G.
jjr^^
1993
1991
2000
1984
1970
1994
1995
1995
1990
2000
^
•"":!;.;•..'' .; Reference... - _ : : . •- ..:
surnal of Nutrition 96:37-45
Environmental Toxicology, andChemistry 12:1261-1268
Report to USFWS, ColoradoField Office
Environmental Toxicology andChemistry 19 (5) : 1297-1303
U. S. Geological Survey,Profession Paper 1270
titan State University, Logan,Utah, Utah State UniversityAgricultural ' ExperimentStation Journal Paper No. 2037
Resurrection Mining Company,Denver, Colorado
Journal of EnvironmentalQuality 24:498-505 (1995)
Environmental Pollution88:333-340
Archives of EnvironmentalContamination and Toxicology19:241-248
Unpublished report
-•r; ;;-: '•:: '.Key-Words::, !; .;Ti.-..'.JMammals, arsenic, tin, ^^Hgermanium ^ 1
Invertebrates, Aquatic,Metals, pH, Toxicity
eutrema, penland alpine fenmustard, plants, mosquitorange, endangered species,upper arkansas, terrestrial
terrestrial, copper, soil,invertebrates, metals
Soils, Metals, terrestrial
Mammals, metals, copper,selenium, zinc, soil,vegetation, terrestrial,animals
Sediments, work plan,Oregon Gulch
Soils, Soil-Ingestion,Bioavailability, Metals,Contaminants, Lead,Cadmium, Cesium, Iodine,Mercury, terrestrial
metals, mammals, soil,terrestrial, cadmium, lead
Aquatic Biota, Metals,Effects, acid mine,sediments
arkansas river, vegetation,soils, 11-mile reach,grazing
Page 39
-Doc'Np.V
D00486
D00227
D00228
D00206
D00229
D00230
D00231
D00512
D00511
- yv." ••-'<••'";'•••;•.•' ; .'~<-i t'Tifle •"S'-'i-5"-""lf;''s- '-'* j 'jVK: '?.':•* :'~;?:^K'"'':!;2'--%-:»'-':}< .vW - tf ^ -•,•£''<••'-. -'?; «Agronomic Investigations for theUpper Arkansas River RestorationProject in 1999
Hydroxyl Radical Formation in St.Kevin Gulch, and Iron-Rich Streamin Colorado. In: U. S. GeologicalSurvey, Toxic Substances HydrologyProgram- -Proceedings of theTechnical Meeting, Phoenix,Arizona, September 26-30, 1988
Restoration of a Placer MinedTrout Stream
Transcript from Bernie SmithInterview regarding Hayden &Hallenbeck ranches
Water/Sediment Partitioning ofTrace Elements in a StreamReceiving Acid-Mine Drainage
Partitioning of Metals BetweenWater And Flocculated Bed Materialin a Stream Contaminated by AcidMine Drainage near Leadville,Colorado
Predictive Modeling of Copper,Cadmium, and Zinc PartitioningBetween Streamwater and BedSediment from a Stream ReceivingAcid Mine Drainage, St. KevinGulch, Colorado
Considerations of ObservationalScale when Evaluating the Effectof, and Remediation Strategiesfor, a Fluvial Tailings Deposit inthe Upper Arkansas River Basin,Colorado
Evaluating the Effects of FluvialTailings Deposits on Water Qualityin the Upper Arkansas River Basin,Colorado: Observational ScaleConsiderations
Siemer, E.G.
Sigleo, A. C., K. M.Cuningham, M. C. Goldberg andB.A. Kimball
Skidmore, P.B.
Smith, B., M.R. Nivens
Smith, K.S. and D.L. Macalady
Smith, K.S., D.L. Macaladyand P.H. Briggs
Smith, K.S., J.F. Ranvilleand D.L. Macalady
Smith, K.S., K. Walton-Day,and J.F. Ranville
Smith, K.S., K. Walton-Day,and J.F. Ranville
•J; patch;.
1999
1988
1995
2000
1992
1988
1991
1999
2000
'^^-^•^f^^^o^^--:.;]:^^unpublished report
U. S. Geological Survey,Water ResourcesInvestigations Report 88-4220
Land and Water July/August,1995
Lake County GovernmentTranscripts
Water-Rock Interaction,Proceedings of the 7thInternational Symposium onWater-Rock Interaction - WR-7/Park City/Utah/USA 13-18July 1992
U. S. Geological Survey,Water ResourcesInvestigations Report 88-4220
U.S.G.S. Toxic SubstancesHydrology Program- -Proceedings of the technicalmeeting, Monterey California,March 11-15, 1991. WaterInvestigations Report 91-4034
In: Morganwalp, D.W. andBuxton, H.T. eds., U.S.Geological Survey ToxicSubstances Hydrology Program-Proceedings of the TechnicalMeeting, Charleston, SC, 8-12March 1999, Vol. I.
In: Proceedings from the 5thInternational Conference onAcid Rock Drainage, VolumeII. Published by the Societyfor Mining, Metallurgy, andExploration, Inc., Littleton,CO.
arkansas river, lakecounty, soils, plants,grazing, private lands,forage, vegetation
Metals, Transport, AcidMine Drainage, St. KevinGulch, Colorado, UpperArkansas River
Restoration, Mining, Trout,Montana, Cutthroat,aquatic, fish
Leadville, HallenbeckRanch, Hayden Ranch
Metals, Transport,Sediments, Acid MineDrainage, Upper ArkansasRiver Basin, Colorado, St.Kevin Gulch
Metals, Transport,Sediments, Acid MineDrainage, Leadville,Colorado, St. Kevin Gulch
Sediments, metals, acidmine, St. Kevin's Gulch
arkansas river, fluvial,tailings, 11-mile reach,metals, soils, waterquality, water, groundwater, remediation
arkansas river, fluvial,tailings, 11-mile reach,metals, soils, waterquality, water, groundwater, remediation
Page 40
Doc No.
D00475
D00510
D00320
D00556
D00232
D00233
D00234
D00544
D00235
D00619
D00436
- . .- - -' ; : '•:•• :U • v; ~ Titlef. - :- •- -C-. - ':-. ~^V ' -<^ ^ •••-- ..-•.' - . , '.;.--.: v ...-.••:.>. •.:..-. • -.-
Me ^ Jeaching through a FluvialTa M s Deposit along the UpperArkansas River, Colorado
Trends in water- leachable leadfrom a fluvial tailings depositalong the upper Arkansas River,Colorado
Metal and Arsenic PartitioningBetween Water and SuspendedSediment at Mine-Drainage Site inDiverse Geologic Settings
Arkansas River Water NeedsAssessment
Geochemical Maps of Copper, Lead,and Zinc, Upper Arkansas RiverDrainage Basin, Colorado
Behavior of Trace Metals inMountain Meadow Soils. In:Proceedings of the 3rdIntermountain Meadow Symposium,July 1-3, 1991, Steamboat Springs,Colorado
Toxicity and bioaccumulation ofCadmium and Lead in AquaticInvertebrates
Agenda: Mining, Forest & LandRestoration Symposium/Workshop
Main and Interactive Effects ofArsenic and Selenium on MallardReproduction and Duckling Growthand Survival
The Uptake and Effects of Lead inSmall Mammals and Frogs at a Trapand Skeet Range
Sampling Activities Report,College of the Canons
V'"-'-V •-•."•: :;.:: Author ". -.;..-:•,-••'•>••.• '.,'-:-.-:• ."-.• •'- ••- :.--.'•• -..'-•---:• .-...-.•;•<•'?Smith, K.S., P.J. Lamothe, JA.L. Meier, K. Walton-Day, 'and J.F. Ranville
Smith, K.S., S.J. Sutley,P.H. Briggs, A.L. Meier, K.Walton-Day
Smith, K.S., W.H. Ficklin,G.S. Plumlee and A.L. Meier
Smith, R.E. and L.M. Hill(eds.)
Smith, S.M.
Sommers, L.E., K.A. Barbarickand D.B. Levy
Spehar, R. , R.L. Anderson,J.T. Fiandt
Sponsors: Rocky Mtn. WaterEnvironment AssociationBiosolids Committee, EPA,USCOE
Stanley, T. R., J. W. Spann,G. J. Smith and R. Rosscoe
Stansley, W. , D.E. Roscoe
START, U.S. EnvironmentalProtection Agency
ate:
*
1998
1992
2000
1994
1991
1978
2000
1994
1996
1996
.• .'•-.'vX /-"'Reference. ::! ;•;* :•••--:- /-;
In Proceedings of the 6thInternational Conference onTailings and Mine Waste '99,Fort Collins, Colorado, 24-27January 1999: 627-632.Rotterdam: Balkema
In: Proceedings of the 5thInternational Conference onTailings and Mine Waste '98,Fort Collins, Colorado, 26-29January 1998: 627-632.Rotterdam: Balkema
Hater-Rock Interaction,Proceedings of the 7thInternational Symposium onWater-Rock Interaction - WR-7/Park City/Utah/USA 13-18July 1992
Bureau of Land Management ,Bureau of Reclamation, ForestService, and ColoradoDepartment of NaturalResources
U. S. Geological Survey, Open-File Report 94-408
Colorado State University,Fort Collins, Colorado
Environmental Pollution 15:195
Agenda with Abstracts frompresentations
Archives of EnvironmentalContaminants and Toxicology26:444-431
Archives of EnvironmentalContamination and Toxicology30:220-226
U.S. Environmental ProtectionAgency
v ;;--;" Key Words' -..•-•':2-.-'V^. . :-:. . •".:.<.- >•-;•-: : ••-.•. ' :~ H
arkansas river, fluvial, ^Htailings, metals, water ^^Bquality, ground water
arkansas river, fluvial,tailings, metals, soils, 11-mile reach, water- leachable
Metals, Transport,Sediments, Copper, Arsenic,Zinc, Cadmium, Nickel,mining, drainage
arkansas river, water,recreation, naturalresources, water needs,hydrology, aquatic
Metals, Contaminants, UpperArkansas River Basin,Copper, Zinc, Lead,Geochemistry
Soils, Metals,Contaminants, UpperArkansas River, Leadville,Colorado
Invertebrates, cadmium,lead, aquatic
biosolids, restoration,remediation, mining,
Birds, Waterfowl, Metals,Arsenic, Selenium,Reproduction, terrestrial
Lead, mammals, terrestrial,forgs, metals
college of the canons,arkansas river, downstream,metals, smelter, soils
Page 41
Doc No.
D00522
D00324
D00377
D00239
D00339
D00514
D00240
D00502
D00454
D00242
D00610
D00453
-Cotter Corporation Uranium MillSite
Investigations on Impacts of HighRunoff on Flushing Sediments fromthe Arkansas River and theDissolution and Toxicity of Metalsfrom Sediments on Aquatic Life
Deposition of Cadmium in Tissuesof Coturnix Quail Fed Honey Bees
Vertebrate Abundance and WildlifeHabitat Suitability Near thePalmerton Zinc Smelters,Pennsylvania
Recent Developments in FederalWetlands Law: Part I
Flow Regime Limitations ofColorado Trout Populations:Perspectives for WatershedManagement
Trace Element Accumulation In theTissues of Fish From Lakes withDifferent pH Values
The Utility of Metal Biomarkers inAssessing the Toxicity of Metalsin the American Dipper (Cinclusmexicanus)
A Summary of Environmental StudiesDone in the Upper Arkansas Basinas They Pertain to StreambankErosion in the Area- DRAFT
Reconnaissance of Water Quality ofLake Henry and Lake MeredithReservoir, Crowley County,Southeastern Colorado, April -October 1987
Accumulation of cadmium in and itseffect on bank vole tissues afterchronic exposure
Metal Contamination of a HighAltitude Mountain Valley Meadowdue to Heavy Metal Mining of aWorld Class Ore Body
•H&. ::f ?" »:uthor:">;'4f- /:«J;J!-V:-:5«--i:T3i:-,%-i:':5- •'&:-• \± •^'i^*-.-^'^".'-*
State of Colorado/Cotter
Stednick, J.D.
Stoewsand, G.S., R.A. Morse,C.A. Bache, and D.J. Lisk
Storm, G., R. Yahner and E.Bellis
Strand, Margaret N.
Strange, E. M.
Stripp, R. A., M. Heit, D. C.Bogen, J. Bidanset and L.Trombetta
Strom, S.M.
Studzinski, M.
Sullivan, J.R. Jr.
Swiergosz, R., M. Zakrzewska,K. Sawicka-Kapusta, K. Bacia,and I . Janowska
Swyers, J.A.
••y?a*e1986
1994
1987
1993
1996
1998
1990
2000
1995
1993
1998
1990
;:;:';V;;f ^ lfer e : ; :f';:;
Administrative Record,Remedial Action Plan,Appendix A
Colorado State University,Department of EarthResources, Ft. Collins, CO
Bulletin of EnvironmentalContamination and Toxicology38:783-788
Archives of EnvironmentalContaminants and Toxicology25:428-437
ELR News & Analysis, 6-96
Trout Unlimited, Boulder, CO
Hater, Air and Soil Pollution54:75-87, 1990
Unpublished Thesis, ColoradoState University, Ft.Collins, CO
University College.
U. S. Geological Survey,Water -ResourcesInvestigations Report 91-4102
Ecotoxicology andEnvironmental Safety 41:130-136
Dept . of EnvironmentalTechnology, Colorado MountainCollege, Leadville, Colorado.
<'•• ••;:&iV ":Key;W6rifc ;i 'H ;: • ~v- •••--• - ''vv.'*. •.-•;- ;-v; •-•.-/ ivv-.v.--l.''-rV-yk-.''rLincoln Park, Cotter Mill,arkansas river, Canon City,tailings, uranium, radon,molybdenum, radiation,water, ground-water, soils,biota, vegetation, birds,mammals
Runoff, Sediments, ArkansasRiver, Toxicity, Metals,Aquatic Life, Water Column
Cadmium, Coturnix Quail,Honey Bees, Metals,Contaminant, Insect, birds,terrestrial
Terrestrial Environment,vertebrates, metals,smelters
Wetlands, Federal Law,Clean Water Act, Section 404
flows, river, Colorado,watershed management, fish,trout, arkansas river,water, aquatic
Fish, Metals, pH, aquatic
birds, arkansas river,metals, aquatic,invertebrates, water, alad,biomarkers, dipper
arkansas river, metals,soils, water quality,erosion, lake county, flows,
Water Quality, UpperArkansas River Basin,Colorado, aquatic
mammals, cadmium, metals,toxicity, terrestrial
arkansas river, soils,Seppi, metals, terrestrial
Page 42
Doc No.
D00595
D00628
D00371
D00611
D00248
D00480
D00247
D00249
D00250
D00262
D00264
• • -^- ..-x.w-vjndflcV ,:.::>-,,:..>;v~-.•^^^---•. J-; . .. «.-, v^-^-r •.•.-•• ..-. ••.--.; '.;.--. -yTh ^ Bects of Mining on Mammalsof Be Coeur d'Alene River Basin,Idaho
Small Mammals as Monitors ofEnvironmental Contaminants
Biological Resource Inventory -Pueblo County
Appraisal of Ground Water in theVicinity of the Leadville DrainageTunnel, Lake County, Colorado
Dinero Tunnel Site, ProjectImplementation Plan-DRAFT
Interpretive Report- -Water Qualityand Sediment Chemistry, UpperArkansas River, Colorado: BedloadSediment Sampling Arkansas Rivernear Leadville Colorado
Review of Operations Fryingpan-Arkansas Project Colorado
Heavy Metal Effects on PlantGrowth as Related to AnimalNutrition
Special Report: Study of Effectson Plugging the Leadville DrainageTunnel
Ambient Water Quality Criteria forCadmium (Cover and Criteria)
Ambient Water Quality Criteria forLead
'•>'&,*.-*• •£---. . Author---- ,- •-••••>.:-•- -..'•:.•• -•-•,•••..•:., : - . •,.-..•••*• ' • '. .. .- ••.. -tSzumski, M.J. 1
Talmage, S.S. and B.T. Walton
Todd , D .
Turk, J.T., O.J. Taylor, USGS
U.S. Bureau of Reclamation
U.S. Bureau of Reclamation
U.S. Bureau of Reclamation
U.S. Bureau of Reclamation/E& A EnvironmentalConsultants, Inc.
U.S. Department of Interior
U.S. Environmental ProtectionAgency
U.S. Environmental ProtectionAgency
Jate.;
P"1991
1985
1979
1994
1993
1990
1982
1979
1980
1980
.: "Ui- --Reference •>_ : -::- .- '; -'.•.:•>•U.S. Fish and Wildlife Service
In Reviews of EnvironmentalContamination and Toxicology.Hare, G.W. (ed.) Vol. 119
Colorado Division ofWildlife, Ft. Collins,Colorado for Department ofthe Army, Corps of Engineers,Albuquerque District,Albuquerque, New Mexico
USGS Open-File Report 79-1538
U. S. Bureau of Reclamation,Eastern Colorado Area Office,Great Plains Region, August,1994
unpublished report
U. S. Bureau of Reclamation,in cooperation withSoutheastern Colorado WaterConservancy District •
U. S. Bureau of Reclamation
U.S. BOR, Geological Survey,Bureau of Mines
U. S. EnvironmentalProtection Agency, Off.Water. Reg. and Standards,Criteria and StandardsDivision, Washington, D. C.,EPA 440\5-80-025
U. S. EnvironmentalProtection Agency, Off.Water. Reg. and Standards,Criteria and StandardsDivision, Washington, D. C.,EPA 440/5-84-027
^> i gv Keywords V-vrJfclMining, mammals, Coeur ^^Hd'Alene, Idaho, metals, ^^Bterrestrial
mammals, metals,contaminants, cadmium,copper, lead, zinc.
Biological Resources,Pueblo County, Colorado,Corps of Engineers, FloodControl, invertebrates,aquatics, terrestrial,wildlife
Leadville Drainage Tunnel,Ground Water, CaliforniaGulch
Water Quality, Lake Fork,Sugarloaf, Dinero Tunnel,Upper Arkansas River,Metals, Contaminants,aquatic
arkansas river, sediments,water quality, metals,aquatic, invertebrates
Water Management , TwinLakes, Colorado, Metals,Sediments
Vegetation, Metals,Mammals, Human Health,Contaminants, terrestrial
Leadville Drainage Tunnel,Arkansas River, Mines,
Water Quality, cadmium,metals
Water Quality, metals, lead
Page 43
•DocNo.
D00263
D00356
D00261
D00435
D00357
D00365
D00260
D00251
D00253
D00259
D00427
•<T^m3&?mzm&*m^Ambient Water Quality Criteria forZinc (Cover and criteria only)
Arkansas River Basin Database andCIS Database Content Listing
California Gulch, Colorado SiteFact Sheet
College of the Canons SiteInspection Report
Colorado Department of HealthArkansas River Database and CISDatabase Listings
Draft RI/FS Work Plan, SmeltertownSuperfund Site
Drinking Water Regulations andHealth Advisories
Ecological Effects of Soil LeadContamination
Effects of Exposure to HeavyMetals on Selected Fresh Fish,Toxicity of Copper, Cadmium,Chromium and Lead to Eggs and Fryof Seven Fish Species
EPA Federal Center Library -Contaminants Search
Final Engineering Evaluation/CostAnalysis Feasibility Study:Smeltertown Superfund Site,Smelter Subsite
^
; ??l !w xi?v|.: yU.S. Environmental ProtectionAgency
U.S. Environmental ProtectionAgency
U.S. Environmental ProtectionAgency
U.S. Environmental ProtectionAgency
U.S. Environmental ProtectionAgency
U.S. Environmental ProtectionAgency
U.S. Environmental ProtectionAgency
U.S. Environmental ProtectionAgency
U.S. Environmental ProtectionAgency
U.S. Environmental ProtectionAgency
U.S. Environmental ProtectionAgency
-
V.DatiKt: -.-',: - :• •-1980
1994
1995
1995
1994
1993
1995
1992
1976
1995
1995
*_
;*?'.« "'p v. R e '& tv ' -i :<U. S. EnvironmentalProtection Agency, Off.Water. Reg. and Standards,Criteria and StandardsDivision, Washington, D. C.,EPA 440\5-80-079
U.S. Environmental ProtectionAgency Region VIIIHeadwaters Mining InitiativeCommittee in Conjunction withU.S. Fish and WildlifeService Colorado Field Office
U. S. EnvironmentalProtection Agency
U.S. Environmental ProtectionAgency
U.S. Environmental ProtectionAgency Region VIII HeadwatersMining Initiative Committeein conjunction with U.S. Fishand Wildlife Service ColoradoField Office, September 1994
U.S. Environmental ProtectionAgency, EPA Work AssignmentNo. 63-8LJ6, ARCS ContractNo. 68-W8-0112
U. S. EnvironmentalProtection Agency, Office ofWater, Washington, D. C.,May, 1995
U. S. EnvironmentalProtection Agency, ToxicsIntegration Branch, Office ofEmergency and RemedialResponse
U. S. EnvironmentalProtection Agency,Environmental ResearchLaboratory, Duluth, Minnesota55884 EPA-600/3-76-105,October 1976
U. S. EnvironmentalProtection Agency Library
U.S. Environmental ProtectionAgency, ARCS Contract No. 68-W8-0112, EPA Work AssignmentNo. 63-8LJ6
; : - ¥iiilKiyW[6rdsC'r%-V; -,f ;%•;
Water Quality, zinc, metals
Arkansas River, WaterChemistry, Fish,Invertebrates, Metals, CIS
California Gulch-General
college of the canons,arkansas river, downstream,metals, smelter, aquatic,air, sediment, waterquality, soils
Arkansas River Basin,Hardrock Mining, Smelting,water Quality, Fish,Sediment, Metals
RI, FS, SmeltertownSuperfund Site, Salida,Colorado, Zinc,Contamination, metals
Water Quality Standards,Drinking Water Regulations,Human Health
Soils, Metals, Lead,Effects, Bioavailability,Invertebrates, Plants,Mycorrhizae, Mammals,terrestrial
Fish, Metals, Effects,aquatic
Bibliography
Smeltertown, downstream,arkansas river, metals,remediation, smelting,ecological risk summary
^Page 44
. Doc No'.
D00429
D00430
D00438
D00431
D00257
D00256
D00416
D00368
D00101
D00504
•••--'-:•' :.--:-• A.?; Title \- -.'.••-"• --^^---.-.••k "•.'-••i.-/.'- -•--.-••• •.-•--..•..-, '. ,-.-•-••• '- :Fi ^ Kport Smelter town Super fundSiSMrcvestigation, Volume 1 of 3
Final Report Smeltertown SuperfundSite Investigation, Volume 2 of 3(Appendix A: XRF Final Report)
Final Report, Smeltertown SiteInvestigation II: Extended SiteCharacterization, Volume 1 of 4
Human Health Baseline RiskAssessment, Smeltertown SuperfundSite
Interpretive Addenda forCalifornia Gulch RemedialInvestigation, Leadville, Colorado
Phase I Remedial InvestigationReport, California Gulch,Leadville, Colorado
Proceedings of Public Meeting Re:Proposed Plan for the FormerKoppers Woodtreating Site,Smeltertown Superfund Site
Quality Assurance Project PlanSmeltertown RI/FS
Record of Decision (ROD) Abstracts-California Gulch
Responsiveness Summary to Commentson the "Work Plan", Upper ArkansasRiver Fluvial Tailings III - SoilAmendment Remediation Project
- - • -.--Author' -:..-!•;• -, ,- , - . - • - - • • . . - . . • • - -. • • _ • • • • - . . - . , . - . • . • : • • • • • • - : •
U.S. Environmental Protection jAgency
U.S. Environmental ProtectionAgency
U.S. Environmental ProtectionAgency
U.S. Environmental ProtectionAgency
U.S. Environmental ProtectionAgency
U.S. Environmental ProtectionAgency
U.S. Environmental ProtectionAgency
U.S. Environmental ProtectionAgency
U.S. Environmental ProtectionAgency
U.S. Environmental ProtectionAgency
Date
•1993
1994
1995
1987
1987
1997
1993
1999
2000
;;-.. •'-.'; - ^Reference ...:rr> . . .'
U.S. Environmental ProtectionAgency, EPA Work AssignmentNo. 4-650, Weston work OrderNo. 3347-34-01-5650-01, EPAContract No. 68-03-3482
U.S. Environmental ProtectionAgency, EPA Work AssignmentNo. 4-650, Weston Work OrderNo. 3347-34-01-5650-01, EPAContract No. 68-03-3482
U.S. Environmental ProtectionAgency, EPA Work AssignmentNo. 5-650, Weston Work OrderNo. 3347-35-01-6650-01, EPAContract No. 68-03-3482
U.S. Environmental ProtectionAgency, Contract No. 68-W8-0112, EPA Work Assignment No.63-8LJ6, CH2M Hill MasterProject No. RME68111
U. S. EnvironmentalProtection Agency, WA25.8V29.0
U. S. EnvironmentalProtection Agency, WA 53-8L29.0/W63781.R1, May, 1987
U.S. Environmental ProtectionAgency
U.S. Environmental ProtectionAgency, EPA Work AssignmentNo. 63-8LJ6, ARCS ContractNo. 68-W8-0112
U.S. EPA website,http : //www. epa . gov/ super fund/sites/rodsites/0801478 .htm
Unpublished response tocomments
. •'•---• -'AKey Words' •-•••::-.-*J.VJJ•._-••.... : -!•••.<•- . - . - • t '."..•.:•.• '.jjgBj
Smeltertown, downstream, ^^Harkansas river, metals, ^Hremediation, smelting,soils, water quality,ground water
Smeltertown, downstream,arkansas river, metals,remediation, smelting, soils
smeltertown, arkansasriver, downstream, waterquality, metals, soils,aquatic, toxicity testing,smelter, fish
smeltertown, downstream,arkansas river, metals,remediation, smelting,soils, human health
RI/FS, California Gulch,Leadville, Colorado, metals
RI/FS, California Gulch,Leadville, Colorado
smeltertown, downstream,arkansas river, publicmeeting
RI, Hazardous Waste Sites,Smeltertown, Superfund Site
abstracts, CaliforniaGulch, record of decision,ROD
arkansas river, biosolids,vegetation, metals, soils,amendments, fluvial, 11-mile reach, tailings
Page 45
DooNp.
D00490
D00432
D00433
D00418
D00428
D00258
D00245
D00252
D00290
D00255
D00266
D00407
•Responsiveness Summary to Commentsto Alternatives Analysis UpperArkansas River Fluvial Tailings -Soil Amendment Remediation Project
Smeltertown Ecological RiskAssessment, Smeltertown SuperfundSite
Smeltertown Superfund Site,Consent Decree for RemedialDesign/Remedial Action for OU2
Smeltertown Superfund Site, Recordof Decision, 6/4/98
Smeltertown Superfund Site,Smelter Subsite RI , Volume ! Of II
Smeltertown, Colorado Site FactSheet
Summary, California Gulch,Remedial Investigation/ FeasibilityStudy
Tailings Pile Inventory ofCalifornia Gulch (SCAP) Site,Leadville, Colorado (cover only)
Upper Arkansas Fluvial TailingRemovals 2002 Interim Monitoringreport
Yak Tunnel Operable UnitFeasibility Study, CaliforniaGulch Site - Volume I and Volume II
Final Scoping Document, Strategyfor Development of the Work Planto Assess Pre-mining Geochemistry,California Gulch Study Area,Leadville, Colorado
1988 Leadville Mine DrainageTunnel Pilot Plant Studies: Acuteand Chronic Toxicity Results
A
?$*&} x£ /^f^foK^^r^f ¥• !
U.S. Environmental ProtectionAgency
U.S. Environmental ProtectionAgency
U.S. Environmental ProtectionAgency
U.S. Environmental ProtectionAgency
U.S. Environmental ProtectionAgency
U.S. Environmental ProtectionAgency
U.S. Environmental ProtectionAgency
U.S. Environmental ProtectionAgency
U.S. Environmental ProtectionAgency
U.S. Environmental ProtectionAgency
U.S. Environmental ProtectionAgency, Roy F.Weston, Inc.
U.S. Environmental ProtectionAgency, U.S. Bureau ofReclamation
I
iiBate
1999
1995
1999
1998
1994
1993
1983
1988
2002
1987
1992
1988
fe-
;••:.« -x£ K-.;' ;JReferehce} .-i->i -v ;&w:; i •!-.<:';-'-- :.oJv.---.-..;i'.->--!- ff!T~.' "\i -'•?*letter report to UpperArkansas River RestorationProject Core Team
U.S. Environmental ProtectionAgency, Contract No. 68-W8-0112, EPA Work Assignment No.63-8LJ6, CM2M Hill MasterProject No. RME68111
U.S. Environmental ProtectionAgency
U.S. Environmental ProtectionAgency
U.S. Environmental ProtectionAgency, ARCS Contract No. 68-H8-0112, EPA Work AssignmentNo. 63-8LJ6, CH2M Hill MasterProject No. RME68111
U. S. EnvironmentalProtection Agency
U.S. EPA Region VIII,Superfund Program 83-C-2388
U. S. EnvironmentalProtection Agency,Environmental MonitoringSystems Laboratory, LasVegas , Nevada
U.S. Environmental ProtectionAgency Region 8
CJ. S. EnvironmentalProtection Agency, WA 53-8L29.0/W63785.T1, June 1987
U. S. EnvironmentalProtection Agency, In:Remedial Planning Activitiesat Selected UncontrolledHazardous Substance DisposalSites in the Zone of RegionsVI, VII, and VIII, Arcs VI,VII, VIII
Unpublished Study Report
7 «:gi™ Key:yy f ggiiiarkansas river, fluvial,tailings, metals,remediation, 11-mile reach,soils, amendments, biosolids
Smeltertown, downstream,arkansas river, metals,smelting, soils, ecologicalrisk, water quality,aquatic, terrestrial,birds, mammals, plants,sediment
Smeltertown, consentdecree, arkansas river,downstream, remediation
Smeltertown, arkansasriver, rod, metals,downstream
Smeltertown, downstream,arkansas river, metals,remediation, smelting,soils, water quality,ground water
Smeltertown
RI/FS, California Gulch
California Gulch-General,tailings
fluvial tailings, mining,upper arkansas river,biosolids, lime, metals,groundwater
Yak Tunnel, CaliforniaGulch, RI/FS
Soils, California Gulch,Leadville, Colorado,geochemistry, work plan
Leadville Mine DrainageTunnel, toxicity tests,arkansas river
Page 46
; Doc No.
D00355
D00268
D00272
D00270
D00269
D00578
D00579
D00574
D00274
D00276
D00277
\.-.^^:f- •.","-•.'•-;"•'•• ™«.: V'v;... '-'..'.%•-.. -•'•••/•'-.'Di ^ H'ield Sampling Plan:SmSWrtown RemedialInvestigation/Feasibility Study
Final Baseline Aquatic EcologicalRisk Assessment: California GulchNPL Site
Minimal Program Requirements forSoil Sampling for the TerrestrialEcosystem Evaluation at theCalifornia Gulch Site, Leadville,Colorado
Minimum Program Requirements forField Surveys for TerrestrialEcosystem Evaluation at theCalifornia Gulch Site, Leadville,Colorado
Site Management Plan, Volume III,California Gulch NPL Site,Leadville, Colorado
Volume I, Site Management Plan,California Gulch, Leadville, CO
Volume II, Site Management Plan,California Gulch, Leadville, CO
U.S. Fish and Wildlife Service,Region 6, Policy on StreambedStabilization Projects
Greenback Cutthroat Trout RecoveryPlan, Final Greenback CutthroatTrout Recovery Team Submission-DRAFT
Lead Hazards to Fish, Wildlife,and Invertebrates: A SynopticReview (cover only)
Methods for the Assessment andPrediction of Mineral MiningImpacts on Aquatic Communities: AReview and Analysis
:"::"• '"••^^•Authprv.-;. -.••:;- '
U.S. Environmental Protection 1Agency/CH2M Hill "
U.S. Environmental ProtectionAgency/Roy F. Weston, Inc.
U.S. Environmental ProtectionAgency/Roy F. Weston, Inc.
U.S. Environmental ProtectionAgency/Roy F. Weston, Inc.
U.S. Environmental ProtectionAgency/Roy F. Weston, Inc.
U.S. Environmental ProtectionAgency/Roy F. Weston, Inc.
U.S. Environmental ProtectionAgency/Roy F. Weston, Inc.
U.S. Fish and WildifeService, Region 6, Denver,Colorado
U.S. Fish and Wildlife Service
U.S. Fish and Wildlife Service
U.S. Fish and Wildlife Service
J>ate
mf
1995
1991
1991
1991
1990
1990
2001
1995
1988
1978
'-.;j:'1.-:>\- :- Reference "; j '-A -U.S. Environmental ProtectionAgency, EPA Work AssignmentNo. 68-W8-0112
CJ. S. EnvironmentalProtection Agency, RegionVIII, Work Assignment No. 31-8L29, DCN 4800-31-0123
U. S. EnvironmentalProtection Agency, RegionVIII, Denver, Colorado DCN4800-01-0799
U.S. Environmental ProtectionAgency, Region VIII, Denver,Colorado DCS 4800-01-0793
U. S. EnvironmentalProtection Agency, RegionVIII, Denver, Colorado DCN4800-01-0666
U.S. Environmental ProtectionAgency, Region VIII, Denver,CO, DCN: 4800-01-0382
U.S. Environmental ProtectionAgency, Region VIII, Denver,CO, DCN: 4800-01-0382
U.S. Fish and WildlifeService, Region 6, Denver,Colorado
U. S. Fish and WildlifeService, Region 6, Denver,Colorado, Prepared andSubmitted by: GreenbackCutthroat Trout RecoveryTeam, 28 February 1995
U. S. Fish and WildlifeService, Biological Report85(1.14) , April 1988
U. S. Fish and WildlifeService, Office of BiologicalServices, Eastern Energy andLand Use Group, WorkshopProceedings, December 6-7,1977, April 1978, William T.Mason, Jr., Editor
•"* O' r-fvVKeyWofts- ;,-? j '^\
Smelt ertown, RI, ^^HFeasibility, Superfund, ^ 1Colorado Zinc Company,Beazers EastEcological Risk Assessment,Aquatic, Leadville,Colorado, Upper ArkansasRiver, California Gulch
Soils, California Gulch,terrestrial, Leadville
RI/FS, terrestrial,California Gulch
Management Plan, CaliforniaGulch, Leadville, CO
California Gulch,Leadville, Arkansas River,RI, Metals, Contaminants
California Gulch,Leadville, Arkansas River,RI, Metals, Contaminants
streams, stabilization,morphology, restoration
Fish, Trout, Cutthroat,Greenback, Recovery Plan,aquatic
Fish, aquatic, lead, metals
Aquatic Biota, Mining,Impacts Assessment
Page 47
'•"Doc-No:-'
D00370
D00487
D00280
D00279
D00333
D00278
D00281
D00282
D00063
D00465
D00468
D00469
D00472
?* '- i! !i PMl ?l;lvMTwo Forks Reservoir & William'sFork Gravity Collection SystemProjects Colorado
Clear Creek Reservoir Reclamationand Arkansas River Fish Kill: AReview and Evaluation of the Useof Rotenone
Assessment of the Trout Populationin the Upper Arkansas River Basinof Central Colorado
Compilation of Records of SurfaceWaters of the United Statesthrough September 1950
Summary of Discharge MeasurementData, Arkansas River, CO
Upper Arkansas Surf ace -WaterToxics Project Bibliography
A Colorado History (Cover Only)
A Colorado Reader (Cover only)
1998 Sampling and AnalysisReport : Upper Arkansas RiverMonitoring Wells, Leadville, .Colorado
Alternatives Analysis, UpperArkansas River Fluvial Tailings,Lake County, Colorado
Alternatives Analysis, UpperArkansas River Fluvial Tailings,Lake County, Colorado
Alternatives Analysis, UpperArkansas River Fluvial Tailings,Lake County, Colorado
Biosolids Sampling Plan, UpperArkansas Fluvial TailingsBiosolids Revegetation Project,Leadville, Colorado
3$^g$^$^g&*^?U.S. Fish and Wildlife Service
U.S. Fish and WildlifeService for Colorado Divisionof Wildlife
U.S. Fish and WildlifeService with ColoradoDivision of Wildlife
U.S. Geological Survey
U.S. Geological Survey
U.S. Geological Survey
Ubbelohde, C., M. Benson,D.A. Smith
Ubbelohde, C., M. Benson,D.A. Smith
URS Operating Services
URS Operating Services, USEnvironmental ProtectionAgency
URS Operating Services, USEnvironmental ProtectionAgency
URS Operating Services, USEnvironmental ProtectionAgency
URS Operating Services, USEnvironmental ProtectionAgency
?pate-4
1987
1988
1993
1955
1996
1993
1995
1982
1999
1997
1999
1999
1998
^^^ik^^^^^^^^nU.S. Pish and WildlifeService, Fish and WildlifeCoordination Report, Denver,Colorado
unpublished report
U.S. Bureau of Reclamation,Eastern Colorado ProjectsOffice, Loveland, CO
U. S. Geological Survey,Hater-Supply Paper 1311
U.S. Geological Survey, WaterResources Division, SummaryData
U. S. Geological Survey
Pruett Press, Boulder,Colorado 339p.
Pruett Press, Boulder,Colorado 342p.
URS, START EPA Region 8,Contract No. 68-W5-0031, TDDNo. 9702-0025
URS, START EPA Region 8,Contract No. 68-W5-0031, TDDNo. 9702-0025
URS, START EPA Region 8,Contract No. 68-W5-0031, TDDNo. 9702-0025
URS, START EPA Region 8,Contract No. 6B-W5-0031, TDDNo. 9702-0025
URS, START EPA Region 8,Contract No. 68-W5-0031, TDDNo. 9702-0025
v " i!Key:-W6rais&Sa::.%?«, ft.-i .-.«.-.- ,:« QsViPi 'V.V. • Z i'«fe*1* !v-&4.;?--rTwo Forks Reservoir,William's Fork GravityCollection System,Colorado, Coordination,Biological Opinions
arkansas river, fish,aquatic, fish kill, trout,clear creek reservoir,rotenone
fish, trout, brown trout,arkansas river, metals,aquatic, water quality.Upper Arkansas River
Hydrology, Surface Water,Discharge Records, ArkansasRiver Basin, Colorado
Discharge, Arkansas River,Colorado, Malta, Leadville
Bibliography
Colorado History
Colorado History
Arkansas River, aquatic,wells, groundwater
arkansas river, tailings,metals, soils, 11-milereach, fluvial, amendments,revegetation, biosolids,remediation
arkansas river, tailings,metals, soils, 11-milereach, fluvial, amendments,revegetation, biosolids,remediation
arkansas river, tailings,metals, soils, 11-milereach, fluvial, amendments,revegetation, biosolids,remediation
arkansas river, tailings,metals, soils, 11-milereach, fluvial, groundwater, water quality,sampling
Page 48
Doc No.
D00473
D00508
D00500
D00463
D00466
D00470
D00458
D00509
D00467
D00467B
D00460
D00461
.. - v • •,-, ; :-; .?.;-%TOte *; • •, ;;-.;- $$. #*&•B ^ Hds Sampling Report, UpperArnlKs River Tailings BiosolidsRevegetation Project, Leadville,Colorado - DRAFT
Draft Alternatives Analysis forthe Year 2000, Upper ArkansasRiver Fluvial Tailings, LakeCounty, Colorado
Draft Work Plan/2000 Field Season,Upper Arkansas River FluvialTailings Soil Amendment/Revegetation Project
DRAFT- -Work Plan, Upper ArkansasRiver Fluvial Tailings SoilAmendments/Revegetation Project,Leadville, Colorado
Field Sampling Plan, CaliforniaGulch, Arkansas River FluvialTailings, Leadville, Colorado
Field Sampling Plan, UpperArkansas River Fluvial TailingsMonitoring Wells, Leadville,Colorado
Hydrologic and HydraulicAssessment, Brovmfields- -UpperArkansas River, Leadville, Colorado
Monitoring Plan, BiosolidsRevegetation Project, UpperArkansas River Fluvial Tailings,Lake County, Colorado
Sampling Activities Report, Fall1997 Sampling, Upper ArkansasRiver Fluvial Tailings, Leadville,Colorado
Sampling Activities Report, Fall1997 Sampling, Upper ArkansasRiver Fluvial Tailings, Leadville,Colorado, Appendix B, PhotographicResults
Sampling Activities Report, UpperArkansas River Fluvial Tailings,Leadville, Colorado
Sampling Activities Report, UpperArkansas River Fluvial Tailings,Leadville, Colorado: Appendix B--Photographic Results
;;v,y:: ' •;;,• .Author *,-; ..._;v;' :/
URS Operating Services, US 1Environmental Protection *Agency
URS Operating Services, USEnvironmental ProtectionAgency
URS Operating Services, USEnvironmental ProtectionAgency
URS Operating Services, USEnvironmental ProtectionAgency
URS Operating Services, USEnvironmental ProtectionAgency
URS Operating Services, USEnvironmental ProtectionAgency
URS Operating Services, USEnvironmental ProtectionAgency
URS Operating Services, USEnvironmental ProtectionAgency
URS Operating Services, USEnvironmental ProtectionAgency
URS Operating Services, USEnvironmental ProtectionAgency
URS Operating Services, USEnvironmental ProtectionAgency
URS Operating Services, USEnvironmental ProtectionAgency
ate
•g~
1999
2000
1999
1996
1998
1998
1999
1998
1998
1997
1997
„•;;• .'-.rj .'-:'. .Reference;. •'-; ' •V .V':*-'-URS, START EPA Region 8,Contract No. 68-W5-0031, TDDNo. 9702-0025
URS, START EPA Region 8,Contract No. 68-W5-0031, TDDNo. 9702-0025
URS, START EPA Region 8,Contract No. 68-W5-0031, TDDNo. 9702-0025
URS, START EPA Region 8,Contract No. 68-W5-0031, TDDNo. 9702-0025
URS, START EPA Region 8,Contract No. 68-W5-0031, TDDNo. 9605-0016
URS, START EPA Region 8,Contract No. 68-W5-0031, TDDNo. 9702-0025
URS, START EPA Region 8,Contract No. 68-W5-0031, TDDNo. 9703-0008
URS, START EPA Region 8,Contract No. 68-W5-0031, TDDNO. 9702-0025
URS, START EPA Region 8,Contract No. 68-W5-0031, TDDNo. 9702-0025
ORS, START EPA Region 8,Contract No. 68-W5-0031, TDDNO. 9702-0025
URS, START EPA Region 8,Contract No. 6B-W5-0031, TDDNo. 9609-0005
URS, START EPA Region 8,Contract No. 68-WS-0031, TDDNo. 9609-0005
-^.f;:* j yyr-Key Words: '. i- /' > JX- J
arkansas river, tailings , Hmetals, soils, 11-mile ^^Hreach, fluvial, amendments,biosolids
arkansas river, fluvial,tailings, metals,remediation, 11-mile reach,soils, amendments,biosolids, remediation
arkansas river, tailings,metals, soils, 11-milereach, fluvial, amendments,biosolids
arkansas river, tailings,metals, soils, 11-milereach, fluvial, amendments,revegetation, biosolids,remediation
arkansas river, tailings,metals, soils, 11-milereach, fluvial, sampling
arkansas river, tailings,metals, soils, 11-milereach, fluvial, groundwater, water quality,sampling
arkansas river, hydrology,hydraulics, flows, 11-milereach
arkansas river, fluvial,tailings, metals,remediation, 11-mile reach,soils, amendments,biosolids, remediation
arkansas river, tailings,metals, soils, 11-milereach, fluvial, sampling,hayden ranch
arkansas river, tailings,metals, soils, 11-milereach, fluvial, sampling,hayden ranch
arkansas river, tailings,metals, soils, 11-milereach, fluvial,characterization
arkansas river, tailings,metals, soils, 11-milereach, fluvial,characterization, photos
Page 49
\PpcNp ^
D00462
D00459
D00464
D00471
D00550
D00283
D00476
D00445
D00451
D00450
D00415
•' ;*%Sj;Sv - -OT«e.*f*S/ :s;: fevi:>. ;: •'••S*,^.*.-.:--:-*?!.-'.---.--™ •.•«"-4'1:J*r/*;-}1.-J-.-i.-.:-A--.-r-. .':Sampling Activities Report, UpperArkansas River Fluvial Tailings,Leadville, Colorado: Appendix B--Photographic Results
Sampling Activities Report --July1998, Upper Arkansas River FluvialTailings Monitoring Wells,Leadville, Colorado
Work Plan 1998 Biosolids Projects,Upper Arkansas River FluvialTailings, Leadville, Colorado
Work Plan, Upper Arkansas FluvialTailings Biosolids RevegetationProject, Leadville, Colorado
Screening Level Soil SamplingResults on Private Property, UpperArkansas River
Abiotic and Biotic FactorsInfluencing in situ Trace Metallevels in Macroinvertebrates inFreshwater Ecosystems
Effects of Placer Gold Mining onPrimary Production in SubarcticStreams of Alaska
Data provided by Dr. B. Smith
Data provided by Mrs. Edith Seppi
Restoration Ecology: SpecialSupplement. ..Riparian Restoration
U.S. Geological Survey ToxicSubstances Hydrology Program- -Proceedings of the TechnicalMeeting, Monterey, CA, March 1991
i >:A}V A' M:&csi:. Afith'or.S\Htfl- t-v.'*-.-=#l-'y/;. .::vCr-'....-..'-v--f.';S-.r-i"?t.:; -T.;" »' r".a-' ~ •".-:.- URS Operating Services, USEnvironmental ProtectionAgency
URS Operating Services, USEnvironmental ProtectionAgency
URS Operating Services, USEnvironmental ProtectionAgency
URS Operating Services, USEnvironmental ProtectionAgency
US Bureau of Reclamation andUS Bureau of Land Management
van Hattum, Bert, Klaas R.Timmermans, Harrie A. Covers
Van Nieuwenhuyse and J.D.LaPerriere
various
various
various
various... . see contentspage-articles highlighted areincluded
SPate*-:1998
1998
1998
1998
2001
1991
1986
1999
1999
1997
1991
••f^W^^^mnct^jj^^^^URS, START EPA Region 8,Contract No. 68-W5-0031, TDDNo. 9702-0025
URS, START EPA Region 8,Contract No. 68-W5-0031, TDDNO. 9702-0025
URS, START EPA Region 8,Contract No. 68-W5-0031, TDDNo. 9702-0025
URS, START EPA Region 8,Contract No. 68-W5-0031, TDDNo. 9702-0025
Memo from US BOR to LakeCounty Soil ConservationDistrict
Environmental Toxicology andChemistry, 10:275-292
Hater Resources Bulletin22(1) : 91-99
unpublished reports
various
Restoration Ecology 5 (4s)121pp.
U.S. Geological Survey, Water-Resources InvestigationsReport 91-4034
n^^^^^m^Mmarkansas river, tailings,metals, soils, 11-milereach, fluvial,characterization, photos
arkansas river, tailings,ground water, monitoring,metals, water quality, 11-mile reach, demonstrationsites
arkansas river, tailings,metals, soils, 11-milereach, fluvial, amendments,revegetation, biosolids,remediation
arkansas river, tailings,metals, soils, ll-milereach, fluvial, amendments,revegetation, biosolids,remediation
soil sampling, upperarkansas, metals, privatelands,
Invertebrates, Aquatic,Metals, bioavailability,sediment
placer mining, effects,primary production,sediments, algae, mining,oxygen, aquatic, stream,water quality, alaska
arkansas river,osteochondrosis, forage,terrestrial, livestock,soils, plants, 11-mile reach
soils, forage, metals, 11-mile reach, Californiagulch, water, livestock,arkansas river, maps, rangemanagement
restoration, riparian,upper arkansas, landscapeapproach, watershed scale,prioritization
arkansas river, toxicsubstances, acid minedrainage, sediments,metals, water quality,metal loading
Page 50
Doc No.
D00613
D00532
D00313
D00284
D00285
D00394
D00376
D00446
D00588
D00286
' . :- JL . r" "X;-; .-Title'-1;. - -H-, ',-.v •••.:,-:-.j^.~ .'-•',-• -;...-.. •-- •-,.-; •:. .-. ,• . :;. -•• ...
H^^^Kdmium Residues Observeddu Bg a Pilot Study in Shorebirdsand Their Prey Downstream from theEl Salvador Copper Mine, Chile
Bird List - Upper Arkansas River,Lake County
Seasonal Relationships Between theBenthos, Invertebrate Drift andBrown Trout Predation (AbstractOnly)
Effects of Copper, pH and Hardnesson the Critical SwimmingPerformance of Rainbow Trout(Salmo giardneri Richardson)
Mercury, Arsenic Lead, Cadmium,and Selenium Residues in Fish,1971-1973, National PesticideMonitoring Program
Impact of Water Level Changes onWoody Riparian and WetlandCommunities
Preliminary Assessment of theEffects of Acid Mine Drainage onGround Water Beneath a WetlandNear Leadville, Colorado
Effects of Fluvial TailingsDeposits on Soils and Surface- andGround-Water Quality, andImplications for Remediation- -Upper Arkansas River, Colorado,1992-96
use of Mass-Flow Calculations toIdentify Processes ControllingWater Quality in a SubalpineWetland Receiving Acid MineDrainage, St. Kevin Gulch, Colorado
Hydrology and Geochemistry of aNatural Wetland Affected by AcidMine Drainage, St. Kevin Gulch,Lake County, Colorado - DRAFT
-?.'• --.v'i"' .-«•>•-, Author- ; - •:. --'.-' t'-- "^.•' • '.. '- . ' -f~ - '-'. --•.'- • ' • ' . ~i
Vermeer, K. and J.C. Castillafl
Voynick, S.
W. , David S.
Waiwood, K. G. and F. W. H.Beamish
Walsh, D., B Berger and J.Bean
Walters, M.A., R.O. Teskey,T.M. Hinckley
Walton-Day, K. , and P.H.Briggs
Walton-Day, K. , F.J. Rossi,L.J. Gerner, J.B. Evans, T.J.Yager, J.F. Ranville, andK.S. Smith
Walton-Day, K., P.H. Briggs,and S . B . Romberger
Walton-Day, Katherine
Dat?
Bn~
1992
1988
1978
1977
1980
1988
2000
1991
1995
V/r' •;•". -v'-r Reference;.' - -*:*:':-v;.';"V ''•-.Bulletin of EnvironmentalContaminant Toxicology 46:242-248
bird list from Mr. SteveVoynick
Colorado State University,Fort Collins, Colorado, M. S.Thesis
Water Research 12:611-619
Pesticides MonitoringJournal 11:5-34
US FWS Biological ServicesProgram, Volume VIII PacificNorthwest and Rocky MountainRegions (FWS/OBS-78/94)
U.S. Geological Survey, WaterResources InvestigationsReport 88-4220
U.S. Geological Survey, Water-Resources InvestigationsReport 99-4273100pp.
In Proceedings ofInternational Conference onTailings/ Mine Waste
U. S. Geological Survey,Denver, CO
o-v- .-, - -.0 .Ke/Wbrds-x i- ; > V 1. ..v.... .--.•-.•;• -.'.-•.•• ••:• fjj.,.^m*imetals, cadmium, copper, Bmines, birds, terrestrial^^l
birds, species list, upperarkansas, riparian
Fish, Trout, invertebrates,aquatic
Fish, Metals, Trout,Copper, aquatic, pH
Fish, mercury, arsenic,lead, cadmium, selenium,metals, pesticidess
water, riparian, wetland,aquatic
St. Kevin Gulch, Leadville,Acid Mine Drainage,Wetland, Tennessee Creek,East Fork of the ArkansasRiver, Sulfide
arkansas river, 11-milereach, tailings, waterquality, aquatic, metals,soils, fluvial deposits
water quality, acid mine,wetland, cadmium, zinc,metals
Wetland/Riparian, Metals,Acid Mine Drainage, St.Kevin Gulch, Leadville,Colorado, Hydrology,Geochemistry, aquatic
Page 51
:.DocN<v;.
D00287
D00289
D00557
D00404
D00291
D00011
D00292
D00293
D00537
D00294
D00295
•^'-:^<*S^^!ttm'S^p^Z;iyf^:::;,•';• :.;:•;.• vSi -f~ .:• :>v "•••'•' JT- ?•'*"'«";•&!;•«-•••!••• :- f X'« . ,:Iron and Zinc Budgets in SurfaceWater for a Natural WetlandAffected by Acidic Mine Drainage,St. Kevin Gulch, Lake County,Colorado- DRAFT
CONFIDENTIAL - Water-Quality, SoilChemistry, and Geologic Data for aProperty along the Arkansas Rivernear Leadville, Colorado
Effects of Remediation onGeochemistry and Hydrology of theUnsaturated Zone of FluvialTailings Deposits in theFloodplain of the Upper ArkansasRiver, Colorado
Effect of Placer Mining (Dredging)on a Trout Stream
Effect of Mine Drainage on theQuality of Streams in Colorado
The WRRI Trout Cover RatingMethod: Development and Application
The Effect of Graded Doses ofCadmium on Lead, Zinc and CopperContent of Target and IndicatorOrgans in Rats (Front page)
Cadmium Content of Indicator andTarget Organs in Rats after GradedDoses of Cadmium (First page)
Use of Environmental Variables toEstimate Metal Loads in Streams,Upper Arkansas River Basin,Colorado
Selected Hydrologic Data for theUpper Arkansas River Basin,Colorado, 1986-1989
Uptake and Retention of Cadmium byM| £d Ducks
y y; ££f yttiQ igv | 'H$g*::Walton-Day, Katherine
Walton-Day, Katherine andTracy J. Yager
Walton-Day, K. , R.w. Healy,F.B. Maestas, and A. Ranalli
Webb, W.E. and O.E. Casey
Wentz, D.
Wesche, T.A.
Wesenberg, G. B. R. , G. Fosseand P. Rasmussen
Wesenberg, G., G. Fosse, P.Rasmussen and N. P. B.Justesen
Wetherbee, G.A. and B.A.Kimball
Wetherbee, G.A., B.A. Kimballand W.S. Maura
White, D. and M. Finley
¥-Date*£
1995
1992
2000
1961
1974
1980
1981
1981
1991
1991
1978
_
il' ;i¥iv a'" ;':i ;R«terence: L'i:J.'jS;'<>i'-- -y?•: •;»'• ~.:~fi~. ' :•• •" ?.' -" :, ••• ••". V -. Wi ••' > 5~ " >-:T i.
in Morganwalp, D.W., andAronson, D.A, (eds.), U.S.Geological Survey ToxicSubstances in HydrologyProgram- -Proceedings of theTechnical Meeting, ColoradoSprings, CO: U.S.G.S. Water-Resources InvestigationsReport 94-4015, 2:759-764
U. S. Bureau of LandManagement , prepared by U . S .Geological Survey, WaterResources Division, ColoradoDistrict, December, 1992
In Proceedings from the FifthInternational Conference onAcid Rock Drainage, VolumeII, 2000, pp. 1450
State of Idaho, Department ofFish and Game Report, ProjectDJ-F-34-R, Job 3
U. S. Geological Survey,Colorado Resource Circ. No.21, 117p.
Water Resources Series No. 78Completion Report, WaterResources Research Institute,University of Wyoming
American Journal ofEnvironmental Studies 17:191-200
International Journal ofEnvironmental Studies 16:147-155
in Mallard, G.E. and Aronson,D.E. (eds.) USGS ToxicSubstances Hydrology Program;proceedings of the technicalmeeting, Monterey CA, March11-15, 1991, WRI 91-4034, p.398-406
U. S. Geological Survey, Open-File Report 91-528
Environmental Research 17:53-59
j;|:g;^S^Wetland/Riparian, Metals,Acid Mine Drainage, St.Kevin Gulch, Leadville,Colorado, Iron, Zinc,aquatic
Soils, Water Quality, SoilChemistry, Geology, UpperArkansas River, Leadville,Colorado
upper arkansas, tailings,fluvial, metals, hydrology,water, remediation,biosolids, floodplain
aquatic, fish, placermining, dredging, stream,physical change
Water Quality, Acid MineDrainage, Colorado, Metals,Contaminants, aquatic
fish, trout, instream flow,aquatic, cover
Mammals, Metals, Rats,Cadmium, Lead, Zinc, Copper
Mammals, Metals, Rats,Cadmium, Toxicity
upper arkansas, metals,water, aquatic, sediment,water quality
Water Quality, UpperArkansas River Basin
Birds, cadmium, metals,ducks , J
Page 52
: Doc No.
D00296
D00297
D00298
D00299
D00300
D00301
D00302
D00303
D00304
D00305
D00306
D00307
•-^-- "••/:-•••'' :.- -Title ^ -••'.• V.-:--v •: :-:^ ^; •--"->•.. -.--.-s- :_'.,- ; - . . ' • < • -..-.'.- .'-
H: ^ Btt ho logic Effects of DietaryCaaMKn on Kidneys and Testes ofMallard Ducks
Bird Use and Heavy MetalAccumulation in Waterbirds atDredge Disposal Impoundments,Corpus Christi, Texas
Residues of EnvironmentalPollutants and Shell Thinning inMerganser Eggs
Residues of Organochlorines andHeavy Metals in Ruddy Ducks fromthe Delaware River, 1973
Reproductive Success of BlackSkimmers in Texas Relative toEnvironmental Pollutants
Significance of Organochlorine andHeavy Metal Residues in WinteringShorebirds at Corpus Christi,Texas, 1976-1977
Trace Elements in Sediments,Water, and American Coots (Fulicaamericana) at a Coal -fired PowerPlant in Texas, 1979-1982
Relations of Wintering Canvasbacksto Environmental Pollutants --Chesapeake Bay, Maryland
Effects of Dietary Boron andArsenic on the Behavior of MallardDucklings
Patterns of Vegetation Response toHeavy Metal Stress
Enhanced Bioaccumulation ofMercury, Cadmium and Lead in Low-Alkalinity Waters: An EmergingRegional Environmental Problem
A Water Handbook fpr Metal MiningOperations
^•-r] *•- '• - .':.' Author v.'-lT. _. -'•: ,>
White, D., M. Finley and J. IFerrell ™
White, D.H. and E. Cromartie
White, D.H. and E. Cromartie
White, D.H. and T.E. Kaiser
White, D.H., C.A. Mitchelland D.M. Swineford
White, D.H., K.A. King, andR.M. Prouty
White, D.H., K.A. King, C.A.Mitchell and B.M. Mulhern
White, D.H., R.C. Stendelland B.M. Mulhern
Whitworth, M.R., G.W.Pendleton, D.J. Hoffman andM . B . Camardese
Wickman, D.E.
Wiener, J. G. and P. M. Stokes
Wildeman, T.R.
Date^
^V8
1985
1977
1976
1984
1980
1986
1979
1991
1982
1990
1981
,-,'•' ,-'4-- '•'•••-•:•;... Reference.; ::;-.'• '•'-.*•.':>'-"•".
Journal of Toxicology andEnvironmental Health 4:551-558
Bulletin of EnvironmentalContaminants and Toxicology34: 295-300
The Wilson Bulletin 89(4)
Pesticides Monitoring Journal9(4) :155-156
Journal of Field Ornithology55(1) :18-30
Pesticides Monitoring Journal14(2) :58-63
Bulletin of EnvironmentalContaminants Toxicology36:376-383,
Wilson Bulletin 91(21:279-287
Environmental Toxicology andChemistry 10:911-916
Presented at theInternational Symposium onRemote Sensing of EnvironmentSecond Thematic Conference,Remote Sensing forExploration Geology, FortWorth, Texas, December 6-10,
Environmental Toxicology andChemistry 9:821-823
Colorado State University,Colorado Water Resources,Research Institute, Ft.Collins, Colorado, CompletionReport No. 113
•'•'. "•--••- . i? Key Wordsyy, > ' •'.r-y-.jBirds, ducks, cadmium, ^^Hmetals ^ 1
Birds, Waterfowl, Metals,Mining, terrestrial
Birds, Contaminants, Eggs,Reproduction, terrestrial
Birds, Waterfowl, Metals,Contaminants, Toxicity,terrestrial
Birds, Contaminants, Eggs,Reproduction, terrestrial
Birds, Metals, Standards,Bioaccumulation,Shorebirds, terrestrial
Birds, Water Fowl,Sediments, Water, PowerPlant, terrestrial
Birds, Waterfowl, Metals,Effects, Foodchain,Physiologic, terrestrial
Birds, Waterfowl, Metals,Boron, Arsenic, terrestrial
Vegetation, heavy metals,terrestrial
Fish, Metals,Bioaccumulation, aquatic
Metals, Mining, Acid MineDrainage, Water Quality
Page 53
^pbcNbi:
D00308
D00582
D00309
D00310
D00366
D00312
D00311
D00314
D00489
D00507
D00315
D00403
D00449
v- ;•;' '* i •; « ?£&8 Titife y' c jS ii-.vu- u±;;>. ..-• .wsih'jo-*!. :, «?.3$;;-jv.vi' ;.~- '-.:• •<:--.'•PC-Based Design of ChannelProtection Using PermanentGeosynthetic Reinforcement Mattings
Water Resource ManagementStrategies for Restoring andMaintaining Aquatic Life Uses
Copper, Zinc, and CadmiumConcentrations of Resident TroutRelated to Acid-Mine Wastes
Lichens as Indicators of AirPollution Impacts at SuperfundSites
Water Quality Study; ArkansasRiver above Salida, Colorado (Incontaminants database #4019)
Seasonal Variability in theSensitivity of Freshwater LenticCommunities to a Chronic CopperStress
Insect Community Structure as anIndex of Heavy-Metal Pollution inLotic Ecosystems
Stampede to Timberline (Cover Only)
Use Attainability Study,California Gulch, Colorado
Survival and Mortality of BrownTrout (Salmo trutta) to In SituAcutely Toxic Concentrations ofCadmium and Zinc
Sensitivity of Greenback CutthroatTrout to Acidic pH and ElevatedAluminum
Metals -Contaminated BenthicInvertebrates in the Clark ForkRiver, Montana: Effects on Age-0Brown Trout and Rainbow Trout
Brown Trout Avoidance of Metals inWater Characteristic of the ClarkFork, Montana
, r- r 'E UtKotl SiK:' =- ,~i *&v&"J •-••-. -.-i • '-:• X--±*i '.-fa •- . • * .;.--?_:;!?t ,* >:,--'T-'. •Williams, D.T., D.N. Austin
Willingham, T., A. Medine
Wilson, D.
Wilson, M.J.
Windell, J.T., M.L. Kline, USArmy Corps of Engineers, ARIX
Winner, R.W., H.A. Owen andM.V. Moore
Winner, R.W., M. W. Boesel,and M. P. Farrell
Wolle, M.
Woodling, J., ColoradoDepartment of Public Healthand Environment, and U.S.Environmental ProtectionAgency
Woodling, J.D.
Woodward, D. F., A. M. Farag,E. E. Little, B. Steadman andR. Yancik
Woodward, D.F., A.M. Farag,H.L. Bergman, A.J. DeLonay,E.E. Little, C.E. Smith, andF.T. Barrows
Woodward, D.F., J.A. Hansen,H.L. Bergman, E.E. Little,and A.J. DeLonay
^m^1995
1992
1980
1991
1985
1990
1980
1974
1990
1993
1991
1995
1995
:V"-'.:3?;ji ^B&fyfi?-??- ix •£%£'£*Land and WaterSeptember/October, 1995
Second International JointEPA- Peoples Republic of ChinaSymposium on Fish Toxicology,Physiology and Water QualityManagement
California Department of Fishand Game, PesticidesInvestigations Unit,Sacramento, California
U. S. EnvironmentalProtection Agency, ExposureAssessment Group, EGAContract No. 68-DO-0100
U.S. Army Corps of Engineers,Albuquerque District
Aquatic Toxicology 17:75-92
Canadian Journal of Fish andAquatic Sciences 37:647-655
Sage Books, Chicago,Illinois, 544p.
Colorado Department of PublicHealth and Environment, andU.S. Environmental ProtectionAgency Report
Dissertation, University ofColorado, Boulder, CO
Transactions of the AmericanFisheries Society 120: 34-42
Canadian Journal of Fisheriesand Aquatic Sciences 52:1994-2004
Canadian Journal of Fisheriesand Aquatic Science 52: 2031-2037
Restoration, StreambankErosion
water quality, ArkansasRiver, aquatic life,management
Fish, copper, zinc,cadmium, metals, acid mine
Smelters, MetalsDeposition, StudyTechniques, vegetation
Arkansas River, waterquality, metals, dredging,aquatic
Aquatic Biota, HeavyMetals, Copper
Invertebrates, Aquatic,Metals, Indices
Colorado History, mining
arkansas river, Californiagulch, metals, fish,invertebrates, aquatic,riparian habitat
arkansas river, trout,metals, aquatic, water,toxicology, cadmium, zinc
Fish, Trout, Cutthroat, pH,Greenback, aquatic, metals
aquatic, fish,invertebrates, metalsuptake, metals, clark forkriver
clark fork, metals,aquatic, water quality,fish, behavior,
Page 54
Doc No.
D00316
D00530
D00414
••••• _:-:'-: •'••••:•>' •-•..-.•.•Title*.-..-:' ' ;.,'•, --*'.' •:-•,*.•| k_- ••• • v. ..•-..-•-•' -:. •.••.•.--.'" ..-.••:••'.E ^ BF on Rainbow Trout Fry of aM^^^F-Contaminated Diet ofBenthic Invertebrates from theClark Fork River, Montana
Revegetation of Pb/Zn MineTailings, Guangdong Province, China
Uraniferous Waters of the ArkansasRiver valley, Colorado USA: aFunction of Geology and Land Use
' /:- £>:. '-"^""- Author :•.,;"• rV --.^ ^Woodward, D.F., W.G. IBrumbaugh, A.J. DeLonay, E.E.^Little and C.E. Smith
Ye, Z.E., J.W.C. Wong , M . H .Wong, A.J.M. Baker, W.S. Shu,C.Y. Lan
Zielinski, R.A. , S. Asher-Bolinder, and A.L. Meier
Date
jjr
2000
1995
:,- '. p.>w;,':';';i Reference ; Y ;; '"•"•; '•-/• ::
Transactions of the AmericanFisheries Society 123:51-62
Restoration Ecology 8(11:87-92.
Applied Geochemistry 10: 133-144
:• . . ;;'; :-Key'Words.,'_:;.,:., ,.'_:|
Fish, , aquatic, metals, ^^Hdiet, invertebrates, troi H
revegetation, mine tails,tailings, lead, zinc,mining, soil, reclamation,metals
water quality, downstream,arkansas river, uranium,land use, geology
Page 55
APPENDIX B
Hydrographs
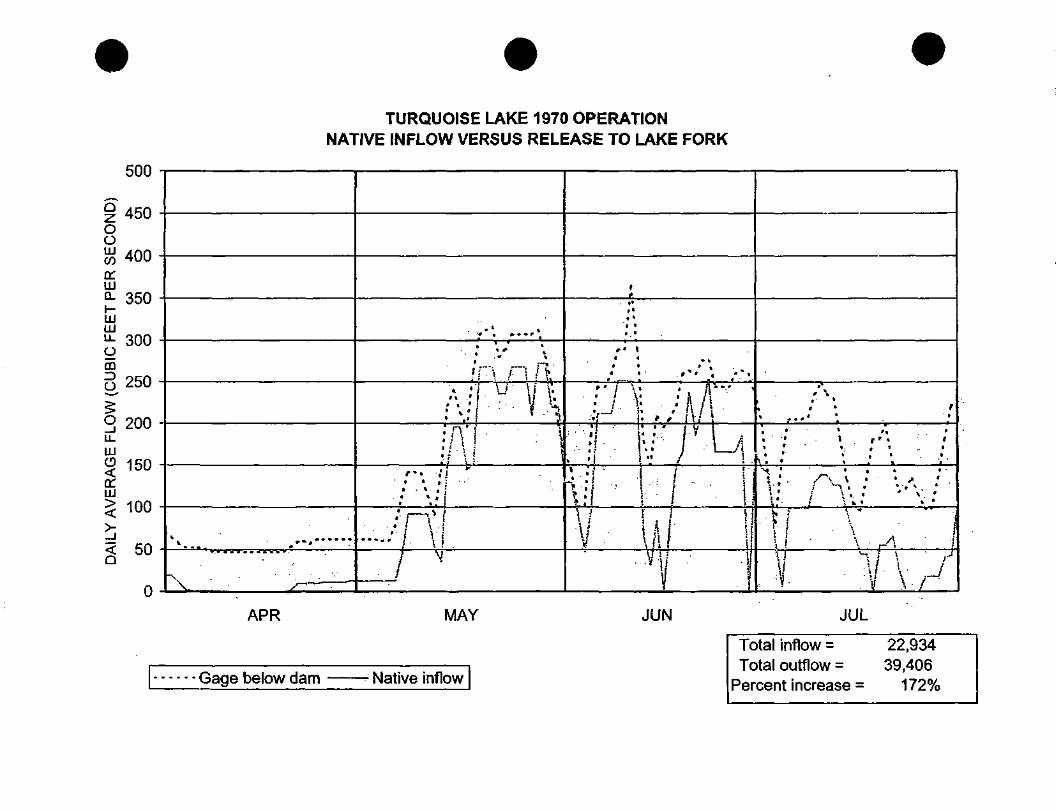
TURQUOISE LAKE 1970 OPERATIONNATIVE INFLOW VERSUS RELEASE TO LAKE FORK
500
» — ."••
' \ - • ' . ' • ' • ' _
,'•'. ,--.'.• V' f"'* •>r\ r\ \\
A •! u \j t• " » • ! ' • ' • t •'!• .« i j
!A'I : ' ir » t : • • '
» . % , f .
..../ n iT" \! •
/ '
»
*«•»»1 »
"l *1 . •
r> \t •t i
«
•"/ \. / \.'.I-1
: ' •;• f •
* 'j
N'V
• %
.**' • ' * «
• A"'
/ » A ;• \' 'v;1 * ' / V i;:" /!\: / ^—^l
/ \. • • * . . i, : / i ,W 1V V "V 1
•*. \> «' • f' . - • • • ' . , *• • • • • - . , «. • \ r ' • *1 * v § • . *i • i' , i . t
X • • • . . '. •x ; • ' _ • • • •i ; . .s\ \ • • • *s » ^ i • • •« » •I ; / \ .. . ' < •
i.'- / <"
•U \" " '
i! \ ^ 1M ^ * ' >\ \ \- jll ' V \ i•• " ' .V A /
OoLUCOa:LUo.i-UJLULLomIDO
9 200u_LUCD
o:LU?<Q
0
APR MAY JUN JUL
Gage below dam Native inflow
Total inflow = 22,934Total outflow = 39,406
Percent increase = 172%
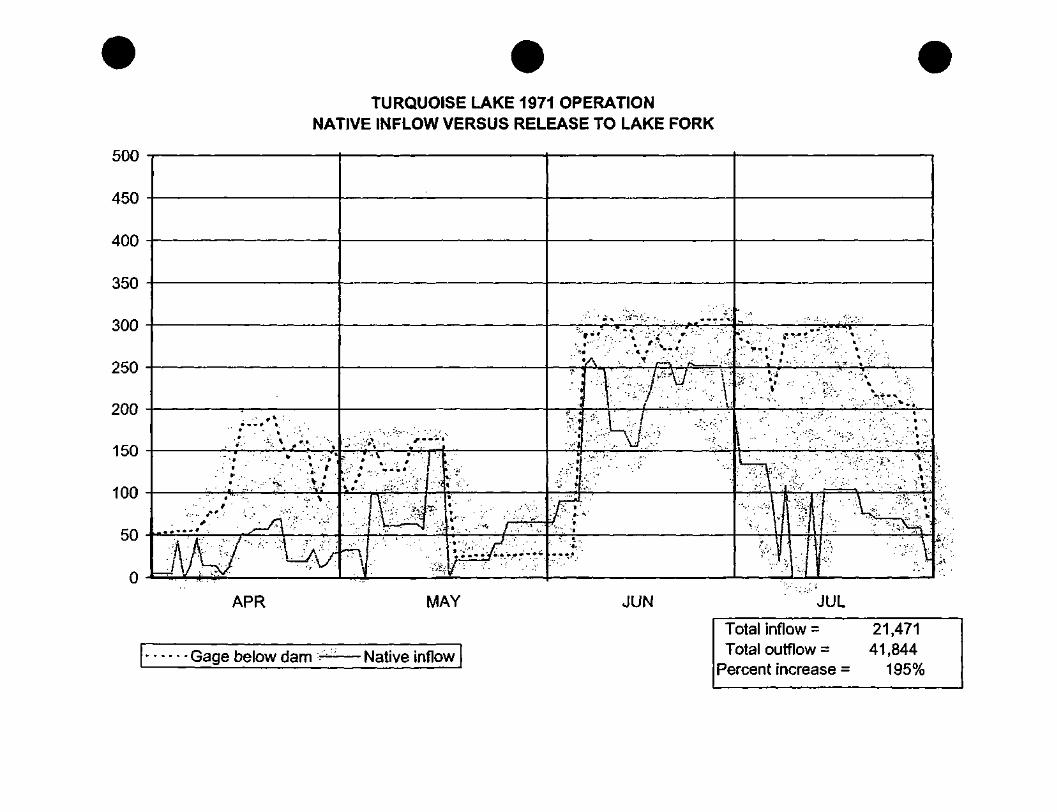
TURQUOISE LAKE 1971 OPERATIONNATIVE INFLOW VERSUS RELEASE TO LAKE FORK
500
450
400
350
300
250
200
150
100
APR MAY JUN JUL
• Gage below dam ^-— Native inflow
Total inflow = 21,471Total outflow = 41,844
Percent increase = 195%
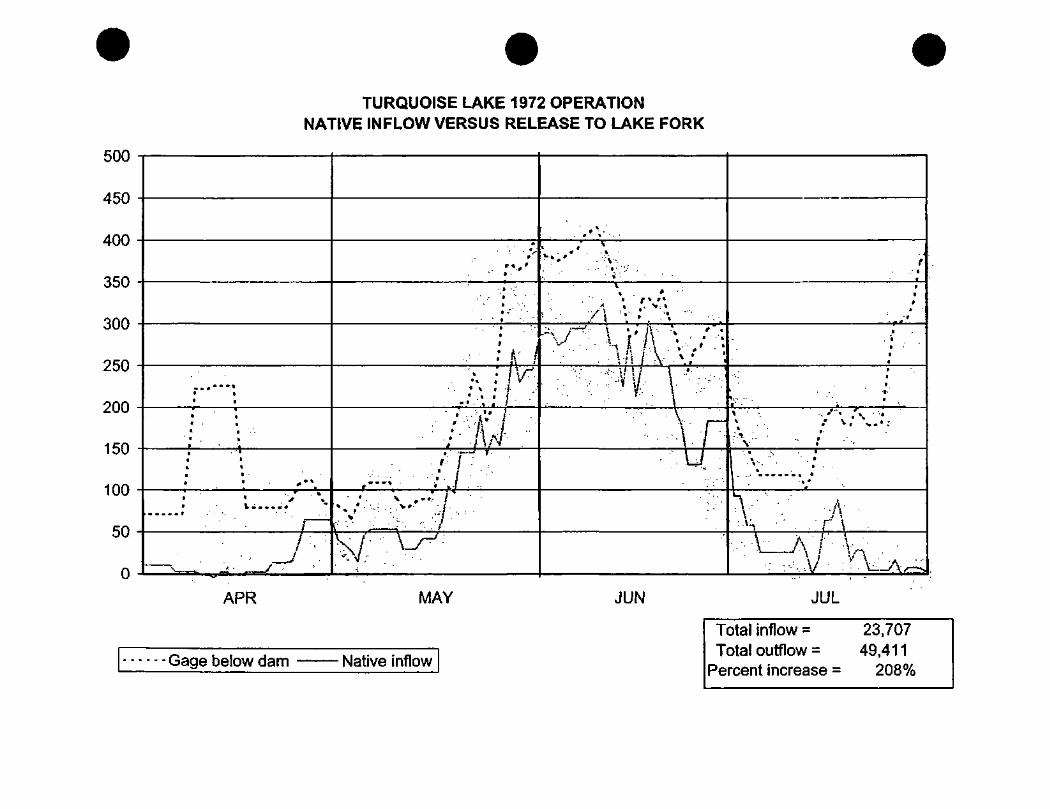
TURQUOISE LAKE 1972 OPERATIONNATIVE INFLOW VERSUS RELEASE TO LAKE FORK
ouu -
Acr\ .nOU
/inn .ifUU
ocr\ .oOU
onn -GUU
ocn _ZOU
onn^UU
•ten -1 OU
innIUU
CA _ou
...-••«• i• i• «t . B• •t . «• • •«i •»• i• t• • • '• . ,-»
••/ \
f —/:.
'v. ^ *. • _/
#
. ' v '.'".'• •
• • •.'. ' .' '• -1 - '
••• -' ' -
•' i • • "
: ... \1 A ;
. '.\ i \V-• : .'. : / .-- « . . . ;
/ :U,., ff}
• '. v ,-: /' -%. /••-: • ;>• - . / • . . ., > . .-•.. , • : ' / • " •
W-' ^ :
APR MAY
r^ L I ioage Deiow dam - Native inflow
' . ' , ' < ' \ - : . . .
"v** V• • • ' • • ' * . •
.._ • ' i - ' "\i' . *
"• • • e » • •^ • . . N : t
' • ' • • / i : - ; . . - v - • -.-.^ M'/\v./;-;
. \ - / i / - \ - • * - / ;
. ,V,-4f^y'; , :-
V r-
" -.W
i.• •
**i
**
*•
. - •>••»»i
•i.v- - - • . • • •I~ • m '• •
* /. ,\ .
\ / v: —i: V" " .
'•"» -" ;
:«.......;" : • •-'V - - A -•••^ • . r \. V- A / V•'• — — -* i i \ /^i
... \y . v \^JA •
JUN JUL
TT
Pe
Dtal inflow = 23,707otal outflow - 49,41 1rcent increase = 208%
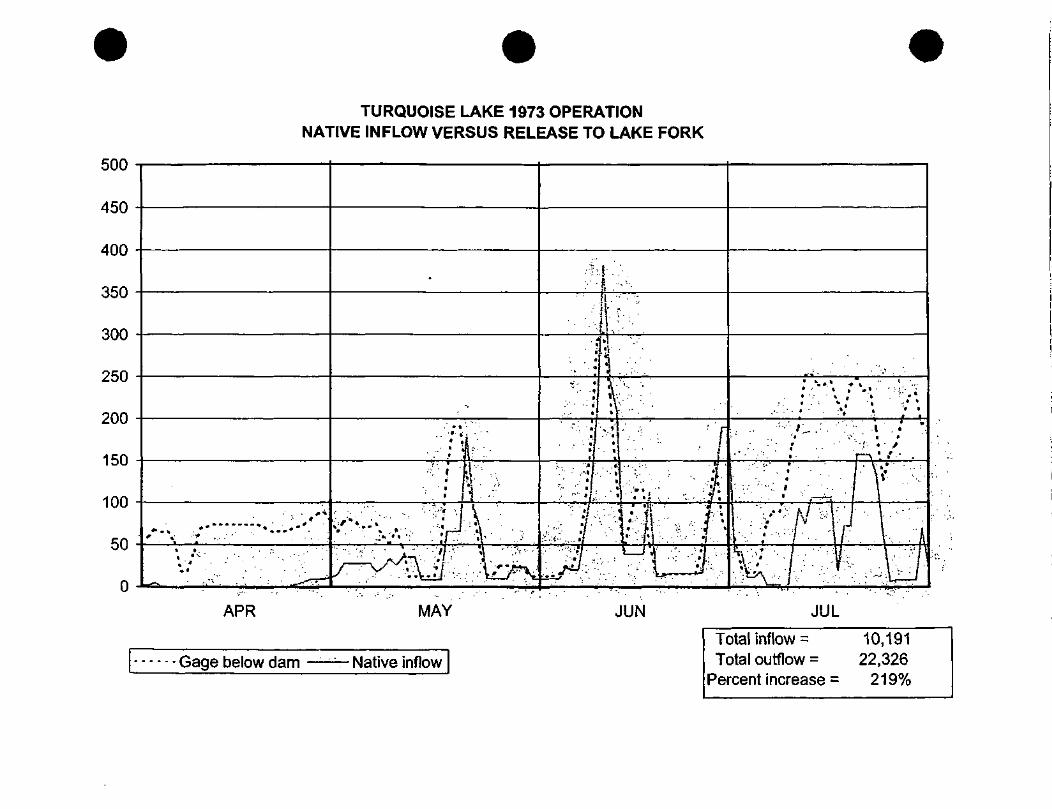
TURQUOISE LAKE 1973 OPERATIONNATIVE INFLOW VERSUS RELEASE TO LAKE FORK
500
450
400
350
300
250
200
150
100
APR MAY JUN JUL
Gage below dam - Native inflowTotalinflow= 10,191Total outflow = 22,326
Percent increase = 219%
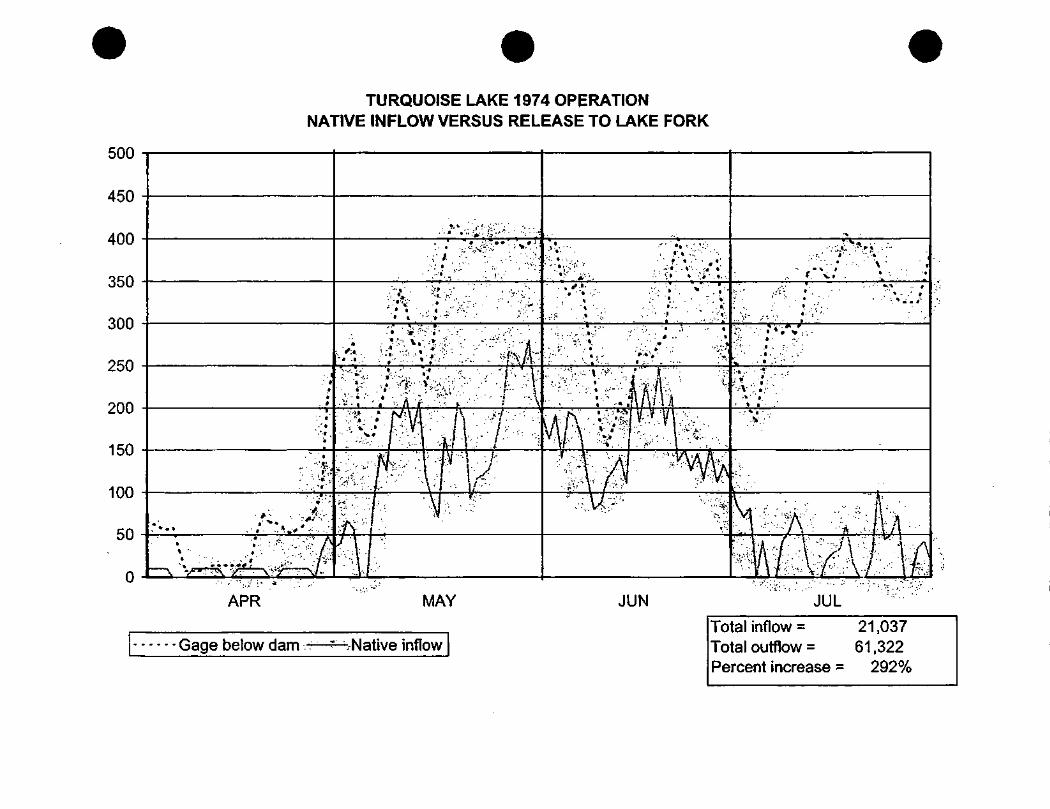
500
450
APR
TURQUOISE LAKE 1974 OPERATIONNATIVE INFLOW VERSUS RELEASE TO LAKE FORK
MAY
Gage below dam • •'' .Native inflow
JUN JUL
Total inflow = 21,037Total outflow = 61,322Percent increase = 292%
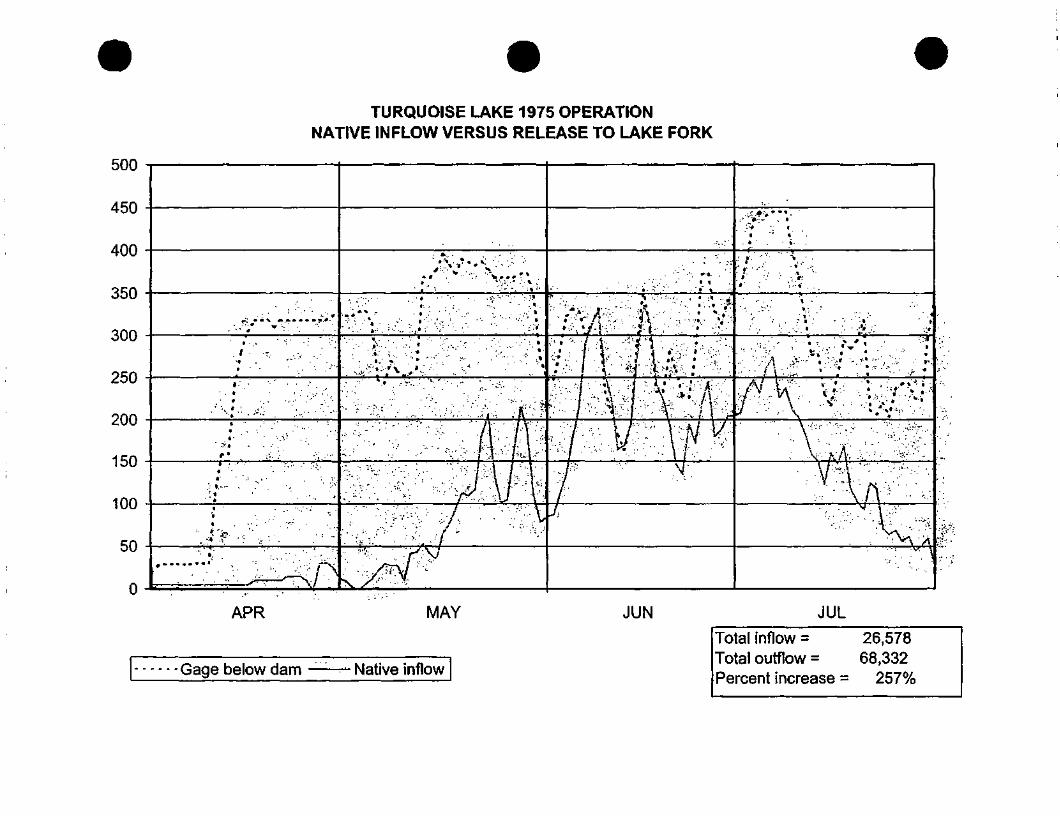
TURQUOISE LAKE 1975 OPERATIONNATIVE INFLOW VERSUS RELEASE TO LAKE FORK
500
350
100
- ' ; " ' 1
0
APR MAY
• Gage below dam Native inflow
JUN JUL
Total inflow = 26,578Total outflow = 68,332Percent increase = 257%
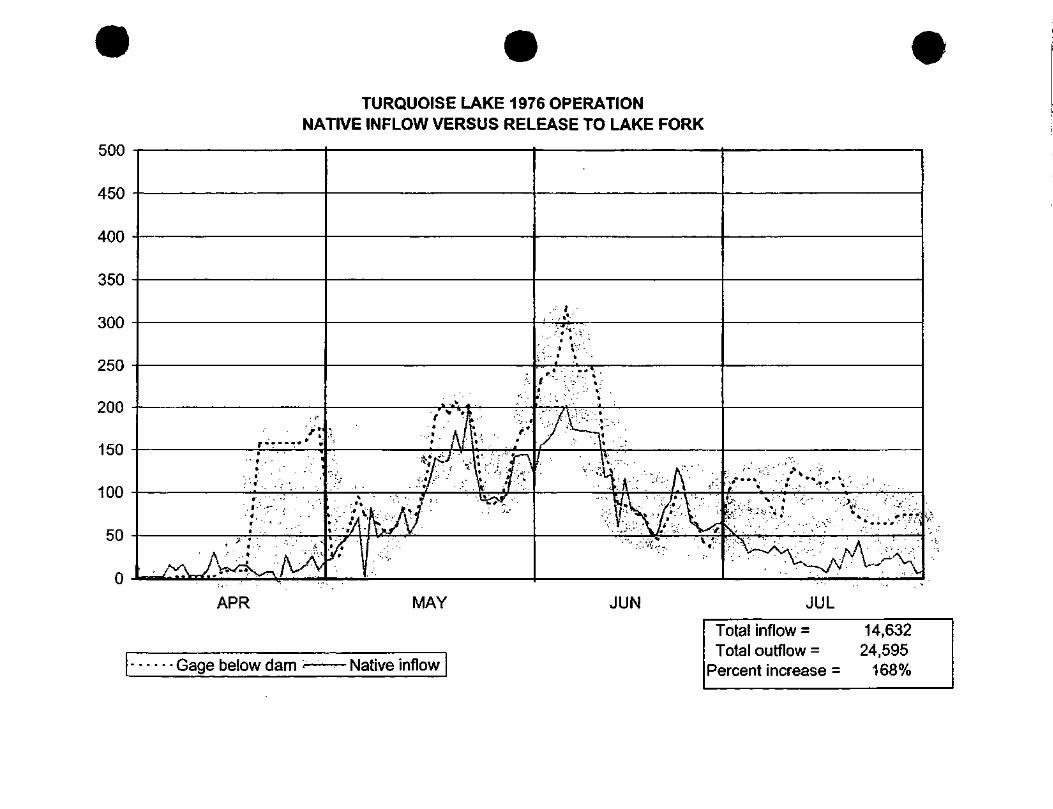
TURQUOISE LAKE 1976 OPERATIONNATIVE INFLOW VERSUS RELEASE TO LAKE FORK
500
450
••• i
' V '.• Jit
100
0
APR MAY JUN
• Gage below dam Native inflow
JUL
Total inflow = 14,632Total outflow = 24,595
Percent increase = 168%
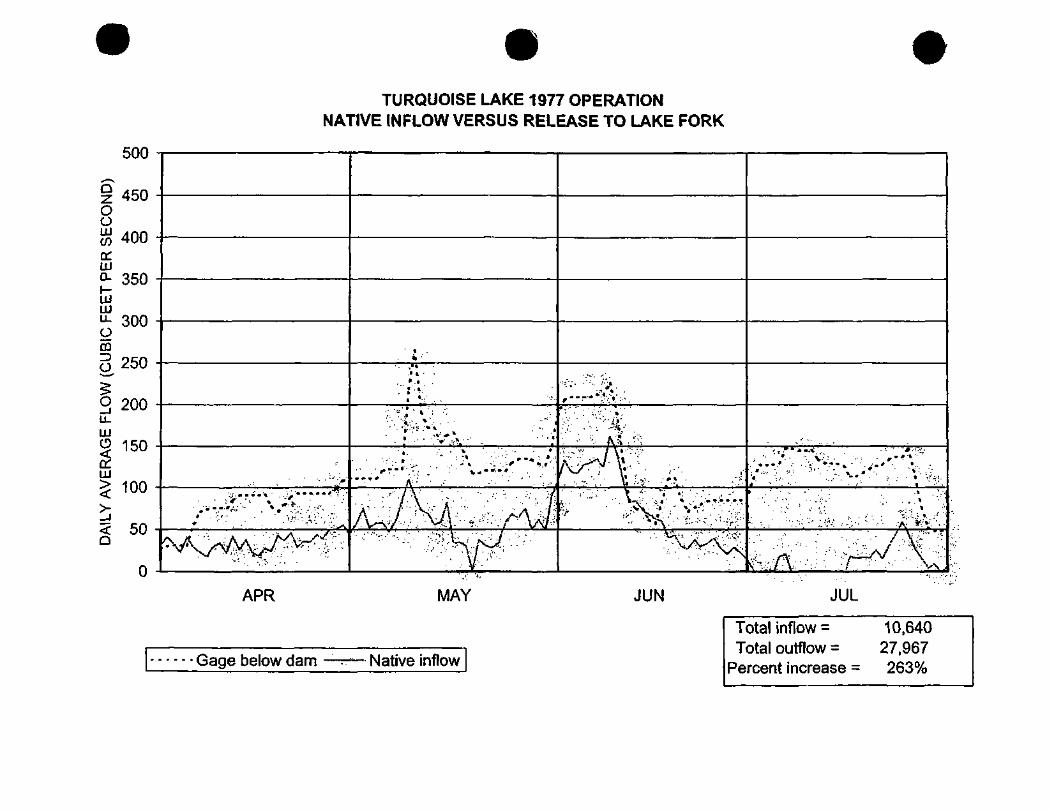
TURQUOISE LAKE 1977 OPERATIONNATIVE INFLOW VERSUS RELEASE TO LAKE FORK
500
OOcoQLUJ0-
01UJ
ocoo
u_UJosLU>
150
APR MAY JUN JUL
Gage below dam • Native inflow
Total inflow = 10,640Total outflow = 27,967
Percent increase = 263%
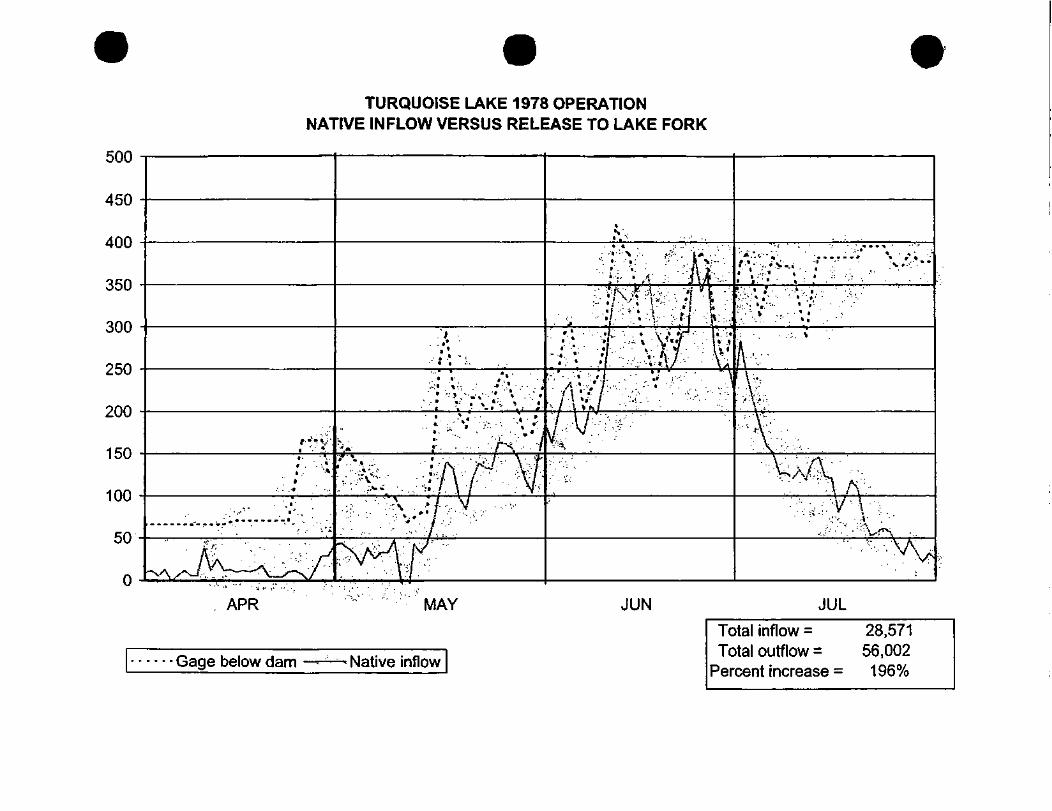
TURQUOISE LAKE 1978 OPERATIONNATIVE INFLOW VERSUS RELEASE TO LAKE FORK
500
•V
300» « - . »l« •
*.
150
100
50
3 r
APR MAY
below dam Native inflow
JUN JUL
Total inflow =Total outflow =
Percent ir
28,57156,002196%
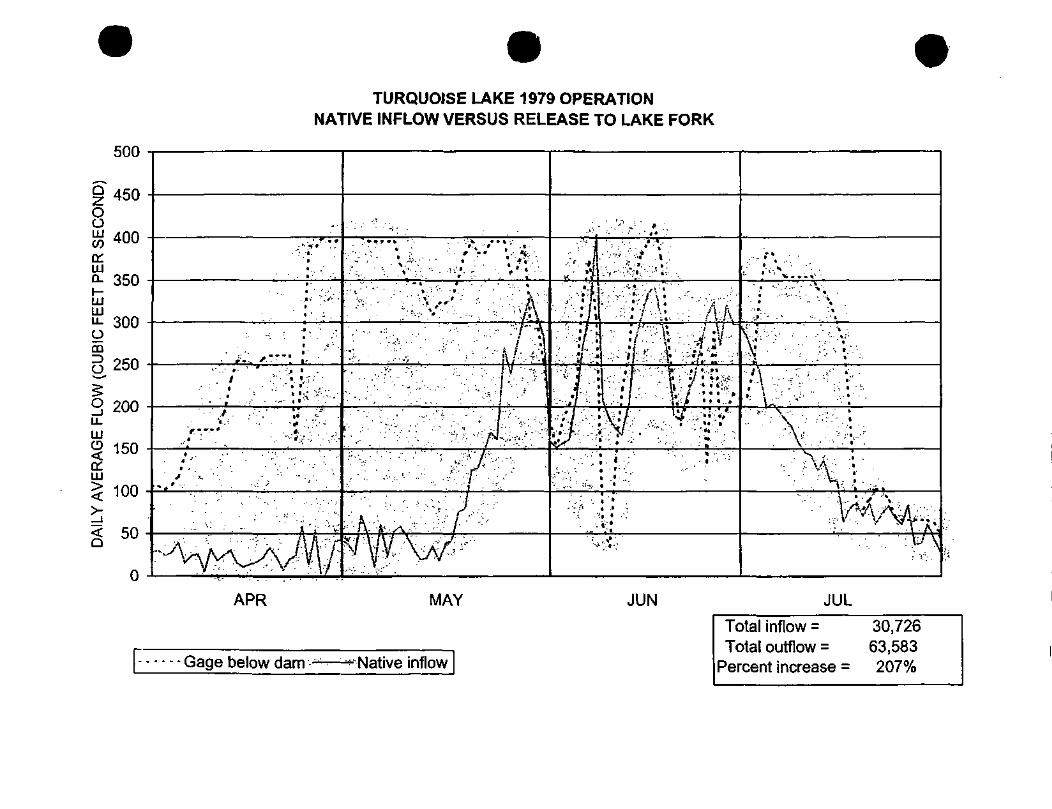
500
OoLUCO
LUQ.
LULU
O
mo
O
LUO
a:LU
TURQUOISE LAKE 1979 OPERATIONNATIVE INFLOW VERSUS RELEASE TO LAKE FORK
APR MAY JUN JUL
I Gage below dam ^—^ Native inflow
Total inflow = 30,726Total outflow = 63,583
Percent increase = 207%
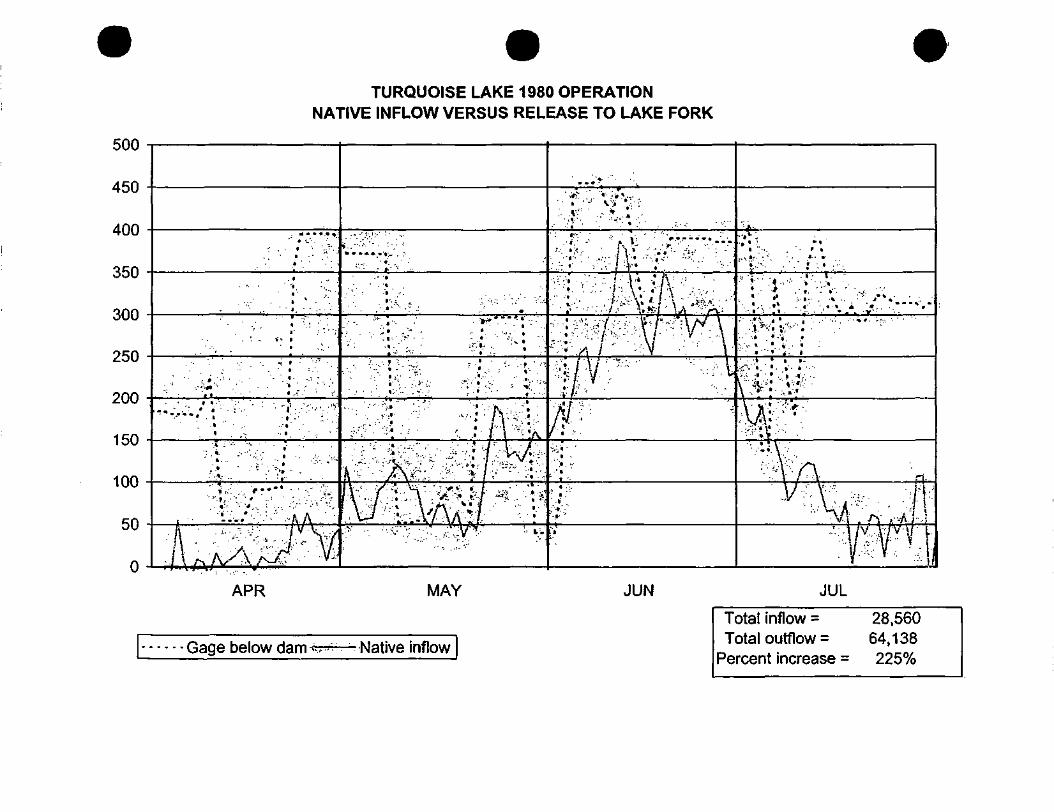
500
TURQUOISE LAKE 1980 OPERATIONNATIVE INFLOW VERSUS RELEASE TO LAKE FORK
APR MAY JUN JUL
•Gage below dam ^7-^—— Native inflow
Total inflow = 28,560Total outflow = 64,138
Percent increase = 225%
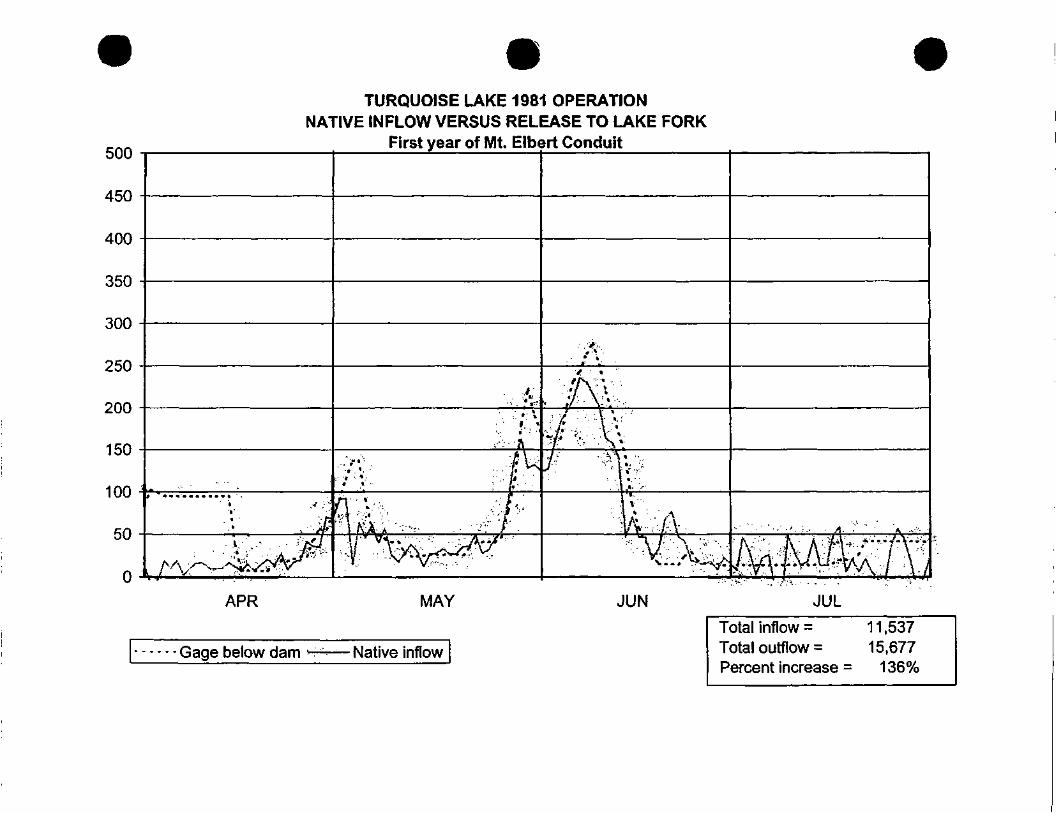
TURQUOISE LAKE 1981 OPERATIONNATIVE INFLOW VERSUS RELEASE TO LAKE FORK
ouu -
/1CA .*fOU
/inn -*HJU
OCA .oOU
or\n .ouu
OCA .jiDU
OAA .*LUU
1 n -I OU
inn -i \j\j
Rn -OU
0 .
' V ' y ;--:
•i'
/" ^- ' •'"• * " ^ •
-...- ^'• '.:•..••
i, «
••>•;.. .. •&: - / - v . ; • • • > . - :
\ Kl ia/ ' "'r' ' ' ": • / '
• --V ; v>c\./ ^> - *v^
APR MAY
r+ u i jv^age DGIOW dam ^ — ~— Native inflow
- '*<•-.
. -Mv,4/v-S'-/'." ' " W
: . t. " '
. I- ".' '• .• • '• , ' A
';- ; ;::;;.-. v
- ' ' . ' • ' ' • - -;. ':.• • f.. • "' ' '* ...-.••.
•!i^']^J^-'ff^!'V^-*. V ..* - : "'. 'VX-.'j \ ••/: : ; . - - • • - . , ' • / v. • - . . . • " . : . • > . '
JUN JUL
TTP
Dtal inflow = 1 1 ,537otal outflow = 15,677ercent increase = 1 36%
TURQUOISE LAKE 1982 OPERATIONNATIVE INFLOW VERSUS RELEASE TO LAKE FORK
ouu -
A en4OU
Ar\r\ -4UU
ocn .oOU
onn -ouu
OCf) -zou
onn -^uu
1CA .1 UU
mn -I UU
en .ou
o .
-;.' /Y , 'j(::
t\ 1 \ ••"•••' "."—s~, . • ' ' • • • ' ' • ' • • ' ..H%.
APR MA1
/"> , I , . .. . . _• • • • uage oeiow aam : ••• Native intlow
.R - •fl
I
'- (
' i- ^ : : ::A/ ::':!
y(^/^:"r : :'-1 • • ' • • ' • ' . -. ; •"' .., 1
,/^-:.\l;;.>:--.
A •; ':.. • •••- •'•.": .;. .• ^ " ;.:• • . ' - . . . . - . . : • , . : .
Y JUN
'••i:
': ;^/Y ./f:.:\.!V^.\.v. j .
^ • V: M.- /.V= • • ' • • • ' : : - V A ••' ) V
' • ; • •• ^-^XjA ' 1^1'• • ; - ; y - ; - ^ - ; ; --VS ! ' • $
' • ' • . • '^^ .-: . -:- ••- : : U"./'. . ; . . . . . • ••.-..' . . ' 'U
JUL
Total inflow = 25,230Tntal r>i itflnu/ — ^ 1ft11 Uldl UulllUW O, 1 O 1
Percent reduction = 87%
TURQUOISE LAKE 1983 OPERATIONNATIVE INFLOW VERSUS RELEASE TO LAKE FORK
IUUU •
Qnn -yuu
Qf\f\ .ouu
ynn -/uu
Ron -ouu
Knn -ouu
/inn -H-UU
••ann -oUU
ono -zuu
•inn -IUU
A •• :"
APR
_ . . .oage oeiow dam
:ij
A .• .•
AA '-- . A - - ' 7 - • • : H
. . . . . J\i^}-:: ; : ; A
^V^ . . .V-;. .; :,. • '. ' " . • . - . . . • .'. - .'.
•:., - - / I - •-' .'< .•...••• • ' • '.
-••^^^ - ' v - ' ^ - l L . - : - • - : -.-•,:.-••
MAY
— Native inflow
JUN
ToToPe
•/•-. . » ' ' •••*.-• .*.• «...
' ' . ' • • • • ' ' ' v >'r • . •
^ »' ' ' • • • '• •• .
I''':''-' • • ; V : : - f -* : • ....... • ^
» : ^' r • ' -'. . ' 1
" . "• * ' * . ' ' '
. ' - • ' ' I f"
'-^^'.--K^\ ,- /' v \ ••'/•'••.'
•;- V^
JUL
tal inflow = 28,411tal outflow = 50,931*rppnt inrrpaQp ~ 1TQ%
500
TURQUOISE LAKE 1984 OPERATIONNATIVE INFLOW VERSUS RELEASE TO LAKE FORK
450 --
300
'.'..'. >. : - •• '
100
0
APR MAY JUN JUL
Gage below dam -r-r-1—^ Native inflow
Total inflow = 40,631Total outflow = 33,270Percent reduction = 18%
TURQUOISE LAKE 1985 OPERATIONNATIVE INFLOW VERSUS RELEASE TO LAKE FORK
500
APR MAY JUN
below dam Native inflow
JUL
Total inflow = 32,834Total outflow = 5,138Percent reduction = 84%
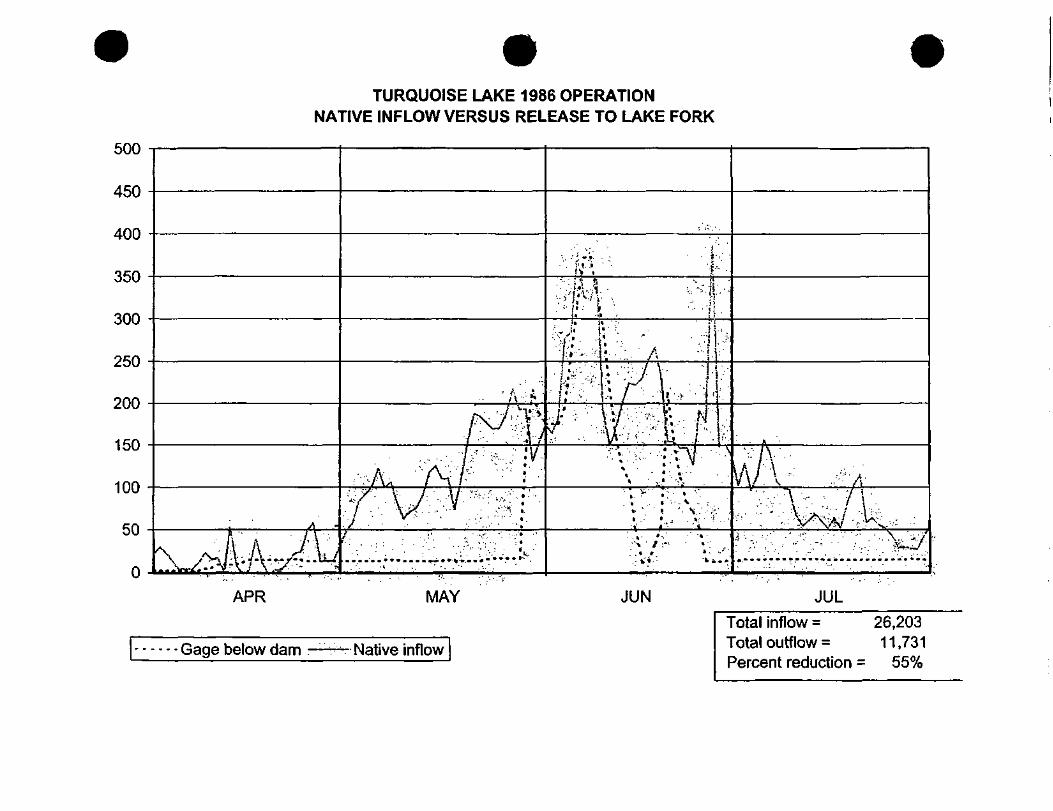
TURQUOISE LAKE 1986 OPERATIONNATIVE INFLOW VERSUS RELEASE TO LAKE FORK
500
450
400
350
300
250
150
100
fi• - •
.;- \ ".' / '
0
APR MAY
Gage below dam Native inflow
JUN JUL
Total inflow = 26,203Total outflow = 11,731Percent reduction = 55%
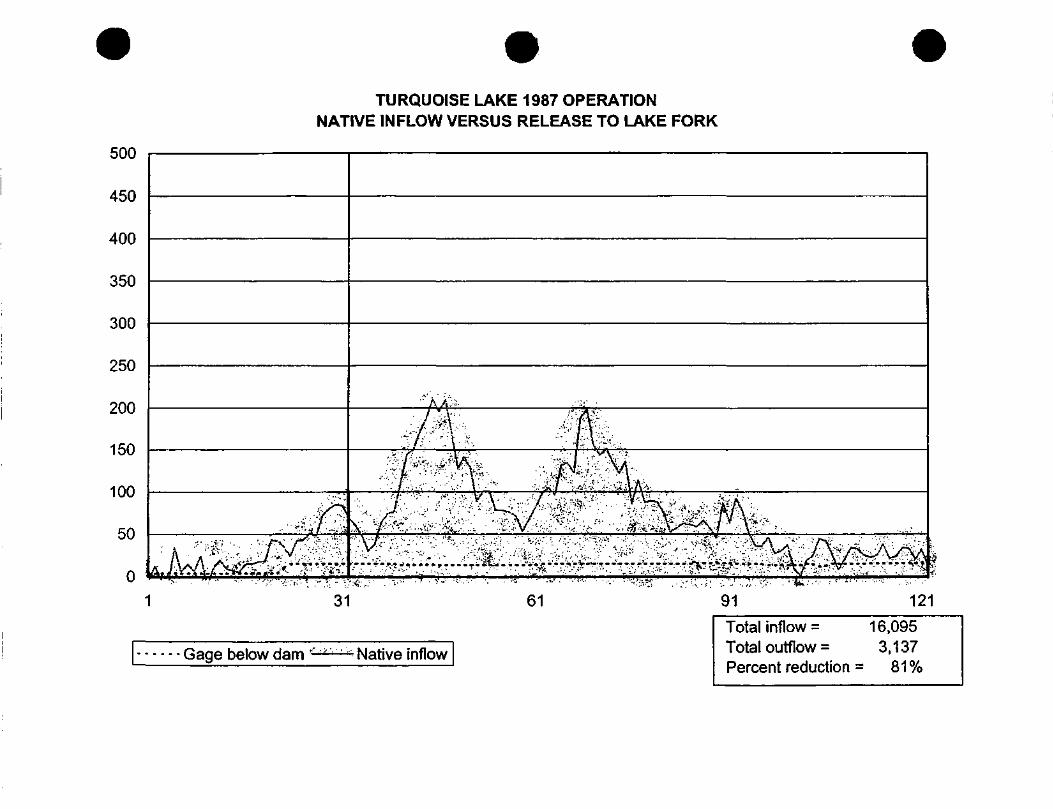
TURQUOISE LAKE 1987 OPERATIONNATIVE INFLOW VERSUS RELEASE TO LAKE FORK
450
400
350
300
250
200
150
100
50
0
'''"'A >i ;.
' 7'^ V.^'^^-T'JK? ^'^ ••• '•^n;j^^^^" V ":T" """
31 61 91 121
Gage below dam ' ' :"V;- Native inflow
Total inflow = 16,095Total outflow = 3,137Percent reduction = 81 %
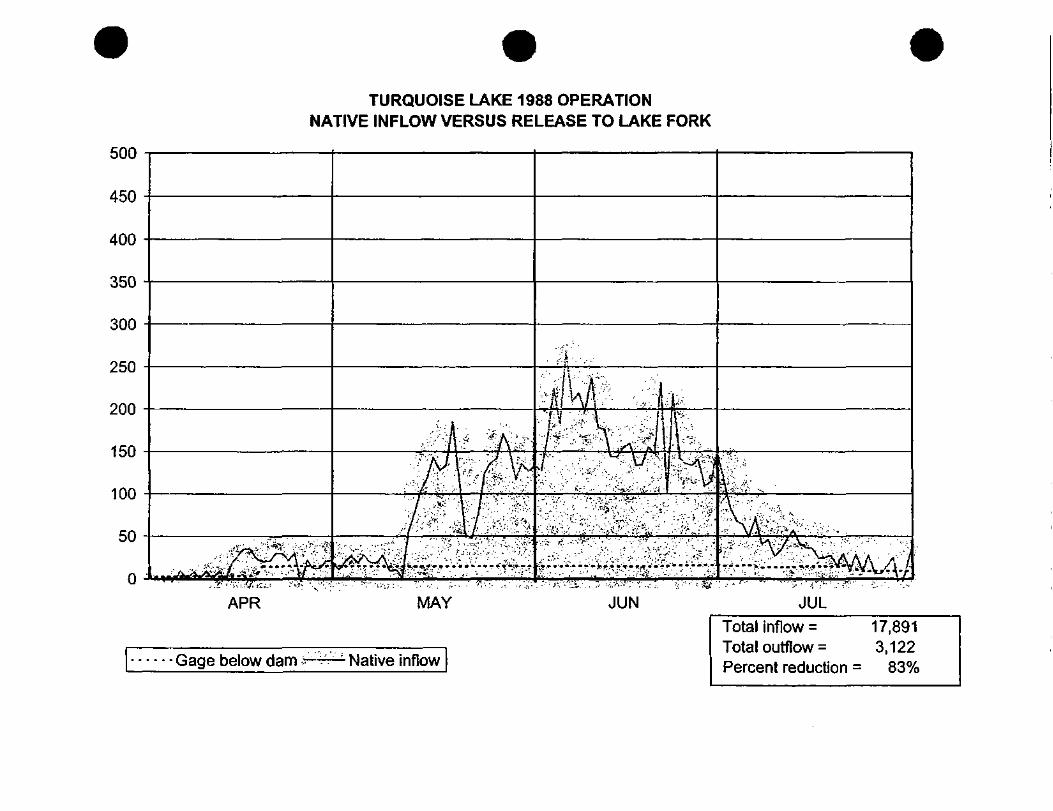
500
450
300
250
150
100
50
TURQUOISE LAKE 1988 OPERATIONNATIVE INFLOW VERSUS RELEASE TO LAKE FORK
0 *M-i
APR MAY JUN JUL
below dam :~-jrr-1 Native inflow
Total inflow = 17,891Total outflow = 3,122Percent reduction = 83%
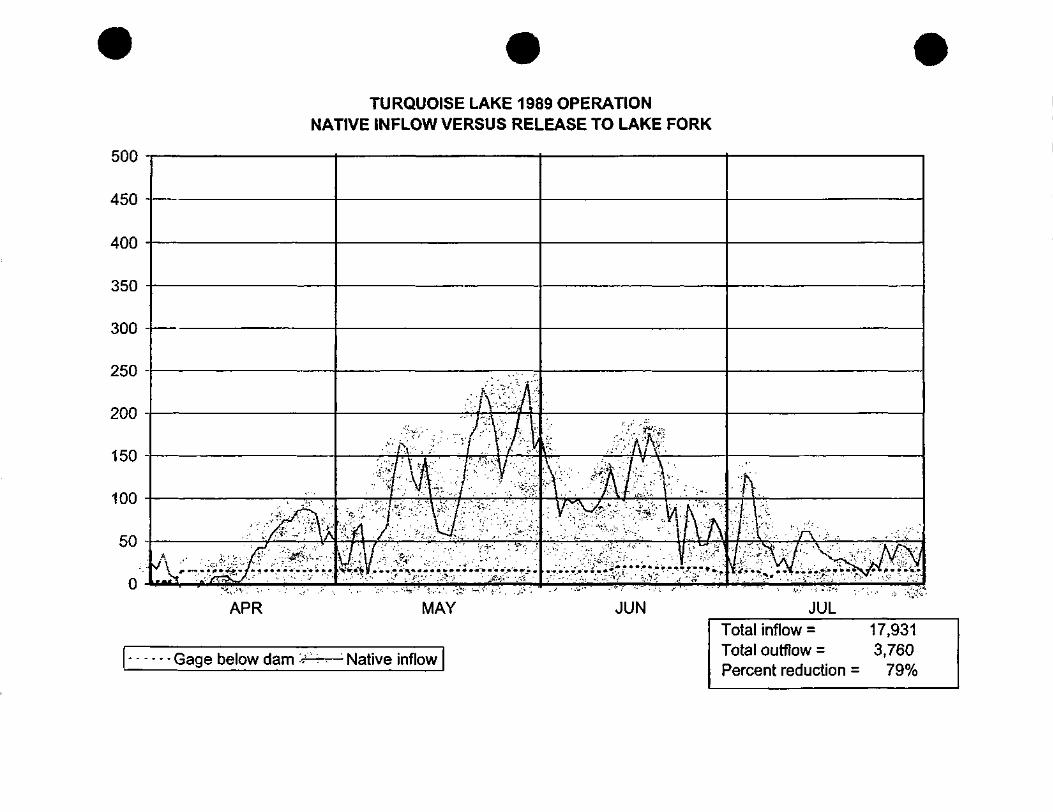
500
450
400
350
300
250 -
200 -
150
100
0
TURQUOISE LAKE 1989 OPERATIONNATIVE INFLOW VERSUS RELEASE TO LAKE FORK
APR MAY JUN JUL
Gage below dam : - — Native inflow
Total inflow = 17,931Total outflow = 3,760Percent reduction = 79%
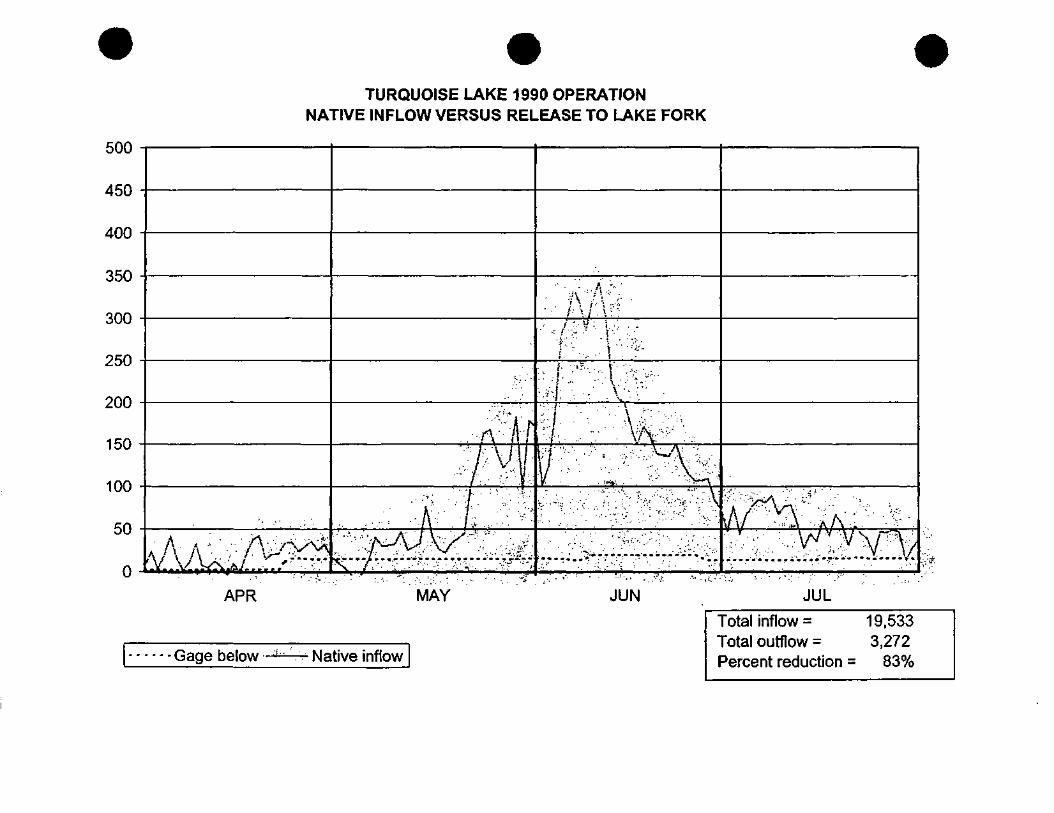
TURQUOISE LAKE 1990 OPERATIONNATIVE INFLOW VERSUS RELEASE TO LAKE FORK
ouu -
A txA4OU
/inn -4UU
ocn, .OOU
onn -ouu
ocn .zou
9nn -Z.UU
-ICO .1 QU
inn -I UU
^n -\j<j
n -A^A^v/V/^
;;;'•
-, |
.,-•: ••k''G$
^^j^LM- > . . . - . . •- - . -. .;,- . • •- ' . j-
APR MAY
oage oeiow • - • • • . . i\jative inflow
• "->v:: A •*"";• .-• ..../.'-•- V- i..,-;
• ; 1, ' ' ' '". 1 ' 'V| J~---
• • : • ' . - • 1N :...
?^:';-^;!^fe^^^Wy!.;.:;: r:; -r---^-* ;:
$^'.&- «.t-:.::; . M!
JUN JUL
f
fotal inflow = 19,533fntal ni itflnw - "^9793ercent reduction = 83%
.'•/tv
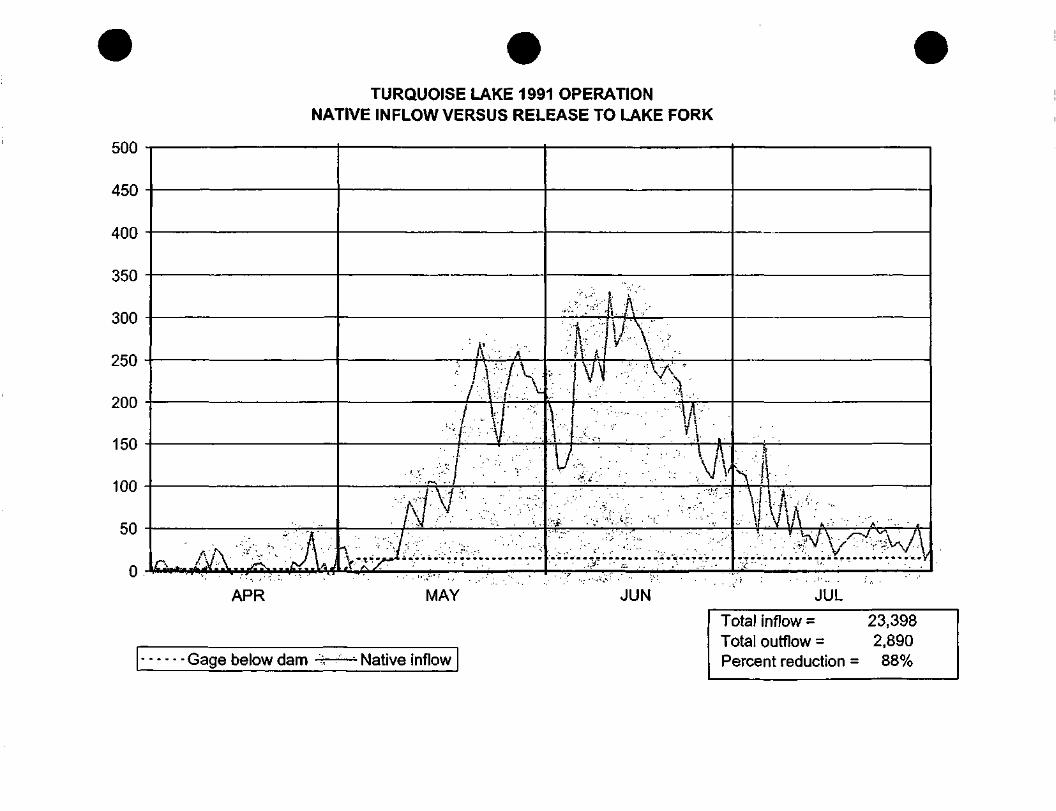
500
450
TURQUOISE LAKE 1991 OPERATIONNATIVE INFLOW VERSUS RELEASE TO LAKE FORK
C*-*.. -i J/; \ . . ff^., . ,l>f. PM J
• • fc :•/ -•
/ ::\-r .:>4vV;.x>.^/>^;"f0"^f.
»f r\ y^^ • ' ' ' . - . , •
> •
-i
V.'•'"*•• '
:-:---
?i| A1"-.. . . - • . •n . r i .V,-V : : i / V ;f f i s
y i \ v .V.V :": ;;w.
• ' ' . • • '''-A', '• ' . . - ! • . '
•-- ; ' W; •'' 1\
••'•'• • ' • •' A'&:.;^'" •'.-. " ' . • ' • ' •'' :..-!-. • '"
- .' J- - •': •;- " ;• .• •'
' •••IJB ••••••'•••••*• ••••••• • •
' ,' :i
\ I|.11%, , ...
>: - • ' V \ / V . XV, ^ \ / \
.i; :.;: :y.:.l'£V 'X
. ' . ' ' < " " " • ' " • ' ' • . - " ' - -
300
150
0
APR MAY JUN JUL
below dam Native inflow
Total inflow = 23,398Total outflow = 2,890Percent reduction = 88%
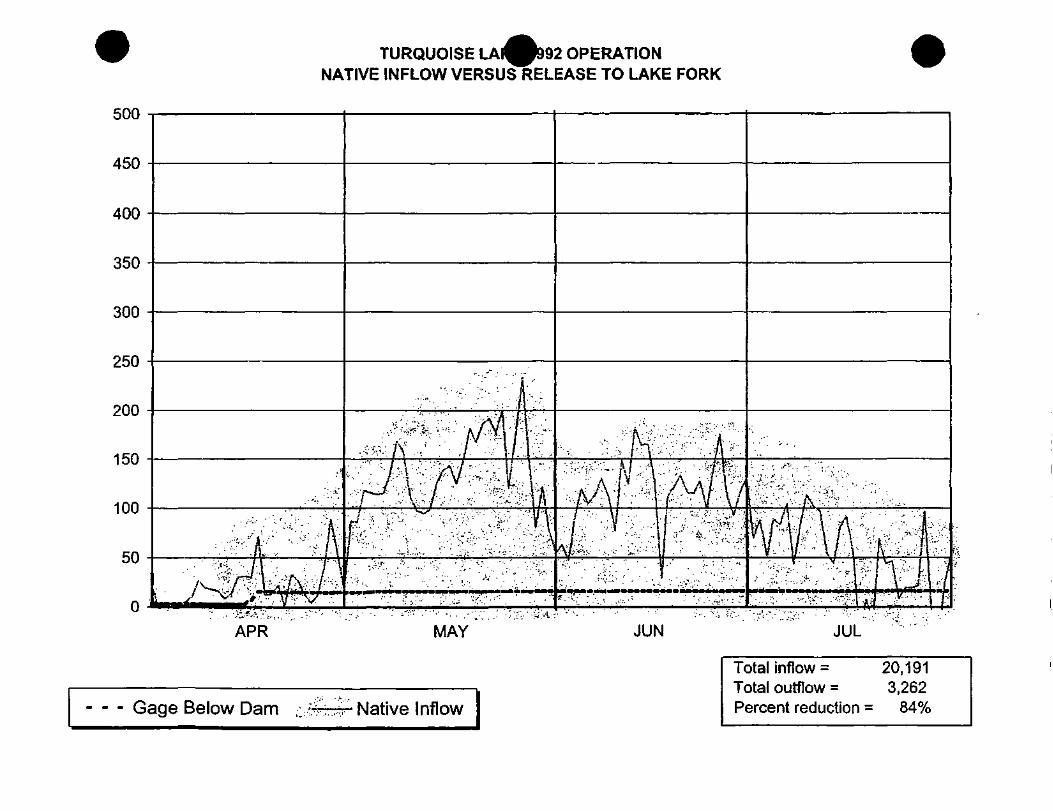
TURQUOISE LAI ^992 OPERATIONNATIVE INFLOW VERSUS RELEASE TO LAKE FORK
500
450
400
350
APR MAY JUN JUL
- - - Gage Below Dam .-i Native Inflow
Total inflow = 20,191Total outflow = 3,262Percent reduction = 84%
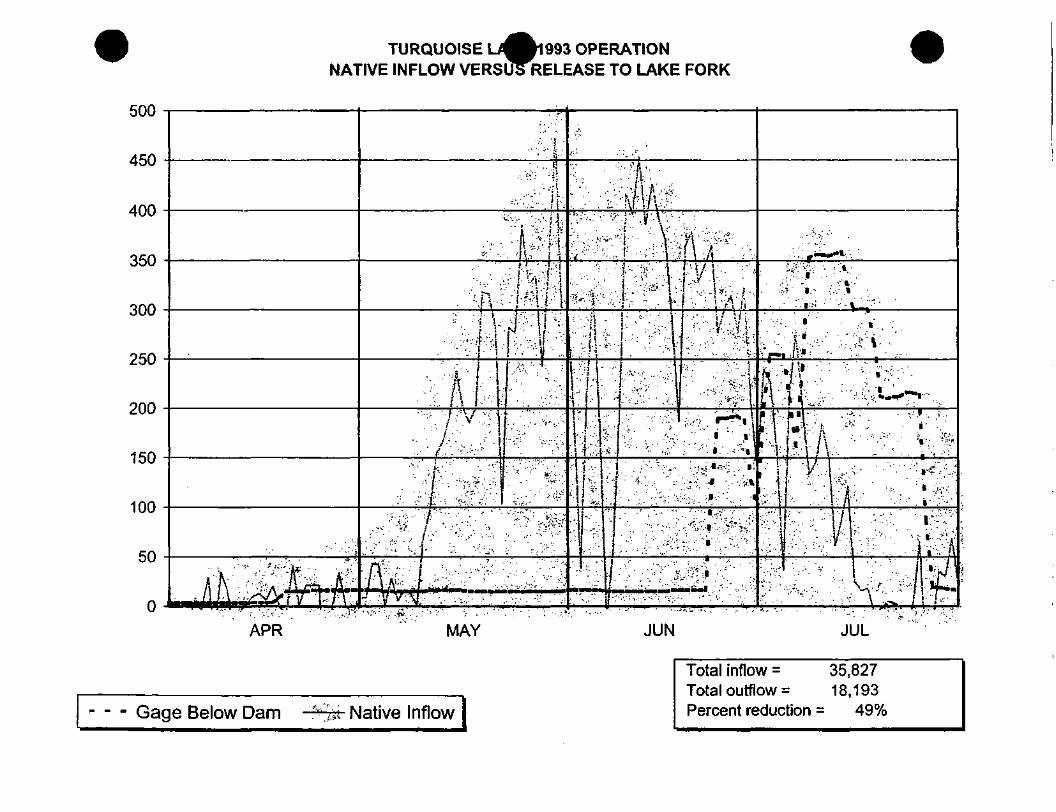
TURQUOISE L/ Bl993 OPERATIONNATIVE INFLOW VERSUS RELEASE TO LAKE FORK
APR MAY JUN JUL
- - - Gage Below Dam > .u Native Inflow
Total inflow = 35,827Total outflow = 18,193Percent reduction = 49%
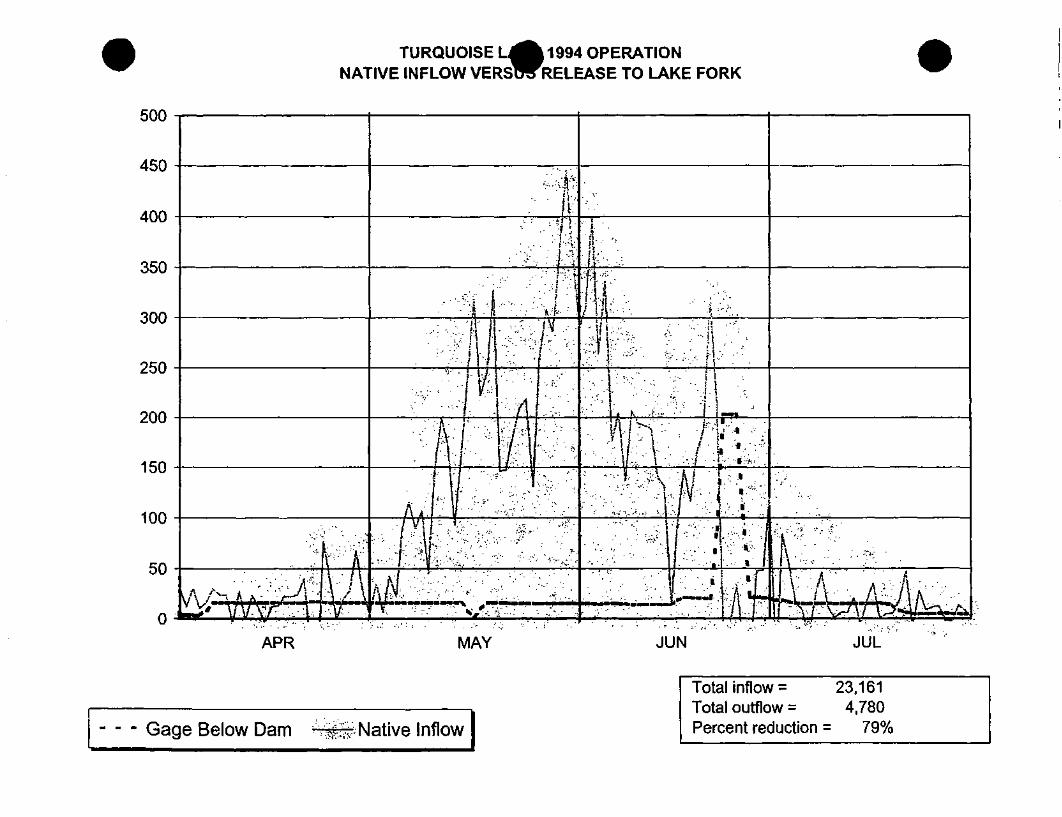
TURQUOISE L^m 1994 OPERATIONNATIVE INFLOW VERSWRELEASE TO LAKE FORK
500
450
400
APR MAY JUN JUL
- - - Gage Below Dam ^TT? Native Inflow
Total inflow = 23,161Total outflow = 4,780Percent reduction = 79%
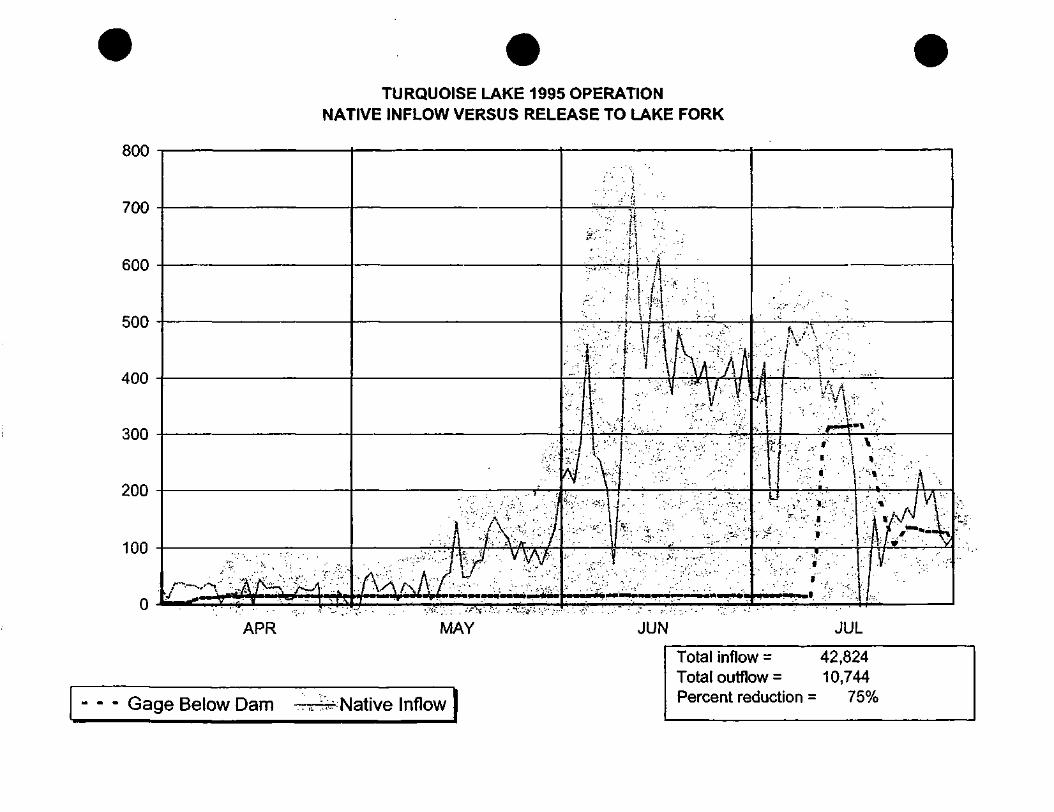
800
700
600
500
400
300
200
100
APR
• - - Gage Below Dam
TURQUOISE LAKE 1995 OPERATIONNATIVE INFLOW VERSUS RELEASE TO LAKE FORK
MAY JUN JUL
Native Inflow
Total inflow = 42,824Total outflow = 10,744Percent reduction = 75%
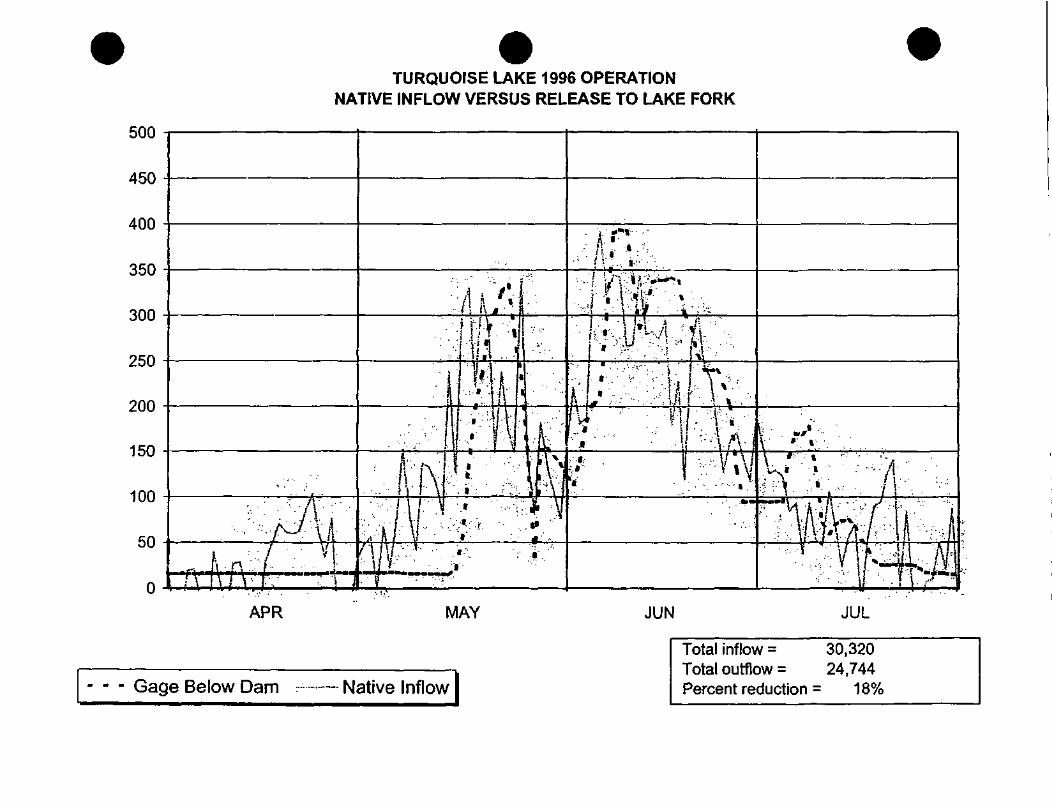
500
450
400
350
300
250
200
150
100
TURQUOISE LAKE 1996 OPERATIONNATIVE INFLOW VERSUS RELEASE TO LAKE FORK
APR MAY JUN JUL
- - - Gage Below Dam Native Inflow
Total inflow = 30,320Total outflow = 24,744Percent reduction = 18%
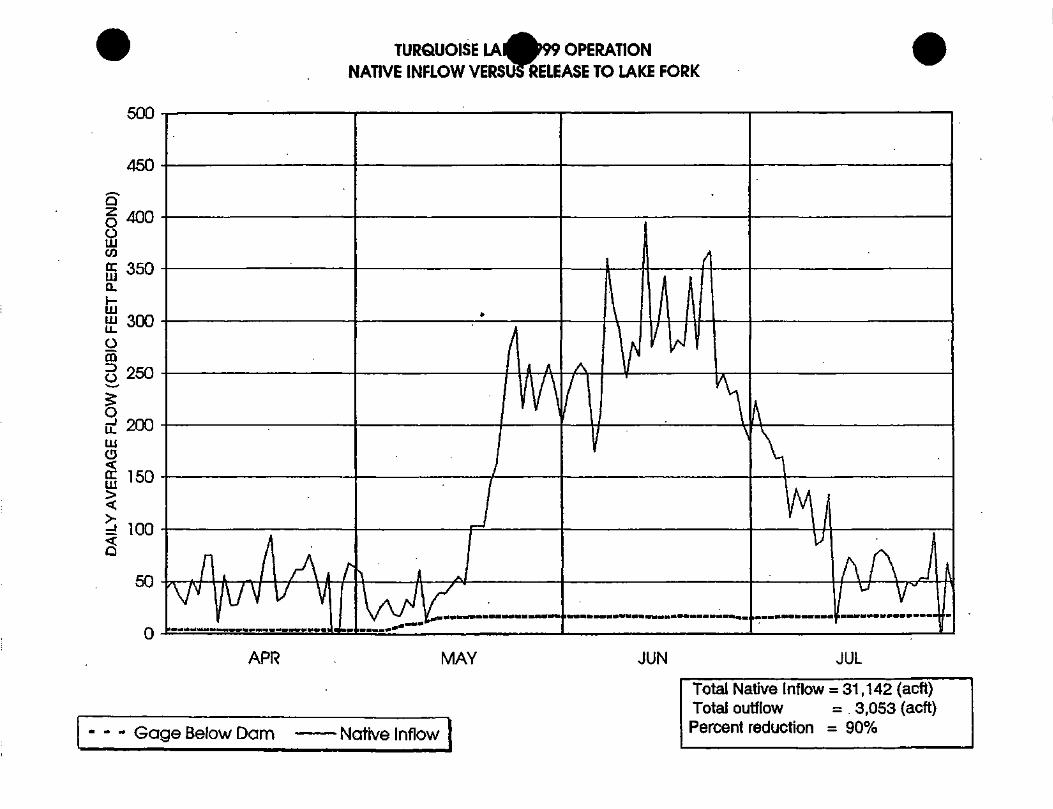
TURQUOISE LANATIVE INFLOW VERS
OPERATIONRELEASE TO LAKE FORK
500
O-11
APR MAY JUN JUL
• - - Gage Below Dam • Native Inflow
Total Native Inflow = 31,142 (acft)Total outflow = 3,053 (acft)Percent reduction = 90%
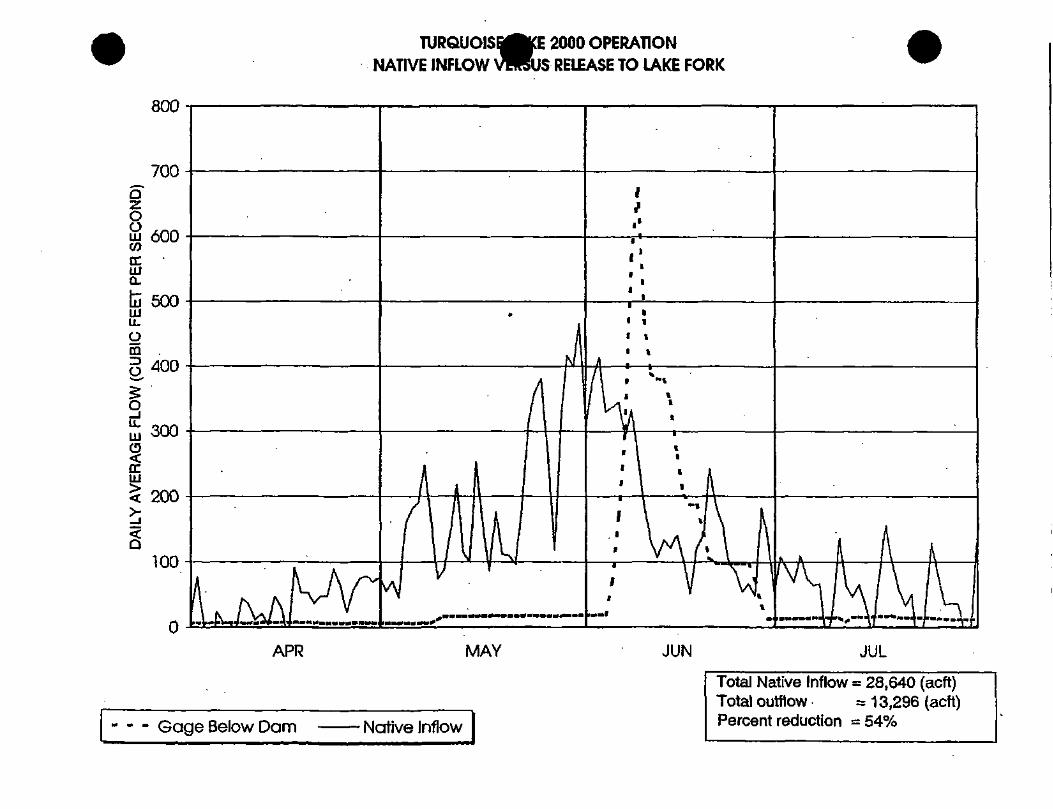
TURQUOISNATIVE INFLOW
2000 OPERATIONUS RELEASE TO LAKE FORK
aooLLJV)
Q.
In01u.omO
Ou.in
S£EUJ
800
700
600
600
400
300
200
100
APR MAY JUN JUL
• - - Gage Below Dam Native Inflow
Total Native Inflow = 28,640 (acft)Total outflow = 13,296 (actt)Percent reduction = 54%
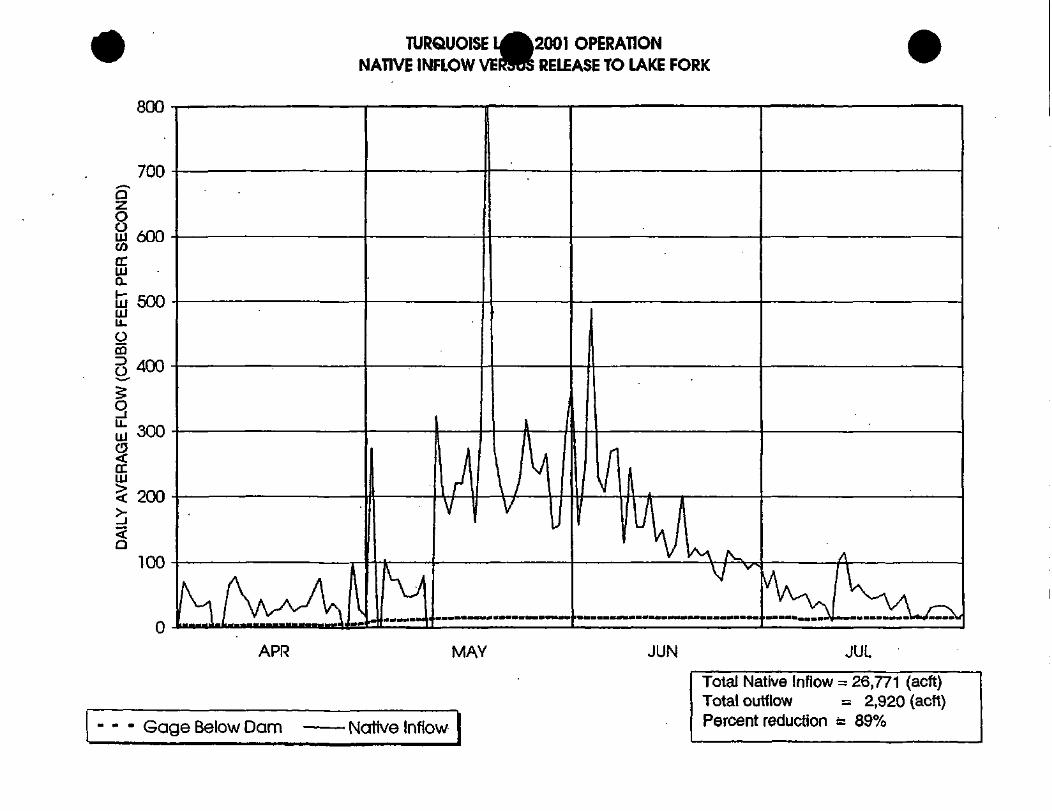
TURQUOISENATIVE INFLOW VE
2001 OPERATIONRELEASE TO LAKE FORK
800
APR MAY JUN JUL
- • • Gage Below Dam Native Inflow
Total Native Inflow = 26,771 (acft)Total outflow = 2,920 (acft)Percent reduction = 89%
APPENDIX C,
Chemical Data
Electronic Database
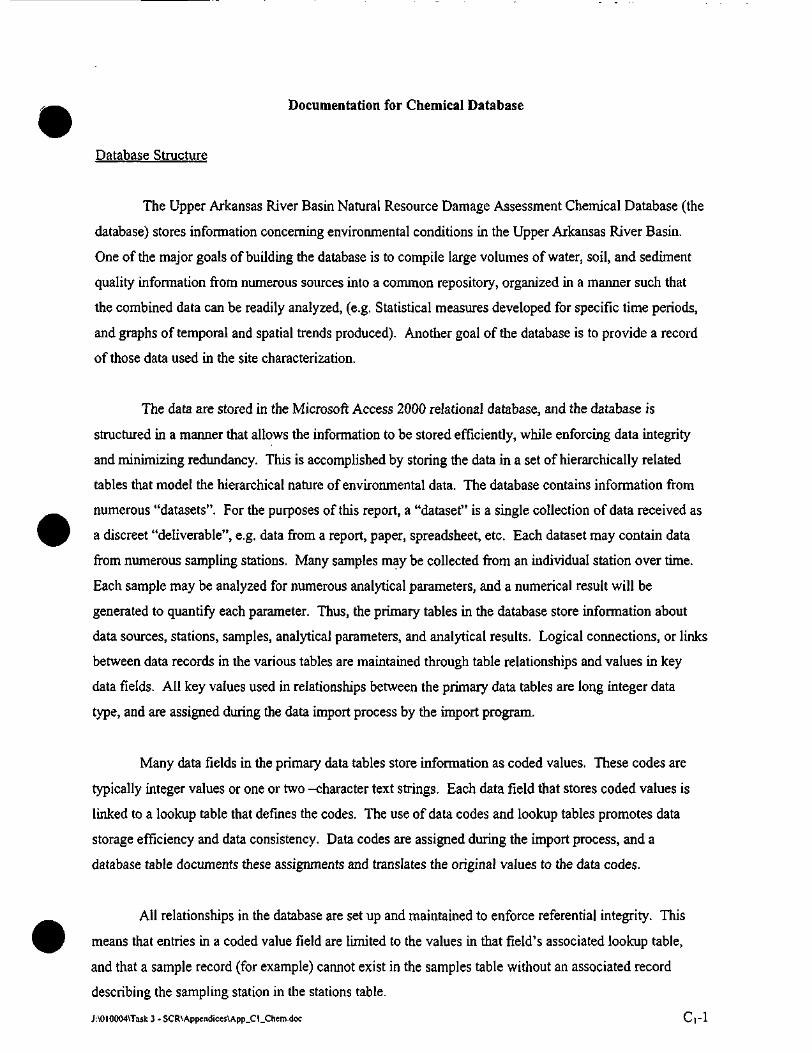
Documentation for Chemical Database
Database Structure
The Upper Arkansas River Basin Natural Resource Damage Assessment Chemical Database (the
database) stores information concerning environmental conditions in the Upper Arkansas River Basin.
One of the major goals of building the database is to compile large volumes of water, soil, and sediment
quality information from numerous sources into a common repository, organized in a manner such that
the combined data can be readily analyzed, (e.g. Statistical measures developed for specific time periods,
and graphs of temporal and spatial trends produced). Another goal of the database is to provide a record
of those data used in the site characterization.
The data are stored in the Microsoft Access 2000 relational database, and the database is
structured in a manner that allows the information to be stored efficiently, while enforcing data integrity
and minimizing redundancy. This is accomplished by storing the data in a set of hierarchically related
tables that model the hierarchical nature of environmental data. The database contains information from
numerous "datasets". For the purposes of this report, a "dataset" is a single collection of data received as
a discreet "deliverable", e.g. data from a report, paper, spreadsheet, etc. Each dataset may contain data
from numerous sampling stations. Many samples may be collected from an individual station over time.
Each sample may be analyzed for numerous analytical parameters, and a numerical result will be
generated to quantify each parameter. Thus, the primary tables in the database store information about
data sources, stations, samples, analytical parameters, and analytical results. Logical connections, or links
between data records in the various tables are maintained through table relationships and values in key
data fields. All key values used in relationships between the primary data tables are long integer data
type, and are assigned during the data import process by the import program.
Many data fields in the primary data tables store information as coded values. These codes are
typically integer values or one or two -character text strings. Each data field that stores coded values is
linked to a lookup table that defines the codes. The use of data codes and lookup tables promotes data
storage efficiency and data consistency. Data codes are assigned during the import process, and a
database table documents these assignments and translates the original values to the data codes.
All relationships in the database are set up and maintained to enforce referential integrity. This
means that entries in a coded value field are limited to the values in that field's associated lookup table,
and that a sample record (for example) cannot exist in the samples table without an associated record
describing the sampling station in the stations table.
J:\OI0004\Task 3 - SCR\Appendices\App_CI_Chem.doc Cpl
Tables, queries, and other database objects are named following standard naming conventions.
Object names consist of a lower-case prefix to indicate object type, followed by a proper case descriptive
name. The prefixes tbl, Ik, and qry are used to indicate primary data tables, lookup tables, and queries,
respectively.
A table of Data Sources for the Upper Arkansas Site Characterization Database can be found at
the end of this appendix. An Entity-Relationship Diagram for the database table is also included in this
appendix.
Dataset Processing & Import
Raw datasets received from all data sources were checked for a minimum set of required
information for each sample, and if sufficient information was available to allow processing, a
restructuring process was performed prior to importing into the database. Datasets were prioritized for
entry into the database based on how recent and how complete and pertinent the data were for site
characterization purposes. A pair of digital data folders was created to store files associated with each
dataset. A read-only folder was created to preserve the original unprocessed data files as they were
received from the data provider. The second folder was made to store files as they underwent the
restructuring necessary for import to the database.
Datasets were required to have (at a minimum) a) complete sample location, i.e. known
geographic coordinates, b) sample collection date, c) analytical parameter, d) numerical result value, and
e) units of measure information in order to be included in the database. In addition to these minimum
requirements, every effort was made to obtain sample depth, analytical method, and limits of detection
data for each dataset.
Sampling station location data was requested, and typically received, as X-Y coordinate pairs. In
cases of datasets lacking coordinate data but having detailed location descriptions, the descriptions and
GIS software were used to generate coordinates. Datasets lacking both coordinates and detailed location
descriptions were not usable. However, in cases where a small percentage of a dataset's stations lacked
sufficient locational data these stations were included in the database in the hope that the locational data
may be obtained through ongoing data acquisition efforts. (Data associated with these stations were
excluded from data analysis efforts until coordinates were obtained.)
J:\OI0004\Task3 -SCR\Appendices\App_Ct_Chem.doc C\-2
Sample collection date information was requested and typically received as complete
month/day/year dates. Certain datasets contained incomplete sample date information, typically as
month/year. The database structure requires dates to be stored in month/day/year format. When
incomplete dates were encountered, a request was made to the data provider to obtain the missing
information. If attempts to obtain exact sample date data were unsuccessful, sample dates were assumed
based on available information and a note was made in the samples table for those records.
After all essential data components were obtained, the datasets were prepared for import to the
database. All data was brought into the database through a custom import program. This program is built
into the database, and receives the incoming data via an import template table. The process of adding
data to the database involves two principal steps. First, each dataset must be processed into the structural
format of the template table, and then the import program is run to move the data elements from the
template table to the appropriate tables in the repository database.
A Microsoft Access 2000 database file was created for each source dataset for pre-processing
purposes. Each one of these database files contains all original data files and tables associated with a
dataset and any queries, utility programs, and intermediate tables that were created in order to restructure
the dataset into the import table. The import table is a flat-file table containing 34 data fields to
accommodate anticipated data elements, five long text fields for notes and miscellaneous data, and three
long integer fields to store key values assigned by the import program.
At the conclusion of the pre-processing, each dataset (in the import template format) was brought
into the main repository database and the import program was run. This program consists of four steps
initiated from a user interface form. Step one opens a. form for entry of general information about the
dataset including: title, author, source organization, date published, etc. The second step runs a procedure
that converts all null values in the import table to missing data flags. This is necessary because
procedures used in the program require that all data fields contain non-null values. Null date and time
data elements were set to 11/11/1111, and null numeric and text values were replaced with -9999.99.
Step three of the program opens an interactive form used to assign lookup values for data fields that are
stored as coded values tied to lookup tables. The form displays a list of fields for which lookup values
need to be assigned. When a field is selected, two new lists are populated. One displays a list of unique
values for the field from the import table, and the other lists the values currently in the associated lookup
table. Lookup codes are assigned by selecting a value from the import table list and double-clicking the
desired value in the lookup table list. An option exists on the form to add entries to the lookup table if
necessary. All lookup code assignments are written to a database table. This table is used by the final
step of the import program to translate the original values to lookup codes as records are written to the
J:\010004\Task3-SCR\Appendices\App_CI_Chem.doc Cp3
repository database tables. The table also provides documentation of the data translations made during
import. The final step of the import process runs a series of procedures that assign key values used in the
database relationships, and append the data to the appropriate tables in the repository database.
Post-Import Data Conversion
The database was constructed with the philosophy of preserving data values as they were
originally reported, to the extent possible. This approach minimizes opportunity for errors induced by
data conversion and manipulation, and facilitates easy comparison between the database and original
files, but is in apparent conflict with the database goal of normalizing data to a readily comparable state.
This conflict was handled by storing original data values in the database, but then providing means to
dynamically normalize the data to a readily comparable state. This normalization process was carried out
for station locations, station types, analyte names, numerical values/units of measure, and data qualifiers.
Sampling stations provided numerous data normalization challenges. Due to the variety of data
sources, numerous station naming conventions and coordinate systems were encountered. Station names
were not usable in efforts to group all samples collected at a given location because different data sources
assigned different names to common sampling stations. Conversely, common station names were
assigned to a variety of different sampling locations by various organizations. In addition, stations
associated with sample records common to multiple datasets were often found to have slightly different
coordinates in the separate datasets. These discrepancies were introduced by the variety of conventions
and electronic storage formats used by various data source organizations. The GIS was used to project all
coordinates into a standard geographic projection (UTM, NAD 27 meters). Coordinate data are stored in
the stations table both in their original form and in the standard projection. The standard projection was
used for all mapping and analysis tasks. Stations were normalized for data grouping and comparison in
the GIS using spatial buffers. For station counting purposes, all stations within two meters of each other
were considered to be the same station and assigned a common buffer identifier. These identifiers are of
long integer data type and were written to a field in the stations table by a GIS macro. For duplicate data
identification across multiple datasets, a 100-meter buffer was also generated for each station. These
buffer identifiers were used to identify stations for all data analysis tasks.
Station type information is used by data queries to group and select data. For example, a query
may use station type as a selection criterion to retrieve all data associated with river sampling stations.
Some source datasets contained a data field indicating sampling location type, such as river, soil boring,
well, seep, etc. This data was translated to lookup codes during the import process and stored in the
stations table and station type lookup table. With other datasets the station type may not be explicitly
J:\010004\Task 3 - SCR\Appendices\App_C l_Chem.doc C | -4
stated in the source files, but may be readily inferred from text describing the station, sample media
reported, or station X-Y location. For example, stations associated with groundwater samples were
inferred to be wells. A location type table in the database stores sampling location type information for
all stations. The table contains a record corresponding to every station record in the stations table.
Location type codes are assigned in this table for each station after a dataset is imported. A code source
field indicates whether the location type code was based on data in the original source file, or inferred
based on other information such as station description or X-Y location.
Each station in the database was assigned a summary zone, or reach designation, in order to group
data by spatial location within the drainage basin. Summary zones exist for distinct reaches of the
Arkansas River, as well as its major tributaries and surrounding upland areas. Stations in a dataset were
assigned to summary zones after the dataset was imported. Summary zone assignments were based
primarily on station location, but other data such as textual descriptions of sampling locations were used
to support zone assignments. This auxiliary data was given greater weight when station coordinates were
of questionable quality.
Analytical result values are stored in the results table in the units of measure reported in the
original data files. Records in the results table are linked to records in the parameters table. The
parameters table stores the original parameter names and units as reported by the data provider. In order
to readily query and compare values from different data sources a system of standard analyte names and
units is necessary. For example, a source dataset may report values for 'Dissolved Zinc' in micrograms
per liter. Another source dataset may report values for 'Zn, D' in milligrams per liter. To facilitate
comparison of this data, the parameters table contains Standard Analyte, Standard Unit, and Multiplier
data fields used to normalize data to common names and units. Records for the example given would be
assigned a Standard Analyte of 'Zinc, Dissolved' and a Standard Unit of 'mg/L'. Records having
original units of milligrams per liter would be given ' 1' as a multiplier, while records originally reported
as micrograms per liter would be assigned a multiplier of '0.001'. The standard analyte and unit fields,
when used in conjunction with the product of the original value and the multiplier, produce a normalized
dataset. This approach is used by all saved queries that extract results information for comparison and
analysis. A similar approach is used with sample depth data. Values are stored in their original units, and
a standard unit and multiplier are used to normalize values.
Many datasets contained a variety of qualifiers associated with result values. During dataset pre-
processing and import these qualifiers were put into one of three data fields depending on whether they
were assigned by an analytical lab, data validator, or other or unknown source. After data were imported
to the database each record was assigned an additional qualifier code. This code serves as a master
J:\OI0004\Task 3 - SCR\Appendices\App_CI_Chem.doc C[-5
qualifier and groups all other qualifiers into several basic categories for data comparison and analysis
purposes. Records were classified as either unqualified, non-detect, or rejected.
Analysis Sub-Datasets
Additional data processing steps were performed to prepare the data for use in a data analysis
program. These steps include setting flags to indicate duplicate records (records with the same location,
date, parameter, and analytical result, arising from obtaining partially overlapping datasets from multiple
agencies or sources), statistical outliers, and assigning codes to indicate the appropriate analysis time
period and flow regime (high flow, low flow) for each record. This additional processing and all
subsequent data analysis were performed in a separate database file. This was done to keep file sizes
manageable and to keep a clear distinction between raw data and the processed data used for statistical
analysis and interpretations. The database is a raw data repository that preserves data as it was received
from the data provider to the extent possible. The data analysis database file accesses the tables in the
raw data repository through live links, and uses queries to create static copies of the appropriate data for
charting and statistics purposes. It is in these copied tables that all interpretive flags and codes are
assigned. A set of queries and Visual Basic programs in the data analysis file are used to refresh the
analysis tables as needed. The refresh process deletes the current analysis table, queries the data
repository and constructs a new analysis table containing the appropriate data, then runs a series of
procedures that update the several "flag" fields in the table.
Analysis tables are created for each of the following media: Surface Water, Groundwater,
Sediment, Lowland Soil, and Upland Soil. The queries that create these tables limit the data to include
only complete and valid records for the media and parameters of interest. Records lacking coordinates
are excluded, as are those describing field duplicate and lab QA/QC samples. Records flagged as rejected
or otherwise invalid by the data validator are also excluded. The queries that create the analysis tables
normalize all parameters to standardized parameter names, and convert numerical values to consistent
units of measure so that they may be readily compared.
Duplicate Flags
The database is a compilation of numerous source datasets from numerous data providers. Many
of these datasets originate from databases maintained by public agencies or from consultants working
with these public datasets. Thus, there can be considerable overlap between datasets received from
different data providers. Datasets were added to the database in their entirety, no effort was made to
exclude records that were already included in the database from a previously added data source. This was
J:\010004\Task 3 - SCR\Appendices\App_CI_Chem.doc C|-6
done to preserve datasets intact and avoid difficulties in identifying areas of overlap induced by rounding
and other formatting performed by individual dataset providers. As a preferred alternative to identifying
and excluding duplicated records prior to import, a Visual Basic program was developed to identify
duplicated records during the analysis table refresh process.
Each analysis table contains a field that stores a duplicate flag for each record. This flag's value
is initialized to '0' for all records at the start of the duplicate flagging program. Then the program creates
a temporary table containing all unique combinations of normalized sample location, date, analyte, and
value entries from the subject table. The program steps through the records in this temporary table. For
each record in the temporary table the program retrieves all records from the subject table matching the
record's normalized sample location, date, analyte, and value. If only one matching record is retrieved,
the record's duplicate flag is left as 0 and the program moves on to the next record in the temporary table.
If more than one matching record is retrieved, the program steps through the matching records and
increments their duplicate flags from 1 to n (the number of duplicates). When the program has finished
running, a duplicate-free recordset may be retrieved by selecting only records having a duplicate flag of 0
or 1.
Time Flags
For data analysis purposes, the time continuum is split into three periods corresponding to
historical events influencing water flow and quality. The annual cycle is also split into periods of high
and low flow. The dates of these period breaks are stored in a table in the analysis database (illustrated
below). Each analysis data table contains data fields that store a period value and flow flag for each
record. A series of procedures are run to update the period and flow flags based on each record's sample
date when an analysis data table is refreshed.
High Flow
Low Flow
Period 1
Period 2
Period 3
.:-'-:-:"-''-'-'- -•••/••', •••- , ' '
5/1 /XX
8/15/XX
1/1/1900
6/1/81
2/1/92
:Ty.' .•:' •';-''•.'.'."
8/14/XX
4/30/XX
5/31/81
1/31/92
Present Date
J:\010004\Task 3 - SCR\Appendices\App_Cl_Chem.doc C.-7
Non-Detects
Records in the analysis tables having qualifiers indicating non-detect results were updated to one-
half of the reported value (the reported value for non-detect records is typically the detection limit). This
operation is performed by a Visual Basic procedure when the analysis tables are refreshed.
Outlier Flags
Outlier flagging is performed on the surface water data analysis table. Data records which are
determined to be statistical outliers are flagged with an 'O' in the qualifier field. The outlier flagging
procedure begins by resetting all qualifiers in the surface water data analysis table to the qualifier value
stored in the main data repository (clears all outlier flags). The program then retrieves lists of the
summary zone groups and analytes to be considered in the outlier test. Currently the program considers
data from Arkansas River reaches 0-4 (grouped collectively as Ark R) and the Cal Gulch and Cal Gulch at
Ark Riv zones (grouped together as Cal Gulch). Analytes considered include dissolved and total
Cadmium, Copper, Lead, and Zinc, as well as Hardness. The program steps through all possible zone-
analyte combinations. For each iteration, the procedure retrieves a recordset consisting of all data records
for the current zone and analyte. It then calculates the mean and standard deviation of this recordset. The
procedure then finds all records within the recordset having values greater than or equal to the mean plus
four standard deviations (one-sided test), and updates the qualifier field to 'O' for these records. (It
should be noted that data from all dates and flow periods are considered together in the outlier tests. The
recordsets used in the outlier tests are defined solely by summary zone and analyte.)
Table Value Standards
Acute and chronic Colorado Table Value Standards (TVS) were calculated for dissolved
cadmium, copper, lead, and zinc for selected river reaches. These calculations were performed by a
Visual Basic program and the resulting values were stored in a table in the analysis database file. The
program begins by creating lists of all analytes, river reaches, time periods, and flow periods for which
standards are to be calculated. It then steps through all possible combinations of analyte, reach, time
period, and flow period. During each iteration of the loop, the program calculates an average hardness
value for use in the standards calculations, then calculates the acute and chronic standards based on the
average hardness, and counts the number of records exceeding each of the standards for the current
analyte-reach-time-flow scenario.
J:\OI0004\Task 3 - SCR\Appendices\App_Cl_Chem.doc C|-8
Average hardness values are calculated for each scenario using available hardness data applicable
to the scenario's reach, time period, and flow period. Hardness, Total Hardness, and Calculated Hardness
values were used, while Carbonate and Non-Carbonate Hardness values were not included. For TVS
calculation purposes, average hardness values less than 25 mg/L or greater than 400 mg/L were reset to
25 and 400 mg/L, respectively.
Charting and Statistics
The data analysis database file includes a set of forms that provide a graphical user interface for
selecting and charting data. This interface provides users with a means to select specific data subsets
based on sample media, river reach, analyte, flow period, and time period criteria, and display charts and
statistical summaries of the selected data. Two types of charts are available in the program. One is a
time-series chart displaying a parameter's values for a single reach over time. The other allows
comparison between reaches by displaying a parameter's minimum, maximum, and average values for
multiple reaches.
A maximum series-axis value is specified in the database for each parameter that is plotted on the
time-series charts. These values are used by the charting program to limit the scale of the vertical axis so
that all charts produced for a given parameter have the same scale and are readily comparable. Data
points that exceed the chart limit are displayed in a table below the chart.
There are several display options for the time-series charts that may be toggled on and off using
check boxes on the user interface. Data points representing non-detect analysis results may be displayed
with a different symbol than results greater than the detection limit. Acute and chronic Table Value
Standards may be displayed on the chart as horizontal lines at the standard levels. This option is available
when the 'High Flow' and/or 'Low Flow' options are selected, but is disabled when the 'All Flow' option
is chosen because Table Value Standards only exist for the high and low flow divisions of the annual flow
cycle. An option is available to display period breaks on the chart when the 'All Periods' sample date
option is chosen. Period breaks appear on the charts as vertical lines marking the division points between
the three data analysis periods.
J:\Ol0004\Task3 -SCR\Appendices\App_Cl_Chem.doc Cp9
Data Sources for the Upper ArlRecord Count by
Site Characterization Databaseand Data Source
Source Query: JA010004VTask 2 - Data Acquisltion\DataAnalysis\LNRD_DataAnalysis.mdb - p,ryOa/aSrc_Report
LNRD #
LNRD-001 Surface Water Quality Data for theArkansas River
'SoifceOrgartotkih
USFWS
LNRD-006 !Cal Gulch Water Quality Data MSSI
LNRD-010
LNRD-011
ill.•;•„;' -Autria '?•':
Arkansas River Database- USFWS1994
Cal Gulch WQ Data IISSISurface Water Quality Data from CSU- CSU-AEHS IWator Quality data (1968- -Clements (CSU)AEHS (1968-1996) I 1996)Colorado River Watch Dala - Surface CDOWWater i
LNRD-015 i Division of Wildlife Water Quality Data
LNRD-016
LNRD-017
LNRD-020
LNRD-021
CSU - Department ofFishery and WildlifeBiology
CDOW-RiverWatch data CDOW
DOW WQ and Discharge iCIements (CSU)Dala
Soil and Vegetation -Plant Cover. CSU [1986/1987 Soil and KeammererProduction. Tissue & Soil Metal j [vegetation Metals DalaConcentrations1996 Upper Arkansas Soil Data ! URS Operating 1996 Upper Arkansas Soil EPA/URS
Services (EPA) Data1997 Upper Arkansas Soils Data JURS Operating ; 1997 Upper Arkansas Soil EPA/URS
[Services (EPA) iDala-URS
Upper Arkansas 1998 Monitoring WellData
LNRD-023 i Upper Arkansas 1999 Monitoring WellJData
LNRD-024
LNRD-OM
URS OperatingServices (EPA)
Upper Arkansas 1998Monitoring Well Dala
URS Operating Upper Arkansas 1999Services (EPA) Monitoring Well Data
NURE Hydrogeochemical and Stream JUSGSSediment Data
USGS Flow data and field parameters JUSGS
1LNRD-030 ! 1994 & 1995 REMAP data ~1
i
LNRD-031
LNRD-033
LNRD-038
NURE Stream Sediment Data
EPAAJRS.Walton-Day(USGS)
EPA/URS
USGS
Flow and f eld parameter data USGS
jEPA J1994& 1995 REMAP data EPA
STORET groundwater and surface water EPA jSTORETdata EPAdata j iSeppi Ranch Soils - Swyers Data {Colorado Mountain jSeppi Ranch Soils - Swyers ! Swyers (CMC)
College JDataLevy Thesis Data - Plant and Soils JCSU Metal Contamination in Soils
and Plant Near Leadville
Seppi Ranch Soils - Colby Data Colorado Mountain iSeppi Ranch Soils - ColbyCollege [Data
David Levy(CSU)
Colby (CMC)
LNRD-039 jGroundwaterS Surface Water Data -SeppiiWWL JWW&L Groundwaler & JWWL'Ranch j i Surface Water Data
LNRD-041 Selected sediment and surface water data iUSGSfor the upper Arkansas River basin, iColorado. 1988-89 i
ILNRO-044 iGeochemical and Lead Isotope data for
j sir earn and lake sedimentsi
LNRD-049 [Total Zinc in 3 SW station, 1992-1997
i
USGS
BOR. Denver CO
-
Selected hydrologic data forthe upper Arkansas Riverbasin. Colorado. 1986-89
Geocnemical and LeadIsotope data for stream andlake sediments
Kimball,CaDender andAxtmann(USGS)
S.E. Church(USGS)
Relationships Between Metals Nelson andand Hyporheic Invertebrate 'Richard (BOR)Community Structure
"publish: bate :. •. .' RleName •
07/01/94;samples.data
09/29/99) mfg.mdb
1 1/05/OOjcsuarkwq.mdb
01/24/OOiarkansas.dbf
j . ...01/13/99JH2O.CDOW.data.w
jb3
Soil and VegetationJData.xls
02/10/97 96soildata.mdb
01/16/98j97soildata.mdb
|98 Monitoring WelllData.mdbi
!1999weHs.mdb;T-ILocations-2.mdbhttp://greenwood.cr.usgs.gov/pub/open-file-reports/ofr-97-0492/state/nure_co.htm
I
;s_rockies.remap.midb
02/11/00,
04/26/90
06/01/89;
04/25/39
02/02/90
03/01/95J
01/01/93;j
I03/13/99
"••.DaleEntered: MJn Date'"
12/14/99 01/01/01
01/19/00 11/11/1103/07/00 11/08/39
02/09/00 06/26/22
]03/23/00 j 09/17/96
03/03/00
05/22/00
08/1 5/87
09/12/96
05/22/00 j 10/17/97
05/04/00 ! 06/09/93
05/04/00
03/22/00
03/22/99
04/07/76
06/13/00 04/01/10I
06/14/00 09/12/94
02/1 5/00 06/16/06
05/25/00 10/01/89
04/09/01
05/22/00
06/22/00
06/01/88
10/01/98
10/25/89
04/05/01 | 10/01/88
08/14/00 07/01/93
03/06/01 07/07/92
Max Date
01/21/94
11/20/9810/13/99
04/11/99
09/02/99
08/15/87
12/10/96
10/17/97
11/09/98
10/29/99
09/19/79
12/19/99
Tola)Result'Count-
118477
1664
44174
4162
200
Media
it
MS
-Mln
e S
olid
Was
te
2886.
1 SO
- S
edim
ent''
SL-
. S
oil V
i. \
••-''
.,.' •
'.
..'.jeiBA
n ooqln
g -M
S
i 16698
"\ 1664!
TS- T
issue
.
:
44174
4162
200
!6938 6938 j
3429
784
2409
18169
147897
09/05/95 141
03/26/98"
10/01/89
06/01/88
10/01/98
11/02/89
05/01/89
203157
148
915
100
184
879
768
3429
i
-f
1
2361 i ! I 48;
I
8465
37
07/01/93 680!
i10/07/97 72
I
16169
147897
42 99
319 i 194341"
I148J
795
6
32
100 i
147
417 462
368 304
i I
72
VG
-VS
fleta
llon
;
'
IrV-
Un'
sp'e
clfle
d W
ater
• V
-;: ' '
1 '
118477J
L
!
j
i
ii
120ji
__|
-
1i
J:\010004VTask 3...\Appendices\App_C1_Tbl_1o3_dataSources.xls
Table C,-lPage 1 of2 10/22/2002
Data Sources for the Upper ARecord Count b
Site Characterization Databaseand Data Source
UNRD#
LNRD-050
LNRD-051
LNRD-052
LNRD-054
USGS 1992-96 Soil. SW & GW data
Resurrection Database - Groundwater,Pore Water. Sediment and Surface WaterDala
OU4 Cal Gulch Eco RA
USFWS Sediment Samples (1998)
LNRDJ055 CDOW/BOR/CSU 1995-1999 WQ Datafrom CDOW
LNRD-057 BLM July 2000 Soil/Sediment Data (2ndimport, private land data)
LNRD-058 .2000 Monitoring Well Data
LNRD-060
LNRD-061
LNRD-062
LNRD-063
LN"RD-664
LNRD-065
2000 spring/storm SW data, OU6/CalGulch, collected by Colorado MountainCollege
Surface soils data - 0 to 2 inches
Ecology & Environment, Surface andGroundwater data. Cal Gulch/ArkansasRiver area (1983)
1995-1996 Sediment data from CSU
USGS Semi-Annual Water Level Data
GW data for well at Dr. Smiths residence
LNRD-068 iCDPHEGW Dala (1984-2001)
i
•I111tSs
USGS
Shepherd-Miller
S. M. Sloller
USFWS
Effects of Fluvial Tailings onSoils and Surface andGroundwater- UpperArkansas River, Colorado,1992-96
Katie Walton-Day et al.(USGS)
Resurrection Database i Shepherd-Milleri
Screening-Level Ecological JS.M. SlollerRisk Assessment OU4California Gulch Superfund :Site i
USFWS Sediment Samples jUSFWS
CDOW CDOW/BOR/CSU 1995-1999WQ Data from CDOW
BLM
URS OperatingServices (EPA)EPA - Mike Holmes
Walsh
Ecology &Environment, Inc.
CSU
Davies,Clements, et al.
BLM July 2000 Soil/Sediment BLMData i
Upper Arkansas 2000Monitoring Well Data2000 Spring/Storm SurfaceWater Data - OU6/Cal Gulch
v • T: • -•;
•-.''••Date:'/01/01/00
•'.: '• '.';.• '"''•' '
• *: FSeNanw
WRIR99-4273.mdb
jdbforMFG.mdb
12/10/96
/.Entered •08/02/00
07/31/00
MinDaUr
09/01/92
04/26/94
02/27/01 01/07/94
05/01/98 SEDIMENT • 04/25/01 i 07/30/96pooled.xls i i
1 1/01/01 [Reportdbf i 06/15/01 06/05/96
EPA/URS
CDM Federal
Surface soils data - 0 to 2 jwaisriinchesSurface and Groundwater {Ecology &data, Cal Gulch/Arkansas Environment,River area Inc.
1995-1996 Sediment datafrom CSU
Clements (CSU)
USGS j USGS Upper Arkansas Basin JMike HaleySemi-Annual Well Network j(USGS)(Water Levels 196 3-2000)
iURS/EPA Preliminary EPA GW data for
well at Dr. Smiths residence
CDPHE CDPHE GW Data (1984-2001)
EPA/URS
CDPHE
j 03/07/01 07/06/00| !
Max Date.
09/01/92
09/16/99
10/04/95
05/14/98
10/01/99
' 08/02/00
2000 Monitoring j 12/06/00 06/15/00 08/30/00Well Data.mdb | !
01/18/OOitblChemRes cal gul j 04/05/01!OU 6TEMPjds,IblChemResTEMP.
ids
05/04/00 08/21/00
03/15/00;mfgsails.mdb 04/24/01 j 05/29/86
!06/20/83! 06/18/01
06/21/01
08/24/01
02/15/83
sedimenLHarrahy.x 06/19/01 08/10/95tS i
table.upark 06/26/01 08/05/63
DocsWellCombined.xls
Metals, dbf,Colo_src.dbf
07/25/01 05/07/01
09/04/01 07/23/84
09/08/97
02/21/83
08/23/96
11/03/00
05/07/01
03/28/01
Total .ResultCount
2376
70124
3720
2070
11641
1088
2032
3341
4087
362
OW
-Gro
undw
aler
1-'.
j
1372
8021
MS
-Mih
e S
olid
Wa
ste
.
i288
SD
-'Sedlm
'antri;.
.. •
..•••• •
••; .
''"..'•
• •• I
77
2070
|
2032
226 n
90!
1234
30
1003
1234
30
1003
r
90
&
SW
- S
urfa
ce W
ate
r
^••K
f* YG
- V
eget
atio
n
'"•'
.-,]
52 952';
i i
1858
61738
~
11641
1088
4087
3341
136
I*.
l/y-
Uns
peci
fied
Wate
r
!!
j
!
i i
! ii
i
""
J:\010004\Task 3...\Appendices\App_C1_Tbl_1o3_dataSources.xlsTable CrlPage 2 of2 10/22/2002
Arkansas River Outliers for Surface Water
p;f|ArkROArkROArkRIArkRIArkRIArkRIArkRIArkRIArkRIArkRIArkRIArkRIArkRIArkRIArkRIArkRI
ArkRIArkRIArkRI
ArkRIArkRIArkRIArkRIArkRIArkRIArkRIArkRIArkRIArkRIArkRIArkRIArkRI^kR1B(R1RrkR1
ArkRIArkRIArkRIArkRIArkRIArkRIArkRIArkRIArkRIArkRIArkRIArkRIArkRIArkRIArkRIArkRI
ArkRIArkRIArkR2ArkR2ArkR2Ark R2 jArkR2ArkR2ArkR2ArkR2
ArkR2ArkR2ArkR2ArkR2ArkR2 _j
ArkR3 jUrk Riv nr Cal Gul (AR2)
;:;ifArkRArkRArkR
ArkR jArkRArkRArkRArkRArkRArkRArkRArkRArkRArkRArkRArkRArkRArkRArkRArkR 1
ArkRArkR _,ArkRArkRArkRArkRArkRArkRArkRArkRArkR JArkRArkRArkRArkRArkRArkRArkRArkRArkR
ArkRArkRArkRArkRArkR
1Period 1Period 3Period 2Period 2Period 2Period 2Period 2_^Period 2Period 2Period 2Period 2Period 2Period 2Period 2Period 2Period 2Period 2Period 2Period 2Period 2Period 2PeriodsPeriod 3Period 3Period 3Period 3Period 3PeriodsPeriod 31
Period 3Period 3Period 3Periods
PeriodsPeriod 3Period 3Period 3Period 3PeriodsPeriodsPeriod 3Period 3,Period3Period 3Periods
Ark R iPeriod 3ArkRArkRArkRArkRArkR
ArkRArkRArkRArkR jArkRArkRArkRArkRArkR~|ArkRArkRArkRArkRArkRArkR
ArkR
ArkRIrk Riv nr Cal Gul (AR2) [ArkR
Wrk Riv nr Cal Gul (AR2) !Ark R|Ark Riv nr Cal Gul (AR2) JArk R
Period 3Period 3
Period 3Period 3Period 3PeriodsIPeriod 3Period 1Period 1Period 1Period 2Period 2
..'•.:':'.' .'I ••!.*';• '•< . to t - . ••Lead, TotalCopper, Dissolved
Cadmium. TotalCadmium, TotalCadmium, TotalCopger. DissolvedCopper, TotalCopper, TotalCopper, TotalCopper, TotalLead, TotalLead, TotalLead. TotalZinc, DissolvedZinc, DissolvedZinc, DissolvedZinc, DissolvedZinc, TotalZinc. TotalZinc, TotalZinc, TotalCadmium, DissolvedCadmium. DissolvedCadmium, DissolvedCadmium, DissolvedCadmium, DissolvedCadmium, DissolvedCadmium, DissolvedCadmium, TotalCadmium, TotalCopper, DissolvedCopper, DissolvedCopper, TotalCopper, TotalCopper, Total
Hardness
, ";;£. :'/' •j
11/13/1970 L5/3/19955/8/1991
9/11/19919/12/1991
HHLL
11/19/1986) L
3/25/19851 L5/8/1991 i H9/11/19919/12/19913/25/19859/11/19919/12/1 99"l2/16/19833/25/198511/19/19865/26/1987,5/8/19916/27/1991
9/11/19919/12/19915/6/1993
5/17/19935/22/19935/24/19935/6/19985/4/20005/11/20005/6/19985/4/20005/6/1893 j5/17/1993
5/6/19935/11/19935/15/19935/6/1993
Hardness | 9/17/1996HardnessHardnessLead, DissolvedLead, TotalLead, TotalZinc, DissolvedTine, DissolvedZinc, DissolvedZinc, DissolvedZinc, DissolvedZinc, DissolvedZinc, DissolvedZinc, DissolvedZinc, Dissolved
Zinc, DissolvedZinc, TotalHardnessHardnessHardnessCadmium, TotalCadmium. Total
Period 2 {Copper, Total'Period 2Period 2Period 2Period 2Period 2Period 3Period 3
Periods
Copper, TotalLead, TotalLead, TotalZinc, TotalZinc, TotalCopper, Dissolved
HardnessCadmium, Dissolved
Period 3 ICadmium, DissolvedPeriod 3 Lead. DissolvedPeriod 3 Lead, TotalPeriod 3 iZlnc. Total
11/20/19982/10/19995/11/20005/15/19935/11/20005/1/19935/6/19935/9/1993
5/17/19935/22/1993
Sta
ndan
dYat
utf'-
0.40.0560.0430.2510.08520.040.1890.3~63~
L t 0.687LL
0.3330.439
Ll 1.2rLj 1.09
L 1 2.9L 2.97LHHHLLHHHHHHHHHHHHHHHLLLHHHHHHH
H
2.438.62420.737.915.30.030.0290~0170.0170.0560.054
, 6.0270.0560.0610.068
' 6.067
0.1560.155
i 0.145414276334
292.80.780.3470.594.97.453.45
I 4.763.05
5/24/1993 j H 2.775/8/19963/13/1997j
HL
4/1/1997 t L4/22/19971 L
5/6/19935/18/19669/13/19661/18/19679/11/1991
HH
2.712.582.852.517.8
476.05883L ! 421. 64868L {300.08178L 0.0964
9/11/1991 i L 0.05879/11/1991^9/11/19919/11/19919/11/19919/11/19919/11/1991
L i 0.254L 6.213'LLLL
8/30/1995! L
4/8/1999 j L
5/6/1 998 _{ H_
"5/lT/2o66"i"H
0.8130.45223.411.7
0.078
3140.03
0.0265/1 1/2000 | H 0.575/1 1/2000 I H 0.65
6/21/1998! L 7.654
HImg/L
mg/L
Rea
uHIp
--
-':
•
106309.143001
mg/L 394197mg/L jj 44074mg/L 144080mg/L 385142mg/L L 132687mg/L j 394198mg/L 144076mg/L
mg/L
mg/L
mg/L
mg/L
144062r132689
144077144083747057
mg/L [ 132690mg/L j 385147mg/L j 132641
mg/L 394199mg/L ! 168017mg/L
mg/L
mg/L
mg/L
mg/L
mg/L
mg/L
mg/L
mg/L
mg/L
mg/L
mg/L
mg/L
mg/L
mg/L
mg/L
mg/L
mg/L
mg/L
mg/L
mg/L .
mg/L
mg/L
mg/L
mg/L
mg/L
mg/L
mg/L
mg/L
mg/L 'mg/L
mg_/L ,
mg/L
mg/L
mg/L
mg/L
mg/L
mg/L
mg/L
mg/L
144079J 44085
149774149841149868149885394326722707722659394327722708
ri49776149843149777
149809149831149788465199465341465579722667149834722668149772149789149806149855149883149900394297150672150689150706149790
^226799226810226821125305,125311125307
mg/L f 1253 13mg/L
mg/L
mg/L
mg/L
mg/L
mg/L
mg/L
125308125314125310125316125340
466106394497
mg/L | 722609mg/L JJ22617mg/L | 722618mg/L ! 464917
i 'i '
934913
1086
1086
1086
9131033
1033
1033
1033
934934934960960960960
1132
1132
1132
1132
947947
947947947947
1086
1086
913913
1033
1033
1033r 845
845845845837934934960960960960960
960960960960960
1132
845845845
1086
1086
1033
1033
934934
1132
1132
913845947947837934
1132
•: o-',.V
,..*..
0.0220.0050.0030.0030.003
0.0050.012
0.0120.012
0.0120.0220.0220.0220.2960.296
l||0.0770.008
0.01
0.01
6.01
0.0080.0320.0320.0320.0320.0776.0770.0770.5320.532
0.296J 0.5320.2960.5740.5740.57410.5741
0.0020.0020.0020.0020.0020.0020.0021
0.0030.0030.0056.0050.012
0.0120.012
88.37488.37488.37488.374
0.0040.0220.0220.2960.2960.2960.296,0.2966.2960.2960.2960.2960.2960.574
88.374
0.5321.735
1.7351.735
1.7350.0040.0040.0040.0040.0040.0046.004
0.01
0.01
0.0080.0080.032
0.0320.032
45.144
45.14445.14445.1440.0340.077
F 0.0770.5320.5320.5320.5320.5320.5320.5320.5320.532
I 0.532
' 1.73545.144
88.374J 45.14488.3741 45.144
0.003! 0.010.003] 0.010.012] 0.0326.0121 6.0320.022J 0.0770.0220.57410.5740.005
88.3740.002
0.077
1.7351.735
0.00845.1440.004
0.0021 0.0040.004 0.034
0.022! 0.0770.574: 1.735
|jjf
0.33
0.0370.043
I 0.04~36.043
L 0.0370.14
0.14
0.14
0.14
0.33
0.33
0.33
2.4242.4242.4242.4247.514,7.514
7.514
7.5141
0.0180.018
0.018
0.0180.018
0.018
0.0180.0430.0430.033]0.037
0.14
0.14
0.14
268.95268ll5268.95268.95
0.14
0.33
0.33
2.4242.424
2.4242.4242.4242.4242.4242.4242.424
2.424I
7.514
268.95268.95268.950.0430.043
0.14
0.14
0.331
0.33
7.514J7.5_t4J
0.037268.95,
0.018
0.0180.14
0.33
7.514
|||
LNRD-001LNRD-006
, LNRD-010I~LNRD-006
LNRD-006LNRD-031LNRD-006LNRD-010LNRD-006LNRD-006LNRD-006LNRD-006LNRD-006LNRD-062LNRD-006
LNRD-031LNRO-006LNRD-010
J.NRp-011LNRD-006LNRD-006LNRD-01 1LNRD-011LNRD-011LNRD-011LNRD-010LNRD-060LNRD-060LNRD-010LNRD-060LNRD-01 1LNRD-01 1LNRD-01 1
LNRD-01 1LNRD-011LNRD-011
LNRD-015LNRD-01 SLNRO-015LNRD-060LNRD-011LNRD-060LNRD-01 1LNRD-011
LNRD-011LNRD-011LNRD-01 1LNRD-011
LNRD-010LNRD-01 1LNRD-011LNRD-011
LNRD-011LNRD-031LNRD-031LNRD-031LNRD-006LNRD-006LNRD-006LNRD-006LNRO-006LNRD-006LNRD-006LNRD-006LNRD-006LNRD-015LNRD-010
LNRD-060LNRD-060LNRD-060LNRD-015
J:\010004\Task 3-SCR\Appendices\App_C1_Tbl_2o3_outliers.xls
Table C,-2Page I of 2
California Gulch Outliers for Surface Water
"' •- ' . "* L '• ,'• ',-.,•;>! . '.|Bt:-::.-x.W • .. - at- •Cal Gulch
Cal Gulch
Cal Gulch
Cal Gulch
Cal Gulch
Cal Gulch
Cal Gulch
Cal Gulch
Cal Gulch j
Cal Gulch
Cal Gulch
Cal Gulch
Cal Gulch
Cal Gulch
Cal Gulch
Cal Gulch
Cal Gulch
Cal Gulch
Cal Gulch
Cal Gulch
Cal Gulch
Cal Gulch
Cal Gulch
Cal Gulch
Cal Gulch
Cal Gulch
Cal Gulch
Cal Gulch
Cal Gulch
Cal Gulch
Cal Gulch
Cal Gulch
fel Gulch
m\ Gulch
Eal Gulch
Cal Gulch
Cal Gulch
Cal Gulch
Cal Gulch
Cal Gulch
Cal Gulch
Cal Gulch
Cal Gulch
Cal Gulch
Cal Gulch
Cal Gulch
Cal Gulch
Cal Gulch
Cal Gulch
Cal Gulch
Cal Gulch
Cal Gulch
Cal Gulch
Cal Gulch
Cal Gulch
Cal Gulch
Cal Gulch
Cal GulchCal Gulch
Wat
erbo
dy ;
Oregon Gl
Oregon Gl
Oregon Gl
Oregon Gl
Cal Gulch
Nugget Gl
Runoff
Runoff
Oregon Gl
Oregon Gl
Parshall Flume
Stray Horse Gl
Parshall Flume
Nugget Gl
Nugget Gl
Nugget Gl
Nugget Gl
Runoff
Runoff
^Nugget Gl
Nugget Gl
Nugget Gl
Nugget Gl
Nugget Gl
Nugget Gl
Nugget Gl
Runoff
Runoff
Nugget Gl
Nugget Gl
Nugget Gl
Oregon Gl
Oregon Gl
Oregon Gl
Oregon Gl
Oregon Gl
Oregon Gl _Oregon Gl
Oregon Gl
Oregon Gl
Oregon Gl
Cal Gulch
Oregon Gl
Cal Gulch
Oregon Gl
Oregon Gl
Oregon Gl
Oregon Gl
Oregon Gl
Oregon Gl
Oregon Gl
Oregon Gl
Oregon Gl
Oregon Gl
Oregon Gl
Oregon Gl
Oregon Gl
Oregon GlOregon Gl
Cal Gulch 'Oregon GlCal Gulch [Oregon GlCal Gulch Oregon GlCal Gulch-At Ark Riv (Cal Gulch
V;S '•
•>!'•"Period 2
[Period 2
Period 2
Period 2
Periods
Period 3
Period 3
Period 3
, Period 3
[Period 3"
lPenod3
Period 3
Period 3
Period 3
Period 3
Periods
Period 3
feriod 3
Period 3
Period 3
Period 3
Period 3
Period 3
Period 3
Period 3
Period 3
Period 3
Periods
Period 3
Period 3
Period 3
Period 3
Period 3
Period 3
Period 3
Period 3
Periods
Period 3
Period 3
Period 3
Period 3
Period 3
Period 3
Period 3
Period 3
Period 3
Period 3
Period 3
Period 3
Periods
Period 3
Period 3
Period 3
Periods
Periods
Periods
Periods
Period 3Period 3Period 3PeriodsPeriod 3Period 2
O^l'^y:
V :i '',. co''. ''.- '".Zinc, Dissolved
Zinc, Total
Zinc, Total
Zinc. Total
Cadmium, Dissolved
Cadmium, Total
Cadmium, Total
Cadmium, Total
Cadmium. Total
Cadmium, Total
Cadmium, Total
Cadmium, Total
Cadmium, Total
Copper, Dissolved
Copper, Dissolved
Copper, Dissolved
Copper, Dissolved
Copper, Dissolved
Copper, Dissolved
Copper, Dissolved
Copper, Dissolved
Copper, Dissolved
Copper, Total
Copper, Total
Copper, Total
Copper, Total
Copper, Total
Copper, Total
Copper, Total
Copper, Total
Copper, Total
Hardness
Hardness
Hardness
Hardness
Hardness
Hardness
Hardness
Hardness
Hardness
Lead, Dissolved
Lead, Dissolved
Lead. Total
Lead, Total
Zinc, Dissolved
Zinc, Dissolved
Zinc, Dissolved
Zinc, Dissolved
Zinc, Dissolved
Zinc, Dissolved
Zinc, Dissolved
Zinc, Dissolved
Zinc, Dissolved
Zinc. Total
Zinc, Total
Zinc, Total
Zinc, Total
Zinc, TotalZinc, TotalZinc, TotalZinc, TotalZinc. TotalCadmium, Total
•,". ' . .1 ..;:; *'• :'.f., . ' • ' .
''••$-$*
•••>!••?6/12/1991
5/2/1991
6/12/1991
7/24/1991
5/8/1996
6/15/1995"
6/16/1995
5/15/1997
8/29/1997
9/30/1997
5/1 1/2000
5/1 1/2000
5/11/2000
6/15/1995
6/26/1995
6/6/1996
5/15/1997
5/15/1997
6/3/1997
6/3/1997
6/3/1 997_
6/4/1997
6/15/1995
6/26/1995
6/6/1996
5/15/1997
5/15/1997
6/3/1997
6/3/1997
6/3/1997
6M/1997
5/4/1995
7/26/1995
_7/n/1996_
7/30/1997"
6/26/1997
8/29/1997
9/30/1997
5/28/1998
9/23/1998
6/6/1996
4/30/1997
6/6/1996
4/30/1997
5/4/1995
7/26/1995
7/11/1996
4/30/1997
6/26/1997
8/29/1997
9/30/1997
J/28/1998
9/23/1998
5/4/1995
7/26/1995
7/11/1996
4/30/1997
6/26/19978/29/19979/30/19975/28/19989/23/19989/11/1991
'at.
H
H
HHHH
HH
LLH
HH
H
HH
HH
H
H
H
HHH
HHHH
HH
H
H
H
H
LH
LLHLH
LHL
HH
H
L
HL
LH
LHH
H
LHLLHL
~L
• ' ' O1.'; /
644
1110
634
559
37.9
4
1.2
x>: ':!£•':;••;. • j- .3 ,. .::..',.'.pls> .!•'§./: ; ••'
;r>'*y|>-':ft.fmg/L
mg/L
mg/L
mg/L
mg/L
mg/L
mg/L
1.D2 mg/L
1.11.3
1.06
1.21
i 1.07
12
2919.5
11.1
42.5
21.5
16
15.5
isT "12.8
28
18.7
11.1
38.7
20.3
16.6
16.7
17.8
9620
8610
6420
7130
12400
.-II4..00 .""12006""
7960
14000
697
670709700
712
596438542
920917951
6381170
717
590482504
850~ 817
9016121100
"""1.53
mg/L
mg/L
mg/L
mg/L
mg/L
mg/L
mg/L
mg/L
mg/L
mg/L
mg/L
mg/L
mg/L
mg/L
jmg/L
mg/L
mg/L
mg/L
mg/L
mg/L
mg/L
mg/L
mg/L
mg/L as CaCOS
mg/L as CaCOS
mg/L as CaCOS
mg/L as CaCOS
mg/L as CaCOS
mg/L as CaCOS
mg/L as CaCOS
mg/L as CaCOS
mg/L as CaCOS
mg/L
mg/L
mg/L
mg/L
mg/L
mg/L
mg/L
mg/L
mg/L
mg/L
mg/L
mg/L
mg/L
mg/L
mg/L
mg/L
mg/L
mg/Lmg/L
mg/L
mg/L
mg/L
mg/L
/-' f ' ' .
|-|,;V
:'-nt;: -.
137765
13B0191
137766
;-'-. '-'>vl *.: .
(
-•f : V f .. -
• •'•• •' . •'
"fa •<?,.'•
: '.'s:v'835J 29.08
822
8221377751 822
1269381 834
6822251 8071
6504031 807
682882
137961
i 137971
725728,
725678
725778^
682231
807807807807807
807844
681664 844
681793 844
6823171 844
683457
683504
844
844
6819731 844
682364
682016
682232
681665
681794
682318
683458
683505
i 682365
681974
682017
685543
685844
6860591
844
844822822
622
822822822
822822
822619
619
6196861021 619
686278
686321"686364
686406
686449
137893,
128965
137895
128967
619
619
""619
619619799799807807
137784| 835
137854
137908
137918,
137958.
13796*
835
835835
835
835137978! 835
137998
138008
137785
137855
835835
822822
137909! 822
137919J 822
137959T379691
822822
137979 822137999! 822138009130911
822"807]
32.421
"32.421
32.421
0.149
0.115
0.1150.115
0.1150.1150.115
0.1150.115
0.743
0.743
0.743
0.743
0.743
0.743
0.743
0.743
0.743
0.83
0.83
0.83
0.83
0.83
0.83
0.83
0.83
0.83
594.1
594.1r 594.1
594.1
594.1594.1
~" 594."l
594.1594.11.995
1.9952.927
2.927
29.08
29.08
29.08
29.08
29.08
29.08
29.08
29.08
29.08
32.421
32.421
32.421
32.421
32.42132.42132.42132.42132.421
""b"."iis
.' •••• : -.»
;ffe:y'.-'.u:V'!',-''.A'';'''! ,','•
90.1 1| 389.52
96.319L 417.697
96.319 417.697
96.3191 417.697
1.321J 5.433
0.2231 1.007
0.223I 1.007
0.223L 1.007
0.223
0.223
1.0071.007
0.223! 1.007
0.223 1.007
0.223, 1.007P 2.532j 10.871
2.532
2.532
2.532
10.871
10.871
10.871
2.5321 10.871
2.532! 10.871
2.532
2.532
~ ~'2.532
2.508
2.508
2.508
2.508
2.508
2.508
2.508
2.508
10.871
10.871
~ 10.871
10.862
10.862
10.862
10.862
10.862
10.862
10.862
10.862
2.508J 10.862
1272.36| 5683.547
1272.36! 5683.547
1 272.36] "5683.547
1272.36
1272.36
1272.36
1272.36
1272.36
1272.36
34.3134.31
35.471
35.471
90.11
90.11
90.1190.11
90.11
90.11
90.1190.11
90.1196.319
5683.547
5683.547
5683.547
5683.547
5683.547
5683.547
139.235
139.235
144.811
144.811
389.52
3B9.52
389.52
389.52
389.52
3B9.52
389.52
389.52
389.52
417.697
96.3 19J 417.697
96.3191 417.697
96.319! 417.697
96.319] 417.69796.319! 417.69796.319! 417.69796.319! 417.69796.319 417.6970.223 ! 1.007
mm;$Jg
LNRO-006
LNRD-006
LNRD-006
LNRD-006
LNRD-006
LNRD-051
LNRD-051
LNRD-051
LNRD-006
LNRD-006
LNRD-060
LNRD-060
LNRD-060
LNRD-051
LNRD-051
LNRD-051
LNRD-051
LNRD-051
LNRD-051
LNRD-051
LNRD-051
LNRD-051
LNRD-051
LNRD-051
LNRD-051
LNRD-051
LNRD-051
LNRD-051
LNRD-051
LNRD-051
LNRD-051
LNRD-051
LNRD-051
LNRD-051
LNRD-051
LNRD-051
J-NRD-qSJ
INRD^OSILNRD-051
LNRD-051
LNRD-006
LNRD-006
LNRD-006
LNRD-006
LNRD-006
LNRD-006
LNRD-006
LNRD-006
LNRD-006
LNRD-006
LNRD-006
LNRD-006
LNRD-006
LNRD-006
LNRD-006
LNRD-006
j-NRD-poeLNRD-006LNRD-006LNRD-006LNRD-006LNRD-006LNRD-006
J:\010004\Task 3 • SCR\Appendices\App_C1_Tbl_2o3_oulliers.xls
Table C,-2Page 2 of 2
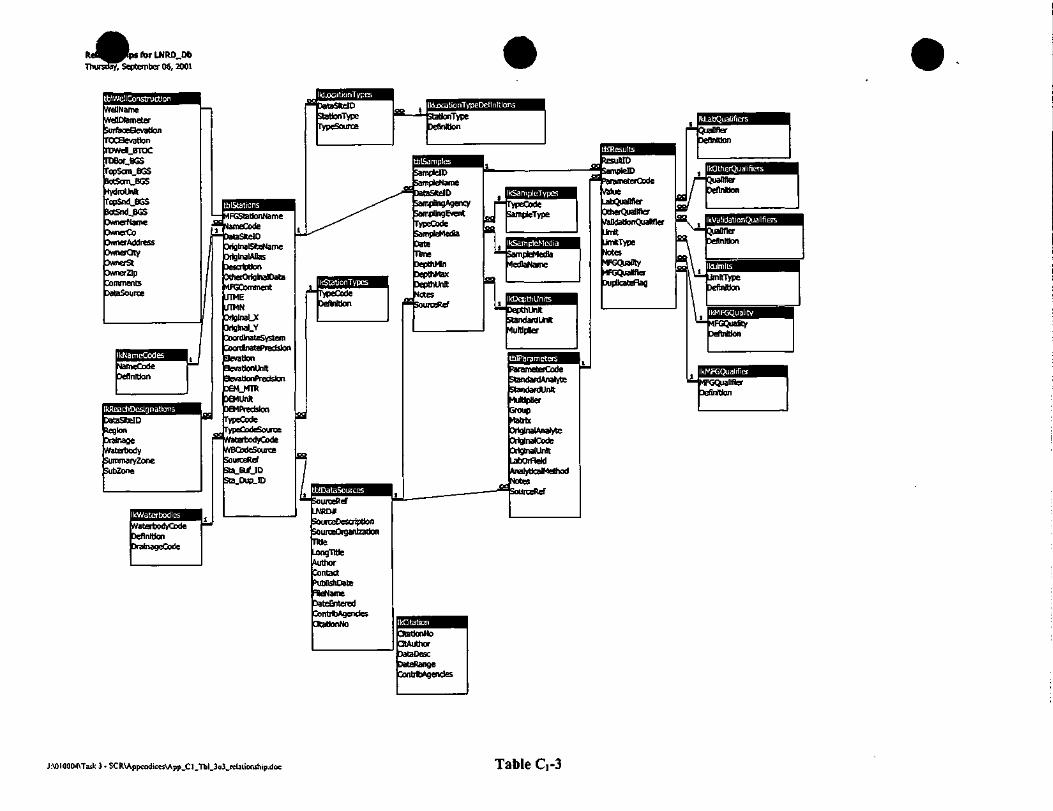
for LNRD.Db'September 06,2001
WeONameWellDtameterkirfeoeSevabonTOCBevattonTDWdLBTOCIDBor.BGSfopSan BGS3otSan_BGS-rydroUnHropSnd BGSBctSnd.BGSOwnerNameDwnerCoOwnerAddressOwneOty3wnerSt3wner2Ip
wOnvnents3ata Source
DataStelDRegionDrainageWaterbodySummaryZoneSubZone
t— MFGStattonName&NameCode
OriglnalSfteNameOriglnalAfiasdescriptionOthoOriglnalDataMFGCommentLTTMEUTMNOrtglnaLXOrigmal_YGoordlnatESystemCoonlnatePredslonElevationBevatlonUnltBevatlon^edslonIJEM_MTRDWUnftDeiPredskxiTypeCodeTypeCodeSource
flWatertxxlyCodeWBCodeSourceSouiceRefS»a_Buf_IDSta_Dup_ID
JourtEOtgantatton
TftteLongTitteAuthorContactPubOshDateFDeNameDateEnteredContribAgendesOtaoonNo
aampllngAgencylampllngEventrypeCodeSampleMeolaDatenmeDepthNn
DepthUnlt'lotes
r'SourctRef
lesuftlDOB
^ "arameterCodeValueLabQuaffierOtherQuallner
ParameterCodeStendardAnalyteStandardUnltMuttjplierGroupMatrixOriglnalAnalyteOrighalCodeOrigtnalUnltLabOifieWAnatyUcalMethodNotes
JmftJmitType*)tesIFGQuaDtyIFGQuaDnerDupBcateHag
J:\OI0004\Tnsfc 3 - SCR\Appcndiccs\App_CI.TbL3o3_rclalionship.doc Table C,-3
APPENDIX C2
Biological Data
Other Electronic Datasets
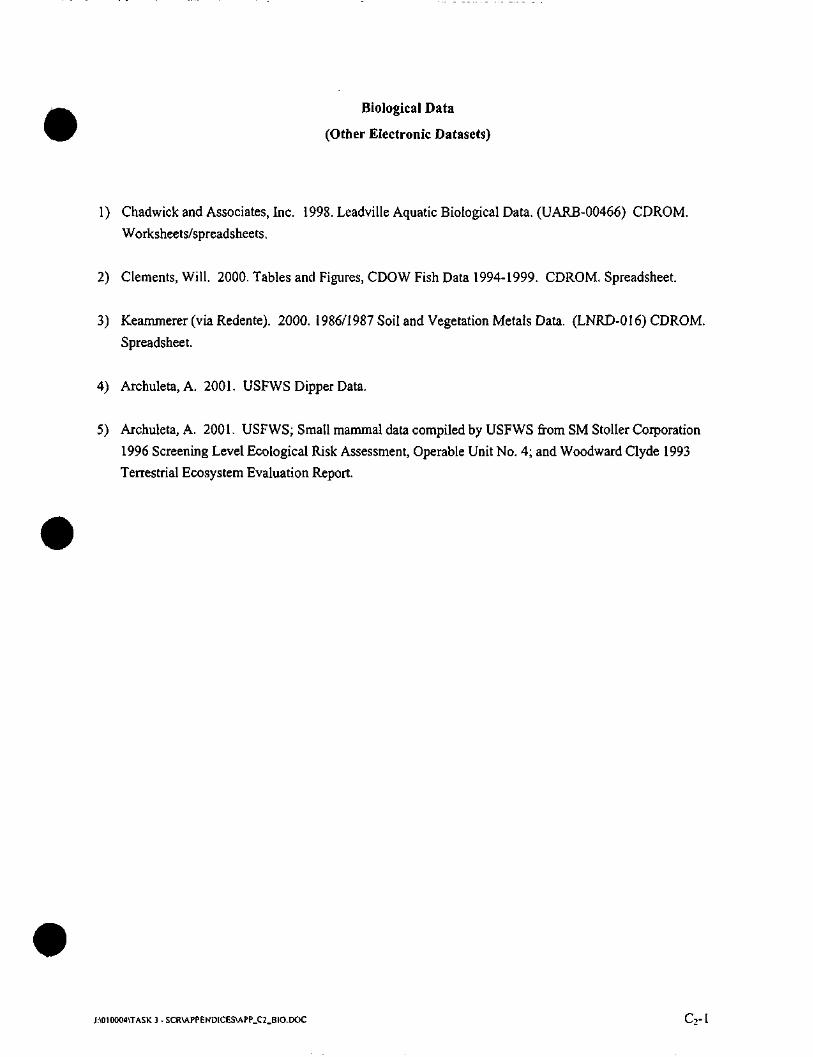
Biological Data
(Other Electronic Datasets)
1) Chadwick and Associates, Inc. 1998. Leadville Aquatic Biological Data. (UARB-00466) CDROM.
Worksheets/spreadsheets.
2) Clements, Will. 2000. Tables and Figures, CDOW Fish Data 1994-1999. CDROM. Spreadsheet.
3) Keammerer (via Redente). 2000. 1986/1987 Soil and Vegetation Metals Data. (LNRD-016) CDROM.
Spreadsheet.
4) Archuleta,A. 2001. USFWS Dipper Data.
5) Archuleta, A. 2001. USFWS; Small mammal data compiled by USFWS from SM Stoller Corporation
1996 Screening Level Ecological Risk Assessment, Operable Unit No. 4; and Woodward Clyde 1993
Terrestrial Ecosystem Evaluation Report.
J:\OI0004\TASK 3 - SCR\APPENDICES\APP_C2_BIO.DOC C2" 1
APPENDIX C3
Station Lists of Sampling Locations
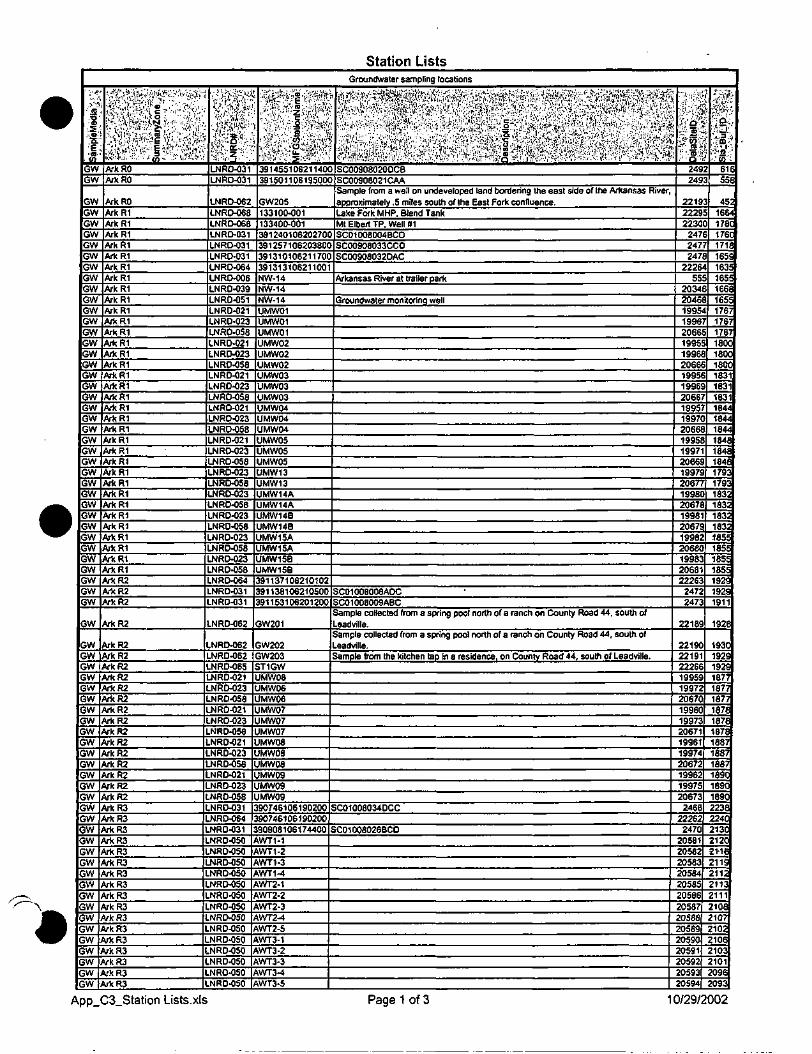
Station Lists
I"1• to(/)
GWGW
GWGWGWGWGWGWGWGWGWGWGWGWGWGWGWGWGWGWGWGWGWGWGWGWGWGWGWGWGWGWGWGWGWGWGWGWGWGW
GW
GWGWGWGWGWGWGWGWGWGWGWGWGWGWGWGWGWGWGWGWGWGWGWGWGWGWGWGWGWGWGWGW
lpit!;;'ll,;.rf.N, •;:.:-..;£.;, ,?..,K.*-.ArkROArkRO
ArkROArkR1ArkR1ArkR1ArkR1ArkR1ArkR1ArkR1ArkR1ArkR1ArkR1ArkR1ArkR1ArkR1ArkR1ArkR1ArkR1ArkR1ArkR1ArkR1ArkR1ArkR1ArkR1ArkR1ArkR1ArkR1ArkR1ArkR1ArkR1ArkR1ArkR1ArkR1ArkR1ArkR1ArkR1ArkR2ArkR2ArkR2
ArkRZ
ArkR2ArkR2ArkR2ArkR2ArkR2ArkR2ArkR2ArkR2ArkR2ArkR2ArkR2ArkR2ArkR2ArkR2ArkR2ArkR3ArkR3ArkRSArkR3ArkR3ArkR3ArkR3ArkR3ArkR3ArkR3ftrkRSArkR3ftrkR3ArkR3ArkR3<VrkR3ftrkR3
C?»tf&£&liPm^•K-g-":.LNRD-031LNRD-031
LNRD-062LNRD-068LNRD-068LNRD-031LNRD-031LNRD-031LNRO-064LNRD-006LNRO-039LNRD-051LNRD-021LNRD-023LNRD-058LNRD-021LNRD-023LNRD-058LNRD-021LNRD-023LNRD-058LNRD-021LNRD-023LNRD-058LNRD-021LNRD-023LNRD-058LNRD-023LNRD-058LNRD-023LNRD-058LNRD-023LNRD-058LNRD-023LNRD-058LNRD-023LNRD-058LNRD-064LNRD-031NRD-031
NRD-062
NRD-062NRD-062NRD-065
LNRD-021NRD-023NRD-058NRD-021NRD-023NRD-056NRD-021NRD-023NRD-058NRD-021NRD-023NRD-058NRD-031NRD-064NRD-031NRD-050NRD-050
LNRD-050NRD-050NRD-050NRO-050NRD-050NRD-050NRD-050NRD-050NRD-050NRD-050NRD-050NRD-050
•^iVj ;iv/n;,^j.::^V.
sis3914551062114039150110619500
GW205133100-001133400-0013912401062027039125710620380039131010621170039131310621100NW-14NW-14NW-14UMW01UMW01UMW01UMW02UMW02UMW02UMW03UMW03UMW03UMW04UMW04UMW04UMW05UMW05UMW05UMW13UMW13UMW14AUMW14AUMW14BUMW14BUMW15AUMW15AUMW15BUMW15B911371062101029113610621050091153106201200
GW201
GW202GW203
T1GWMW06MW06MW06MW07MW07MW07MW08MW08MW08MW09MW09MW09907461061902009074610619020090908106174400WT1-1WT1-2WT1-3WT1-4WT2-1WT2-2WT2-3WT2-4WT2-5WT3-1WT3-2WT3-3WT3-4WT3-5
Groundwater sampling locations
SC00908020DCBSC00908021CAASample from a well on undeveloped land bordering the east side of the Arkansas Riverapproximately .5 miles south of the East Fork confluence.Lake Fork MHP, Blend TankMt Elbert TP, Well #1SC01008004BCDSC00908033CCDSC00908032DAC
Arkansas River at trailer park
Groundwater monitoring well
SC01008008ADCSC01008C09ABCSample collected from a spring pool north of a ranch on County Road 44. south ofeadville.ample collected from a spring pool north of a ranch on County Road 44, south ofeadville.ample from the kitchen tap in a residence, on County Road 44, south of Leadville.
C01008034DCC
C01008026BCD
$,'•'&;'':';' 0-,Vi'-.a'.$;§>?_
249249
221922292230
247247247
2226455
20342046199541996206619951996{206619951996206619951997120661995819971206691997920677199802067819981206791998220680199832068122263
24722473
22189
221902219122266199591997220670199601997320671199611997420672199621997520673
246822262
24702058120582205832058420585205862058720588205892059020591205922059320594
a':;''b'.;,.S3''$*?;*n-::•••' 55 •
616558
4521664178(176C17K165E1635165516681655176717671767180C180C18001831183118311844184.1844184184184(1793179318321832183:18321355185E185!185!192?192!1911
1928
1930192J192S1877187718771878187{187t188718871887189C189C189C223(2240213C212021-1621 1£2112211321112108107102106103101096093
App_C3_Station Lists.xls Page 1 of 3 10/29/2002
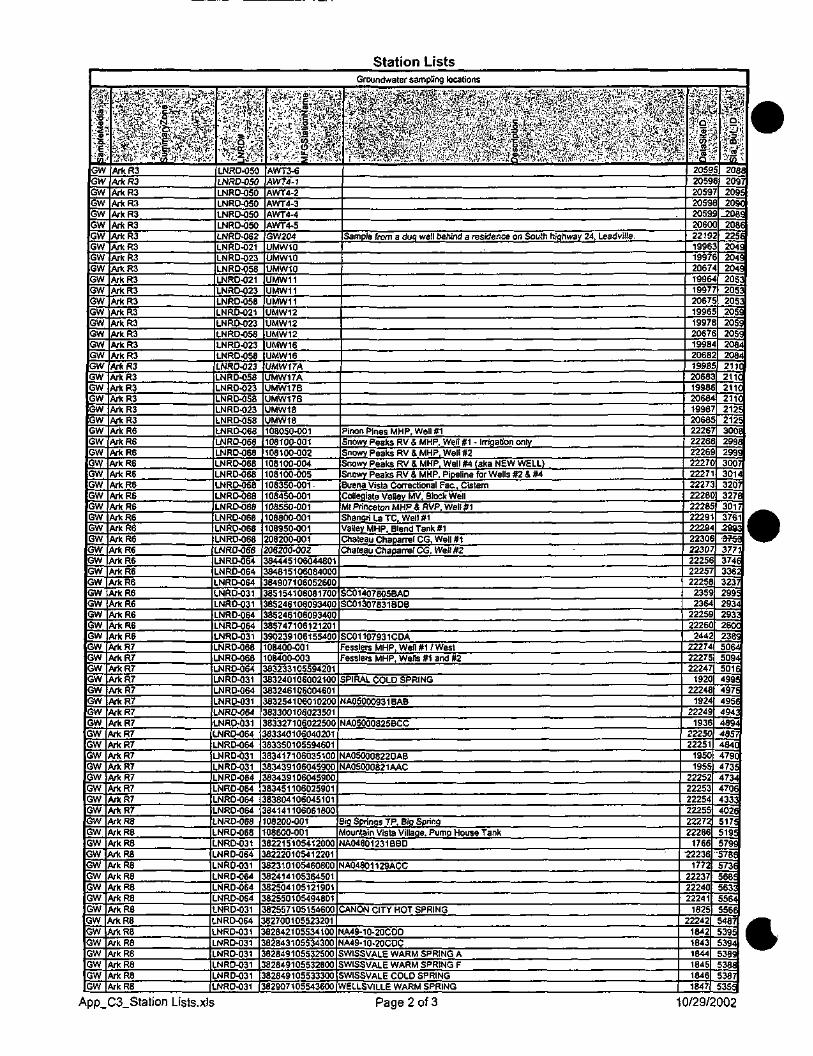
Station ListsGroundwater sampling locations
1Mffl
'•»
1;ffi
GWGWGWGWGWGWUWGWGWGWGWGWGWGWGWGWGWGWGWGWGWGWGWGWGWGWGWGWGWGWGWGWGWGWGWGWGWGWGWGWGWGWGWGWGWGWGWGWGWGWGWGWGWGWGWGWGWGWGWGWGWGWGWGWGWGWGWGWGWGWGWGWGWGWGWGW
lii iiil :
rM;feK§*-Av4%:j
m^w^^'Xti^$&¥?f &£•)$••&••&£ArkR3A/*R3ArkR3ArkRSArkR3ArkR3ArkR3ArkR3ArkR3ArkR3ArkR3ArkR3ArkR3ArkR3ArkR3ArkR3ArkR3ArkR3ArfcRSArkR3ArkR3ArkR3ArkRSArkRSArkRSArkR6ArkR6ArkRSArkR6ArkR6ArkRSArkRSArkRSArkRSArkRSArkRSArkRSArkRSArkRSArkRSArkRSArkR6ArkRSArkRSArkR7ArkR7ArkR7ArkR7ArkR7ArkR7ArkR7ArkR7ArkR7ArkR7ArkR7ArkR7ArkR7ArkR7ArkR7ArkR7ArkR8ArkRSArkRSArkR8ArkRBArkRBArkRSArkRSArkRSArkRSArkRSArkRSArkRSArkRSArkRSArkRS
^timiS« ,•* •-' '•,l<"liy
IM
•.i-i; .-••*• j- V.&:-;<"'Q ,'•"•.;?
LNRD-050LNRD-050LNRD-050LNRD-050UNRD-050LNRD-050-NRD-062LNRD-021.NRD-023-NRD-058.NRD-021.NRD-023LNRD-058.NRD-021LNRD-023.NRD-058.NRD-023.NRD-058.NRO-023.NRD-058.NRD-023
LNRD-058LNRD-023LNRD-058LNRD-068.NRD-068.NRD-068.NRD-068.NRD-068
LNRD-068.NRD-068.NRD-068
LNRD-068LNRD-068LNRD-068LNRO-068LNRD-064NRD-064NRD-064NRD-031.NRD-031.NRD-064.NRD-064.NRD-031NRD-068
LNRD-068NRD-064NRD-031NRD-064NRD-031.NRD-064.NRD-031NRD-064.NRD-064
LNRD-031NRD-031NRD-064NRD-064NRD-064NRD-064NRD-068NRD-068
.NRD-031NRD-064NRD-031
.NRD-064NRD-064NRD-064NRD-031NRD-064NRD-031MRD-031NRD-031NRD-031NRD-031
LNRD-031
t''--'-','/&;S'--.'K:{B.-.i?<:'f *."/^t^s.^-y*i' y^g^&fe
•ISlilfAWT3-6AW74-1AWT4-2AWT4-3AWT4-4AWT4-5GW204UMW10UMW10JMW10UMW11JMW11UMW11JMW12UMW12JMW12JMW16UMW16UMW17AUMW17AUMW17BUMW17BUMW18UMW18108050-00108100-00108100-00208100-00408100-00508350-001 .08450-00108550-00108800-00108950-001
208200-001208200-00238444510604480138481510608400084907106052600
385154106081700852461060934008524610609340C857471061212019023910615540008400-00108400-003832331055942018324010600210083246106004601832541060102008330010602350183327106022500
3833401060402018335010559460183417106035100
3834391060459008343910604590083451106025901838041060451018414110606180008200-00108600-001J221510541200082220105412201823101054608008241410536450182504105121901825501054948018255710515460082700105523201828421055341005284310553430082849105532500828491055328008284910553330082907105543600
Sample from a dug well behind a residence on South highway 24, Leadville.
Pinon Pines MHP, Well #1Snowy Peaks RV & MHP, Well #1 - Irrigation onlySnowy Peaks RV & MHP, Well #2Snowy Peaks RV & MHP, Well #4 (aka NEW WELL)Snowy Peaks RV & MHP, Pipeline for Wells #2 & #4Buena Vista Correctional Fac., CisternColleqiate Valley MV. Block WellMt Princeton MHP & RVP, Well #1Shangri La TC, Well #1Valley MHP. Blend Tank #1Chateau Chaparrel CG, Well #1Chateau Chaparral CG. Wall #2
C01407805BADC01307831BDB
C01107931CDAesslers MHP. Well #1 / Westesslers MHP, Wells #1 and #2
PIRAL COLD SPRING
A05000931BAB
A05000825BCC
A05000822DABA05000821AAC
ig Springs TP, Big Springountain Vista Villaqe, Pump House TankA04801231BBD
A04801129ACC
ANON CITY HOT SPRING
A49-10-20CDOA49-10-20CDCWISSVALE WARM SPRING AWISSVALE WARM SPRING FWISSVALE COLD SPRINGELLSVILLE WARM SPRING
• ;*•"•••-^v4''2*T-'.l?1 f r ' ..•v«;r;r'Ii
•$8M;%>&.'".-•s^*.«>.Si
IV. . CD:.r :Q-20592059205920592059.20602219199619972067199619972067199619972067199820681998206819982068199820682226222622262227222722272228222822291222S223062230722256222572225823592364
2225922260
2442222742227522247
192022248
192422249
19362225022251
19501955
222522225322254222552227222286
1766-22236
1772222372224022241
18252242184218431844184518461847
:ip*ftMoi1'.w1-':'55 *208!20972095209C
_208£208C225E204£204S204S205320532053205£2059205920842084]2110]21 id21 10j21 id21 2J21233008299E299E300730143207327630173761 ,2993 '^753377M3746]3362J3237299529342933260C238950645094501 f4995497!495(494:489<4357484C479C47354734470643334026517!519:579£578:573f568!56335564556£487395 |394 "38938E387355
App_C3_Station Lists.xls Page 2 of 3 10/29/2002
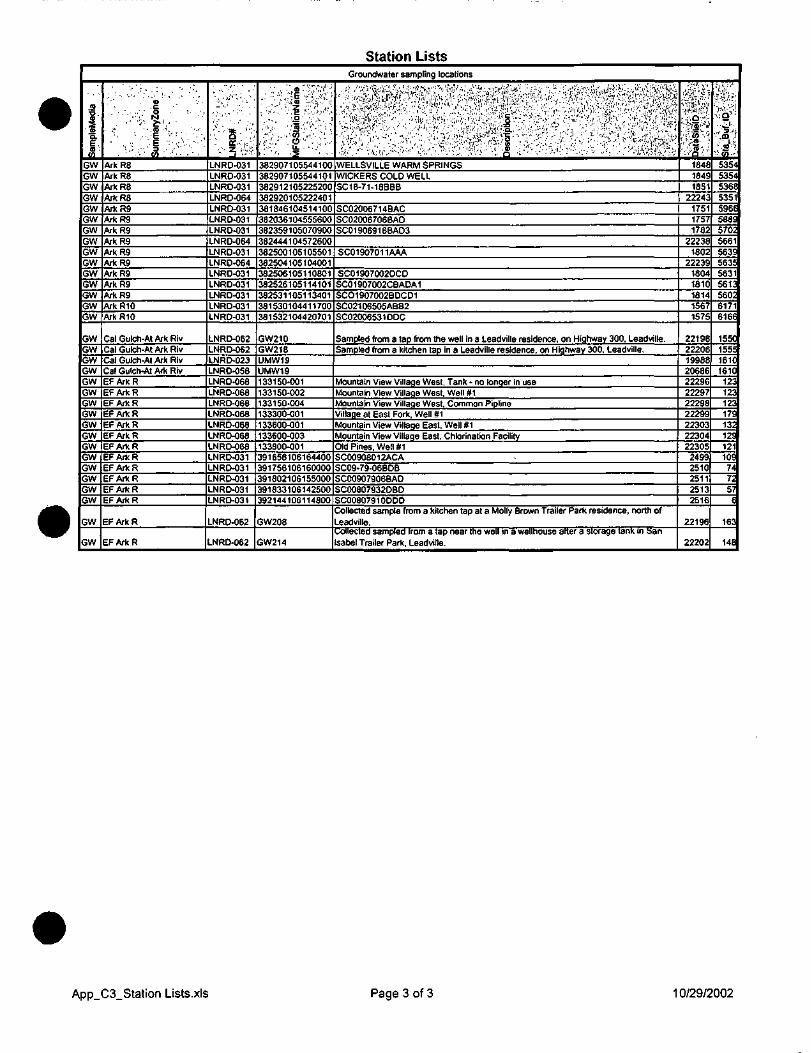
Station Lists
Sam
pleM
edia
GWGWGWGWGWGWGWGWGWGWGWGWGWGWGW
GWGWGWGWGWGWGWGWGWGWGWGWGWGWGWGW
GW
GW
o
v'-*!,:;:;."••••• ••:•'•'' ••A;:".V'
ArkRSArkRSArkR8ArkRSArkR9ArkR9ArkR9ArkR9ArkR9ArkR9ArkR9ArkR9ArkR9ArkRIOArkRIO
Cal Gulch-At Ark RivCal Gulch-At Ark RivCal Gulch-At Ark RivCal Gulch-At Ark RivEFArkREFArkREFArkREFArkREFArkREFArkREF Ark REFArkREFArkREFArkREFArkREF Ark R
EF Ark R
EFArkR
-IS,, g £S
LNRD-031LNRD-031LNRD-031LNRD-064LNRD-031LNRD-031LNRD-031LNRD-064LNRD-031LNRD-064LNRD-031LNRD-031LNRD-031LNRD-031LNRD-031
LNRD-062LNRD-062LNRD-023LNRD-058LNRD-068LNRD-068LNRD-068LNRD-068LNRD-068LNRD-068LNRD-068LNRD-031LNRD-031LNRD-031LNRD-031LNRD-031
LNRD-062
LNRD-062
vlFG
Sta
tibnN
a'm
e
: "v "i'
KM
382907105544100382907105544101382912105225200382920105222401381846104514100382036104555600382359105070900382444104572600382500105105501382504105104001382506105110801382526105114101382531105113401381530104411700381532104420701
GW210GW218UMW19UMW19133150-001133150-002133150-004133300-001133600-001133600-003133800-001391658106164400391756106160000391802106155000391833106142500392144106114800
GW208
GW214
Groundwater sampling locations
4,:itiM^S^;«^&/'w^m?W:'::: ';•'. V ft/ $&•$&«£ >m %t yt*&$££ *.;i $$;>';;;'W: •- -•'••>.,-it"\"l'; ••.;. "^rMW/S- :->:V^ -"•.",,. :, :.'• f^,^'. ^ -"'W-'. •
'•^•/Y-'*^ ,.;';iv •"-.••'!v?:!"W^1S&S- \T'^^'\+ ••.:;• ;--^: Si- !^0t&''^^;-f.:^'^'^--i-^'^^f^ ^K-'^-^-.r/o.1:.-; 'm^l^WELLSVILLE WARM SPRINGSWICKERS COLD WELLSC18-71-18BBB
SC02006714BACSC02006706BADSC01906916BAD3
SC01907011AAA
SC019070020CDSC01907002CBADA1SCO1907002BDCD1SC02106505ABB2SC02006531DDC
Sampled from a tap from the well in a Leadville residence, on Highway 300, Leadville.Sampled from a kitchen tap in a Leadville residence, on Highway 300. Leadville.
Mountain View Village West, Tank - no longer in useMountain View Village West, Well #1Mountain View Village West. Common PiplineVillage at East Fork, Well #1Mountain View Village East, Well #1Mountain View Village East, Chlorination FacilityOld Pines, Well #1SC00908012ACASC09-79-06BDBSC00907906BADSC00807932DBDSC00807910DDDCollected sample from a kitchen tap at a Molly Brown Trailer Park residence, north ofLeadville.collected sampled from a tap near the well in a wellhouse after a storage tank in Sansabel Trailer Park, Leadville.
*|-:E-%$&•rU-WV
!|P
$iv''•f&;164818491851
22243175117571782
222381802
2223918041810181415671575
2219822206199882068622296222972229822299223032230422305
24992510251125132516
22196
22202
K-
^,*;-.<s'i'•.••. m ••••5354535453685351596!588!570;5661
563£56355631
5613
56026171
616E
1550
1555
161C
161C
12312312317S132129121109747257
e
163
148
App_C3_Station Lists.xls Page 3 of 3 10/29/2002
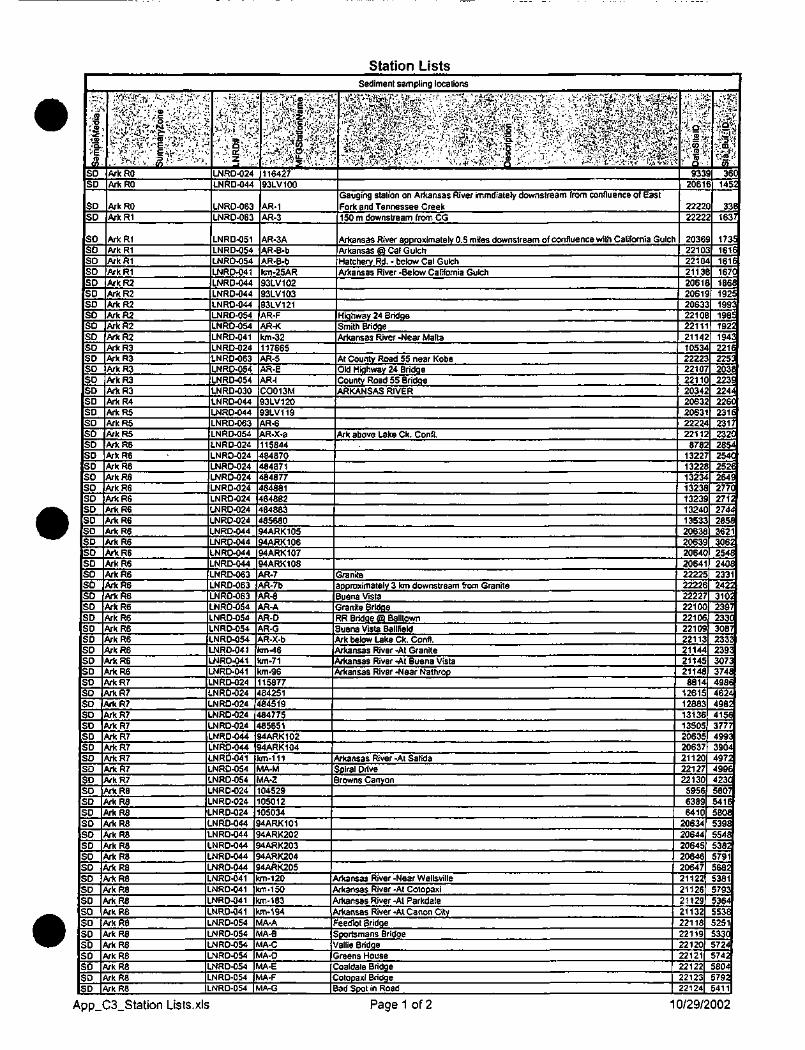
Station ListsSediment sampling locations
Sam
pieM
edia
y- ;?
:
SDSO
SDSD
SDSDSDSDSDSDSDSDSDSDSDSDSDSDSDSDSDSDSDSDSDSDSDSDSDSDSDSDSDSDSDSDSDSDSDSDSDSDSDSDSDSDSDSDSDSDSDSDSDSDSDSDSDSDSDSDSDSDSDSDSDSDSDSDSDSDSDSD
3D
. fs-;.1^-?-;'; ':'';'^£'? '•';' ••'«!'•: ;:!'.'v-~i:-
i l -V:•:&v .f*-;y£;... -•.«.-, v .«'• • ••-•ArkROArkRO
ArkROArkR1
ArkR1ArkR1ArkRIArkR1ArkR2ArkR2ArkR2ArkR2ArkR2ArkR2ArkR3ArkR3ArkR3ArkR3ArkR3ArkR4ArkRSArkRSArkRSArkR6Ark R6ArkRSArkR6ArkR6ArkRSArkRSArkRSArkRSArkRSArkRSArkRSArkRSArkRSArkRSArkRSArkRSArkRSArkRSArkRBArkRSArkRSArkR7ArkR7ArkR7ArkR7ArkR7ArkR7ArkR7ArkR7ArkR7ArkR7
rkR8ArkRSArkRSArkR8ArkRBArkR8ArkR8ArkRSArkRBArkR8ArkRSAfkR8ArkRBArkRBArkRSArkRSArkRBArkRSArkRS
":;>;|v?t«3m^.'•'.;SV.•.••. :;;K. ..
_l
LNRD-024LNRD-044
LNRD-063LNRO-063
LNRD-051LNRD-054LNRD-054LNRD-041LNRD-044LNRD-044LNRD-044LNRD-054LNRD-054LNRD-041LNRD-024LNRD-063LNRD-054LNRD-054LNRD-030LNRD-044LNRD-044LNRD-063LNRD-054LNRD-024LNRD-024LNRD-024LNRD-024LNRD-024NRD-024NRD-024NRD-024NRD-044NRD-044NRD-044NRD-044NRD-063NRD-063NRD-063NRD-054NRD-054NRD-054NRD-054NRD-041
LNRD-041NRD-041NRD-024NRD-024NRD-024NRD-024NRD-024NRD-044NRD-044NRD-041NRD-054NRD-054NRD-024NRD-024NRD-024NRD-044NRD-044NRD-044NRD-044NRD-044NRD-041NRD-041NRD-041NRD-041NRD-054NRD-054NRO-054NRD-054NRD-054NRD-054NRD-054
§!i!IK• *'.'J~:'.z;X:Vi
J$$!*i&jj••''•^V-:&B-fter!'<';
|8-<^;.;>=: s' .i":.:11642793LV100
AR-1AR-3
AR-3AAR-B-bAR-B-bkm-25AR93LV10293LV10393LV121AR-FAR-Kkm-32117665AR-5AR-EAR-IC0013M93LV12093LV119AR-6AR-X-a
15844484870484871484877484881484S8284883856804ARK1054ARK1064ARK107
94ARK108AR-7AR-7bAR-8AR-AAR-D
R-GR-X-b
km-46km-71m-9615877
484251484519484775
356514ARK1024ARK104
km-111vlA-M
A-Z045290501205034
MARK1014ARK202
J4ARK2034ARK2044ARK205(m-120cm-150tm-183un-194
A-AHA-BA-CA-D
dA-EA-F
ulA-G
•>VJ>^WSvfr. ••-:?•-.• ••- V-.Y'ii~-.-t:>':. :'o > • . • • - • . > • ' •-"' )*:V'V;.«W$ "ftivfe-
Gauging station on Arkansas River immdiately downstream from confluence of EastFork and Tennessee Creek150 m downstream from CG
Arkansas River approximately 0.5 miles downstream of confluence with California GulcArkansas @Cal GulchHatchery Rd. - below Cal GulchArkansas River -Below California Gulch
Highway 24 BridgeSmith BridgeArkansas River -Near Malta
At County Road 55 near KobeOld Highway 24 BridgeCounty Road 55 BridgeARKANSAS RIVER
Ark above Lake Ck. Conn.
Granitepproximately 3 km downstream from Graniteuena Vista
Granite BridgeRR Bridge ffl BalltownJuena Vista Ballfield
Ark below Lake Ck. Confl.Arkansas River -At GraniteArkansas River -At Buena VistaArkansas River -Near Nathrop
Arkansas River -At Salidapiral Driverowns Canyon
Vrkansas River -Near WellsvilleVrkansas River -At CotopaxiArkansas River -At ParkdaleKansas River -At Canon Cityeedlot Bridgeportsmans Bridgeallie Bridgereens Houseoaldale Bridgeotopaxi Bridgead Spot in Road
:•.(•'• -\•'i.o'-:,.'•, £ r'.•'>,m .";.-s:rg..
9332061
22222222
2036221022102113206120612063221022112114105322222210221120342063206322222211878
13221322132313231132313241353206320639206420642222222262222722100221062210922113211442114521148
8814126151288313136135052063520637211202212722130
5956638!641C
20634206442064520646206472112221126211292113222118221192212022121221222212322124
#M"M•'f'Cll'*•1::'i3:;1
sw.w2 -.'-
OJ
36C1452
3381637
173S
1616
1616
167C
186E
1925
1993
1985
1922
1943
2216
2253203£223!
2244226C2316
2317
232C2854254C252C264!
277C2712
27442S5E3621
3062254(
240(
2331
242;
310;2397233C308723332393307;374f498E4624498:415(3777499:3904497;4996423C5807541 f580f53985548538257915682538157935364553652515330572457425804
792411
App_C3_Station Lists.xls Page 1 of 2 10/29/2002
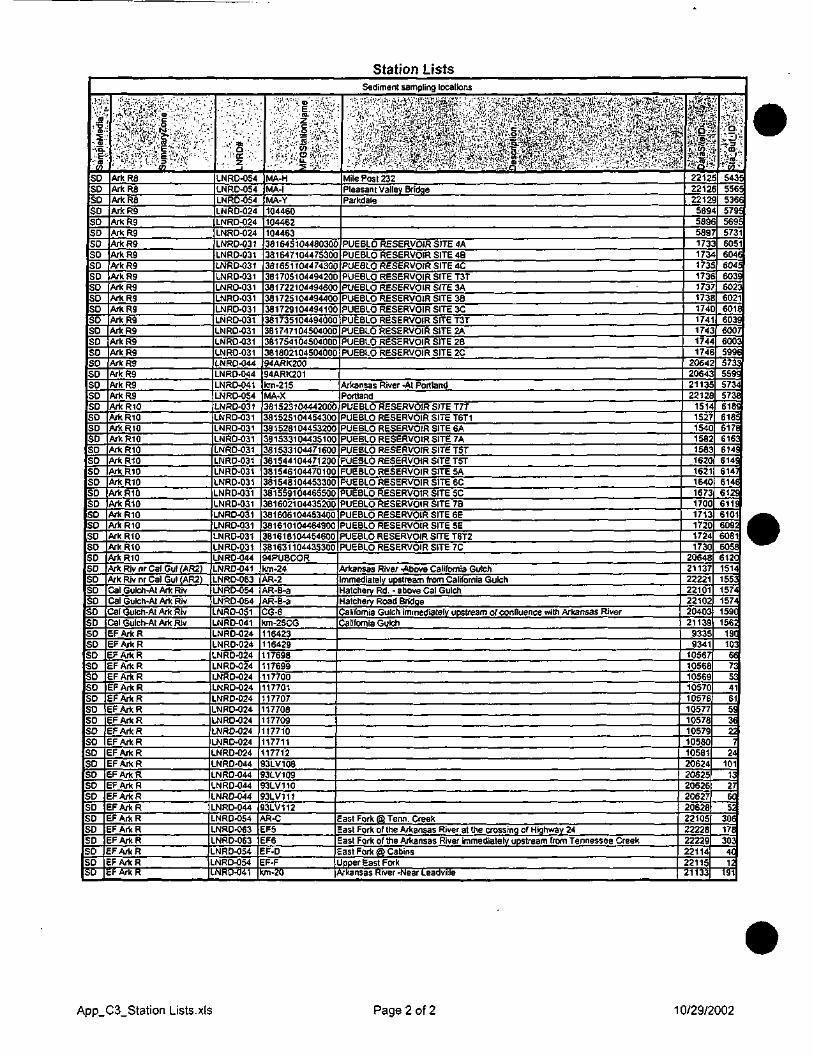
Station ListsSediment sampling locations
.:;J
•'"£:"§,1'|D
V: OJ'<^
SDSDSDSDSDSDSOSDSOSDSDSDSDSDSDSDSDSDSDSDSOSOSDSDSDSDSDSDSDSDSDSDSDSDSDSDSDSDSDSDSOSDSDSDSOSOSDSOSDSOSOSDSDSDSOSD
DSDSOSOSDSDSOSOSD
•••:£-:W&,%V:-!:fC-.','::$*:$&&;,*"•>&;•"••'.'.:.-v\i;iJ!-y:§ •:;."•• . V. •fVrt-1.-' N'.'-:,./:. . .•'..'••^tit&#r$&:iv.V-^M^EV'fe. •'•:•;.^V/^VKEY-V;..:'''- :.-; '•;•„.!• i •!..!. ••= :"!»;• .' • -••:'. > ' CO ••.•-.-• .
ArkRSArkRSArkRSArkR9ArkR9ArkR9ArkRSArkR9ArkR9ArkR9ArkR9ArkR9ArkR9ArkR9ArkR9ArkR9ArkR9ArkR9ArkR9ArkR9ArkR9ArkRIOArkRIOArkRIOArkRIOArkRIOArkRIOArkRIOArkRIOArkRIOArkRIOArkRIOArkRIOArkRIOArkRIOArkRIOArk Riv nr Cal Cut (AR2)Ark Riv nr Cal Gul (AR2)Cal Gulch-At Ark RivCal Gulch-At Ark RivCal Gulch-At Ark RivCal Gulch-At Ark Riv
FArkREFArkRFArkRFArkRFArkRFArkRFArkRFArkRFArkRFArkRFArkRFArkRFArkRFArkRFArkRFArkRFArkRFArkRFArkRFArkRFArkRFArkRFArkR
• .' •*- . 1". ".£..,•!
" -^S'v•.I'.ir1.."-.... 2. • •• '_!
LNRD-054LNRD-054LNRD-054LNRD-024LNRD-024LNRD-024LNRD-031LNRD-031LNRD-031LNRD-031LNRD-031LNRD-031LNRD-031LNRD-031LNRO-031LNRO-031LNRD-031LNRD-044LNRD-044LNRD-041LNRO-054LNRD-031LNRD-031LNRD-031LNRD-031LNRO-031LNRD-031LNRD-031LNRD-031LNRD-031LNRD-031LNRD-031LNRD-031NRD-031NRD-031NRD-044NRD-041NRD-063.NRD-054NRD-054NRD-051.NRD-041NRD-024NRO-024NRD-024NRD-024
LNRD-024NRD-024NRD-024NRD-024NRD-024NRD-024NRD-024NRD-024NRD-044NRO-044NRD-044NRD-044NRD-044NRD-054NRD-063NRO-063NRD-054NRD-054NRD-041
./WvVffl1'-^'.-• •••*?..••:• :;;E.\W.<
'§afi?•'*;:V;tl:
•'.••:•;:•':;••' 35- •.',&.<'-..; iifMA-HMA-IMA-Y10446010446210446338164510448030038164710447530038165110447430138170510449420033172210449460038172510449440138 17291 04494 10(38173510449400(38174710450400038175410450400(38180210450400094ARK20094ARK201km-215MA-X38152310444200038152510445430038152810445320038153310443510038153310447160038154410447120081546104470100
38154810445330C38155910446550C38160210443520C8160610445340C8161010446490081618104454600
38163110443530094PUBCORkm-24AR-2AR-B-a
R-B-a6-6
km-25CG1642316429176981769917700177011770717708177091771017711177123LV1083LV1093LV1103LV1113LV112R-CF5F6F-DF-F
un-20
••; am ::K<^
Mile Post 232Pleasant Valley BridgeParkdale
PUEBLO RESERVOIR SITE 4APUEBLO RESERVOIR SITE 48PUEBLO RESERVOIR SITE 4CPUEBLO RESERVOIR SITE T3TPUEBLO RESERVOIR SITE 3APUEBLO RESERVOIR SITE 38'UEBLO RESERVOIR SITE 3C'UEBLO RESERVOIR SITE T3T
PUEBLO RESERVOIR SITE 2A'UEBLO RESERVOIR SITE 2B
PUEBLO RESERVOIR SITE 2C
Arkansas River -At PortlandPortlandPUEBLO RESERVOIR SITE T7TPUEBLO RESERVOIR SITE T6T1PUEBLO RESERVOIR SITE 6APUEBLO RESERVOIR SITE 7APUEBLO RESERVOIR SITE T5TPUEBLO RESERVOIR SITE T5TPUEBLO RESERVOIR SITE 5APUEBLO RESERVOIR SITE 6CPUEBLO RESERVOIR SITE 5C'UEBLO RESERVOIR SITE 7B'UEBLO RESERVOIR SITE 6E
PUEBLO RESERVOIR SITE 5EPUEBLO RESERVOIR SITE T6T2
UEBLO RESERVOIR SITE 7C
rkansas River -Above California Gulchmmediately upstream from California Gulchatcherv Rd. - above Cal Gulchatchery Road Bridgealifomia Gulch immediately upstream of confluence with Arkansas Riveralifomia Gulch
ast Fork @ Tenn. Creekast Fork of the Arkansas River at the crossing of Highway 24ast Fork of the Arkansas River immediately upstream from Tennessee Creekast Fork @ Cabinspper East Fork
Vkansas River -Near Leadville
mw-•;i&:&?Sii-f en'-Ws;s*e5>2212221222125895895891731734173173173173174174174174174
2064206432113522128
15141527154015821583162016211640167317001713172017241730
2064821137222212210122102204032113!
93359341
1056710568105691057010576105771057J1057910580105812062420625206262062720628221052222822229221142211521133
m
^54355565536S579556955731605160466045603S6023602160K603E60076003599C5733559!57345738618!618!61 7(616:614!614!6147614661 2J611!6101609:6081605f612C1514155315741574159(156:
19C10:6f7;5341615!3(Z7
241011:276C52
30E17E303
4C12
191
App_C3_Station Lists.xls Page 2 of 2 10/29/2002
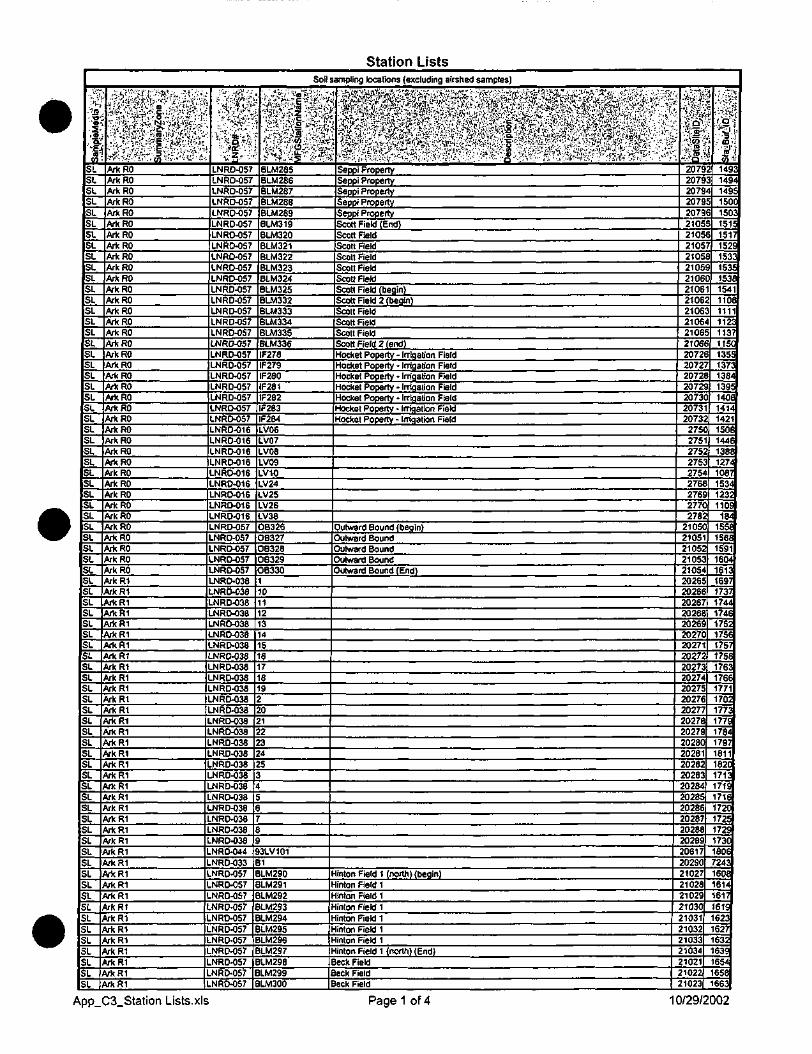
Station ListsSoil sampling locations (excluding airshed samples)
Sarn
ple
MedIa
fS
ji
SLSLSLSLSLSLSLSLSLSLSLSLSLSLSLSLSLSLSLSLSLSLSLSLSLSLSLSLSLSLSLSLSLSLSLSLSLSLSLSLSLSLSLSLSLSLSLSLSLSLSLSLSLSLSLSLSLSLSLSLSLSLSLSLSLSLSLSLSLSLSLSLSL
LLL
'.££& y^f^v^-V;5'<^fo--:^p,:,' iS*;-:-g-'A^V^
;V':t £ £^ ' I5f " VV»J ;-. •
&>$&!3£*$&&>.wMfe^f-^1;^,:£?"&£Z:i\fc}?:$'':•.*>••:>,.,:.!.,.., CO •-•'••• •'•*-• I-''-
ArkROArkROArkROArkROArkROArkROArkROArkROArkROArkROArkROArkROArkROArkROArkROArkROArkROArkROArkROArkROArkROArkROArkROArkROArkROArkROArkROArkROArkROArkROArkROArkROArkROArkROArkROArkROArkROArkROArkRtArkR1ArkR1ArkR1ArkR1ArkR1ArkR1ArkR1ArkR1ArkR1ArkR1ArkR1ArkR1ArkR1ArkR1ArkR1ArkR1ArkR1ArkR1ArkR1ArkR1ArkR1ArkR1ArkR1ArkR1ArkR1ftrkRIftrkRIftrkRIftrkRIftrkRIftrkRIftrkRIftrkRIftrkRIftrkRIftrkRIftrkRI
m&f$$>v'?$&!
'&&&•;-^r-'K §- V
LNRD-057LNRD-057LNRD-057LNRD-057LNRD-057LNRD-057LNRD-057LNRD-057LNRD-057LNRD-057LNRD-057LNRD-057LNRD-057LNRD-057LNRD-057LNRD-057LNRD-057LNRD-057LNRD-057LNRD-057LNRD-057LNRD-057LNRD-057LNRO-057LNRD-016LNRD-016LNRD-016LNRD-016LNRD-016LNRD-016LNRD-016LNRD-016LNRD-016LNRD-057LNRD-057LNRD-057LNRD-057LNRD-057LNRD-038LNRD-038LNRD-03BLNRD-038LNRD-038LNRD-038LNRD-038LNRD-038LNRD-038LNRD-038LNRD-038LNRD-038LNRD-038LNRD-038LNRD-038LNRD-038LNRD-038LNRD-038LNRD-038LNRD-038LNRD-038LNRD-038LNRD-038LNRD-038LNRD-038LNRD-044LNRD-033LNRD-057LNRD-057LNRO-057LNRD-057LNRD-057LNRD-057LNRD-057LNRD-057LNRD-057LNRD-057LNRD-057
;p|pfi>
•SillStf>&?j#<%&•£^v.:.*:s*'? .'>?., ':.1.5 ' -C' •'•>>
BLM285BLM286BLM287BLM288BLM289BLM319BLM320BLM3213LM3228LM323BLM324BLM325BLM332BLM3333LM334BLM3353LM336IF278IF279IF280IF281IF282IF283IF284LV06LV07LV08.V09
LV10
LV24LV25LV26LV38OB326OB327OB328OB329OB330
01234
56789
012345
3LV1011LM290LM291LM292LM293LM294LM295LM296LM297LM298LM299LM300
Seppi PropertySeppi PropertySeppi PropertySeppi PropertySeppi PropertyScott Field (End)Scott ReidScott FieldScott FieldScott FieldScott FieldScott Field (begin)Scott Field 2 (begin)Scott FieldScott FieldScott FieldScott Field 2 (end)Hocket Poperty - Irrigation FieldHocket Poperty - Irrigation FieldHocket Poperty - Irrigation FieldHocket Poperty - Irrigation FieldHocket Poperty - Irrigation FieldHocket Poperty - Irrigation FieldHocket Poperty - Irrigation Field
Outward Bound (begin)Outward BoundOutward BoundOutward BoundOutward Bound (End)
inton Field 1 (north) (begin)'nton Field 1inton Field 1nton Field 1nton Reid 1nton Field 1nton Field 1nton Field 1 (north) (End)eck Fieldeck Fieldeck Field
•$$
1•'^<a'
207920792079207920792105
2105
2105
2105
2105
2106
2106
2106
2106
2106
2106
2106
2072207220722072207320732073275275275275327542768276927702782
210502105121052210532105420265202662026720268202692027020271202722027320274202752027620277202782027!2028020281202822028320284202852028620287202882028920617202902102721028210292103021031210322103321034210212102221023
, ; /;pv
1• CO •:••'i^i
55*1493
1494
1495
1500
1503
1515
1517
1529
1533
1535
153f
1541
1108
1111
1123
1137
115C
1355
1373
1384
1395
140£
1414
1421
1508
1446
1388
1274
1087
1534
1232
110S
184155«
156f
1591
1604
161!
1697
1737
1744
174C
175:175<
1757
175f
1763
1766
1771
1702
177;177S
1784
1797
1811
182C
1713
1719
1716
1720
1725
172917301
BOH724360861461761 =623627632639654658663
App_C3_Station Lists.xls Page 1 of 4 10/29/2002
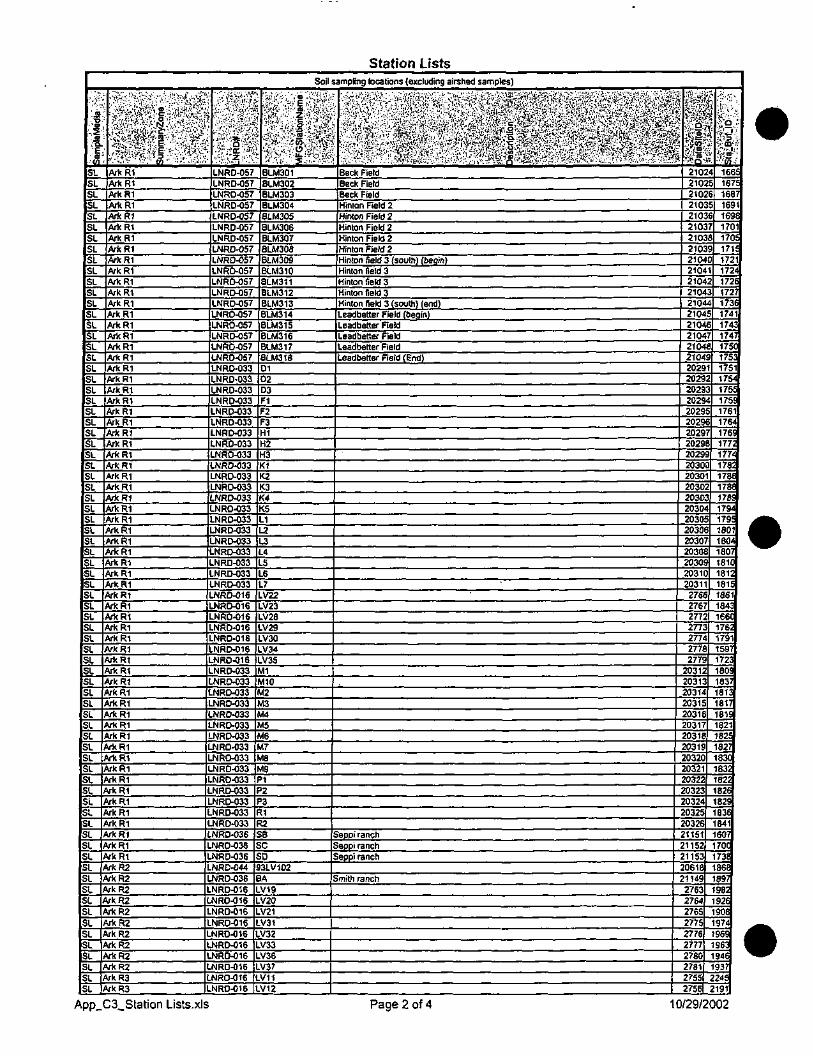
Station ListsSoil sampling locations (excluding airshed samples)
Sar
ri'pl
eMed
ia
.ffe
SLSLSLSLSLSLSLSLSLSLSLSLSLSLSLSLSLSLSLSLSLSLSLSLSLSLSLSLSLSLSLSLSLSLSLSLSLSLSLSLSLSLSLSLSLSLSLSLSLSLSLSLSLSLSLSLSLSLSLSLSLSLSLSLSLSL
^_
SLSLSLSLSLSL
LSL
• • | £l; £t:
ArkR1ArkRlArkR1ArkR1ArkRlArkR1ArkRlAfkR1ArkR1ArkR1ArkR1ArkR1ArkR1ArkR1ArkR1ArkR1ArkR1ArkR1ArkR1ArkRlArkR1ArkRlArkR1ArkRlArkRlArkRlArkRlArkRlArkRlArkRlArkRlArkRlArkRlArkRlArkRlArkRlArkRlArkRlArkRlArkRlArkRlArkRlArkRlArkRlArkRlArkRlArkRlArkRlArkRlArkRlArkRlArkRlArkRlArkRlArkR1ArkRl<krkR1HrkR1*rkRl*rkR1(VkRli\rkR1ikrkRIHrkRlHrkR2HrkR2\rkR2ij-kR2\rkR2\rkR2\rkR2\rkR2\rkR2\rkR2VkR3\rkR3
iiPiil$&$
•I£MLNRD-OS7LNRD-057LNRD-057LNRO-057LNRD-057LNRD-057LNRD-057LNRD-057LNRD-057LNRD-057LNRD-057LNRD-057LNRD-057LNRD-057LNRD-057LNRD-057LNRD-057LNRD-057LNRD-033.NRD-033
LNRD-033.NRD-033
LNRD-033LNRD-033LNRD-033LNRD-033LNRO-033LNRD-033LNRD-033LNRD-033LNRD-033LNRD-033LNRD-033LNRD-033NRD-033NRD-033NRD-033NRD-033
LNRD-033NRD-016NRD-016NRD-016NRD-016NRD-016NRD-016NRD-016NRD-033NRD-033NRD-033NRD-033NRD-033NRD-033NRD-033NRO-033NRO-033
LNRD-033NRD-033NRD-033NRD-033NRD-033
LNRD-033NRD-036NRD-036NRD-036NRD-044
JMRO-036NRD-016NRO-016NRD-016NRD-016NRD-016
.NRD-016NRD-016NRD-016
-NRD-016NRD-016
JtfWeSSr''m-•;.*••.'. rfSM-w
BLM301BLM302BLM303BLM304BLM305SLM306BLM3076LM30SBLM309BLM310BLM311BLM312BLM313BLM314BLM315BLM316BLM317BLM31B0132D3:1
F2F3H1H2H3K1K2K3K4K5
1L234.56.7V22V23V28V29V30V34V35
M1M10
2M3M4
567891231
R2B
D3LV102AV19V20V21V31V32V33V36V37V11V12
Beck FieldBeck FieldBeck FieldHinton Field 2Hinton Field 2Hinton Field 2Hinton Field 2Hinton Field 2Hinton field 3 (south) (beqin)Hinton field 3•linton field 3Hinton Held 3Hinton field 3 (south) (end!Leadbetter Field (begin)Leadbetter Field.eadbetter FieldLeadbetter FieldLeadbetter Reid (End)
eppi rancheppi rancheppi ranch
milh ranch
HIiirf111illi-sfB'-i.•"'tfQ"."
2102210221022103210321032103121032104C2104210422104C210442104£2104€2104721046210492029120292202932029420295202962029720298202992030020301203022030320304203052030620307203082030920310203112766276727722773277427782779
2031220313203142031520316203172031820319203202032120322
I $Km• 3^''f^;• Jfitf''
•••in-:t 16655 1675
16871691169(17011705171!17211724172617271736174117431747175(1753175117541755175!17611764176!177217741782178f178<178S1794179!180118041807181C1812181518611843166C17621791159717231809183718131817181E182118251827183<18321822
20323 182620324 18290325 18360326115111521153061811492763276427652775277627772780278127552756
18411607170C173J186E189719B21926190£1974196E19631946193722452191
App_C3_Station Lists.xls Page 2 of 4 10/29/2002
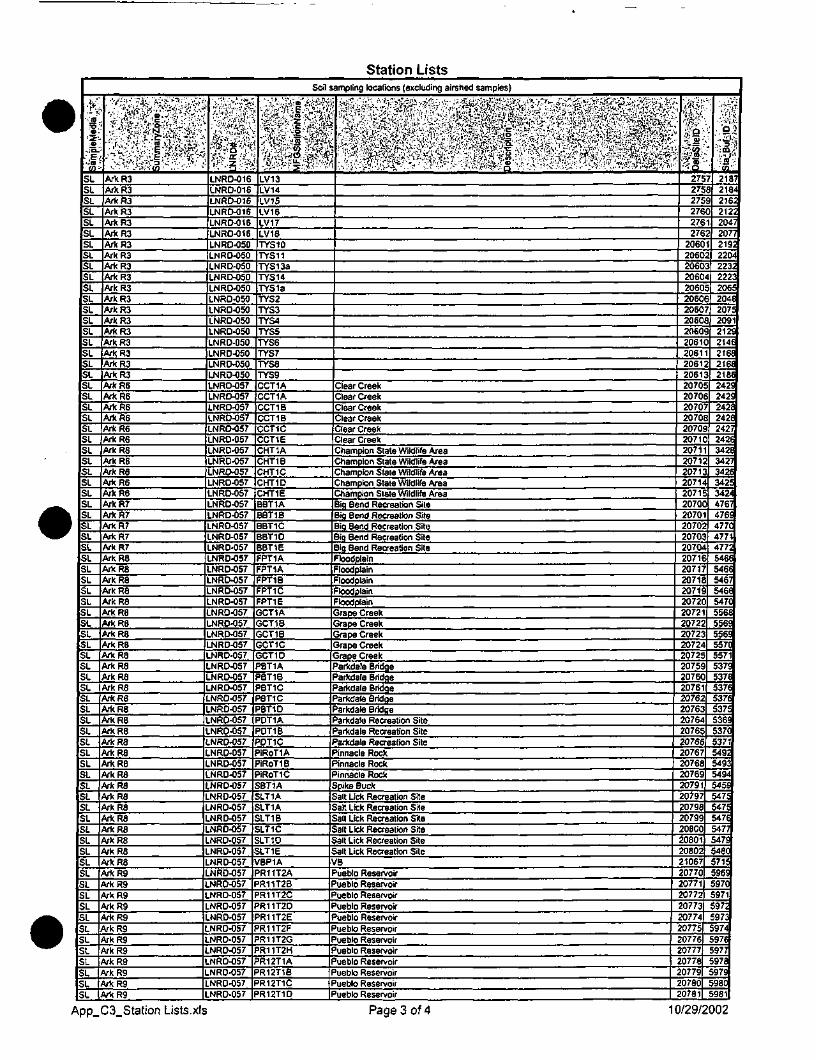
Station ListsSoil sampling locations (excluding airshed samples)
•KIJ3. j«-%
'.'«wSLSLSLSLSLSLSLSLSLSLSLSLSLSLSLSLSLSLSL_j
SLSLSLSLSLSLSLSLSLSLSLSLSLSLSLSLSLSLSLSLSLSLSLSLSLSLSLSLSLSLSLSLSLSLSLSLSLSLSLSLSLSLSLSLSLSLSLSLSLSLSLSLSLSLSLSLSL
.•VyV^c-^'^wv='-^;$:iW&£^K'A^&^'K"•.A'i--'-.'-"'-^----"^"^-"-'••^K^^fs-^.-:
•:.;r f: |. J»»-••^fe-^.l-i wS&J:
" V'H'f f'-i-i'-.-a-'',:; -•!.'• '. •?.<••••.-..'•'.- ..•'-.7i.:'-; en ' ' , . . ' . • • '
ArkR3ArkR3ArkR3ArkR3ArkR3ArkR3ArkR3ArkR3ArkR3ArkR3ArkR3ArkR3ArkR3ArkRSArkR3ArkR3ArkR3ArkR3ArkR3ArkR6ArkR6ArkR6ArkR6ArkR6ArkR6ArkR6ArkRBArkR6ArkRBArkR6ArkRTArkR7ArkR7ArkR7ArkR7ArkRSArkRSArkRSArkRSArkRSArkRSArkRSArkRSArkRSArkRSArkRSArkRSArkRSArkRSArkRSA/kRSArkRBArkRSArkRSArkRBArkRSArkRBArkRSArkRSArkRSArkRBArkRSArkRSArkRBArkR9ArkR9ArkR9ArkR9ArkR9ArkR9ArkR9ArkR9ArkR9ArkR9*rkR9ftrkR9
:3$$?$.mimm'&:&••{..>';••', .z ::?.:
LNRD-016LNRD-016LNRD-016LNRD-016LNRD-016LNRD-016LNRD-050LNRD-050LNRD-050LNRD-050LNRD-050LNRD-050.NRD-050LNRD-050LNRD-050LNRD-050LNRD-050LNRD-050LNRD-050LNRD-057LNRD-057LNRD-057LNRD-057.NRD-057
LNRD-057LNRD-057LNRD-057LNRD-057LNRD-057.NRD-057.NRD-057.NRD-057LNRD-057LNRD-057.NRD-057
LNRD-057LNRD-057LNRD-057.NRD-057.NRD-057.NRD-057
LNRD-057LNRD-057NRD-057NRD-057.NRD-057NRD-057NRD-057NRD-057NRD-057NRD-057NRD-057NRD-057NRD-057NRD-057.NRD-057.NRD-057.NRD-057.NRO-057NRD-057NRD-057NRD-057NRD-057NRD-057NRD-057NRD-057NRD-057NRD-057NRD-057NRD-057NRD-057NRD-057NRD-057NRO-057.NRO-057.NRD-057
->^g'
^P 'ff> ;v!"$&s..•-.. ijiv-.-w >iv$iw&&$$'.•"i"''^" •'.'•^••T'-'" ' '•
LV13
LV14
LV15
LV16
LV17
LV18
TYS10TYS11TYS133TYS14TYS1aTYS2TYS3TYS4nrssFYS6
TYS7TYS8TYS9CCT1ACCT1ACCT1BCCT1BCCT1CCCT1ECHT1ACHT1BCHT1CCHT1DCHT1E3BT1A)BT1B
BBT1CBBT1D1BT1E
FPT1AFPT1AFPT1BFPT1C
PT1E
GCT1AGCT1BGCT1BGCT1CGCT1D'BT1ABT1B
BT1C
BT1C
BT1D
DT1A
DT1B
DT1C
iRoTIAiRoTIBIROT1CBT1A
LT1A
LT1A
LT1B
LT1C
LT1D
LT1E
BP1A
'R11T2AR11T2BR11T2CR11T2DR11T2ER11T2FR11T2GR11T2HR12T1AR12T1BR12T1CR12T1D
•'':;«>:*Sc'4*te:^
Clear CreekClear CreekClear CreekClear CreekClear CreekClear CreekChampion State Wildlife AreaChampion State Wildlife AreaChampion State Wildlife AreaChampion State Wildlife AreaChampion State Wildlife Arealiq Bend Recreation Siteiig Bend Recreation Sits
Biq Bend Recreation SiteBiq Bend Recreation SiteBiq Bend Recreation Siteloodplainloodplainloodplainloodplainloodplain
Grape CreekGrape CreekGrape CreekGrape CreekGrape Creek
arkdale Bridgearkdale Bridgearkdale Bridgearkdale Bridaearkdale Bridaearkdale Recreation Sitearkdale Recreation Sitearkdale Recreation Siteinnacle Rockinnacla Rockinnacle Rockpike Buckalt Lick Recreation Sitealt Lick Recreation Siteall Lick Recreation Sitealt Lick Recreation Sitealt Lick Recreation Sitealt Lick Recreation SiteBueblo Reservoirueblo Reservoirueblo Reservoirueblo Reservoirueblo Reservoirueblo Reservoirueblo Reservoirueblo Reservoirueblo Reservoirueblo Reservoirueblo Reservoirueblo Reservoir
V.-'&i:1
"$£.fev•£«!••
$8>..%$'•
275275275276(
276276;
20602060:2060C2060120605206062060720606206092061020611206122061320705207062070720708207092071020711207122071320714207152070020701207022070320704207162071720718207 1S2072020721207222072320724207252075920760207612076220763207642076520766207672076820769207912079720798207992080020801208022106707700771
0772077307740775077607770778077907800781
•/-S:• •••1'i'-lA,r->
• . 'o:J
m-W7 2187
3 2184
3 2162
) 2122
2047> 2077
219;
2204223222232065204C20752091
212!
214f
216f
216(
21 8f242!
242!
242E242f2427242£342E34273426342534244767476S477C4771
477:
546(
546!
5467546(
547(
556<556!
556!
557(
5571
537!
537f537f537f5375536S537C5371
549254935494545S54755475547E5477547£548C5715
596S59705971
59735973159741597659775976597E598C5981
App_C3_Station Lists.xls Page 3 of 4 10/29/2002
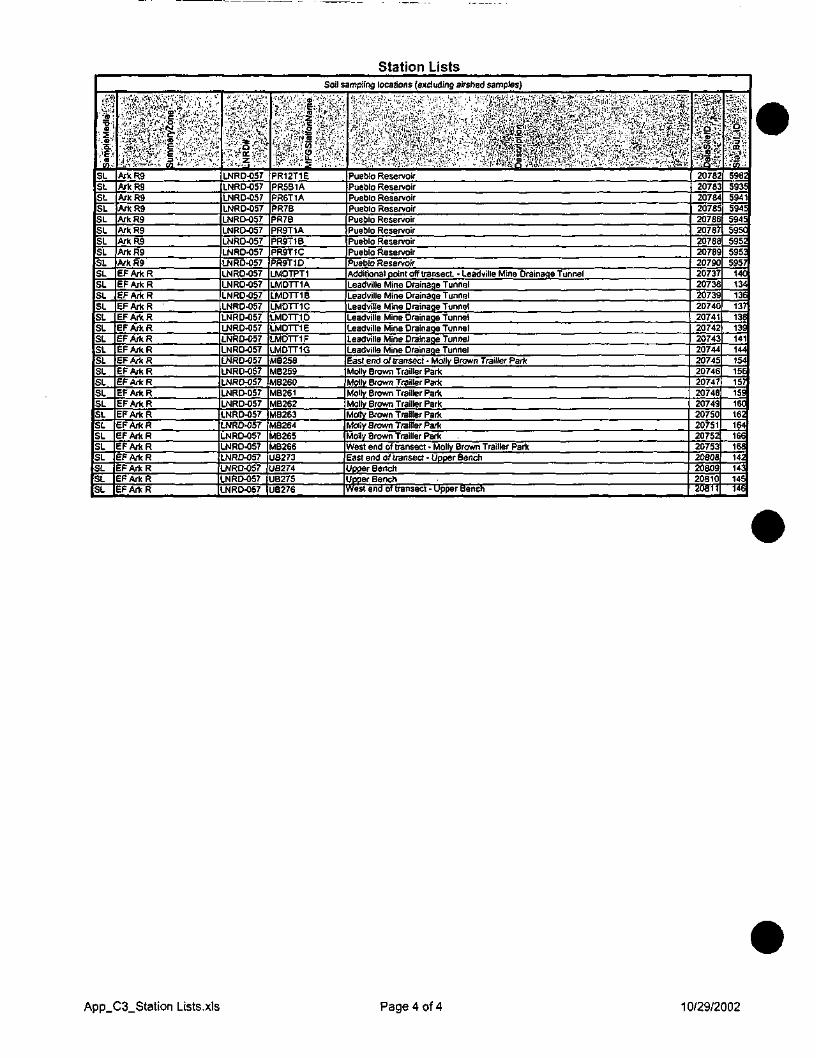
ArkRg LNRD-057 PR5B1A Pueblo Reservoir 20783 5935ArkR9 LNRD-057 PR6T1A Pueblo Reservoir 20784 594ArkR9 LNRD-057 PR7B Pueblo Reservoir 20785 5945ArkR9 LNRD-057 PR7B Pueblo Reservoir 20786 5945ArkR9 LNRD-057 PR9T1A Pueblo Reservoir 20787 5950ArkR9 LNRD-057 PR9T1B 'ueblo Reservoir 20788 5952ArkR9 LNRD-057 'R9T1C =ueblo Reservoir 20789 5953ArkR9 LNRD-057 PR9T1D 3ueblo Reservoir 20790 595;EFArkR LNRD-057 LMDTPT1 Additional point off transect. - Leadville Mine Drainage Tunnel 20737 140EFArkR LNRD-057 LMDTT1A Leadville Mine Drainage Tunnel 20738 134
1361313113914"
J4f154156157159
J60
Ji164166168142143145146
EFArkR LNRD-057 LMDTT1B .eadville Mine Drainage Tunnel 20739EFArkR LNRD-057 LMDTT1C .eadville Mine Drainage Tunnel 20740EF Ark R LNRD-057 LMDTT1D .eadville Mine Drainage Tunnel 20741EFArkR LNRD-057 LMDTT1E .eadville Mine Drainage Tunnel 2074;EFArkR LNRD-057 LMDTT1F .eadville Mine Drainage Tunnel 20743EFArkR LNRD-057 LMDTT1G .eadville Mine Drainage Tunnel 20744EFArkR LNRD-057 MB258 :asl end of transect • Molly Brown Trailler Park 20745EFArkR LNRD-057 MB259 Molly Brown Trailler Park 20746EFArkR LNRD-057 MB260 dolly Bfown Trailler Park 20747EFArkR LNRD-057 MB261 /lolly Brown Trailler Park 20748EFArkR LNRD-OS7 MB262 /lolly Brown Trailler Park 20749EFArkR LNRD-057 MB263 dolly Brown Trailler Park 20750EFArkR LNRD-057 MB264 >tolly Brown Traillar Park 20751EFArkR LNRD-057 MB265 .Holly Brown Trailler Park 20752EFArkR LNRD-057 MB266 West end of transect • Molly Brown Trailler Park 20753EFArkR LNRD-057 UB273 iasl end of transect - Upper Bench 20808EFArkR LNRD-057 UB274 Upper Bench 20809EFArkR LNRD-057 UB275 Upper Bench 20810EFArkR LNRD-057 UB276 /est end of transect - Upper Bench 20811
App_C3_Station Lists.xls Page 4 of 4 10/29/2002
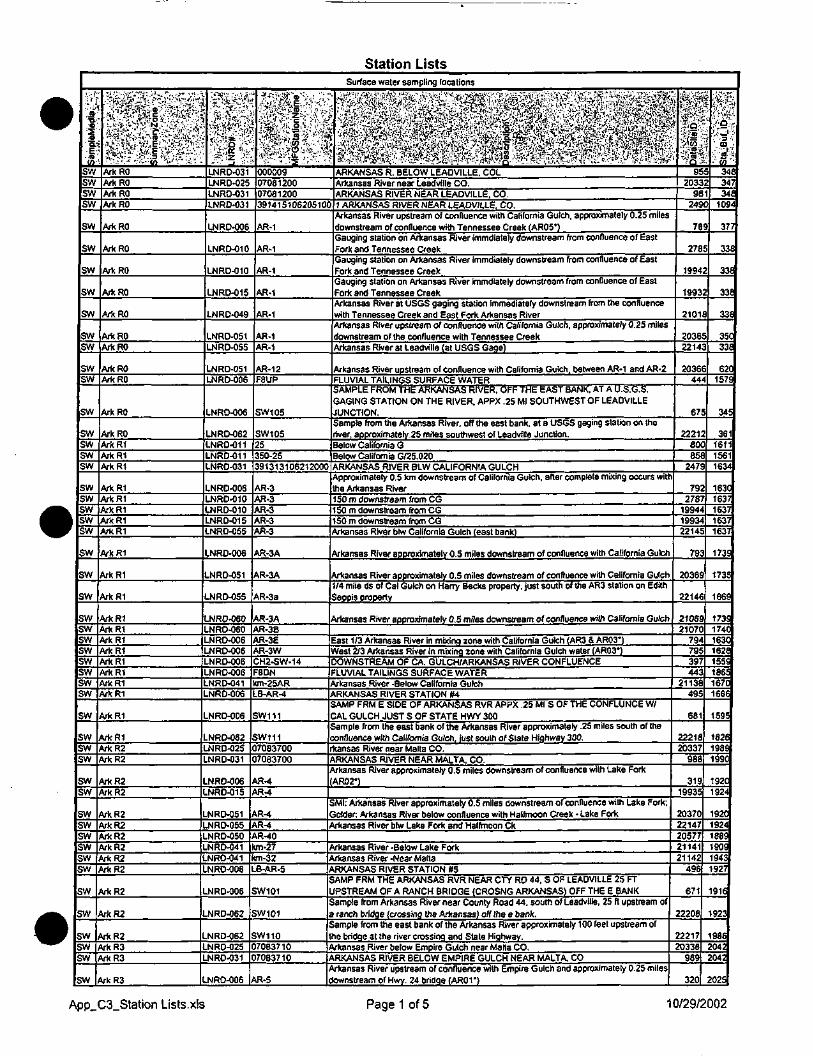
Station ListsSurface water sampling locations
:T~"?B|peN
e|diJiiBS
SWSWSWSW
SW
SW
SW
SW
SW
SWSW
SWSW
SW
SWSWSWSW
SWSWSWSWSW
SW
SW
SW
SWSWSWSWSWSWSWSW
SW
SWSWSW
SWSW
SWSWSWSWSWSW
SW
SW
SWSWSW
SW
ArkROArkROArkROArkRO
ArkRO
ArkRO
ArkRO
ArkRO
ArkRO
ArkROArkRO
ArkROArkRO
ArkRO
ArkROArkR1ArkR1ArkR1
ArkR1ArkR1ArkR1ArkR1ArkR1
ArkR1
ArkR1
ArkR1
ArkR1ArkR1ArkR1ArkR1ArkR1ArkR1ArkR1ArkR1
ArkR1
ArkR1ArkR2ArkR2
ArkR2ArkR2
ArkR2ArkR2ArkR2ArkR2ArkR2ArkR2
ArkR2
ArkR2
*rkR2<VrkR3Ikrk R3
VkR3
ill
LNRD-031LNRD-025LNRD-031LNRD-031
LNRD-006
LNRD-010
LNRD-010
LNRD-015
LNRD-049
LNRD-051LNRO-055
LNRD-051LNRD-006
LNRD-006
LNRD-062LNRD-011LNRD-011LNRO-031
LNRD-006LNRD-010LNRD-010LNRD-015NRD-055
NRD-006
NRD-051
NRD-055
NRD-060NRD-060NRD-006NRD-006NRD-006NRD-006NRD-041NRD-006
NRD-006
NRD-062NRD-025NRD-031
NRD-006vJRD-015
NRD-051-NRD-055\|RD-050^JRD-041NRD-041NRD-006
NRD-006
NRD-062
NRD-062NRD-025NRO-031
NRD-006
|1000009070812000708120039141510620510<
AR-1
AR-1
AR-1
AR-1
AR-1
AR-1AR-1
AR-1 2F8UP
SW105
SW10525150-25191313106212000
AR-3AR-3AR-3AR-3AR-3
AR-3A
AR-3A
AR-3a
AR-3AAR-3BAR-3EAR-3WCH2-SW-14
8DNim-25ARB-AR-4
W111
W11170837007083700
R-4R-4
R-tR-4R-40
<m-27<m-32B-AR-5
W101
W101
W11070B37107083710
R-5
ARKANSAS R. BELOW LEAOVILLE. COLArkansas River near Leadville CO.ARKANSAS RIVER NEAR LEADVILLE, CO.1 ARKANSAS RIVER NEAR LEADVILLE, CO.Arkansas River upstream of confluence with California Gulch, approximately 0.25 milesdownstream of confluence with Tennessee Creek (ARCS')Gauging station on Arkansas River immdiately downstream from confluence of EastFork and Tennessee CreekGauging station on Arkansas River immdiately downstream from confluence of EastFork and Tennessee CreekGauging station on Arkansas River immdiately downstream from confluence of EastFork and Tennessee CreekArkansas River at USGS gaging station immediately downstream from the confluencewith Tennessee Creek and East Fork Arkansas RiverArkansas River upstream of confluence with California Gulch, approximately 0.25 milesdownstream of the confluence with Tennessee CreekArkansas River at Leadville (at USGS Gage)
Arkansas River upstream of confluence with California Gulch, between AR-1 and AR-2:LUVIAL TAILINGS SURFACE WATER
SAMPLE FROM YH£ ARKANSAS RIVER, OFF^ THE EAST BANK, AT A U.S.G.S.GAGING STATION ON THE RIVER, APPX .25 Ml SOUTHWEST OF LEAOVILLEJUNCTION.Sample from the Arkansas River, off the east bank, at a USGS gaging station on theriver, aooroximatelv.25 miles southwest of Leadville Junction.Below California Glelow California G/25.020
ARKANSAS RIVER BLW CALIFORNIA GULCHApproximately 0.5 km downstream of California Gulch, after complete mixing occurs withthe Arkansas River50 m downstream from CG50 m downstream from CG50 m downstream from CG
Arkansas River blw California Gulch (east bank)
Arkansas River approximately 0.5 miles downstream of confluence with California Gulch
rkansas River approximately 0.5 miles downstream of confluence with California Gulch/4 mile ds of Cal Gulch on Harry Becks property, just south of the AR3 station on Editheppis property
rkansas River approximately 0.5 miles downstream of confluence with California Gulch
East 1/3 Arkansas River in mixing zone with California Gulch (AR3 & AR03')West 2/3 Arkansas River In mixing zone with California Gulch water (AR03*)
OWNSTREAM OF CA. GULCH/ARKANSAS RIVER CONFLUENCELUVIAL TAILINGS SURFACE WATER
Arkansas River -Below California GulchRKANSAS RIVER STATION #4AMP FRM E SIDE OF ARKANSAS RVR APPX .25 Ml S OF THE CONFLUNCE W/AL GULCH JUST S OF STATE HWY 300ample from the east bank of the Arkansas River approximately .25 miles south of the
Confluence with California Gulch, just south of State Highway 300.•kansas River near Malta CO.RKANSAS RIVER NEAR MALTA, CO.
Vkansas River approximately 0.5 miles downstream of confluence with Lake ForkAR02-)
Ml: Arkansas River approximately 0.5 miles downstream of confluence with Lake Fork;older Arkansas River below confluence with Halfmoon Creek - Lake Fork
Vkansas River blw Lake Fork and Halfmoon Ck
Vkansas River -Below Lake Fork\rkansas River -Near MaltaARKANSAS RIVER STATION #5AMP FRM THE ARKANSAS RVR NEAR CTY RD 44, S OF LEADVILLE 25 FTPSTREAM OF A RANCH BRIDGE (CROSNG ARKANSAS) OFF THE E BANKample from Arkansas River near County Road 44, south of Leadville, 25 ft upstream ofranch bridge (crossing the Arkansas) off the e bank.ample from the east bank of the Arkansas River approximately 100 feet upstream ofe bridge at the river crossing and State Highway.
Vkansas River below Empire Gulch near Malta CO.RKANSAS RIVER BELOW EMPIRE GULCH NEAR MALTA, COkansas River upstream of confluence with Empire Gulch and approximately 0.25 miles
ownstream of Hwy. 24 bridge (AROT)
II
952033
98249
78
278
1994
1993
2101
20362214
203644
67
222180858
2479
7922787
199441993422145
793
20369
22146
2106921070
794795397443
21131495
681
2221820337
988
31919935
2037022147205772114121142
496
671
2208
222170338
989
320
III!•'.01 .!•
• : '55' '34834734f
1094
377
338
338
338
338
35033E
620157E
345
361161115611634
16301637163716371637
1739
1735
1669
1739174(163C162(155!1865167C1666
1595
1626198?199C
1920924
920924869909943927
916
923
986042042
025
App_C3_Station Lists.xls Page 1 of 5 10/29/2002
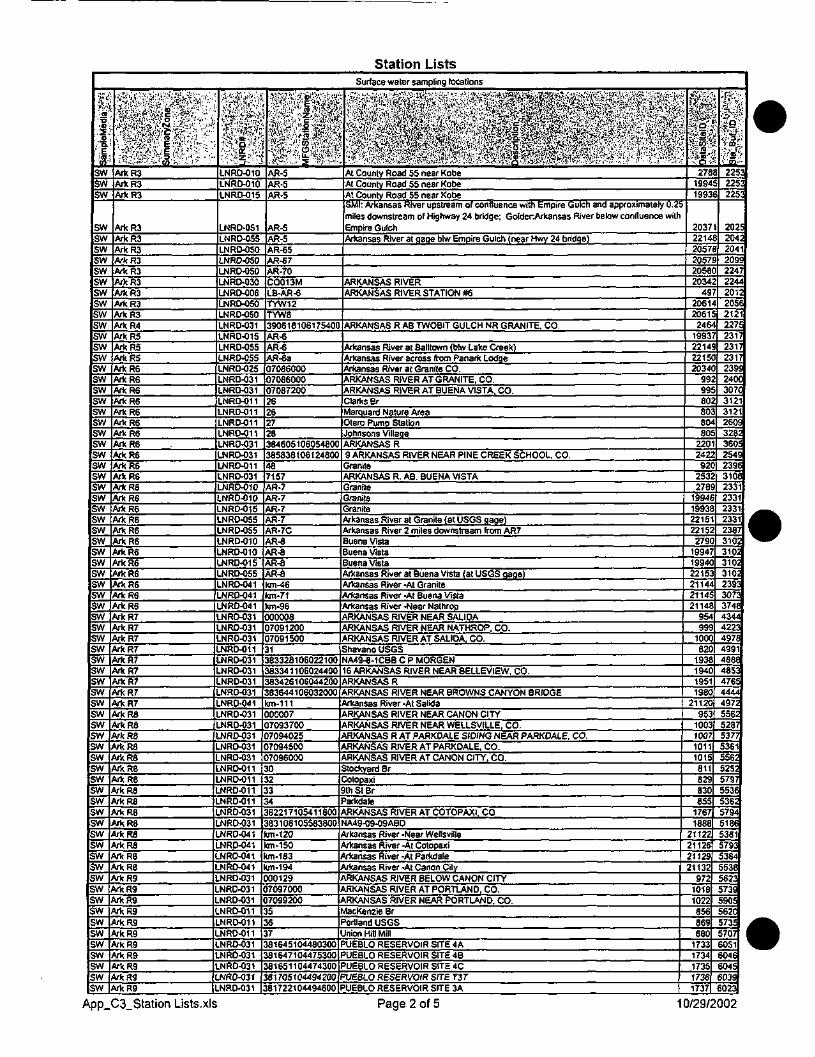
Station Lists
Nampi
eMed
'la':?
rp
SWSWSW
SWSWSWSWSWSWSWSWSWSWSWSWSWSWSWSWSWSWSWSWSWSWSWSWSWSWSWSWSWSWSWSWSWSWSWSWSWSWSWSWSWSWSWSWSWSWSWSWSWSWSWSWSWSWSWSWSWSWSWSWSWSWSWSWSWSWSWSWSWSWSW
^&*i'$£-y''j$&$&:*~f. • •••: ":'-.J.' >v*> j.:1' :•.'<:• .../.:• •
•^'^yi/dci-M':;" -:.••StMwfri'*'.. 0 \-.yy ;'..; •. '
^§:i$£#M'--*
•IllsArkR3ArkR3ArkR3
ArkR3ArkR3ArkR3ArkR3ArkR3ArkR3ArkR3ArkR3ArkR3ArkR4ArkRSArkRSArkRSArkR6ArkR6ArkR6ArkR6ArkR6ArkR6ArkR6ArkR6ArkR6ArkR6ArkR6ArkRSArkR6ArkR6ArkR6ArkR6ArkR6ArkR6ArkR6ArkR6ArkR6ArkR6ArkR6ArkR7ArkR7ArkR7ArkR7ArkR7ArkR7ArkR7ArkR7ArkR7ArkRSArkRSArkRSArkRSArkRSArkRSArkRSArkRSArkRSArkRSArkR8ArkRBArkRSArkRSArkRSArkR9ArkR9ArkR9ArkR9ArkR9ArkR9ArkR9ArkR9ArkR9ArkR9ArkR9
»mt»•W£:•/.•C^.Z •':•:••
LNRD-010LNRD-010LNRD-015
LNRD-051-NRD-055-NRD-050LNRD-050LNRD-050.NRD-030LNRD-006LNRD-050LNRO-050LNRO-031LNRD-015.NRD-055LNRD-055LNRD-025LNRD-031LNRD-031LNRD-011LNRD-011LNRD-011LNRD-011LNRD-031LNRD-031.NRD-011
LNRD-031LNRD-010LNRD-010LNRD-015LNRD-055LNRD-055LNRO-010LNRD-010LNRD-015LNRD-055LNRD-041LNRD-041LNRD-041LNRD-031NRD-031.NRD-031NRD-011NRD-031NRD-031NRD-031NRD-031NRD-041NRD-031NRD-031NRD-031
LNRD-031.NRD-031NRD-011NRD-011NRD-011NRD-011NRD-031NRD-031
LNRD-041NRD-041NRO-041NRD-041NRD-031NRD-031NRD-031NRD-011NRD-011NRD-011NRD-031NRD-031NRD-031NRD-031NRD-031
infillH IPW^sm^i"K^msAR-5AR-5AR-5
AR-5AR-5AR-65AR-67AR-70C0013MLB-AR-6PYW12rvwa390618106175400AR-6AR-6AR-6a07086000070860000708720026262728384605106054800385838106124800487157AR-7AR-7AR-7AR-7AR-7CAR-8AR-8AR-8AR-8km-46cm-71km-96000008
709120017091500183328106022100833411060244008342610604420083644106032000
<m-111000077093700709402570945007096000023
348221710541180083108105583800
km-120km-150km-183km-19400129709700070992005678164510448030081647104475300816511044743008170510449420081722104494600
Surface water sampling locations
At County Road 55 near KobeAt County Road 55 near KobeAt County Road 55 near KobeSMI: Arkansas River upstream of confluence with Empire Gulch and approximately 0.2mites downstream of Highway 24 bridge; Golder.Arkansas River below confluence withEmpire GulchArkansas River at qaqe blw Empire Gulch (near Hwy 24 bridge)
ARKANSAS RIVERARKANSAS RIVER STATION #6
ARKANSAS R AS TWOBIT GULCH NR GRANITE. CO.
Arkansas River at Balltown (blw Lake Creek)Arkansas River across from Panark LodqeArkansas Rfver at Granite CO.ARKANSAS RIVER AT GRANITE, CO.ARKANSAS RIVER AT BUENA VISTA. CO.Clarks BrMarquard Nature AreaOtero Pump StationJohnsons VillageARKANSAS R9 ARKANSAS RIVER NEAR PINE CREEK SCHOOL, CO.GraniteARKANSAS R. AB. BUENA VISTAGraniteGraniteGraniteArkansas River at Granite (at USGS gage)Arkansas River 2 miles downstream from AR7Buena VistaBuena VistaBuena VistaArkansas River at Buena Vista (at USGS gage)Arkansas River -At GraniteArkansas River -At Buena VistaArkansas River -Near NathropARKANSAS RIVER NEAR SALIDAARKANSAS RIVER NEAR NATHROP, CO.ARKANSAS RIVER AT SALIDA, CO.Shavano USGSNA49-8-1CBB C P MORGEN6 ARKANSAS RIVER NEAR BELLEVIEW. CO.
ARKANSAS RARKANSAS RIVER NEAR BROWNS CANYON BRIDGEArkansas River -At SalidaARKANSAS RIVER NEAR CANON CITYARKANSAS RIVER NEAR WELLSVILLE, CO.ARKANSAS R AT PARKDALE SIDING NEAR PARKDALE. CO.ARKANSAS RIVER AT PARKDALE. CO.
RKANSAS RIVER AT CANON CITY^ CO.tockyard Brotopaxith St Brarkdale
ARKANSAS RIVER AT COTOPAXI. COA49-09-09ABD
Arkansas River -Near WellsvilleArkansas River -At CotopaxiArkansas River -At ParkdaleArkansas River -At Canon CityRKANSAS RIVER BELOW CANON CITY
ARKANSAS RIVER AT PORTLAND, CO.RKANSAS RIVER NEAR PORTLAND. CO.
MacKenzie Brortland USGSnion Hill MillUEBLO RESERVOIR SITE 4AUEBLO RESERVOIR SITE 4BUEBLO RESERVOIR SITE 4CUEBLO RESERVOIR SITE T3TUEBLO RESERVOIR SITE 3A
'li'ik-Vi!*'y-'i.\-'&•!%mif1|:
27819941993
203722142057205720562034
4920612061
24641993221422152034
999980808080
220242292
253278
1994199322152215279
199471994022153211442114521148
954999
1000820
1938194019511980
21120953
1003100710111015811829830855
17671888
21122211262112921132
97210181022856869880
17331734173517361737
tfl
1VoQv*1
•.:••.- fV": r
225322532253
2025204:2041
209922472244201.
20562121
22752317
2317
2317
239!
240C307C3121
3121
260!
328!
360!
254!
239(
3101
2331
2331
2331
2331
23873102
310:310:310:2393307:374(43444223497(4991488(485:4765444497;5561528753775361556:525;5797553f536:57945186538157935364553£562357395905562C57355707605160466045B03S023
App_C3_Station Lists.xls Page 2 of 5 10/29/2002
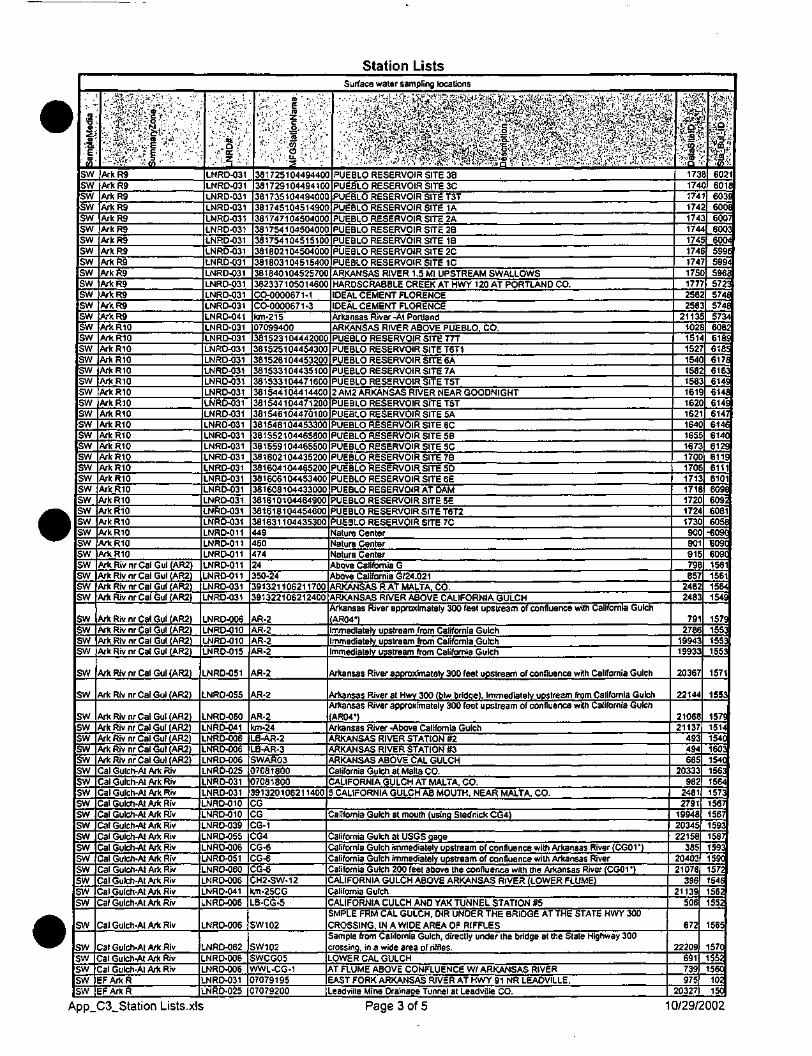
Station ListsSurface water sampling locations
Sam
pleM
edia
"•'.
'
SWSWSWSWSWSWSWSWSWSWSWSWSWSWSWSWSWSWSWSWSWSWSWSWSWSWSWSWSWSWSWSWSWSWSWSWSWSWSWSW
SWSWSWSW
SW
SW
SWSWSWSWSWSWSWSWSWSWSWSWSWSWSWSWSWSW
SW
SWSWSWSWSW
• -i.V.1- ;•••? •-. • • . ' " • " . . • - .
!$$%^ti+.-'^S^VSvV. .;-.•:
»ip:'A•!(.:£$&•*• !.'•;;:••• ;-:.::•'•'••'•ifr'1' •••''« •' •'• ' "' •-ArkR9ArkR9ArkR9ArkRSArkR9ArkR9ArkR9ArkR9ArkR9ArkR9ArkR9ArkR9ArkR9ArkR9ArkRIOArkRIOArkRIOArkRIOArkRIOArkRIOArkRIOArkRIOArkRIOArkRIOArkRIOArkRIOArkRIOArkRIOArkRIOArkRIOArkRIOArk R10ArkRIOArkRIOArkRIOArkRIOArk Riv nr Cal Gul CAR2)Ark Riv nr Cal Gul (AR2)Ark Riv nr Cal Gul (AR2)Ark Riv nr Cal Gul (AR2)
Ark Riv nr Cal Gul (AR2)Ark Riv nr Cal Gul (AR2)Ark Riv nr Cal Gul (AR2)Ark Riv nr Cal Gul (AR2)
Ark Riv nr Cal Gul (AR2)
ArkRivnrCalGul(AR2)
ArkRivnrCalGul(AR2)ArkRivnrCalGul(AR2)Ark Riv nr Cal Gul (AR2)Ark Riv nr Cal Gul (AR2)ArkRivnrCalGulIAR2)Cal Gulch-At Ark RivCal Gulch-At Ark RivCal Gulch-At Ark RivCal Gulch-At Ark RivCal Gulch-At Ark RivCal Gulch-At Ark RivCal Gulch-At Ark RivCal Gulch-At Ark RivCal Gulch-At Ark Riv
al Gulch-At Ark Rival Gulch-At Ark Rival Gulch-At Ark Rival Gulch-AI Ark Riv
al Gulch-At Ark Riv
al Gulch-AI Ark Rival Gulch-At Ark Rival Gulch-At Ark Riv
SFArkRFArkR
;. ."-'/'',''••/" " i=it '•''•'-, o'f-
•£!•?•;LNRD-031LNRD-031LNRD-031LNRD-031LNRD-031LNRO-031LNRO-031LNRD-031LNRD-031LNRD-031LNRD-031LNRD-031LNRD-031LNRD-041LNRD-031LNRD-031LNRD-031LNRD-031LNRD-031LNRD-031LNRD-031.NRD-031LNRD-031LNRO-031LNRD-031LNRD-031LNRD-031LNRD-031LNRD-031LNRD-031LNRD-031LNRD-031LNRD-031LNRD-011LNRD-01 1LNRD-011LNRD-011LNRD-011LNRD-031NRD-031
NRD-006NRD-010NRD-010NRD-015
NRD-051
NRD-055
NRD-060NRD-041NRD-006.NRD-006NRD-006NRD-025NRD-031NRD-031NRD-010NRD-010NRD-039NRD-055NRD-006NRD-051NRD-060NRD-006NRD-041NRD-006
NRD-006
NRD-062JMRD-006.NRD-006NRD-031NRD-025
• : . ; ' ' . &'•*•'•'"'.
m-'i'^:•-., :'-• C -, •:-.•:.••.
•:ii'i!i'.1 .•£.. -.•£•<•
'•^:M^\^•V:h|H-:-
38172510449440381729104494103817351044940038174510451490038174710450400(381754104504000381754104515100381802104504000381803104515400381840104525700382337105014600CO-0000671-1CO-0000671-3km-2150709940038152310444200038152510445430038152810445320038153310443510038153310447160038154410441440038154410447120(381546104470100381548104453300381552104465800381559104465500381602104435200381604104465200381606104453400381608104433000381610104464900381618104454600381631104435300449450474450-249132110621170091322106212400
AR-2AR-2AR-2AR-2
AR-2
AR-2
R-2km-24B-AR-2B-AR-3WAR037081800708180091320106211400GGG-1G4G-6G-6G-6H2-SW-12
Km-25CGB-CG-5
W102
W102WCG05
WWL-CG-170791957079200
.•••o ix ;. • • ' • • •tt/'-nK^-is'i.."^^^^*^-'. ; /•^JvlV-^Sr'-.'-J^?^^ ,J7:. ?•*';;/'!";
PUEBLO RESERVOIR SITE 3BPUEBLO RESERVOIR SITE 3CPUEBLO RESERVOIR SITE T3TPUEBLO RESERVOIR SITE 1APUEBLO RESERVOIR SITE 2APUEBLO RESERVOIR SITE 2BPUEBLO RESERVOIR SITE 1BPUEBLO RESERVOIR SITE 2CPUEBLO RESERVOIR SITE 1CARKANSAS RIVER 1.5 Ml UPSTREAM SWALLOWSHARDSCRABBLE CREEK AT HWY 120 AT PORTLAND CO.IDEAL CEMENT FLORENCEIDEAL CEMENT FLORENCEArkansas River -At PortlandARKANSAS RIVER ABOVE PUEBLO. CO.PUEBLO RESERVOIR SITE T7TPUEBLO RESERVOIR SITE T6T1PUEBLO RESERVOIR SITE 6APUEBLO RESERVOIR SITE 7APUEBLO RESERVOIR SITE T5T2 AM2 ARKANSAS RIVER NEAR GOODNIGHTPUEBLO RESERVOIR SITE T5TPUEBLO RESERVOIR SITE 5APUEBLO RESERVOIR SITE 6CPUEBLO RESERVOIR SITE SBPUEBLO RESERVOIR SITE 5CPUEBLO RESERVOIR SITE 7BPUEBLO RESERVOIR SITE 5DPUEBLO RESERVOIR SITE 6EPUEBLO RESERVOIR AT DAMPUEBLO RESERVOIR SITE 5EPUEBLO RESERVOIR SITE T6T2PUEBLO RESERVOIR SITE 7CNature CenterNature CenterNature CenterAbove California GAbove California G/24.021ARKANSAS R AT MALTA. CO.ARKANSAS RIVER ABOVE CALIFORNIA GULCHArkansas River approximately 300 feet upstream of confluence with California GulchAR04')mmediately upstream from California Gulchmmediately upstream from California Gulchmmediately upstream from California Gulch
Arkansas River approximately 300 feet upstream of confluence with California Gulch
Arkansas River at Hwy 300 (blw bridge), Immediately upstream from California GulchArkansas River approximately 300 feet upstream of confluence with California GulchAR04*)Arkansas River -Above California GulchRKANSAS RIVER STATION #2
ARKANSAS RIVER STATION #3RKANSAS ABOVE CAL GULCHalifornia Gulch at Malta CO.ALIFORNIA GULCH AT MALTA, CO.CALIFORNIA GULCH AS MOUTH, NEAR MALTA, CO.
alifomia Gulch at mouth (using Stednick CG4)
alifornia Gulch at USGS gageCalifornia Gulch immediately upstream of confluence with Arkansas River (CG01*)alifornia Gulch immediately upstream of confluence with Arkansas Riveralifornia Gulch 200 feet above the confluence with the Arkansas River (CG01*)ALIFORNIA GULCH ABOVE ARKANSAS RIVER (LOWER FLUME)alifornia GulchALIFORNIA CULCH AND YAK TUNNEL STATION #5MPLE FRM CAL GULCH, DIR UNDER THE BRIDGE AT THE STATE HWY 300ROSSING, IN A WIDE AREA OF RIFFLESample from California Gulch, directly under the bridge at the State Highway 300ossing, in a wide area of riffles.OWER CAL GULCHT FLUME ABOVE CONFLUENCE W/ ARKANSAS RIVER
-AST FORK ARKANSAS RIVER AT HWY 91 NR LEADVILLE,eadville Mine Drainage Tunnel al Leadville CO.
4>lM&AL..S.
1731741741741741744174174174175177258258
21131021511521541581581611621621640165516731700170617131718172017241730900901915798857
24822483
7912786
1994319933
20367
22144
2106821137
493494685
20333982
24812791
199482034522158
3852040321076
3961139506
672
220S691739975
0327
•&*•••te&-•••»1i"'!1
;.ib::-
1• COM
6021
6016
603£600860076003600459965994596!
57235741
5741
5734608;
618!
618!
617£
6163
614E
6148614E
6147
6146
6141
612!
611!
6111
6101
609(
60926081
60 5<-609(609(
609(
1561
1561
1564
154!
1579
1553
1553
1553
1571
1553
1579
1514
154(
160;
154(
1563
1564
1573
1567
5671593
56759359C57!54E562552
565
57055256C102150
App_C3_Station Lists.xls Page 3 of 5 10/29/2002
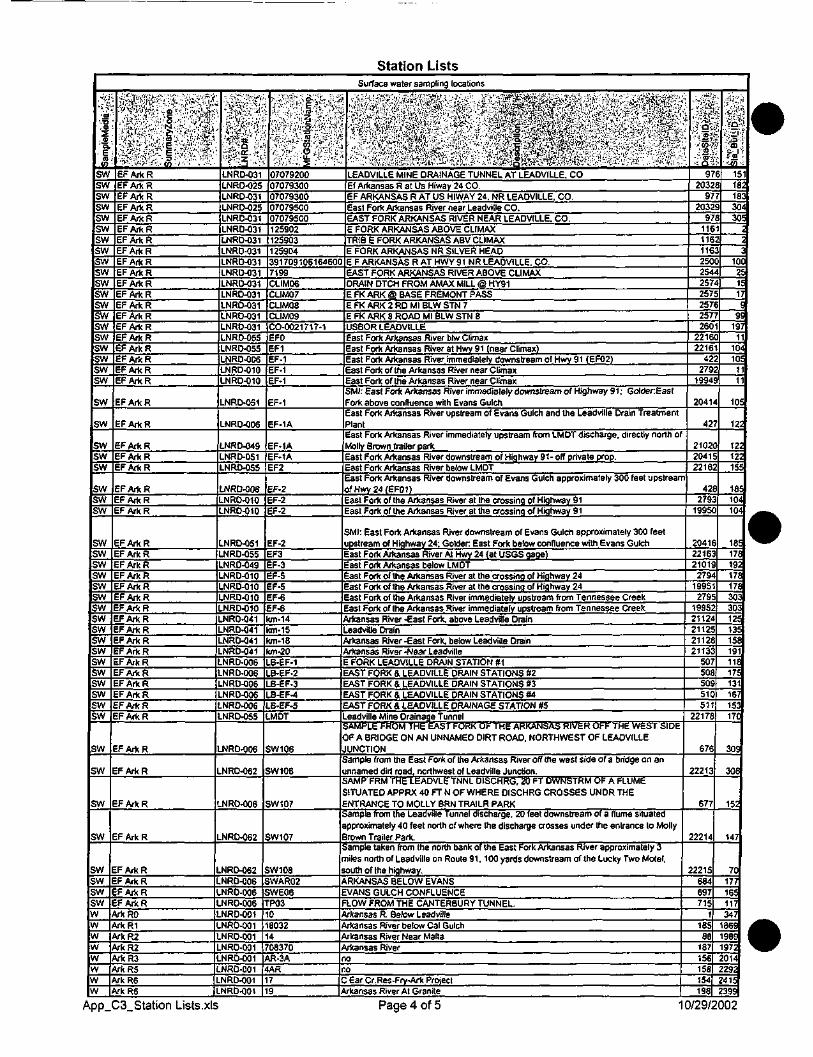
Station ListsSurface water sampling locations
Sam
pleM
edla
4;<::
SWSWSWSWSWSWSWSWSWSWSWSWSWSWSWSWSWSWSWSW
SW
SW
SWSWSW
SWSWSW
SWSWSWSWSWSWSWSWSWSWSWSWSWSWSWSWSW
SW
SW
SW
SW
SWSWSWSWww
r
ww
w
t^mw^ft
•'""••••.vW^.'.-.-Ol •>'•'< '•• - • ' • • '
EFArkREFArkREFArkREFArkREFArkREFArkREFArkREFArkREFArkREFArkREFArkREFArkREFArkREFArkREFArkREFArkREF Ark REFArkREFArkREFArkR
EFArkR
EFArkR
EFArkREF Ark REFArkR
EFArkREFArkREFArkR
EFArkREF Ark REF Ark REFArkREFArkR
FArkRFArkRFArkRFArkRFArkRFArkRFArkRFArkRFArkRFArkRFArkRFArkR
FArkR
FArkR
FArkR
FArkR
FArkRFArkRFArkRFArkR
HrkROHrkR1\rkR2\rkR2*rkR3\rkR5\rkR6\rkR6
••'$;$'&•:f in};1- :•/••?•z::j&.;£wig||LNRD-031LNRD-025LNRD-031LNRD-025LNRD-031LNRD-031-NRD-031LNRD-031.NRD-031.NRD-031.NRD-031
LNRD-031LNRD-031LNRD-031LNRD-031LNRD-055LNRD-05SLNRD-006LNRD-010LNRD-010
LNRD-051
LNRD-006
LNRD-049LNRD-051LNRD-055
NRD-006NRD-010NRD-010
NRD-051NRD-055.NRD-049NRD-010NRD-010NRD-010NRD-010NRD-041NRD-041NRD-041NRD-041NRD-006NRD-006.NRD-006.NRD-006NRD-006NRD-055
LNRD-006
NRD-062
NRO-006
NRD-062
NRD-062NRD-006NRO-006NRD-006NRD-001NRO-001NRO-001NRO-001NRD-001NRD-001NRD-001NRD-001
. M'.. ': &•.-'!,' ,' ii.>•':::::'<:'.!'',• e.t;:"-"V.,
'Wt€l:/:..-::.!' f.'-O.-^-.-i/vijj'i •.,'.' 5 ;'•. v ' ;-
07079200070793003707930007079500)707950012590212590312590439170910616460(7199CLIM06CLIM07CLIM08CLIM09CO-0021717-1EFOEF1
EF-1EF-1EF-1
EF-1
EF-1A
EF-1AEF-1AEF2
EF-2EF-2EF-2
F-2F3
EF-3F-5F-5F-6
EF-6km-14km-15km-18km-20B-EF-1B-EF-23-EF-33-EF-4B-EF-5MOT
W106
W106
W107
W107
W108WAR02WE06P0308032408370
IVR-3AAR'
9
LEADVILLE MINE DRAINAGE TUNNEL AT LEADVILLE, COEf Arkansas R at Us Hiway 24 CO.EF ARKANSAS R AT US HIWAY 24, NR LEADVILLE, CO.East Fork Arkansas River near Leadville CO.EAST FORK ARKANSAS RIVER NEAR LEADVILLE, CO.E FORK ARKANSAS ABOVE CLIMAXFRIB E FORK ARKANSAS ABV CLIMAXE FORK ARKANSAS NR SILVER HEADE F ARKANSAS R AT HWY 91 NR LEADVILLE. CO.EAST FORK ARKANSAS RIVER ABOVE CLIMAX)RAIN DTCH FROM AMAX MILL @ HY91E FK ARK @ BASE FREMONT PASS
E FK ARK 2 RD Ml BLW STN 7E FK ARK 8 ROAD Ml BLW STN 8
USBOR LEADVILLEEast Fork Arkansas River blw ClimaxEast Fork Arkansas River at Hwy 91 (near Climax)East Fork Arkansas River immediately downstream of Hwy 91 (EF02)East Fork of the Arkansas River near ClimaxEast Fork of the Arkansas River near ClimaxSMI: East Fork Arkansas River immediately downstream of Highway 91; GolderEastFork above confluence with Evans GulchEast Fork Arkansas River upstream of Evans Gulch and the Leadville Drain TreatmentPlantEast Fork Arkansas River immediately upstream from LMDT discharge, directly north oMolly Brown trailer parkEast Fork Arkansas River downstream of Highway 91- off private prop.East Fork Arkansas River below LMDTEast Fork Arkansas River downstream of Evans Gulch approximately 300 feet upstreamfHwy24(EF01)
East Fork of the Arkansas River at the crossing of Highway 91East Fork of the Arkansas River at the crossing of Highway 91
SMI: East Fork Arkansas River downstream of Evans Gulch approximately 300 feetpstream of Highway 24; Golden East Fork below confluence with Evans Gulchast Fork Arkansas River At Hwy 24 jat USGS gage)
East Fork Arkansas below LMDTast Fork of the Arkansas River at the crossing of Highway 24
East Fork of the Arkansas River at the crossing of Highway 24East Fork of the Arkansas River immediately upstream from Tennessee CreekEast Fork of the Arkansas River immediately upstream from Tennessee Creek
Arkansas River -East Fork, above Leadville Draineadville Drain
Arkansas River -East Fork, below Leadville DrainArkansas River -Naar Leadville
FORK LEADVILLE DRAIN STATION #1EAST FORK & LEADVILLE DRAIN STATIONS #2EAST FORK & LEADVILLE DRAIN STATIONS #3EAST FORK & LEADVILLE DRAIN STATIONS #4
EAST FORK & LEADVILLE DRAINAGE STATION #5eadville Mine Drainage TunnelAMPLE FROM THE EAST FORK OF THE ARKANSAS RIVER OFF THE WEST SIDEF A BRIDGE ON AN UNNAMED DIRT ROAD, NORTHWEST OF LEAOVILLEUNCTIONample from the East Fork of the Arkansas River off the west side of a bridge on annnamed dirt road, northwest of Leadville Junction.AMP FRM THE LEADVLE TNNL DISCHRG, 20 FT DWNSTRM OF A FLUMEITUATED APPRX 40 FT N OF WHERE OISCHRG CROSSES UNDR THENTRANCE TO MOLLY BRN TRAILR PARKample from the Leadville Tunnel discharge. 20 feet downstream of a flume situatediproximately 40 feet north of where the discharge crosses under the entrance to Mollyrown Trailer Park.ample taken from the north bank of the East Fork Arkansas River approximately 3iles north of Leadville on Route 91, 100 yards downstream of the Lucky Two Motel,
.outh of the highway.RKANSAS BELOW EVANSVANS GULCH CONFLUENCELOW FROM THE CANTERBURY TUNNEL.
Arkansas R. Below LeadvilleArkansas River below Cal GulchArkansas River Near MaltaArkansas River0
0
Ear Cr. Res-Fry-Ark ProjectArkansas River At Granite
''-'?&
»•.:•;. a\•V)'.; nj
:T'S-9
2039
2039
116116116250254257257257257260
22162216
42279
1994
2041
42
210220412216
42279
1995
20412216321019
279419951
27951995221124211252112821133
507508509510511
22178
676
22213
677
22214
22215684697715
118588
187156158154198
'••^'•'•'•'•'
•'•:s£jJo4'•'j5-:::<n,.'
. Fin' !•<en ::
15118218330430!
10C
9S197
104105
•
105
122
122121155
185104104
18517f19217f17f303so:12!13515f19111f175131167153170
309
306
152
147
701771651173478599B£972014292415399
App_C3_Station Lists.xts Page 4 of 5 10/29/2002
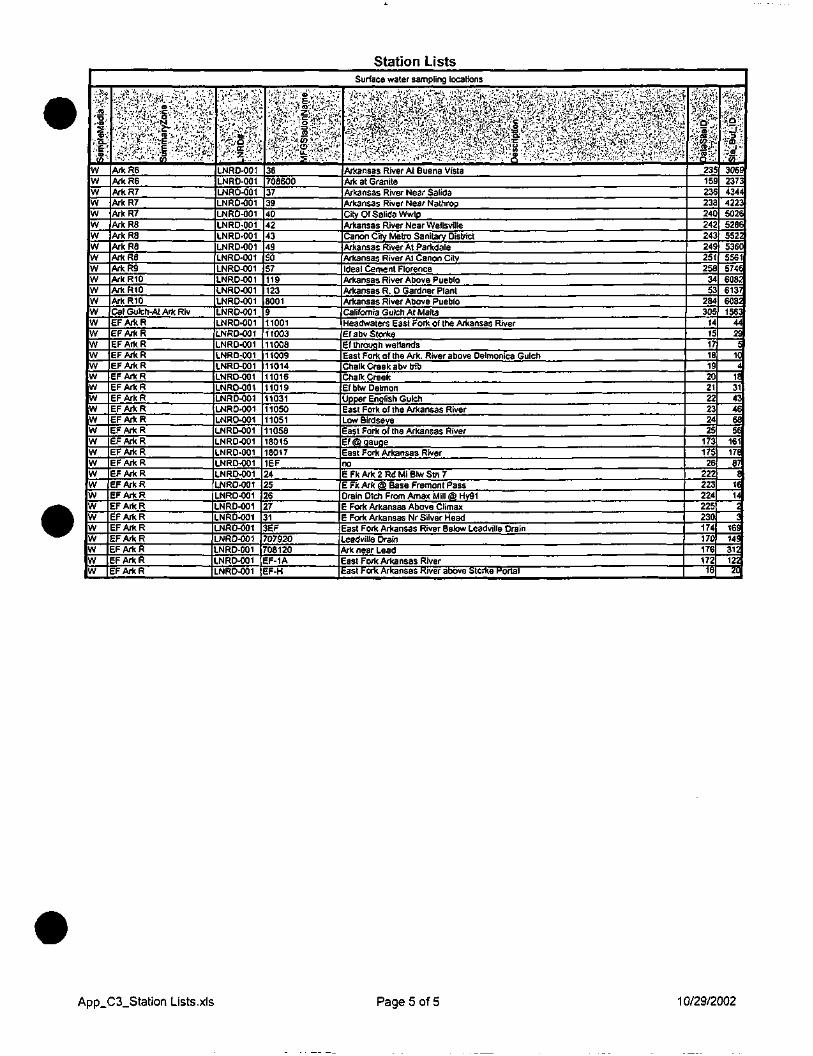
Station ListsSurface water sampling locations
• \'
':nj'•o~*iO
V.H
•|:WWWWWWWWWWWWWWWWWWWWWWWWWWWWWWWWWWWWWW
• ;y* "•••1i.'-.i-;.;,."iV.1' •':.':;>:;::''t ,;:-:.:;#...;.":' I,;:-'1)/,.?-. '-«.."i:«i>:r'.i1"i?>:
•%$'/&&§•: W.?gJ. -J.'-.y-V-VN . • ,'„. :";>•i,' ,;.fl v"^:-.- £j»* ..-iv '/.'vr-ir
•*s^si- .:-.;• ;•'-•'••-.-». tn •• •••' -•ArkR6ArkRSArkR7ArkR7ArkR7ArkRSArkRSArk R6ArkR8ArkR9ArkRIOArkRIOArkRIOCal Gulch-Al Ark RivEFArkREFArkREFArkREFArkREFArkREFArkREFArkREFArkREFArkREFArkREFArkREFArkREFArkREFArkREFArkREFArkREFArkREF Ark REFArkREFArkREFArkREFArkREFArkREFArkR
M*v%!.'u:~- •'';•*':"'ti'^rtM'£'X;
^M:LNRD-001LNRD-001LNRD-001LNRD-001LNRD-001LNRD-001LNRD-001LNRD-001LNRD-001LNRD-001LNRD-001LNRD-001LNRD-001LNRD-001LNRD-001LNRD-001LNRD-001LNRD-001LNRD-001LNRD-001LNRD-001LNRD-001LNRD-001LNRD-001LNRD-001LNRD-001LNRD-001LNRD-001LNRD-001LNRD-001LNRD-001LNRD-001LNRD-001LNRD-001LNRD-001LNRD-001NRD-001NRD-001
}%j;^e$$£;
•,'^.'-f-'.<!-Sf'A-f'f-'^•V3f«$«*••tfi&tt&tikfii*A, •'•'•'!. in ''.;•'.,•'- '?•-:;:•&•:;-•' ••••,;o'--.-A;.>;-'•:W;v'.;'!^v?.:riV-'•."• • • • • • '-'f- '-•' •'•*• " v
36708600373940424349505711912330019110011100311008110091101411016110191103110501051105880158017EF
242526271EF0792008120
EF-1AEF-H
V«:vr!i^ ^X^^^Zi&W&titi •i-rW &;K-£i -::;:-v?; "*&:&£&
Arkansas River At Buena VistaArk at GraniteArkansas River Near SalidaArkansas River Near NathropCity Of Salida WwtpArkansas River Near WellsvilleCanon City Metro Sanitary DistrictArkansas River At ParkdaleArkansas River At Canon CityIdeal Cement FlorenceArkansas River Above PuebloArkansas R. D Gardner PlantArkansas River Above PuebloCalifornia Gulch At MaltaHeadwaters East Fork of the Arkansas RiverifabvStorke:f through wetlandsEast Fork of the Ark. River above Delmonica GulchChalk Creek abv tribChalk CreekEf blw DelmonUpper English GulchEast Fork of the Arkansas River.ow Birdseyelast Fork of the Arkansas River:f(S>qauge•ast Fork Arkansas River
noE Fk Ark 2 Rd Mi Blw Stn 7: Fk Ark @ Base Fremont Pass
Drain Dtch From Amax Mill @ Hy91E Fork Arkansas Above ClimaxE Fork Arkansas Nr Silver HeadEast Fork Arkansas River Below Leadville Draineadville Drain
Ark near LeadEast Fork Arkansas RiverEast Fork Arkansas River above Storke Portal
fi'l'Sflm' .-"'''S'./$sfM•\''Q ••
235159236238240242243249251258
3453
284305
1415171819202122232425
173175
26222223224225230174170176172
16
-.•iSfci
M-^•-&$'!!$.••.sW:.':W''306£237343444223502652865522536C5561574660S;613760S:1563
442£i
1(4
1f31434(6(56
16117!87(
1614;
^16!14!31212220
App_C3_Station Lists.xls Page 5 of 5 10/29/2002
APPENDIX D
Descriptions of Mine-Waste Deposits from Chapter 2
Descriptions of Mine-Waste Deposits from Chapter 2
Reach 1 Mine-Waste Deposits
Deposit AA is located on the east side of the Arkansas River and directly north of an irrigation
return ditch that discharges at the confluence of California Gulch and the Arkansas River. It contains
approximately 8,991 ft3 of mine-waste over an area of approximately 4,259 ft2, and has an average mine-
waste depth of 2.1 ft. Samples from this deposit had average concentrations of the following metals:
cadmium, 115 mg/kg; copper, 160 mg/kg; lead, 3,900 mg/kg; and zinc, 1,700 mg/kg. No vegetation was
observed on the deposit. Erosion features (rills) and salt deposits were observed on the surface.
Deposit AB is located on the east side of the Arkansas River between an irrigation return ditch
and California Gulch. The Eastern portion of the deposit is less than 10 feet from the Arkansas River
bank. It contains approximately 32,187 ft3 of mine-waste over an area of approximately 16,685 ft2, and
has an average mine-waste depth of 1.9 ft. Samples from this deposit had average concentrations of the
following metals: cadmium, 220 mg/kg; copper, 535 mg/kg; lead, 3,900 mg/kg; and zinc 1,650 mg/kg.
Signs of erosion and salts were visible on the surface. Grasses were observed in the low area adjacent to
California Gulch.
Deposit AC comprises a portion of the east bank of the Arkansas River and is bordered on the
north by California Gulch. This deposit contains approximately 20,286 ft3 of mine-waste over an area of
approximately 31,137 ft2, and has an average mine-waste depth of 0.7 ft. The deposit consists of cobble
and gravel mixed with mine-waste. Samples from this deposit had average concentrations of the
following metals: cadmium 250 mg/kg; copper 453 mg/kg; lead, 4,883 mg/kg; and zinc, 17,750 mg/kg.
Some vegetation was present on the west portion of the deposit, along the Arkansas River. Grasses were
observed in the low area adjacent to California Gulch.
Deposit AD is ten feet from the west bank of the Arkansas River across the river from the
California Gulch inflow. The 34,977 ft2 area is covered with orange stained and unstained cobbles. Salts
were present on the surface in some areas. Samples from this deposit had average concentrations of the
following metals: cadmium, 115 mg/kg; copper, 120 mg/kg; lead, 520 mg/kg; and zinc, 1,900 mg/kg.
Sparsely scattered clumps of grass were present, however the deposit is primarily non-vegetated.
Deposit AE is located on the west side of Deposit AD, west of the Arkansas River, approximately
100 feet from the riverbank. It contains approximately 146,313 ft3 of mine-waste over an area of
approximately 103,280 ft2, and has an average mine-waste depth of 1.4 ft. Samples from this deposit had
J:\010004\Task 3 - SCR\Appendices\App_D_Ch2MWD.doc D-l
average concentrations of the following metals: cadmium, 414 mg/kg; copper, 698 mg/kg; lead, 8,402
mg/kg; and zinc, 26,433 mg/kg. The deposit had sparse grass and signs of dead grass and willows. There
was a thick layer of salt over most of the deposit.
Deposit AG is located on the east side of the Arkansas River adjacent to the river, and, at the
northern tip, is in contact with the riverbank. Orange stained cobble separates mine-waste material from
the river. Deposit AG has an average mine-waste depth of 0.5 ft. Samples from this deposit had average
concentrations of the following metals: cadmium, 105 mg/kg; copper, 857 mg/kg; lead, 5,400 mg/kg; and
zinc, 16,600 mg/kg. Some grass and willows were observed on the deposit and some willows were dead.
Active erosion of the area along the riverbank was noted.
Deposit AH is located on the east side of the Arkansas River and comprises a portion of the bank.
It contains approximately 12,893 ft3 of mine-waste over an area of approximately 14,066 ft2, and has an
average mine-waste depth of 0.9 ft. Samples from this deposit had average concentrations of the
following metals: cadmium, 95 mg/kg; copper, 290 mg/kg; lead, 3,400 mg/kg; and zinc, 2,000 mg/kg.
Healthy vegetation was observed in the east portion of the deposit and dead vegetation was noted on the
west portion of the deposit. Some salts were observed on the surface.
Deposit AI is located on the east side of the Arkansas River and comprises a portion of the bank.
It contains approximately 29,167 ft3 of mine-waste over an area of approximately 25,455 ft2, and has an
average mine-waste depth of 1.1 ft. Samples from this deposit had average concentrations of the
following metals: cadmium, 208 mg/kg; copper, 88 mg/kg; lead, 2,095 mg/kg; and zinc, 3,900 mg/kg.
Vegetation was noted over most of the deposit, but there were some dead willows.
Deposit AJ is located east of the Arkansas River under power lines and away from the river. It
contains approximately 6,786 ft3 of mine-waste over an area of approximately 9,580 ft2, and has an
average mine-waste depth of 0.7 ft. Samples from this deposit had average concentrations of the
following metals: cadmium, 95 mg/kg; copper, 1,200 mg/kg; lead, 6,500 mg/kg; and zinc, 2,500 mg/kg.
There are some salts on the surface. The deposit was mostly barren, but several clumps of grass were
seen. There were no visible signs of erosion. The deposit appeared to be impacted by livestock.
Deposit BB is located on the west side of the Arkansas River and comprises a portion of the bank.
It contains approximately 9,517 ft3 of mine-waste over an area of approximately 11,714 ft2, and has an
average mine-waste depth of 0.8 ft. Samples from this deposit had average concentrations of the
following metals: cadmium, 85 mg/kg; copper, 228 mg/kg; lead, 5,350 mg/kg; and zinc, 1,135 mg/kg.
Vegetation was noted in low-lying areas of the deposit. Signs of erosion were observed.
J:\010004\Task 3 - SCR\Appendices\App_D_Ch2MWD.doc D-2
Deposit CA is located on the east side of the Arkansas River and comprises a portion of the bank.
It contains approximately 28,123 ft3 of mine-waste over an area of approximately 38,204 ft2, and has an
average mine-waste depth of 0.7 ft. Samples from this deposit had average concentrations of the
following metals: cadmium, 115 mg/kg; copper, 55 mg/kg; lead, 5,800 mg/kg; and zinc, 3, 100 mg/kg. A
cut bank, approximately 3.5 to 4 feet, showed erosion of mine-waste material into the river. Erosion
channels in the deposit were an indication of erosional activity. Dead willows and limited grass were
noted on the deposit.
Deposit CC is located on the west side of the Arkansas River and is approximately 100 feet back
from the riverbank. It contains approximately 16,792 ft3 of mine-waste over an area of approximately
16,792 ft2, and has an average mine-waste depth of 1.0 ft. Samples from this deposit had average
concentrations of the following metals: cadmium, 85 mg/kg; copper, 1,100 mg/kg; lead, 4,800 mg/kg;
and zinc, 4,400 mg/kg. Dead vegetation was noted on the deposit.
Deposit CD is located on the east side of the Arkansas River and comprises a portion of the bank.
It contains approximately 71,571 ft3 of mine-waste over an area of approximately 71,571 ft2, and has an
average mine-waste depth of 1.0 ft. Samples from this deposit had average concentrations of the
following metals: cadmium, 517 mg/kg; copper, 867 mg/kg; lead, 9,080 mg/kg; and zinc, 41,000 mg/kg.
A two- to three-foot eroding cut bank was observed adjacent to the river. The deposit contained little
vegetation, but some grass was present in the low areas, and willows surround the deposit.
Deposit CE is located on the west side of the Arkansas River and comprises a portion of the bank.
Mine-waste material continues into a heavily vegetated deposit, which was sampled but not included in
the calculation of mine-waste volume. Within the heavily vegetated area is a small, unvegetated area that
was included in Deposit CE. It contains approximately 19,756 ft3 of mine-waste over an area of
approximately 24,146 ft2, and has an average mine-waste depth of 0.8 ft. Samples from this deposit had
average concentrations of the following metals: cadmium, 232 mg/kg; copper, 282 mg/kg; lead, 3,251
mg/kg; and zinc, 2,621 mg/kg. Grasses were noted in low areas and willows surrounded the deposit, but
most of the deposit was not vegetated. A cut bank was observed along tributaries on the north, east, and
south boundaries of the deposit.
Deposit CF is located west of the Arkansas River. It contains approximately 2,665 ft3 of mine-
waste over an area of approximately 5,329 ft2, and has an average mine-waste depth of 0.5 ft. Samples
from this deposit had average concentrations of the following metals: cadmium, 120 mg/kg; copper, 300
mg/kg; lead, 8,500 mg/kg; and zinc, 980 mg/kg.
J:\010004\Task 3 - SCR\Appendices\App_D_Ch2MWD.doc D-3
Deposit CG is located west of the Arkansas River. It contains approximately 6,480 ft3 of mine-
waste over an area of approximately 12,959 ft2, and has an average mine-waste depth of 0.5 ft. Samples
from this deposit had average concentrations of the following metals: cadmium, 115 mg/kg; copper, 55
mg/kg; lead, 2,700 mg/kg; and zinc, 440 mg/kg. The deposit consists of sand and cobbles mixed with
mine-waste.
Deposit CJ is located east of the Arkansas River directly south of die drainage ditch on the south
end of Deposit CD. It contains approximately 20,947 ft3 of mine-waste over an area of approximately
20,947 ft2, and has an average mine-waste depth of 1.0 ft. Samples from this deposit had average
concentrations of the following metals: cadmium, 338 mg/kg; copper, 178 mg/kg; lead, 8,015 mg/kg; and
zinc, 6,615 mg/kg. Mine-waste material is layered over pyrite in this deposit. Dead vegetation was
noted.
Deposit CK is located east of the Arkansas River and comprises a portion of the bank. It contains
approximately 28,927 ft3 of mine-waste over an area of approximately 13,351 ft2, and has an average
mine-waste depth of 2.2 ft. Samples from this deposit had average concentrations of the following
metals: cadmium, 100 mg/kg; copper, 60 mg/kg; lead, 1,075 mg/kg; and zinc, 200 mg/kg. Dead
vegetation was noted on the deposit.
Deposit CL is located east of the Arkansas River, and the northern tip is in contact with the river.
It contains approximately 154,281 ft3 of mine-waste over an area of approximately 106,026 ft2, and has an
average mine-waste depth of 1.5 ft. Samples from this deposit had average concentrations of the
following metals: cadmium, 175 mg/kg; copper, 917 mg/kg; lead, 3,108 mg/kg; and zinc, 16,105 mg/kg.
Most of the deposit was not vegetated and dead willows and grass were noted. Low areas contained
grasses and some willows. Erosion channels and a 1.5- to 3-foot cut bank were observed as signs of
erosion.
Deposit CN is located on the east side of the Arkansas River and is actually a part of Deposit CO.
It was studied separately from deposit CO because it is on property of a different landowner. Deposit CN
contains approximately 29,024 ft3 of mine-waste over an area of approximately 17,415 ft2, and has an
average mine-waste depth of 1.7 ft. Samples from this deposit had average concentrations of the
following metals: cadmium, 85 mg/kg; copper, 185 mg/kg; lead, 1,776 mg/kg; and zinc, 1,670 mg/kg.
There was a two-foot cut bank observed adjacent to standing water on the northern boundary. The
deposit was not vegetated and was covered with salts.
J:\OI0004\Task 3 - SCR\Appendiccs\App_D_Ch2MWD.doc D-4
Deposit CO is located on the east side of the Arkansas River adjacent to the river. It contains
approximately 83,464 ft3 of mine-waste over an area of approximately 102,011 ft2, and has an average
mine-waste depth of 0.8 ft. Samples from this deposit had average concentrations of the following
metals: cadmium, 244 mg/kg; copper, 956 mg/kg; lead, 1,936 mg/kg; and zinc, 6,227 mg/kg. The visible
signs of erosion included cut banks and erosion channels. The deposit was not vegetated except for small
amounts of grass along a tributary north of the site. Dead vegetation was noted throughout the deposit
and salts were observed on the surface.
Deposit CP is a small deposit located on the west bank of the Arkansas River. It contains
approximately 712 ft3 of mine-waste over an area of approximately 5,698 ft2, and has an average mine-
waste depth of 0.1 ft. Samples from this deposit had average concentrations of the following metals:
cadmium, 100 mg/kg; copper, 293 mg/kg; lead, 2,533 mg/kg; and zinc, 1,210 mg/kg. There are finger-
like deposits extending into the vegetation. The deposit had some vegetation noted on both sides of the
ditch. The mine-wastes are sandy and salts were visible on the surface.
Deposit CR is located on the east side of the Arkansas River. It contains approximately 36,876
ft3 of mine-waste over an area of approximately 39,091 ft2, and has an average mine-waste depth of 0.9 ft.
Samples from this deposit had average concentrations of the following metals: cadmium, 111 mg/kg;
copper, 391 mg/kg; lead, 1,622 mg/kg; and zinc, 4,383 mg/kg. The deposit had both live and dead
vegetation. Willows were observed growing in shallow mine-waste material and salts were observed on
the surface.
Deposit CS is located on the east side of the Arkansas River at the confluence with Lake Fork
Creek. Mine-waste material is separated from the river by a retaining wall. Deposit CS contains
approximately 60,386 ft3 of mine-waste over an area of approximately 38,414 ft2, and has an average
mine-waste depth of 1.6 ft. Samples from this deposit had average concentrations of the following
metals: cadmium, 208 mg/kg; copper, 431 mg/kg; lead, 2,926 mg/kg; and zinc, 9,990 mg/kg. The
deposit had abundant vegetation in the southwest corner. Dead willows were noted, but some dead
willow clumps contained new growth. Grasses were observed at the edges of the deposit.
Reach 2 Mine-Waste Deposits
Deposit FA is located on the east side of the Arkansas River approximately 200 feet back from
the river, just south of the confluence with Lake Fork Creek. It contains approximately 13,507 ft3 of
mine-waste over an area of approximately 50,873 ft2, and has an average mine-waste depth of 0.3 ft.
Samples from this deposit had average concentrations of the following metals: cadmium, 133 mg/kg;
J:\010004\Task 3 - SCR\Appcndices\App_D_Ch2MWD.doc D-5
copper, 676 mg/kg; Lead, 3,245 mg/kg; and zinc, 6,413 mg/kg. Heavy surface salts were observed. The
deposit was primarily non-vegetated, but there were live willows surrounding the deposit.
Deposit FB is located on the east side of the Arkansas River and comprises a portion of the bank
of the river. It contains approximately 33,329 ft3 of mine-waste over an area of approximately 107,628
ft2, and has an average mine-waste depth of 0.3 ft. Samples from this deposit had average concentrations
of the following metals: cadmium, 88 mg/kg; copper, 848 mg/kg; lead, 4,062 mg/kg; and zinc, 6,020
mg/kg. The deposit was primarily non-vegetated and dead willows were observed, but the south end of
the deposit contained live grasses and willows. Heavy salts were observed on the surface.
Deposit FC is located on the east side of the Arkansas River adjacent to the river. It contains
approximately 3,750 ft3 of mine-waste over an area of approximately 12,693 ft2, and has an average mine-
waste depth of 0.3 ft. This deposit was not sampled. There were many isolated mine-wastes in thick
willows.
Deposit FD is located on the east side of the Arkansas River adjacent to the river. It contains
approximately 659 ft3 of mine-waste over an area of approximately 1,759 ft2, and has an average mine-
waste depth of 0.4 ft. This deposit was not sampled. The deposit has cobbles and grass surrounding
mine-waste.
Deposit FE is located on the east side of the Arkansas River, comprises a portion of the bank of
the river, and curves to the southeast. It contains approximately 239 ft3 of mine-waste over an area of
approximately 957 ft2, and has an average mine-waste depth of 0.3 ft. Samples from this deposit had
average concentrations of the following metals: cadmium, 95 mg/kg; copper, 55 mg/kg; lead, 85 mg/kg;
and zinc, 460 mg/kg. The mine-waste is under approximately 2.5 feet of soil and was only observable on
the cut bank.
Deposit FF is located on the east side of the Arkansas River, comprises a portion of the bank of
the river, and is adjacent to an irrigation ditch. The mine-waste appears to have been deposited from the
irrigation ditch rather than from the river. It contains approximately 4,285 ft3 of mine-waste over an area
of approximately 18,698 ft2, and has an average mine-waste depth of 0.2 ft. Samples from this deposit
had average concentrations of the following metals: cadmium, 305 mg/kg; copper, 165 mg/kg; lead,
2,725 mg/kg; and zinc, 955 mg/kg. The center of deposit FF had dead vegetation, and salts were present.
The edges of the deposit were heavily vegetated with willows and grasses.
J:\010004\Task 3 - SCR\Appendices\App_D_Ch2MWD.doc D-6
Deposit FG is on an island with abundant vegetation. Samples from this deposit had average
concentrations of the following metals: cadmium, 95 mg/kg; copper, 55 mg/kg; lead, 2,300 mg/kg; and
zinc, 1,000 mg/kg. The mine-waste material has an average mine-waste depth of 0.1 feet.
Deposit FH is located on the west side of the Arkansas River, adjacent to the river. It contains
approximately 89 ft3 of mine-waste over an area of approximately 533 ft2, and has an average mine-waste
depth of 0.2 ft. Samples were not collected from deposit FH because of the small area.
Deposit FI is located on the east side of the Arkansas River on the riverbank. Mine-waste
material was observed in the cut bank under four inches of organic material. Samples from this deposit
had average concentrations of the following metals: cadmium, 95 mg/kg; copper, 55 mg/kg; lead, 680
mg/kg; and zinc, 955 mg/kg.
Deposit FJ is located on the west side of the Arkansas River and comprises a portion of the bank
of the river. It contains approximately 7,918 ft3 of mine-waste over an area of approximately 14,152 ft2,
and has an average mine-waste depth of 0.6 ft. Samples from this deposit had average concentrations of
the following metals: cadmium, 230 mg/kg; copper, 220 mg/kg; lead, 9,700 mg/kg; and zinc, 3,200
mg/kg. Grasses and willows were observed on the west edge of the deposit. The deposit had a one-foot
cut bank. Salts were visible in non-vegetated areas.
Deposit FL is on an island in the Arkansas River. This deposit is well vegetated and the
vegetation has good root development. It contains approximately 590 ft3 of mine-waste over an area of
approximately 884 ft2, and has an average mine-waste depth of 0.7 ft. Samples from this deposit had
average concentrations of the following metals: cadmium, 190 mg/kg; copper, 190 mg/kg; lead, 2,700
mg/kg; and zinc, 1,500 mg/kg.
Deposit FM is located on the west side of the Arkansas River and comprises a portion of the bank
of the river. It contains approximately 12,965 ft3 of mine-waste over an area of approximately 27,726 ft2,
and has an average mine-waste depth of 0.5 ft. Samples from this deposit had average concentrations of
the following metals: cadmium, 270 mg/kg; copper, 231 mg/kg; lead, 10,000 mg/kg; and zinc, 9,350
mg/kg. The deposit was not vegetated and had signs of heavy cattle trampling. There was a cut bank by
the river.
Deposit FN is located on the east side of the Arkansas River and comprises a portion of the bank
of the river. It contains approximately 5,516 ft3 of mine-waste over an area of approximately 5,928 ft2,
and has an average mine-waste depth of 0.9 ft. Samples from this deposit had average concentrations of
J:\OI0004\Task 3 - SCR\Appendices\App_D_Ch2MWD.doc D-7
the following metals: cadmium, 95 mg/kg; copper, 140 mg/kg; lead, 1,400 mg/kg; and zinc, 900 mg/kg.
There were grasses on the stream bank and a few willows on the edges of the deposit. There was a one-
foot cut bank.
Deposit FO is located on the east side of the Arkansas River. It contains unknown depths of
mine-waste mixed with cobble over an area of approximately 5,279 ft2. Deposit FO was not sampled
because of the large amount of cobbles.
Deposit GA is located on the west side of the Arkansas River twenty feet from the river. It
contains approximately 7900 ft3 of mine-waste over an area of approximately 2,032 ft2, and has an
average mine-waste depth of 0.4 ft. Samples from this deposit had average concentrations of the
following metals: cadmium, 95 mg/kg; copper, 285 mg/kg; lead, 3,133 mg/kg; and zinc, 6,767 mg/kg.
Deposit GA is surrounded by an irrigation ditch. This deposit was well vegetated with some bare zones.
Cattle have trampled portions of area.
Deposit GB is located on the east side of the Arkansas River adjacent to the river, and consists of
a one-foot-thick band of mine-waste along a 2.5-foot cut bank. It contains approximately 554 ft3 of mine-
waste over an area of approximately 391 ft2, and has an average mine-waste depth of 1.4 ft. There are no
analytical data characterizing the metal concentrations associated with the mine-waste in deposit GB.
The deposit had good vegetation cover. The visible signs of erosion included a cut bank susceptible to
erosion during high flow events.
Deposit GC is located on the west side of the Arkansas River 25 feet from the riverbank. It
covers approximately 1,754 ft2. The deposit contains piles of dredged cobble mixed with mine-waste.
Mine-waste was also evident eight inches below ground surface in the river cut. There were no analytical
data characterizing the metal concentrations associated with the mine-waste deposit.
Deposit GE is located on the east side of the Arkansas River and comprises a portion of the bank
of the river. It contains approximately 4,111 ft3 of mine-waste over an area of approximately 3,523 ft2,
and has an average mine-waste depth of 1.2 ft. Samples from this deposit had average concentrations of
the following metals: cadmium, 95 mg/kg; copper, 210 mg/kg; lead, 2,700 mg/kg; and zinc, 1,000 mg/kg.
The deposit has minimal grassy vegetation. There was visible erosion of a two-foot cut bank.
Deposit GH is located on the west side of the Arkansas River 10 feet from the riverbank. It
contains approximately 2,110 ft3 of mine-waste over an area of approximately 3,014 ft2, and has an
average mine-waste depth of 0.7 ft. Samples from this deposit had average concentrations of the
J:\OI0004\Task 3 - SCR\Appendices\App_D_Ch2MWD.doc D-8
following metals: cadmium, 95 mg/kg; copper, 55 mg/kg; lead, 350 mg/kg; and zinc, 310 mg/kg. The
deposit had visible signs of erosion, including a drainage that runs along the east bank of the deposit.
There were signs of cattle trampling through the deposit.
Deposit GI is located on the east side of the Arkansas River and comprises a portion of the bank
of the river. It contains approximately 5,491 ft3 of mine-waste over an area of approximately 9,414 ft2,
and has an average mine-waste depth of 0.6 ft. Samples from this deposit had average concentrations of
the following metals: cadmium, 95 mg/kg; copper, 55 mg/kg; lead, 1,600 mg/kg; and zinc, 840 mg/kg.
The deposit was surrounded by good vegetation cover, but there were signs of cattle trampling that may
have reduced plant cover.
Deposit GJ is located on the west side of the Arkansas River. This deposit consists of an
intermittent series of mine-waste deposits along a cut bank on the western side of the Arkansas River. It
contains approximately 74 ft3 of mine-waste over an area of approximately 588 ft2, and has an average
mine-waste depth of 0.1 ft. There are no analytical data that characterize the metals concentrations
contained within this mine-waste deposit. The deposit had good vegetation cover.
Deposit GK is the downstream end of an island located near the west side of the Arkansas River.
It contains approximately 994 ft3 of mine-waste over an area of approximately 1,884 ft2, and has an
average mine-waste depth of 0.5 ft. There are no analytical results for this deposit. The deposit had dead
vegetation and there were salts visible on the surface. Erosion was observed in the deposit.
Deposit GL is located on the west side of the Arkansas River 60 feet from the riverbank. It
contains approximately 2,590 ft3 of mine-waste over an area of approximately 3,532 ft2, and has an
average mine-waste depth of 0.7 ft. Samples from this deposit had average concentrations of the
following metals: cadmium, 203 mg/kg; copper, 153 mg/kg; lead, 6,300 mg/kg; and zinc, 9,600 mg/kg.
The deposit had some salt deposits present on the surface.
Deposit GM is located on the east side of the Arkansas River, comprises a portion of the bank of
the river, and consists of a band of mine-waste occupying the cut bank adjacent to the river. It contains
approximately 652 ft3 of mine-waste over an area of approximately 2,609 ft2, and has an average mine-
waste depth of 0.3 ft. Samples from this deposit had average concentrations of the following metals:
cadmium, 260 mg/kg; copper, 370 mg/kg; lead, 9,200 mg/kg; and zinc, 9,800 mg/kg. The deposit had
abundant vegetation on the surface. The visible signs of erosion included a cut bank.
J:\010004\Task 3 - SCR\Appendices\App_D_Ch2MWD.doc D-9
Deposit GN is located in the center of an island in the Arkansas River. It contains approximately
497 ft3 of mine-waste over an area of approximately 1,988 ft2, and has an average mine-waste depth of 0.3
ft. There are no analytical data characterizing the metals concentrations of the mine-waste materials in
this deposit. The deposit had some vegetation, and the mine-waste were well mixed with river sands.
Some salts were observed on the surface vegetation.
Deposit HA is located on the west side of the Arkansas River approximately 40 feet from the
riverbank. Deposit HA contains approximately 9,297 ft3 of mine-waste over an area of approximately
12,873 ft2, and has an average mine-waste depth of 0.7 ft. Samples from this deposit had average
concentrations of the following metals: cadmium, 95 mg/kg; copper, 55 mg/kg; lead, 3,400 mg/kg; and
zinc, 2,900 mg/kg. The deposit had sparse vegetation cover with no visible sign of current erosion in this
deposit.
Deposit HB is located on an island occupying the middle of the Arkansas River. It contains
approximately 244 ft3 of mine-waste over an area of approximately 1,099 ft2, and has an average mine-
waste depth of 0.2 ft. The mine-waste is a four-inch deposit under approximately five inches of topsoil.
Samples from this deposit had average concentrations of the following metals: cadmium, 78 mg/kg;
copper, 120 mg/kg; lead, 1,350 mg/kg; and zinc, 800 mg/kg. The deposit had some grass and willows
present.
Deposit HD is located on the east side of the Arkansas River and comprises a portion of the bank
of the river. It contains approximately 1,182 ft3 of mine-waste over an area of approximately 2,703 ft2,
and has an average mine-waste depth of 0.4 ft. There was an eight-inch layer of mine-waste over river
gravel at the cut bank. Samples from this deposit had average concentrations of the following metals:
cadmium, 95 mg/kg; copper, 120 mg/kg; lead, 2,500 mg/kg; and zinc, 1,300 mg/kg. The deposit had poor
vegetation cover. The visible signs of erosion include a cut bank and material eroding into a field
adjacent to the deposit.
Deposit HE is located on the west side of the Arkansas River and comprises a portion of the bank
of the river. It contains approximately 1,818 ft3 of mine-waste over an area of approximately 6,981 ft2.
The mine-wastes are well mixed with river gravels to a depth of approximately 0.3 feet. Samples from
this deposit had average concentrations of the following metals: cadmium, 95 mg/kg; copper, 130 mg/kg;
lead, 1,100 mg/kg; and zinc, 510 mg/kg. The deposit was vegetated with grass and willows and showed
signs of cattle trampling. There was little evidence of erosion.
J:\010004\Task 3 - SCR\Appendices\App_D_Ch2MWD.doc D-10
Deposit HI is located on the west side of the Arkansas River adjacent to the river. It contains
approximately 21,931 ft3 of mine-waste over an area of approximately 21,338 ft2, and has an average
mine-waste depth of 1.0 ft. Samples from this deposit had average concentrations of the following
metals: cadmium, 240 mg/kg; copper, 130 mg/kg; and zinc, 13,000 mg/kg. The deposit is sparsely
vegetated. Deposit HI is located on the inside of a river bend and did not show evidence of active
erosion. The deposit had sparse grasses and contained many cobbles on the surface.
Deposit HK is located on the west side of the Arkansas River and comprises a portion of the bank
of the river. It contains approximately 11,647 ft3 of mine-waste over an area of approximately 13,439 ft2,
and has an average mine-waste depth of 0.9 ft. Samples from this deposit had average concentrations of
the following metals: cadmium, 95 mg/kg; copper, 300 mg/kg; lead, 1,600 mg/kg; and zinc, 2,200 mg/kg.
The deposit is poorly vegetated. The visible signs of erosion included an actively eroding one-foot cut
bank.
Deposit LA is located on the east side of the Arkansas River and comprises a portion of the bank
of the river. It contains approximately 5,713 ft3 of mine-waste over an area of approximately 6,634 ft2,
and has an average mine-waste depth of 0.9 ft. Samples from this deposit had average concentrations of
the following metals: cadmium, 210 mg/kg; copper, 55 mg/kg; lead, 3,800 mg/kg; and zinc, 750 mg/kg.
The deposit had little vegetation. The visible signs of erosion included a one-foot cut bank.
Deposit 1C is located on the west side of the Arkansas River and comprises a portion of the bank
of the river, but is separated from the river by cobble and vegetation. It contains approximately 14,493 ft3
of mine-waste over an area of approximately 13,378 ft2, and has an average mine-waste depth of 1.1 ft.
Samples from this deposit had average concentrations of the following metals: cadmium, 95 mg/kg;
copper, 130 mg/kg; lead, 1,000 mg/kg; and zinc, 680 mg/kg. The deposit had no vegetation cover.
Deposit KK is located on the west side of the Arkansas River 10 feet from the river channel, and
comprises a portion of the bank of the river. It contains approximately 1,886 ft3 of mine-waste over an
area of approximately 9,052 ft2, and has an average mine-waste depth of 0.2 ft. Samples from this deposit
had average concentrations of the following metals: cadmium, 148mg/kg; copper, 185 mg/kg; lead, 2,350
mg/kg; and zinc, 1,250 mg/kg. The deposit had sparse vegetation cover.
Deposit KL is located on the banks of a drainage ditch located on the west side of the Arkansas
River. It contains approximately 56,909 ft3 of mine-waste over an area of approximately 37,250 ft2, and
has an average mine-waste depth of 1.5 ft. Samples from this deposit had average concentrations of the
following metals: cadmium, 228 mg/kg; copper, 218 mg/kg; lead, 4,783 mg/kg; and zinc, 4,360 mg/kg.
J:\010004\Task 3 - SCR\Appendices\App_D_Ch2MWD.doc D-l 1
The deposit had sparse vegetation cover. The visible signs of erosion included a two-foot cut bank along
the drainage ditch. Evidence of cattle trampling was observed.
Reach 3 Mine-Waste Deposits
Deposit LA is located approximately 100 feet east of the Arkansas River at the base of the
Highway 24 overpass. It contains approximately 3,626 ft3 of mine-waste over an area of approximately
6,217 ft2 and has an average mine-waste depth of 0.6 ft. Samples from this deposit had average
concentrations of the following metals: cadmium, 260; copper, 260; lead, 5,600 mg/kg and zinc, 12,000
mg/kg. Little vegetation was observed on the deposit. Mine-wastes were visible at the south end of the
deposit, while stained sand and cobble dominated the north end of the deposit.
Deposit LB is located on the east side of the Arkansas River and comprises a portion of the
riverbank at the base of the Highway 24 overpass. It contains approximately 11,019 ft3 of mine-waste
over an area of approximately 12,796 ft2, and has an average mine-waste depth of 0.9 ft. Samples from
this deposit had average concentrations of the following metals: cadmium, 275; copper, 210; lead, 3,300
mg/kg and zinc, 10,450 mg/kg. No vegetation was observed on the deposit, but grasses surrounded the
area. Salts were observed on the surface. The deposit has a cut bank up to five feet high. Portions of the
cut bank contained mine-waste.
Deposit LC is located on the west bank of the Arkansas River at the base of the Highway 24
overpass. It is separated from the river by a narrow strip of grass, willows, and cobble. It contains
approximately 24,275 ft3 of mine-waste over an area of approximately 44,388 ft2 and has an average
mine-waste depth of 0.5 ft. Samples from this deposit had concentrations of the following metals:
cadmium, 374 mg/kg; copper, 434 mg/kg; lead, 4,680 mg/kg; and zinc, 48,320 mg/kg. Thick salts were
present on the surface. Some grasses were observed in sections of the deposit without surface salts.
Grasses and willows were present adjacent to the deposit and between the deposit and the Arkansas River.
Samples collected from deposit LC showed soil pH from 1.8 to 5.0.
Deposit LD is located on the west side of the Arkansas River and comprises a portion of the
riverbank. It contains approximately 8,419 ft3 of mine-waste over an area of approximately 21,649 ft2,
and has an average mine-waste depth of 0.4 ft. Samples from this deposit had average concentrations of
the following metals: cadmium, 74 mg/kg; copper, 226 mg/kg; lead, 1,856 mg/kg; and zinc, 2,792 mg/kg.
The deposit consists primarily of stained cobble and gravel mixed with mine-waste, but has mine-waste in
thicker amounts around the edges. The deposit is surrounded by a dense grassy area. There were dead
J:\Ol0004\Task 3 - SCR\Appendices\App_D_Ch2MVVD.doc D-12
willows and salts on the surface of the deposit. Samples collected from deposit LD showed soil pH from
3.5 to 5.6.
Deposit LG is located south of an orange stained cobble and sand deposit east of the Arkansas
River. It contains approximately 235 ft3 of mine-waste over an area of approximately 352 ft2, and has an
average mine-waste depth of 0.7 ft. Samples from this deposit had average concentrations of the
following metals: cadmium, 190 mg/kg; copper, 200 mg/kg; lead, 5,300 mg/kg; and zinc, 7,700 mg/kg.
The deposit was barren, and some salts were present on the adjacent cobble and sand. One sample from
deposit LG showed a soil pH of 1.5.
Deposit LH is located east of the Arkansas River. The deposit is separated from the small stream
by a low grassy area. It contains approximately 3,619 ft3 of mine-waste over an area of approximately
16,287 ft2, and has an average mine-waste depth of 0.2 ft. Samples from this deposit had average
concentrations of the following metals: cadmium, 48 mg/kg; copper, 480 mg/kg; lead, 3,500 mg/kg; and
zinc, 7,700 mg/kg. Salts were present on drier sections of the deposit. There were signs of cattle
trampling present. One sample from deposit LH showed a soil pH of 5.3.
Deposit LI is located along the east bank of the Arkansas River and comprises a portion of the
riverbank. It contains approximately 11,401 ft3 of mine-waste over an area of approximately 11,214 ft2,
and has an average mine-waste depth of 1.0 ft. Samples from this deposit had average concentrations of
the following metals: cadmium, 269 mg/kg; copper, 345 mg/kg; lead, 2,500 mg/kg; and zinc, 11,400
mg/kg. There were indications of heavy cattle use, including a well-worn cattle path. Salts were present
on the surface, and dead willow clumps were present. A one- to two-foot cut bank on the Arkansas River
is located over part of the west edge of the deposit. Samples collected from deposit LI showed soil pH
from 4.0 to 5.2.
Deposit LK is located on the west side of the Arkansas River and is partly in contact with the
river by an area of grass and willows. It contains approximately 7,649 ft3 of mine-waste over an area of
approximately 17,765 ft2, and has an average mine-waste depth of 0.4 ft. Samples from this deposit had
average concentrations of the following metals: cadmium, 84 mg/kg; copper, 643 mg/kg; lead, 2,433
mg/kg; and zinc, 3,133 mg/kg. The deposit contained stained cobble and gravel in the center of the
deposit, but mine-waste are on the surface around the cobble and gravel. The deposit is surrounded by
grasses and willows. Dead willows and light salts were observed on the surface. Samples collected from
deposit LK showed soil pH from 2.5 to 4.1.
J:\010004\Task 3 - SCR\Appcndices\App_D_Ch2MWD.doc D-13
Deposit LL is located to the west of the Arkansas River. The center of the deposit is primarily
stained cobble, willows, and grasses. Mine-wastes are located on the north and south ends of the cobbled
area. It contains approximately 3,483 ft3 of mine-waste over an area of approximately 5,224 ft and has
an average mine-waste depth of 0.7 ft. Samples from this deposit had average concentrations of the
following metals: cadmium, 74 mg/kg; copper, 287 mg/kg; lead, 3,767 mg/kg; and zinc, 830 mg/kg.
Some salts were present on the cobbled area near willows and grass. The stream bank was stabilized with
grasses. The area is surrounded by dense grass and willows. Samples collected from deposit LL showed
soil pH from 2.7 to 3.3.
Deposit LM is located along the east bank of the Arkansas River. It contains approximately
20,744 ft3 of mine-waste over an area of approximately 16,377 ft2, and has an average mine-waste depth
of 1.3 ft. Samples from this deposit had average concentrations of the following metals: cadmium, 152
mg/kg; copper 425 mg/kg; lead, 7,300 mg/kg; and zinc, 5,273 mg/kg. Clumps of grasses were growing
on the southern most section of the deposit, but the rest of the deposit was non-vegetated. Salts were
observed on the surface. The deposit has a cut bank on the Arkansas River. Samples collected from
deposit LM showed soil pH from 3.2 to 5.3.
Deposit LN is located to the east of the Arkansas River. It contains approximately 41,880 ft3 of
mine-waste over an area of approximately 45,985 ft2, and has an average mine-waste depth of 0.9 ft.
Samples from this deposit had average concentrations of the following metals: cadmium, 575 mg/kg;
copper, 455 mg/kg; lead, 11,525 mg/kg; and zinc, 34,973 mg/kg. The center of the deposit is primarily
stained cobble and sand with mine-waste along the edges. Grasses have encroached on the mine-waste
along the eastern edge of the deposit. Sporadic grass clumps were observed in a small section near the
western boundary of the deposit, and a grass area defined the western edge of the deposit. There were
signs of cattle trampling on the deposit. Samples collected from deposit LB showed soil pH from 2.2 to
4.9.
Deposit LO is located to the east of the Arkansas River. It contains approximately 23,498 ft3 of
mine-waste over an area of approximately 20,349 ft2, and has an average mine-waste depth of 1.2 ft.
Samples from this deposit had average concentrations of the following metals: cadmium, 128 mg/kg;
copper, 487 mg/kg; lead, 3,133 mg/kg; and zinc, 6,200 mg/kg. The deposit has stained cobble and sand
in the center, with mine-waste at the north and east ends. Some grasses were observed on the deposit.
The creek bank was stabilized with grasses except for a cattle-crossing area at the north end. There were
signs of surface erosion. Samples collected from deposit LO showed soil pH from 3.4 to 4.8.
J:\OI0004\Task 3 - SCR\Appendices\App_D_Ch2MVVD.doc D-14
Deposit LP is located east of the Arkansas River. It contains approximately 8,390 ft3 of mine-
waste over an area of approximately 15,794 ft2 and has an average mine-waste depth of 0.5 ft. Samples
from this deposit had average concentrations of the following metals: cadmium, 119 mg/kg; copper, 280
mg/kg; lead, 1,950 mg/kg and zinc, 14,800 mg/kg. The stream bank was vegetated with grasses. The
eastern section of the deposit had mine-waste at the surface. The area had signs of extensive cattle
activity. Salts were observed on the surface. Samples collected from deposit LP showed soil pH from 2.9
to 4.7.
Deposit LQ is located east of the Arkansas River. It contains approximately 6,152 ft3 of mine-
waste over an area of approximately 5,906 ft2, and has an average mine-waste depth of 1.0 ft. Samples
from this deposit had average concentrations of the following metals: cadmium, 99 mg/kg; copper, 377
mg/kg; lead, 4,125 mg/kg; and zinc, 6,525 mg/kg. There is a 1.5-foot cut bank along the stream bank;
some of the stream bank is stabilized with grasses. Cattle tracks and salts were observed on the surface.
Samples collected from deposit LQ showed soil pH from 2.7 to 5.0.
Deposit LR is a small deposit located east of the Arkansas River. It contains approximately 1,444
ft3 of mine-waste over an area of approximately 1,155 ft2, and has an average mine-waste depth of 1.3 ft.
Samples from this deposit had average concentrations of the following metals: cadmium, 48 mg/kg;
copper, 470 mg/kg; lead, 9,900 mg/kg and zinc, 1,800 mg/kg. The creek bank is stabilized with grasses.
Several dead willows were observed on the deposit. Grasses surround the deposit. One sample from
deposit LR showed a soil pH of 3.8.
Deposit LS is located to the east of the Arkansas River. It contains approximately 57,181 ft3 of
mine-waste over an area of approximately 43,272 ft2, and has an average mine-waste depth of 1.3 ft.
Samples from this deposit had average concentrations of the following metals: cadmium, 185 mg/kg;
copper, 345 mg/kg; lead, 4,121 mg/kg; and zinc, 3,664 mg/kg. The deposit was primarily non-vegetated.
Cattle tracks and salts were observed on the surface. Samples collected from deposit LS showed soil pH
from 2.4 to 5.1.
Deposit LT is located east of the Arkansas River. It contains approximately 1,931 ft3 of mine-
waste over an area of approximately 2,970 ft2, and has an average mine-waste depth of 0.7 ft. Samples
from this deposit had average concentrations of the following metals: cadmium, 48 mg/kg; copper, 70
mg/kg; lead, 370 mg/kg; and zinc, 1,200 mg/kg. There is some grass cover throughout the site.
Abundant grass was observed on the stream bank. One sample from deposit LT showed a soil pH of 4.0.
J:\010004\Task 3 - SCR\Appendices\App_D_Ch2MWD.doc D-l 5
Deposit LU is a small deposit located to the west of the Arkansas River. It contains
approximately 336 ft3 of mine-waste over an area of approximately 504 ft2, and has an average mine-
waste depth of 0.7 ft. Samples from this deposit had average concentrations of the following metals:
cadmium, 48 mg/kg; copper, 210 mg/kg; lead, 1,500 mg/kg and zinc, 590 mg/kg. Cattle tracks were
observed on the deposit. One sample from deposit LU showed a soil pH of 2.4.
Deposit LV is located to the east of the Arkansas River. It contains approximately 16,299 ft3 of
mine-waste over an area of approximately 11,041 ft2, and has an average mine-waste depth of 1.5 ft.
Samples from this deposit had average concentrations of the following metals: cadmium, 301 mg/kg;
copper, 533 mg/kg; lead, 2,673 mg/kg; and zinc, 16,728 mg/kg. Grass cover was observed on the stream
bank, except for the western most portion, which has a 1.5- to 2-foot cut bank. Mine-wastes were
observed on the cut bank. The eastern section is primarily cobble in the center, surrounded by mine-
waste. Cattle tracks were observed in the area. Surface salts were observed on the northern most portion
of the deposit. Samples collected from deposit LV showed soil pH from 2.1 to 5.5.
Deposit MA is located on the east bank of the Arkansas River. It contains approximately 1,312
ft3 of mine-waste over an area of approximately 1,049 ft2, and has an average mine-waste depth of 0.5 ft.
Samples from this deposit had average concentrations of the following metals: cadmium, 85 mg/kg;
copper, 140 mg/kg; lead, 1,000 mg/kg and zinc, 3,000 mg/kg. The visible signs of erosion included an
eight-inch cut bank. The deposit had no vegetation, but was surrounded by grasses.
Deposit MB is located to the east of the Arkansas River, comprises a portion of the riverbank, and
extends 250 feet back from the riverbank. It contains approximately 85,765 ft3 of mine-waste over an
area of approximately 31,728 ft2, and has an average mine-waste depth of 1.1 ft. Samples from this
deposit had average concentrations of the following metals: cadmium, 123 mg/kg; copper, 242 mg/kg;
lead, 2,075 mg/kg; and zinc, 6,518 mg/kg. The deposit had no vegetation present. The visible signs of
erosion included a three-foot cut bank. There were some salts observed on the surface.
Deposit ME is located to the east of the Arkansas River. It contains approximately 22,399 ft3 of
mine-waste over an area of approximately 38,398 ft2, and has an average mine-waste depth of 0.6 ft.
Samples from this deposit had average concentrations of the following metals: cadmium, 75 mg/kg;
copper, 120 mg/kg; lead, 3,200 mg/kg and zinc, 880 mg/kg. The deposit had no vegetation present. The
visible signs of erosion included a 1.5-foot cut bank, but in most of the area the tributary bank is
stabilized with grasses.
JAO10004\Task 3 - SCR\Appendices\App_D_Ch2MWD.doc D-16
Deposit MF is located on the east side of the Arkansas River adjacent to the river. It contains
approximately 1,632 ft3 of mine-waste over an area of approximately 1,130 ft2, and has an average mine-
waste depth of 1.4 ft. Samples from this deposit had average concentrations of the following metals:
cadmium, 228 mg/kg; copper, 140 mg/kg; lead, 1,203 mg/kg; and zinc, 11,800. Vegetation in the area
included both live and dead willows, and very little grass. The visible signs of erosion included a 3.5-foot
cut bank. Cattle activity was observed in the area.
Deposit MG is located to the east of the Arkansas River approximately 120 feet from the
riverbank. It contains approximately 9,172 ft3 of mine-waste over an area of approximately 22,661 ft2,
and has an average mine-waste depth of 0.4 ft. Samples from this deposit had average concentrations of
the following metals: cadmium, 300 mg/kg; copper, 170 mg/kg; lead, 3,300 mg/kg and zinc, 930 mg/kg.
The deposit had sparse vegetation.
Deposit MH is located to the east of the Arkansas River. It contains approximately 4,329 ft3 of
mine-waste over an area of approximately 6,835 ft2, and has an average mine-waste depth of 0.6 ft.
Samples from this deposit had average concentrations of the following metals: cadmium, 92 mg/kg;
copper, 188 mg/kg; lead, 4,233 mg/kg and zinc, 2,557 mg/kg. The deposit was surrounded by vegetation
and had a well-vegetated cut bank. Signs of extensive cattle activity were observed.
Deposit MI is located to the east of the Arkansas River. It contains approximately 14,529 ft3 of
mine-waste over an area of approximately 10,170 ft2, and has an average mine-waste depth of 1.4 ft.
Samples from this deposit had average concentrations of the following metals: cadmium, 85 mg/kg;
copper, 65 mg/kg; lead, 1,600 mg/kg and zinc, 380 mg/kg. The deposit contained dead willows and
sparse clumps of grass. There were signs of extensive cattle activity. Salts were observed on the surface.
Deposit MJ is located to the east of the Arkansas River. It contains approximately 2,262 ft3 of
mine-waste over an area of approximately 9,048 ft2, and has an average mine-waste depth of 0.3 ft.
Samples from this deposit had average concentrations of the following metals: cadmium, 80 mg/kg;
copper, 79 mg/kg; lead, 4,150 mg/kg and zinc, 2,350. The deposit contained many cobbles on the
surface. Salts were observed in places and cattle activity was evident.
Deposit MK is located to the east of the Arkansas River. It contains approximately 5,137 ft3 of
mine-waste over an area of approximately 9,943 ft", and has an average mine-waste depth of 0.5 ft.
Samples from this deposit had average concentrations of the following metals: cadmium, 75 mg/kg;
copper, 170 mg/kg; lead, 6,900 mg/kg and zinc, 2,900 mg/kg. The deposit had grass cover and showed
signs of cattle use.
J:\010004\Task 3 - SCR\Appendices\App_D_Ch2MWD.doc D-l 7
Deposit ML is located to the east of the Arkansas River adjacent to the river. It contains
approximately 2,149 ft3 of mine-waste over an area of approximately 3,223 ft2, and has an average mine-
waste depth of 0.7 ft. No samples were collected from this deposit. The deposit had dead grass, and salts
were present. A three-foot cut bank showed signs of active erosion.
Deposit MM is located to the east of the Arkansas River. It contains approximately 11,533 ft3 of
mine-waste over an area of approximately 11,533 ft2, and has an average mine-waste depth of 1.0 ft. The
deposit had some grass cover, but was primarily stained cobble surrounded by sand mixed with mine-
waste over cobble. The deposit was not sampled because of the cobble.
Deposit MN is located to the east of the Arkansas River. It contains approximately 1,296 ft3 of
mine-waste over an area of approximately 5,183 ft2 of organic soil, and has an average depth of 0.3 ft.
Samples from this deposit had average concentrations of the following metals: cadmium, 75 mg/kg;
copper, 46 mg/kg; lead, 1,600 mg/kg and zinc, 15,000 mg/kg. The deposit was well vegetated, except
where trampled by cattle. The mine-waste material is a one-inch lens under about 18 inches of soil.
Deposit MP is located on the west bank of the Arkansas River. It contains approximately 8,000
ft3 of mine-waste over an area of approximately 4,800 ft2, and has an average mine-waste depth of 1.7 ft.
Samples from this deposit had average concentrations of the following metals: cadmium, 89 mg/kg;
copper, 170 mg/kg; lead, 1,160 mg/kg and zinc, 1,677 mg/kg. The deposit has a three-foot cut bank on
the river. Samples collected from deposit MP showed soil pH from 3.2 to 4.5.
Deposit MQ is located on the west bank of the Arkansas River. It contains approximately 85,765
ft3 of mine-waste over an area of approximately 40,307 ft2, and has an average mine-waste depth of 2.1 ft.
Samples from this deposit had average concentrations of the following metals: cadmium, 101 mg/kg;
copper, 313 mg/kg; lead, 1,458 mg/kg; and zinc, 5,798 mg/kg. The deposit is surrounded by standing
water, except for the easternmost boundary, which is the Arkansas River. The northern section of the
oxbow has mine-waste at the surface. Salts and cattle tracks were observed on the surface. The deposit
was primarily non-vegetated, but some grass and willows were observed; the willows showed some new
growth. Cut banks are located on the river and the oxbow channel. Samples collected from deposit MQ
showed soil pH from 3.6 to 5.5.
Deposit NA is located on an inside bend of the west bank of the Arkansas River. It contains
approximately 8,919 ft3 of mine-waste over an area of approximately 4,039 ft2, and has an average mine-
waste depth of 2.2 ft. Samples from this deposit had average concentrations of the following metals:
J:\010004\Task3 -SCR\Appendices\App_D_Ch2MWD.doc D-18
cadmium, 169 mg/kg; copper, 225 mg/kg; lead, 950 mg/kg and zinc, 3,765 mg/kg. Salts, cattle tracks,
and dead willows were observed on the surface. A two- to three-foot cut bank was present along the
Arkansas River. Samples collected from deposit LB showed soil pH from 2.6 to 4.0.
Deposit NB is located to the east of the Arkansas River and comprises a portion of the riverbank.
It contains approximately 25,143 ft3 of mine-waste over an area of approximately 35,496 ft2, and has an
average mine-waste depth of 0.7 ft. Samples from this deposit had average concentrations of the
following metals: cadmium, 95 mg/kg; copper, 280 mg/kg; lead, 2,500 mg/kg; and zinc, 1,900. The
deposit had live and dead vegetation, including grass and willows. The visible signs of erosion included a
three-foot cut bank.
Deposit NC is located to the west of the Arkansas River. It contains approximately 17,288 ft3 of
mine-waste over an area of approximately 4,039 ft2, and has an average mine-waste depth of 2.2 ft.
Samples from this deposit had average concentrations of the following metals: cadmium, 57 mg/kg;
copper, 290 mg/kg; lead, 1,600 mg/kg and zinc, 1,870 mg/kg. Dead willows and salts were observed on
the surface. Samples collected from deposit NC showed soil pH from 3.1 to 3.8.
Deposit ND is located to the west of the Arkansas River and comprises a portion of the riverbank.
It contains approximately 45,187 ft3 of mine-waste over an area of approximately 21,324 ft2, and has an
average mine-waste depth of 2.1 ft. Samples from this deposit had average concentrations of the
following metals: cadmium, 120 mg/kg; copper, 170 mg/kg; lead, 1,270 mg/kg and zinc, 640 mg/kg.
There is a 3- to 4-foot cut bank on the river. Dead willows, salts, and cattle tracks were observed on the
surface. The deposit is primarily non-vegetated, but some grass was observed near the edges of the mine-
waste deposit. Samples collected from deposit ND showed soil pH from 3.3 to 3.4.
Deposit NG is located to the east of the Arkansas River. It contains approximately 62,398 ft3 of
mine-waste over an area of approximately 44,046 ft2, and has an average mine-waste depth of 1.4 ft.
Samples from this deposit had average concentrations of the following metals: cadmium, 90 mg/kg;
copper, 58 mg/kg; lead, 245 mg/kg; and zinc, 1,710 mg/kg. The deposit had grass cover and dead
willows present. Good grass cover was observed along low deposits adjacent to the tributary. The visible
signs of erosion included a two- to three-foot cut bank.
Deposit NH is located to the east of the Arkansas River. The deposit is a part of the groundwater
study area of the USGS. It contains approximately 27,356 ft3 of mine-waste over an area of
approximately 35,811 ft2, and has an average mine-waste depth of 0.8 ft. Samples from this deposit had
average concentrations of the following metals: cadmium, 172 mg/kg; copper, 180 mg/kg; lead, 2,400
J:\OI0004\Task 3 - SCR\Appendices\App_D_Ch2MWD.doc D-l 9
mg/kg; and zinc, 7,740 mg/kg. The deposit had dead willows, but abundant grass along low areas
adjacent to the tributary. The visible signs of erosion included a four-foot cut bank.
Deposit NI is located to the east of the Arkansas River. It is part of the USGS groundwater study
area. Deposit NI contains approximately 70,057 ft3 of mine-waste over an area of approximately 69,734
ft2, and has an average mine-waste depth of 1.0 ft. Samples from this deposit had average concentrations
of the following metals: cadmium, 128 mg/kg; copper, 405 mg/kg; lead, 4,293 mg/kg and zinc, 2,308
mg/kg. The deposit was primarily non-vegetated, and there was evidence of dead willows. Good grass
cover was observed by the tributary. The visible signs of erosion included a one- to three-foot cut bank.
Deposit NJ is located to the east of the Arkansas River and comprises a portion of the riverbank.
It contains approximately 1,618 ft3 of mine-waste over an area of approximately 4,088 ft2, and has an
average mine-waste depth of 0.4 ft. Samples from this deposit had average concentrations of the
following metals: cadmium, 115 mg/kg; copper, 55 mg/kg; lead, 760 mg/kg; and zinc, 410 mg/kg. The
deposit had sparse grass cover, and was surrounded by grass and some willows. Light salts were
observed on the surface. The visible signs of erosion included a one-foot cut bank.
Deposit NL is located to the east of the Arkansas River. It contains approximately 21,722 ft3 of
mine-waste over an area of approximately 14,145 ft2, and has an average mine-waste depth of 1.5 ft.
Samples from this deposit had average concentrations of the following metals: cadmium, 115 mg/kg;
copper, 55 mg/kg; lead, 1,250 mg/kg and zinc, 415 mg/kg. The deposit was mostly non-vegetated, but
grass cover was observed in the low-lying area adjacent to the deposit.
Deposit NN is located to the east of the Arkansas River and the southern tip of the deposit
comprises a portion of the riverbank. It contained approximately 9,291 ft3 of mine-waste over an area of
approximately 28,835 ft2, and has an average mine-waste depth of 0.3 ft. Samples from this deposit had
average concentrations of the following metals: cadmium, 80 mg/kg; copper, 108 mg/kg; lead, 4,300
mg/kg and zinc, 2,200 mg/kg. The surface contained a few clumps of grass. The visible signs of erosion
included a small cut bank. Light salts were observed on the surface.
Deposit NO is located to the east of the Arkansas River and comprises a portion of the riverbank.
It contains approximately 14,147 ft3 of mine-waste over an area of approximately 6,757 ft2, and has an
average mine-waste depth of 2.1 ft. Samples from this deposit had average concentrations of the
following metals: cadmium, 85 mg/kg; copper, 330 mg/kg; lead, 3,000 mg/kg and zinc, 1,500 mg/kg.
The deposit had some vegetation, but was primarily bare. The visible signs of erosion included a 1.5-foot
cut bank.
J:\010004\Task 3 - SCR\Appendices\App_D_Ch2MWD.doc D-20
Deposit NP is located to the east of the Arkansas River and comprises a portion of the riverbank.
It contains approximately 5,060 ft3 of mine-waste over an area of approximately 10,469 ft2, and has an
average mine-waste depth of 0.5 ft. Samples from this deposit had average concentrations of the
following metals: cadmium, 128 mg/kg; copper, 180 mg/kg; lead, 1,950 mg/kg and zinc, 1,250 mg/kg.
No vegetation was present, possibly due to heavy cattle use. The visible signs of erosion included a 17-
inch cut bank with signs of current erosion.
Deposit NR is located to the west of the Arkansas River. It contains approximately 46,265 ft3 of
mine-waste over an area of approximately 28,071 ft2, and has an average mine-waste depth of 1.6 ft.
Samples from this deposit had average concentrations of the following metals: cadmium, 48 mg/kg;
copper, 480 mg/kg; lead, 2,275 mg/kg; and zinc, 1,825 mg/kg. Cattle tracks, salts, and dead willows were
observed on the surface. Grass was growing in low areas next to the deposit. Samples collected from
deposit NR showed soil pH from 3.6 to 4.0.
Deposit NT is located along the west bank of the Arkansas River. It contains approximately
5,900 ft3 of mine-waste over an area of approximately 14,900 ft2, and has an average mine-waste depth of
0.4 ft. Samples from this deposit had average concentrations of the following metals: cadmium, 94
mg/kg; copper, 235 mg/kg; lead, 1,950 mg/kg and zinc, 2,900 mg/kg. There was a cut bank along the
river, but the bank was primarily cobbles. Salts were observed on the surface. Samples collected from
deposit NT showed soil pH from 3.8 to 5.5.
Deposit NU is located to the west of the Arkansas River near a small creek, and a small portion
comprises a portion of the riverbank. It contains approximately 15,495 ft3 of mine-waste over an area of
approximately 16,169 ft2, and has an average mine-waste depth of 1.0 ft. Samples from this deposit had
average concentrations of the following metals: cadmium, 79 mg/kg; copper, 195 mg/kg; lead, 2,250
mg/kg; and zinc, 820 mg/kg. An erosional ditch runs through the deposit. The deposit is surrounded by
grasses and shrubs, with willows observed southwest of the deposit. The deposit is separated from the
river by a grassy area. Salts, dead willows, and livestock tracks were observed on the surface. Samples
collected from deposit NU showed soil pH from 2.1 to 3.0.
Deposit OA is located to the west of the Arkansas River and comprises a portion of the riverbank.
It contains approximately 55,257 ft3 of mine-waste over an area of approximately 46,416 ft2, and has an
average mine-waste depth of 1.2 ft. Samples from this deposit had average concentrations of the
following metals: cadmium, 57 mg/kg; copper, 455 mg/kg; lead, 3,150 mg/kg; and zinc, 2,700 mg/kg.
J:\OI0004\Task 3 - SCR\Appendices\App_D_Ch2MVVD.doc D-2 1
There is a cut bank and cobbles along the river. Dead willows, salts, and livestock tracks were observed
on the surface. Samples collected from deposit OA showed soil pH from 2.1 to 3.8.
Deposit OB is located to the east of the Arkansas River and comprises a portion of the riverbank.
It contains approximately 47,141 ft3 of mine-waste over an area of approximately 34,155 ft2, and has an
average mine-waste depth of 1.4 ft. Samples from this deposit had average concentrations of the
following metals: cadmium, 85 mg/kg; copper, 65 mg/kg; lead, 813 mg/kg and zinc, 868 mg/kg. The
deposit had uneven plant cover. The visible signs of erosion included a three-foot cut bank.
Deposit OC is located to the west of the Arkansas River. It consists of three ellipsoid deposits in
the midst of a large cobble deposit. It contains approximately 6,989 ft3 of mine-waste over an area of
approximately 19,865 ft2, and has an average mine-waste depth of 0.4 ft. Samples from this deposit had
average concentrations of the following metals: cadmium, 65 mg/kg; copper, 230 mg/kg; lead, 4,000
mg/kg; and zinc, 3,900 mg/kg. Cattle tracks were observed on the surface. Samples collected from
deposit OC showed soil pH from 3.9 to 4.6.
Deposit OD is located to the west of the Arkansas River. It contains approximately 7,048 ft3 of
mine-waste over an area of approximately 8,601 ft2, and has an average mine-waste depth of 0.8 ft.
Samples from this deposit had average concentrations of the following metals: cadmium, 124 mg/kg;
copper, 300 mg/kg; lead, 3,100 mg/kg; and zinc, 1,145 mg/kg. Light salts and livestock tracks were
observed on the surface. The deposit is primarily non-vegetated with grasses growing in the low area
between the two sections. Samples collected from deposit OD showed soil pH from 2.3 to 4.1.
Deposit OE is located to the west of the Arkansas River and comprises a portion of the riverbank.
It contains approximately 37,689 ft3 of mine-waste over an area of approximately 31,890 ft2, and has an
average mine-waste depth of 1.2 ft. Samples from this deposit had average concentrations of the
following metals: cadmium, 221 mg/kg; copper, 268 mg/kg; lead, 3,513 mg/kg; and zinc, 6,912 mg/kg.
Salts, livestock tracks, and dead willows were observed on the surface. Erosion channels were present.
Samples collected from deposit OE showed soil pH from 3.9 to 5.3.
Deposit OF is located to the east of the Arkansas River and comprises a portion of the riverbank.
It contains approximately 9,754 ft3 of mine-waste over an area of approximately 15,103 ft2, and has an
average mine-waste depth of 0.6 ft. Samples from this deposit had average concentrations of the
following metals: cadmium, 85 mg/kg; copper, 65 mg/kg; lead, 340 mg/kg and zinc, 660 mg/kg. Dead
willows were observed and most of the area was non-vegetated. Salt was observed on the surface. A
two-foot cut bank adjacent to the river showed signs of erosion.
J:\010004\Task 3 - SCR\Appendices\App_D_Ch2MWD.doc D-22
Deposit OG is a finger of mine-wastes on the west side of the Arkansas River, which continues
into a densely vegetated area. It contains approximately 19,164 ft3 of mine-waste over an area of
approximately 11,498 ft2, and has an average mine-waste depth of 1.7 ft. Samples from this deposit had
average concentrations of the following metals: cadmium, 97 mg/kg; copper, 70 mg/kg; lead, 100 mg/kg;
and zinc, 970 mg/kg. The deposit is non-vegetated. Dead willows and livestock tracks were observed on
the surface. One sample from deposit OG showed a soil pH of 5.5.
Deposit OH is located on the west bank of the Arkansas River. It consists of two mine-waste
deposits over cobble. It contains approximately 4,017 ft3 of mine-waste over an area of approximately
3,708 ft2, and has an average mine-waste depth of 1.1 ft. Samples from this deposit had average
concentrations of the following metals: cadmium, 48 mg/kg; copper, 160 mg/kg; lead, 2,150 mg/kg; and
zinc, 1,675 mg/kg. Samples collected from deposit OH showed soil pH from 2.5 to 5.0.
Deposit OI consists of mine-waste along the west side of the Arkansas River. One section of the
deposit is surrounded by grasses. The deposit contains approximately 3,301 ft3 of mine-waste over an
area of approximately 3,301 ft2, and has an average mine-waste depth of 1.0 ft. One section consists of
mine-waste placed in a manmade cobble wall. Samples from this deposit had average concentrations of
the following metals: cadmium, 250 mg/kg; copper, 690 mg/kg; lead, 1,950 mg/kg; and zinc, 17,100
mg/kg. Salts were observed on the surface. Samples collected from deposit OI showed soil pH from 3.8
to 4.9.
Deposit OJ consists of three small deposits along the west side of the Arkansas River. The
irrigation inlet is located just north of these deposits. It contains approximately 2,281 ft3 of mine-waste
over an area of approximately 3,802 ft2, and has an average mine-waste depth of 0.6 ft. Samples from this
deposit had average concentrations of the following metals: cadmium, 272 mg/kg; copper, 414 mg/kg;
lead, 6,360 mg/kg; and zinc, 9,567 mg/kg. Salts were observed on the south western most deposit.
Samples collected from deposit OJ showed soil pH from 1.3 to 5.3.
Deposit OK is located to the west of the Arkansas River. It is primarily fine sand, but has
shallow lenses of gray and orange mine-waste. Some salts were observed on the surface. It contains
approximately 1,500 ft3 of mine-waste over an area of approximately 4,154 ft3, and has an average mine-
waste depth of 0.4 ft. Samples from this deposit had average concentrations of the following metals:
cadmium, 65 mg/kg; copper, 330 mg/kg; lead, 3,200 mg/kg; and zinc, 1,100 mg/kg. One sample from
deposit OK showed a soil pH of 3.2.
J:\010004\Task 3 - SCR\Appendices\App_D_Ch2MWD.doc D-23
Deposit PA is located to the east of the Arkansas River and comprises a portion of the riverbank.
The north edge of the deposit is adjacent to the river. It contains approximately 32,113 ft3 of mine-waste
over an area of approximately 20,972 ft2, and has an average mine-waste depth of 1.5 ft. Samples from
this deposit had average concentrations of the following metals: cadmium, 95 mg/kg; copper, 330 mg/kg;
lead, 4,050 mg/kg; and zinc, 1,900 mg/kg. The deposit had little vegetation but was surrounded by
grasses and cobble. The northern edge of deposit PA showed current signs of erosion into the river.
Deposit PC is located approximately 250 feet east of the Arkansas River. It contains
approximately 17,980 ft3 of mine-waste over an area of approximately 17,831 ft2, and has an average
mine-waste depth of 1.0 ft. Samples from this deposit had average concentrations of the following
metals: cadmium, 85 mg/kg; copper, 65 mg/kg; lead, 2,100 mg/kg and zinc, 625 mg/kg. The deposit was
sparsely vegetated with grasses. Dead willows were observed on the deposit.
Deposit PD is located on the east side of the Arkansas River and comprises a portion of the
riverbank. It contains approximately 9,434 ft3 of mine-waste over an area of approximately 6,011 ft2, and
has an average mine-waste depth of 1.6 ft. Samples from this deposit had average concentrations of the
following metals: cadmium, 85 mg/kg; copper, 103 mg/kg; lead, 5,500 mg/kg and zinc, 455 mg/kg. The
deposit was bare in some spots and well vegetated in others. The visible signs of erosion included a small
cut bank.
Deposit PE is located to the west of the Arkansas River. It contains approximately 6,868 ft3 of
mine-waste over an area of approximately 5,720 ft2, and has an average mine-waste depth of 1.2 ft.
Samples from this deposit had average concentrations of the following metals: cadmium, 65 mg/kg;
copper, 760 mg/kg; lead, 10,000 mg/kg; and zinc, 3,700 mg/kg. The deposit was surrounded by grasses.
Dead willows and salts were observed on the surface. Some new growth was evident in the willows. One
sample from deposit PE showed a soil pH of 4.7.
Deposit PF is located along the west bank of the Arkansas River. There is a one-foot cut bank
along the river. It contains approximately 795 ft3 of mine-waste over an area of approximately 1,908 ft2,
and has an average mine-waste depth of 0.4 ft. Samples from this deposit had average concentrations of
the following metals: cadmium, 48 mg/kg; copper, 70 mg/kg; lead, 100 mg/kg; and zinc, 1,000 mg/kg.
One sample from deposit PF showed a soil pH of 4.7.
Deposit PG is located to the west of the Arkansas River. It consists primarily of cobbles, gravel,
and sand, but has mine-wastes mixed throughout. The deposit is located on the inside bend of a channel
with standing water. It contains approximately 51,527 ft3 of mine-waste over an area of approximately
J:\010004\Task 3 - SCR\Appendices\App_D_Ch2MWD.doc D-24
61,832 ft2, and has an average mine-waste depth of 0.8 ft. Samples from this deposit had average
concentrations of the following metals: cadmium, 94 mg/kg; copper 170 mg/kg; lead, 2,395 mg/kg and
zinc, 4,800 mg/kg. Samples collected from deposit PG showed soil pH from 2.5 to 4.6.
Deposit PJ is located approximately 300 feet east of the Arkansas River. It contains
approximately 17,937 ft3 of mine-waste over an area of approximately 16,063 ft2, and has an average
mine-waste depth of 1.1 ft. Samples from this deposit had average concentrations of the following
metals: cadmium, 87 mg/kg; copper, 337 mg/kg; lead, 2,900 mg/kg; and zinc, 8,467 mg/kg. The deposit
was surrounded by grasses and willows.
Deposit PM is located to the east of the Arkansas River approximately 100 feet from the
riverbank. It contains approximately 446 ft3 of mine-waste over an area of approximately 1,114 ft2, and
has an average mine-waste depth of 0.4 ft. Samples from this deposit had average concentrations of the
following metals: cadmium, 75 mg/kg; copper, 46 mg/kg; lead, 830 mg/kg and zinc, 780 mg/kg. The
deposit was non-vegetated, but vegetation along the small drainage on the western pile perimeter was
preventing erosion.
Deposit PN is located to the east of the Arkansas River. It contains approximately 7,087 ft3 of
mine-waste over an area of approximately 5,390 ft2, and has an average mine-waste depth of 1.3 ft.
Samples from this deposit had average concentrations of the following metals: cadmium, 85 mg/kg;
copper, 65 mg/kg; lead, 93 mg/kg; and zinc, 2,400 mg/kg. Dead willows were present within the mine-
waste deposit and in the surrounding areas. The deposit is primarily bare, but has some grasses present.
Deposit PP is located to the east of the Arkansas River. It contains approximately 15,704 ft3 of
mine-waste over an area of approximately 16,506 ft2, and has an average mine-waste depth of 1.0 ft.
Samples from this deposit had average concentrations of the following metals: cadmium, 93 mg/kg;
copper, 65 mg/kg; lead, 4,050 mg/kg and zinc, 1,785 mg/kg. The deposit had dead willows and was
surrounded by grasses. A two- to three-foot cut bank was noted adjacent to a tributary.
Deposit PX is located approximately 300 feet east of the Arkansas River just south of deposit PJ.
It contains approximately 24,816 ft3 of mine-waste over an area of approximately 24,276 ft2, and has an
average mine-waste depth of 1.0 ft. Samples from this deposit had average concentrations of the
following metals: cadmium, 145 mg/kg; copper, 505 mg/kg; lead, 6,150 mg/kg; and zinc, 5,100 mg/kg.
Mine-waste is concentrated in small deposits over cobbles and organic soil.
J:\010004\Task 3 - SCR\Appendices\App_D_Ch2MWD.doc D-25
Deposit QA is located to the east of the Arkansas River. It contains approximately 7,549 ft3 of
mine-waste over an area of approximately 10,065 ft2, and has an average mine-waste depth of 0.8 ft.
Samples from this deposit had average concentrations of the following metals: cadmium, 105 mg/kg;
copper, 123 mg/kg; lead, 1,570 mg/kg and zinc, 655 mg/kg. The deposit had vegetation in low-lying
areas adjacent to the tributary. Visible signs of erosion included a 1.5-foot cut bank.
Deposit QD is located to the east of the Arkansas River. It contains approximately 46,183 ft3 of
mine-waste over an area of approximately 51,794 ft2, and has an average mine-waste depth of 0.9 ft.
Samples from this deposit had average concentrations of the following metals: cadmium, 147 mg/kg;
copper, 93 mg/kg; lead, 2,117 mg/kg and zinc, 2,197 mg/kg. The visible signs of erosion included
surface rills.
Deposit QF is located to the east of the Arkansas River and comprises a portion of the riverbank.
It contains approximately 71,910 ft3 of mine-waste over an area of approximately 99,367 ft2, and has an
average mine-waste depth of 0.7 ft. Samples from this deposit had average concentrations of the
following metals: cadmium, 160 mg/kg; copper, 114 mg/kg; lead, 2,431 mg/kg; and zinc, 698 mg/kg.
The deposit was partially vegetated with grasses. A low area contained dense grass cover. Dead willows
were present on the site, but new growth was observed. The visible signs of erosion included surface rills
and cattle paths.
Deposit QG is located to the east of the Arkansas River. It contains approximately 18,165 ft3 of
mine-waste over an area of approximately 18,165 ft2, and has an average mine-waste depth of 1.0 ft.
Samples from this deposit had average concentrations of the following metals: cadmium, 105 mg/kg;
copper, 290 mg/kg; lead, 2,450 mg/kg; and zinc, 1,585 mg/kg. Dead willows were present on the mine-
waste deposit. The deposit was surrounded by grasses and some willows. The visible signs of erosion
included a small cut bank adjacent to the tributary.
Deposit QH is located to the east of the Arkansas River. It contains approximately 14,830 ft3 of
mine-waste over an area of approximately 14,237 ft2, and has an average mine-waste depth of 1.0 ft.
Samples from this deposit had average concentrations of the following metals: cadmium, 138 mg/kg;
copper, 215 mg/kg; lead, 3,600 mg/kg and zinc, 1,850 mg/kg. Dead willows were present on the mine-
waste deposit.
Deposit QI is located to the east of the Arkansas River and is in contact with the riverbank. It
contains approximately 12,686 ft3 of mine-waste over an area of approximately 20,075 ft2, and has an
average mine-waste depth of 0.6 ft. Samples from this deposit had average concentrations of the
J:\010004\Task 3 - SCR\Appendices\App_D_Ch2MWD.doc D-26

following metals: cadmium, 115 mg/kg; copper, 370 mg/kg; lead, 3,100 mg/kg; and zinc, 2,400 mg/kg.
The deposit had some grasses present and evidence of dead willows. The visible signs of erosion
included a one-foot cut bank.
Deposit QJ is located to the east of the Arkansas River and comprises a portion of the riverbank.
It contains approximately 1,235 ft3 of mine-waste over an area of approximately 1,289 ft2, and has an
average mine-waste depth of 1.0 ft. Samples from this deposit had average concentrations of the
following metals: cadmium, 115 mg/kg; copper, 190 mg/kg; lead, 1,600 mg/kg and zinc, 2,700 mg/kg.
Dead grass was observed on the area. Live vegetation was observed in spots and included grasses and
willows. Cattle paths were also observed. The visible signs of erosion included a one-foot cut bank.
Deposit QK is located to the east of the Arkansas River. It contains approximately 7,752 ft3 of
mine-waste over an area of approximately 7,344 ft2, and has an average mine-waste depth of 1.1 ft.
Samples from this deposit had average concentrations of the following metals: cadmium, 115 mg/kg;
copper, 280 mg/kg; lead, 2,400 mg/kg and zinc, 780 mg/kg. The deposit had no vegetation except in a
low-lying area adjacent to the tributary.
Deposit QM is located to the east of the Arkansas River. It contains approximately 7,960 ft3 of
mine-waste over an area of approximately 4,094 ft2, and has an average mine-waste depth of 1.9 ft.
Samples from this deposit had average concentrations of the following metals: cadmium, 75 mg/kg;
copper, 210 mg/kg; lead, 1,200 mg/kg and zinc, 960 mg/kg. The deposit had dead willows and was
surrounded by grasses and willows.
Deposit QN is located to the east of the Arkansas River. It contains approximately 55,041 ft3 of
mine-waste over an area of approximately 45,672 ft2, and has an average mine-waste depth of 1.2 ft.
Samples from this deposit had average concentrations of the following metals: cadmium, 201 mg/kg;
copper, 330 mg/kg; lead, 1,638 mg/kg; and zinc, 3,763 mg/kg. The deposit had dead willows with some
new growth observed. A heavy layer of salt was present on the surface. The visible signs of erosion
included a two-to three-foot cut bank and surface channels.
Deposit QO is located on the east side of the Arkansas River. It contains approximately 13,096 ft3
of mine-waste over an area of approximately 31,962 ft2, and has an average mine-waste depth of 0.4 ft.
Samples from this deposit had concentrations of the following metals: cadmium, 85 mg/kg; copper, 65
mg/kg; lead, 3,000 mg/kg and zinc, 1,400 mg/kg. Visible signs of erosion included a cut bank used by
cattle. However, most of the cut bank was stabilized with grasses.
J:\010004\Task 3 - SCR\Appendices\App_D_Ch2MWD.doc D-27
Deposit QP is located to the east of the Arkansas River and comprises a portion of the riverbank.
It contains approximately 9,122 ft3 of mine-waste over an area of approximately 17,283 ft2, and has an
average mine-waste depth of 0.5 ft. Samples from this deposit had average concentrations of the
following metals: cadmium, 80 mg/kg; copper, 535 mg/kg; lead, 1,900 mg/kg; and zinc, 3,450 mg/kg.
The deposit had isolated spots of grasses and willows. Salts were observed on the surface. The visible
signs of erosion included a 2.5-foot cut bank.
Deposit QQ is located to the east of the Arkansas River. It contains approximately 4,019 ft3 of
mine-waste over an area of approximately 4,385 ft2, and has an average mine-waste depth of 0.9 ft.
Samples from this deposit had average concentrations of the following metals: cadmium, 75 mg/kg;
copper, 46 mg/kg; lead, 2,000 mg/kg; and zinc, 940 mg/kg. The deposit was well vegetated. The visible
signs of erosion included a small cut bank.
Deposit QR is located to the east of the Arkansas River. It contains approximately 8,606 ft3 of
mine-waste over an area of approximately 9,954 ft2, and has an average mine-waste depth of 0.9 ft.
Samples from the deposit had average concentrations of the following metals: cadmium, 115 mg/kg;
copper, 55 mg/kg; lead, 4,700 mg/kg and zinc, 950 mg/kg. There were areas with grass cover within the
deposit.
Deposit QT is located to the east of the Arkansas River adjacent to the river. It contains
approximately 7,243 ft3 of mine-waste over an area of approximately 7,009 ft2, and has an average mine-
waste depth of 1.0 ft. Samples from this deposit had average concentrations of the following metals:
cadmium, 75 mg/kg; copper, 300 mg/kg; lead, 1,300 mg/kg; and zinc, 1,200 mg/kg. The deposit had dead
willows and no vegetation except some grasses along the river. The visible signs of erosion included a
one-foot cut bank.
Deposit QV is located to the west of the Arkansas River. It contains approximately 10,415 ft3 of
mine-waste over an area of approximately 4,933 ft2, and has an average mine-waste depth of 2.1 ft.
Samples from this deposit had average concentrations of the following metals: cadmium, 174 mg/kg;
copper, 227 mg/kg; lead, 4,733 mg/kg; and zinc, 12,667 mg/kg. Salts were observed on the surface.
Samples collected from deposit QV showed soil pH from 3.9 to 5.1.
Deposit QW is located to the west of the Arkansas River. It contains approximately 3,916 ft3 of
mine-waste over an area of approximately 1,698 ft" and has an average mine-waste depth of 2.3 ft.
Samples from this deposit had average concentrations of the following metals: cadmium, 128 mg/kg;
copper, 293 mg/kg; lead, 1,240 mg/kg; and zinc, 6,000 mg/kg. Salts and livestock tracks were observed
J:\010004\Task 3 - SCR\Appendices\App_D_Ch2MWD.doc D-28
on the surface. Grass is invading along the edges of the deposit. Some grass clumps were observed in the
center of the deposit. Samples collected from deposit QW showed soil pH from 4.0 to 4.9.
Deposit QX is located on the west bank of the Arkansas River. It has an actively eroding three-
foot cut bank on the river. Dead willows, salts, and cattle tracks were observed on the surface. It contains
approximately 8,098 ft3 of mine-waste over an area of approximately 3,786 ft2, and has an average mine-
waste depth of 2.1 ft. Samples from this deposit had average concentrations of the following metals:
cadmium, 65 mg/kg; copper, 670 mg/kg; lead, 6,400 mg/kg; and zinc, 2,300 mg/kg. One sample from
deposit QX showed a soil pH of 3.4.
Deposit QY is adjacent to a cobble deposit by a small stream to the west of the Arkansas River.
It contains approximately 1,658 ft3 of mine-waste over an area of approximately 3,510 ft2, and has an
average mine-waste depth of 0.5 ft. Samples from this deposit had average concentrations of the
following metals: cadmium, 48 mg/kg; copper, 430 mg/kg; lead, 7,600 mg/kg and zinc, 5,900 mg/kg.
Salts and cattle tracks were observed on the surface. One sample from deposit QY showed a soil pH of
4.7.
Deposit QZ is located to the west of the Arkansas River. It contains approximately 492 ft3 of
mine-waste over an area of approximately 1,687 ft2, and has an average mine-waste depth of 0.3 ft.
Samples from this deposit had average concentrations of the following metals: cadmium, 190 mg/kg;
copper, 270 mg/kg; lead, 7,200 mg/kg and zinc, 3,400 mg/kg. Animal tracks and a small amount of salts
were observed on the surface. One sample from deposit QZ showed a soil pH of 1.5.
Deposit RA is located to the west of the Arkansas River just south of County Road 55. It
contains approximately 33,319 ft3 of mine-waste over an area of approximately 45,263 ft2, and has an
average mine-waste depth of 0.7 ft. Samples from this deposit had average concentrations of the
following metals: cadmium, 412 mg/kg; copper, 513 mg/kg; lead, 2,200 mg/kg; and zinc, 29,667 mg/kg.
Erosional ditches, salts, and cattle tracks were observed on the surface. Samples collected from deposit
RA showed soil pH from 3.0 to 4. 1.
Deposit RB is located on the west bank of the Arkansas River just south of County Road 55. It
contains approximately 15,856 ft3 of mine-waste over an area of approximately 27,182 ft2, and has an
average mine-waste depth of 0.6 ft. Samples from this deposit had average concentrations of the
following metals: cadmium, 65 mg/kg; copper, 240 mg/kg; lead, 3,000 mg/kg and zinc, 1,000 mg/kg.
Some salts were observed on the surface. One sample from deposit RB showed a soil pH of 2.8.
J:\010004\Task 3 - SCR\Appendices\App_D_Ch2iMWD.doc D-29
Deposit RC is located on the west bank of the Arkansas River. It contains approximately 1,984 ft3
of mine-waste over an area of approximately 3,662 ft2, and has an average mine-waste depth of 0.5 ft.
Samples from this deposit had average concentrations of the following metals: cadmium, 65 mg/kg;
copper, 300 mg/kg; lead, 1,700 mg/kg and zinc, 1,100 mg/kg. There was a cut bank that was primarily
cobbles. Some salts and dead willows were present on the surface. One sample from deposit RC showed a
soil pH of 3.7.
Deposit RF is a small deposit located five feet west of the Arkansas River. It contains
approximately 7,287 ft3 of mine-waste over an area of approximately 2,429 ft2, and has an average mine-
waste depth of 3.0 ft. Samples from this deposit had concentrations of the following metals: cadmium,
320 mg/kg; copper, 520 mg/kg; lead, 3,100 mg/kg; and zinc, 12,000 mg/kg. The deposit was non-
vegetated. One sample from deposit RF showed a soil pH of 5.5.
J:\010004\Task 3 - SCR\Appendices\App_D_Ch2MWD.doc D-30
APPENDIX E
Water Quality Data
Groundwater Data (orDissolved cadmium, copper, lead, and zinc data (mg/L) for all data sets, am
River Reaches 0 to 3.cadmium, copper, lead, and zinc data (mg/L) for CDPHE data (LNRD-068).
D.Ark RO.CadmUn. Otssotved
OArt RO Coppw. Oissatved
0 Ark RO Lead. Dissolved
O.Art RO ZJnc. Dissolved
Period!
Period 2
Period!
Period 2
D A* Rl.Cadnejm. Dissolved ] Period 2
0 Ark Hi Cadmium. Dkssdved j Period 2Art Hl.Cudnyum. tola
D.AARlCadrraufn.Tate.AikRl.Cedmkim.TotaArk Rl.Codmhvn, Tout
<Art Kl.Cadmkon. Tola
0 Ark Rl.Copper. Oiurvod(.Art Hi Coppei. Otisorvedi Ark R 1 .Copper. Dissolved1 Ark Rl. Capper. Tota(Art Rl. Capper. ToUlArh Hi. Copper. Tota
O.Art Rl Lead. DissolvedlArkRI.Laad. Dissolved
D Art Rl Lead. Dissolved).AAR|. Lead. Tola
D.ArkR1.L»ad. Tola) Arh Rl Lead. ToU
DArk Rl. Load. ToU
D.Art Rl.Zinc. DkisotvedOArt Rl.ZkV. OtssotwdrArk Rl Zinc. Dissolved j
OArt RZ.Cedmkjm, OiuoNed >
Period 2Period 2
~Penod3Period3Period 3
Period 2
,
3W205
3WZOS
GW205
CW20S
OW211
NW-14'33100-001
1 \452! GW
452
452
4S2
1621
1667
GW
GW
2/17/1983
2/17/1983
2/17/1983
GW j 2/17/1963
GW I 2/18/1983
GW1663 GW
33100-001 1663J GW133100-001 1003133100-001 i 1063(33400-001
GW211Period 2 NW-14Period 2Period3
NW-14133100-001
Period3 (133100-001Penod 3 1 133400401
P.TW2"PeriodYPeriod 2Period 21
'"PeriodsPeriod 2Period §1
Period 2
Period 2Period 2
) Arii R2 Capper, aiiaJved jj>eriod 2D Ark R2 Copper. Dissolved0 Ark R2 Lead. Dissolved
0 Arh R2 Zlrc. Distorted
D.Ark H3 Cadcnkm. Dlsiotved
DArk R3 Copper. DbsoNed
O.Art R3Lead. OlssotvedD Arh Rl Zinc. DtssotvedD Ark R3 Zinc. DissolvedD.Col Gulcn-Al Ark Rhr.Coditeum. Dissolved).Cnl Gukh-Al Ark Rrv.Cedmkun. Dissolvedb.Cni Guich-AI Ark~Riir.Capper. Dissolved
OCa Gufch-At Aft Rrv.Copper. DissolvedD.Cat Guich-Ai Art Rrv Lead, brssotved
D Col Cufch-Al Ark Rlv.Zkic. DtsMtvedO.Arh R2.Codmum. ObservedO.Art R2 Cadmium, Dissolved
O.Art R£ Capper. OtTsaNed
O.Art R2 Lead. Dissolved
O.Arh R2.Zlnc. DissolvedS.Arh Hl.Cadmkm. DisservedS Ark HI .Cadmium, Dissolved
S Arh Rl.Cadmlum. Disserved
S Art Ri.CadrMum. DiwohedS.Ark RT.Cadmhjm. DissolvedSArk Ri.Cadmium. DlMorved
S.Art Rl.Cadrrium. GfesotvedS Arh RtCodmtan, OlssorvedS»k Rt Cadmium, Dissolved '
S Art Rl Cadmium. OiuolvedS Art Ri.Codmijm. DtssiitvedS Ark HI Codrnkm. Ottiotved "SArk HlTcidmkm. rjTsaalved " "S Art Rl.Cadmlum. DissolvedS Art R l.Codrrsum. Dissolved
Penad3Period 2
Penal 2
Period 2
Period 2
Period!'Period 1Period 2Period 2Period 2
"PeViod7
Period 2'Period 2
"Period 2Period 2Period 2Period 2
Period!
Period 2
Period 2'Period!PeriodsPeriod 3Period]PeriodsPeriodsPeriod:Period S
"PeriodTPeriod!Period!P*nod3
>enadS'Period")Penod3
TPeriodJPeriod:Period :Period:
1779
1621-_.
UWGW"GW
GW-raw
11/13/10697/31/19845716/10883/12/19000/29/20005/28/1997
2/18/1983657/1983
1667 GW ; 11/13/19891663 GW~j 6/30/19941883! GW
"1779JGW
GW211 1621JGWNW-14 10541 GWNW-14 { 1 6 8 7 1 GW
33100-00133400-001 '33400-001
GW2IIW-14
W-14
GW203
GW2O3GW203
1063! CW
1621 GW1654 GW
1026
1928
1928
GW
GW
3/12/19985/26/1097
2/18/19836/27/198;
11/13/19897/31/10643/12/1098
5/2B7l997
2/10/19836/27/1969
11/13/19892/15/1003
2/15/1083GW 5/7/2001
GW203 j 1928 GW
GW203 19201 GW
GW2O4 2254JGW
GW204
GW7O4
3.00746EM4GW204GW210
2254 GW
22S4! GW2238JGW2254J GW15501 GW
2/1 5/1 BW
2/15/1983
2/15/1983
2/1 571983
2/15/10636/30/10722/15/19832/18/1963
GW21B 155S| GW 2/21/1983GW210 [ 1550J GW 2/18/1083
GW216GW210
1555 GW1550[ GW
W210 | 1550
GW218 i 155!GW201 ! 1927GW202
IGWiGW' SP
, I92»J_SP
2/21/19832/1 8/1 oa:
2/16/1963' 2/2 1/1 M:
2/1 5/1 98:2/15/1663
GW202 t 1920; SP | 2/15/1883
GW202 I929J SP
GW202IUWOI
UUW01
1929; SP| 17Ur«fa
JUWOI 1 1761JUWOI | 176
UUW01UUWOIJUW01UUWOIJUW01juwaiJUWDIUMW02UUW02UUW02UMWOIUUW02JHW02
UUW02
17«17«
"*™"T76I176
jewGWGWGW
GW"GWGW
1766 GW"*"" 17661 GW
1 790! GW" "ireet GW
17'ogTGM1799JGW
2/15MB63
2/15/iea:6/9/1091
7/14/1091ara/igsi
L 11/U193I__3jf22M099
6/15/199!0/17/1099
10/28/10916/15/20016Q9QOOI
6AV109I7/14/19H90/10U
11/0/109£ vni\9M
6/is7ie»8/17/1995
r
Cadmsim, Oiseorved
Copper. Dissorvad
Lead. DUsoNed
Zhc. Dissolved
Cedmkim. DttsoNed
Cadmium. OwotvedCadmatraTotaZaomkmx Tote^drrsurruTote:admbm.TateCedmsm. Tote
Copper. CUssarvedCoppor. Dtstorved
** I
0007
f
1 ! 1.3
]0015! <
002
00025
0003
" " owi?0.0000600005000060.0005
0.01
00025
1
1.._.
I
0
0.015 | 0
5
O.OOS
0005•OOM"0005
< 0005fyooosi* O.OM
1
Capper. Dlssaived 0.0025, <Capper. Tote i 0.35Copper. ToteCopper. Tota
Lead. OtssotvedLead. DissolvedLead. Dissolved "Lead. TotaLead, tolaLead, Tolaead. Tola
BY; OisvitverlZinc. Ohsorvedinc. Dissolved
Cadmajm, DktsoNed _,
Capper. DissolvedCopper. DtssoNedead. Dtssotved
Zfr£ Dissolved ""
Cadmtm. DissoNed
Copper. Dtsaorved
Lead, DissolvedZkK, DIssoTvodZhc, DtssoNed
00060.023
11
Q0025i <0.0025: <10024L 1
00005-00090001
00630.63
1.1
.3
.3
.3
.3
.3
"0:675"0015
< 0015
rTo'ois1 ! 0.015
-T-H-
0
0
0T
0000
00001)
0_r0
000
0„_1 i t 10
00025; «
00025; <0.002 •<0015! <
0.383
00025
i
o.«H<
o.oi si <0.13
0032Cadmkim. Otncived 00025Cadmkim. OtuolvodCopper. Olssorved
Copper, ObservedLead. Otseorved
Zsic. Dissolved
0005 : o
1.3 i 01.3 ! 0
0.015 1 0
s-j-6-
O.OM ; o
1.3 ; 0
0.015 ! 01 ' S I 01 ! 3 | 0« t 0005 1 0
O.OOaSjjt i O.OOS
D033J 10.0-15! -
0.0691 11.89i 1
Cedmian, OtesoNed j 0.0025Cadmium. Dtttorved
Copper, Dissolved
Lead. Dissolved
«0009; 1
1.3
W5~
T-
00
0~0~
0005 0robos"
000251 < j 1.3
O.OI$i~<~fboi5
Ztac, Dissorvad J 0.02!Udmum, Dissolved 1 0,000:Cadmkim. DEuotveddmkim. ObsoNedrtiuum. Dlsaotved
Cadfnhim. Drssotvad
Cadmmn. OUsoTvedCadnuum, DtaaotvedCadmium, DosotvedCadmium, OiESorvedCadmkm. OtitorvedCadmkim. DtswrvedCidmlum, DeuotvedCadmium. OlssorvedCedmlum, DissolvedCadmium. Observed
Caomhan. Dburved
000130001.00015 <0.00051V00009] <0.00091 «
000097 <
OOOOli <
00135; 10.00791 1OOlSfli 100t84j 10.01731 1
0011* 1
0.0142! 1
s
1
0
0
u0.009 ! 0o.dcT] o0.005 j 0~6oos i <rTFooTTb
To.oo5-t-o0.005 1 00005 1 00.005 I G
JO 005
,0.0030.00500050005
1 0005
-" 0.005"" 0005
0* 0
1
T1
11
r1
_L_
L
HHLLH
LHLLLH
LHLHLHH
LHLL
LHL
L
L
L
LLL
LL
L
LLLL
L
L
LH
H
LLLHHLLHLH
LLL
HL
134895
746750
746756
746819"larfSST630634749139749141749151749167749256
134919137536630640
-<•
ECOLOGY AND ENV
Ecology 6 Envfrormenu Inc.
Ecotogy * Environment. Inc.
Ecology ft Environment. Inc.
|GW
r
Sample bom a *ei on undeveloped land bordering the east side of tie Arkansas Rrvar. appnudmatciy .5Tites south of ffw East Fork confkience.SAMPLED FROU WELL ON UNDEVELOPED LAND BORDERING E SIDE OF ARKANSAS RIVER. S
GW Ml S OF E FORK CONFLUENC
GW
GW
GW
WWL ' JGWPubHc Water SystemsPublic Water SystemsPubic water SystemsPubHc Water SystemsPublic Water Systems
ECOLOGY AND ENV
GWCWGWl
Sampto bom a w«l on undeveloped land bordering the east tide of ha Arkansas River, approxknalaty .5mtkts south ol ha Ea» Fork confluence.Sample from a wal on undeveloped land bordering the east tide of Via Arkanus Rtver. appraximalaty .Smiles south of tie East Forh confsjence.
Sampted bom a Up oil a ilorege tank In he wel house for Lake Fork Trafler Park, west of LeadvBe.
Afkansn River ai rUer parkke Fork UHP. Blend Tank
M» Fork UHP. Blend TankLake Fork MHP. Btend Tank
GW Lake Fork MHP. Bkmd TankGW^MI Eben TP. Wei 11
: SAMPLED FROU A TAP OFF A STORAGE TANK IN THE WELL HOUSE FOR LAKE FORK TRAILERGW iPARK. W OF LEADVO.LE
WATER.WASTE AND GW {Arkansas River at Mar parkWWL
749145 Pubic W«ta Systems j749153
"74920"
134920137537
749140749156749253749263
746828137S39~630604746723
746725746393746728
7413732 "1
746735
134691
134692385009"746744
746901746609"
134947746610
746816746910
"MSB5T746711
746713
746714
~74672B46663746865346686946666546942346S4424694614G94BO469499704464704520468701
~4687lT466733
-468749"469518
469556£4B»i5~
Pubflc Water SystemsPublic Water Systems
GW555"
Arkansas Rnrer ai frailer park.ake Fork MHP. Btend T«nk '
GW rLaka Fork MHP. Bland TankGw'utEtiertTP.Weltl
1 SAMPLED FROU A TAP OFF A STORAGE TANK tN THE WELL HOUSE FOR LAKE FORK TRAILERCOLOGYAHDENV ! GW PARK. W OF LEAOVILLE
WATEH.WASTE AND I GW i Arkansas River at friler parkWWL 1 CW •Arkansas River at Mar park•ubllc Water System ! GW ILaka Fork UHP. Blend Tank
Pubuc Water Systems
Public Water SystemsPublic Water Systems
ccJogyl Environment. Inc.WATERWASTEANDWWLEcokw* Environment, Inc
Ecology* Environment, IncURS/EPAEa^aErrrfronmenlinc
Ecology i Environment IK
Ecology t Environment, me
GWGW
-GWGW
Laka Fork MHP. Blend TankUt Efcert TP. Wai f 1MtEbadTP.WeBtl
Sampkid from a lap ofl a storage tank In ffie wal house lor Lake Fork Trailer Park west of Loadvllte.Arkansas Rrvei at tamer pork
GW [Arkansas River el feeler parkGW ISampb tarn the kitchen tap hi a nuklance. on County Road 44. soutt of Leadv)
GW 1 Sample from tha kitchen tap hi a residence, on County Road 44. south ol LeadviGW -Sample from a we! at a residence, on County Road 44. souOi of LaadvQGW
CW
GW
ECOLOGY AND ENV ! GW
ECOLOGY AND ENVI12WROEcotogy S Environment IncEcolona&ivtrOTmenUneEcology & environment. IncEuJouv * Eitvkuiiment me
ECOLOGY AND ENV
Ecotogy A Errvtronment Inc
•cotogy 6 Envkvvnent. Inc
GWGWGWGWGWCW
GWGW
GWEcotogy A EmfconmenL Inc GW
Sample from the kfcchen tap In a residence, on County Road 44, south of Leadvi
Swnpkt from the Ufchen tap si a teikience. on County Road 44. tout) of Leadvi
Sampto from a dug wet behind a residence on SouA highway 24. Leadvi
SAMPLED FROU A DUG WELL BEHIND A RESIDENCE ON SOUTH HIGHWAY 24. LEAOVILLE
SAMPLED FROM A DUG WELL BEHIND A RESIDENCE ON SOUTH HIGHWAY 24 LEAOVILLESC01008034DCC " " " " " "Scmpte from a dug we! behind e residence on Souti highway 24. LeadvHSampted from a lap bom the wal in a Lendvflto raddence. on Highway 300. LeadvtSampled from a kitten tap in a LaaxMOa raddence. on Highway 300. LeadviSampled from e tap from the wri hi a UadvUe residence, on Highway 300. Leadvi
SAMPLED FROU A KITCHEN TAP IN A LEAOVILLE RESIDENCE. ON HIGHWAY 300. LEAOVILLESampled from a top from the wel tn a Laedvda residence, on Highway 300. Laadvl
Sampted from a taplram the wet In a Lesdvite residence, on Highway 300. LeadviSampted from • klutan tap tn a LtadvUe residence, on Highway 300, LaadvlSampte CQlectad from a spring pool north of a ranch on County Road 44. south ol Laadvl
Ecology & Environment, Inc ! GW {Sampto collected from a spring pool north of a ranch on County Road 44, south of Laadvl
Ecotogy & Environment Inc
Ecology « Erunronmard. Inc
E^ ^ErrSorSiSrmrJOS * USGS lor EPA
GW i3*rnpto cosected trom a spring pool north of ranch on County Road 44. sou B» of Leadvi
GW : Sample coDedad from a spring pool north of ranch on County Road 44. soutti of Loadvd
GW jsampto cotected from a spring pool north of ranch on County Road 44. Mufti of LaadvlGW !-OB9a.99
UOS&USGSfar£PA GW -0999.99UOS « USGS tor EPA 1 GW 1-0900.90UOS 6 USGS tor EPA ] GW !-9900 09EPAAJRSEPAAJRSEPAAJRSEPAAJRSEPAAJRSURS Oparaana Semen for EPAURS Opera** Services for EPAUOS 6 USGS tar EPA ~JOS* USGS kir EPA 'UOS & USGS far EPAUOS ft USGS far EPAEPAAJRSEPWURSEPAAJRSEPAAJR3
GWGWWGWfTWGWGWCW
"~GW
GWGWGW
GWJew
i -9998.99-9999.99
^999999-090909 " •J~ • - -
-0909.09-9099.99
1-9999.99j-0999.99•999999-9099.08-099099
-9999.99
)65
6.5
6.5
65
-^
60
00
60
607
7
7
7
—
T
|SO
50
50
50
82
02
•«"si-
j|:i.
so : io:
— i 1
1
50
]
soTTo so50 i 10— ,- ,
sol to
!
i
50
.__.
50SO
sot 10 ; so
32
3232
32
™
49
39
39
39
39
-
SO 1020
SO32
— i"si~rs"j 20 i 32rzo"1
-iir
i
i 27
j 27
32
32
™~
39
39
+ 2Tl 39
j 27 • 39
i
H646.4"67e6
t "! a
f
hr|i :
-H-,-ll
=orJ IL_
-H- 4-
r
u
u
^
:|»LHRO-062 0
LNRD406
1LNRD-062 I
LNRD-062
1
0
LNRD-062 ; 0
LNRD-039 1 0LNRD-068.NRO-068LNRD-068jjRD-oaa
LHRCWJ06
D000
"o"
1TLNRCMOS j o"1 LNRD-039
LNRD-06000
•LNRD-060 1 0
•LNRO-006[LKRD-OOe""1
ltKRD-039
YY
YY
LNRD466
LNRD468~
LNRD-062LNRO-OOfl
Y LHRD439
•yTLNRooea"YY
Y
Y
Y
"F0
~b~000
000o"
~rLNRD-065 j 0TNRD-062 }~1
LNRD-062 j 0
LNRD-062 j 0
LNRD406
Y !LNRD-OOeUYYYY
YY
YY
LNRO-031LNRD-062
1
,00
LNRD-062~1 0LNRD-062LNRD-062
0
LNRO-006 i 11NRD462 { f
LNR0462'LNRD-062
U 1LNRD463"U JLNRD462
U
U
U
N"NNNNN
NN
"N"N
"hi1TNN
N
0~> 0
4*-v-
LNRD-062 I 0
:LNRD-062 j 0
LNRD-062]LNRD421iLNRD-021iLNRMjT"ILNRD-021
[LNRD-073ILNRD-023li.NRD-023ILHRCWOlLNRD-056
'UNRO-OS0LNRD-021
ILNR&JMI[LNRD-021
[LNRD-023
! o[ o
R1 0
To"00(10
-5-0
W
|LNRiWI23 t 0ILNRD-023 i (
App_E_gw_Tbl_1 o3.xls Page 1 of 15 10/22/2002
Groundwater Data forDissolved cadmium, copper, lead, and zinc data (mg/L) for all data sets, am
Is River Reaches 0 to 3.il cadmium, copper, lead, and zinc data (mg/L) for CDPHE data (LNRD-068).
S Art Rl.CadrrSum. DtssoNedSArt Hl.Codmlum. DissolvedSArt Hi Cudrnkm. DissolvedS Art R 1 .Cadmhxn. Disserved
PartedPeriod!
• f
MFCSbMwHsmeJUW02
Period 3 iUUWOTPeriodS UMW02Period S
SArt Rl CarJmkm. Disserved 1 Penod 3SArt Rl.Cadmkim. Observed jS Ark Rl.Cadmium. Ousorved \S Ark RlCodrrium. Observed [S Art Rl Cadmium. Dlssarved l
Periods"PertodTPeriods'Period 3
SArt HI Cadmlurn. Dissolved i Period 3SArt Rl.Codirri*n. Dissolved ] Period 3SArt Rl Codmkm Dissolved I Period 3SArt Rf.CodrreW Disserved j Penod s"
Art Rt.CadmSm. DisservediArt Rl.Cadmium, Dlssarved
S Ark Rl.Cadrnkm. Dissolved-SSiJPeriod S
S Art Ri Cadrraun. Dissolved ; Period 3SArt Rl.Cadmium. Disserved [ Period S
Art Rl~Cadrrdum Disserved Period 1Art RLCoerrdum. Dissolved ! Period 3
JUW02UUW02JUW03UUW03JUW03JUW03UMW03UUWOSLtuwoaJMW03UUWOSuuwosuuwosUUW04UUW04UUWO4UUW04
SArk R i.Cedrrtisn. Dissolved Period 3 JUUW04
SArt Rl~ Cadneum. Dissolved 1
SArt RrCndrr* .oii*arved
Penod 3 IUUWO4
Period 3 !uuw04SArt Rl.Cadrnrum. Dissolved Penod 3SArk Rl.Cedrrsum. Dissolved i Period 3SArk Ri Cadmhm. Dissolved j Period 3S"Art'Ri.Cadrrs\m. Dissolved i Pert 3
UUW04UUW04uuwos
SArt Ri.Cadmkan. Dlssarved • Period 3 ;UMWDSSJM Ht.CadWn, Dissolved i Period 3 i UUWOSSArt Rl.Cadmtun. DtssorvedSArt Rl.Codn**n. Dissolved
Period 3"Pernd's"
Art Rl.CodmUn. Disserved • PeriodsS Ark HiCodrtum. Disserved i PeriodsS Art Rl.Cadmium. Dissolved j Period 3S Ark Rl.Cedmhm. Dissolved ! PeriodsSArt HI. Cadmium. Dissolved 1 Periods..Art Rl Cadmium. Dissolved Penod 3
S.Ari Rl.Cadmium. dissolved i Period 3S.Art Rl.CadrrJum, Dlssofved Period SS.XrtRi.Cednttum.Ortsafved i Periods,AA R l Cadmium Dissolved i Period 3
SArkR1.Carirniurn.Dti»arvBd ! PeriodsS Art Rl.Codmun. Dissolved | Periods
uuwosuuwosuuwosUUW05uuwosuuwosuuwosUUW 13
UUW ISUMW13UUWI3UUW 13UUW 3UUW 4A
1 Art Rl. Cadmium. Orssolved Period S IUUW 4A[Art Ri Cadmium. Obsorved
SArt Rl.Codmkjn. DissolvedSArt RI.CodmMn. DiBiofvedSArt Rt.Cadrnhan. DisservedSArt HI. Cadmium. DisservediArt HI CadmUm. Dissolved
SArt Rl Cadmhm. Dissolved
[.Art Rl Cadmlun. DisservedS:AA"Ri.Cadrr4urri. DbsorvedS Art R 1 Cadrnfcxn, DissolvedSArt Rl.Codmkm. Dlssotved
PeriodS [UUW 4A~Penod ~3 iUUW 4APenod 3
"KSdTPenod 3PeriodsPeriods
PerbdSPeriodS
"'PenotfifSArt R1.C»dmrum. Observed Period 3
SArt Rl Cadmium. Dissolved j Period 3S Art Rl.Codrrdum. Dissolved i Period 3S.Art Rl Cadmkm. Dissolved ! Penod 3S.Art Ri.Cadrnrum. Dissolved "T Period 3
SArt Rl.Cadrrium. DissolvedSArt Rl Codrrtum. OUsobadS Art Rl Cedmkvn. DissolvedSArt Rl Codmrun. DbsorvedSArt Hi Codmfaan. DbsorvedS Art Hi Cadmium. DisservedS .Art H 1 .Copper, DissolvedS Art HI. Copper. DlssarvedS Art Rl.CappM. Disserved
SArt Rl. Capper. Observed
'UUW 4AJUUW 4AIUUW 4AJUUW4BiUUW 4D
iUUW 4BJUUW 40•UMW 4B[UUW 48IUUW 5A
UUW SAtUUW SA1UMW SAJUUW 5A
Penod 3 JUUW SBPerM3PeriodsPeriod 3
""Period's
'Period!Period]PeriodS
PertodS
SArt Rl.Coppar. Dissolved Periods
!UUW SBiUUW SBJUUW 56(UUW SBJUMW SBJUMW01'UUWOI1 uuwoi
'uuwoiiUUWOIi UUWOI
SArt Rl Cappof. Dissolved Penod 3 !UUWOiSArt R). Capper. Disserved Penad 3 iuUWOISArt Rl Copper. Dissolved Period SSArt Rl.Capper. Dissolved Period 3
5 Art HI Copper. Dissoiveci ~^ Period 3S Art HI Capper. Disserved Period SS Art Rl Copper. Dissolved [ Period 3
. — —
UUWOIUUWOI
lUMWOZJUUW02IUUWD2
J
i-"T*
7997001
rm79!ax831
1831
103C
1830
030ISCM
1131
1 131131
1 MSM;M:M:
043
843
M:i M:
H:047
047847
1M7MTM7847M7
1 647M7792
792792782792792131631031031B31831
1831
1831
1031
1031
1831
1831
1831
1054
~5sl854854054
854as-85485-0540547M701766
76.70<
176i
1768
1761
I76i
179!
179179
|GWGWGWGWGWGW
D*fle10/78/1999 admkini. Observed6/1 5/2000 iCadmkjm. Dissolved0/1 5/2000! Cadmium. Observed8/29/20008/29/20006/9/1998
7/14/1990GW i 9/8/1998GW! 11/9/1998GWGWUWCWCWGW
3/23/10995/18/19096/15/19990/17/1999
10/28/19996/15/2000
GW 0/29/2000GW! 8/9/1991GW i 7/1 4/1 9UGWj 9J8/199I
.5", 11AV199I
Cadmium. DisservedCadmsxn. OlssotvedCadmbrn. ObservedCedmkim. ObservedCadmsjm, ObservedCadmium. Oluorved"Cadmium. DisservedCadmun, ObsorvedCadmium. ObsorvedCedmejm, DbsotvedCadmkm. DosorvedCedmkun. DbsorvedCadmium, absolvedCeArilum. ObservedCadmium. ObservedCedmbm. ObsorvedCedmsim. Dissolved
3/23/1999 'CadrnUn. Disserved
GW iOAO/1999!Cadntom. ObservedGW 0/15/2000GW1 0/2A/200CGW = 6/9J19SHCW 1 7/14/19MGW i Brt/IBWGW 1 1 1/9/1991GW
W13/73/199!5/18/1991
JW • 8/15/109!GW 8/17/199!3W i 10/20/199!
^wr"a/i5«w
Cadmium. ObservedCadmson. DbsoNedCadmium. Observed
Cadmium. Obsorved
Cadmsjm, DissolvedCadrruum. ObservedCadmium. ObservedCadmium. ObservediCadmlum. ObservedCadmium. Obsorved
GW i fl/29r2000!Cadm*jm. absolvedGW ( 3/22/199! Cadmium. Observed
GW; 6n5/1999jCadrnJum.OowirvedGW1 0/17/199! Cadmium. DbsorvedGWj 10/28/1 999 'Cedmsjriv. Dissolved3W j 6/I5/2DOI
0/79/7000CBdmksn. DisservedCadmium, Observed
3/23/1999 Cadmium. DtssoNedGWj 5/17/1991GWGWGWGW
& IS/19998/17/1999
10/20/199!
iCodmkim. Dissolved'cadmium, Observed[Cadmium, Dbsorvedi Cadmium, Observed
fi/l 5/2000 ICedmkim. OlssotvedGW j a/JWOOOjCadrnkm. DisservedGW j 3/23/1991 JCtdmion. ObseivodGW ; 5/17/1999:Cadrnhjm. Observed
GW i 0/1 7/1999! Cadmium. DissolvedGW 1 0/28/1999 jCerjmhim. DissolvedGWGw"GW
6/1 5/2000 iCaamlum. Dissolved0/29/200 iCtdrnsun. Observed3/23/1999JCadrnJum. DbsoNad
GW! 6/15/1999'Cadmkm. ObservedGW { 8/17/199SGW i 10/28/199!GW J 6f29/200C
'GWGW
GWGWGWCWGWGWGW
GWGWGW
ICadmsm. DbsorvedICodrnkim. Dbeorved
5/1 9/1099 •Cadrnkm. Observed6/15/1998/17/1991
10/20/1991'"evisnooi
; Cadmium. ObservediCadmkjm. OluorvedrCsdmmjm, DbsolvedICadmsjiTL ObsoNed
B/29/20rJOiCadmkim. OissoNad6V9/I99
7/14/1999/8/1991
*~sS!S1 5/17/199-1 Bfl57l89>
GW ! 8/1 7/1 99"GW [ 10/20/199GWGW
GWGWCM
i Copper. Obsorved'copper. Obsolved! Copper. Dbsorved
,. Copper, Dbsorved^Copper. DissotvediCopper. Obsorved
liCopper. Dissolved9: Copper. Dbsorved
! 671 5/2000 iCoppor. Dissolved"oWTOOOiCeppar. Observed"
r r/WiasBi Copper. Observed9A/1BS
TlfiVIW
J ! — j ffi.™
1 iCepper. DbsorvedijCopper. Dbserved
0.017610.0144! 10.0141! 1
0016
"oofse0.007
" 0.0035] 100046! 10.0034; 10.0022 100091 10.01110005400041 10.00470.0033;o.ooos! <0.0015: <0001 Siooois! <o.ooos! <
•££! -rOOOIOj 10.0018!0002J
0.0079!
0.01!0.0052000540.0117:
0.01ie!0.0111J
OOOfl!0000-
0.0126;0.0005;
00046;0002|
0.00091ooois;OJX14o.ooos0.000900031
"00009*"0.0009!OOOOIj
0.00055!0.0005=00009
000090.0009!0.0001!
0.00062!00513
0.095S001310.0303J
0.0014000021
0.0044 =0.0034!o.oosz!000090.0030^
U.U2320000I0.0010.001OOOIj
oociosj0.0021 s!0.002 15]0.0104!
0001250001100012
0001 «0.001 40.001 [ <
- i-^5E^- — ~ J ^;— " — 1~
0.0050.005D"005'
1005
1005
I.OOS00050.0050.0050.0050.005
1005
1005
1.0051.005
00050.0051.0051005
I.OOS0.005
0.005
dobT1.005
OD050005
0.0050.005>0050.0051005
0.005}OOS
00050.0050.005
0005£005laoos
30050.0050.00500050005a oos~0.0090005000500050005
0.00500050.005"00050.005
0.0050.0050.0050.003
000500050005000!
0.0050.005
1.3" .3
.3
33J3
.3S
.3
.3
.3
.3
'. —
11
11100001110900D030
0
n00i
iiiiitiii0
00000000o"00000
T0001
11
4-"5"010010(10
00
"o0c0t
0ct
—
1[• 4SSSB1
H 704554\ 704040. 704092. i 7046104 i 468765 'H ! 468781L j *68797_i
L j 469693H ; 469712H ! 469731.L |~469750L i 4097C9H~ j 704720 *LH>i
LL
704702400029408045^4O0001468877
•l' 'URS Operaang SerMcas tar EPAURS ODarsav'Servtes (o7£PA~URS Oparatng Services lor EPAJRS Opening Services for EPAJOS 4 USGS tor EPA
UOS & USGS tor EPAJOS & USGS far EPA
UOS A USGS far EPAEPA/URSEPAAJRS•PAAJRSLPA/URSEPA/URSJRS Operalng Services for EPAURS Operetta^ Services for EPAUOS 1 USGS far EPAJOS & USGS faf EPAUOS i USGS far EPAJOS ft USGS fat EPA
L 469788 ! EPAAJRS
H 469826 JEPAAJRS
T1
HLH
469872""7048167M072~
EPAAIRSURS Ooerttng Services for EPAURS Operating Services for EPA
468893 UOS * USGS far EPA^46a909"~[uOSTuSGS tor EPA [
L 488925 jUOSft USGS lor EPAL j 408941 IUOS i USGS far EPAL i 463091H I 4fi99lOH
H j 409629L ; 469948LHLL
HLL
4699877049QET704902
"470747"
470004470023
H 705600CT 7"05656LJ 470802H 470901H 470920
L 1 470950H r705690
~H
LL
703740470977470996
471031471053
H i 703700L~) 705836"L • 471072
HLLL
471110471129471148
EPAAIRSEPAAJRSEPAAJRSEPAAJRSEPA/URSURS Operalng Services for EPAURS Operating Services for EPAEPAAIRS
EPAAJRSEPAAJRSEPA/URSURS Operating Services (or EPAURS Operating Services for EPAEPAAJRSEPAAJRSEPAAJRSEPAAJRSEPA/URSURS Opervtng Servlctt'roTEPAURS Operetoifl Services tor EPAEPAAJRSEPAAJRS
'EPAAJRSEPAAJRSURS Operating Services for EPAURS Opening Servtcas tor EPAEPAAIRS
EPAAJRSEPAAIRS'EPA/URSJUR3 p^eraBryServlces for EPA
H 1 471186 jEPAAJRSHT.
! 4712051 471224
L ! 471243H"J 765964LHHL
LH
~H*
705980408041
408073
I"40B42546D444
j 409403LJ 409402L [ 409501H j 704463L J 704525
! EPAAJRSJEPAAJRSi EPA/URSiURS Operalng Service* lor EPAiURS Operaono Services lor EPAUOS t USGS br EPAUOS t USGS far EPA
^UbS A USGS"far EPA
EPAAJRSEPA/URSEPAAJRSEPAAJRS
iURS Opening Services for EPAlURS Opermtng Services tor EPA
H i~4M721 IDOS * USGS far EPAL { 468737 [UOS A USGS tor EPAL ! 4087U tUOSt USGS far EPA
J !_^
GW~UWGW*GWGWGW ,GW
9999.99•9999.99
4999.99 I499999 i-990999
GW -999999GW j-999999GW '-4999.99
IIS
e60864
4
\ i 4i
GW 1-9999.99 ] {GW !-9999.99 [ !Gw"1
GWiwCWGW
-9999.99 --999999 !099999 !9990.99 ;
-9999.99 'jW i-9999.99 jGWi-8999.99 "
!i J1
|11
119-_-
N
••VrV '"
LNRD-023N ^LNRD-OSON !LNRfW»0N {LNRD-OSB
TTilNRMSB !NN
0 ! N
" 9"7 H4 9 L H_J4
4
4
4
4
9 | N
9 JN
00
T6"
LNRO-021 ; 0LNRD421 t 0LNRD-021LHRM31LNRD-023LNRMT)
LNRD-0239 ) N iLNRD-023
! ,_< ! 9 i H1 3 5 ! 8.5 | N
i>W j-9999.99 i
GW 499999 j ) i
GW -0999.99 !
3W 14999.99GW S-9999.WGW j-0999 99 iGW i-0999.993W 1-099699 'GW ;-9099 99GW I-B999.99GWj
GWGWGWGWGWGW
GWGW
-9999.99•999999-9999.99-8999.99-999999-9999.99-999999 i-999999 i
4999.99 ' !'499999 !
GW i-9999.99 iGW j-999999 iGW i-9999.99GW j-9999.99GW j-9999.99GW i-9999.99 iGW i-9999.99 !GW i-9999 99 |GW 1-S999 99 '•GWGWGW
GW
-9999.99 !499999 14999.99 I
499999 ;GW 1-9999.99GW i-9999 99 •CW 1^99999 tGW
GWGWGWGW
4999.99 |
3.5 O.S • N
3.5 ! 0.53!s"i"(L5"
N
LNRO-050LNRCM331' 1
LNRO-021
000
00o"000
LNRO-021 i 0N JLNRD-023 i 0
S i 3.st~8.5 i N JLNRD423 0
j 1 3.5 ! fl'.SII
_....i
35.„„.,
22
! i 2
-fl
O S"5.5~
7„_
"^___
N
7 j N__._;___
7 N"N
2 J \ Hf 2 i 7 i M
! 21" "~2
7 N
i 2 i 7 Ni 3 1 8
Tai 3
i ! 3
- |— i 3"
i
_.L.._.
0600
Y.I"
0080a
80
N
NNN
~STN
LNRD-023 ; 0LNRD-OSO ; 0
LNRO-021 0LNRCMJ21 T6~LNRO-021LNRD-021LNRO-023LNRD-023LNRD-023LKRO-Q2SLNRO-023LNRD-OSOLNRO-058LNRO-023 ^
LNRCK123LNRD-023
00000000
0
0
0LNR0023 0LNRO-OSO _jLNRD-OSO
J>...LNRO-023 0
U8 0^ N iLNRO423
"o'St'iT: ! 6.0 ! 8 8 N
le'eTa B' ! Ni 06
"T"0812
N"N
i ' j 12 N
! 7 ; 12 i N! j 7 ; 12 N
f t"-fH~fHN
S [ 5 i N
r4999.B9 \ 1 S ! 5 ! N4999.99 !4999.99 j4B9an
GW 1-9999 99GW i-0999.99 jGW -9999.99 !GW r-9999 99 jGW 1-9999.09 =GWGW"
4999.99 [[4999.99 ' ' ~" "" ••• T —
GW !-9999.99 !Gwi-9999.99 "" " " " r '
GWj-999999GW 1-9999.99GW j-9999.99GW I -9999.99
GWGW
6wCMCM
4999.99
4909.99 | "499999 1499999 !
! I 3 51 : S
3 nr^^ 0
3y~r
0
i e
N
N"N"
LNRD-023
LNRD-023.LNRO-058[LNRD-058ILNRD-023!LNRD-023
ILNR&023
00
~~rJT00000
0;LNRD-023 [0JLKRCMJS8 i 0ILNRLVOM•LNRD-023
ILNRD-023
00
0: LNRD-023 0ILNRD423ILNHMSB
N ILMRD-023NN
iLNRD-023ILNRD-023
1 3 i 6 N JLKRD-023i s 3 i 6 N iLNRD458i i s i a ; N;!
__!!
J 0 4 i 1 1 .4 1 N114A 4
64
HULAjjl.4; N
11.4 N"6.4 11.4 N0 4 i 1 1 .4 i N
: 64i fifi
. i . L"! 0.'
it 1.4 1 N11.41 N11-4 INJiJIN
- i "• or M r«i
; LNRO-OSO'LNRD-OaiLNRO-021
•f0a001
00(1
iLNRCWHt ~* Q
NRD-023 j 0^NRO-023ILNRO-O23ILNRD-023
'LNRD-OSO•LNRD-OSO
!LNRf>-021~;LNRD-02t:LNRD-02I
cc
4-?-
0n
t0
App_E_gw_Tbl_1 o3.xls Page 2 of 15 10/22/2002
Groundwater Data f<Dissolved cadmium, copper, lead, and zinc data (mg/L) for all data sets,
is River Reaches 0 to 3.I cadmium, copper, lead, and zinc data (mg/L) for CDPHE data (LNRD-068).
. '•'• '-. . ."••: .."•:..•- ' , .:i .- ". • •• .;. --^:'-j-.-!i;.'.-.,4ri-'•/ ''••"'•'• '•'.:. "• / ' -.I:':! ;":vi;^/^V**V.:
: . • • : * • . > • . - ' 'Cam U. „ ' . ' • ' . ' • " 'period :".'.''' • loTO8lo.iiM.nir >X :*":
S Art Hl.Coppor. Dissolved Penod 3 !UUW02S Ark RV Capper. Dissolved Pertod 3 JUUW02SArt Rl Copper. DusorvwJ Pertod 3 JUUW02SArt Rt.Coppor. Dissolved i Period 3 1UUW02S Art Rl.Cappar. OiuorMd } Period 3 :UMWQ2SArkRl Coppar. nssahwd : Pertod 3 UUW025 Ait HI Caooei. assarted i Penod 3 UMWOZ
Art Rt Copper. OlisaNad Portod 3 '.UUW03SArt Rl Coppor. Dttiahad L?*" 3 [UUW03
Art Ri.Copp-. Otiiatnd Period 3 JUUW03SArt Rl COOPV. Dissolved Period 3 JUUW03S Art HI Capper Unsolved Penod 3 IUUW03S Art Rl.CcppV Dn*rtvnd Ponod 3 1UUWQ3SAifc Rl.Cappar. OiisaWed ! Period 3 UUW03SArt Rl.Cappar. CNssolvad Pertod 3 ;UUW03SArt" Rl.Cappar. Oitsatrad ! Pertod 3 JUUW03S"AA Rl Copper. Dissolved ; Ponod 3 (UMW03S'Arti Rt Copper. bliiohed Portod 3 JUUW03S Art HI Capper. Dltsafved Period 3 JUUW04S.Art Rl.Copper. Dissolved ! Periods UUW04
S.Art Hi Cappor. Dhsalrad ; Ponod 3 JUUW04SArt Rl Copper. Dissolved ' Period 3 1UUW04S Art Rt.Coppor, bTssohad ! Period 3 JUMW04SArt Rt.Coppei. Ofesatvod ! Period 3 JUMW04
SAriLRI.Capper. Dissolved ! Portod 3 !uUW04i Art Rl.Cappo.. JbiMotved i Period 3 JUUW04
S Art Rl Coppar. Unsolved Penod 3 IUUW04SArtRirCoppOF.'aiioNid' Period 3 JUUWOSS.Art Rl Coppar. Olkcatved • Pertod 3 ! UUWOSS?M RI.CaKMf'. DfesiobMI i Period 3 ; UUWOSS Art Rt. Cappw. Otssalvad i Period S [UUWOSSArti Rl" Copper. atsaWwd j Period S jUUWOSlArtRI Copper. Dusotvod Period 3 UUWOS
SAikRfCorjpV. Dissolved j Period 3 JUUWOSS Art Rt.Cnppar. Disserved i Pertod 3~j UI4WOSS/Arti Rt.CoppBr. Di*«J*vod i Period 3 UUWOSSArt Rl Coppor. DUtoNod ! Pertod 3 UUWOSS>rt Rl.Cappar. ftssofved I Pertod S UUWOSSAiiRl.Cnpper. Dissolved i Pertod 3 UUW13S Ark Rl Capper. Dissolved • Penod 3 UUW13S Ark Rl Conner. Oissahrad J Periods UUW13S Ark Rl Copper. OrstarMd j Period 3 UUW13SArtRi. Coppor. Dissolved 1 Pertod 3 !UUW13SArt'HVCoppw. O«at«d i Pertod 3 iUMWISS Art Rt.Coppor. Dissolved i Pertod 3 ;UUWI3SArtHI.Cappai. OlsiaiVed [ Pertod 3 ;UMW14ASArt Rl.Coppw. Obsatvod ; Periods UUW14ASArt Rl.Copper. OissotMd i Periods UUW14AS Art Rl.Cappar. bttsotved ! Pertod 3 |UUW 4ASArtRi. Coppar Dissolved I PenodsiuUW 4AS"A* Rl.Coppor. Dissorvwl 1 Periods UUW 4ASArti RT.Copper. Dissolved j Periods UUW 4ASArt Rl.Cappar. Dniahad ! Periods iUUW 48S*Art¥i. Coppor. UstolMd Period 3 UwW 48SArtRi Coppor. Dissalvad Periods UUW 4BSArt Rl.Coppw. Otosohwd ', Pertod 3 iUUWt4BS Ark RVCappar. Dissolved i Period 3 IUUW 149S Art Rl.Copper. OlssoNad - Pcrtod 3 [UUW14BS.Art Ri.Cappei. Dissolved • Poriod 3 1UUW14BSArt Rl.Capper. Dlssatvod ! Period 3 !UUWI5AS.Art HI. Coppar. Dissolved [ Penad 3 {UUW15ASArh Rl.Capper. Observed | Period 3 UMWlSASArt Rl.Cappar. Otssolvad J Period 3 JUUWISASArt Rl Copper. Otssalvod j period 3 JUUWlSAS.Art Rl.Cappar. Dissolved Pwtod 3 JUUWISAS Art R rcopper. JHnolved Penod 3|UUW15BSArtRl.Capper.Dlssolved Period 3 ! UUW 158SArtRt~Coppar.bissolvod Periods UUW 1 SBSAitRI Capper. Dissolved Penod 3 UUWI5BS Art Rl.Cappar. Dlssorvod j Portod 3 1UUW156S.Art Rl Cappor. Disserved ; Period 3 .UUWISBSArt Rl.Cappar. Dissolved j Pertod S lUMWISBS~Art RI.Lud. Dissolved ! Period 3 'tJUWOS Art Rl Lead. Dissolved ! Period 3 UUWOS Art RI.Laod, Dlssorvad T~Pwiod'*3" UUWOS.ArtHl.Leod.6TssolVad . Pwtod 3 UUWOSArt Rl Lead. Dissolved j Pertod 3 UUWOS Art Rt Lew), biisatvad p.nad 3 JUUWOSArt Rl.Load, OlcsctfMd ' Ponod 3 'UUWOSArk RTLeod. oWiidd I PeriodTJUUWb ~~ "S Art Rl'Lead. Dissolved Portod S iUUWOS Ark" HI Lead. DJctaivod 1 Period 3 ?UUWOS Art R 1 Lnod. Dissolved {j>eriod 3 iUUWOS Art Rl (dad. DUsarved i Portod 3 iUUWOJSArt Rt Lead. Dlssalvod ! Penod 3 i UMWOZ
*t 9!
~7999999
1 9(99
83C
I3(
I3(850830
830
B30043843
04304304!H;H:
~043
8430470404714047
~"547047
^047047047047792792792
ii sis iii i!i i i!i!ili!ili iiililiiill ill ililsliilN
lllllii ill iliillilillliliiili
IGWGWGWGWGWowlGWGWGWbWr,wGWGWGWGW
GWGWGW
GW
^-GW-
~rwT
GWGWGW"
GWGWGW
"cw"GWGW
GWGWGWGWGWCWGWGWGWGWGWCWCWGWGWGWawmvGWGWGWGW
GVVCWGWGWGWGWGWGV)GWGWGWGWCMGWGWCWGWGWCWGWGWGWGWGWGVCW
5/1 7/1999 !
671 5/1999 i8/1 7/1999 j
6/15/20000/29/20000/29/20000/0/1999
7/14/19909A/1998
3O3/19995/10/19990/15/1999an7/1999
10QO/1999___6|15/2000
619/1998
.«*19»B
^ 11r9/19983/23/19995/18/19996/15/19998/17/1999
KV2BV1999
bVlS/2000OQB/2000
1_ 8A/19987/14/1996B/a/1998
11/0/10983/23/19995/18/19996/15/1999B/1 7/1999
6/15/2000
5/17/19996/15/19998/17/1999
1 0/28/19996/15/70000729/30003/23/19995/17/1999B/1S/19998/17/1999
1 10(78/19990715/2000
1/23/1 8985/17/1999o/IS/1099B/17/tS9(
10/28/1999
± taanaoo> 3/23/1999i snwioK^ 6/li7r999^ 8/17/1991
10/28/1991
3/23/19995/19/199!6/1S/199B
| 8/17/19M10/28/199!0/15/2000
; B/29/2001! Kr9/193E
T" '1/9/199i 3/22/199St 5T17/199!I 6/15/199!
"j aTl7/199t10V2D7199
i 0/15/200i Or29nDOt• 6r9/t99! 7/14/1991
;opper. Obsotvediper. Dissolved
Copper. OocolVodCapper. Dluahed
Copper. DissolvedCopper. DissotvwlCopp...Db»o>v«dJ3ppof. DtStOtVadCoopsf. Dtssatvod
^pper. DbsotvedCapper. Dissolved
Copper. ObsahrodCopper. Dkssorvod
Capper. Dtsiurved
Copper. DissolvedCopper. OUsotvedCapper. DbualvadCapper. Dissolved
Capper. DissolvedCoppor. OasatvedCopper. DissolvedCcppor.OlssaNed
1Copper. DtaaaNed
Capper. DtetotradrCopper. Dissolved
Copper. Dtesotvod
Capper. ObsatMdCoppor. DisservedCapper. DtssotMdCapper. Dissolved
Capper. DlssarvedCopper. Ots solvedCopper, DissolvedCapper. DissolvedCapper. Dissolved
Copper. DissolvedCopper. Dasalved
Copper, Dissolved.Copper. Dissolved
Copper. DissolvedCapper. DissolvedCopper. DttiatvBdCopper. DissolvedCopper. DissolvedICopper.DiuotvMJCppper. Dissolvedi Capper. DissolvediCopper. Dissolved[Capper. DissolvedCoppor. Dissorved.Lead, Dissolved
jLeed. Dlscotved
[Lud. Dtssotved!LMd. DOsohediLe*d. Kisotved!LMd. Dissotvedil'Md. Dissolved•Lemd. Dissolved
000215J0.00215*0.0022:
o.ooll
00014[
00019JOOOli0001
0.0010001'
0.0005OOOJlt000215;0.0022;
000125!
00006'0001:000V
0.001
0.002156.00215
0.0006" 0001
1 0601o.oo io.oot
000110002150.0021500022
0001250.0008000000.0010
000215000215
0.00125
0.00060.0011
0002150002150.0022
0001250.0003
0.000750.0014
000215000215
0.001250001
0.00075' OUOS
0.00370022
0.014400059oojw0.0018
00021!00021500022
00012500024._„_-
0.00
0.001400001
0.00
0.0V
0.0140001
0.0077!aoboi
aoo"0.00
0.000!
T
-
.1
1.31.31.3t 3.3
.3"~r
.3
.3
TT1.31.3
1.31.3
t.31.3
3
3
.3
.3"s".3
.3
.3
.3
.3
.33
1.31.3
Ts~1.3
3
3333333
' 3"3
333J.333.3.3T.3.3
t.1.tt.1.3
.31.31.31.3-..__
0.015001S
00 S0.0 50.00.<f
or-b!o
j 0.0"060.0000.0
0~uD0
0
~0~0000nn00
__.
000
0
00n
0000u0000000
-s"o"0000000u00000u00-_-
000
"o00000
00If0000u0
-b~00
"b""b~
0u
H"HL
L
H
"L"t"1H
TTlL
T-HHLL
H
-f-l-n
1LHLHHLLLHHLL
~H~L
HH
LHLLH
LLHLLHHLLHLLHHLLTLHHL
H
fT
LLL
'H"IfLL
"H"LHH
RsfltMO469539409550409577"
TMMr1
704615408769400705468801
469695469714"469733
48977)
7047874008334600494BaB£5468801
^469790
"469828"'469847469B7470482170487746889T468913
r4089294689454698934C9912469931"469950~4B99697049 U704987470749470768470787
EPAAJRSEPAAJRSEPAAJRSEPAAJRSURS Operaoig Services tor EPAURS Opormfeng Services lor EPAURS Opermttng Services lor EPAURSGpenfcngSorvlcesforEPAUOS * USGS tor EPAUOS « USGS tor EPAUOS * USGS tor EPAUOS A'uSGStor EPA
EPAAJRS'EPAAJRSEPAAJRSEPAAJRSEPAAJRSURS Opening Services for EPAURS Opereeno Servkes far EPAUOS a USCS far EPA
LUOS a USGS tor EPAUOS a USGS far EPAUOS a USGS for EPA'EPAAJRSEPAAJRSEPAAJRSEPAURSEPAAJRSURS Operssng Servfces lor EPAURS Opening Services lor EPA
UOS ft U3GS far EPA
UOS a USGS br EPAUOS a USCS far EPAEPAAJRSEPAAJRSEPAAJRSEPAAJRSEPAAJRSURS Opening Services for EPAURS OperiUng Service* tor EPAEPAAJRSEPAAJRSEPAAJRS
470806 EPA/URS470025 EPA/URS
~705Gatr*URS Openong SorwesVia7EPA705661 URS Opora&ng Services (or EPA470084 IEPA/URS470903 ; EPA/URS
470938 EPAAJRS470960 iEPAAJRS705696 iURSOpornSng Services far EPA705751 lURS Operating Sendees (or EPA470979 iEPAAJRS470990 ! EPAAJRS471017 iEPAAJRS471033 iEPAAJRS471055 = EPAAJRS
705790 |URS CperEBtO Sorvieoj for EPAt 705841 !URS Opsrmting Services lor EPAj 471074 jEFAAJRa! 471093 iEPAAJRS1 71112 JEPAAIRS' 71131 IEPAAJRS
71150 ,EPAAJRSOS87S JURS Operasng Sorvkes for EPA
^7 1189 iEPAAJRSi 471188 JEPAAJR3
i 471207 jEPAAJRSj 471220 EPAAJRS
47l245lEPAAJRS705909 luRSOperatng Services far EPA
| 400043 lUbsaUSGSfar EPA[408859 JU^Sj UMia'itafEPA• 4S8875 lUOSIUSGStor EPAj 468691 iUOS a USGS for EPA! 469420 S EPA/URS1489445 TEPAAJRSj 469464 j EPAAJRSI 409483 ! EPAAJRS
469502 1 EPAAJRS1~7()4473^URSbpenlbnisVrvieW^E"PA~! 704&29 URS Opendno Senices tor EPA1 468707 !UOSaUSG5torEPA! 408723 JUO3 4 USGStor EPA
l!lil|liS
|ililli3
l3:S
lSiS
]8$3il]
^
:
cwGW"GWGWGW*GWGWGWGW<JWGWGWGWGWGWGWUWGWGWGWGWGWGWCWnwcw
GWGWGWGW
GWGWC«
GMGWGWCWuw
",Ji'.- '•"• ,': ; -\'f ™ \ir •"•-' "•'..* '.'.'."'f.' : - ^- \ ''•:• V -E' ' ' • ' • ' • " - • ; . .:, trjeaatobon. •,; ; — i._: • .. -^ . : — i, ••.:. - . :f^•999999
-9999.99 !-B9B9.99 |9999.99 1•4)99999 jW9Q« 1•9999.99 I-•9B9.99 ;
•9999.99-M99.9B '
9999.99 '• !-9999.99 ' '-9999.99 ! !-9999.99 ; !-9999.99 ' j4r99B99 | '.9999.99 !-9999.99 !-9999.99 !
•9999.99•9999.99-9999.99 :•999999-999999 i
499999 i•9999J9 i-9969.99 !-9999.99 i-9999.99 i-999999 i-999999 !-9999.99 I'-999999 !-9999.99-9999.99-9999.99-999999•999999-9999.99-9999.99-0999.99-999999-999999-8999.99 ;-9999.99-0999.99p«99999 !-999999 !•999990 !-999999 !-9999.99 i,•9999.99 j'-099999 j-9999.99 ;-999999 j4999.99 !-999999<-9999.99i-9999.99 1-999999 i•0999.99•9999.99•-0999.99-9999.99-0999.99-9999.99-9999.99 j-9999.99 ;
1-9999.99 ij-9999.99 j
jjl9W.99^ ^ ^ J_u,-LT_._r ._ -n ._-_-. - ._.) ._.
1-999999"-M99'.n " "j-9999.99\49MM!-9999.99
j-9999.99{•9999.99{-9999.99 ;I4999.99 ' "~"!"~E-999999 |
Ti 1
r 1
1 1
1 M
1 1
1 1
1 M
II M
1 II
! 1
! 1
i 1
! 1
i 1
! 1
1 1
II i
1 |»
"W«
ii
T
1
ii
-
-—
4__J
f-i.__F
•i —
tr
OT
"T"'0 'a6
B~5~
444
4
3.5
?*.J
»3.33.5
'J
r^
2
2
333
~3~S3
"sf0.8~008B
"o'a™68Vi"/7171
7/.™
3"3""
1 3
3
P33T
3
8.4
6.40.484
! R4
fn: «<
Hi1 6"~T
11 i
it '.
TT
11
TI9 i
9 :
99 jy9 ;
„__•
8T5•T
.•1.
TT
as__
77
7
B0
-fl-
01~a~n
a
*0.8B.BTa-8.B
"iTa121712
Hi-"-f
55
~S~0
,___
0
i..,_
• a
jtl.4)
11.'11.4
11>
U.4
11.4
tt.4
"Ml t
11>
i 1 1 .4
' 11
TTT
N '•NNT!LN
"
-S-
KKN
1
""N"N
N
N
.!L
"N~N
NNN
"_iNN
HNNNNNNNNNN
"N"N~N~HNNHNNNN
NNNH
t H
H
JLH
Jl
~.~H
UlULi N
NN
*~N~NN
i Ni N! N= N
flLKRb-023~|LNRD-023LrfRD-073 TLNRD-023LNRtMSa"LNRD-OS8
fNRD-05BLNRD-021
LNRCMJ31LNHD-021.NRQ-023LNRO-023LNRD-073LNRD-023LNRMn 4
LNRD-OSiLNRO421LNRD-021
LNRO-023 .LWRSbaT"1
LNRO-023LNRf>O23
LHRO-OS8
LNRD-021LNRDXnT"1
LNRD-021LNRD423LNRD-023LNRD-O23LNRD-023LNRO-023LNRO-OSOLWUMISOLNRO-023
LNR0423LNRD-023'lNRD-023
LNRO-OSBLNRO-023LNRD-023LN*R6-023LNRD-023LNRDSS"LNRD-058LNRD-058LNRD-023LNRD423LNRD-023LN*RD r23LNRD-023LNRD-058LNRD-058
rLNRD-023
tLNRD-023
iLNRO-023•LNROJH3JLNRD-05B[LNRD4I23JLNR0423iLNRO-023JLNRD-O23
TLNRDMSTiLNRf>050
•LNRD-021JLNRD-021!LNRD-02lLNRM2tJLNRO-021ILNRD-023JLNRD-023'JLNRO-O23{LNRO-023iLNR'fiOM
ILNRO^MO-ILNRO^ST[LNRD-021
100000
0
"o"00o~00T0
0
"o™00
00
"fj~
0n
00000
0
T0u0V
0*T
0000000u
"o0
JL000000000T000
;0rr1 °
n^0
01 0
0~fl-
•Q0
\ 0
t o
App_E_gw_Tbl_1 o3.xls Page 3 of 15 10/22/2002
Groundwater Data forDissolved cadmium, copper, lead, and zinc data (mg/L) for all data sets, am
River Reaches 0 to 3.ital cadmium, copper, lead, and zinc data (mg/L) for CDPHE data (LNRD-068).
• - . . . • Cau . - . - . • •SArtRI.LowJ. Diwotv«dS Art Rl Lead. Dlssav odi Art Rl Lud. Dliialvad
Pertod^:" -:ti iiiiii -V: ,
PcriodS UUW02Period S JUUWO2
S.Art Rl Lud. btiiofrad Period 3JUUW02
S.Art H1.Lud. DIuaNod • Period 3 !UUW02S Art Rt tMd. Oiuohed j Period 3 JUUW02SArt Rl.Lud. DliMfwd 1 Parted 3 jSArt Rl.lMd.OHaoNwd ; Period 3 |
UUWOIUUW02
SArt HI LMd. OtMofrad f Perid 3 (UUW03S Art Rt Lud. CMuovwj Parted 3 ;UUW03S Art Rl Lud. Ottiohed • Parted 3 iUMW03SArt HI Lud. bitiobed i Parted 3 JUMW03
Art Rl.Lud. DluoJved | Parted 3 IUUWO3
Art Hi LeM. DtuoNed iSArt Rt Loud. Dmotved ' ~Pertbd"3~ JUW03SAikRILud.auo«ed [ Parted S !UUWOS
Parted 3 UUW03
SArt Rt.Lud. OnuMMd ! Parted 3 [UUW04SArt RLLnnd. Otatthed ! Parted 3 JUUW04SArt. Rl.LMd. Diuafred J Parted 3 JUUWO4SArtt Rl.Lud. DfotdvedS Art Rl.Laod. DUtGH-od
Period 3 JUW04UUW04
SArt Rl Lud OutotMd J Parted 3 UUW04SArt Rl Load. Diuoivod ! Parted S |UUW04S Art HI Land. Diuojvad
Art Rl Lud. DUUwadS Art Rt Laod. DliioNedSArk Rt.Laod. OUMfvedS Ark Rt.Lud. Observed
SArh Rl.Lud. Oi»«radSArt Rl Tend. DuMhedSArfc Rl.LMd. OtuDfeodSArt Rl LMd. OtuttmaS.Art HI. LMd. DisK*edS Art Rl Load. DluobedSArk Rl Load. D»Mh«d.Art HI LMd. DIuoNed
SArk Rl.Lud. DluarmdS Art Rt.Lud. DlMCfeedSArt RLLend. DluobedS.ArtRI.Laad. Dtiidhed
Parted 3 :UUW04Parted 3 IUUWO4Parted 3 'uUW04Period SjPeriods
"Pa'rtodT"Parted 3Period's"
PeriodsParted 3PeriodsParted 3jParted 3Panod 3
"Parted 3'
UUW04UUWOS
UUWOSuuwosUMWOSuuwos
UUW05UUWOSuuwosuuwosUUW 13UUWOUUW IS
S.Art HI. L«ad. OlitoNod ! Period 3 JUUW 3SArhRl.LiwJ. WswNfld ! Parted 3 ;UMW 3
S Ark Rl. Laad. DtaHrtMd Parted 3S.Art Rl. Laad. Dutorwd j Panod 3jSArh Rl.LMd. DtuolvedSArt Rl Laad. Diuohed
Period!"Periods
SArt Rt Lud. DltMtved j Period 3
S Art HI Land. PuolvedS Art Rl Laad. a»c*wdS.Art Rl.Lud. DincfeadSArt Rl Lead. Dluolved
•pertadTParted 3
UMW 4AUUW 4AUUW 4AUUW 4AUUW 4A
UUW 4AUUW 46
Parted 3 UUW 4DParted 3 luuw 48
SArkRl.Laad.Otuolved Parted 3 JUUW 4BS.AA Rt.LMd.Dluotved ! Parted 3 iUUW 4BS.Art Rl.Lud. OliiotoedS.Art R I. laud, OfuoffodSArt Rl Lud. DluolwdSArt HI Laad. diuatnd
-£!3fJ>arted3
S.ArkRlL*ad.D(uafeed i Period 3S.Art Rt Laad. OMiorvedS Art Rl Lead. DtuobedSArtRILud. OiuofrndS Ark HI Land. DIuoNad
SArt HI. Land. DliuNedS Art Ri.Land. OtuotodS.AA Rl.Lud. DUtolMdSArt RI.Lud. DrtaorvedSArtRI.Zinc.OlswfvedSArt R 1. Zinc, OiiMrvad
S Ark Rl Zmc. DicMrvad
SArkRI.Zbw:.DIuorved
SArk HI. Zinc. DlnohMdSArt R I. Zinc. DUsotved
S Art Rl Zinc. OUstfvod
UUW 48UUW 48UUW 5AUUW 5A
UUW 5APeriod3 UUM 5AParted 3 tuuvi 5AParted 3
^Period S
Period 3Parted3Periods
UMW SBUUW 5B
UUW15BUMW15BUUW13B
Parted 3 IUUW15BParted 3 UUWOParted 1 JUUWOPanod 3 UUWOParted S 'uuw6Parted 3 JUUWO
Period 3 JUMWQ
Panod 3 UUWOParted 3 UUWO
t lS— r:
IT9i799790
—I"TinJK
7991130
IV s
GW wissa
f
'V t
LMd. OlsiotvadGW 1 1 1/9/1998 [Lead. DtuoivedmvGW
GWGW*CWGW
3/22/199915/17/1999!
ud. DbsotMdLMd.Dtsao(wd
a/17/1999lLud. DlUotvM10/28/1999 LMd. Dtuohtd0/15/2000 Laad. Olimriaj6/29/2000 'Lead. Diuoived
GW 6WI998;630] GW [ 7/14/1998
1l3fl[GW :830830
830~~630
63063C
84364:843843643843843843843843843047
847" 847
•47847
104104
104
184
1792
1792
r~i792
1792
1702
~7021831
1831
1831
1031
1831
1B31
1B31
103t
1831631B3t831831854
1854
1854
18*IBS1654
1B5
IBS'
185185
J8S-
I76C17617«178
-Tni
17617&
GW;9W1996
11*1098GW I 3/23/1999
GWTSTGWnw
6/15/1999'0(1 7/1999
_1_0/2a/1999_
GW I 6/9/1 996GW t 7/14/1996GWlGWGW~nv
GWGW;w
GWGWCW
GW"
JWGW
GWGW^WGW.GW
csrGW
Lead. DU*oiv«]A*d, OistarMdLud. DiuohtdLaad.Dluor«w
Laad, DIuoNadLaad, OlisorvwLMd. DttaohndLMd. Dtaaornd
Lnd.Oiualvwd
9Ar1990iLaad.Olnolv«d1l/9/l9M!L .OtuoN»d3/73/1990 Lud.Dluorvwd5/iOM 099 i Lead. DiiaoNed0/15/19998/1 7/1999
Imtd, DUaatvwlLud.Diuolved
lO/28/1999!Laad. DoaoNed0/1500008/29/2000
_fi¥.l9?£i
am/tosa
Lud. DhnorvMLurJ.OU»arndLMd.Otuotw«d
LMd.Dtuotv«d1 1/9/1998 LMd. Otuohrvd303/1999 LMd.DiuotvedyiB/l999iLMd. Otudved
a/1 7H 9991 (KB/1 9996/15/2000
Lud. OluonndLMd.DiualwdLMd. DUaatved
,___ 6/29/2QOO;Lud, Unotved3/22/1999 Lead. DUaatwad5/1 7/1999 iLMd. DlmaolVMlft/1 5/1999 JUKI. Dissolved
10/28M999 LMd. DoaorwdGW anV2000;LBed.Otuotvad
GW 3/73/1S99dBTj" 5/17/1899GW 1 6/15/1999GWUW
CWGWGWGWGWGW
8/17/199910/28/1 9w
o/2wzooo3/23/19995/17/19996/1SM99S6/17/1999
CW 6/lUOOtcwl aoaooocGWCW
GWGWGWGWUW
GWGWGWGW
"GWGWGWGWGW
OW
CMGW
3/23M9KS/iari9S9
8/17/199910/28/19958/29/200C3/23/199!6/IW1B91
0/17/19991 0/20/1 B9t0/15/2001
__B/29/2000
7/14/1998
Laad. DiuDUnK)Lud.DUsolVK)Lkad. DtudvadLaad. OtnorndLMd.Ofuolvad
Lu iSiaovaLead, DiuolvedLead. DluorvedUad. DissolvedLMd. DlnotvtdLaad. DtwoNedLaad. DtuDhedLMd. OcuanwdLud.Dtuolww)Laad.OUeolved
SS^ —Laad, Otisotved'LMd. Dluolv«i•Lud, Diuohw]LMd. DiiaoNwi
jLud.DtuohedjLMd DtnoNadjLaad, DtuorndLaad, DlitoivadZterZ DJnolvedZMC. Dluorvod
9/B/i99aiZJnc. Dttcorwd1 1/Wl998;Zlnc. Dtuorwed3Q2/1999!ZJnc, Ditiolvad
-^Sfianl^OtaohM
lonanawiZJnc, Di«otv«i6/ ) SrtOOO ; Znc, Dissolved
GWJ GAV1 998 fzinc. Dttaotved
0.0014;
oooost" 0.001)
JL
0014; <
oW00077500008! <oooii <0.001
00005000210.0005
0001
O014
0.0090.0077500008
0.00100005; <00005; <o.ooos! *
0001 <
0.0140.009
0.00775o.oooaj *0001! <0001
0.00050.0005
0.00 tj0.014
r,*.
*<0015
0.0150015
0.0 IS
"o'ois"ooTS"0.0150.0150.0150015
0.0150.01 S0015
"oois0.0150015
0015
0015
0.0 IS0015
0.0150015
"rlDTs~001S
0015
0015
0.015< 0015
_1
0.009! <
0.0006;0001
0.001 -0014!0014J
00000
0.0010.0140.0140009
000775
000220001
0.014
0009000775
..,
0.0008000080.0010.014
oooa00162
0.00
000oov
0.009)000775}
~~ "MOO 10001]
oobisf0.0025J0001!0.001 j
iJoossT
o.ooasi
000720.001 7'
~— .
0010.01
1010.01
i0un0
T00000u00
"6"00
000u00000000
-5-000
0.01
1015
0.0 ISb~bts0.01 S
rbois
0.015
0015
0.0150015
0.01
0.01
0.01
0.01
0.01
ToT0010.0:0010010.0150015
obis"0015
0010.01
001
0.01
0.01
0015
0015
0
f)u
00
0
00000
00000
"b0
"o"00
IT1
"b0c
ccc0ccf
"(n0
"6
rr
.
RHMD40873940B7S5
. 469521H jj 469540
L '' 469578 'L ! 469597H
HH.
LL
rL
LH
HHL
704583704619468771408767
46M19"
489734•489751
469772704735
468835468851468887
L 1 466683
-Si 469829L 469048L ! 409875H j 704625L i 704881
i-L n
H
468931468947™
,4698344B39T3"
L t 489951""
H
LL"HH
409970704915704971
"470750470769470788
H j 705809
LH
470665^"470904
H_L 470923L r 470939L 470961
LLHHLL~
705755470980"470999471018471034
, 471058Hj 705792
L { 471075H
„
LL
471094
47~lT32L471151
705879L 471170
X
DOS 1 USGS br EPAJOS A USGS br EPA=PAAJRSEPAAJRS
EPAAJRSEPAAJRSURS OparatMB SaMcu tor EPAURS Opwurio. Servicas tor EPAUOS 4 USGS Jor EPAUOS A USGS far EPAJOS • USGS tot EPAUOS & USGS tar EPAEPAAJRS
EPAAJRSEPAAJRSEPAAJRSURS Operating Servicas far EPA
UOS A USGS for EPAUOS & USGS for EPAUOS ft USGS br EPAUOS A USCS far EPA|EPAAJRS
EPAAJRSEPAAJRSEPAAJRSURS Operating Sarvtoe* for EPATiRS Operaang Service* (or EPAUOS & USGS br EPA
UOS 4 USGS tor EPAUOS a USCStor EPAEPAAJRSEPAAJRS
EPAAJRSEPAAJRSURS Oparaong Service) far EPAURS Operaang Sarvfcai for EPAEPAAJRSEPAAJRSEPAAJRS
EPAAJRSURS Operating Service* for EPA
EPAAJRSEPAAJRSEPAAJRSEPAAJRSEPAAJRS
URS Opening Service! tor EPA"EPMiRS" """ "EPAAJRS
'EPAAJRS'EPAAJRSEPAAJRSUR3 Operating Service* tor EPA
f URS Opert*ifl Sarvieea for EPAIEPAAJRSiEPAAJRS
|EPAA»R3iEPAAJRSURS Operate; Smvtca* far EPAEPAAJRS
H 1 471189 ! EPAAJRS
LLHLHH1LL
471227471246705913'70596946984946866546866r488697499429
H 1 469487
iEPAAJRSiEPAAJRS
TORS Operating SarviCMtor EPA '|URS Oponttna Sarvicai tor EPAUOS a USGS far EPAUOS 1 USGS far EPAUOS & USGS far EPAUOS & USGS far EPA
iEPAAJRS
TEPMIRS
L i 469505 iEPAAJRSH ! 704488 jURSOparallng Strata! for EPA
V I ' 468713 ;'UOS A USGS (or EPA
iGW<W
GW
GW"GWCWGWGWCW
1^ l;
DaHnptfon *-•999.99-4)999.99•999999499990 "' ' " '
5999W "-9999.99-tnm.994999.99
B
-9999.99 •4999.99
)W j-9999.99GWGW
UWGWCWGW
•9909.99 :-9999.99 ;
4999.994B99A9 '4999.99-9999.99
GW j -9999 .99GW -099999GW 1-8999.99 jGW j-999999 jGW i-9999.09 :
g
1I:
I
•§•!
llB
•«•T-
r "•"
-KS-\i 4
: 4
|tl N iLNRU-021 ]11 i N |
It N ?It
NRD-021NRD-023
N JLNRD-023
Tif'r N*It i H11 i N !11 I N0 ! N
"-i~i"S'i
NRD-023J4RD-023JtRO-058.HRO458
0000
~b"ii
LNRD-021 j 0NR0021 |0NRD-021 1 0NRCM121 I 0
9 ; N :LNRO-023 • 0
- 4 B
44
353.5
Ys™
- fS-SW i-9999.99 j ; ! 3 5
CWGW;w
GWGWGW
CWGWGWCWGWGWGWTWGW
"cwCWGW
GWGW
GWGWGWGWGW
GwTGWGW"cwGW
"GvyuwCWuw
•9999.99 I i j 3.5499999 i ; 354999.99 - -- -j. ! J3.5
-9999.99 t-9999.99 |-9999.90 i
4999.994999 09-8999094OT9.99 ~"•9999994999.994999.99-9999.994999.99 i-9999.99-859969499999 ' ' I
-9999.99 i-0999.99 j
4999.994099.99
,
4999.99 ]-9999.994999.99
4999.994999 89:4999.994999.994999.99J499999J4999.991.999399
—
.
{•999999 iCW J-09M.99
GWGWOVlGWGW
4999.99 14999.99 !4999B9 |499999 j4999.99 i
GW j-9999.99 jGVSGM
f1'""
—
-4999991-099999i4909.99'-9999.99i 4099.99
GW i-9999.99 " !GW 1-9909 M •CW !-B99a M (
OW
GW
"cv
14MBM
'4999B9 '
14099 90 ""
-i —
35' 3 5
2
2I 2
! 2— r~f
22
, i 2T 2
1 i 23
, 3"1 i 3
! 31
4-3
686.8
; ; 66j f i8-]«..
— • —;
Jii-
i 7_
1
1
|_
77
7
._i._JL
i—•j — •
!1
— j—
—
3
i3
s"
3
T-J-
99
8.5
H !M-lN S
LNRD-023.NRD-023 1
LNRD423N JLNRD4S8
N ! LNRD-021B5 N !LNRD-OIl
8.5 , N~l
BSj N85 j N8.58.5
N"N
85 i NB.S7
N 1
N
_LJ_2_7 N
'TH.„_,
1 I N7 T7._„_
78
N
N
.NRD-021LNRCMJ23 ~".NR&023.NRb-023.NRD423.NRD-023.HRD-058 j
LNRD-OSB
00~00
00
o"000b0000
LNRDjOZJ 0_
.NRD-021 1 0LKRD421 i 6.NRD-023LNRD-023 ^LNRD-023 ! 0LNRD-023 | 0.NRD-023.NRD-OSB
N lLNRD-058
a N8 1 N
LNRD-023LNRD-023LNRD-023 "
Lo066"0_.
B ! N ILNRO-023 f 0B ! N [LNRD-058 j 0
8.88.B
N -LNRD-023
e.8 i N•eTTir
8612 -rT
J<RD-O23LNRO-023LNRO-023
LNRD-OMLNRD-023
^JL_1.iyi*9^5?_t2 I fi [LNR0423
! 12! U
t H [LNRO-023* N IL'NRD-QM
1 12 ! NI 12 i N! 5 i Nt 5
|~T"
j 5
! aa
N
00
40
0o"0
ot 01 6
LNRD-058 0
LHRO-D23 ; 0LNRD423 j~0
N iLNRDMD» T 6"NHNN
B !Tri 8
s a; N
3 1 a iiT1 6 .4 Ml. 4! Hi 0.4 !11.4i N
• }64
T~r«?0.'
— fffi
i "
hi.fiTS
irr}}n
4~
' NNH
N
NN
j i a i u i N
LNRD423LNRO-OS8LNRD-023LNR042T
1 °: oTO"
L"NR(W2'H"iir
LNRO-023LNRD-05B H!-LNRD-OSB ! CLNRD-021 | 0LNRD-021 ! CLNRD42i f C.LNRD-021 - 0LNRD-023 i (
U4RD423
LNRD-OSBf
™
\NRfXU1 i 0
App_E_gw_Tbl_1 o3.xls Page 4 of 15 10/22/2002
Groundwater DataDissolved cadmium, copper, lead, and zinc data (mg/L) for all data sets, ai
is River Reaches 0 to 3.il cadmium, copper, lead, and zinc data (mg/L) for CDPHE data (LNRD-068).
'.';• >..'"•' . .'",'--'•' • '' - -. .V^.;;: •.?•>")".'•/;•'" :^f,^ :'' •, '•;-.' 'CM* '••, ' . - • ; "' -/ .Period .^. MTOBtofcjnHirreV ' ?-.'- • 'Ark Rl ZJnc. Dluotved Period 3 ' JUW02
SArk Rl.Zinc. Dissolved £ Period 3 ' UUWOS
S.Art Rl Zinc, Dissolved ! Period 3 iUUWOJSArk Rl Zinc Otnolved j Period 1 {UUWO2S Art Rt Zinc. Dtuarved I Period 3 luLtWOZ5' Art Riizinc. Dissolved 1 Period 3 <UhtW02S Art Rl.Zinc, Oiuatvod ' Periods UUW02
ArkHlZlnc.Olisa.Ved j Periods UUW02Art Rl Zlri£ Dissolved Period 3JUUW02
S Art Rl Zinc. DiuaWed 1 Period 3 -UUWO2Ark'Rl.ZJnc.tMuo1ved ! Period 3 jUUWOS
Ark Rl Zinc. Dtutfnd F P«nod 3 IUUW03SArkR1.Znc.Dluoh*d Penod S UUWOS
Aik"Ri Zinc Diuolved"" | Pertod 3 1UUW035 Ark Rl.Zinc. Diuolved i Portod 3 UMW03
Ark Rf Zinc. Dissolved Periods UUWOSSArt Rl Zinc, Oiuotved ! Period 3 UMW03SJrtRrZir 'oluatved ! Periods UUWOS
ArtHlinc.OiMalved f Period3 UUWOSSArk Rl Zinc. Dtwotwd E Penod 3 JUUWO4SArii Rl.Ztoc. Dtearved Penod 3 JUUWO4
Art Rl Zinc, Dluorved P«*«> 3 JUUW04Art RTzwc. Dissolved ! Period 3 JUUWO4
BAA Ri Zinc. Dissolved j Penod 3 JUUWO4SArk Rl.Zinc. Diuolved l Pertod 3 iUUWM
Art Rl .Zinc, DJnaived 1 Period 3 JUMWD4SArt Hi Jinc. DluarvBd ! Penod 3 IUMW04
S Art. Rl Zinc. DtUOfvod 1 Ported 3 JUUWO4SArt Hi Ztoc. Disserved Pertod S UUWOSS Art Rl Zinc. DIuarvBd Pertod 3 jUUWWS Art Rl Zinc, Dissolved Period 3 ! UUWOSS Art Rl Zmc. Dluorvad Period 3 j UUWOSS Art Rl Zmc, OluaNed Period 3 JUUW05S Art Rl Zinc, Olnalved Period 3 i UUWOSSArt Rl.Zinc. OiuaNed Pertod S [UUWOSS Ark Rl.Zmc. Otuotved I Period 3 UUWOSSArtRI.Zlnc. Dh**wd Periods UUWOSS Ark fll.Znc, Dissolved Periods UUW05SArkRI.Zjnc.bluaNad Period 3 UUWOSSAARI.ZJnc,OIjsatwd Period 3 tUMWlSSArtRi.Zlnc. Dissolved Pertod 3 UHWlSSArkRI.Zlnc.Oluotved Periods [UUWlS Ark fll.ZJnc, Dissolved Pertod S UUWlSArk Rl. Zmc. Dluotwd Pertod S UUWlSArt Rt .Zinc, Dluolvod Period 3 JUUWIS Art Rl Zhc. Quorved Period 3 luUWISArkRi.Zmc. Dissolved \ Penod 3 UUW14ASArt RI.Zmc,D4uo*ved j Penod 3 UMW14AS.AA Rl.Zinc, Dluorved * Period 3 1UUW14AS.Art HLZtnc. Diuolved 1 Pertod 3 IUUW14AS Ark HI Zmc, Dissolved I Partod 3 IUUW14AS.Art RLZinc. Dluotved Pertod 3 1UUW14AS.Art Rl Zinc. Oiuorvad Period 3 ;UUW14ASArt Rl Zmc. Oiuotvad Period 3 UUW14BS Ark Rl. Zinc. Oinotvod Period 3 UUW14BS Art Rl.Zinc. Oiuorvad Pertod 3 UUWI4B3ArtR1.Zmc.Olssotved j Penod 3 iUUWMBSArt Rl Zinc. Dissolved Period 3 [UUW14BSArt Rl Zinc. Dissolved Pertod 3 iUUWMBSArt Rl Znc. Dissolved Penod 3 UUWl 465AifcRiZlnc.OiS>alvad Periods UUWiSAS Art Rl Zinc. Druotvod Periods UMWISA5ArtR1.Ztoc.Dluoh>ed Penod 3 UUWISASArt Rl Zinc, Dissolved Periods UUWISAS.Art Rl.Zinc. Dissolved ( Pertod S luUWlSA
SArtRiZmc.Otuc4ved 1 Period 3 'UUWlSB
SArkRl.Zlnc.Diuorved j Portod 3 JUUWISBS Ark Rl.Zinc. DlMorvwJ [ Period 3 UUWlSBS Art Rl.ZJnc. Dissolved P.nod S UUWlSBS Art Rl. Zinc. Oluorved : Pertod S (UUWlSBS.ArkRIZIr.c'.btuoived J tisrMl'iUMWisB ' "S Ark RZ.Cedmlum. Dissolved Pwtod 3 iUMWOBSAAR2.Cwlnriun.Otuc.1ved | Pwtod UMWOB
S Art R2~ Codrnlurn. DtsKOlvad P«rtod UUWOflS Art R2.Codmlum. Dtuotved Penod UUW06SArt KI Cadmkm. Ussoivnd *" Pertod UUWOBSArt R2 Codmhm. Dissolved Period UUW06S Art" RZCodrt /Mssolved Period UMWOfl
1179S 1
iis§Bi7/14/199B Zhc.0svsorwd
I7BS GW i 11AV1998
17M GW179B
179fl1799
1799
1799
1799
799)30J
830830830*830830830830
830
84S843842
84384]843843843843847841
1847
1847
847847847B47847a929;
L ":
9;9;9:
8313i313i313
1 131313
1 IS1 13t t38383BS415.15.854
)!>BW8S<14
IS87
~ ft1717
1 87~sT
B787
GWGW"
Unc. Dluorved
5/1 7/1909jZmc. Dissolved6/1 S/ 19991
GW j 10/28/1999!GW 1 ft/1 5/2000GWI 6/ismoo"cw i saaAoobTGWJ
GW
*""*!GWGWGWGW
8/29/2000:
jnc, DiuorvedElnc, DtuahedOne, DissolvedEmc.Dhaofved
:«.D.«*v«dJnc,Db*oNed
6/3/1 9Wi Zinc, Otuotved
BAVIfiSalZnc, Dissolved11/9/I9B8I3/23/1999V1B/1U9:6/ls7l999
One. DissolvedZlnc.Dt.torv*]Zinc. DtuarvedZnc.OMsaived
GW tOf7fli1999]Zlrrc. Ddsotvod
GW 1 8r79nDOo[Znc. DissolvedGW I 6V9/1938GW ; 7/14/1998 jZtoc. DissolvedGW
C".
GW3W
GWGW
"GW"*GWGW
9/B/1996:Zmc. OluoNed1 1/9/1998 j Zhc, Observed
5/18/I999J Znc. Diuolved6/1 5/1 999: Zinc, Dtuotrad8/17/1999 ZJnc. Dtiolved
10/28/1999 Zinc. Observed
809/2000 Znc. OluorvedBAVigaaiZnc. Dissolved
jW 7/1 41 1998 |ZJnc, OtuotvedGW gn/iesa
«1 1 AT/19983/23/1999
GW f 5n8/1999GW fl/1 5/1999GWGW'GWGW
GWGWWGW
GW
8/17/1999io/2B/i"M9~
Znc. DiuolvedZnc, DluoNedZkK, OtuoNed
Zinc. DluorvedZinc. DiuatvedZnc. DtuoKred
6/15/2OOOjZJnc. DKsrJved8/29/2000 ;Znc. Dfcaolved302/19995/17/19998/15/19998/17/1999
10/78/19996/15/2000
GW j 0/29/2000GW"! 3/23/r999GWGW
Zinc, OiuotvedZhc. DiuolvedZnc. CiuarvodZnc, DluolvodZhc. OiuotvedZnc,0tuarvedZnc. OhwrwdZnc.DsBolv«d
S/17/1999;Zhc. OfesohedryiS/IWOlZJnc, Diuolved
GWi 6/17/1999GW< IOA8/1999Gw
_jCWGWGWGWGWGWGWGWGWGW
8/tsnooa8V29/2000W3/19OT5/1 11 1999
L_ 6/1S/199I
Znc. ObteoNedZJnc. OEuohedZJnc. Oluorved2nc.0kuorvedZnc. DbsorvedZtic. DbsorvMZncOlualved
8M7/l999iZJnc. OLuolverJ10/28/1 OKfl/15/20008/29/200C3^3/199*5/18/1991
GW j e/!S/l99fGW I 8/17/199!
Ztoc. DluatvedZnc. DiuofvedZnc. DluafvodZncOhsorvedZnc.Dksoh>ed'Znc. OtuolvedZnc. Oiuotved
GW ! lo/Z8/l999;ZJnc, Oluorved
GW
GWGWGWGWGWGWGWCWGWGWGWGWGW
i.sy.
3V20/1 999! Zinc, Dtuornd
6/15/l999iZlnc. Dtuatved8/17/1991
10/28/1991VISrXMX8/Z9/2DO(8/9/1991
7/14/10919O/199I
1 1/9/199B__W4/1999
6/15/199!
IZInc. DKsorvedtznc. DkutvedZnc. OiudvedZnc.OliulvedCedmtom. DluorvedCedmkm. OluaKedCertnUum. Dinoi¥enCadmium. DEnotvedCsdmtom. DissolvedCsdrniurn. DtssotvedCedmkm. Doaotvad
8/1 71 1999 {Cadmium. OluaNed
i_'5™.1*?'il'.Tiir — :...:„.. iSiEi-
Hi1.93
2.19
io7
i1.99J
0893;1.72
2.2"Vflfl2.03
2.02
1.94!24.6
16
92924.7
29.711B.BJ19.BJTa l " ~136,
1.26;1.6
1.01
1.21382.29
i'.249.29
11 s;7.53
691
11 Z15.3
9.15
11.5
10.8
05571.21
"6"84906240.636
—
0.58800055;0.01 It;
000115!0.0043
0.0010500017000120005500049
000115O.OOSS1
0001090001700012!
S.2B
8.81J3.68J1852.73 1
0.384i
0.05341 10.44 ll0.118-D.7DB!
2.77
0.000*0001
0001
0.0010000.oooot
<
<<
00025 10.000flk *
• • .1 • '
5
005005009005003
" 003009005
1>"0
0)0000J
1
tt111
1
1
000
000
6"0_.
111
1111100
000000000000
*o~000•5-001000
0
000
000
0y000
*r-I*
L
, ' " - •• [.- "i;. ".'•:'~.\. ','' •'.; :;;l..:
488729 iUOS 8 USGS for EPA
468761 ! UOS 1 USGS tor EPA
H 4C9543 JCPA/URSH !— !
46B562 !469581 !
Li 469600hT} nSsfeTH \ 704578L I 704714
1
LLLHH
704832 !~iM777
IPAAJRSEPAAJRSEPAAJRSURS Opening Service! for EPALIRS Openttng Service* for EPAIRS OperMng Servkes tor EPAJRS Operring Services for EPAJOS » USGS tor~EP/r "
468809 iUOS 8. USGS far EPA468825 j469699 i469718
"469737 'L i 469756L i 469775
rnwawr
UOS & USGS tor EPAEPAAJRSEPAAJRSEPAAJRSEPAAJRSEPAAJRS
URS Opening Services (or EPA
GW
G«a
^:^^"-^^ffy:^'^/^:..^
•9999.99
9999.99 i
GW j-8999 99 iGW -9999 99 jGWGWCW~GWGW4
9B99.99•9999.99-9999.994999 9B499999
GW. -8999.99GW 9999.99 " i
GW j-9999.99 iGW j-9999.99GWGWGW*
-9999.99 i
If~i1"i ™|T '
11 ,i.N
_._..__ .
•>•,:"•'•"
LNRD-O21
j«b«-
• I 6 ; 11 i N |LNRD-023
999999 i-9SB9.99
GW I-B999.99Gwl-999999
GW !-9999.99
H ' 468857 iUOS A USGS far EPA j GW i -9999. 89L ! 468673L 466889
H 1 469613HL
LH"
L
489832469851
704838"704894
"46890!"
468937 ^L 468953L 469897
J!
L"469935"'
4699S4L ! 469973H i 7049Z8L"* 704984LH
LH
470753470772
470829705622
L 705678L ; 470888H ; 470907H~! 470028L j 470942L 470964HLL
705712705768470983471002
H j 471021"L fr "'037
L j 471059•HI 7b5802~L t 705B58L r~47i6nfH
~H 471 116L 1 471135L | 471154
L~! 471173
~fi"*"47 121 1LLHLH
"H"
LLHHL
471230-471249
70592670598246A957
"4eB97T
"4i9005~469988
'47DOMI~470Q21
470040
— L-^ *-
UOS i USGS br EPAJOS & USGS far EPA
EPAAJRSEPAAJRSEPAAJRS
URS Operattng ServlcH tor EPAURS OperatnQ Sen-fees tor EPAudS8USGSfor~EPAUOS 8 USGS far EPAUOS 1 USGS far EPAUOS & USGS tor EPAEPAAJRS
EPAAJRSEPAAJRSEPAAJRS
IURS Opening Services for EPAURS Opening Service* for EPAEPAAJRSEPAAJRS
EPAAJRSEPAAJRSURS Opereong Service* tor EPAURS Opefitng Services lor EPAEPAAJRS
EPAAJRSEPAAJRSEPAAJRSURS Operefrig Services for EPAURS Opening Services Bar EPAEPAAJRSEPAAJRSEPAAJRSEPAAJRSEPAAJRSURS Opener* Servlcee For EPAURS Operating Service* for EPAEPAAJRS
EPAAJRSEPAAJRSEPAAJRS
EPAAJRS
lEPAAJRSIEPAAJRS: EPAAJRSIURS OpOTJmg ServfcM lor EPA*URS Opening Services for EPAUOS 1 USGS tor EPA
iUOS ft USGS tor EPAiUOSft USGS br EPAiUOS 8 USGS far EPA! EPAAJRSIEPAAJRS 'iEPAAJRSi EPAAJRS
GW ; -9999.99cw,
GWGWGWGW
GWGWJWGW
-999999
-999999
_
-999999 :-9999.09 i-9999.99 !-0999.99 '•4999994999.99 ;4999.99 i4999.99 i
GW ;-9999.UyGW~TGWGW"GWf^va'GW
4999.9fi4999.99•8999 9949M.B9-9999.99
GWj-9999.99 !GW3WGW
cw"GWGWGWGW(JWGW
4999.99 !-999999 i4990.99
.999999 i•9999.094999994999.99-9999.99
499999GW -0999 99GW 1-9899.99GW 1-9999.99GW !-9999.99GWGW"GWGWGW
4999.99499999r4999.994999.99499999
GW 1-B9BB.99
—
GW 1-9999.99GWGWGWGWGW
4999.394999.99
1
499999 S4999.994999.99
CWi-0999.99
GW j-9999.99GW 1-0999 99GW i-9999.99 ' ' 'GW i-9909.99GW ;-«99.99GWGWGWGWGWGWGWGW
4999.994909.99499999.9909.99 " - - -499999-9999994999.99
4 *! 8
__|JL««
! B4
._!
T 4! 4
i— *• 4
: i"'3 .5
—i,."..
-Jriuu -.n"ig
9
999B
as
^i 3 5 • B.S! i 35! *S.S
B58.5
i 3 5 1 • 5^! 3 5 8.5"
! 3.5 ! 8.51 2 , 7
• 2
i" '' t ^_j__1 J_2
- I 12"! 21 2i 2
' i 2! 3; 3
i_3
33
*~ 33
68
! S.BI 6t
: Teai 6«! 6.B
I j 7
i 7
! f 'i : '
1 3
i 3i i >1 3
7"7
'
N
N
£4
H
H
N
N
N
N
N
V
N
N"
N"N
N
N
NHNNNN
N
N
.NRD-023LNRD-023LNRD42SLNRD-OiaLNRO-058.NRD458LNRD-058LNRD421
I0
-0-
000000
"6*
"6"
LHRCMJ21 { 0
LNRM2S"; o"LNRD-023 0LNRD-023 j 0LNRD-023 1 6LMRDKJJ3 1 0
LNRMS8
LNRCMSJi""1
LNRO-021LNRD-021
LNRD-023
o
__0
"o"
0LNRO423 1 0LNRD-02S j 0LNRD-O23 ! 0LNRD-OSa |~0LNRD-058 10LNRD-02T T" 0LNRD-021LNRD-021
JL
LNRD-02) 07 i N !LNRO-023 0
'T
7
7aB888BB
6.8
8B• B88B8
1 8 8
NH
N
N
NN
H
N
-:-NH.
JLNN
"N~
Nn
1 12 i N' iTt'N
HI-s «1 12
J*.
5
! *i s
3 l 5
--H-A — J — j— -5
\. —
r
r~"4099 09 i
J."- . 1.
1 ! 3r-f-r""''' i~3"
', ) 1.1
' i Vl
i i 1.1
i I l.li 1.1
I ITTM.1
1.1
hr-h!-! 8
B
N
„!NN
: N
i"i n
J.J.1
| H
i N
-T+S6.16.16.1616.1
18.1
j til8.1
i NTN
r-S
H
H
H
LNRO-023LNRO-023LNRD023 'LNRO-058LNRCMJSaLNRO-02SLNRO-023'LNRO-023LNRD423
tLNRO-02SLNRD-058LNRD-OS8
rLNRO423
;LMRO-Or>
4-s-000-5-000
0000
'LNRD-023 j 0JLNRCM123 ! 0iLNHO-OSa ! 0!LNRD-OS8 D"JLNRO-023 01LNRD-02S F 0! LNRD-023fLKRD-023
|U«041M_
: o'. 0
WLNRD-05B _j 0
ILNRD4ZS 1 0LNRD-023 i 0iLNRO-023 i 0:LNRO-033\StKSSS~
c0
~'LNRb423 1 0"
LMRD423' T6LNRO-023LNRO-023LNRD-058JLNRCM58iLNRO-021iLNRD-021
JLNRO-M1_
LNRD-02S
^LNRD-023LNRD-023
1 00
£
((
-S-fn
App_E_gw_Tbl_1 o3.xls Page 5 of 15 10/22/2002
Groundwater Data forDissolved cadmium, copper, lead, and zinc data (mg/L) for all data sets, infl aN
is River Reaches 0 to 3.j cadmium, copper, lead, and zinc data (mg/L) for CDPHE data (LNRD-068).
.-: • - " • Caw j _,_Art R2 Cadirtum. OuohodArt R2 Codmtum. Obnbed
S Arh R2 CadmMn. OtsuhedSArk R2.Caorrdum, Observed
SArt R2 Cadnfcvn. Uuobed5 Arh R2.Cndm1um. Dbaotoad
PeriodPeriodsPeriodsPeriodsPertedS
' -+•
1UWOSIMW06JMW07UUW07
Period S -UUW07Parted 3 IUUW07
S Arh R2 Codmkm. Diuohvd ( Period 3 IUUW07
SArt H2 CadrnWt. Diuobed [ Period S JUMW07S Art R2 Cadmium. Dtuarnd ; Period 3 !UMW07S Art R2 Cadrnfcun. Duaived T Penbd 3 'UMW07
SArt HJ.Codmhm. DUMhed Period S JUUW08S.Art R2.Cadmfcm. DIscoNod Period 3 JUMW06
Art R2.Cadn*jm. UisoNed
Art R2 Cadmun. DuutvedSArt R2 Cadmium. DUcoNodS Arh RZ.Cadmhjm. Diuotrad
Period 3 iUUWOB
Period 3 iUUWOBperiods JUW08
UUWOBS.Art R2.Caorrii*T«. OUtahed ! Period 3 jUMWOOS Arit R2 CDdrrtfura. DU«*«d Period 3 lUUWOBS Art R2.Codrraum DUtabed ! Period 3 JUMWOBS Arti R2.Codrnun. Oiualvwl ; Period 3 lUMWOB
Arh R2.Cadrrdun. DlnoVod ! Period 3 -UUW09SArhraCadrT*im.btHoN»d T Period S UMW095 Art R2 Cadrmm. D»«*ed j Period S JUUW09S lArh R2\C«frhkm. Ouaotved ! Period 3 UUW09S Art R2 Cadmhan. Ofetotvad Ponod 3 JUMW09S Art R2.CaaVrtun. DbftaVed j Period 3 IUMWDO
S Art FQ.Cadrntint, Ouched' ; Period 3 UUW09S Arh RZCattnhm. Dissolved i Period 3 UUW09SArk RlCadmhan. OtiuNed j Period 3 iUUWOSSArt R2 Capper. OruolvedSArt R2 .Copper. DtuatvedS Art R2.CoppM. OiualvedS.AA R2 Capper, Dlcmatved
Periods"Period 3Periods
"PvtedSS Art R2 Capper. Oiuorved ! Period SS Art R2 Copper. Ot«r*ad j Periods
S.Art RZCopper. Daubed j Period 3S.Art R2 Copper. DUsnNad Period 3S Art R2 Coppar. OUMhed ' Period 3
UUW06uuwoaUMW06UUWOeuuwoauuwoe
UMWD6UUWOBuuwoe
S Art R2.Copper. Olisobed j Ponod 3 UUWOBi Art R2 Capper. Dtuatoed | Period 3 1UUW07
S Art R2 Capper. Dluatwed | Period 3 JUUW07S.Art RZ Capper. OluafvedS.Art R2.Copper. OsiotvedS Art RZ.Cappoi. DttMMdS Art R2 Copper. DludvedS Art R2.Canpar. DtsutoedS Art R2 Copper. Dltwr*edS Art H3 Copp*. CNiiotvedS Arh RJ.Coppor. DUMlvedSArt R2.Capper. OiUOtved
Period 3 UWWOTPeriods UUW07PeriodsPeriod 3PariodSPeriods
UUW07UMW07UUW07UMW07
Period 3 'UMW07Poriod 3 UUW07Periods JUUW07
S Art R2 Copper. OlMOVed \_ Parted 3 JUUW06
SArh H2 Copper. DUubod i Period 3 uuwoaS Art R2 Copper. OUubed ! Period 3 i UMWOBS.Art R2 Copper. Dluobed j Period 3 {UUWOBS Ark R2 Copper. Dluotnd ; Period 3 JUMWOBS.Art R2.Copper. OUwrvad ! Parted 3 IUUWO6S Art RZ.Coppor. Dfetobad i Period 3 JUUWTJ6S Art R2.Copper. Dlaiohed ! Period 3 jUMWOBS.Art RZ.Coppw. DtMObed ! Period 3 UMWOBS Arh R2. Copper. DJiiobed j Period 3S Arh R2.Coppar. Otuotrad ! Period 3SArt RZ.Copper. DiuolMd I Ported 3
uuwoaUUW09UUWOO
S.Art' R2 Copper. Diktobed ''"Period S iUUWOSS Art R2 Copper. OtKHtoed [ Period 3 JUUWO9S.Art H2.Copper. DfeubedS Art R2.Coppar. DluotvedSArt Rl.Coppor. DtuohwdS.Art R2 Copper. Dttaobed3 Art HI Capper, DliiorvedSArt H2 Copper. DtuorvwdS Art. Rl.Cappoi. OUeatvedS Art R2 Lead. DistortedSArt Rl.lead. OluabedSArt R2 Laod, DlisobedSArt R2.Leod. DtuohrodS Art R2 Lead. DttcobttdS Art R2.Lead. DtuofrodSArt H2.Lead. Dxaohred
Period 3 JUUWO9Period 3 JUMWO9Period 3 lUMWTjgPeriod 3 JUMW09Penod 3 UUWOOParted 3Period 3Period?
Period 3"pertoVsPeriodsPeriog-3Period 3
S Art R2 Lead. Oriiatvod | Parted 3S Art RM.BDd. Druobed 1 Period 3
UUW09uuwoauuwoe
'UMWOBUMW06
uuwoe"*UUW06
uuwoa
i876B76877677877
877
sir
1677
1877
1B77
1866
1686
1681
1661
1666
r&661046
1686
1U81689
1689
1689
1689
1889
1889
1839
-rah1889,1869
IB/I
1876
1876
1B76
1676
5
1GWGWGWGWrw"uwGW
GW
GWGWGW
GW
A/1 5/20008/79/20006A/19981
. -Cadmhim. DiuaKedCadrnkm. DlesotvedCadrrrium. Deuohad
7/14/1998 ICadmkxn. Otuolved
— ii/giaaa'Cadmaim. Dtt»oNed~3A4/i999!Cadmhjm. Diuofwi
6flS/l999f Cadmium. Ofubrved"1
10/78/1999! Cadmium, Dtsaolved
6/15/2000 Cadmkim. DtuohwdB/29/2QOOj Cadmkm. Diuolvwi
GW j 8/8/1998Cadmium. OiuoNedCadmhim. Dluotvad
GW | i t/e/1996 Cadmium. Dtuorved
CW i S/lB/1999:Cadmkjm. DieioNedGW i 6/15/1999GW"* vi 77imGW 10/20/1999
6/1 3/2000GW i tujunuuuGWJ a/9/1694GWGW^
7/14/1996
GW | HAV19Hcw MM/IMS
T&
-JarGWGWuwGW
^S/1 9/1998
CadrnktfTi. DisioNad
Cadrnum. DiMoTwdCadmkm, DkaoNedCadmum. DisurvedCadmium, Di»otvadCadmium. DbaolndCadmbm. btnotvedCaorrwim. Oissahred
Cadmkm. 0«orwd6/15/1099 Cedmkim. Dluarred
10(76/1999 Cadmkm. Oeuolvede/lSnOOOiCadrnkm. Diuolved6/30/3000 Cadmkm, Dauotved6/9/1991 Coppar. Dbufvad
7/1 4/1998 iCoppef. DiuotvedGW. 9JB/199IGW] I1WT991
1Cappar. DiuortredCapper. 0"l»atved
GW 1 3/24/1 099 iCopper. OluotveO187 GW; 5/19/1999
itTfi1876
1676
1676
1877
1877
1B77
1877
1877
1B77
1B77
1877
1886
1886
1888
1688
18*6
1686
1686
1B8B
1888
1886
1669
IBM
i&ea166!
IBB!
18BS
1B8S
teasIMS
~wi
187187{
Cappw. Oaurvod
GW T aft 7/1999 ICoppar. OhMfvedGWGW
10T2B/199I6/1V2000
GW i 8/29/2000GWGWGWGWGW
GWGWGW
GWGW
GW
6S/19Q87/14/19989A/1B9B
11/9/19913Q4/1099S/19/19W
.Copper. DtMQtwd
.Capper. OtasatvBdCopper. Da solvedjCopper. Dbuohed.Copper. D»Mfved4Copper."DaiicirvedCopper. Dtaotvod
fCoppcr. D4UOrWdCapper. DEaahwd
6/15/l999iCopper. DHKrfwd8V17/1B9* :Capper. DluoNed
10Q6/1 999 iCopper, Dbufvedfi/lS^OOl
6/29/2OOI
* •*.!?"
9JB/199JGW~ 11/9/I99JGW i 3/24/1991GW i 5/19/199!GW ! 0/15/1991GW i fl/1 7/199GWGWGWGW
10/2B/199!&7J 5/2000anrv2oo
' awiweGW [ 7/14/tWGW an/193cw 11/B/1WGW 1 3r24/199CW [ 5/19/100GW! e/is/VwGWGWGWGWGW
; Copper, Dluahnd'Copper. DitcoNeti
JC2W?ri_I?_tl^rtd___
; Copper. DttMhed[Capper. DajsoNediCopper. OeuolvediCoppar. ObaoNadCopper. DiuorvadCoppar. OUtohndCopper. Oawrved: Coppar. DtuohediCopper. DbtorvwJ!cipp.r.O«oK«diCoppar. DitaorvedICoppar. Ocssotvod'Copper. DtuoNedicwbeMfcar-[Copper. DbwrvedICoppar. Deuolved
a/17/l990|Capper. Obcotved10/28/1 9991 Capper, Di»molved6/15/200 iCopper. DHaorrad6/30/2000 ICopoer, Dtuatwed6/9/19081 Lead, Otuolved
GW 7/14/199GW j 9W199JGWl 11(9/199GWJ 3J24M99IGWJ 5719/199-GW j fl7l5/19&<
HjWT 6/17/199
.jLead.Dluohwl1-Laad. Diuoivad,'Lead.OiuaNad} Lead. Dluotved} Laad. OuiotvedJ'Lead.OliiOrVed
> Lead. Oiuorwd
~ f
00001
i000067 1o'.ooos{~«00015 <
000150.0005
00009; <
00009J <0.00011 <
OOOOlSj *
001631 10.0097] 1000691
0007;0.0 IB
0006
-,-
00063-00241i0.0109003050019900289
0020.0146!001B70.0257
0.0171
00222999990.0010.0010.001;
obbir0001;
000215!
000£000125000030.0006
-0.001oooi!0.001J0001
OOOI 7
000215!0.0022]
000125
0.0008r0.001;
OOOIjO.DOIj
0002l!ToSTsT
oon:0.0022!
00012!0007100011
" 6060.00
000
'.
t
0.001!OODDSJ
000215100021SJ0.0022
000125;0.0000.0001
0.00
[_
0.0005}00005!00005
0.00
0010.01
0001
0.017
!i.JL
I-ooosooosOOD30005
"ooos"0005
"oooT
1005
0006ODD5"
0.0051005
(005
toos00050.00500050005)005
QMS"
0005OOOSOOOS0005OOOS0.005
"oooT0.003OOOS
1.3333~33
33....
33333
— 3~
3
J
33
3S3i"1
3._ j
.3._„_
.3
.3
.31.31.31.31.31.3131.31.31 3
0015
0.01!0.013001!
0015
0.0110015
001!
j 0.01!
1000
00
"b~
000
111
11t"1l""I1111111
_._
r000
"o"00
0(J000000D
0
0
00
00000000~0
~d0000000
"o00
"oc000000
1L
RaiuflO704996705052
H t 469021H T, 690371
469069L | 470081
H"t
~cHL
H
4701 16
470137703066703172
469101JL *HIJ«L:
IH j_ 470243
f
LH
470259470276470300705206705262"469"l49
H j 469165L i 469181L | 469197LHH
L
4703104703384703S4
470395H 705298
~L ! 705352"H }_ 468961
H ["480*77L 1 466993V"p469009L I 469086
i|||l||5URS OparatJng Sarvfcaa lor EPAURS Operating Service* lor EPAUOS A USGS br EPAUOS A USGS br EPA
UOS A USGS kv EPAEPAAJRS
EPMJRS
EPAAJRSURS OparaUrH] Servian ta EPAURS Operating Sarvtca* (or EPA
UOS A USGS tarEPAUOS A USGS br EPAUOS A USCStaTlPA ~ "
EPAAJRSEPAAJRSEPAAJRSEPAAJRSURS Opervtkq Santeei tor EPAURS Opening Sorvicaa lor EPAUOS A USGS br EPAUOS A USGS far EPAUOS A USGS far EPAUOS A USGS far EPA
TPAAJR3 "~EPAAJRSEPAAJRS
EPAAJRSURS OperaOng Semca* for EPAURS Operabng Servfcaa lor EPAUOS A USGS lor EPAUOS A USGS br EPAUOS A USGS tor EPAUOS A USGS far EPAEPAAJRS
H 470007 iEPAAJRS
L i 470043 iEPAAJRS470064705001
L ; 705057H ; 469025HLLLHHLL
469041469057~4690734700B3470102
TTBTiS-470137
"ere'isTH 705091
H : 469089
LLL
"HHLLHLHH
[ 469121469137470226470245470261470280470302
1 70S211705287469153469169
L i 469185L | 489201L ] 470321H i 470340H 1 470356L > 470375
! 470397H i 705301LHHLLLHH
j 705337
466979466995
69011
EPAAJRS)URS Opereang Sorvton far EPAURS Opntog Sarvlcaa far EPAUOS A USGS br EPA
'UOS A USGS for EPAiUOS A USGS tor EPAJUOS A USGS far EPAiEPAAJRS.'EPAAJRSiEPAAJRSjEPAAJRSJEPAAJRS:URS Opening Serwion (or EPA
SCWGW
GW
cw"GW
GW
Oaaotpibn- -*- -..: ., •'-.. .»' -.-j"-;. -'". •' :.V:':"- ''<: : t . •--,, -_ *'. " f1'.': . .' |9099.99-9999.99 1•0990.990090.09_.._-_ __„ _ ^ ,
5999~99 i-3999.99
S999.BB
I-
II1.1
"SM l;l
1.1 6.1 N [1 j 5.9 ! N i
LNRD456 * 0NRD456 ,
'NRD42I1 | 59 I N iLNRD-021
. 4 ''L»i 1 ! 5.0
"I *~t s.a
499999 j i 1 !59499999
GW -9999.09 i
CwI-9999.99 ' ~ " " '^" "" 1' "GW 1-9999 99 !3W i -6999.99 ' r
3W !-0999.99GW [-9999.99GW -MM 99 jGW -9909.99GW [4999 09 [GWGWCWGWGW
"GW"
4999.90 E4909.99 i•9999.99 I4999.09 i4999.09 |499909 " i "
GW !-9999 99 •GW 14999.99 """
GW I-99M 99 !GW r-9999.89 jGW -9999.99 ;GWGW
490909 !•099999 j
GW i 9999.99 jGW ; -9999.99GWi-909909GW 1-9999.99
GW i-9999.W 1GW 1-6999.09 jGW -B90909 'GWGWGWGWGWGWUW
490909 i4999.994999094909.99 !4999.99 {499909-9999.09
GW [-9999.99GW1-B99999GW I-S999.99GW ! -0999. 09
fURS Opwmbng S«rv1c*. Icr EPA GW J.9999 99 ~~ " ' '• UOS A USGS lor EPA j GW •999999
.UOS A USGS br EPA GW j-9999.991 UOS A USGS tor EPA
EPAAJRS: EPAAJRSIEPAAJRS'EPAAJRSjEPAAJRS;UR3 OperaDng Sorvicaa far EPAluRS Operaing Sorvtcai tor EPA[UOS A USGS far EPAiUOS A USGS far EPAIUOS A USGS br EPA!UOS A USGS br EPA! EPAAJRS'EPAAJHSiEPAAJRSEPAAJRS
iEPAAJRS!URS Opanang Sarvtce* tor EPAiURS Opanbno Service* tor EPA
' ; uos a uses (or EPAi UOS i USGS far EPA
"jUOS A USGS far EPA! UOS A USCS tar EPA
" 469989 JEPAAJRS470008 ] EPAAJRS
! 470024 jEPAAJRSL i 470043L~l 470065
JEPAAJRS[EPAAJRS
GW j-9999 99GW-^99909GWi^99999GW -9999.99 [CW 1-9999 99GW j.9999 99GW i-9999.99GW 1-8999.99GW -999999CMGMGWGW
4990.09•9999.994909.004999:99" " '" - " T-'
GW !-9999.99GW j-9999 99GW J-B999.99GW 14999 99 iGW 1-9999.99 '-GWGWnwGWGW
'4999.99 i
"4999.09 •— !4999.99 i
" 4009,99 !*4999.99 i ~
GW j.9999 09 iGW j-9999 99 T "GWT90D909 ' 'GW J-9999 99 j ~CW j.000999 — —
qj 1T i
5.95i9"
N JLNRD-021N LNRD-023
NlLNRD-023 ^
000
0
0
N fTNRD-023 0'
^
LNRD-05BL'NRMSB"!
01
1 1 i 6 i N ILKRD421 ! 0; > 1 • 6 i N iLNRD-021
i i• •- 1 1__j iri 'ii •,--i t! 1
-
.1.4
fi6
...™
86
0LNRD-021 0
N iLHRD^O23 f 6
.™.N
N
H
JLJUL6 i H6 ! H^6
._.nu._|...N
'"r7"I l l 6 N! i l i 6 N
LNRD-023 iLNRCMD23 jLNR&023 !.NRD-OSB j
000
"b"LNRD-OSB j _0LNR0421' i 0LNRD-021 ;LNR&O21 t
0"b"
LNRD-021 j DLNRD-023LNRD-023rNRD-023
i 1 ! 6 \ H LLNRD-OMT"1
-l-r-kfi h.i• r -i i.i
6.16. l"'
; 1.1 ! 6 1T 1.1
__|_l.L.! t.i
• i i.i! j 1.1
: 1 1.1
N
H
N
N
6.1 j N6.16.1
Nnr
LNRD458LTSSSeT'LNRD-oaiLNRD-021LNRD-021LNRD421LHRD-023
0-5"0
"o"0
0"0
~o"0
0LNRD-023 ; 0
fi.i i Hi iLNRO-023 i 06.1 ! NTT TT
i 1.1 ! 6.1i 1 59
[ l
! i
f-rT5.9 1 N"sTTV5.9
"—i 1 [50
N
! ! 1 i 5.0 ! N
LNRD-023 j 0LNRD-058 ! 0LNRD-OSBLNRJ>021LNRO-021
LNRD-021LNRD423LNR0023
0
0
0r-o'
0
~" i i fi6TH"Tii«D«i i of I
j '
JJL59i i iso
) 1 [ 59
i i «. i ' i «
i i s et i l ei i e
N ;LKRD-OJ3
NHN
NNN
.1 e : t?i..._.__.. ^
! »i
66
i NTN~
6 ! N* B N
r r i J"6 1 N1 6 ! N1 T6 i N
! ' Vt -W
i l B } H1 1 ) 6 N *rr e
T 1
11
1.1
1.1
• I.i
...i i.i
-T-frl
6ir N
j 6 • NT6"~1~N
ILNRD-058LNRD45ALNRD-021
LNRD-O21LNRD421LNRO-023LNRD-023LNRM23LNRD-023LNRD-023LNRO-OSBiLNRD-058;LHRO-021LNRD-021
*LNRD-021'LNRD-021taRMZTJLNRD-023iLNRD-023
Q
00\~0
000
~000ac0000hr0
ILNRD423 ! 0!LNRM23~ ~0";LNRD-OS8
JLNRD.021B.fl N |LNRO0216.1 1 N ILNRD-0216.1 j N* LNRD-021
Q
0
(
1 (j 6.1 i N LNRD-023 j 0Tl 1 N 1LNRD42S 1"i6.1 i N ILNRD423 i I
"V l j N JLNRD*a3¥T
App_E_jgw_Tbl_1o3.xls Page 6 of 15 10/22/2002
Graundwater Data forDissolved cadmium, copper, lead, and zinc data (mg/L) for all data sets, an
r. River Reaches 0 to 3.cadmium, copper, lead, and zinc data (mg/L) for CDPHE data (LNRD-068).
Cau Partod ^ UFCSlatwiKarr-Art R2.Laod. OnsoNad ! Parted 3 JUUW06Art R2 Laad, DluoNad Pariod 3 JUUWOO
SArt FH.Laad. DfuoVad Patted 3 UUW07Art fU Land. Druoivad { Partod 3 UUW07
S Art RZ Land. DtuoNad Partod 3 UUW07SArt R2 Laod! OuioNad" " " i"P«*d 3 UUW07 ~S Art K2 Laad oiuorwd ! Petted 3 UUW07S Art R2 La'ad. DUwNed | Parted 3 .UMW07SArt RTlaad. Oluotvod Parted 3 ;UUWQ7S.Art R2 Laad. biuoNed j Parted 3 (UUW07
Art R2 Land. DnioNBd ! Pariod 3 JUUW07S Art R3 Lud'. DHiorvad i Partod 3 UHWQ7
Art R2 Land. DluoVad i Parted 3 UHWOBArt"R2Laad\D«uoNad j Patted 3 luMWOO
S Art R2 Laad. Ottaolvad i Partod 3 fUUWOaArt R2.La*d. DtuoNad j Pariod 3 UUW06
S Art K2 Laad. Dluolvad ! Pariod 3 UUW06SArtH2ia»d.bli**od ! Patted 3 UUWOaSArt R2.LMd. Dluokrad i Panod 3 iUUWOflSAfkR2Laud.DlMONed j Partod3>UUW08S Art RZLaod. OiiuNod 1 Partod 3 jUUWOOS.Art R2.Laod Dif toNad Parted 3 JUUW08S Art RZLaatf. D>»olva<J Patted 3 1UUW06SArt R2 Laad. DUubad Period 3 iUUWOOSArt R} Laad. DtuoNad Ported 3 JUUWDOSAri R3 Laad. OKuNad Partod 3 JUMWOO
Art R2 Laad. DluoNad Pwtod 3 lUUWOO
S.AtkR2 Laad. OluoNad Parted 3 UUWOO,AA rexaair. DH'»oWad Partod 3 UUWD9
SArt R2iaod.DiMoiv*d j Parted 3 iUUWOOS Art R2.laad. OtuONad Partod 3 IUUW09
Art KI Land. Dtuotead Parwd 3 [UMWOOSArt R2 LHd. dtubtvad Partod 3 !UUW09SArt R7 Zinc. DluoNad Partod 3 j UMWOOS Art R2 Zinc. Dluotvad j Parted 3 ;UMW06S Art R2.Zlnc, OrtsoNBd j Patted 3 UUW06SArt R2.Z]nc. DiuoNad i Parted 3 IUUW06SArt FU.ZbK, DluoNad ! Partod 3 i UUWOOS Art R? Zinc. DlwivBd Pajtod 3 JUUW06S Art R2 Zrnc, Oluorvad Patted 3 JUUW06S.Art RJ ZbK. Dlttatvad Partod 3 iuUWOflSArt R2.Ztec. DluoNad ( Parted 3 !uUW06
SArt R? Zinc. DIeorvad ! Parted 3 lUUWOOS.Art H2 Zbx:. Oiuofvad • Parted 3 IUUW07
S Art RZ.ZJnc. DluoNad i Parted 3 |UMW07S.Art R2 Zinc. Dtuotvad ! Partod 3 1UUW07SArt R2 Zinc. Dluotvad ; Partod 3 JUUW07S.Art R2.ZJnc. OlnoNad ! Partod 3 JUMW07S Art RJ.Zinc. OlMoNad i Partod 3 !uUW07S Art R2. Zinc. DtuoNad i Parted 3 UUW07SArt R2 Zbw. OluoNad | Partod 3 UUW07S Art R2 Zinc. OluoNad ] Parted 3 UUWO7SArt R2.Zlnc. OluoNad ! Parted 3 UMW07S Art R2 Zinc, Dluotvad > Parted 3 UMWU7SArt R2 ZJnc. DtuoNad | Pariod 3 UUWOOSArt R2.ZJnc, Oluotved I Pwtod 3 UUWOflS.ArtR2Zlnc.DiuoNad Parted 3 UUWOBS Art R2 Zinc, DluoJvad ! Patted 3 UMWOOS Art R2.Zinc, DtuoNad S Parted 3 UUWOBS.Art R2 Zinc. Diuorvad j Parted 3 LUUWOOS Art, Rj.Zinc. Oluorvad [ Partod 3 fuuwoeS Art R2 Ztec. OluoNad j Parted 3 iUUWOBS Art RTZtec. Otuotnd | Pwtod 3 jUMWOflSArt R2.Zlnc. OruotvMl j Partod 3 iuUWOOSArt R2.Zlnc. Oluorvad [ Parted 3 UUWOBS Art RZZlnc. Oluorvod | Parted 3 UUWOOSArt RUinc. DtuoNad Pwted 3 [UUWOOS Ark R2 ZJra. DtHorvad Parted 3 JUMWO9SArh R2 Zinc. Druotvad 1 Pwtod 3 UMWOOS Art R2.Zlnc. OluoNad i Pwtod 3 UMWOBS Art R2.Zlnc. DluoNad ' Period 3 UUWOO
S.Art R2 Zinc. Dtaotvad 1 Partod 3 UUWOOSArt H2 ZbK. OtuoNad i Parted 3 -UUW09S Art R2 Zinc. Diuotvad Partod 3 JUUWOSS.Art R2.Zlnc. Dluotvad Partod 3 iUUWOOS Art H3 Cadrrdum. OruotMd Parted J [AWT1- 1S Art R3 Cndmhm. DUaoNad r Partod 3 jAWTioS.Art R3 Cadmlun. Diuotvad Parted 3 JAWTL1
SArt R3 Codmturn. DiuaKad Partod 3 JAWTI-1
S.Art R3 Codrnkm. OluoNad } Partod 3 UwTI-J
— —
|1878
1677
1677
1871
1677
1877
1871
1877
1877
in 711877
1861
1886
te«188£
1861
18AI
1861
1881
1681
1881
18611881
1
IGWGW
GWCWGWGWGWCiWGWGWGWGWGWGWGWGWGWCWGWGWCWGWGWGW
-u6/1 5/2000 iLaad. Dluotvad
7/14/l998|
11/9719081
Laad. Dluotvad
Liad, OtuolwlLaad. Dkuotvad,aad. Oluorvad
3/24/1 099 iLaad. OluoNadS/1 8/1999,6/1 5/1999 j0/17/1909^
1 0/76/1909 j
Laad. DtuoNadLead. DluotvadL«ud, Oiurdvcd
6/1 5/2000 :Lead. OteioNad6/29/2000 ILaad. DrsnUvad6W1096 Laad. DtuoNad
7714(1990WB/lflSB-
11AV10983«4/1909
"~ S/19/10906/15/10900/17/1999
10r2B/1900
Laad. DluoNad.aad. {Huorwd1
Laad, Diuotvad.aad. DtoioNadLoad. DtuoJvadLaad. DiuotvadLaad. DluoNad.aad. OluoNad
6V1S/2000;Laad, DiuoNad8/M/2OOO
IBS' GW > 7/14/19981809 CW
|_1S??
i i8oaion1869
1889
187C
1Q76
1876
18,6
I«H1876
1876
1676
1876
1876
1877
1677
1877
" 1877
1677
187]
1077
1677
1877
' 1877
1877
18B8
1886
1666
1886
leae1U£1681
IOBG1866
t68l168C
1663
1889
1B6S
1641681
186!
"Teas186186tea211
"TTT211
211
2.1
GW
;wCWGWiw3W
CW3W
GWGWCWCWGW3W^WM
3W
&/B/1DS811/9/1098
5/13/1999— S7s7i999
tV17/1999
.aad. Dissolved
.aad. Dluotvad
Laad. OruotvadLaad. Dluotvadla*d. ObioNad
Laad. DruotvadLaad.QtuoNod
1 0/26/1 099 i LMd. DtuoNad
000/2000679/1998
7/14/1998OO/1098
11/9/19983Q4J19095/1 0/19906/15/10900/17/1009
Laad.OiuoNBdZJnc. DtuorvadZhc. OiuotvadZnc,OuotvadZkic, ttMOtvodZinc. DluotvadZinc. DruotvadZinc. OluoNadZnc. OtuoNad
10/20/1 999 -Zinc. Diuotvod
tmODODl Zhc, DiuotvadGW ! 6V9/1998 Ztec. btuoNad
T55GW"GWGWGWGW"GW"GWcWGW
'GW~GWGW"GW"GWGWGWGWGWGWGWGWGWGWGWGWGW
GWGWGWGW
J Mi/1998"11/9/1098
i 3/24/1999
: S/19/1999P e/is/Tooij a/17/1999j TO/28/10901 fl/15/2000> 07290000i 0/28/2000i 6*1998! 7/14/1938* 8*1998i 11(9/1008
3H4/19995/19/1900
~via/im8/17/1999
10/20/1090
ZhK. DlstotvodZtoc, DruotvadZtnc,baw)tvadZhc. OluorvadZkic. DluoNadZinc. DinatvadZlnc,OhwotvadZtec. DtuoNodZJnc. DiuotvadZJnc, OiuotvadZinc, DluotvadZinc. DluorvedZinc. Oiuotvad "ZJnc, OlnotvadZinc. OruotvadZinc, DluoNadZinc. OiuotvadZinc. DaioNadZnc, Daaotvad
fl/1 5/2000 :ZJnc. OluoNad8730V2000
1 T/TvioSI am/tooaf 11*1998, 3/24/1009J 5/19/1009
jZJnc. DtuotvedjZmc. DtuotvadEZiic. DaaoNad
§ic. DtuotvadK.0afolvad
Zrnc, DluotvadZinc. DbioNad
T 6/1 7/1090! Zinc, DtuoNad10/26/1 090 IZkic. Dtuotvad
r 6S1~S/2OM!ZlM.DIubNwJ
owl loavtwGWT 5/7/1998CW 1 6M/1008
I'cadmfcMTv. Diuotvad"jCadmtom. Dlnotvad
GW i 8/4/1 996 iCadrnJum. DrUOtVed
Gwl S/7M996 Cadmium, Dluotvad
>ooooa
]0.0011 <
00005oooos; <0.0005|_<
~" obdiraoi4f0.014 — 10.009 <
0.00775! *oooie!oooip<
00132!" 00734|
00119:'
0.0031 1 10008!0.014
009630.009
000775OOG5G99997
0.00380.001
0.0011 j00005oooi1
0014
0.014[ O009
000779;0.0008-
OOOlioooeel0-0104J00052
0001
00055!OD946J00067;0307!
oooios!
0.056200001 ^~
P 0.0127!
0.001=0001
0.0055O.0037
OOOIISj0.0057J6.01170.0286J0.001 3;
0000456.06
_,
9.4 7i823*~4.84L4.09
8i t5.92
565-
4.091
0825346.74
619; 183
3323.5fl438
H-4J6803r
»
0005
O0025 <
O.OOC
0.00
4015
o!oT0.01
0150010.0 1
001001O.Ot
o'oi001001MM
0015
0015
OOlS0015
0.01S1.015
O.Ot 50.0150015
0015
0.0150015
0.01500)50015mis1.0 150.015
S555555S
1 5
55
• "5
5S555s"~55S55,_. .,
55SS5555555S55
555
00030005o.otn
000!
"6.005
j — __ ^. 1 . ^ 1-. ._....
i0
0000
0o"0"b"u0010000t0010"r000
00
n0000000D000
00
ITua00000
"o01110
"6iii011111100
1c11I
c
1
11 —
fi; L
tacVtft ^ Saralratoaflc., __70SOOS URSOpanthoSarvKntorEPA
L i 706001 !UR3 Opening Swvfcn tar EPA
HL.
LNH
T-H
469043 "UOS A USGS tor EPA469059 JUOS A USGS tor EPA46907SJ
700647010370iiiTI"70138
~ 70160
IQSAUSGStofEPAEPAAJRSEPAA/ffS1PAAJRSiPAAJRS
EPAAJRS05095 URS Oparadng Sarvtea* for EPA
L j 705181 iURS Gpantng Sarvlcu for EPAH i 469001 UOS A USGS tor EPAH S 469107 tuOS a USGS far EPAL i 469123 loOS 4 USC3 tof EPAL 1 469139 ! UOS 1 USGS far EPA. j 470227 IEPAAJRSH 470240 1CPAAJRSHLLH
rT*
LL
HHL1HL
470202 iEPAAJRS470281 EPAAJRS470303 LPAAJRS705215 iURSOparalhgSarvtoulorEPA705271 URS Operating Sarvlcu lor EPA469155 [uOS A USGS tor EPA
469187 UOS A USGS tor EPA469203 JUOS A USGS tor EPA
470341 j EPAAJRS470357 IEPAAJRS
"470376"! EPAAJRS470390 > EPAAJRS705305 :URSOpantkigSarvka:i(orEPA7b~536l URS OparMng Servicas tor EPA
H 406060 UOS A USGS tor EPAHL
LHH
469085 JUOS A USGS tor EPA469001 UOS A USGS tor EPA
UOS A USGS tor EPA469992 EPAAJRS470011 iEPAAJRS470027
L ! 470040L i 470060
LH
T"LLH
L
705074h 489033"
EPAAJRSEPAAJRSEPAAJRS
URS Opanbnrj SarvicM tor EPAUOS A USGS tor EPA
469065 iuOSaUSGSbrEPA489001
"4"70067~470106
UOS A USGS tor EPAEPAAJRSEPAAJRSEPAAIRS
470141 iEPAAJRSL 470163 iEPAAJRS
L705106 URS OparaOng Sarvicai (or EPA705104 /URSOparaOngSarvlcaatorEPA
L j 70S164 URS Operating Setvteg) (or EPA"H i 469097~*udsau'SGS""torEPA"™ '"H I 469113 iUOSAUSGSfbrEPAL i 460120 [UOS A USGS tor EPAL i 469145
TTrbncTM 70249HLL
UOS A USCS tor EPA
EPAAIRS70265 EPAA/RS70284 JEPAJURS70308
H ] 705226L T 705264HH
EPAAJRSURS Oparmang Sarvtcai tor EPA
tuRS Oparaftig Sarvlcu tor EPAI 469161 UOS A USGS tor EPAi 469177 iUOSAUSGStorEPA
L J 460103 iUOSAUSGSfarEPAL 1 469208L 470325H
LtHTL
"H"H
L
H
—
UOS A USGS tor EPAEPAAJRS
470344 EPAAJRS
470370470401705316
pTOMTT70f724
h 701 736701760
J~70T790
EPAAJRSEPAAJRSURS Opwatkig "Sarvlcas to EPAURS Oparaltna S«rvka> tor EPA
JUSC3'uses
USGS
701818 UJSG3
— .! }¥ — *
J DaaortoJfcn ,499999
llGWI-999999 _ _ _ ,GWr-0999.99
SS"'
tiW;
cw"|
—•909000•9090.009999.99 !0999.99 ' ' ~ ' ' !
GW {-0999 99GW i-9999.99GW •8999.99CW -099009GW (-909999GW 14099.99W '-099899
GW j-8999.99 jCW -9999 BOGWGWGW;w
CWGWCWGWGWGW
-099B.99-0999.09-9999.09 I•9999.00 |-9999-99 " " ""•• T-9999.09 i909009 :
-9099.00-999900-090909•=-KrS= . 4-
GW j-990999 ;CW
"cw"3W
GWGW
-9999.99 " 1-9999.99 !-9999.99 !-0990.99 j-9999.99 !
GWi-099900Cwi-0990.09GW -0990.00GW 1-9999.00
S; 99M99-9999.99
GW -«0»O.DOGWi«S9.99GW j-OSOO.OO
""
—
3W i-9999.99 {GWj-9099.09
|«g. — j
CW ;-9999.99CWj.9999.90GWGWGWGW'
!-0989.99-B99999-090909-099999
GW S-8999.99GW (-OfrBfl.OOGWGWGW•&M
-9099.90-9999.99
•~,-
4999.99-0999.99 I
GW t-9909.00 tGW i-0099.99GW i-S999.B9 1CW ,'-«S9.99 " iGW [-6999 09GWGWCWGWGWGWGWGWGW
499999 !-0999.09 i-0999.99 1-9099.09-0999.99•099009-999999 ••9999.90
"-8999.99 ' '
GW 1.0099.90GW [4999.90GW I-M99 99CW 1-9999.99GWCWCW
CW
{499999-999903409090
T.._
-1 —4099.90 — ~ T "
GW j-0990.09 '
iI•
:
:
1
iu1M > 1 1— mi
- S 9
--f—
5.05.0 15.9 i551
ToH
V
"S"N
"NH"
5.9 ! N
YopN60
-ft8 _J6 "
-f~
«
NNN•T,!L
_!LNN
p i rnr
"•(.i~:.
HRD-021LWR0421_[
i0
"o~
LNRD-023 i 0T
LNRO-023 ! 0
LNRD-058LJ4RD-056
LNKO-021LNRD-Q21LNRD-021 _^.NRD423LNRD423
00t
"o"000000
LNRO-023 1 0LNRD423LNR 0-058
0"6"
j i 1 6 j_N LURO^Sa • 0;' 1 6| NlHROSl T"0~
--!-._. _i._s_i
i
-H
-h
rr-6
- "r-j
1.U611.1 I«1
.1
.1
.1
.1r ! .1
j._\L
H-i
— t ——
.1
6.16.16.1a0IT„•
e~is
i
}
—
1
I !I
5555!!S!'.S
L!
— }— |~f-ii
i i
iT
1-
P
-f
-»-H
LNRD-0211 NR 0-021
0
LNRD-021 1 0
N !LNRD-023 0
N iLHRD-023 j 0"W"]LHRCMJ23 j" 6
N ilNRD-058 < 0~N"
'i-TNNNNN
NN
"NNHNNNNNN
-5-~S"
--"•TT
rr; Nnr[ NJ~N"1 N
LNRD458LNR 0-021 '
LMRD421 "LNRD-021
LNRD-021LNRO-023LNRDXro
SR^~
00
~sQ™.
0000
LNRD-C23 0
LNRD-OSBLNRD42I
LWRCM72ILNRD421LNRD423LNRD-023LNRD423LNRD-023LNRD423jLNRO-OSO'LNRD-OULNRD-058'LNRO421LNRD4211LNRD421ELNRD421j LNRD-023; LNRD-023•LNRO-023'LNRD-023tLNRO-023•LNRD4S6iLNRiMrU;LNRO-OJI'LNR002I
JLNRO-021JLNRD-021
! I N ILNRIM23f -j- — hr!u«MB~
1
—
— r-. .L
zri —
NN
NMHN
i "! ' N
nrrt-:! »
0"if
-o-00
~0~0D00000D000
00c
1ctc0n
JLNRO-023 {JLNR04231LNRIM581LNRD-058LMRO-050LNR0450LNRMM
ILNRD-OSO
0
(r0
i
App_E_gw_Tbl_1o3.xls Page 7 of 15 10/22/2002
GrouncJwater Data forDissolved cadmium, copper, lead, and zinc data (mg/L) for all data sets.•an^BWa
River Reaches 0 to 3.cadmium, copper, lead, and zinc data (mg/L) for CDPHE data (LNRD-068).
. \'''^]^:^^'^'
S Ark R3 Codmkjm. OluolvadS.AA RD.Codmlum. CMiulwd3 Arii R3 Cadmium. OtiKtfwad
PartedPartod 3Panod3jPartod Tj
Ark R3 Cadmtum. Dluolwad Parted 3
. i -. UFGStaOOfiHjma ;-;.; ,AWT 1-2AWT 1-2AWT 1-3AWT1-3
S Ark R3 Cadmium. d»*orved f Parted 3 AWTC-3SArt R3 Cadmium. Dis&oNed !SArk fO.Cadmlum. DIsMtod
S.Art R3.Cadmnm. DuiohwdSArk R3 Cadmtum. ObservedS.Art R3 Cadmium. Dtuolwd
SArk RS.Cndmtum. DU*otv*dS Art R3.Cadmlum^Or»»or-«lSArk R3 cWmkJmTDFssarued ~ "'SArk R3 Cadmkm. DfeeorvedSArk R3 Cadmhm. DiubtoedSArk R3.Cadmkim. QsiorvedS.AiX RXCadnmm. DusofvedSArt R3.Cadmlum. OiuorvedSArk R3 CadmUn. Ofssorvad
Ark R3 Cadmium. QuotvadS Art RiCadmium. DJiiafved
S Arti R3.CodmUn. Diuofcad
"pertod"3
"PtatadT
'pirtedY
SSIPamd 3
Pariod3Parted 3Partod 3Parted 3Partod3
"pertodYParted 3
WT1-3AWT 1-3
AWT 1-4AWT1-4
AWT2-1WT2-1AWT7-1AWT2-1AWT7-2AWT2-2AWT2-2AWT2-2AWT 2-2AWT2-3
"Period's :AWT2-3
Parted 3 JAWT2-3Ark HI Cwdmtum. OJiiolvad S Parted 3
SArt H3 Cadmium, biiitoiwid ! Parted 3Arh RlCadmkm, Otuotvad ! Partod 3Art R3 Cadmium, ouiibrvad Parted 3
S Art R3 Cadmium. OiuoNad , Pariod 3SArii R3 Cadmium, biuorvad l Parted 3SArt R3 Cadmium. Dtuofced _i_p*ltad 3
SArk R3 Cadmium. DI»oK<ad ! Pariod 3S Ark fO.Cadmtwn, Dlualvad } Partod 3
Ark R3 Codirium. OuioirMd [ Period 3S.Art R3 Cadmtom. Dissolved ! Pariad 3S.ArkRi.C»dmium. Ottsatvod ; Ported 3
S Art RlCadrnfum. diseoNed T"p*riod 3S Art R3 Cadmhim. CNiMrvodS Art R3 Cadmium. DissolvedSArt R3 Cadmium. Dts&otnd
P«hod3"Parted 3Parted 3
S Art R3 Cadmium. Disserved [ Parted 3
AWT2-3AWT2-3AWT2-4AWT2-4AWT2-4AWT2-4AWT2-4AWT2-SAWT2-5AWT2-5AWT2-5AWT7-5
AWT HAWTJ-1AWT3-1AWT3-1AWT3-1
S.ArtRy Cadmkm. Dtasolved j Pert* 3 JAWT3-2SArkR3.Cadmtum.Du*olmd j Partod 3S Art R3 CadmUn. Otssafced 1 Parted 3SArt R3 Cadmium. Otucrvad i Pertod 3
AWT3-2AWT 3-2AWTJ-2
SArt R3 Codmlum. DlssoNad Period 3 JAWT3-3SArt H3 Cadmium. DisservedSArt R3.Cndmtum, DisservedSArt R3 Cadrrium. DisservedS Art R3 Codmlum. DissolvedS.Ark R3 Cadmium. DissolvedI Art R3.Codmlum, Dtssotved
S Art R3 Cadmium. Dfitotoad
Parted 3Period 3Parted 3Parted 3~Pariod 3Parted 3Partod 3
S Arh R3 Cadmium. Disserved Parted 3S Art R3 Cadmkn. Observed j Pamd 3SArt R3.Cadmtum. DJisotvad j Parted 3S Art R3 Cadmium. Distorted ! Pariad 3S Art R3 Cadrniurn. OluoNod j Pariod 3SArt R3.Cadm»um. DltsafvedS Art R3.Codndum. Ottsgrvad
J»ariDd.3_
AWT 3-4AWT3-4AWTJ-4AWTWAWT 3-5AWT 3-5AWT3-SAWT3-5Awn-eAWT3-6
'AWTS-BVwTWAWT34AWT4-1
S Art R3 Cadmium. Qiuatvad \ Fund 3 !AWT4-1S Art R3 Cadmium. OtsutvodS Art R3 Cadmlun. DissolvedSArt R3 Cadmtum. DtuoNad
S Art R3.CadJmbjm. DissolvedS Ark R3.Codmkjm. DisioNadS.Art KJ.Cadmtum. DlssorvadS Art R3 CwtrrriumTnuolvad
Period 3Parted 3
IAWT4-1JAWT4-1
Parted 3 'AWT4-1
Pertod 3^AWT4-2~Partod 3 IAWT4-2Partod 3 IAWT4-2
t Partod 3 1AWT4-2IsArk R3.Cadmium Otuotvad | Parted 3 JAWT4-3SJMk R3.CsdmlurH. Disserved ~ i Partod 3 !AWTV3S Art Rl Cadmium. OlsuirMd Parted 3 (AWT4-3S.Art H3 Cadmium. DIssdMdSArt R3 Codmlum. Dissolved
S Art R3.Cndrr*um, DMsarved
SArk R3.Cadrrtum. Disserved
S.ArhR3C»dii**n. OluDhwdS Art R3 Cadniium. DuaoNed
Parted]Parted 3
"peTtoTi
Peflod:
Pertod*:i Parted 3
Parted 3
SArt R3.Cudm)um, Dissolved ! Partod 3
IAWT4-3
AWT4-4
AWT4-*1AWT4-<
AWT4-5 "JAWT4-5JAWT4-5
iUMWIO
12117
2117
2118
2111
2tU
21K211B
2 ifl2111
2112
2li:
2112)211;
21 if.21101ft 102110
21 TO210'
2107
2107
2iO:2107
2 OB2 062 a2 CMS
2 OG
2 01
•rGWCW
/ " : ' ; *
7/BV1996
-';i\-.'-*>':V'-:!"Cadmkm. DnsorMd
BMn99e;Cadmkm. Db*otv*dGW i 1CK4/19951
GW i S/7/I99BCW| &WI09BGW ;
"cw"
GWGWew
GW
7W199S9W10U
fJM/19987A/199Q
Cadmkan. DhuorMdCadmium, DisservedCadrrAn. OfluorvedCadmium, OkseNedCadnwm, DruotvM
5SdmkSTbtooN*d™CadmkJtn. DUorvau
fl/4/1 996 "Cadmium, DtuoNod
5*yi9M; Cadmium. DtuahariGW ] aft/1994 Cadmium. DlualvadCW 7/9/1 998 ICadmoim. DtooNadGW 1 QyS/199(liC«dmkHn.DruorvadGWJ 10r75f109S
GW"iB/19966*1996
GWJ 7W1996
Cadmium. OuuarvadCadmum. DiuorndCadmtom. DIuoNMCadmkm. Dftaolvad
GW i 9^1990 iCadmkjm. DbaolvadGW 1 10/24J1995GW1
GWCWGWGWewGWGW
Cadmium. O*w«*ved5n/l09a!CBdmuni, Dlxutvad
h 7"S/r99« Cadmium, DkuotvadBI5r199G9ft/ 1998
10/24/1995
jCadmhim, Obaotvad"Cadmkjni. ObsorMdCKlmkim. Dtasahad
5mV199fliCadmtem, ObmrivM6»1998!Cadmkjm, Druolwad7/9V1996
"GW l' 10>34/199521011 GWJ 10*24/1995
Cadmtum. OtscoNMCadnuum. Olsaolvad5»tak»Vato£Jvad~CadmUn. DbrcoNad
2101 GWj fi/7yi99e!CadmUn,OluoIvad2101
2101
2105
2105
2105
2105
2105
2102'2102
2102
2102
aVorii2095209520952095209]
209]
209J2092Toa?2087204720872087209E20962091
2091
209)
209420942094
~»54min
"208520S
~208S
20ft
"JOB
GW | OM/109t Cadrnhvn. OksoNedGW ! 7r9/1998;Cadmkm, Dbsohrarj
GWGWGWGWGW
GWOWGWGW
10/25/1995SW199rjUS/199C7/9/1 99t
,C«lmkun. OiuohradCadmJum. DiuoNedCadmtom, DiMorvodCKlmkn. Dtssolvad
9/5/1898 Cadmium. OtuaNad
—^Slallc Sii-dr rS-BVS/10967/9/19969C/1996
GW O5/199(
Cadmkim, DtuotvMCadmfcim. Obsofwd
Cadmkm. DtuorndGW 10/25/1995 'Cadmum. OrMoIndGW j 5W10BGiCadmam. ObwKvMGW"cwGWGWGWGWGWGWGWGWGWGWGWCWGWGW
GWGWGWGWGWGWawCWGW
, 7nO/109t .Cadmium. Dluolvtd9Afl99Bi Cadmhm. Dissolved
10/25/1995 fCadmem. DtuoNad5«109B:Cadmajm. DtttaNad
j_ 7/10/1998 'Cadmium, Dbsotnd9JBV199(
1Q/25/19KSrW199(
jCadmlum, OtuotvadjCadmJum. OluorvadiCadmbm. Oluorvwl
6«/1B98;C«lm(urn. Oisutnd7/10/199)9W199I
\omi\9v.5W199Ifl/7/199l
7/11/1991W7/199I
6/7/1991
Cadmium. Ohufvad•Cadmkim. DbcoNtdICadmhim. OruotvwjJCadmlum. Oasorvw]CadmkMn. DtuolvadCadmium. DftK**dCadmhrm. Oiisdvad
•Cadmkm. Dissolved7/1 1/1996 jCadrakim. DfssoNod9/7n99«!CadmJum. Dtuohml
10/20/1095 Icadmum. DIssoNvd5/9/1 996^ Cadmfcxn. Dtnohrad
7no/lSH9miB9t
Scadmun. DbsoNedtcadmkim. Dttaoh^d
GW 5«/199a:CarJmkjm. Oluorwd
GW
V.M"
__20B5JGW
2oas| GW
7/10/1091 «/7ri9tt
5/9/1M^ 6ffi/i~99(
7/10/1091
Cadmium. Dluolved•Cadmhim. DteaotvwJ
'cadmkmi. OliietvadCadmium. OiuaNad'Cadmem. oiwrvad
204*1 GW 1 erByiSUlCaomkim. Dbsotvad
UaadardVkhM00025;0.00250027
0.12
00790043
~OOM
f<
1
^
0.0025; <00025! <00025
0.0110007;
00075] <0.006
0.002500025000250002500025
<__
0.019! 1
o.obaooii0012
i~
0.249iO.lll!0.13|
0.1120.104
~ Soofi
i
|'
0.007}0.207007110.030!
6.002S0.00250.00250.0025 10006!
00025;0002*0.0023
oooe00025
r
f-0.042;0.019;0.02
0.01
oot0054
OCU0002
:
i1
-0.0025!00025!00025)00025!0002001
000?0002*0.002
iii
si0.0 11
— final0.0.
oocr0.002
I.sii! —
0.1110.0fl2i0.096,'0.112J
-' - 0053!
O.OMr
6.03410017]
0 002SJ <0.0025! *o.oozs1 <
OOOQ
f0.0050.0050.0051
J0.005oboif00050005
0.0051005
0005
0.0051.005
0.00500050.00500050.00500050.0051.0090005
0.005IOOS0005>.OOS0.0051005
00050.0050.00500050.0050.0050005
0.00500050.0050.0050005
00050.0050.0050.005ODDS'0.0050.0050.0050.0050.0030.00500050.00500050.0050.005O.OOS0.00500050005O.Ott0.00!0005
0.00500050.0050.00!00050.005O.OOSO.OOS0.00!
0005
"abosf
oooT00010.00
ooo
10011
tt
0u0
t1
010000011
1111t111
1111
0o00
000
"o~111.__
t1t0000
0
0TT01
010011f11
1
™i
c0
o
*!•HLL
"Rl< 1
RaoMO701 560701872701888701900701914701928
"701942~
liiffil;USCSUSGSUSGSUSGS
USGSuses___
H [ 701970 iUSGSHL
701984701990 1
usesUSGS
H j 702020 JUSGSH ! 702040H j 702054
USGSUSGS
L i 702060 IUSGSL" 702082H 702005H | 702110
r702124702138
L 1 702152H i 702168
USGSUSGSUSGSUSGSUSCSUSCSUSGS
H i 702194 'usesLLL
TQ22I2702206'
USCSUSGS ~
702232 fUSGSH i 702248HH
702260702274
L 702288L 702302"LHHH
702318702325702339707353
T"~§5SrtnHH
i
7023BS
702423
USGSUSGSUSGSUSGS
USGSusesusesUSGS
USGSUSGSUSGSuses
702437 USCS
H ; 702485
HHL
702479702493702507702S21
1 j 7O2535H i 702583H i 707503Li 702597L 1 702AMH t 702625H j 702649L 1 702683L i 702677H 702691H
"H"L_
HHH
702705702719702733702747
,702781702775702789
UsesUSGSUSCSUSGSUSGSUSGSUSGSUSGSUSGSUSGSUSGSUSGSUSGSUSGSUSGSUSCSUSGSUSGSUSGS.usesUSGSUSGS
L 702803 iUSGS
H - 702845i USGTUSGS
H 1 702859 iUSGSL j 7Q2B73 iUSCS
HHHL
H
~»L
"H"H
702887702900702914702926702942
~70M70
TTQ299S703012
™703040*'^ 703054. 703068
H j ««13
iUSGSIUSGS
useslUSGS
USGS
iUSGSfuses
]USGS=USGSIUSGS
!UOS ft USGS fcv EPA
1CWCWGWGWGW-GW
||||l;::;|::::::;;i!;is:,ii|:|;|
499999-0999.99 !9999.99 !
-099999 i-0999.99 i-999909 !
GW 1-9999 09 1
GWCWCW
GWCW
-0999.99 |-B999.B9 •-0909.09
-0999.99 i999999 i
GW i-0999.99
GWGW
-099909 ••9999.99 1-9999.99 j
GW -9999.99 )GWGW-GWGW
-999939 i-9999.99 . . . - . . . ,
•9999.99-9099.99 ' "" "
GW )-9999.99 IGW -9999.00 •GW j-0099.09 iGWGWGWGWCWCWGW
hGWGW
'-9999.99 i
! i ""~ "M*j
^_L_L J*1 INI
! N
;;|:LNRO-OSOLNRD-OSOLKRO-OSOLNRO-050LNR&050
I0
~6"_o_
; N ! LNRD-OSO | 0r T ' fTlLNRD^OSO TO*
; : ! N iuNRD-oso
t- ; ' N— i — • — 1 — J~S^-I— I— }— f~
.NRD-O50LNRO-OSO
LNRMSO"! > : IN [LNRD-OSOj I |N JLHRO-050
I'M'i N
' . !"i i Ni l l i N
~T"r 1 • [ « •
.NRDXtSO
.NRD4»50LNRD-OSOLNRO-OSOLNRD-OSOLNHD-O50
00
-5-T0T
-tf-
000
IT-NRD-O5O ! 0LNRO-050 i 67
i— T— ;- -"N"!Qais«b h>/ I i Hi i j N
i l l ! "-0999.99 ! L j • 1 H-099909 i-999909 i-009999 |-S9S999
j_ | i i N
! 1 i i Hr— i — t nr
-999999 1 i '• • ' N
•»»«• "" " 1 | !«-0999.99 t i = N
CW -0999.99 ] i ' i N
GWGWGWGWCW
GW
LNRO-OSO j 0
.NRD-OSOLNRD-OSOLNRO-OSOLNRMSOLNRD-OSOLNRD-OSOLNRO-OSOLNRD-OSOLNRD-050LNRD-OSO
-0999 99 i t : ! N JLNRCWrSO-0999.99-9999.99 """ |-999999 =-999999 i
1-9999.99 >GW {-899999GWGWGWGWGWCWCWGW
"GW"GWGW~
GWGWGWGWGWGWGWewCW"GW
•999999 I-0999.99 i-909999 ' !-909999 }-099999 !-9999.99 !-8999.99 ;-9999.99 j-9999.99-8999.99•999999 ]-9999.99 ;-9999.99 i-999999 ;-9999.99 1.-9999.99 I1-899999 L" j
-9999.99 !
i-0999.991-9999.89
GW 1-9999.99 1GW i-0999.99 ;GWi-999999 "" " !GW i-9999.09 iCW j -9999.99 ^GW i-9999.99 ]GW f-B999.99 jGWi-0999.99 " ' 1GW -9999.99 !
GW
TiwGW
"cw
"ow
*cw
1-999B.W•4m9ia ' ~ 1
1-0999.99 1
-j~jj - ... -. .-. 1
i«m.M — — 1 —
1 i N..... ^
i 1 N; 1 IN
i I = f N
1 ! L N
! ! i i N1 i Hi
i— ! \-H
1^ TN! i IN
- - i i Mi i j N
! I ! N
;N
i i IN
- !~rT rH"1 ' L 1"\ ' \ N
i i N
1 1 N
t Ni i j N| ! 1 i NF ! : N
i i ' i NL..-L1.
H-H--S-4-f-!--^
tizptz,:, j L ! i H
LNRO-OSO
LNRO-OSO
LHRCWSOLNRD-OSOLNRD5SO~LNRD-OSOLKRD^50 "LNRD-OSOLNRO-OSOLNRD-OSOLNRO-OSOLNRO-OSOLNRD-050
1JS.
o0
-6~_0
00
"T
~oT0
"T
0000001
Hr0
" 0LNRD450 i 0
LNRMSO~T6"LNRD-OSOLNRiMM' •4LNRD-OSO • 0LNRCWST] 0LNRO-OSO i QLNRO-OM ToLNRO-OSOLNRD-OSO
SLNRCMMO!LNRD-OSO
U-1TfoT o
LN'RCMMO i 6"'LNRD-050ILNRCMiSo"ILNRO-OSO
jLKRO-OSO
^LNRD-OSO
?LNKD-O50
; °
4-s-0
~0~0
TT
KRO-050 i 6
iLNHD-050 1 (T I : IN !LNRD-050 i (
j i 1 26 [ 76 j N JLNRD-021 } 0
App_E_gw_Tbl_1 o3.xls Page 8 of 15 10/22/2002
Groundwater Data forDissolved cadmium, copper, lead, and zinc data (mg/L) for all data sets, ai
^is River Reaches 0 to 3.il cadmium, copper, lead, and zinc data (mg/L) for CDPHE data (LNRD-068).
Co* Pertod UTOStafcnNamaS Art R3 Cadmhm. OwMtved Period 3 IUUWiOS.Art R3 Codntum. Dbtotved ! Penod 3 iUUWiOSArt R3 Cadmium. Dluafced Period 3 JUMW10S Ark R3.Cedmium. OHiatved i Penod 3 JUUW10SArt R3.C*drrtum. Diuaived } Pertod 3 JUUW10S Art R3 Cadmium. Dusolved 1 Penod 3 IUUWIOS Art R3 Cadrrium. Dissolved 1 Period 3 iUUWiO
S~Art RJ CadrnUm. Dtuorved ! Penod 3 ;UUW 0S Art H3 Cadmium, Dtiuvved ! Pertod 3 UMW aSArt'RSCadmkn Outolved ! Pertod 3 UMW 1S Ark R3 Cadmium Dt.utved i Pertod 3 JUUW 1.Art R3 Cadmium. Dlt-ofved 1 Pertod 3 "UUW 1
S.AA rU.CadmUii. DliMKed . Periods UUWll
SArtR3Cadmlurn DtssoWed ! Periods UUWll
S~ArtR3CedmUjm.rjlMOrVed Pertod 3 UUWllS Ark HiCadmJum. biuotved Period 3 jUMWI 1SArt R3 Cadmium. Oti*o»vod Pariod 3 -UUWl 1SArt U.Codmium. biubived i P«tod 3 i UUWl 2S Art RJ.Cadmrum. Dissolved i Period 3 IUUW12
. Art H3 Codnaum. BisoNed i Periods UMW12S Art R3 Cadrraum. DUsotvod ! Pertod S ;UMW12S.Art R3.Cednium. Otuofved ! Penod S UUW12
Art R3.Cadmtum. Dissolved • Period 3 UMW12S.AJTRyCedmium. OluoWed Period 3 UUW12SArt R3 Cedmhm. OiHotved Periods UUWl 2
ArtR3Cadmiurn.Oiuohred Periods UUWl 2S Art R3 Cadrrium. Dluohed Penod 3 UUW12S Art RS Cadmium. Diuaived Period S !UUWl2S Art R3 Cndnjum. Dusahed i Period 3 i UMW 16S Art R3 Codmium. OUsaived S Pertod 3 jUUWiaS Art R3 Cedrrrium. Orsaalwd f Penod 3 (UUWIBSArt*MCadnum.6lua»nd i Period 3 ; UUWl 6SArt R3 Cadmium, nuorved Period 3 IUUW16S.Art R3 Cadmium. Dissolved i Pertod 3 -UUWlBS Art R3 Cadmium. Dissolved 1 Period 3 JUUW18S Art H3 CwHWum. DtssoNed j Pertod 3 JUUWI7AS Art RS.Cadrrium. Diuotved i Pertod S JUUW17ASArt R3.Cadmium, DJuoWed i Pertod 3 -UUWI7A
i/rtRjCadrnJurii. DIssoNed Periods UUWl ASArt K3 Cadmkm. Diuotved Periods UUWl ASArt R3 Cadrrrium. ObBoVMt ! Period 3 UUWl AS Art R3.Cadmun. Ottscdved | Periods UUWl BS.ArtR3.Cadrn^w.druatved i Periods UMW17BSAARXCadmJum Diisatved • Pertod 3 SUUW17BS.Art R3.Cadmiurn. OUsotved ! Period 3 .UUWI7BS.Art R3.Cadmtum. Olssotved Pertod 3 .UUW17BI.Art R3.Cadfr.ium. DIuolVBd Period 3 UUW17B
S.Ark R3.Cedn.tum. Oiisorvrri Pertod S UUW17BSArt R3 Cadnvun. Dlisotvad Penod 3 UUW18SArt R3 Cadnaum. Dissolved Penod S ;UUWlBS.Art R3 Cadneum, Otaurmd Period 3 !uUWlBS.Art K3 Cadmium. DUsotved j Pertod 3 i UUWl 8S Art RS.Codmrum. Dtuohed [ Pertod 3 jUUW B5 Art R3 Cadmium. Oniatwd Pertod 3 JUUW BS Art R3 Cadmium. Dissolved i Period 3 jUUW 10SArt H3 Capper. Dissolved ; Period 3 iAWT -1S Art R3.Cappor. Dtuoived S Period 3 !AWT 1SArt R3.Copper. Dr-sobed Pertod 3 iAWT .)S Art" R3.CoDper, OiuaWed Period 3 IAWT iSArt RS.Copper. DUsaWed t Penod 3 JAWT -1S Art R3 Capper. Dissolved 1 Period S AWT -2SArk R3 Copper. Diuaived j Period 3 AWT -2S Art R3 Copper. Dissolved Period 3 AWT -2S.ArtH3 Copper. Ditsofved ! Period 3 AWT -2S Art W Copper, aswrved i Period 3 iAWT 2S.Art H3.Cappar. DUtatved { Pertod 3 IAWT -3S Art. RJ Capper. Dissolved i Penod 3 AWT -3S.Art R3 Copper. Dl.iaNed p Period 3 iAWT -3S Art R3 Copper. blisaiMd ~| Period S JAWT OSAA R3.Copper. Dluarved period 3 :AW1 -3S iArt RJ Capper. Dissolved j" Period 3 jAWl -4S Art Rl.Cappet. Dissatved 1 Period 3 JAW1 -4S Art R3 Copper. OUsotved 1 Period 3 JAW1 -4S Art R3 Capjxtf . OtssaWed • Pertod 3 JAWl -45 Art HI Capper. OtssarVed Period 3 iAWT2-1
3 Art H3 Cap|j« . DUufced Period" 3~TAWtt"l ™SArh R3 Capper. Dissolved Periods AWT2-I
SArt R3 Capper. Oiuotved Pertod S 'AWT2-2SArt H3 Copper. duarVed i Pertod S • AWT2-2SArt R3.Cat.iper. Ottsorved | Pertod 3 .AWT2-2SArt"R3.Capper. OlssaWed i Period 3 SAWT2-2S Art R3 Capper. Dluatwed I Pertod 3 JAWT2-2
9HJB
ULW
"
;
2048204820482048204820482048
204B2048205220522051
20SJ
"2052
2052205220522058
elfCWCWGWGW
CW
GWGW .GWGWGWUWrw"cw"
fDele
7/14/1998
1I/Q/1W8
a£Cadmium, DluatvedCadrreum. DissolvedCadneum. Dkaotved
3/2&71B99 Cadmum. Dicsatved5/1B/1999 ;CedmUm. Dttsotved6/15/1999 Cadmium. DkutivedB/17/I999 Cadmun. Oluarved
B/1SV2000B/ZB/2000
fiAfl998
7/14/19989A/1988
Mfl/1998
Cadmium, DevolvedCadmun, DeuotvedCadmun. DiuolvedCadmui), DtsMtvadCadmajm. DkaolvadCadmtm. Dtesotved
S/l8/1999;Cadmlum. Diuotved
GW : 8717/1999GW| 10/29/1999
GW ! 6/9/19982050 GW
~2658 GW2058
~205B205820582058205820582058208320832DU20832083208320832109
2109
2109
2109
2109
109IDS109109109IDS109lOOj124124124124
2124
2124
2124
2119
2119
211!
2119
2119
2117
21i;
2117
2 17"2 17
2 IB2 112 113118
2 182 12 13111 tJ i:
; 11:2 1
~2~~T2 r2 1
2 1
S-1UWUW
E7/14/19989fl/l998
11/0/19981/26/19995/18/1999
~~fl7i5iiS»GW ovi 7/1 gatGW | 10/29/1 99SGW j fl/iS/200CGW 8/28/2000GW 3V2S/19SEGW 1 5/18/1999GW [ artvimsGW ! 8/17/1999GW IQ/2BM999GW 6/15/2000CW I B/30/2DOCCwT MS/19WGWGW"
GW~^GwGWCWGW
V18/IWQ6/15/199!
'Cedrrvjm Otuotved~Cao rn.OtuorradCadmium. DttaotvedCadmium. DeooNedCadmium. DkaotvedCadmium. DeuotvedCadmium, ObservedCadtrtum, DttaotvedCedmbm. Oiualved
"Cadmium. Diuaived"Cadmun. DosntvedCedmtom. DIsaoNedCadmium. Observed
^Cadmium. ObsoivedCadmkjm. DissolvedCadmun. DbsohedCadmbrn. DkaorvedCadmhMn. DtuoNedCadmkjm. DissolvedCadmtom. DiuolvedCadrreum. OlMotvedCadmium. DissolvedCadmkm. Dtootved
'Cadmium. DBJaoVad "
l(V2B/l999iCadmlum. Dlnotved«/1 S/200t Cadneum. DIsaoMed(/JO/2000 iCedmajm, Diaiolved3/25/199! iCadneum, DisaoNed5/ia/i999JCadmkim, Diuotved
GW; 6/15/1991G«t"e7i7/S9iGWj 1009/109!GWGWGWGW
6/15/20008/30/200C
S/T 8/199!6/1 5/1991
GWj VI 7/199!GW long/liraGWGWGWGWGWGW
B/1 5/2001anonooo
{CadrraMn. DiuotvedCadmium. DhtsohttdiCadrnkm, Dtnotved[Cadmium. DtaorvadiCadmlum, DtosotvedjCadrnkMn. DeuofvedjCadmlum. OiuohedCadmium. DevolvedCadmkim. DbtoNediCadmum. DhsoTved; Cadmium, DfcsotvedIcadmium. Otartved
10/23/1095 'Copper. Diuotved5/7/1 986 Copper. Otuotved6M/199I7/8/199
GW ! 9M/1B9GW j IQV24/19B'GW| 5/7/199
Copper. DissolvedjCopper. DbioNedi Copper. Dliaotved{CoppM.DIuorved.Copper, Dtstotwd
GW : 8MJI996jCapper. OiasatvedGWGW
I 7/S/199! 9W1B9
GW[ 1Q/24/199GW ! 5/7/199CGW i art/tag
i Capper. DiuotvediCopper. OhsolvedjCopper. DiuaivedCappeVrDbsoivedCopper. [Huatved
GW < 7/8/1 906 'Copper, DiuotvedGW OH/199GWT 10/24/109,GW
GW^ BM/1991i 7/8/199<
GW i 9/4/I9E
;Capper. Olnatved•Capper. DiuctvedjCapper.OUsahed'Copper. DejtoNediCapper. Dtuatved
GW i 1005/1 995 iCopper. Ohsolved
GWGW
GWGWGWGW
B/S/1987/3/1 M
liCapper. DtssalvedI! Cooper. Diuolved
10QS/1995iCqppar. Dbnhnd5/a/iaatwieg7~/g7i9sW5/1U
I [Copper, bissalved1 'Capper. DisservedliCopper. DbuTved
SeMdemVakje0.00150.0015
I»
ooois <00005 <
0.0009
oTiSolOOOOIj *
000015000290.0015; <o.otwsr0004
00074
000700117
~TLJ_
H-0.0058 100018 10.0015] <00034000310.00510.002*000430.00180005
0.00220003700005oooog;000090000900009!000010.0005002SI-00204^002OST
O.OTJ69J0.021200001
0.01 3fl00312:0.0207'.0.0195'00213!0.0103J
*~ bdzit'i00139;00005!0.021-
O.OOQS
oooos0.000
iii0000241
002510025]0.02'0.02-0.02*0.02!
tii
0.025]0035:
0.02
0.02
0020.34
•i—iir~
0.272:0.153!0024
002002
l,«0.025002$0025
0.02S0.025
OCC- OK 5
0.0250.025
^Capper. DasoNed | 0.02S,
0.0050.0050.005OOOS00050.0050005
"oooT0005.OOOS0.0050005O.OOS
0005
0.0050.0050.005OOOSOOOS
~6"oos~0.005OOOS
j,.ops_
O.OOSOOOS0.005OOOS0.0050005OOOS
"oobT0.005OOOS)OOS
OOOSO.OOS0.005
OJM50.005"ooos1.00900050.0050.0050.0050.00500050005OOOSOOOS00050.0050.005DOM
1.31 31.31.3131.31 31.3
33.3.333
|00000o"
6~
J» L
RaauBO489229
L > 469245L I 469301
,
JOS 4 USGS far EPAUOS & USGS tot EPAUOS 1 USGS lor EPA
L [ 4 0414 JEPAAJR3
HL :
TT
470452 iEPAAJRS470471 JEPAAJR3 ~"
70S38B IURS Operating Servicas tor EPA0 L 7054420 H0
00
111000010o"00000(f0
00"011t
1
"f1t11111010000000000
"o000000
'o0
— f-fjT
.3
.333
3y
— y-
.3
.3
.3
.3
00n(1
00
-5-0aa0
HL
469277489293469309
URS Operating Services for EPAUOS A USGS fcv EPAUOS A USGS lor EPAUOS & USC3 kv EPA
L 469325 iUOS 8 USGS kw EPA
H
LLLHHLL
470578 'EPAAJRS
470814470633"705478469341409357
'489373469389
L :- 470652HH
4706714~7069a~
L~7 470709L } 470728H
•-
"ir
705510~7055fla
471262471281
H 47?3CO
LH
47133870S99T
L ! 700050L • 471357H : 471378
irpi71395~
f
f
471433706084706140
L ; 471452H ! 471471
EPAAJRSEPAAJR3URS Operating Scrvfca* tor EPAUOS ft USGS br EPAUOS A USGS lor EPAUOS A USGS lor EPAUOS 4 USGS hjr EPAEPAAJRSEPAAJRSEPAAJRSEPAAJRSEPAAJRSURS bperatng Service* tor EPA
*UR3 Opera^~SefVkWfar EPAEPAAJRSEPAAJRSEPAAJRSE'PAAJRS"" "EPAAJRSURS Operating Services (or EPAURS Operating Services tar EPAEPAAJRSEPAAJRSEPAAJRS
EPAAJRS'URS Operating Service* tor EPA
EPAAJRSIEPAAJRS
Hi 471490 iEPAAJRSTT 471S09
L i 471528H i 706174L i 708230L ! 471547H j 471566H""
1
LLHL
47)564471803
"«71KZ70626470B32O
L t 701726H i 701740H | 701768H~! 701778L > 701792
TpoiBOBH } 701820H f701834HL
701848"701874
'L '• 701888HHHLLHHI1
HH
LH
701902701910701930701944
f~70195B"701972701988702000702014
r~7"02043702056
702084\~1mS
iEPAAJRS
} 1GW 9999 99GW iCWi
N99.99099999 t
3W 1-0999 99GW L4J999.99 1GWGW
GWGW iGW
«999fifi09999
499999999999-909999
GW 1-9999.09CW I-9999.99GW i-9999.99 j
GW 1-0999.99
GW f-9999.99GWUWGWUWGVT
499999-990999-099999•099999099999
GW -9999.99GW 1-9999.99GW ;-9999 99
--
GW1-899S99GW 1-3999 99 !GW [-6999 99 iGW
GW~GW~
-9999.99 1-0999.99-999999-9999.99
GW i.9999.99GW i-9999.99
WrGW
999999
....
*-9999.99-9999.99
GW 4999.09
p-999999-9999.99
GW i-999999GWGW
.S™!.GW
-9999.99 :-9999.09 j-9999.99-B999.99 >
GW 1-9999.99GWS-9999.99 "
—
|1— — t
ii282ft20
41
767.8
IB reifj-feij"
! T""
I ;261 1 3
"
-fTrr
t~T"
1 p-y-ii : s
!_ . '___
i\I
1 12.;212.72 7
1 '""1 "*
2.7
' I2-7
'_
J
33
-H-; i si 3
i ; s— j — i— -
-r *•1 3
T~1 3"
;
nIEPAAJRS i GW 1-9999.99 i 1'URS Operating Sovfcn far EPA ! GW i- 8999. 99 iiURS Operating Services for EPAiEPAAJRSJCPAAJRSJEPAAJRS•EPAAJRSEPAAJRS
:URS Operattng Service! tor EPAJUHS Operating Service* lor EPAiUSGSIUSGSiUSGSiUSGS ' "iUSGSiUSGSJUSGSiUSGSiUSGSiUSGS "'uses'uses:USGSJUSGSiUSGSJUSGS[usesIUSGSiUSGSIUSGS
IUSGSiUSGS
"Fuses;USGS
H 1 702112 iUSGSH j TUizatusc'sL [ 702140 iuscs
GW 1-9999.99 iGWi-999999 ;GW p-099999CW 1-9999 99GW"cw"GWCWGWGWGWGWGWGWGWGWGWGWGWGWGW
-999909 j-9999.99 i-999999-999999-9999.99 I•9999.99 <-999999 !
-9999.99 1-9999.99-899999•9999.09 i-9999.99 j-099999 i-099999 T•9999.99-999999
GW -999999GW J-B999 09GW --0999.09GW 1-9999 98GW =-9999.09GW j-0999 99GW 1.0999 9B
CwGW
GwGW
GWGW
|_.
r-
.man " ' 1
•neg.n•9M9.» i—
-99M99 ' " 'J-M99M ' !
Gwi-999999 " ' ! "
3-..
!
r—
^~
—4—
iHNNNNN
"H"
-Ir1NN
.™_N
::|i:JNRD421.NRD-021LNRD-021.NRD42S.NRD423 ~"
i00000
LNRD-023 0LNRO-023 t 0
SsS^~[T"LNRD-OS8 i 0LNRD-021LNRO-021LNRD421
000
1 N LNRtM)21 i 0
' N |LNR[M)23 ! 0'
777.77.77.77.7TT777 7
--
^
HNNNN
NNN
"N"N
N
NH
< H
H"
NN
VN
N
—
;
r "t ".. i
t*-•- B! B
N
N™rT
"S"NHNNN
NNN
; H: N
< : i N
_!_, — i —
' •T- 4-
-
[
-!
t
— K
— i — ^ —i
..
1
P
f —
I
-L-
-j
______
NVN
i NNN
i N
N
1-"-
1"i Ni N1 N: N-• N
1 N
.LJ?
r N
Tif: N
T"N"t"
LNRM23 ' 0LNRD-023LNRD-05BLNRD-021LNRD-021LNRO-021LNRD-021LNRD-023 ~tLMRD-033LNRD-023
LNRD42S
00000000
00
LNRD-OSB 1 0LNRD-05B 1 0LNRD-023LNRD-023 jLNRD-023,LNRD-023LNRO-023LHRb-OSa"'~LNRD4S8LNR^O-023LNRD-023LNRD423 *>
LNRD-023"LNRD4S8tHRMSa""1
LNRD423LNRD423
0000™000
"o"00
0000
*"oLNRD-023 ! 0iNRMM-yo",LNR&<I23"LNRO-OM
0
LNRD-OSB 0LNRD-023 ! 0LNRD-023_
LNRD-023LNRD-023JLNRD-OS8
LNRO-050LNRD-050LNRO-050
ILNRD-OSOTHRO-OSOLNRD450LNRD-050iLNRD-OSO^LKKCWSOjLNRD-050iLNRO-050LNRD-050lLNRFJ-050JLNRD-050iLHRD-050iLNRD-050LNRD-050
o000000,-„._
1
ff00010000
KLI1 o
LNRD-OSO i 0JLNRD-050 t C;CNRI>DSO 1 t
ILNRO-OSOILNRO-OSO
LLNHD4SO1LNRD-OSOILNRD450iLNRD-050
0
"*~I~rT
"o"ILNRD4SO 0
App_E_gw_Tbl_1 o3.xls Page 9 of 15 10/22/2002
Groundwater Data forDissolved cadmium, copper, lead, and zinc data (mg/L) for all data sets, ai
is River Reaches 0 to 3.il cadmium, copper, lead, and zinc data (mg/L) for CDPHE data (LNRD-068).
:' ' ' . - • ; - . ; : • • • • . ! • . . • : ; • . ; _
• 'ca*e ' "i1". '• .. • • Pwtad-Art R3 Capper. Dissolved Period 3
SArt R3 Copper Dfssarved • Period 3 ;Art R3 Capper. Dhsohed Penad^
SArt RS.Capper. Dissolved Period 3S Art RlCopper. Observed j Period 3 'S Art R3 Cappar. Dissolved 1 Penod 3S Art R3 Copper. DnsoNed 1 Period 3S Art R3.Copper. Otuotvad ! Period 3S.Art R3.Cappar. dissolved | Penod 3S Art R3 Cappar. Dissolved jSArt R3 Capper. Dissolved |
Periods ."Period 3"
Ark R3.Coppei. Dtssotvod Period 3 S Art R3 Copper . Dissolved i "Period 3
.L» :•''.. "v^ ' :• :•• ' ' • y.V^kWT2-3
AWT2-3AWT2-3MrVT2-3
AWT2-3kWT2-4
AWT2-4WT2-4WT2-4*WT2-4
AWT2-5WT2-SAWT2-S
S Art R3 Cappar. Disserved j Penod 3 JAWT2-5
SArt RS.Capper. DisservedS Ark R3.Coppor. Dissolved
Pertod3Period 3'
S.Art R3.Copper. Duvtfvod j Period 3Art R3.Copper. Dissolved Period 3
S.AritR3.Copper. Dissolved ! Period 3S.Art R3 Copper. Dissolved ' Pertod 3S Art R3 Copper. Dissolved ; Penod 3
AWT 3-1AWT3-1AWn-1AWTS-1AWT3-1AWT 3-2AWT3-2
SArt R3 Copper, Dissolved j Period 3 i AWT 3-2SArt RJ.Copper. Dissolved ! Period 3SArt R3 Copper, DissolvedS Art R3 Capper. OnsoKadSArt R3 Capper. Dlsialvod
.Art R3 Copper. DissolvedSArt H3 Coppof. DusoNedS.Art R3 Coppet. Dissolved
SArt H3 Copper. DIssoNed
AWT3-2Perad 3 IAWT3-2Periods AWT 3-3
Periods AWT3-4PertaJS
"Period's'Periodj
PeriodsS Art R3.Coppai . Disserved i Pertad 3SArt R3 Cappar. Dissolved
.Art R3.Copper. DissolvedrfS&L
PeriodsS.ArkR3 Copper. Dissolved ! Penod 3
AWTS-4AWT3-4AWT3-4
AWT3-SAWT3-5AWT3-5AWTWAWT3-6
S.Art HJ Capper. Dtuolved ! Penod 3 JAWTW
SArt HS.Cappnr. DisservedArt R3.Coppar. Dissolved
3. Ark R3.Cappar. Dissolved
s:Art"rUa£peY; DissolvedS.Art RS.Copper. DissolvedS Ark R3.Copper. DtisarvadSArt R3 Copper. DtitalvadSArt R3 Capper. Dissolved
S Arm WCoppm. Dissolved
PeriodsPeriods
'Period's"
PeriodsPeriodsPeriodsPeriods
'Periods
PeriodsS Art R3.Capper. Dissolved ; Period 3SArt HJ.Copper. Dissolved PeriodsS.Art R3 Cappar. Dissolved Period 3S.Art H3 Coppar. Dissolved ! Period 3SArt R3 Capper. DissolvedS Ark H3.Capper. Dissolved
L.P-3S1Period 3
SArt R3. Cooper. Dissolved 1 Penad 3
*AV¥T3-6AWT4-1AWT4-1
AWT4-1AWT4-1AWT4-2AWT4-2AWT4-2
AWT4-ZAWT4-SAWT4-SAWT4-3AWT4-SAWT4-3AWT4-4AWT4-4
SAri R3.Copper. DliiaMed T Period 3 !AWT4-4
S Art R3.Copper. Disserved ! Period 3 jAWT4-4S.Ark K3.Copper. Dusarrad < period 3S Art R3 Copper. Otesaived j Period 3*SArt RS.Coppar. DissolvedS.Art RS Coppar. DisservedS Art R3 Coppar, DissolvedS Art RS Copper. 'DissolvedS Ark R3 Copper. DissolvedSArt R3 Copper. DissolvedSArt R3 Cappar. DisservedS Art R3 Capper. DUsabvd
Periodsr "Period 3
Periods•periaVs"Periods
'""PeriodsPeriodsPeriods
SArt R3 Capper. Ottsahed ± Period 3SArt R3.Copper. Dissolved ! Period 3
S Art R3 Copper. Disserved i Ponod 3S.Art R3 Coppar, Dissolved 1 P«rlod 3S Art R3 Capper. Dissolved 1 Period 3
1AWT4-5-AWT4-51AWT4-5JAWT4-5AWT4-5UUWIOUUW10uMwibi UUWIO1UUW10JUUWIOluuwioiUMWIOJUMWIOjuuwioUUWIO
SArhRJ.Copper.DUiarvBd • Periods UUW11S Art RS.Capper. Dissolved ' Period 3S Ark Rs'Copper. Dissolved Period 3S.Art R3 Copper. Otssatnd ] Period :
UUW11UMW11iUMWll
SArt RS.Cappor. Dissolved I Period 3 iUHWll
S Art H jTCapper Ssioived i Portal 3 !u5w7iS.Art HI Cappar. Dissolved ; Period: >UMW11
S.Art R3 Cappar. Oissoiwd ! Period 3 JUUWI 1S Art H3 Copper. Dissolved j Period 3 1UUWI2
SArt RS.Copper, OliMlved i Period 3"iUMWIZ
12107
2107
~2~1072107
107
106
10E
106
"Toiji10610110)Tor
2101
2105
2105
2105
210!
2105
"21022 022 022 022 023 O209520ft2O952095
2092"20022092,208208
"SB"
20820962096
1GWGWCW1
Gw !GW
UV24/19935W1996&S/1QM7)9/19969A/19aa
GW t 10/24/1995owl ""SO/TOMCW 6/5/1906
~-
GWGW"
9A/19S610T24/I99S
5/7/1996SM/1996
;-^8iT«&M
Copper, OUsoNed
LCapper. Dlsiolved __Copper. DtssahedCapper. Dft solved
tCapper. DuofvedCapper. DisservedCapper, DissolvedCapper, DissolvedCapper. Dissolved
lCopper. Dissolved^Copper. DissolvedCopper. Oisaotved-Copper, Otuotved
GW • 7/9/1998 iCapper. Dasatved
GW i 10/2S/1S95 iCapper. DisservedGW 1 5AM 086 'Capper. DissolvedGW I 8/5/1998 Capper. OasarndGW ! 7/9/1991
WrTorS^GW i 5*1 we
GW ! 7/9/1991CW ! OrB/iOHCW ; 6/5/199)GWCW
[Copper. OttsdvediCapper, DissolvediCopper. Oluarved[Capper. Dbsohed^Copper. DtnorvodICapper. DissolvediCopper. DkualvediCapper, Dissolved
10r2S/l995;Copper. Ditaolved5/6/tOBi
GW 1 7/10/1996GW i 9A/1994
GW 1 SrW199CGW] 7/1 61 1991
GW•GOTb 9/6/1991
3/25/109!GW i 5/9/1991CW! MfiBl
GWGWGW
2096J GW209620942O*2094
200420892089208920692089208620882068
"MM20852085206S708!
20852O482041
2041
2041
204C204.
2042041
204204204205,
20i205205205
"as:205
205.
20*
"MS
GWGWGW
0/G/199J
iCopper. DttsorvedCopper. DissolvedCoppar. Dissolved
Coppar. Disserved'Copper, Dissolved: Copper, DtsaorvedjCopW. Dissolved
5:Copper. DkssohmdSiC^pper. Dbaotved"
S[Cepper. Dusohed ~~'10/26/1095; Capper. Dlssahed
5nVl096;Copper. Onsohed
7/1 l/1996!Cappar. Dissolved90/199
1006/199*5/9119G
GW"1 6/7/1 D9J
^Copper. OlisarvedICoeper. Dlscotved.Copper. Dissolved5 Capper. DlssaVed
CW 0/7/1 096.. Copper. DissolvedGW 10/267199!GWl 5/9/199GW ( 6/6/199
*~GWGW
7/10/199W7/199I
GW i 10/28/109GW I 5/9/1991GW I 4/6/199
i!Capp«.Dls»**dBl Copper. Dissolved(Capper. OtssoVedB. Copper. DissolvedS;Copper. DinalndSjCopper. DissolvedB; Capper. DissolvedGj Copper. Dissolved
GW j 9/7/1996; Copper. DftaoNMGWl 10(75/1*CW l SVB/199GWGWGWGWGWGWGWGWGWGWGWGWGWnwGWGWGWawCWGWGW
TnoTTw9nVie98/9/199
1 7M4/199i 9Wi«
SiCapper. DissaKedQ!copper. DtssolMdl-Capper. DiuahrediCopper. DissolvedBjCopper. DtssaMd8;Capper. DkuaNed^Copper. OissoNedBiCapper. Otavrved
11/9/l096;Cappar. Obuotved3V26/l099lCapper. DlssotvedS/lB/'lO! )'Capper. DissolvedenS/tOOOiCopper. DtseoNedB/17MB9
10/29/1918115/200warn6/9/199
OiCopper. DissolvedSiCapper. DisservedOjCopper, Dissolved^Copper. DbsoNedaiCopper. Dissolved
7/14/1998 Capper. OEseatvedgn/1998-Copper. Dissotved
1l/9/l996:Capper. Dissolved^ 3n6/1999!capper. Observed
5/1 8/1 009. Capper. Disserved8/1 S/igag.Copper. Otssolved
j GW 8/l7/l909;Capper. Dissolved
GW~| e72BV2ObO;Copper. DissaNedGW ; 6/9/l09e;Cappcr. Diesolved
GW i BA/lDSalCopper. Dosotved
is002!
0.0250.02!
"0.025044!
0.171
A
0296030310.279100250025,0025002SJ
00250.025)0025i0.025:0.025!0.02510.02510025i0.025!0.025;00250081
002500690025
0.2530.132002!
00250.0250.025
00250.025J0025
D.025J0025.0.02510.025;0025;
0.0250021
0.02500250.0250.0250025DOTS0025
0025!00250.023
i —
0025j0.02500250.00
0.00
0.004___
0001s <0.0014! 1
000210.00210.002*
0.00120.000,
! "<«
000130.0028
0.001-0001!OOOli
0.002.00021oowT
VS *. <
0.0022 *
"bdbzij i0.001! •
0.001; <
11.31.31.31.31.3 J1.31.31.31.31.31.31.31.3
1.31.31.31 3.3.3.3.3.3.3.33
1.333
3S33SS
— T3
3
333.33
333S3S33.3
.3
.3
.3
.3
.3
.3
.3J
' .3.3.3.3.33.3.33
313
.3
.3
.3
.3
1.31.3
1.3
i00000u00000000
000nu000u00000~0
00a
"a"00
-6"00
00000
00000u000
0000000000000000r0c0r0
u
I
0
1HHHLLHHHLLHin"H
L
H
M
H
LLH
f 02)64 ;702168 !702182 <702198 j
l>"';. ; ; ;.JSGSJSGSJSGSISGS
702224 IUSGS702234 iUSGS7022481702282 !7*02276702290703304702327^
"7b2341~7023S5
"702369
JSGSUSGSJSGSJSGSUSGSUSGSUSGS
702383 rUSCS"TdnoTlusGS ~
702411 !USGS702425 1USCS70243970245T"r
702467H ! 702481H i 702495I~[~702503H [ 702523L 702537H ,702551H J 7025115
USGSUSGSUSGSUSGSJSGSUSGSJSGSUSGSJSGS
L t 702599 jUSGS
H 702627H i 702651
J. 702685702679 "*
H i 702693H
T~LH
HLLH
"H~
702707
~7§fir
usesUSGSUSGSUSGSUSGSUSGS
USGS702749 'USGS702763
702791702805702819702833
r702o47
"Tj" 702875L > 702889H i fD2002 1H
"H"702916702930
L \ 702944L I 702058H i 702972H
LLH
702086
703014703028
'"703042H 703056
USGS
USGSJSGSUSGSUSGSUSGS
USGSUSGSUSGSUSGSUSGSUSGSUSGSUSGSUSGS
USGSUSGSUSGSUSGS
H i 703070 iUSGSL j 703084H i 489217H i 469233LLLH
L....
46924940926547041B470439
usesUOS A USGS tor EPAUOS A USGS tor EPAUOS & USCS tor EPAUOS & USGS tor EPAEPAAJRSEPAAJRS
470454 i EPA/URS470473
"470492H i 705391I 1 705447H ! 489281H f 469297L i 469313L i 463320L i 470559
H ! 470597L i 470616
L~f 705481H S 469345
1T'™459377"
EPAAJRSEPA/URSURS Oparsang Services lor EPAURS Operating Services tor EPAUOS I USGS tor EPAUOS& USGS for fcPAUOS & USGS tor EPA
'UOS A USGS tor EPAi EPA/URSIEPAAJRS'EPAAJRSEPAAJRS
URS Operatog Services for EPAUOS i USGS tor EPA
UO9 A USGS tar EPA
• t
GWGWGWnv
GW
'^j&S:M''M'\999999-9999.99-0999.09-0999.09
B1! i .i !
-BO99.90 ' iCW -9909.99 iGW j-9999.99 !GW 1-0999.99 iGW i-0009 99 iCWGW
GWGwCW
GWGW"
1
499000 !•0999.09-009999 ;•0000.09 I499009
-0999.09 ;-0999.09 !
JW i-9909.99 ;;WJ'9Q9999 i
GWGW"
-999999 i-.099999- - - !
CW 1-0999.09 jGW -9090.09 iGWGW~iw
GWJW
GWGW
CWGWCWGW
-9099.99 !•9999.99 :-9999.99 <-0999.99 i-9009.99 :-099999-0999.99 i
-099999-0999.09 i•0990.99 !-9999.90 j
GW i-9999.99 JGW j -8999 99
GW [-9999.99 1SW 1-099999 !GW -999999 !
GW 4999993WGWGW"GW
GW
GWGWGW
-0999.99-099999 j-9999.99 !-9999.99 " •" ' '
•9999.0B ~~ f•099999 i-0999.09•0909.09
GW 1-9999.99 IGW 1-9999.99GW j-9999 99CW j-0999 99GW i-0009 99
i1j_I_..J__.
!
!
— ti
iNN
N
N !N :N ,
N
N
-3--r-j-4-4^
! !. .. _r
L iT r™i i
vf.l*LNRO-050LNRD-OSOLNRD-OSOLHRD450LNRD-OSOLNRD-OSO
i0000100
LNRM50 i 0
LNRD-OSO t 0LNRD-OSO [ 1LNRD-OSO JOLNR04Sd" | 0"LNRD-OSO ! 07JRn5so~l a
i N 'LNRD-OSO
{:
N JLKRO-050
VN
N"
—fir
-HRM5CL_1
LNRD-OSOLNRMSO™1
0™_„„
00
LNRD-OSO t 0LNRO450 i 0
: j : N {LNRD-050 ! 0I t ij i <
i I
~i~f~.. -I-
— ' — 1 — '
—jij1
j —
i ' !.__!__! j__
j. j
•
!
.._,
N
N
V
N
LNRO450LNRO-OSOLNR'MSOLNRO-050LNRD-OSO
N ILNRO-OSO
N LNRO-OSOn"1
•3--S-"fi"
HN
000t6"0
0
LNRD-OSO ! 0LNRD-OSOLNRO050LNRO-OSOLNRD-050
LNRO-OSOLNRD-OSOLNRD-OSO
N ILN'RD ISO'N
N"N~
LNRO-OSO
J*..
00
000
00
LNRD-OSO 0LNRO-OSOLNRMSb"
o0
I } j { HlLNRD-OSO [0i !
ii
i "I
GW j -9999 99 f j 1 j i
GWCW
;-909000 i 1 j ! ii-999999 1 ! i i
GW i-9999.99GW i-9999.99GW f-0999 99CW 1-0999.90 jGWGW
1-909999 j1 -0999.99 i
GW [4009.09 1CW •9999.09 jGW j-999909 iGW ! -9999.99 \GW '-9990.99 jGWI-W99.B9GWCW
1-0999.09I-BW999
GWi-690909 !CW [-9999.99 jGW i-9990.90 iGW i-9999.99 jGW {-9999.99 !_GWJ-0999.99 iGW 1-9999 99 iGW i-9999.99 j
GW [-0999.09 :CW J-9999 99 !
GW [-0999 09 !
i— U; !
i —
hf— +— |-|iTr
, i_ a 17.6
i 7.66"j_7.6
"*" e i "rt262.1
,2.B
~ i ~ TiI S
-M-1 1 3
—^ — 14
NN
_N_
N
N"N"
"S~JLN
N
-S-NNN
N
TB i "N"7.67R
TVfl8
, 6
1 ! j ! t
j ; 3 1 »
2.7 [ 7.7
•i-SI-!-
N
N
N
LHRD-050 | 0LNRD-OSOLNRO-OSO'NRD-OSOLNRO-OSOLNRO-OSOLNRO-OSOLNRD-050
0
i0000
So *1"i"LNRO^SO
TNRD-OSO00
LNRD-050 i 0LNRD-050 0LNRD-OSO1LNRD421LNRD421LNRCWU1LNRO^Ul
!LNRCM)2S
0000
-1-iLNRD-023 j 0•LNRD-02S i 0ILNRD-023iLNRD-023iLNRD-058iLNRD-056iLNRD-O21jLNRD-0311LNRD-011'LNRiM21 "
0i rj
0"* 0
0
c
\NRD-02S j 0.LNRD-023 0iLNRD-023 j (! LNRD-023 j 0
iLNRD-OSB i 0^N JLNRO4)21 I 0
N JLNRD-021 > (
App_E_gw_Tbl_1 o3.xls Page 10 of 15 10/22/2002
Groundwater Data forDissolved cadmium, copper, lead, and zinc data (mg/L) (or all data sets, ai
r Is River Reaches 0 to 3.il cadmium, copper, lead, and zinc data (mg/L) for CDPHE data (LNRD-068).
App_E_gw_Tbl_1 o3.xls Page 11 of 15 10/22/2002
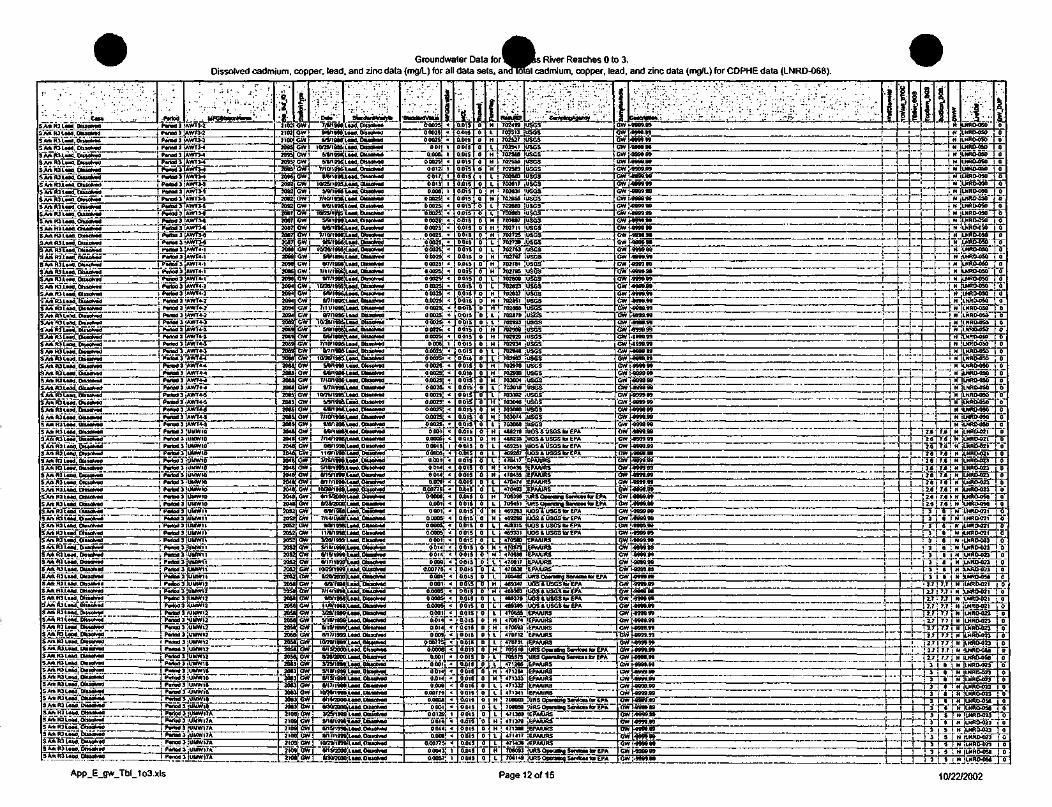
Groundwater Data forDissolved cadmium, copper, lead, and zinc data (mg/L) for all data sets, ai
River Reaches 0 to 3.il cadmium, copper, lead, and zinc data (mg/L) for CDPHE data (LNRD-068).
l'^:&^r[':^;M^•• • :• •• .Can • .; -,. ••• -Period [, : . UFGStwBnMarm/"
SArt R3 Lawl. DI»DMK] Period 3 ! AWT 3-1SArt H3 Laad. DkuoMd 1 Partod 3 |AWT3-ZS Art R3 Laad. Ois*c*md 1 Penod 3 [AWT3-JS.AA R3 Laad. Dissolved f Pwtod 3 lAWTiMS.Art R3.Leed. Dtuohw} ! Parted 3 IAWTH
Art R3Leed. Dtuotvod Pwtod 3 [AWT3-*
SArt R3 Lead. Oiuofced ! Pwtod 3 JAWT3HS*Arii R31oM. DlsiioNwJ I Parted 3 SAWTMSArtR3Lo>d Dbuhml ', Parted 3 IAWT3-5SAWrmeaa:ta*oh«d "" " " ! Pw»d 3 IAWTMS Art R3 laall. DiSKriwd i Pwtoct 3 'AWT3-5
SArt R3 Lead. 0&oh*d j Pwtod 3 JAWT34SArt R3 LeM Otuoivw] i Pwtod 3 !AWT3-«SArt RJ Laad 0(mv*»d Pwtod 3 JAWTTMiArt R3J.ead. biuofrad Period 3 [AWT34
S Art R3 LWHI. DtitDfred Partod 3 JAWT4-1i Art RJ I Lwtt Jnaiohw) J Pwtod 3 JAWT4-1.Art R3.Le«J. Oliiolvod 1 Pwtod 3 AWT4-1
S.Art R3.Lead. Diuohwd i Period 3 JAWT4-15 Art R3.Le*d. DliioNed Penod 3JAWT4-1S Art ru.Laad. DbMtved \ Pwtod 3 :AWT4-2S Art R3 LaM. Ola**™* i Pwtod 3 'AWT4-25 Art R3.Laad~.~CtaioWod i Pemd 3 'AWT4-2S Art R3 Laad Otssobed i Pwiod 3 1AWT4-2SArt R3 L«M. Otiioived | Pwtod 3 [AWT4-2SArt R3 Load, DUM*W) | Pwtod 3 JAWT4-3
Art R3 Load bissofmd ! Penod 1 IAWT4-3S Art R3 Land. biublwod } Pwtod 3 1AWT4-3
lAfiiRHaad Unofcad ! Pwtod3'AWT4-4SArt R3 Load. Diuarved Petted 3 AWT4-4
I Art R3 Lend. OissnvwJ Pwtod 3 JAWT4-4SArt R3 LaM. Diuofead Partod 3 1AWT4-4
SAA R3 Laad. oitaohed Pwtod 3 iAWT4-5S Art R3 LaM, OKulrad Partod 3 AWT4-S
SArt R3 Laad. Oluolwd i Pwtod 3 {AWT4-SS Art R3LoN. UttaNrad ! Pwtod 3 JAWT4-5S i Art R3 Low. giuaNod Pwtod 3 !UUW10
!.Art R3 Land. Disiotvod Penod 3 JUUW10S Art R3 Load. Dissolved ! Pwtod 3 JUUW10S Art HJ.lBod. DJisotad J Pwtod 3 iUMWtOI/Art RJ Laad. DUuAw) j Pwtod 3 illUWlQ
SArt K3 Load. Dutotved > Pwtod 3 JUUWtO[ Art R3 Laad. Dfuotvad 1 Pwtod 3 iUUWIO
SArt R3.Laad. OlsioKwJ ! Partod 3 :UMWIOSArt RJ.Load. DlHoNed i Partod 3 UMW10S Art R3 Lead. Diuorvwl i Pwtod 3 UMW10S Ark R3 Laad. Dts*MWd Partod 3 UUW10
SAftR3Lead. Oltwrvwl Pwiod 3 UMW11S Art H3 load. DUubed i Pwtod 3 IUUW1 1S Art KD Land, Dliiofved Pwtod 3 jUUWI tS Art R3 Load. Disiohad Partod 3 UUWt 1SArt RJ Laad. DuaoNvd i Pwtod 3 ;UUW1 1S Art R3 Lead. Dtiurvw) •; Pared 3 ;UMW1 1S Art H3 Lead. Disaoivetf i Partod 3 jUUWiiS Art fl] Load. OUtofcw) ; Partod 3 -UUW1 1SArt R3.Lead. Dtesorwwl j Period 3 JUUWI tSArt R3Load. DhsoVed • Pwtod 3 JUUWI?SArt R3.Lud. QlMontad 1 Pwtod 3 !UMW12
S.Art RJ Laad. Dluobed j Period 3 'ufctWtaS Art R3 Load. Dusohrad i Pwtod 3 UWW12S.Art R3 Lead. DiuoNed I Pwtod 3 iU«W!2SArt RJ Laad. Dluowed i Panod 3 :UHW12SArtR3Lood. Oi«o**«d | Period 3 JUUW12S Art H3 Lead. Oliurved i Partod 3 JUUWI 2S Art RiXead. Otitatnd f Pwtod 3 JUUW1 2S Art R3 Lead. DlMotved j Period 3 |UMW)2SAA R3 Load. DUiovwJ 5 Periods UMW10S Art RJ.lMdro.iiitvwJ i Partod 3 'UUWIO
S Art R3 Leod.~Dtaioivod " j Period 3 JUMWJ8S Art R3 Lead. Uiufved Pwtod 3 ;UUWlflS Art R3 Load. Dtuorved * Pwtod 3 lUUWlOS A* R3 Laad. Dluotnd i Period 3 lUMWlSSArt R3 Lead. OUsoked 1 Parted 3JUUWI7ASAA R3 Load, OUloM* \ pirfod 3 :UUWl7A" "" ~S Art H3 Lead. Obsofred 1 Pwtod 3 JUMW17AS Art R3 Lead. Dluotoed } Period 3 |UMW17A 'S Art R3 Lort. Oluohrwl ^Peiwd 3 EUUW17A ""S Art '.to Laad. DtitoivlKl ; Porlod 3 UMW17A
1210:
2102
2100
209!
20952095709'
209!
20922O92
""20922092
?oa;208;
2oa:209670ft2091
20962096209420942094209420942089
208920*9
208B20882088
20852085
I~208S2Mi20482041
2040.2IM42046204<204812048204020482048
20522052205220522052205220522052205220502058
2051
2051
205Q70S2051
2051
'Toss2058
""208208
"208:20820U
"ss;206
••?io210
to1«iffIV
1GW
cw]
•••DaW"-'7/9/1 996wry 19966/SM996
GW ! 10/25/1995
• ".-"; .':..:••:;•
Lead. DluoKed.aad.DiuolwMLaad.auotmdLead. DittohwJ
GW i SWiggKLead. DHuhenlGWnw~GW
"GW
BwT
5/8/1 99&LMd, OtuoNwl7MW1996
"ToSMTO1
5W1B9C7/10/1996
GW ; 9M/199S:•QW"V~i7u5««SS
GWGW
r.wGWGW
— 5an9igGf6/IS96
Lead. OtuoNed
Laad,OUurMdLaad.OluaNwl
i** "i****. -..
Laad. DiuohiwlLead. OUiotMd
9rB/199KLoad. Ouofndions/1995"5/9/1996
GW 6/7/1 9W
J.BBd. DillOrVwJ
Laad. OluoNedLead.OBaahad
GW ] T/11/199fi.:Lead. DtssoNedGW i 9f7/1990GWGWGW
WWw
iWW
10/26/19955/9/19966/7/1996
7f11/1N6
Lead. OttaoNedLMd, Dluotnd
Lead. DtuoKedLead. Oluolved
9/7/1996! Laad. Dtuohed1Q/26/i99SiLead.D(Moh»d
5671996 Lead. DJuoNed7/10f 19961 Lead. Ddeohvt)
3W P*irj/26/1995;Lawt, DtuorndGW i 5/9/1996GW i UG/199G
Lead. OisufvadLaed. DtacoNed
GW j 7/10/1 99$Lead. Oluotvad
3W lOr25/t99S:Laad. DisaowwJCW 5/91996 Lead. n»o»»ad
GW 7/10li996:Laad. Dluotnd3W 1U6/199IGW1
GWGWL.WGW]GWGWGWGWGWGW
GWGWCWGWGWCW
6JW1B987/14/19989A/i*99«
11W189Ir~33wrl9ri
5/1 0/199!
Lead. DtuoNwlLead. DevolvedjLetd. DaaahwJLead. OkuoivwlLaad.DKiotwd^aad. DluotwdLead, Dksolvwl
0/15/l99g;Lead. Oiuohada/17/lB99iLead. Ote*o*ved
10,29/19996n5QOOC
Laad. DluoTMdrlLaad. OleaoNed
OQanooojLaad. Dtuotwd
7/14/ 19BaTLeadrOouolv«d9/8/l998iLeed. OkcohwJ
1 1/9/1998iLe*d. Oeudvad3/20/1993
5/10/19W6/15/I99S
GW a/i 7/1 raGW 10T29/199C
GW tnvxm.GWGW~
GW
7/T47T9?
;Lead. Deuotvad.Lead, DhaoNad•Lead. DJuohnd'Lead. ObnoNwl.Lead. OlssoNcdLoad. DeootvedLead, Ofuofved:Lead.Dh«)Md
1 lUBTlsWLa^^aoS'GW 1 3J26M99"GwT 5/18/19MGWGWGWcwGWGWGWGW
"GW"GWGWGW<>wGWCWr.wGWGW
iLewl. Diuohvd:LewJ. Obeormd
e/lS/l99g;L0wJ. ObsoNedB/t7/19S9:Lead. Dlaaotwd
1009/199)),Lead. Oeuolved
8/28/2000! Laad. OiuoNadMS/tgggrLead. Okaotvad
6/1 5/T999! Lead. Oluohed6/1 7/1999, Laad. DluoNvd
1 0/29/1 B99^Lead. Dhao«vad6/15/2DOo'Lead. DhaoNed
3QS/1 999. Lead. Otttotved
6/i5/l999iLaed. D«*o*v«iJa/l7/i999lLaad. Otuohwl
|f|000251 <00025J *00025' <
OOt t 1O.OOCT 1
000251 <0012 10017 t0013J 10.0061 1
00025J <00025] <
0.0025 <000?5[ <
00025 <00025 <000251 <00025! <0.0025! <0002Si <00025 <0.0025 <0.0025 <000251 <0.0025! <
00025] «0005! 1
000251 <00025: «00025! <0.0025; <
00025- *0.0025! <
0.0025; *00025: <
ODDli <0.0006J <
OOOOSi <0.001 i <0014' *0014 <0.009 <
0.00775i <OOOOOi <0.001] <
0.0005! <0.0005; «0.0005= <
0014; <0014! <00091 <
0.00775! <0.001! <
g0.0151.0150.0150015
O.OtS0015
0015"
OOlSOD15
3.0150015
001
0.01
DOl0.01
0.015*0.0150.0150015
oiis"0.0150015'0.0150.015
O.OTS0015
OtitV0.0 150.0160015
0015
oTois"
0.0150015
0.0150015
O.OlS0015
0015
0015
0.0150.0150.0150015
0.0150.0 150015
0015
0015
~<foi50.0150.015
OOOIj « 0.0150.0005 <
o.ooos; <ooon <0.014J -
0.014: «
000775 <
O.OOOOi <
0.001! <oooti <0014J <0.014 <0.009* <
0.00775 «_o~oooa V
00129' 10014{ <
0014! <
o.oMrr0.007751 <0.0043! 1
0015
0015
0.0150.0150.015
0.0150.0150015
0.0130015
0015
ooTs"00 50.015
0.0150.0150015
0~0150.015o.ois"
i0
0
u00
10u00
000(1uft0
T000000
00
0000
0-fl-
0"0
0
00000000
00
0
0000000
0000
000(10000
0
"6"n
•d~0
iHLHLH
"H"!
102499 JSGS702513 iUSCS702527 [USGS702541 ! JSGS707568 tUSGS702555 i702589 i
L ; 702603 <
USGSUSGSJSGS
L j 702617 iUSCSH 702631 1
702855"?JSGSJSGS
L 702669 I USGS
H 702697 [USGShi ! 702711 iUSGS
1 "*LHHHL
L
702739702753 .
TmeTt
USGSISGSUSGSJSGS
702781 :USGS702795 USGS702809 _|702823 ~?
H 702037 |HH
702851 '702865 '
L * 762179
H
USGSUSGSusesUSGSJSGSuses
702893 jUSGS
702920H i 702934
LH
JL,
702962702976702990
USGS
iL " 1GW i-9999.99 ' "GW i-9999.99 iGW 1-999999 jGW I-B999 99 ;
mm\ \ H {LNRD-050'. J f N jLNRO-OSO
{ ; N LNR0450 II 1 N LNRD-050 <
CW j-9999 99 i j i i H jLHRD-050
i0
0
0
0
o "GW ;-n9B.B9 ll| i N JLNRO-050 I 0GW14999.99 i | } j N 1 LNRD-050GW -9999.99 ; 1 i i ' '. H tLNRD-050GW 1-9999 99 ' j i ! \ t N iLNRD-OSOGW j-9999.99 i ( j j IN tLNRD-050GW '-999999GW 1-9899.99 }
GW 1-9999.99GW i-9999 99 !
GW J-9999 99 iGW 1-9999 99 ]G W 1-0999.99 " . . . . . . .
GW j-0999 99 iGW --9999.99 ;GW 1-999999GW 14999.99 iGW -9999.99 ;GW 4999.99 jGW -OB99.M 1GW 4999.99 " " :GW !-eoag.99 '
J ! ] | N jLNRO-OSQJ I [ N iLNRf>050
000000
; | H ILNRO-OSO j 6
i i N 'LNRD4SO] j N 'LNRD-OSO
; ! i ! N jLNRD-050i ! : N LHRD-OSO• :< 1 I N ILHRD-Q50
! j N JLNRD-050{ f ! N •LNRD-'OSO'
000a.....
0_.: | i N ;LNRO-OSO ; 0
1-1 |"| j t N LNRD4M 1• i 1 J N i LNRD-050 .
"i ! 1 "! M LNRDOSO"1
i i j H JLHRD-050 j
GW 1-B999.99 1 1 N iLNRtWISOUSGS GWi-9999.99 — ,
USGSUSGSUSGS
H { 703004 iUSGS
L 703032 iUSGS
H
USQS
703074 [USGSL 703088
H"T*6M1» 'H i 469235
LL
469267"470417
H 470436H 470453LLHL
^70474470493705396
USGSUOS & USGS tor EPA
GW 1-0999.89 !GW;-999999 =GW ;-9999.99 !GW ^9999.89 !
CW j-9999 99GW i-9999 99 "" " - -- ,-
hGW"|4999.99 ICW j-9999.99GW -9999.99 i
UOS & USGS tor EPA [ GW -9999 99 ;UOS & USGS for EPAUOS & USGS far EPAEPA/URS""EPAAJRSEPAAJRSEPA/URSEPAAJRSURS Opwatng Swvtcae far EPA
705451 'URS Operating Service i fat EPA
H j 469299L i 469315L 469331
H 470579HLLLHH
470598470817"470636
~705485 '469347463363
L i 469395L 1 470GS5H 1 470074H i 470693
LHL1HHL
U.H
1
H
1
L
"H
470731705519705575471265
1 "471284^-471303"1 471322r~47i341T 700003
471360r 471379
i 471417• 47143dI~706M3~
UOS & USGS tor EPAUOS ft USCS far EPAUOS t USGS lor EPAEPAAJRSEPAAJRS
EPAAJRSEPAAJRSEPA/URSURS Opentog Santcss tor EPAUOS & USCS br EPAUOS « USGS tor EPA
UOS A USGS tor EPAEPA/URSEPA/URSEPAAJRSEPAAJRSEPA/URSURS OpwaihQ SwvfcM (or EPAURS Operating Swvtcai tor EPAEPAAJRS
EPAAJRSEPAAJRS 'EPAAJRS
TJR"S Operating Servlcee for EPAURS Opwaihig Service! for EPA
lEPAAJRSEPAAJRS" '" "EPAAJRSEPAAJRSEPAAJRS 'URS OperBfing Service* tor EPA
GW 14999.99 1GW -9999.99 •GW -9999.993W 499999
GW 4999.99 !CW -9999.MGW '-8999.99GW {4999.B9GWi4999.99 t
GWj-0999.99 jGW 14999.99 jGWJ499999 jGW j-9999.99 iGW 1-0999.99 jGW i-9999.99 iCW i-9999.99 jCW 1-B999.B3GW J4999.99 iGW E-9999.99 ,GW j-9999 99 •
GW i-9999.99 =GW 14999 99GW 4999 99GW J4999.99GW 1-9999.99 !GW 1-9999 99 IGW J4999.99 - - -- -
GW 14999.99 :GW 1-9999.99 ' " " " " """ " ~ ' ' {"GW 4909 99 •CW 4999.99 |cw'-BOBB^gg !CW 4999.99 " " " "" " " "'"1CW 14999.99 ' T—GW 1-B999 99 iGW '4999.99 •GW 4999.99 1GW -9999.99 ' !GW -999999 'GW 499999 ' IGW -9999.99 i ~
; i N !LNRO-050 "
_. L-. L— .a -i JL. LNR-tw*° . .•• \ \ IN JLNRD450 j
! I i : N SLNRD-OSOi f i : N jLNRO-050! ! ! M [LNRD450 i
! ! i N iLNRD-OSO! | JN lLNRO-050
' i N ILNRO-OSOi 1 u N iLNRD-050
! 2.6 7.6 H LNRD-021• 26 7.6 i N LNRD-021
1 ! 2.6 7.6 5 N JLNRCMJ21i j 26 7.8 j N iU4RD-021i i 2 6 7.6 N ILNRO-023i ; 2 6 ! 7.S j H 1LHRO-021I i 2.6 ! 7.0 { H jLMRD-023j i 2.0 ! 7.0 ! N JLNRD423; : 2.6 ! 7.6 ! N 'LNRO-023
{ 2.6 > 7.6 i H JLKRO-OM1 2.6 | 7.6 : H LKR0450
' t 3 1 0 1 N LNRD-021! i 3 i 8 I N (LNRCWHtj i"3 j 8 N lLNRD-021
i ! 3 1 B j N iLNRD-023! * 3 1 0 ! N !LNR[M>23
-
-1-r
f
! 3 I 0 1 N jtNRD023ji 3 a ; N lLNRD-023 ;1 3 8 1 N ILNRD-023i 3 1 8 H iLNRCMrSO! i 2.7 1 7.7 N 1LNRD-021; 2.7! 7.7 i N ;LMRIM»i
!
!-•2.7 ! 7.7 ! N i LNRD-021 |
1 2.7 t 7.7 i H LNRO-023jT? ! 7~7 I N iLNRLV02"3< 2.7 ! 7.7 | N LNRD423 !
"" f2.7l 7.7 ! N LNRD-023 ]>. • 2.7 i 7.7 i H jLNRD-023
j Z.J ! 7.7 TN 1LNRD4581 { 2.7 | 7.7 [ N ILNRO-05D
i 3 8 N <LNR04231 3 : 8 N tNRD-023! i 3 [ 6 N LNRO423t ! 3 I 8 H LNRD-023
j f 3 I 8 H iLNRO-O&OI i 3 f 5 N ILNRO-023i 1"3~|"5" N LNR0423"f J 3 j 5 N LNRD-OZ3
di 3 ! 5 N ILNRCM323! 3 • 5 N JLNRD423
; i 3 i s 1 N ILNRCMISO*
t
0
*
App_E_gw_Tbl_1 o3.xls Page 1 2 of 1 5 1 0/22/2002
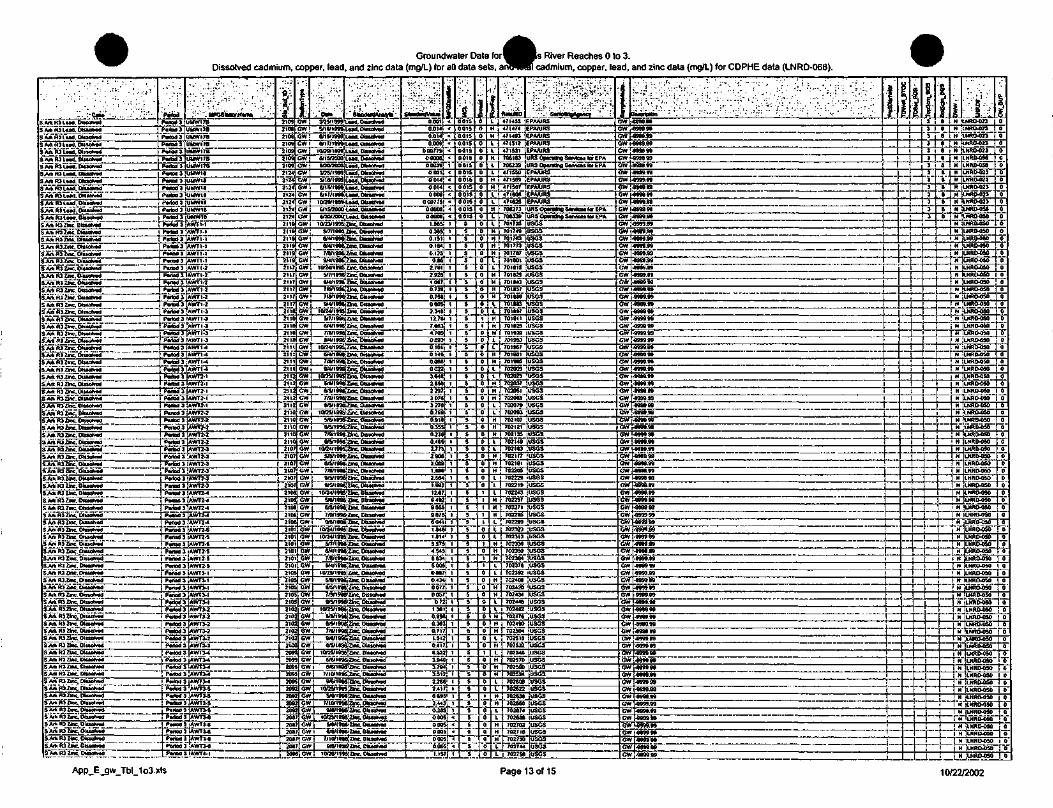
Groundwater Data forDissolved cadmium, copper, lead, and zinc data (mg/L) for all data sets, aiinmRlci
River Reaches 0 to 3.cadmium, copper, lead, and zinc data (mg/L) for CDPME data (LNRD-06B).
_'. ••C-ii"' v. ..'.;•";;•*-S.Art RS Lead. DbsaN*d
.Art R3 land. DissolvedS Art R3 Lead. DissolvedS Art R3 Land. DissolvedS Art R3 Lead. DissolvedS Art R3 Leed. DUsoNedS Art R3.Lead~. Dissolved !
Art R3 Lead. DissolvedS.Art R3 Lead. Dissolved
SArt R3 Lead. Observed
Period 3<Periods
Period 3Periods j
_??*5. JPeriod 3 !Period3 !
~PeftadS
'"> ' X UFCStBOonHwmIUW17BJUW17BJUWI7BJUW17B
IUWI7BIUW17BIUW1BJUW18
Periods 'UUWIBArt R3 Lead. Dissolved i Period 3 JUUW1B
S. Art' R3 Land. Dissolved 1 Period 3 lUUwTifS Art R3 Lead. Dissolved j Parted 3 [UMV 8S Art H3~z££ DJuolvad i Period 3 [AWT -1SArtTrnZnc. Dissolved i Period 3 'AWT -1S.Art Rl Zinc. Dissolved ! Period 3 JAWT 1S Art R3.Ztnc. DissolvedS.Art R3 Zinc. QrstotvedS.AA R3.ZUVZ. DlESoNedS Art R3 ZJne. DissolvedS Art RSZInc. Dissolved
Art R3 Zhe. Dissolved
S.Art R3 Zinc. OusotvedS Art RS.Zrc. DissolvedS ArtTRlZlnc. CMssoNed
S.Art R3.ZMC. DtasaNed
S.AA R3 Zinc. DissolvedSArt R3 Zinc. DissolvedS.AA R3 ZJnc. Dissolved
SArt R3 ZJnc. Dissolved
S.Art R3 Zinc. DissolvedSArt RS Zinc, DissolvedS Art R3 Ztnc. DissolvedS.Art RJ Ztnc, ObSONed
Period 3 {AWT -1Period 3 i AWT 1PeriodsPeriod 3"Periad3
"PertodT
Period 3Periods
AWT 1AWT 2AWT 2AWT -2
AWT -2*.W1 -2
Periods AWT -3
PeriadTtAWT .3
Period 3 JAW! -3Period 3 f AWT -4Period 3 iAWTI-4
Period S JAWT1-4
rperiodTlPeriods
AWT2-AWT2-
Period 3 IAWT2-Period 3 IAWT2-
S.Art RS Zinc, Dissolved j Pariod 1 i AWT 2 -2SArt R3 Zinc. Dlssotvwd | PeriodsS~ Art R3~ Zinc. Dbsotved "~ Period 3SArt RJ.ZJnc, Dissotvad PeriadS
, Art RJ.ZInc, Dissormd I Pariod 3S Art R3.Zinc. OUsotVDdSArt R3 Zinc. ObaoNedS.Art RS-Zlnc. DissolvedS Art R3 Zinc. Dissolved
'Period 3
AWT2-2AWT2-2AWT2-2AWT2-2AWT2-3
Period 3 iAWTZ-3Periods
"PUSHAWT2-3AWT2-3
SArt RS.ZIne. Observed _j_ Period 3 AWT7-3S.Art H3 ZJnc. Dissolved ; Period 3SArt R3 Zinc. Dissolved ! Parted 3I.Aife RS Zinc. Dissolved
S.Art R3 Znc. DissolvedS Art R3 Ztnc. DlssolvadS Art RS Zinc. Dissolved
S Art RS Zinc. Dissolved
SArt R3 Zinc. Dissolved
T PeriodsPeriodsPeriods
AWT2-3AWT2-4AWT2-4
AWT2-4AWT2-*
Periods AWT2-4
Period 3 IAWT2-S
Period 3 rAWTZ-SSArt H3 Zinc. Dissolved ] Period 3 iAWT2-S
SArt R3 Zinc. Dissolved i Period 3 JAWT3-1SArt HJ.Ztnc, Dissolved i Period 3 ;AWT3-1S Art R3 Ztnc. Obarorved ) p*rtod 3 JAWT3-1S Art R3 ZJnc. ObsotvodSArt RS Zinc. Dissolved
j PeriodsTPertodi
SArt R3.ZJnc. Dissolved j Period 3
S.Art R3 Zinc, Dissolved
S. Art HJ Sic; DIssoNed
S.AA R3 Zinc, Dissolved
'Period 3Pariod 3Period 3
AWT 3-1jAWTS-lAWT3-2
AWT3-2AWT 3-2
AwrisAWT3-4
'period s IAWTMS.AA RS Zinc. Dissolved Period 3 | AWT3-4S Art R3 Zinc, Disserved • Period 3 i AWT 3-4S Art R3.Zhc. Olssorved j Period 3 IAWT3-5
S Art R3 Ztnc. OissolvAd < Period 3 IAWT3-S
S Art' RS Zinc. Dissolved [ Period 3 JAWTM ' ' 'S Art R3 Zinc. Dissolved I P«nod 3 AWT 3-6S Art H3 Zinc; Dissolved j Period 3 iAWT3-6
f2109
2100
2109
210V
2 002 24
Tvi
3 2'2 "243124
3 Ifi To2 109119
2~ 19
2U72117
2117
2117
2117
2118
2MB
21*182111
2111
2111
211:
211:
211;
2112
Yiiff2110
2110
2110
2110
2107
2107
2107
107107107
tCW^
•/be*'S/ZS/1999
>iEy3W 5/l6/t099;Le*d, ObservedCW I 6/15/l999:Lead. Dissolved:w ; 8/i7/i090iLaad.Otssalved
CW
GWcvT
1 0/29/1 999!Lead. Dbsotved6fl5/200CI:LeM. DissoNodB/ionooo,3/25/1999
owl am/inffGW]GW<
IO/2WI0996/15/2000
CW 1 V30/2OOCGW I 10/23/1995GW j 5/7/1 D9tGW ] 6/4/1 09ftGW j 6M/199C
Lead. DfeaoNedLead, DissolvedLaad, Dlsaorvad
Lead. ObservedLead, ObservedLaad. DissolvedLead. ObservedZlnc.DKso.vedZhic. DissolvedZJnc DissolvedZinc, DbsoNed
GW 1 7/0/1 996-: Zinc, ObservedGWGWGW i 5/7/1096GW 1 U4/199G
Zinc, DissolvedZinc, ObservedZJnc. Dissolved
GW~L 7(8/1096; ZJnc. ObservedGWGW
GW
GW
9/4/1 894 Zinc. DbsoNed10n l09S!zinc: DOsoived
BM/19KJZM. CUssolved
OM/199GGW ! 10/24/1995
1zinc, DbsorvedZinc. DbsoNed
GW ; Gf4/l996:Zlnc. ObsoNed
G-wf SSHSilzV^bb^
GW j 5/6/1 998; Zinc. DissolvedGW • 6/5/1 996; Zinc. ObservedGW ! 7/9/1 996' ZJnc DissolvedGW 1 B/S/l996!ZJnc. DissolvedGW 10/25/1095GW 5/B/199GGW [ 6/5/1996GW ! 7/9/199)
Zinc, DbsotvodZinc Observed
•ZJnc. DbsoNedZinc, Disserved
GW j fl/S/1996[Zki; DbsotvedGW j 10/74/1995GW 1 5/8/199CW ! 6/5/1B9CGW~! 7/9/1 9MGWGW
9/5/1 09D0/5/19M
106[CW i 10/24/199!Toe,108106106
101
2101
2101
2105
2105
""aids2105
2105
2102
~21022102
"aloe2095
-2MS
209S209!
209320932093
~20T208208
S.Art R3 Zinc, Observed Period 3 jAWTS-a JOB
GW i 5W199CGWGW"
{_ fi/S/1997/9/199
: Zinc, Dissolvedk ZJnc, Dissolvedt; Zinc, DbsoNedl! Zinc, DbsoNedy ZJne. DbsoNedt-Zinc, Db»orved|Zinc Dtssolvad; Zinc, DissolvedIZJnc. DissolvedZinc, DbsoNod
GW i 9/V1B96 Ztnc, Dissolved
GW
GW~GW
cvTGW•GWCW
ICW4/1 995; Zinc, OiaooNed
7/B/t09KZkic. Obsolvad
10/25/19%snnott
— Ss/ToS7/9/1991
GWJ On/1991GW
GWGW
ZJnc DbsoNedZktc. Obsohmd
i-iZint DissolvedJlZinc, DissoNadSiZJnc. Obsotvad
10/25/1 995; Zinc, Obsotved
6/5/1997"/97Toa
slzinc. DbsoNcdKZinc. Dbaolvad
GW" *5/T9»WobsoN'ed' •GW | 10/25/1 095; Zinc, Dissolved
GW i 5/B/1086 Ztnc, DissolvedGWi 7/10/199GW L 9/6/19!GWGWGW
GW
GW"GW
BiZtoG. DissolvedB? ZJnc, DbsoNed
10/25/1095 Zinc. Oissorved
7/10/19!IZJnc, OnsoNed6|Ztrc, ObsoNed
10/25/1 OvSiZlnc. DbcoNad5W19J)frZJnc, DtsaoNed
"GW i 7/10/1 096! ZJrc. OlssorvedGW 9/B/l 096! Zinc. DbsoNed
O.O01
|0.014 <0.0140.009!
000775ooooa'00039
00010014
0000000775
-
ooooa!OOOOflj
1.565O.SOS0.151
0.125
2.7812.926
—
1.087
0.758;oeos!2.348!
7.663J
0693!O.IOli0.149!
0022
2.858!
3076327807690.018
r.0.239]D.4B5;2.77529083.0691.8962.5641.99212J7__ . __M
95559.8756041J
1.814?
4.5456834
08G70.43400770.05
0731 SB
(firO.'7'i"
0.41
'.
\ lt..1__,
6.532;
" "~ 3.S72.26
2.41
:•_
66S5!2.44
0005 <
OOOSj <
0005! *
0.005! <_L_
s"015015
.015
0015
0.0150015
1.015
0015
0015
955
5
555
555
5
S5S
5
5___
5555SS5595
555555S
5
55__ —
555S95
55
5
555
5
55555
i00
T"0J
0
0
00b~
0
0uo"
000
1
000
0
0"o"000000D000
"6u
"o"11
T1
0
01
100
TT
"o"0
0
f2-
471455471474471493
706163 !706239
•PAAJRSEPAAJRS
[PAAJRS
URS OperBtag Sank** lor EPAURS OperabiD Services for EPA
•1 I 471569 ! EPAAJRS
LLH
LHH
471606 'EPAAJRS
706273
701749701763
H j 701787
L 701615 ^H T 701829H | JO i 843
H
LL
H
URS Operating Services for EPAURS Operating Services lor EPAuses" "USGSuses
USGS
USGSUSGSUSGS
701669 IOSG3701683 USGS701 807 JUSGS
"ToiSzT
L 1 701B!Sa~1
L j 701 9G7H ' 701981
L ' 702009
~M~F702fl57~H ; 702051HLLHHHLLH
IT
-rLHHH
702079
uses
USGS 'USGS
USGS
USGS'uses 'USGSUSGS
702093 USGS7021077011121
USGSUSGS
702135 i USGS702149 jUSGS702163702 ITT702101
"702205702229702219702243
""ianst7022717022B5
L 702299
L I 702313
HH
702350702364
L j 702392H 702406HH_
702420702434
L j 7024B2
"H"
H1 LL
00010
00000™
"H"H
; 702490! 702504
USGSUSGSUSGS
rUSGSUSGSUSGSUSGSUSGSUSGSUSGSUSGS
USGS
USGSUSGS
jUSGS•USGS•USGSSUSGSUSGS
EUSGSUSGS
702532 'USGSiUSGS
"""tozseo IUSGS702594
L i 702608T"!"76262TH
H
LHHHL
702636
>USG3!USGS
IUSGS7026EO iUSGS
702688 iUSGS702702
702730702744
.USGSjLJSGSUSGSuses'
,i .
i«999.99
GW 1-0999.00
GW 1-B99999GW -999909
1
GW 1-9099.00 - . ;
GW [-9999.99>W S -9999 99
GWj-999099GW 1-0999.09GW 14999.00GW J-S999.99GW --9999.99iw
GWGWGW
CWGWGW
—
—
-0909.994999994099.99 [_4909.09 i
4999.094999.09 !409999 !
GW i. 9999.99JW i-9999.99
GW|-D90BB9
GW 499990
—
Cw'ioMO"9T !GW -9999.09 jGW 499399 •
GW 1-9999.99 i
iW j-9990.99 !cwlGWjCW
4999.99 !499B99-9999.99 "T
SW [-9009 00CW 1-B999.99 ,-5W I-0999.9S i
GW [-9999.99 •CWGWGWGWGWGWGW•cvT
-9999.99493999 —4990.994090.99 j490909 !-9999.994999.99-000999
GW (-9999.99GW 1-0999.99GW
3s.GWaw
GWGWGWGWGW
•0099.99 1
•9999.99 j
'4990*0 i —4999.99 ;
4999.99 i4999094099.99 j-9909.99{4999.00 t-
GW j-999909 j
GW J-9B99.99 !GW ,4999 09 !
GW 1-9999 99 !GW 1-099999 !
GW j-0990.99GW E-W99.99GW 1-999999 iGWGWGM
CM
•0990.994999094099.09 —-B99999 - - ' " - ~ |
CT ! 9M.09 ' 1GW j-9900.90 !GW 1-9999 99 iGW 14993.09 i
i . . i
|»ij
—
d——i
!
j;r
--
1 i
-_
-f-
•
— •
—
X iN 'LNRD-021
\ N JLNRD423i N :INRD-023f H 1LNRD423* H
TN._.. N
H
LHRO-023
LNRD-O58
LNR"b-023
N-jase™ -
"STllNSCMrSS1"
N
N
1 N
—
1
-j- 1
Hi
—"
H
1"o0
"o"00
"o"
~0
0
__
LNRD-050LHRD-OM
0"6"
"o"
LNRD-050N jLKRD-050
N lLNRD-050i H
N
I N
••~i~N~
!
N
! i »
i i !i
— j—
•—
—
-Hif
i
!!
HN
LHRO-OSOLNRD-050
LNRD-050
LNRO-050LNRO450LNRO450
LNR[W)5O
LHRO-OSOLNRD-OSO
N JLNRO-OSON JLNRD450NNN
IN
ii
i.i
NNNNNNNNN
" N"
LNRD-050LNRD450LHRD-050LNRO-050LNRD-OSOLNRD-OSOLNRD450LNRD-OSOLNRO-050LNRD-OSOLNR04SO
"a"
-o~00
0
00
~Q~
0
00
00000000000
LNRD-OSO I 0LNRD-OSO \ 0LNRD-OSO'LNRD-OSO
L _i_N_jLNRD-050
N
N
i . . j ' H
r~r~i ! N; ! H
! ' N
-t—i
-....
j—_
1
[-J-
! N;™
1 N
TH
LNRD-OSO
LNRO450jLNRO-050
• 00a
*T
0
1LNRD-050 i 0iLNHD-050]LNR 0-050 H-ILNRD-OSO i oJLNRD-050 i 0ILNRD-OSO j o
JLNHD-050 --5-lLNRD-050 j 0
? N [LNRD-OSO | 0
r- iN-
! N• ; N
— ' 1— (-5-
— 1._.... —
.....L..
1: ft
1~H
iLNRD-050 i 0
lt.NRD-050 <ILNRO-OSO 1 (LNRD-OSOtLNRO-050:LNRD-OSOJLNRD-OSO
1 0
-i-J-
f MJLNRD-050_J 01 N 1LNRD-050 1 1
S I". i . i ! <.<•
! LNRD-050 i 0; LNRD-OSO ; i
App_E_gw_Tbl_1 o3.xls Page 13 of 15 10/22/2002
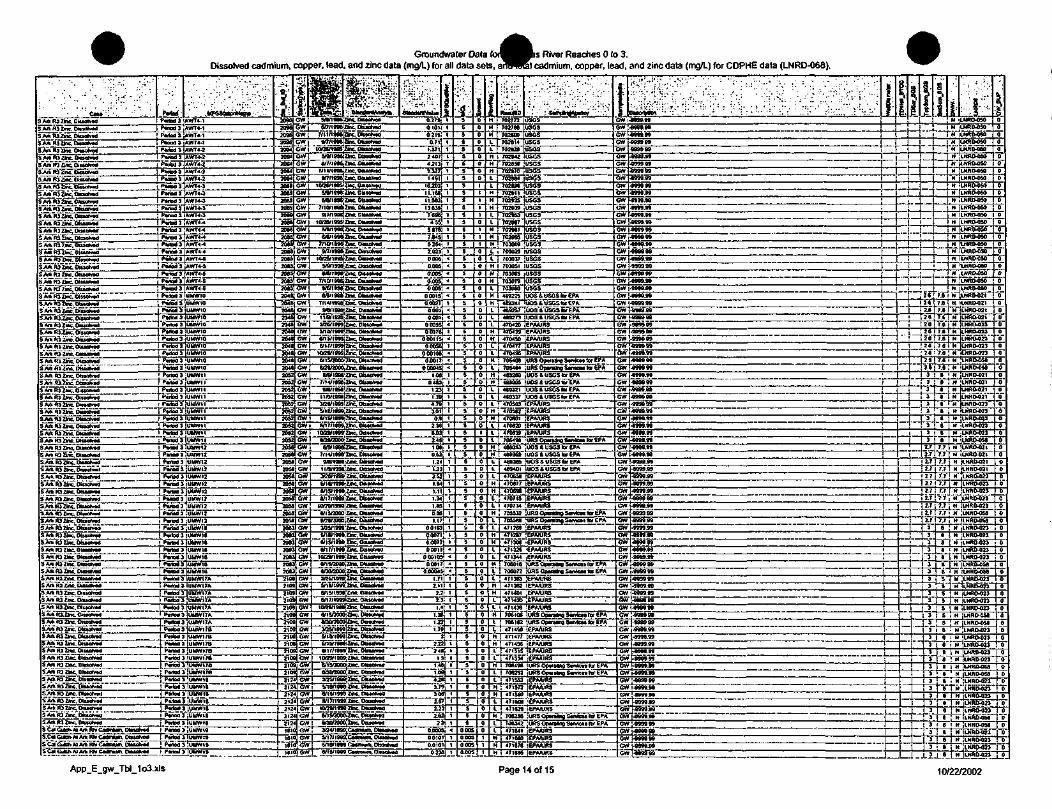
Graundwater DataDissolved cadmium, copper, lead, and zinc data (mg/L) for all data sets, a
is River Reaches 0 to 3.cadmium, copper, lead, and zinc data (mg/L) for CDPHE data (LNRD-068).
•••':•'--:- -:••-,-• •,•'", ; . . > • ' , - 'I. v . - ' . '••-^.;-..• -.:/ ,- '. T;':- :•;:- •:.-.;••- . • . • • - • ; ; . ' • . • • • : : .v:.;
; . • ' • . ; • : , - \ \> : :v : - : : lW. =-.l.v-^,::<>J-;::-v::- . C*»' :;-. '; .., Pwtod | ' . JMFCBMonNm •• • / . .
Art R3 Zinc. Druotvad Pwtod 3 JAWT4-1S Art R3 Zinc. Dtssolvad 1 Panod 3 JAWT4-1SArt* R3.Ztoc. Dluelvad Parted 3 ;AWT4.1SArt RJ Zinc Diuolvad Pwtod 3 JAWT4-1SArt R3 Zinc. DiMolwd Pwtod 3SArt R3 Zinc. UtaaNad Period 3
Art R3 Zinc. DiMcivad Pwtod 3SArt R3 Ztee. D.EMIVMI Parted 3SArt R3 Zinc OluolvwJ Parted 3
Art R3 Zinc, DluohmJ t P»rted 3S Art H3 Ztoc. Ottsolvad Parted 3SArt R3 Zinc. Olsuhwl Parted 3
Art R3 Zinc. blnatvad Pwtod 3
IWT4-2kWT4-2
AWT4-2kWT4-2kWT4-2
AWT4-3r\WT4J
IWT4-3AWT4-3
S Art R3 Zinc. Orualvad [ P«nad 3 1AWT4-3S Afk R3 Zinc. DJuofwd ! Pwtod 3 ;AWT4-4
Art R3 Zinc. Diuohwd Portod 3 ; AWT4-4S Art Rj Zinc. UsulvwJ i "Pttrnd 3SArt R3 Znc. Dascrnd i Pwnd 3 a
SArkrttZjnc DteaNad 1 Pwnd 3~ArtR3Zinc.DliMh.wl i Pwtod 3
SArk R3.Zmc. Oluorvod ! Pwtod 3
S Art R3 Zinc. Dluorrad i Pwtod 3SArt R3 Zinc. Disurvad Pwtod 3
AWT4-4>.WT4^AWT4-4AWT44AWT4-5
AWT4.5KWT4-5UMWIO
SArt R3 ZtriC CTnoKafl Pvtod 1 lUMWIOS Art RJ Zinc. DiublvBd Pwted 3SArt Ftizinc. Diwotvad Period 3
UUW10UUW10
Art ft! Zinc Diwotwd Pwtad3!UMW10SAA R3.Zlnc. OluorvwJ Parted 3 jUUWIO
i Art fifi Zinc. Oteiialvad Pwted 3 UUW10
i Art R3 Zinc OtuafrwJ Pwted 3 JUUW10S Art R] Zinc. OluatvwJ ' Pwtod 3 ;UUW10SArt R3 Zinc. btawiwd 1 Pwted 3 -UUW10S Art R3 Zinc. Oluafvad ! Pwted3|UUWtlS Art Ri.Ziric. DttiblVad" " ~ ! Pwtod 3 JUUW1 1S Art R3 Zinc, OiTOfvwJ i Pwtod 3 JUMWI 1S Art R3 Zinc. OtuSiid ! Pwtod 3 lUUW1 1S Art H3 Zinc. DiMorvad T Pwtod3jUUWII!S Art R3 Zlric biuatod i Pwtod 3 -t UW1 1S Art (U ZJne, DiwdvBd j PwtodllUUWllS Art R3 Zinc, binalvad Pwtod 3 UUW11S Art R3 Zinc, Dluorvad Pwtad 3 JUUWll<Art R3 Zlric. Dluolvad 1 Pwtod 3lArt R3 Zinc. Dtssalvad > Partod 3
UUW11UUW12
S Art R3 Zinc. Ouiwlwwi i Pwted 3 IUUW12iArt R3 Zinc Diuolvad ^Period 3 UUW12
S Art R3 Zhe. Dtwiwl i Pwnd 3 JUMWI2S.Art R3 Zinc, DinoNod | Pwtod 3 IUUWI2S Art Rj Zinc, Oiaorvad ' Pwtod 3 [UUW12S Art R3 Zinc, D.uc*wJ ! Parted 3 JUUW12
SArt RJ Zinc. Ol«oJvad i Pwtod 3 -UUWI2S.Art RJ.Zinc. Diuoivwl 1 Pwtod 3 ;UUWl2SArt R3 Ztoc. Oluotmd i Parted 3 ;UUWl2S Art R3 Ztoc, Dluorvad '• Pwted 3 jUMWlBS.Art RJ Zinc. Dluolvwl } Pwtod 3 JUMW16S Art la Zinc. Dfcsahrad ! Parted 3
S Art Rj Zinc, Dltutvod Panod 3S Art R3 Zinc. Dluotvod Parted 3
SArktU.Ztoc.Dluaruad Parted 3
uuwia
UUW16UUWI6
UUW17AS Art R3 Ztoc, Diuotvad Parted 3 JUHW17ASArt R3 Ztoc. Diuotvod i Poitod 3 JUHWI7AS Art R3 Zinc. Oruorwod i Pwtod 3
S Art R3.Ztoc. CUsorvad ! Pwtod 3S Art R3 Ztoc. Otisorvad • Parted 3SArt R3 ZtoVoliiaivad \ Pwted 3SArtR3.Ztoc.Dluo.Vad I Period 3S Art R3.Zlnc. DIuolvwJ 1 Pwtod 3
UUW17A
UUW17AUUW17AUUW17B ~~ "UUW17BUUW17B
S Art R3 Zinc. DluolvwJ ' Pwttd 3 UUWI7QS Art RS.Zlnc, Otowtvad ! Parted 3 !UUW1 ?B
SArfc R3 Ztoc. Dluorvad ! Pwted 3 UMWI7BS.ArhR3Zlnc,DI»a>vad | Pwted 3 UMW1BS Art R3 Zinc. OUsoNad I Pwtod 3 IUWW18
S Art R3 Ztoc. biiMtvad | Pwtod 3 UUWI8
SAAR37tec.ataM*~~ - ~ hpWiTluuwTa-™- " "
Sicil Gukn-Ai Art Rtv Cadmium. Obscrvad i Pwnd 3 JUUVY19
— ™ "
1200620M209620H209420942094209420*2061
2089208920892089
"208820*82068208B2088208520*
208520U20482041
204820482048204204
204820482044205205220522052205220522052
~»S2206220S220S
'*'?
ow" MlGW| 6/7J
rrS-
1**GW; 7/11/1996GWJ W7GW( 10T26/GW; SHI
1UW1995
1996
1;&Zinc. DkMclvttJZbic. DtuolMdZlnc.Olualvad
Zinc. DlnorvadGW i 6/7/1 •W&ZJnc, OUolvadGWGWGWGWGWCWGWGW"GWGW
7/1 1/B/7
1996
1996
ZJnc. DtuohadZnc. OiuolVBd
10V26/1 995i Ztoc. DtmulvadSftVI 996| Zinc. DkutvadSM
7/1 0/9/7
10/265/91
6ftlGW 7/101GWGWGW
9/710/251
1996
1996
l«Ub
1995
1998
ZncOiuahadZtnc, DUwlvadZtoc. GluolvedZJnc. DbntvarJZJnc.DtuolvwJ
1 996; ZJnc. DUolvad1996
1996
1995
Ztoc. DItaotvwJZtnc. Drnatvad'Ztac. Dbiocvod
5/9/1 996= Ztnc. DtMohwd
GWJ 7/1 0/1996J Zinc, DitsohwdGWGW
9/6/19966AV1998
GW 1 Til*GW a*GWGWGWGW
GWGWCW
,GWGWGWGWGWGW
11/B
3/26)
\9U19BI
ISM199B
\ya>.
ZJnc, Dluolvad ^
Ztoc, Otudvad;Ztoc. DtuolMd.Zinc. DlsinlvadjZJnc. OtecotoadiZtoc. Oiuanwd
6/1 5/1 999i Ztoc. DlMotvad
ui6 Jl9lIzS:!5sSr;S —6/1 5/2000; Ztoc. DEuohad6«afi!DOO,ZhC. DrslOrVWl
6/9/1 938- Zinc, Oluoniad7/14/1 BQBiZJnc, DixntVad9A/l998:Zlnc. Oiuonrad
1 l/9/1998iZlnc. Oh tvad
l__3aa
GW 4 6/1S/1BKGW B/17/199GGWGW
10/238/28
l9Bfraooc
friSSrZtoe. DasolvwJ;Zhc. OtaohcilZJnc,Oatatmd
'Ztoc. OtualMdGW i 6/9/1998!Zinc, Dtaotvad
20581. GW 7/14/1998' Ztoc. Drwolvad2058
"205820562058Wfe
20«2058205820B1
2081
2081
2DB32083
2101
2109
210-
2i09
210fi2 Its
2T»21 oa2 OS
GW i 9/1GWi 11/9
GWGWGW
3/28
fi/IB
'199
/199I/18B-/IBBt
;Ztoc, DbiaNvd!ztoc.D«c4ved[Ztoc. Oluatvad";Zlnc. Olnotvad
6/1S/1999,Znc, Dtaiotyad
GW ! 10/79Gwt~ «/T5
nw/20ix
llztoc! OaattvrtiZtoc. Dtuohad
GW e/2B/20TX!ZJnc. DiMotwadfew
GWGW
GW
3J25S/18
fi/15
/1B9<nw/1991
.Ztoc. DruofMd
.Zinc. OtuoNadiZlnc. DtuoNad ~
10/29/1999; ZJnc. DIuolwdGW B/l5rZOOO;Zlnc. Otuetma
GWCW
! 3/25/19B1
GW ! 6/1*
GW 1 8/11/19917r»
1'ZJnc. OtscolwdS!zinc. D*»**d"r.Zne. DUwAwl
Si Zinc, Oruolvad
GWI 6/rsnoooiZhc. o£*&* —GW"GWGWGW
a/3£
1 MWOOt/199
i~"67f57l9§2 09 GW i 8/1
"j iSlcw
~2 OSa 22 2
2 2
2 2
i i"
' I6l"
GW
9;Ztoc. Distobad91 Ztoc, Dbiohad
10O9/1 999) ZJnc. Dtsioniad
rJWnoOOjZInc, DruoNadCW 3/2 liZJnc, DbsohadGW s 5Tt 8/1 99QI Ztoc. Obtutvad
GW 8/i7/1999;Zlnc. Dluofrad
GW"T 6/T5ra6oOiZlm3; OtUoind
GW i 3Q4/l999jCadmkim, Dbwtvad
[GWJ 5/18/199
.J*JS.~™i-
SICKlrnlum. Dbs id
fi f
MMttarrJVikM0.2750101*0215
0.71
1.371*
i"
24071 14.21323271491
16203"l 1.168 '1
11.583 113635! 17.6961 14 55!
58787.6455254; 12.023 100050.005
0.0050005
0.00150.002
0001
OOOIt000550.007*
000115L-
0001050.00171
000045l.Ofl
04631.23J1.39
4.79
3.01
OS2.36
6.03
--
2.45i1.0*
0.&2
1.24
\z:2.5:1.94
1.11
1.85
0.86
1.17
001C
0.00710.0077
0.00105;0.0017
1.7 i-2.H'
2.2!
231
1.38
1.23
' " i.rt
2Jj2.4
1
l.tt
t!T"i
g55
"5"S5SS5555
55555S555
555&
(——
5S55
__.
55S5555Ss
"955
5S5~559
55S555
55
55
5
5
-_."
5S
5
i - •-4JB1
3.79
2.57i3-531
~ 0.0005}
"6.dioi]~-^ •. — ^OiSLj ^±=
5S
— 5~
5
o'oos
0005
1J0000r00tt1110t11000
0u0000000
0u000000f>
001000
If000
000
~0~u0
0u
u000
0
0000
000
0
0
0
1
iH
H
ii
RMUHO70277270278670260CT
LT 702814L f 702828H [ 702842
"HITOMSTHLLHHHLLH
J3J
702B70,
702898
usesJSGSUSGSJSGS
USGSUSGSUSGSusesUSGS
702911 jUSGS702925702939702953
~702987~702981702995
H i 703009L ' 703023L i 703037H I 703051
H"*LHH
"T"LLH
703079
USGSUSGSUSG3USGSUSGS.USGSUSGSUSGSusesUSGS
USGS703093 -USGS46922546924146925746B273470420470439
H 47045B
UOS & USGS bf EPAUOS & USGS tot EPAUOS & USGS tor EPAUOS & USGS tar EPAEPAAJRSEPAAJRSEPAAJRS
L j 470496 JEPAAJRSH 1 705406L • 705464H 469289H" 469305Li 469321L f 469337L 470563H "* 470562HLLLH
470601470620470839
"705498 "489353
H 489369L
LHH
468305469401
,470658470677
J170696
L 470734
H • 705532LLHH
L
705588HI7126B
471287471306
471344H 706018
L 471363HHL
471382471401.___.___
URS Onaraang Sarvica* for EPAURS Oparatng Swvicss tor EJPAUOS & USGS tor EPAUOS & USGS tor EPAUOS ft USGS tor EPAUOS & USGS far EPAEPAAJRSTPAAJRSEPAAJRSEPAAJRSEPAAJRSURS Oparutoa SwvkM far EPA
:UOS4USGStaf EPA[UOS & USGS tor EPAJUOS ft USGS tor EPAiUOS ft USGS tor EPAJEPAAJRSJEPAAJRSS EPAAJRS
'EPAAJRSIURS OpenOng Sarvtca* tor EPA•URS Operating SWVKCI tor EPAlEPAAJRS1 EPAAJRS; EPAAJRS
EPAAJRSIURS Opwatag SwWcai lor EPA
! EPAAJRSi EPAAJRSJEPAAJRSIEPAAJRS
H 1 706106 iURSOparetogSwvtenlorEPA_Lj 706162
H ; 471477HL
L
471496471515471534
L ! 706252L i 471553
iURS Oparaeng Swvfcat for EPAi EPAAJRSIEPAAJRSIEPAAJRSlEPAAJRS'EPAAJRS
{URS Oparatng Sarvlcaa tor EPAjEPAAJRS
H ; 471572 i EPAAJRS
L
H
471 60S
*~?0628«
471641
471676
J .4 — :.— J J_".L_J__.
lEPAAJRS
:URS OfMraing S«fvtew to EPA
IEPAAJRS
; EPAAJRS
JS?* ?^ ._„_—
IGW
BMOriptfan . _ _ "10999.90
iW 1-9989.90 |WE«99.99 " i 1M j-9999 99 i t
GW -9999.99 |GWGWGWiw
_inv .
GW'GWGW
•9999.99•9999.99 !•999999 i
11 r-
-f-j— '
-|~--]— ,
4999.99 i
B990.99 j j9990.99 - - . - - , j
9999.99 1 | j9999.99 i | j•9999.99 [
iW 1-8999.99 !!W j-0999.99 i |
GWf-999999 !GW j-e999.99 j |GW 1-9999 99 ! j
•"IGW
-9999.99 [999999 1
GW j-9999.99 !
._| i
—
—
—I_j_
__|.._i —
§
-H
--i 1 —GW 1.9999.99 I iGW j- 0999.99 jIW i-MM.« 11W (-9999.99 1
Ja499999 ;9999.99
GW j-9999 09GW J-B999.99 :
GW<-9999.99 " |GW i-9999 99 iGW '-9999 99 tOW j-9999.99GW j-9999 99 !GW {-9999.99 •GW -099999 IGW .999Q.99 jGW • -9999.99 1GWGWGWcVGWGVT
-0999.99 ;-9999.99 ~T"-0999.99 1•4999.99 1•9999.99 i-9999.99 i
GW !-9999.99 tGWGWGWjW
GWGW"GWGWGWGW
'GW
-9999.99 !-9999.99 j-9999.99•9999.99
j
... '._26 :7 .6
2.626
i 1 2.0
-i~i|-;-: n
—i— Ys— _?..
i i 3
'- \ 3T '•• 3
~
<TT
7.6
rJi• a......-f~TT
— 1-ffS-ii
— —
•
33
27
• arr
jNN
~H~N
NNN
N
H
H'"N
N
"HNN~
-S-N
H
N
-r"N"
"NN
H
N
H
N
N
} 7.7 i N2.7 i 7.7f^TiT7~2.7 i 7.7
"27 i 7.7! 2.7
-9999.99 I•9999.99 {-9999.99 ]-9999.99 1-9999.99 |-999999
r.99»:» - • - - - • - • — rGW I-B999.99 >
GW J-G89B.M !GWGW
-9B99.9B i-9999.99 j
GW -W99 W
GW i-9999 99 !GW J-B999.99 iGWGWGWGW"dw
•9999.99 !•-9999.99-9999.99 ' !-9999.99 |-999999 ' •" "" — '
GW 1-9999.99 ' " ~ - - -
GWt-0999.99GW !-9B99.99 i
GW ;-9999.fl9 !
GW 1-0999.99 j
GW j-6999 99 " . - - _p -
CW •9999.99 i
ifS 2 . 7
1 ^4..........
i ir-^-tr
1t33i
3
„_
-•+--
3333
i • K
! 7.7
tfrI ;.;i a1 •,.
LH.1 N
_JL
^LNRD-050LNRD-050LNRD-OSO
LNRD-OSOLNRD450
i00
LNFfO-050 0LNRO-OSOIHRO-OMLHRD-OSOLNRD-OSOLNRD-OSO __,LNRD-OSOLNRD-OSOLNRD^MO
LNRD-OSOLNRD-OSOLNRD-OSOLNRD-OSOLNRD-OSOLNRtWSOn
LNRD-OSOLNRD-OSOLNRD-021
-r
-j-
"f
-S-LKRD-021 0_LNRD-021 j~LNR[XO2ILNRD-023LNRD-023LNRM23
LNRD-O23LNRD-O&B.LNRD-056
LNRD-021LNRD-O21LNRD-021LNRD-023LNRD-023,LNRO-OU:LNRO-O23LNRM23
ILNRIMT2IiLNHO-021
•
-5-
-j-•o-
11—
jLNRD-021 {
:LNRD-023iLNRD-023
L1 H !LNRCM>23 I
fs-i Hi HI H
N
iLNRD-023ILHRD-OSa
-1LNRO-OS8 jjLNRD-023~TiLNRD-023LNRD-023
~ -i 8 1 N ILNSM23 \
{"iJ-=
! 5! 5! sI 5
: s: S
"r aI ai 8
t!-Hr4-;-
— , — I—-L?... -_! ?-..L 8
! 3 UL
H'~v3
_ . .1 \
X8
.,...! B
NTM! N
N
r N
i'rJ
i u
t N
LNRD-OSB
JLNRD423TtNRD-6'n
LNRD-023iLNRD-023
jLNRD-056ILNRO-OSB:LNRD-023•LNRD-023LNRD-OI3
.9..
1-i H LNRD423
TlHCHRMZi
! ^'• N
TS
i N! N"N
Lf?i N
iLNRO-OSBTLNRD423ILNRD-O23
LNRD-023""!
TLNR0458iLNROOSB
iLNRCWttJ •
App_E_gw_Tbl_1 o3.xls Page 14 of 15 10/22/2002
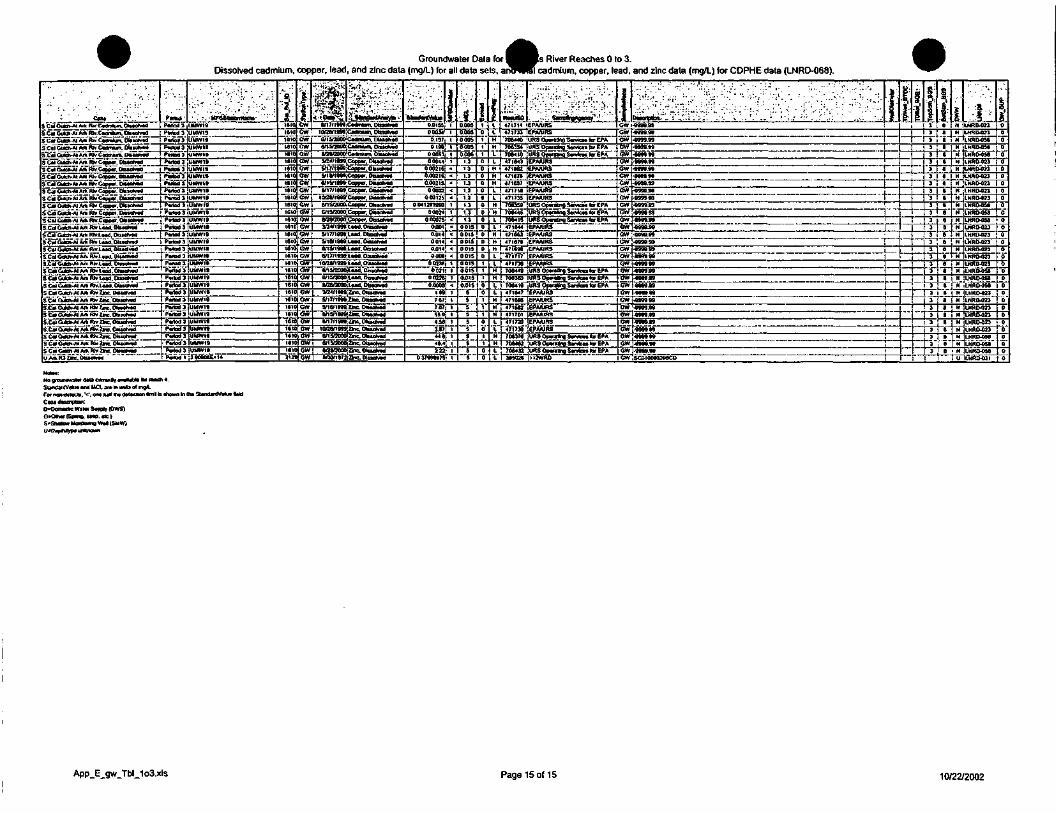
Groundwater Data forDissolved cadmium, copper, lead, and zinc data (mg/L) for all data sets, a
Is River Reaches 0 to 3.cadmium, copper, lead, and zinc data (mg/L) for CDPHE data (LNRD-068).
No groutdwalar data cumnfly «w*abl8 tor nacti 4,SundardV<*M and MO. am h unflj of mgA.For rxn-<talact». •*: OIM hafl tM datactan trril b chown In (ha StandardVMua UUCose dasowoon:DcDttTMCfc: Wator Suppty (DWS)O-Otwr (Sprteg, is«p. ale >S-Sudow Monitoring W.I (SUW)U=O«|)Birtypa w
App_E_gw_Tbl_1 o3.xls Page 15 of 15 10/22/2002
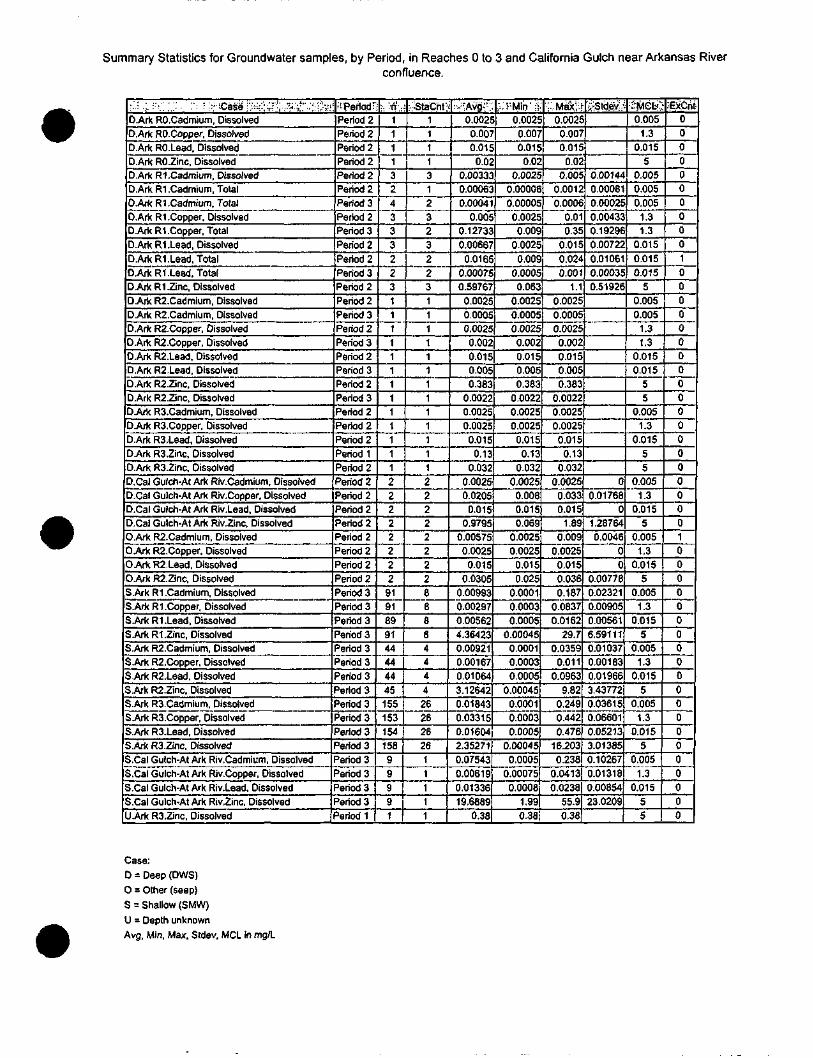
Summary Statistics for Groundwater samples, by Period, in Reaches 0 to 3 and California Gulch near Arkansas Riverconfluence.
:•'••: •':• •:-:. '..'.'-.- . '•''• ; ^;'Case ;••?£'',?•]'•&'•£."'.:'•;*.D.Ark RO.Cadmium, DissolvedD.Ark RO.Copper, DissolvedD.Ark RO.Lead, DissolvedD.Ark RO.Zinc, DissolvedD.Ark R1. Cadmium, DissolvedD.Ark R1. Cadmium, TotalD.Ark R1. Cadmium, TotalD.Ark R1. Copper, DissolvedD.Ark R1 .Copper, TotalD.ArkR1.Lead, DissolvedD.ArkR1. Lead, TotalD.ArkR1. Lead, TotalD.Ark R1 .Zinc, DissolvedD.Ark R2.Cadmium, DissolvedD.Ark R2.Cadmium, DissolvedD.Ark R2.Copper, DissolvedD.Ark R2.Copper, DissolvedD.Ark R2.Lead, DissolvedD.Ark R2.Lead, Dissolved3 .Ark R2.Zinc, DissolvedD.Ark R2.Zinc, DissolvedD.Ark R3.Cadmium, DissolvedD.Ark R3. Copper, DissolvedD.Ark R3.Lead, DissolvedD.Ark R3.Zinc, DissolvedD.Ark R3.Zinc, DissolvedD.Cal Gulch-At Ark Riv. Cadmium, DissolvedXCal Gulch-At Ark Riv.Copper, DissolvedD.Cal Gulch-At Ark Riv.Lead, DissolvedXCal Gulch-At Ark Riv.Zinc, Dissolved
O.Ark R2.Cadmium, DissolvedO.Ark R2.Copper, DissolvedO.Ark R2.Lead, DissolvedO.Ark R2.Zinc, DissolvedS.Ark R1. Cadmium, DissolvedS.Ark R1. Copper, DissolvedS.Ark R1 .Lead, DissolvedS.Ark Rl.Zinc, DissolvedS.Ark R2.Cadmium, DissolvedS.Ark R2. Copper, DissolvedS.Ark R2.Lead, DissolvedS.Ark R2.Zinc, DissolvedS.Ark R3.Cadmium, DissolvedS.Ark RS.Copper, DissolvedS.Ark RS.Lead, DissolvedS.Ark RS.Zinc, DissolvedS.Cal Gulch-At Ark Riv.Cadmium, DissolvedS.Cal Gulch-At Ark Riv.Copper, DissolvedS.Cal Gulch-At Ark Riv.Lead, DissolvedS.Cal Gulch-At Ark Riv.Zinc, DissolvedJ.Ark RS.Zinc, Dissolved
•^Period:Period 2Period 2Period 2Period 2Period 2Period 2Period 3Period 2Period 3Period 2Period 2Period 3Period 2Period 2Period 3Period 2Period 3Period 2Period 3Period 2Period 3Period 2Period 2Period 2'eriod 1Period 2Period 2Period 2Period 2Period 2Period 2Period 2Period 2Period 2Period 3Period 3Period 3'eriod 3Period 3'eriod 3
Period 3Period 3Period 3Period 3Period 3PeriodsPeriod 3Period 3Period 3Period 3Period 1
:• •'(('.:
11113
2
4
3
3
3
2
2
3
11
1
11
1
1
11
1
1
11
22222222919189914444444515515315415899991
r.-StaCht111
l_ 131
2
3
2
3
2231111111111111
22222222888844442626262611111
.-y'iAvg-;';0.00250.0070.015
0.020.003330.000630.00041
0.0050.127330.006670.0165
0.000750.597670.00250.00050.00250.0020.0150.0050.383
0.00220.00250.0025
0.0150.13
0.0320.00250.0205
0.0150.9795
0.005750.0025
0.0150.0305
0.009930.002970.005624.364230.009210.001670.010643.126420.018430.033150.016042.352710.075430.006190.0133619.6889
0.38
;^:Mlr>';!0.0025
0.0070.015
0.020.0025
0.000060.000050.00250.009
0.00250.009
0.00050.063
0.00250.00050.00250.0020.0150.0050.383
0.00220.00250.0025
0.0150.13
0.0320.0025
" 0.0080.0150.069
0.00250.0025
0.0150.025
0.00010.00030.0005
0.000450.00010.00030.0005
0.000450.00010.00030.0005
0.000450.0005
0.000750.0008
1.990.38|'
'•;•'• Max.rf0.00250.0070.015
0.020.005
0.00120.0006
0.010.35
0.015I 0.024
0.0011.1
0.00250.00050.00250.0020.0150.0050.383
0.00220.00250.0025
0.0150.13
0.0320.0025
0.0330.015
1.890.009
0.00250.0150.0360.187
0.08370.0162
29.70.0359
0.0110.0963
9.820.2490.4420.476
16.2030.238
0.0413"}0.0238
55.90.38
iHStdeY;"
0.001440.000810.000250.004330.192960.007220.010610.000350.51926
00.01768
01.287640.0046
00
0.007780.023210.009050.005616.591110.010370.001830.019663.437720.036150.066010.052133.013850.10267,0.0131810.0085423.0209
>MGL<0.005
1.30.015
50.0050.0050.0051.31.3
0.0150.0150.015
50.0050.005
1.31.3
0.0150.015
55
0.0051.3
0.01555
0.0051.3
0.0155
0.0051.3
0.0155
0.0051.3
0.0155
0.0051.3
0.0155
0.0051.3
0.0155
0.0051.3
0.01555
'ExCnt000
^ 000
I 0_00010000000000000000000100000000
0
0
0000000000
Case:D = Deep (DWS)0 = Other (seep)
S = Shallow (SMW)
U = Depth unknownAvg, Min, Max, Stdev, MCL in mg/L
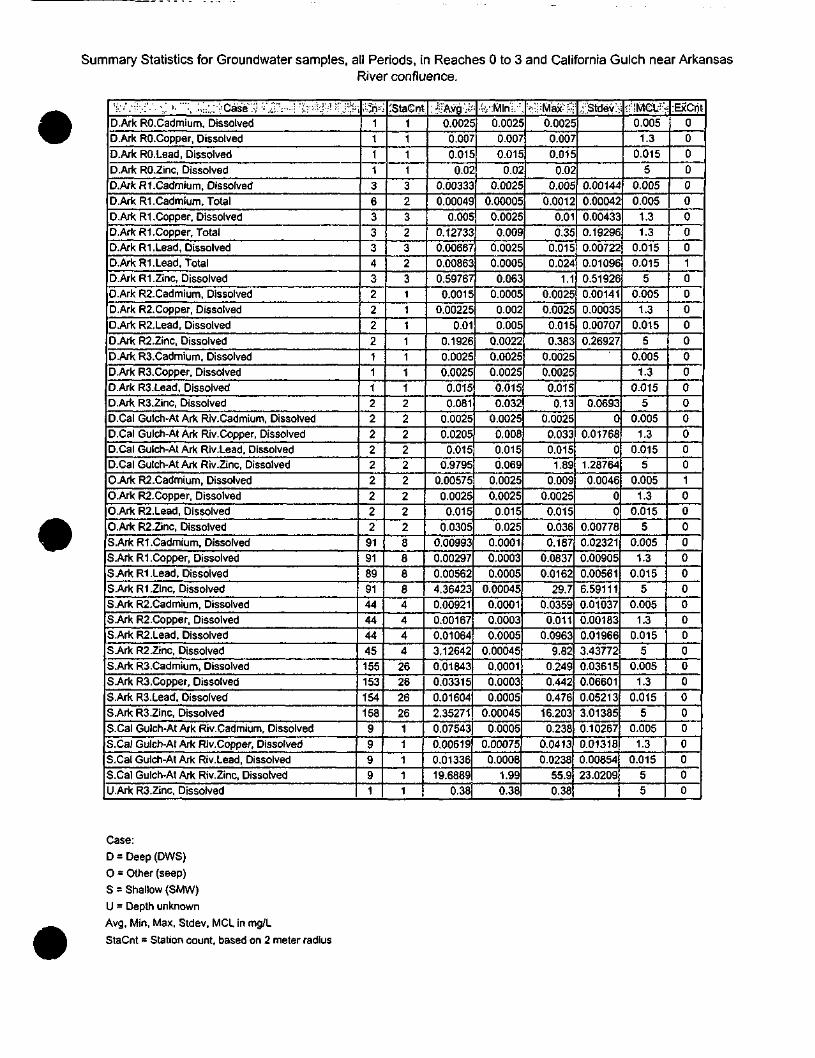
Summary Statistics for Groundwater samples, all Periods, in Reaches 0 to 3 and California Gulch near ArkansasRiver confluence.
:•'• ,':"-l • V '' "< .'i:;!... :;CaSe .-; '.- ,;; .':•••'•': ':-.V^:kf';' •'•- J^r
D.Ark RO. Cadmium, DissolvedD.Ark RO.Copper, Dissolved
D.Ark RO.Lead, DissolvedD.Ark RO.Zinc, DissolvedD.Ark R1. Cadmium, DissolvedD.Ark R1. Cadmium, TotalD.Ark R1. Copper, DissolvedD.Ark R1 .Copper, TotalD.Ark RLLead, DissolvedD.Ark R1. Lead, TotalD.Ark RLZinc, Dissolved
D.Ark R2.Cadmium, DissolvedD.Ark R2. Copper, DissolvedD.Ark R2.Lead, Dissolved
D.Ark R2.Zinc, DissolvedD.Ark RS.Cadmium, DissolvedD.Ark R3. Copper, DissolvedD.Ark RS.Lead, DissolvedD.Ark RS.Zinc, DissolvedD.Cal Gulch-At Ark Riv.Cadmium, DissolvedD.Cal Gulch-At Ark Riv.Copper, Dissolved
D.Cal Gulch-At Ark Riv.Lead, DissolvedD.Cal Gulch-At Ark Riv.Zinc, DissolvedO.Ark R2. Cadmium, DissolvedO.Ark R2.Copper, DissolvedO.Ark R2.Lead, Dissolved
O.Ark R2.Zinc, DissolvedS.Ark R1. Cadmium, DissolvedS.Ark R1. Copper, DissolvedS.Ark RLLead, DissolvedS.Ark RLZinc, DissolvedS.Ark R2.Cadmium, DissolvedS.Ark R2.Copper, DissolvedS.Ark R2.Lead, DissolvedS.Ark R2.Zinc, Dissolved
S.Ark RS.Cadmium, DissolvedS.Ark RS.Copper, DissolvedS.Ark R3.Lead, DissolvedS.Ark RS.Zinc, DissolvedS.Cal Gulch-At Ark Riv.Cadmium, DissolvedS.Cal Gulch-At Ark Riv.Copper, DissolvedS.Cal Gulch-At Ark Riv.Lead, DissolvedS.Cal Gulch-At Ark Riv.Zinc, DissolvedU.Ark RS.Zinc, Dissolved
£Tn'::111136333432222111222222222
919189914444444515515315415899991
JStaCnt111132323231111111222222222888844442626262611111
:£Avg;;;
0.00250.007
0.015
0.02
0.003330.00049
0.0050.127330.006670.008630.597670.0015
0.002250.01
0.19260.00250.00250.0150.081
0.00250.0205
0.0150.9795
0.005750.00250.015
0.03050.009930.002970.005624.364230.009210.001670.010643.126420.018430.033150.016042.352710.075430.006190.0133619.6889
0.38
fc'i'WInl"0.00250.007
0.015
0.02
0.00250.000050.00250.009
0.00250.00050.063
0.00050.002
0.0050.00220.00250.00250.0150.032
0.00250.0080.0150.069
0.00250.00250.015
0.0250.00010.00030.0005
0.000450.00010.00030.0005
0.000450.00010.00030.0005
0.000450.0005
0.000750.0008
1.99
0.38
:i;^Max ?'-0.00250.007
0.015
0.02
0.0050.0012
0.010.35
0.0150.024
1.10.00250.00250.015
0.3830.00250.00250.015
0.13
0.00250.0330.015
1.89
0.0090.00250.015
0.0360.187
0.08370.0162
29.70.0359
0.0110.0963
9.82
0.2490.4420.476
16.2030.238
0.04130.0238
55.90.38
,;:;stdev.::
0.001440.00042
0.004330.192960.007220.010960.519260.001410.000350.00707
0.26927
0.06930
0.017680
1.287640.0046
0
00.007780.023210.009050.005616.591110.010370.001830.019663.437720.036150.066010.052133.013850.10267
0.013180.0085423.0209
!MeL?:'4:ExCnt0.005
1.30.015
50.0050.005
1.31.3
0.0150.015
50.005
1.30.015
50.005
1.30.015
50.0051.3
0.0155
0.005
1.30.015
50.005
1.30.015
50.005
1.30.015
50.005
1.30.015
50.0051.3
0.01555
00000000010000000000000100000000000000000000
Case:
D = Deep (DWS)
O = Other (seep)
S = Shallow (SMW)
U = Depth unknown
Avg, Min, Max, Stdev, MCL in mg/L
StaCnt = Station count, based on 2 meter radius
APPENDIX F
Mass-Balance Calculations
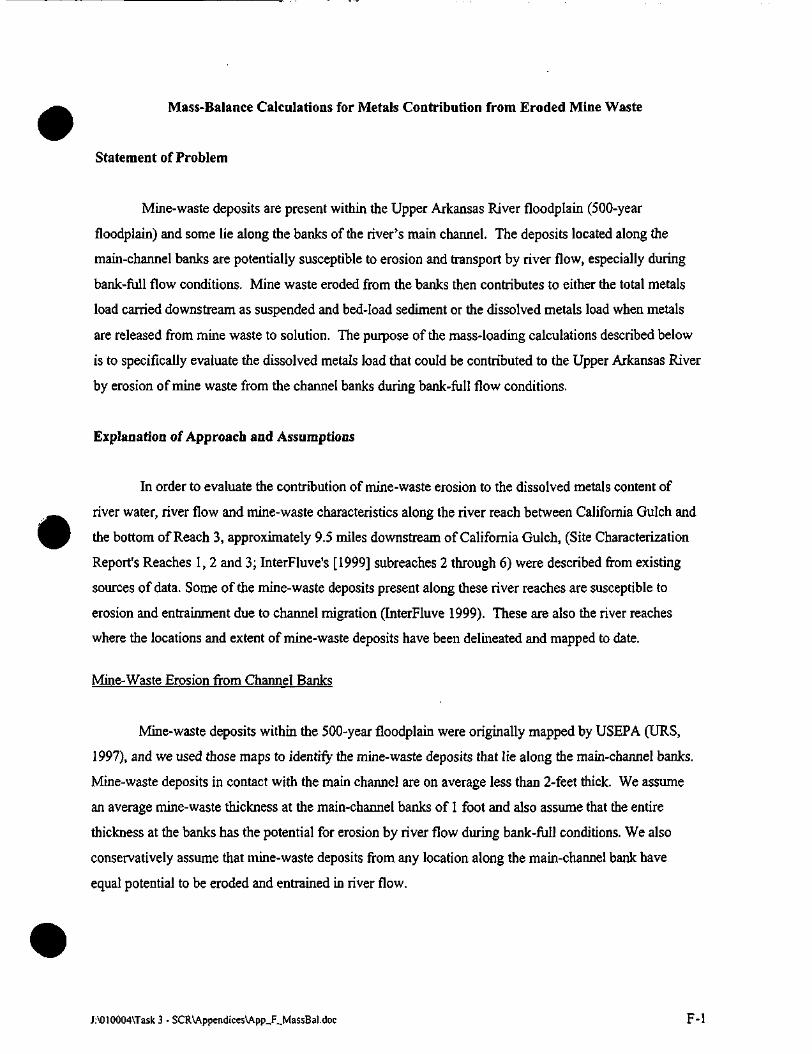
Mass-Balance Calculations for Metals Contribution from Eroded Mine Waste
Statement of Problem
Mine-waste deposits are present within the Upper Arkansas River floodplain (500-year
floodplain) and some lie along the banks of the river's main channel. The deposits located along the
main-channel banks are potentially susceptible to erosion and transport by river flow, especially during
bank-full flow conditions. Mine waste eroded from the banks then contributes to either the total metals
load carried downstream as suspended and bed-load sediment or the dissolved metals load when metals
are released from mine waste to solution. The purpose of the mass-loading calculations described below
is to specifically evaluate the dissolved metals load that could be contributed to the Upper Arkansas River
by erosion of mine waste from the channel banks during bank-full flow conditions.
Explanation of Approach and Assumptions
In order to evaluate the contribution of mine-waste erosion to the dissolved metals content of
river water, river flow and mine-waste characteristics along the river reach between California Gulch and
the bottom of Reach 3, approximately 9.5 miles downstream of California Gulch, (Site Characterization
Report's Reaches 1, 2 and 3; InterFluve's [1999] subreaches 2 through 6) were described from existing
sources of data. Some of the mine-waste deposits present along these river reaches are susceptible to
erosion and entrainment due to channel migration (InterFluve 1999). These are also the river reaches
where the locations and extent of mine-waste deposits have been delineated and mapped to date.
Mine-Waste Erosion from Channel Banks
Mine-waste deposits within the 500-year floodplain were originally mapped by USEPA (URS,
1997), and we used those maps to identify the mine-waste deposits that lie along the main-channel banks.
Mine-waste deposits in contact with the main channel are on average less than 2-feet thick. We assume
an average mine-waste thickness at the main-channel banks of 1 foot and also assume that the entire
thickness at the banks has the potential for erosion by river flow during bank-full conditions. We also
conservatively assume that mine-waste deposits from any location along the main-channel bank have
equal potential to be eroded and entrained in river flow.
J:\010004\Task 3 - SCRAAppendices\App_F_MassBal.doc F-l
Metals Release from Mine Waste to Solution
The average metals content of each mine-waste deposit mapped along the Arkansas River,
estimated from all available sample data including data for surficial samples, was used to describe the
mass of metals associated with a unit mass of those mine wastes.
Metals are present in various forms within the mine-waste deposits. Previous studies of soil and
mine waste in the river's floodplain have shown that cadmium, lead and zinc are primarily associated
with iron and manganese oxide phases (Levy et al., 1992) and that metals are readily leached from mine
waste (Smith et al., 1998). Given these observations, we assumed that the observed metals leaching from
mine waste (by water) was controlled primarily by desorption from secondary mineral phases (e.g.
hydrous oxides), and possibly organic matter, rather than by dissolution of the primary mineral phases
(carbonates and sulfides). Secondary salts, such as soluble sulfate salts, commonly form on the upper
surfaces of mine-waste deposits and have been observed on some mine wastes and other floodplain
deposits along the upper Arkansas River (Levy et al., 1992; Smith et al., 1998). These salts are generally
soluble in water and may also release metals when mine wastes are entrained by river water.
Work performed by Smith et al. (1998) demonstrates that lead is readily leached from the upper
portions of the mine-waste deposits present along the Arkansas River. In a series of batch leaching
experiments on depth-specific, mine-waste core samples, lead partitioning to water was greatest in
samples from the surface layer and lowest in deeper layers. The resultant empirical partition coefficients
(Kd = concentration in solid/concentration in solution) for lead, from all of the mine-waste samples
evaluated including those from the surface layer, range from approximately 765 to 30,000 L/Kg. Because
the mass of metals associated with the surface salts and their occurrence within the floodplain are not
known, the release of metals from soluble surface salts was considered by adopting the conservative
assumptions described below.
Once mine wastes are eroded and entrained by river water, we assume that distribution of metals
to the dissolved phase is controlled by equilibrium partitioning rather than by precipitation and
dissolution reactions. The presence of readily water-soluble forms of metals at the mine-waste surface
was considered when partition coefficients were selected to describe metals release from mine waste; very
conservative (low Kd values; i.e., relatively greater partitioning from solid to water) estimates of metals
release were used in the mass-balance calculations. The Kd values selected are likely to be too low to
accurately describe metals release from mine waste at depth within the deposits and result in over-
estimation of dissolved concentrations. We also conservatively assume that once metals are released to
solution they remain in solution without sorption or other removal processes retarding their transport.
J:\010004\Task 3 - SCR\Appendices\App_F_MassBal.doc F-2
Based on descriptions of bed sediments from the Arkansas River (Kimball et al., 1995) that contain
metals transported downstream from the mine-waste deposits this is appears to be an overly conservative
assumption as well.
Dissolved Metals Mass-Load Calculation
Calculation of the net metals mass load and resultant dissolved metals concentrations was
performed for defined subreach.es of the Arkansas River using a simple spreadsheet (table attached).
For the purposes of these calculations, we assumed that metals are distributed between solid mine
waste and the dissolved phase in accordance with equilibrium partitioning behavior once those mine
wastes are eroded and entrained by river water. Dissolved-phase metals are transported conservatively,
and the dissolved-metals load increases downstream in proportion to the mass of mine waste eroded by
the river. The result is an estimate of the net dissolved-metals load at a location downstream of mine-
waste deposits that may be contributed from the eroded mine waste.
Mine-waste erosion to river water was estimated from the total length of tailing in contact with
the main channel and an estimated bank erosion rate for mine waste in contact with the main channel.
The weighted average metals concentration of mine waste eroded along a specified subreach of the river
was estimated by summing the average metal concentration for each tailing deposit times the proportion
of total mine waste length represented by each deposit along the subreach. The mass of metals released to
the dissolved phase from the mass of mine waste eroded was computed using estimates of an equilibrium
partition coefficient for each metal at chemical conditions representative of Upper Arkansas River water
at bank-full flow conditions. The net mass of dissolved metals contributed to the river flow and resulting
net change in dissolved concentrations along the defined subreach was then computed and summed to
obtain an estimate of the dissolved metal concentration increase resulting from mine-waste erosion along
Reaches 1, 2 and 3.
Sources of Information/Data
1. Linear feet of mine waste in contact with main channel for each mine-waste deposit:
Maps from URS (1997) were used to delineate areas of mine-waste deposits within theriver floodplain. GIS methods were used to identify and define the length of each distinctmine-waste deposit in contact with the main channel. The channel-length estimatesobtained using GIS mapping methods are included on the attached table and were used incomputations.
J:\010004\Task 3 - SCR\Appendices\App_F_MassBal.doc F-3
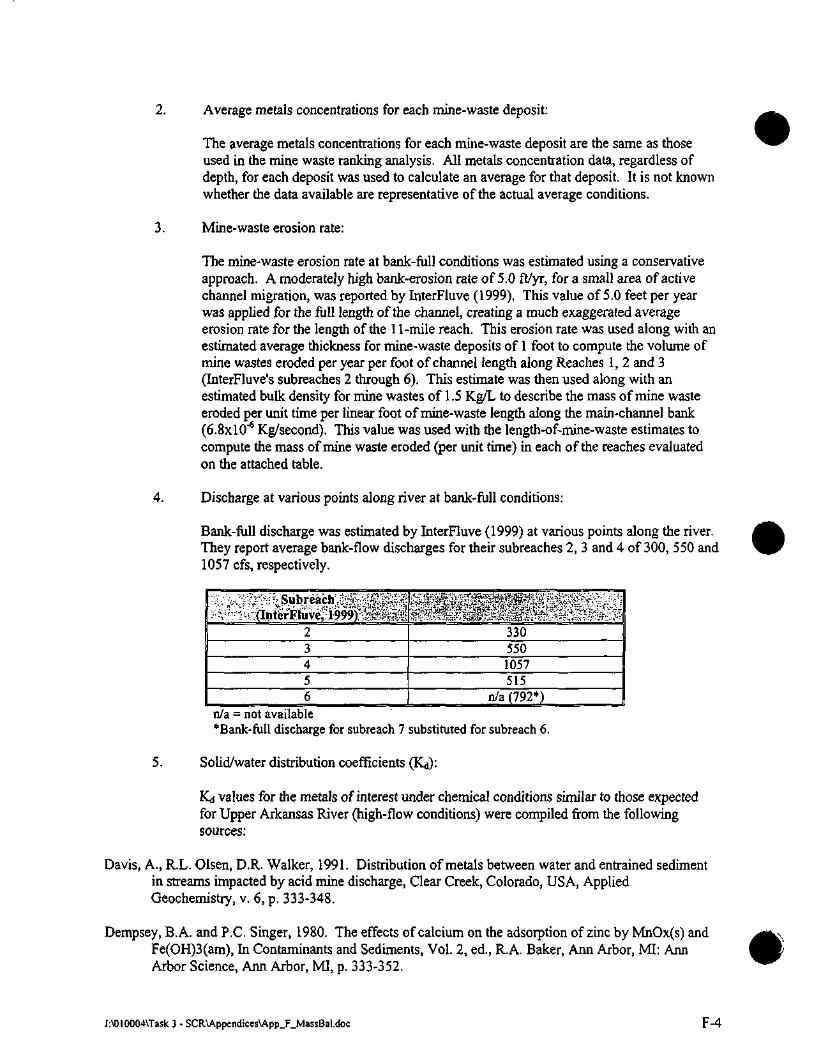
Average metals concentrations for each mine-waste deposit:
The average metals concentrations for each mine-waste deposit are the same as thoseused in the mine waste ranking analysis. All metals concentration data, regardless ofdepth, for each deposit was used to calculate an average for that deposit. It is not knownwhether the data available are representative of the actual average conditions.
Mine-waste erosion rate:
The mine-waste erosion rate at bank-full conditions was estimated using a conservativeapproach. A moderately high bank-erosion rate of 5.0 ft/yr, for a small area of activechannel migration, was reported by InterFluve (1999). This value of 5.0 feet per yearwas applied for the full length of the channel, creating a much exaggerated averageerosion rate for the length of the 11-mile reach. This erosion rate was used along with anestimated average thickness for mine-waste deposits of 1 foot to compute the volume ofmine wastes eroded per year per foot of channel length along Reaches 1, 2 and 3(InterFluve's subreaches 2 through 6). This estimate was then used along with anestimated bulk density for mine wastes of 1.5 Kg/L to describe the mass of mine wasteeroded per unit time per linear foot of mine-waste length along the main-channel bank(6.8xlO~6 Kg/second). This value was used with the length-of-mine-waste estimates tocompute the mass of mine waste eroded (per unit time) in each of the reaches evaluatedon the attached table.
Discharge at various points along river at bank-full conditions:
Bank-full discharge was estimated by InterFluve (1999) at various points along the river.They report average bank-flow discharges for their subreaches 2, 3 and 4 of 300, 550 and1057 cfs, respectively.
3305501057515
n/a (792*)n/a = not available*Bank-full discharge for subreach 7 substituted for subreach 6.
Solid/water distribution coefficients
K<i values for the metals of interest under chemical conditions similar to those expectedfor Upper Arkansas River (high-flow conditions) were compiled from the followingsources:
Davis, A., R.L. Olsen, D.R. Walker, 1991. Distribution of metals between water and entrained sedimentin streams impacted by acid mine discharge, Clear Creek, Colorado, USA, AppliedGeochemistry, v. 6, p. 333-348.
Dempsey, B.A. and P.C. Singer, 1980. The effects of calcium on the adsorption of zinc by MnOx(s) andFe(OH)3(am), In Contaminants and Sediments, Vol. 2, ed., R.A. Baker, Ann Arbor, MI: AnnArbor Science, Ann Arbor, MI, p. 333-352.
J:\Ol0004\Task 3 - SCR\Appendices\App_F_MassBaI.doc F-4
Duddridge, J.I. and M. Wainright, 1981. Heavy metals in river sediments - Calculation of metaladsorption using Langmuir and Freundlich isotherms, Environmental Pollution, v.B2, p. 387-397.
Gadde, R.R. and H.A. Laitinen, 1974. Studies of heavy metal adsorption by hydrous iron and manganeseoxides, Analytical Chemistry, v. 46, p. 2022-2026.
Gardiner, J., 1974. The chemistry of cadmium in natural waters - II. The adsorption of cadmium on rivermuds and naturally occurring solids, Water Resources, v. 8, p. 157-164.
Levy, D.B., K.A. Barbarick, E.G. Siemer and L.E. Sommers, 1992. Distribution and partitioning of tracemetals in contaminated soils near Leadville, Colorado, J. Environ. Quality, v. 21, p. 185-195.
Oakley, S.M., P.O. Nelson, and K.J. Williamson, 1981. Model of trace-metal partitioning in marinesediments, Environmental Science and Technology, v. 15, p. 474-480.
O'Connor, J.T. and C.E. Renn, 1981. Soluble adsorbed zinc equilibrium in natural waters, J. AmericanWaterworks Association, v. 56, p. 1055-1061.
Ramamoorthy, S. and B.R. Rust, 1978. Heavy metal exchange processes in sediment water systems,Environmental Geology, v. 2, p. 165-172.
Smith, K.S., SJ. Sutley, P.H. Briggs, A.L., Meier, K.Walton-Day, 1998. Trends in water-leachable leadfrom a fluvial tailings deposit along the upper Arkansas River, Colorado. Proceedings Tailingsand Mine Waste Conference '98, Ft. Collins, CO, Balkema Press, p. 763-768.
U.S. EPA, 1999. Understanding Variation in Partition Coefficient, Kd, Values, Prepared by U.S. EPAOffice of Radiation and Indoor Air and Office of Environmental Restoration, August 1999, EPA402-R-99-004B.
The resultant compilation is presented on the attached table titled "Kd Calculations."
Two of these sources, Levy et al. (1992) and Smith et al. (1998), provide site-specific partitioning data for
mine wastes from the Upper Arkansas River floodplain and one, Davis et al. (1991), provides empirical
partitioning data for suspended stream sediment in Clear Creek, central Colorado. The remaining
references describe metals partitioning to sediments and soils from a range of settings. The attached table
presents the Kd values found. The Kd values used for the mass-balance calculations were selected to
represent the conservative (low) end of the range determined from site-specific studies. These are
generally more conservative than Kd values from other sources/settings.
Results and Discussion of Uncertainties
Results are shown on the attached tables as the increase in metals concentration (micrograms/L)
resulting from metals partitioning to water from eroded mine wastes occurring along the reach from
California Gulch downstream to the Highway 24 bridge. The estimated increase in concentrations, or the
concentrations attributable to metals release from eroded mine wastes at bank-full conditions, are
J:\010004\Task 3 - SCR\Appcndices\App_F_MassBal.doc F-5
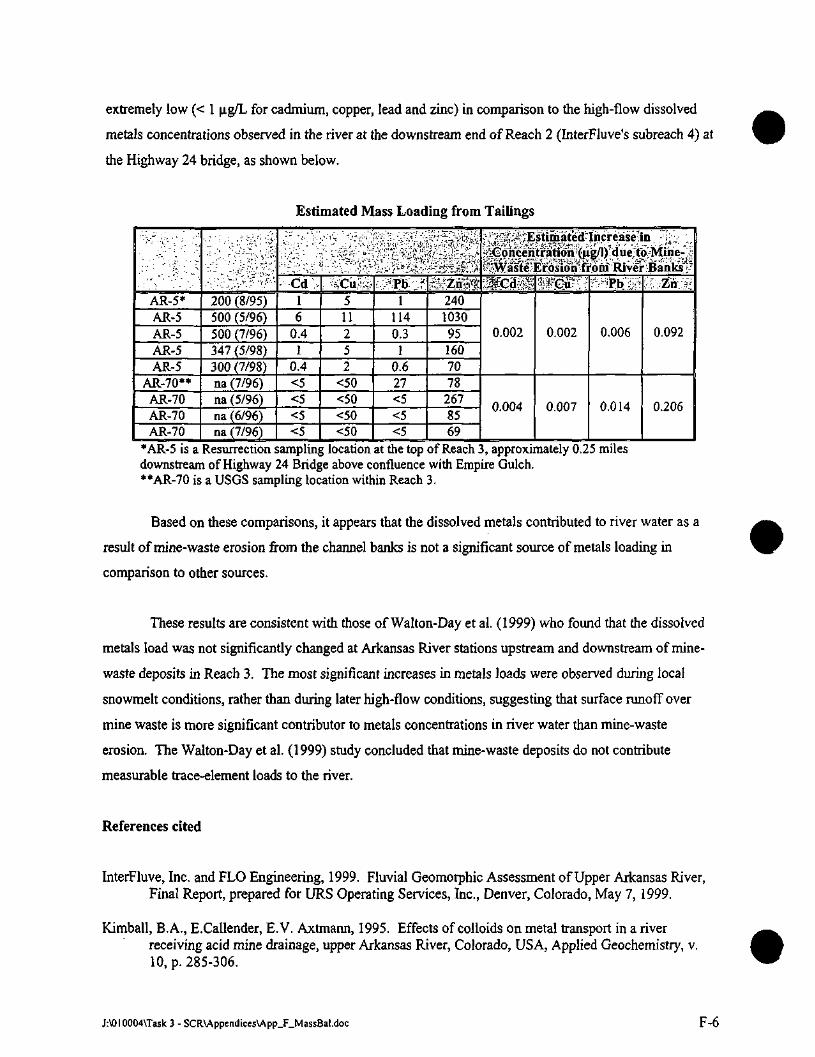
extremely low (< 1 ug/L for cadmium, copper, lead and zinc) in comparison to the high-flow dissolved
metals concentrations observed in the river at the downstream end of Reach 2 (InterFluve's subreach 4) at
the Highway 24 bridge, as shown below.
Estimated Mass Loading from Tailings
AR-5*AR-5AR-5AR-5AR-5
AR-70**AR-70AR-70AR-70
•}•
200 (8/95)500 (5/96)500 (7/96)347 (5/98)300 (7/98)na (7/96)na (5/96)na (6/96)na (7/96)
* ",s ' - *
> t .<%
Cd16
0.41
0.4<5<5<5<5
^Cu511252
<50<50<50<50
Pb '1
1140.31
0.627<5<5<5
^ ^
~- 'S f fr' Ztf-'
2401030951607078
2678569
,J ^'Estimated Increase in" Concentration (fig/l^due to Mine-
Waste Erosion from River Banks;ycd ** | «nci
0.002
0.004
0.002
0.007
Pb
0.006
0.014
Zn
0.092
0.206
*AR-5 is a Resurrection sampling location at the top of Reach 3, approximately 0.25 milesdownstream of Highway 24 Bridge above confluence with Empire Gulch.** AR-70 is a USGS sampling location within Reach 3.
Based on these comparisons, it appears that the dissolved metals contributed to river water as a
result of mine-waste erosion from the channel banks is not a significant source of metals loading in
comparison to other sources.
These results are consistent with those of Walton-Day et al. (1999) who found that the dissolved
metals load was not significantly changed at Arkansas River stations upstream and downstream of mine-
waste deposits in Reach 3. The most significant increases in metals loads were observed during local
snowmelt conditions, rather than during later high-flow conditions, suggesting that surface runoff over
mine waste is more significant contributor to metals concentrations in river water than mine-waste
erosion. The Walton-Day et al. (1999) study concluded that mine-waste deposits do not contribute
measurable trace-element loads to the river.
References cited
InterFluve, Inc. and FLO Engineering, 1999. Fluvial Geomorphic Assessment of Upper Arkansas River,Final Report, prepared for URS Operating Services, Inc., Denver, Colorado, May 7, 1999.
Kimball, B.A., E.Callender, E.V. Axtmann, 1995. Effects of colloids on metal transport in a riverreceiving acid mine drainage, upper Arkansas River, Colorado, USA, Applied Geochemistry, v.10, p. 285-306.
J:\OI0004\Task 3 - SCR\Appendices\App_F_MassBal.doc F-6
Levy, D.B., K..A. Barbarick, E.G. Siemer and L.E. Sommers, 1992. Distribution and partitioning of tracemetals in contaminated soils near Leadville, Colorado, J. Environ. Quality, v. 21, p. 185-195.
Smith, K.S., S.J. Sutley, P.M. Briggs, A.L., Meier, K.Walton-Day, 1998. Trends in water-leachable leadfrom a fluvial tailings deposit along the upper Arkansas River, Colorado. Proceedings Tailingsand Mine Waste Conference '98, Ft. Collins, CO, Balkema Press, p. 763-768.
URS Operating Services, Inc., 1997. Sampling Activities Report, Upper Arkansas Fluvial Tailings,Leadville, Colorado: Report to U.S. Environmental Protection Agency, Contract No. 68-W5-0031.
Walton-Day, K., F.J. Rossi, L.J. Gemer, J.B. Evans, T.J. Yager, J.F. Ranville, and K.S. Smith, 1999.Effects of fluvial tailings deposits on soils and surface- and ground-water quality, andimplications for remediation - Upper Arkansas River, Colorado, 1992-1996, U.S.GeologicalSurvey Water Resources Investigation Report 99-4273.
J:\010004\Task 3 - SCR\Appendices\App_F_MassBal.doc F-7
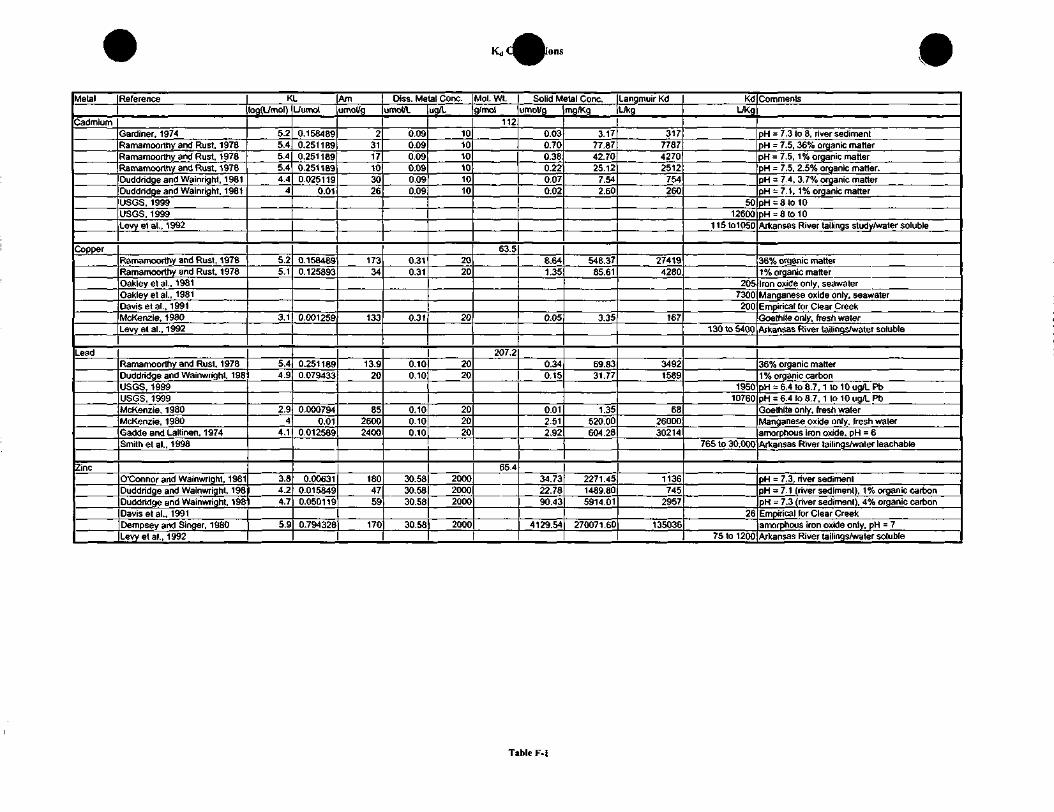
Kd C^ ^Bio
Metal
Cadmium
Copper
Lead
Zinc
Reference
Gardiner, 1974Ramamoorthy and Rust, 1978Ramamoorthy and Rust, 1978Ramamoorthy and Rust, 1978Duddridge and Wainright, 1981Duddridge and Wainright, 1981USGS, 1999USGS, 1999Levy et a!., 1992
Ramamoorthy and Rust, 1978Ramamoorthy and Rust, 1978Oakley etal., 1981Oakley etal., 1981Davis etal., 1991McKenzie, 1980Levy etal., 1992
Ramamoorthy and Rust, 1978Duddridge and Wainwright, 198USGS, 1999USGS, 1999McKenzie, 1980McKenzie, 1980Gadde and Laltinen, 1974Smith etal., 1998
O'Connor and Wainwright, 1981Duddridge and Wainwright, 198Duddridge and Wainwright, 198Davis etal., 1991Dempsey and Singer, 1980Levy etal., 1992
KLlog(Umol)
5.25.45.45.44.4
4
5.25.1
3.1
5.44.9
2.94
4.1
3.84.24.7
5.9
Uumol
0.1584890.2511890.2511890.2511890.025119
0.01
0.1584890.125893
0.001259
0.2511890.079433
0.0007940.01
0.012589
0.006310.0158490.050119
0.794328
Amumol/g
23117103026
17334
133
13.920
8526002400
1804759
170
Diss. Metal Cone.umol/L |ug/L
0.090.090.090.090.090.09
0.310.31
0.31
101010101010
2020
20
I0.100.10
0.100.100.10
30.5830.5830.58
30.58
2020
202020
200020002000
2000
Mol. Wt.g/mol
112
63.5
207.2
65.4
Solid Metal Cone.umol/g
0.030.700.380.220.07
0.02
8.64
1.35
0.05
0.340.15
0.012.512.92
34.7322.7890.43
4129.54
mg/Kg
3.17
77.8742.7025.12
7.54
2.60
548.3785.61
3.35
69.8331.77
1.35520.00604.28
2271.451489.805914.01
270071.60
Langmuir KdUkg
317778742702512
754260
274194280
167
34921589
682600030214
1136745
2957
135036
KdUKg
5012600
115to1050
2057300200
130 to 5400
195010760
765 to 30,000
26
75 to 1200
Comments
pH = 7.3 to 8, river sedimentpH = 7.5, 36% organic matterpH = 7.5, 1% organic matterpH = 7.5, 2.5% organic matter.pH = 7.4, 3.7% organic matterpH = 7.1, 1% organic matterpH = 8to10pH = 8to 10Arkansas River tailings study/water soluble
36% organic matter1% organic matterIron oxide only, seawaterManganese oxide only, seawaterEmpirical for Clear CreekGoethite only, fresh waterArkansas River tailings/water soluble
36% organic matter1 % organic carbonpH = 6.4 to 8.7, 1 to 10 ug/L PbpH = 6.4 to 8.7, 1 to 10 ug/L PbGoethite only, fresh waterManganese oxide only, fresh wateramorphous iron oxide, pH = 6Arkansas River tailings/water teachable
pH = 7.3, river sedimentpH = 7.1 (river sediment), 1% organic carbonpH = 7.3 (river sediment), 4% organic carbonEmpirical for Clear Creekamorphous iron oxide only, pH = 7Arkansas River tailings/water soluble
Table F-t
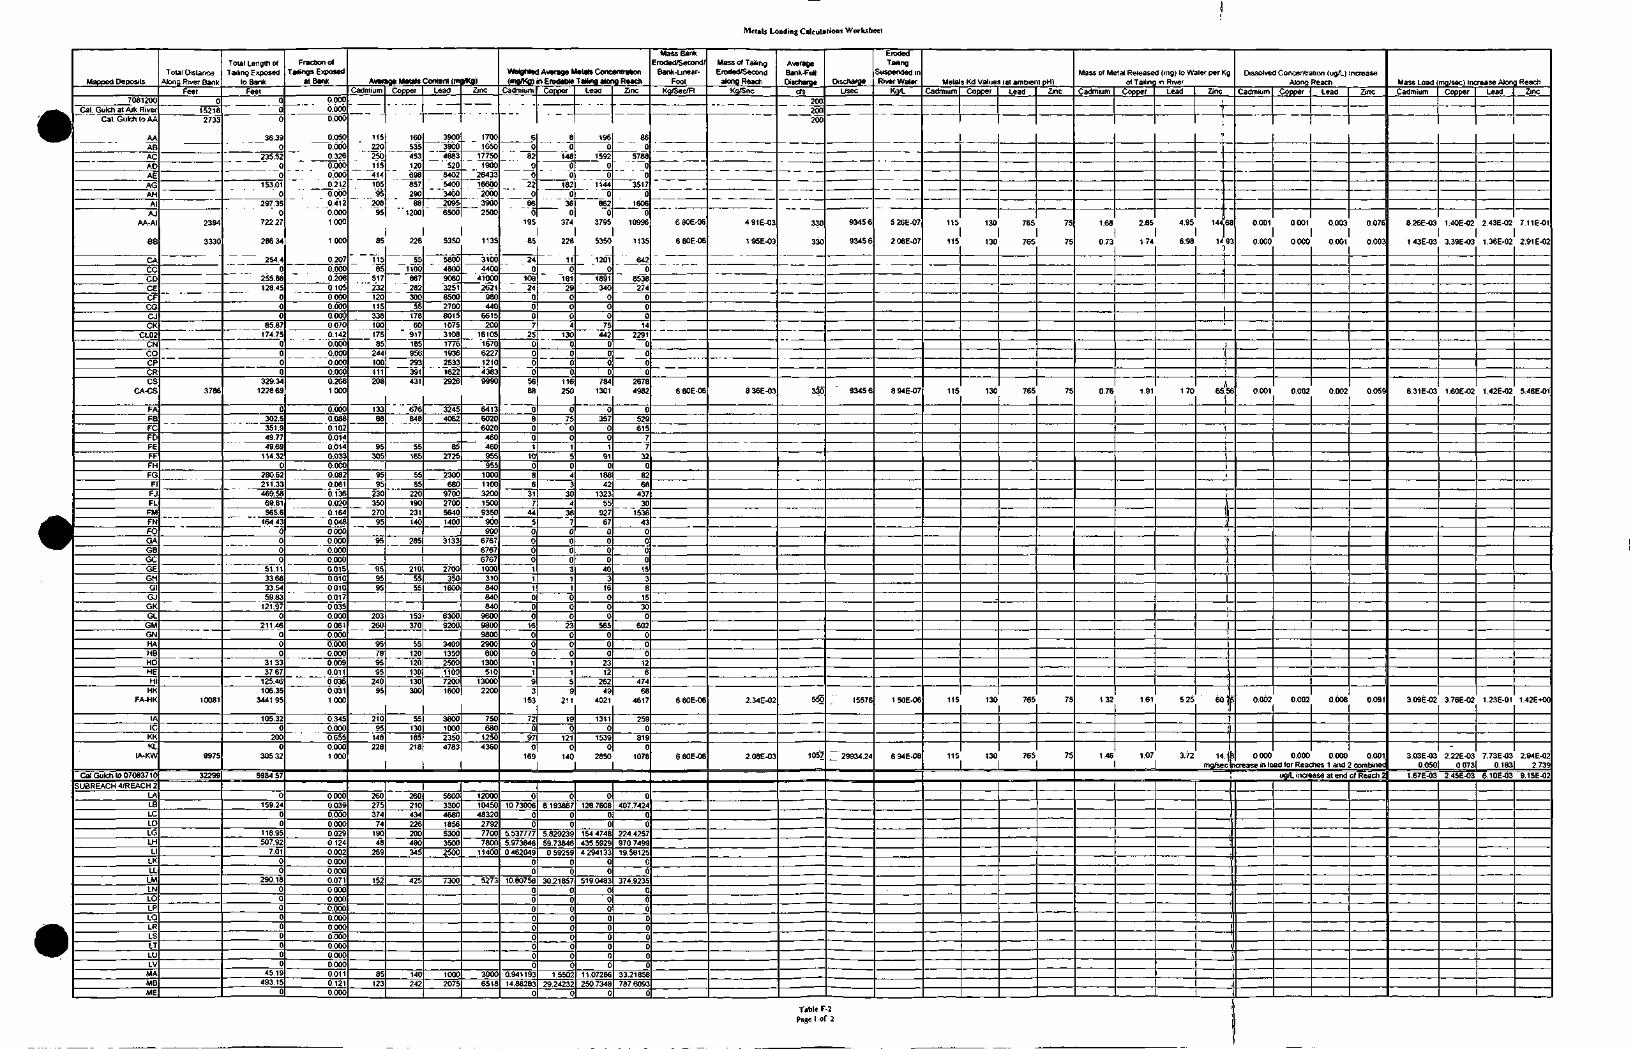
Metals Loading Calculations Worksheet
Mapped Deposits
7081200
ICal Gulch at Artc River
Cal Gulch to AA
AAABACAOAEAGAHAlAJ
AA-AI
BB
CACCCDCECFCGCJCK
CL02CNCOCPCRCS
CA-CS
FAFBFCFDFEFFFHFGFlFJ
FL| FM
FNFOGAGBGCGEGHGlGJGKGL
CMGNHAHBHDHEHI
HKFA-HK
IA1C
KKKL
IA-KW
Cal Gulch to 07083710SUBREACH 4/REACH 2
LALBLCLDLGLHLI
LKLL
LMLNLOLPLQLRLSLTLULV
MAMBME
Total DistanceAlong River Bank
Feet0
152182733
2394
3330
3786
10081
9975
32299
Total Length ofTaihng Exposed
to BankFeet
000
36.390
235.5200
153.010
297.350
72227
28634
25440
25588128.45
000
85.87174.75
0000
329.34122869
0302.5351.9497749.69
114.320
280.62211.33469.586981565.6
164430000
51.113368335459.83
121.970
211.46000
31 333767
125.46106.35
3441 95
105.320
2000
30532
598457
0159.24
00
11895507.92
7.0100
290.18000000000
45.19493.15
0
Fraction ofTailings Exposed
at Bank
0.0000.0000.000
0.0500.0000.3260.0000.0000.2120.0000.4120.0001 000
1 000
0.2070.00002080105000000000.00000700.1420.0000.0000.0000.0000.2681 000
0.0000.0880.1020.0140.0140.0330.0000.0820.0610.1360.0200.16400480.0000.0000.0000.0000.0150.0100.0100.01700350.00000610.0000.0000.0000.0090.01100360.0311 000
0.3450.0000.6550.0001 000
000000390.00000000.029012400020.0000.0000.07100000.0000.0000.0000.0000.0000.0000.0000.0000.01101210.000
Awnge Metals Content (mo/Kg)Cadmium | Copper I Lead
1
11522025011541410595
20895
85
11585
51723212011533810017585
244100111208
13388
95305
9595
23035027095
95
959595
203260
95789595
24095
21095
148228
160535453
|_ 12069885729088
"1200
228
55110086728230055
17860
917185956293391431
676848
55165
5555
220190231140
285
2105555
153370
55120120130130300
55130185218
390039004883
52084025400"340020956500
5350
58004800908032518500270080151075310817761936253316222926
32454062
852725
2300680
9700270056401400
3133
2700350
1600
63009200
340013502500110072001600
3600100023504783
Zinc
17001650
177501900
2643316600200039002500
1135
31004400
410002621980440
6615200
1610516706227121043839990
641360206020460460955955
10001100320015009350900900
6767676767671000310840840840
9600980098002900800
1300510
130002200
750680
12504360
260275374
7419048
269
152
85123
260210434226200480345
425
140242
5600330046801856530035002500
7300
10002075
120001045048320279277007800
11400
5273
300C6518
Weighted Average Metals Concentration(mg/Kg) in Erooatte Tailing along Reach
Cadmium
60
8200
220
86
°1195
85
240
108240007
250000
5688
08001
10086
317
4450000111000
160001193
153
720
970
169
Copper | Lead I Zinc
—
80
14800
1820
360
374
228
110
181290004
1300000
116250
0750015043
304
3870000311000
230001159
211
190
1210
140
Ir196
01592
00
11440
862
°l3795
5350
12010
1891340
000
75442
0000
7841301
0357
001
910
18842
132355
927670000
403
16000
565000
2312
26249
4021
13110
15390
2850
860
578800
35170
16060
10996
1135
6420
8538274
000
142291
0000
26784982
0529615
77
320
8268
43730
1536430000
1538
15300
602000
126
47468
4617
2590
8190
1078
01073006
00
5.5377775.9738460462049
00
10.80758000000000
0.94119314.86283
0
08.193867
00
5.82923959738460 59259
00
30.21857000000000
1 550229.24232
0
0128.7608
00
1544748435.59294294133
00
519.0483000000000
11.072862507348
0
0407.7424
00
2244257970749919.58125
C0
374.92350000CC0CC
33.21 85E787.6092
C
Mass BankEroded/Second/
Bank-Unear-Foot
Kg/SeoTt
6 80E-06
680E-06
680E-06
680E-06
680E-06
Mass of TailingEroded/Secondalong Read!
Kg/Sec
491E-03
1 95E-03
836E-03
234E-02
208E-03
AverageBank-FullDischarge
cfs200200200
330
330
330
550
1057
DischargeUsec
93456
93456
93456
15576
Z 29934.24
ErodedTailing
Suspended inRiver Water
KO/L
5 26E-07
2 08E-07
8 94E-07
1 50E-06
694E-08
Metals Kd Values (at ambient pH)Cadmium
115
115
115
115
115
Copper
130
130
130
.
130
130
Lead I Zinc
765
765
765
765
765
75
75
75
75
75
Mass of Metal Released (mg) to Water per Kgof Tailing in River
Cadmium
1.68
0.73
0.76
1 32
1.46
Copper I Lead
2.85
174
1.91
161
1.07
4.95
6.98
170
525
3.72
Zinc,
T
14466
V931
1
«4*
)
1
i\
J
Iil»1
j
60(|
t
14. Img/sec
Dissolved Concentration (ug/L) increaseAlong Reach
Cadmium I Copper I Lead I Zinc
_JI
0001
0000
0.001
0002
0000icrease in lo
0001
0000
0.002
0.002
0.000ad for Reac
0.003
0.001
0.002
0.008
0.000*tes 1 and
I
0.076
0.003
0.059
0.091
0.0012 combinec
I ug/L increase at end of Reach 2
I
}
-
Mass Load (mg/sec) Increase Along ReachCadmium
8.26E-03
1 43E-03
631E-03
3.09E-02
3.03E-030.050
Copper
1.40E-02
3.39E-03
1.60E-02
3.76E-02
222E-030073
Lead
2.43E-02
1.36E-02
1.42E-02
1.23E-01
7.73E-030.183
Zinc
7.11E-01
2.91 E-02
5.48E-01
1.42E+00
2.94E-022.739
1.67E-03 2.45E-03 6.10E-03 9.15E-02
Table F-2Page 1 of 2
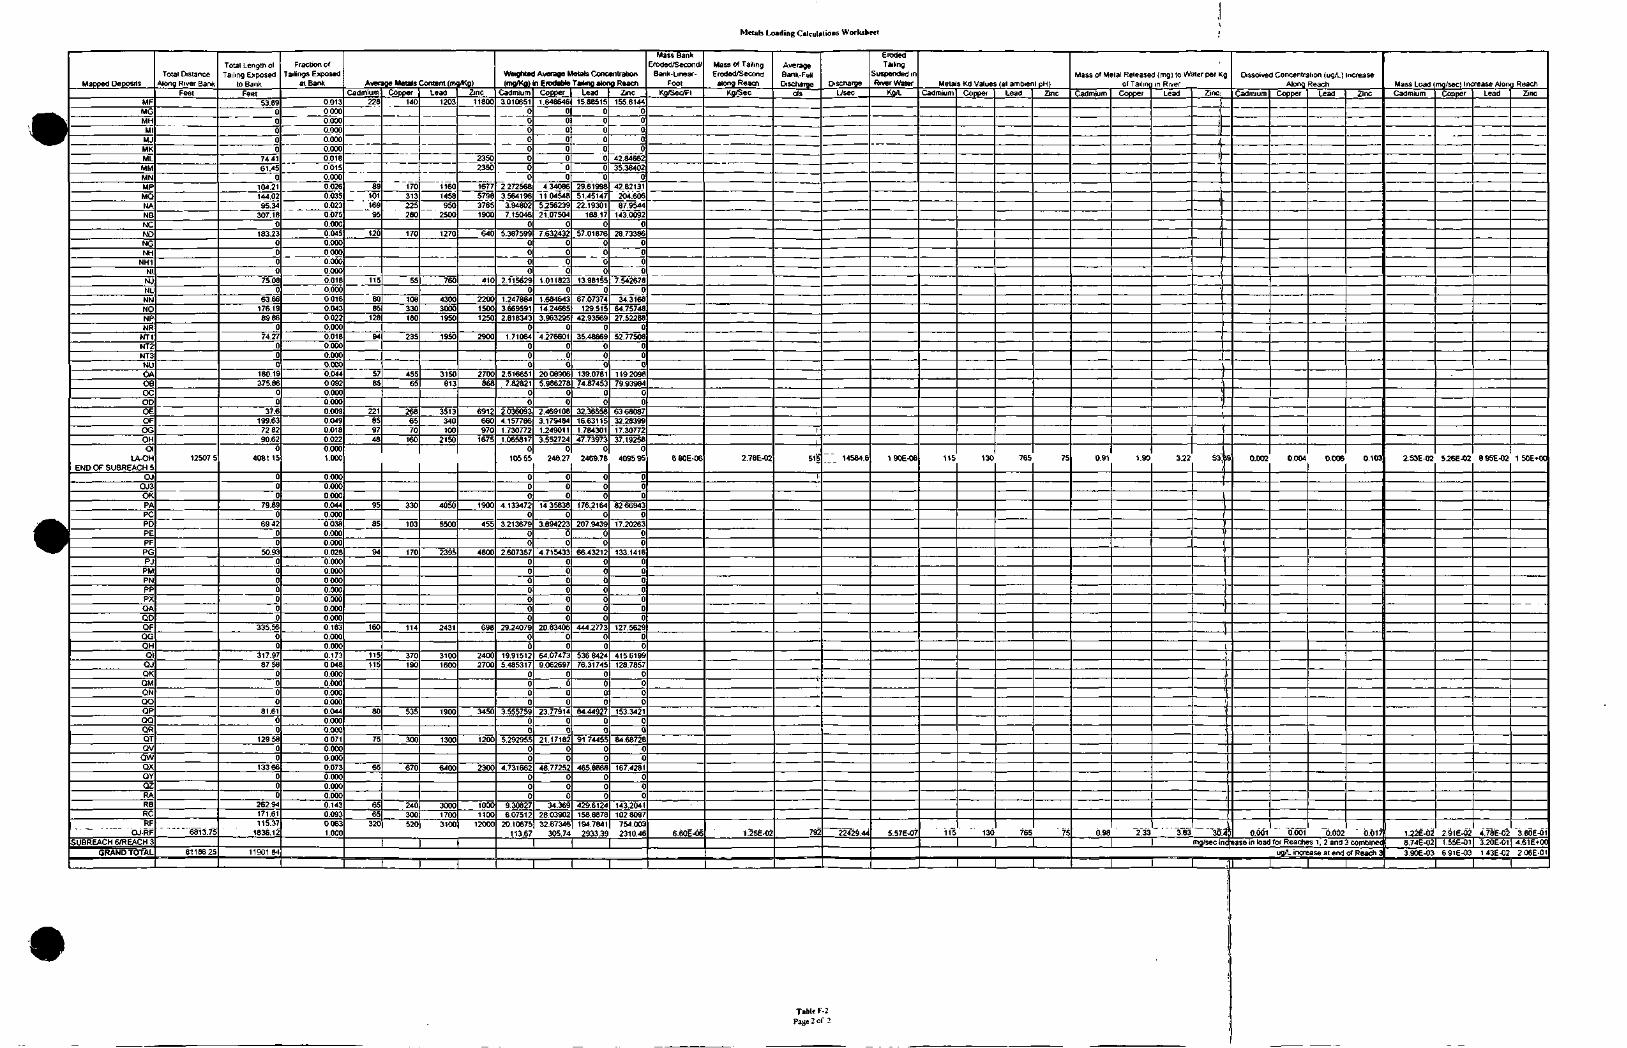
Metals Loading Calculations Worksheet
Mapped Deposits
MFMGMMMlMJMKMLMMMNMPMQMANBNCNDNGNH
NH1NlNJNLNNNONPNR
NT1NT2NTSNUOAOBOCODOEOFOGOHOl
LA-OHEND OF SUBREACH 5
OJOJ3OKPAPC
| PDP£PFPGPJ
PMPNPPPXQAQDOFQGQHQlQJOKQMQNQOOPQQQRQTQV
QWOXQYQZRARBRCRF
OJ-RFSUBREACH 6/REACH 3
GRAND TOTAL
Total DistanceAlong River Bank
Feet
125075
6813.75
6118625
Total Length ofTailing Exposed
to BankFeet
53.8900000
744161.45
0104.21144.0295.34
307.180
183.230006
75080
63.66176.198986
07427
000
180.19375.86
00
37.6199.63728290.62
04081 15
000
79.890
694200
50.930000000
3355600
317.978758
0000
81.6100
1295800
13366000
26294171.61115.37
1836.12
11901 84
Fraction ofTailings Exposed
at Bank
0.013000000000.0000.0000.0000.01800150.0000.0260.0350.0230.0750.0000.0450.00000000.0000.0000.0180.00000160.0430.0220.0000.0180.0000.0000.0000.04400920.0000.0000.00900490.0180.0220.0001.000
0.0000.0000.0000.0440.00000380.0000.0000.0280.00000000.0000.0000.0000.0000.00001830.0000.0000.1730.0480.0000.0000.0000.0000.0440.0000.00000710.0000.0000.0730.0000.0000.0000.1430.09300631.000
Average Metals Content (mg/Kg)Cadmium
228
8910116995
120
115
6085
128
94
5785
221859748
95
85
94
160
115115
80
75
65
6565
320
Copper140
170313225280
170
55
108330180
235
45565
2686570
160
330
103
170
114
370190
535
300
670
240300520
Lead1203
11601458950
2500
1270
760
430030001950
1950
3150813
3513340100
2150
4050
5500
2395
2431
31001600
1900
1300
6400
300017003100
Zinc11800
23502350
1677579837651900
640
410
220015001250
2900
2700868
6912660970
1675
1900
455
4800
698
24002700
3450
120C
230C
100C110C
12000
Weighted Average Metals Concentration(mg/Kg) in Enxtabto Tailing along Reach
Cadmium3.010651
00000000
22725683.5641963.948027.15046
05.387599
0000
2.1156290
12478843.6695912.818343
01.71064
000
2.516651782821
00
20360934.1577861.7307721.065817
010555
000
41334720
321367900
2.6073570000000
29.2407900
19.915125485317
0000
3.55575900
5.29295500
4.731662000
930827607512
20.10675113.67
Copper1.848646
00000000
4340861104548525623921.07504
07.632432
0000
1.0118230
1.68464314.246653.963295
04.276601
000
20089065.986278
00
2.4691083.1794841.2490113.552724
0248.27
000
14 358380
3.89422300
47154330000000
20.8340600
64.074739.062697
0000
23.7791400
21.1718200
4877252000
34.369280390232.67346
305.74
Lead15.88515
00000000
29.6199851.4514722.19301
188.170
57.018760000
13981550
6707374129.515
42.935690
35.48669000
139.078174.87453
00
32.3655816.631151.78430147.73973
0246978
000
176.21640
207.943900
66.432120000000
444.277300
536842476.31745
0000
84.4492700
91 74455CC
465.886800C
429.6124158.8878194.78412933 39
Zinc155.8144
00000
42.8466235.38402
04282131
204.60687.9544
143.00920
28.733860000
7.5426780
34.316864.7574827.52288
052.77508
000
119209879.93984
00
636808732.2839917.3077237.19258
04095 95
000
82669430
17.2026300
13314160000000
127.562900
4156199128.7857
0000
153.342100
84.687280C
16742810CC
143.204110280977540032310.46
Mass BankEroded/Second/
Bank-Linear-Foot
Kg/Sec/Ft
680E-06
6.80E-06
Mass of TailingEroded/Secondalong Reach
Kg/Sec
2.78E-02
1.25E-02
AverageBank-FullDischarge
cfs
,
l
/
515
|.
792
DischargeUsec
14584.8
22429.44
ErodedTailing
Suspended inRiver Water
KoA
190E-06
5.57E-07
Metals Kd Values (at ambient pH)Cadmium
115
"115
Copper
130
130
Lead
765
765
Zinc
75
75
Mass of Metal Released (mg) to Water per Kgof Tailing in River
Cadmium
0.91
0.98
Copper
1 90
"2733
Lead
3.22
T83
Zinc:
JI
;
-
!
(
53", f
111J
I
J
30.4
Dissolved Concentration (ug/L) increaseAlong Reach
Cadmium
0.002
0.00~1
Copper
0004
~" ^Tdoi
Lead
0.006
"6.002"
Zinc
0.103
0.017mg/sec increase in load for Reaches 1, 2 and 3 combine<
ug/L increase at end of Reach :
I
Mass LoadCadmium
253E-02
1.22E-02
mg/sec) Increase AlonCopper
526E-02
2.91 E-02874E-02J 1.55E-01
Lead
895E-02
4.78E-023.20E-01
j ReachZinc
1 50E*OC
~3.80E-6i4.61 E*0(
3.90E-03 691E-03 1 43E-02 206E-01
Table F-2Pane 2 of 2
APPENDIX G
Baseline Considerations
Baseline Considerations
Several non-mining related factors have historically impacted water, land, and associated
biological resources in the Upper Arkansas River Basin. Some of these factors may continue to exert
impacts on the environment today. The principal non-mining influences include flow regulation,
livestock grazing, highway and railroad impacts, and timber harvest.
Reach 0: Above California Gulch
Flow Regulation
Stream flow in this reach is augmented by water imported to both Tennessee Creek and the Upper
East Fork. Flow augmentation to Tennessee Creek occurs via the Ewing Ditch, Wurtz Ditch, and Wurtz
Ditch Extension, while the Upper East Fork receives flow augmentation from the Columbine Ditch (URS
1998). These ditches generally augment flows into the Upper Arkansas River by as much as 15-22 % of
the total streamflow. The most significant impact of flow regulation on natural river hydrology is as much
a result of patterns of release as the volume of water released. Rapid fluctuations in flows, for example,
will disrupt natural hydrological and geomorphological processes causing riverbank instability and
substantial sedimentation. While the Bureau of Reclamation attempts to minimize rapid fluctuations in
flows, URS (1998) reported a reduction in daily streamflow of more than 25% 270 times between 1970
and 1994. Currently, the Bureau of Reclamation is attempting to develop "ramping" rates for increasing
and decreasing flows. However, over the past three decades, flow augmentation in this reach has likely
had (not continuously but on various occasions) a significant impact on hydrological and
geomorphological processes in the Upper East Fork and Tennessee Creek.
A fundamental question is the extent to which flow regulation impacts abiotic and biotic
resources in riverine systems. Scheidegger and Bain (1995) studied larval fishes in the Tallapoosa River,
a highly flow-regulated river, and the Cahaba River, an unregulated river, in Alabama. Dominant
families were Catostomidae, Cyprinidae, Percidae, and Centrarchidae. Flow regulation appeared to: 1)
reduce the abundance of larval fish in nursery habitat; 2) alter taxonomic composition at the family level;
and 3) disrupt microhabitat relations seen in families occupying unregulated rivers.
Converse et al. (1998) studied subadult humpback chub (Gila cypha) densities along 24
kilometers of the Colorado River in the Grand Canyon. One of their objectives was to determine how
discharge, during base flow conditions, was related to subadult humpback chub habitat conditions. They
J:\010004\Task 3 - SCR\Appendices\App_G_Baseline.doc G-1
concluded the following: 1) habitat conditions varied significantly with discharge for certain shoreline
types; 2) mean shoreline depth and velocity increased with increasing discharge, whereas mean cover
decreased; 3) subadult chubs appear to quickly disperse and preferentially use specific shoreline types
along the river corridor, while avoiding others; 4) densities were highest in vegetated shorelines, followed
by talus and debris fan shorelines; and 5) consequently, higher base-flows, which occur a greater
proportion of the time in the current flow regime, may reduce subadult chub habitat quality in natural
habitats compared with base-flows during pre-dam conditions.
In addition to impacting fish populations and communities, flow regulation may also significantly
impact invertebrate abundance, on which salmonids typically depend for most of their diet. Blinn et al.
(1995) examined the effects of fluctuating discharge for lotic communities in the Colorado River below
Glen Canyon Dam. Some important conclusions included: 1) Periods of daily desiccation and freezing
during river fluctuation significantly limited community biomass and energy. The permanently
submerged channel supported a mean annual macroinvertebrate standing crop biomass 4 times that of the
varial zone. 2) Cladophora glomerata exhibited a 50% reduction in biomass after 2 days of repeated 12-
hour summer exposure. Five days of repeated exposure resulted in >70% reduction in C. glomerata and
>50% reduction in epiphyton biomass. The same trend continues for both algae and epiphyton biomass
with increased exposure and extreme water fluctuations. 3) Recolonization by C. glomerata, Gammarus
lacustris, and chironomid larvae was extremely slow (< 30% of controls after 4 months) compared with
gastropod densities (equaled control cobbles within 1 week) on resubmerged cobbles that were subjected
to long-term desiccation. Hence, two 12-hour exposure periods may require greater than 4 months for
recovery to achieve the mass of permanently submerged benthos. 4) Discharge maintained at 793 mVs is
estimated to provide nearly twice the energy in the form of macroinvertebrate biomass at Lees Ferry (15.5
ha) than flows of 142 mVs. Consequently, trout biomass was predicted to increase by 42.5 kg/ha at Lees
Ferry. 5) They emphasized that Gislason (1985) demonstrated that condition factors for salmon and
rainbow trout were higher during periods of stable discharge than during periods of fluctuating discharge
in the Skagit River, Washington. He attributed these differences to loss of shoreline insects and habitat
during the fluctuations.
Malmquist and Englund (1996) examined the effects of hydropower-induced flow regulation on
mayfly richness and abundance in north Swedish river rapids. Important conclusions included: 1) rivers
impacted by regulation for hydropower had significantly reduced species richness and abundance of
mayflies; 2) type of regime (unregulated, reduced flow, regulated but unreduced flow) significantly
influenced mayfly abundance, but not species richness; 3) heptageniids, baetids, ephemerellids and
Caenis rivulorum became less abundant in response to flow reduction, and there were clear species level
effects in response to flow regulation; 4) sites with high flow constancy, peaking flow, and reduced flow
J:\010004\Task 3 - SCR\Appendices\App_G_Baseline.doc G-2
had lowered abundance of most species in comparison with reference sites; and 5) of 20 species occurring
at both unregulated and regulated sites, 19 were significantly more common at the reference sites,
whereas only one was more common at sites of regulated (but unreduced) flow.
Zhang et al. (1998) examined ecological processes affecting community structure of blackfly
(Diptera: Simuliidae) larvae in 51 rapids of regulated and unregulated rivers in northern Sweden. Some
important findings include: 1) Sites with high species richness and abundance were characterized by large
numbers of small suspended particles (food resources), deep water color, high total phosphorus and
nitrogen concentrations, high proportions of forest in the catchment, low frequencies of large flow
increments, extended forest growth period, low cover of filamentous algae on the substratum, and low
altitude. 2) Simuliid species richness and the total abundance at reduced-flow, regulated, sites were 25%
and 50% higher, respectively than predicted. At regulated sites, the abundance of blackfly predators
(spinet given) decreased by 35%, and those of assumed competitors, grazers and net-spinning caddis
larvae, by 22% and 19%, respectively. 3) Particle concentrations were not significantly different between
unregulated and regulated sites and they were positively related to blackfly species richness and
abundance. 4) Results indicate that water flow changes greatly influence blackfly larvae. Predation
pressure and competition is reduced, and recolonization after disturbance is rapid. Simuliid communities
are a feature of disturbed sites and may be a useful indicator for evaluating the impact of flow regulation
on river ecosystems.
Cereghino and Lavandier (1998) studied the influence of hydropeaking on distribution and
population dynamics of mayflies in a mountain stream in the Pyrenees, France. They found that the
lowest density and biomass was downstream of the power plant, suggesting a significant impact of
hydropeaking on species abundance. For example, Rhithrogena semicolorata was abundant at all sites,
but its density was reduced by 50% downstream from the plant. Below the plant, the flushing action of
peaking flows substantially increased catastrophic drift effects on species abundance, with the greatest
impact in autumn when the difference between natural and peak flows was greatest.
Finally, Nelson and Roline (1995) conducted a literature review and limited Arkansas River field
studies in order to examine the impacts of various discharges on macroinvertebrate communities. General
indications were that benthic organisms in the Arkansas River would likely not be negatively impacted by
velocity increases up to 1 m/s. Higher flows and velocities, however, may negatively affect large bodied
stoneflies and the case building caddisfly, which is a major source of food for trout in the Arkansas River.
Data collected in the Arkansas River also indicated that increased flows causes a decrease in the
abundance of caddisflies Hydroptila and Brachycentrus, large bodied stoneflies, midges (Chironomidae),
and scrapers, such as the caddisfly Oligophlebodes. In contrast, Baetis mayflies and Hydropsyche
J:\0l0004\Task 3 - SCR\Appendices\App_G_Baseline.doc G-3
caddisflies appear fairly tolerant of higher flows. Some mayflies (Acentrella), the caddisfly Rhyacophila
coloradensis, and net-winged midges (Blephariceridae) appear to tolerate very high flows. Nelson and
Roline (1995) point out that strong negative impacts on invertebrate communities were associated with
flows at least 5 times greater than baseflows, and those that rapidly changed from high to low flows.
Concerns with regulated low flow impacts are likely not applicable to the Arkansas River.
Clearly, flow augmentation can substantially impact aquatic habitat conditions for both fish and
invertebrates, and can exert negative direct and indirect effects on their populations and communities. In
terms of Tennessee Creek and the Upper East Fork, it is likely that aquatic biota were detrimentally
impacted by flow augmentation on a sporadic rather than continuous basis. While substantial short-term
changes in biotic population and community structure and abundance likely occurred, it is not clear
whether or not they were impacted detrimentally over the long term.
Livestock Grazing
It is unclear whether or not livestock grazing has significantly impacted the Upper East Fork and
Tennessee Creek, although grazing does occur in Tennessee Park. The current vegetation community
structure, dense willow thickets mixed with open grassy areas, suggests that historically it did not
experience heavy livestock grazing.
Highway 24 and 91
Highway 24, traveling north from Leadville, crosses Upper East Fork, East Tennessee Creek,
Tennessee Creek, runs parallel to Tennessee Creek for approximately 2 miles before crossing West
Tennessee Creek, and continues north over the Continental Divide. This road heading north of Leadville
was in place by 1910 (CDOT 2000) and was paved by the mid-1950s. Available literature, although
scarce, suggests a strong association between unpaved roads and increased contributions of sediments to
watersheds (Myers and Swanson 1996). Because this segment of the highway crosses the mainstem and
three major tributaries to the Arkansas River north of Leadville, prior to paving the highway a significant
amount of sediment was likely to have washed into this upper portion of the Arkansas River. However, it
is unlikely that these contributions of sediment were substantial enough to cause any long-term effects on
water quality and stream biota. Secondly, because this reach of the river is more than four miles upstream
of the confluence of the Upper East Fork and Tennessee Creek, its impact on water quality and biota
would be effectively non-existent by the time it reached the mainstem below the confluence. Finally, any
sediment contributed to the river prior to paving the road would have been flushed from the system the
each spring.
J:\010004\Task 3 - SCR\Appendices\App_G_BaseIine.doc G-4
Highway 91 continues northeast out of Leadville, following the Upper East Fork floodplain. The
highway crosses the river about 2 miles upstream of the entry of Evans Gulch, continues north
approximately 0.25 miles west of the river, crosses Chalk Creek, and crosses the Upper East Fork just
0.66 miles southeast of Fremont Pass before continuing north and over the Continental Divide. Highway
91 existed as a dirt road (AKA "Leadville-Breckenridge road") at least since 1910 (CDOT 2000). In
1918, the State Highway Department had designated the Climax portion of the road as State Highway 91
(Voynick 1996 and CDOT 2000). As late as 1928 it remained an unimproved, rough, dirt track closed by
snow throughout the winter. By the early 1950s the highway was paved (Voynick 1996). Thus, the
Upper East Fork floodplain may have received a significant amount of sedimentation runoff from the
unimproved road until the early 1950s. It is important to bear in mind two things when considering
potential impacts: first, the dense willow and sagebrush vegetation in the Upper East Fork floodplain
between the highway and the stream provides a substantial buffer from sedimentation; and second,
because the road crosses the stream at only two points up the valley, and the roadway was paved by the
1950s, it seems unlikely that there would remain any long-term effects of sedimentation.
Railroad
The railroad north of Leadville heads up the Upper East Fork basin towards Climax, and stays
approximately 0.5 miles to the east of the river. The tracks finally cross the river in the extreme
northeastern corner of Lake County, 1 mile southeast of Fremont Pass in San Isabel National Forest, then
continues north over the Continental Divide into Summit County. The point of crossing is the only point
of potential impact of the railroad on the Upper East Fork. Considering the proximity of the railroad to
the river, it is unlikely that there is any significant impact on river water quality or associated aquatic
biota.
At the confluence of California Gulch, the western branch of the railroad tracks continues north
along the Arkansas River and Tennessee Creek. The tracks continue, on average, approximately 0.5
miles east of the river until reaching the confluence of Upper East Fork and Tennessee Creek. The tracks
cross Upper East Fork and continue for the next 1.25 miles in close proximity to Tennessee Creek.
Branching to the east, the tracks continue north, cross the East Fork of Tennessee Creek, and continue 3
miles north before crossing Tennessee Creek and continuing over the Continental Divide. All told, the
tracks travel in close proximity to Tennessee Creek for about 4 miles: 1.25 just above Upper East Fork,
and 2.75 just south of the entrance of West Tennessee Creek. To our knowledge, there is no literature
concerning the impacts of railroad tracks on river water quality or associated biota. The railroad was
completed July of 1880 (Voynick 1996), therefore the berm on which the tracks were built has had many
J:\010004\Task 3 - SCR\Appendices\App_G_Baseline.doc G-5
decades during which to settle. Sedimentation during the construction phase of the railroad likely had the
most significant impact on water quality and aquatic biota. Considering the decades since railway
construction and length of time for recovery of resources potentially impacted, it seems unlikely that there
are any remaining significant impacts due to the railroad bed.
Timber Harvest
It is difficult to determine the extent to which timber was harvested in the Upper East Fork
drainage or Tennessee Creek. Klima and Scherer (2000) point out that timber was a necessary
commodity of all mining practices, and by early in 1879 there were 30 sawmills employing about 1000
men in the Leadville area. Without more information concerning patterns of timber harvest (currently
being investigated by the Leadville Ranger District of the U.S. Forest Service), impacts to water quality
and aquatic biota are difficult to assess. It is important to note, however, that the trees making up the
forests in both river valleys are 75-125 years old. Thus impacts due to silvicultural practices, such as
sedimentation, have not been present for at least three quarters of a century, and perhaps longer.
Therefore, it is unlikely that timber harvest has contributed to negatively impact the natural resources in
either valley for decades.
Reach 1: California Gulch to Lake Fork
Flow Regulation
The effects of flow augmentation for this reach will be very similar to Reach 0 since there are no
additional sources of water augmentation below that for Tennessee Creek. Because this segment of the
river is further downstream, effects would be reduced compared with Reach 0. Therefore, it seems
unlikely that flow augmentation exerts any significant influence on this portion of the Arkansas River
beyond that mentioned for Reach 0.
Livestock Grazing
Klima and Scherer (2000) noted that Mexican settlers maintained cattle and sheep ranches on the
Arkansas River as early as the 1830s, and that Colorado experienced a livestock boom as ranching
became a formidable industry throughout the 19th century. As late as 1929 there were 8,800 cattle and
horses and 102,328 sheep grazing on National Forests in the Leadville area; these numbers dropped to
758 cattle and 11,000 sheep in 1944 in the Leadville District of the San Isabel National Forest (Klima and
Scherer 2000). Klima and Scherer (2000) further note that during the 1800s to the early 1900s
J:\010004\Task 3 - SCR\Appendices\App_G_Baseline.doc G-6
overgrazing by livestock had occurred over much of the grass-shrub area. Because this segment of the
Arkansas River is in such close proximity to the highly populated Leadville and California Gulch, it is
likely that it received heavy use by cattle and sheep.
Through an extensive literature review, Fitch and Adams (1998) report on the interrelationship of
livestock grazing and the health of riparian habitats and associated fish and wildlife. The authors first
note that grassland and riparian ecosystems and associated fish and wildlife have evolved with use by
grazing ungulates, most notably bison. The grazing strategy of bison was likely to disperse throughout
various landscape types, unlike domestic livestock that have an affinity for water and tend to linger for
long periods around riparian habitats. In pre-settlement, there was grazing followed by a period of rest,
and prairie riparian communities evolved under such a regime for millennia.
Fitch and Adams (1998) point out that unmanaged livestock grazing (i.e., releasing livestock into
an area without any planned riparian growing season rest or measures designed to protect vegetation
health along the stream or on its floodplain) appears to always result in overuse of riparian areas,
impairment of plant species vigor, and physical damage to the channel and banks. They noted that if
livestock were allowed to freely graze, they would spend a disproportionate amount of time in riparian
areas — 20 to 30 times longer than expected based on the limited extent of the riparian area. Kauffman
and Krueger (1984) reviewed 64 papers, Platts (1991) reviewed 21 papers, and Ohmart (1996) reviewed
similar references including 30 newer works. Fitch and Adams summarized the results of these three
authors and concluded that inappropriate livestock management results in overuse and subsequent
degradation of riparian and stream systems in the following ways:
• There are effects on stream channel morphology, the shape and quality of the water
column, and soil stability and structure in the riparian zone. Streams become laterally or
vertically unstable. The water column is altered by increasing water temperatures,
nutrients, and suspended sediments, and by altering timing and volume of flow. Soil
compaction on the floodplain from hoof action decreases infiltration rates and leads to
increased runoff and accelerated erosion and sedimentation rates.
• There are considerable effects on vegetation, resulting in decreased vigor and biomass,
and an alteration of species components, especially trees and shrubs.
• There are decreases in fish and wildlife species numbers following overgrazing of
riparian areas.
Belsky et al. (1999) summarized peer-reviewed empirical papers and reviews of the biological
and physical effects of livestock on Western rivers, streams, and associated riparian areas. Where there
J:\010004\Task 3 - SCR\Appendices\App_G_Baseline.doc G-7
was a paucity of data, non-peer-reviewed reports also were used, usually from government documents or
symposia. All conclusions were based on what seemed to be the consensus of experts in the field. The
following summaries for fish, invertebrates, and various aspects of riparian and instream habitat were
extracted from a more complete summary table in Belsky et al. (1999).
Fish
Higher water temperatures increase salmonid mortality by breaking down physiological
regulation of vital processes such as respiration and circulation, and negatively affect fish spawning,
rearing, and passage. Greater water turbidity, increased siltation and bacterial counts, lower summer
flows, low dissolved oxygen in the water column, and intragravel environment reduce fish survival.
Damage to spawning beds, less protective plant cover, fewer insects and other food items, stream bank
damage, decreased hiding cover, and reduced resistance to water-boumed diseases all contribute to fish
mortality. All lead to a loss of salmonids and other cold-water species, loss of avian and mammalian
predators, and replacement of cold-water, riparian species with warm-water species.
Invertebrates
Higher water temperatures from loss of shade, lower dissolved oxygen, and increased fine
sediments reduce plant detritus, while increasing algal biomass for food. These factors cause loss of
invertebrate species that require cleaner and colder waters and coarser substrates, increase in algae
feeders, fewer palatable species, less food for higher trophic levels, and reduced litter breakdown.
In terms of water quality, grazing generally caused an increase in nutrient concentrations,
bacterial protozoa, sediment load and turbidity, and water temperature. Regarding stream channel
morphology, there was an increase in channel depth, width, and fine sediments, and a decrease in channel
stability during floods, streambank stability, number and quality of pools, and quality and quantity of
streambank undercuts. Effects on hydrology include increased overland flow, peak flow, and floodwater
velocity, a decrease in summer and late-season flows, and a reduced water table. Instream vegetation is
generally impacted by an increase in algae and a decline in abundance of higher plants (submersed and
emergent). Streambank vegetation generally experiences a decline in herbaceous cover, biomass,
productivity, and native diversity. Declines are also noted for overhanging vegetation and tree and shrub
biomass and cover. Vegetation structure becomes simplified, plant age-structure becomes even-aged, and
plant succession impeded. In terms of riparian zone soils, there is an increase in bare ground, erosion
(wind, water and ice) and compaction, and a decrease in litter layer, infiltration, and fertility.
J:\0 l0004\Task 3 - SCR\Appendices\App_G_Baseline.doc G-8
Rothrock et al. (1998) examined land use patterns and biointegrity in the Blackfoot River
watershed of Montana. Benthic macroinvertebrate samples were collected in August 1995 to examine the
linkage between land use, water quality, and aquatic biointegrity in seven tributaries of the Blackfoot
River watershed, Montana. The tributaries represented silvicultural (timber harvesting), agricultural
(irrigated hay and livestock grazing) and wilderness land uses. The wilderness stream had the highest
aquatic biointegrity. Two agricultural streams had the largest estimated soil erosion and sediment
delivery rates, the greatest habitat impairment from nonpoint source pollution, and the most impoverished
macroinvertebrate communities. It was clear that livestock grazing had the largest negative impact on
stream health; however, timber harvesting also had significant negative impacts on soil erosion and
sediment transport.
Given the clearly documented impacts of livestock grazing on riverine habitats, an important
question is to what extent these systems, once significantly impacted, recover ecologically. Myers and
Swanson (1996) studied long-term aquatic habitat restoration on Mahogany Creek, Nevada. Livestock
was excluded from the heavily grazed Mahogany Creek watershed from 1976 to 1990 while rotation of
rest grazing on its tributary, Summer Camp Creek, was allowed. Both streams improved since 1976 after
cessation of heavy, season-long grazing. Stability and tree cover increased while sedimentation decreased
regardless of grazing treatment. Myers and Swanson (1996) suggest this illustrates that long-term
recovery is consistent with rotation of rest grazing where rest occurred nine of 14 years. However, the
streambank stability decrease due to flooding after two years of grazing suggests that additional rest for
Summer Camp Creek at the beginning of the study may have been necessary. Sheep grazing after several
additional years of recovery did not apparently have detrimental effects on Summer Camp Creek.
Some variables did not improve due to other management practices, initial conditions, or climatic
perturbations. For instance, fine sediment decreased overall, but accumulations during low flow
coincided with roads that act as a source of and conduit for fine sediments. Significant improvements to
these streams may result from a reduction in roads and crossings.
Brejda (1997) examined changes in chemical and physical properties of soil following 18 years of
protection from grazing in an Arizona chaparral. Important conclusions were: 1) results indicated higher
levels of silt and clay, increased concentrations of organic C, total N, and soluble bases, and a reduction in
bulk density with 18 years of protection from grazing; 2) differences in the concentrations of organic C,
total N, and soluble bases indicate that some recovery in soil fertility has occurred with 18 years of
protection from grazing. However, there has been no recovery of perennial grasses and forbs in the
openings between the chaparral shrubs; 3) changes in soil physical and chemical properties following
disturbance may be species dependent; and 4) improvements in soil physical and chemical properties
within the exclosure did not result in large increases in plant biomass in the bioassay, indicating that they
J:\010004\Task 3 - SCR\Appendices\App_G_Baseline.doc G-9
provided only a small increase in nutrient availability to plants. Furthermore, a very heterogeneous
pattern in soil properties, characterized by large differences between soils under shrub canopies compared
to open areas between shrubs, was evident within the exclosure and in the grazed area, indicating the
presence of a degraded ecosystem. Thus, it was concluded that the improvements in soil properties
observed within the exclosure represent only an upward trend within a stable new threshold of lower
productivity, not a slow return to a climax of more homogeneous and greater soil fertility. The slow
recovery in soil properties and herbaceous vegetation observed at this site suggests that significant
improvement in site productivity will not occur on a practical time scale without substantial intervention
by land managers.
Similarly, Yates et al. (2000) examined grazing effects on plant cover, soil, and microclimate in
Australian woodlands, discussing important implications for restoration. Vegetation and soil surveys were
conducted in three woodlands with a history of regular grazing, and in three woodlands with a history of
little or no grazing. Grazing was associated with a decline in native perennial cover, an increase in exotic
annual cover, reduced litter cover, reduced soil cryptogam cover, loss of surface soil micro topography,
increased erosion, changes in the concentrations of soil nutrients, degradation of surface soil structure,
reduced soil water infiltration rates, and changes in near ground and soil microclimate. Rates of soil
water infiltration in heavily grazed woodlands were half that in rarely grazed/ungrazed woodlands.
Furthermore, soils in the grazed woodland were significantly warmer than in the ungrazed woodland with
temperatures exceeding 40° C in the summer. This was likely due to loss of foliage and litter cover
leading to an increase in the exposure of the soil surface to radiation and compaction, facilitating the rapid
conduction of heat through the soil, and resulting in higher daytime and lower night-time temperatures.
The loss of foliage and litter cover and increased daytime temperatures were likely to cause an increased
loss of water through evaporation from the soil surface.
In terms of restoration, Yates et al. (2000) conclude that livestock grazing changes conditions and
disrupts the ecosystem regulatory processes, causing a loss of scarce resources from within remnant
woodlands ~ resources which maintain the natural biological diversity unique to these woodlands.
Consequently, attempts to restore plant species diversity and community structure in degraded woodlands
are unlikely to succeed without the repair of the dysfunctional ecosystem processes. An essential
component of restoration will be strategies that capture resources, increase their retention, and improve
microclimate in remnant woodlands.
Clearly livestock grazing may have substantial, and sometimes irreversible, impacts on aquatic
ecosystems and associated biota. If recovery is possible, it may take decades for these systems to regain
ecosystem functions responsible for their long-term viability as suitable habitat for fish, wildlife and
J:\010004\Task 3 - SCR\Appendices\App_G_Baseline.doc G-10
plants. While livestock grazing has doubtlessly impacted this stretch of the Arkansas River valley
historically, livestock interests in this area have greatly diminished over the past several decades. Most
likely, since they have received no known aids to restoration, these once overgrazed areas have recovered
to a somewhat less productive state than they were originally.
Highway 24
There are approximately 4 miles (6400 meters) of railroad tracks and approximately 3.5 miles
(4947 meters) of Highway 24 running through the designated 500-year flood plain of the 11-mile reach.
The maximum distance between the river and Highway 24 is 3257 feet (987 meters), and between the
river and railroad track is 2303 feet (698 meters). Both the Highway and railroad tracks cross the river at
some point. The highway first meets the 500-year flood plain, and could potentially have a constraining
influence, acting as a hydraulic barrier to the river, approximately 1500 feet north of the Highway 24
Bridge. Consequently, it is not likely that Highway 24 has had any significant impact on aquatic
resources associated with the Arkansas River in this reach.
Railroad
The railroad track extends south about 3 miles, located approximately 0.5 mile east of the eastern
edge of the designated 500-year floodplain, before intersecting the Arkansas River. Consequently, the
railroad tracks likely have had no significant impact on this stretch of the river.
Timber Harvest
This reach of the Arkansas River valley was heavily used historically in terms of agricultural and
livestock production, and it is likely that substantial timber harvest took place as well. Klima and Scherer
(2000) reported that during the 1800s to the early 1900s much of the mixed conifer was harvested and
burned, surface soils were severely disturbed leaving them susceptible to erosion, and, in many areas, the
only tree species that regenerated were lodgepole pine or aspen. However, Klima and Scherer (2000)
point out that the BLM and USFS determined that following this heavy-impact mining era, fire
suppression, reforestation, and traditional timber management practices have lead to a successful recovery
of much of the forested area.
J:\010004\Task 3 - SCR\Appendices\App_0_Baseline.doc G-11
Reach 2: Lake Fork to Highway 24 Bridge
Flow Regulation
In addition to flow augmentation mentioned above for Reach 0, substantial flow augmentation to
the Arkansas River occurs via Lake Fork Creek south of Turquoise Lake. Turquoise Lake is augmented
by water transported from the Colorado River Basin by the Homestake Tunnel, the Boustead Tunnel, and
the Busk-Ivanhoe Tunnel. Flow augmentation on Lake Fork and Lake Creek has dramatically increased
flood events, resulting in substantial flood events (1965, 1970, 1972, and 1978) that did not occur on
adjacent non-regulated streams (URS 1998). During 1993, 80% of the time flows released from
Turquoise Lake were increased 50-90% by flow augmentation.
Consequently, this reach of the Arkansas River has been substantially impacted by flow
regulation for the past several decades, and will continue to be impacted in the future. Potential impacts
associated with flow regulation to abiotic and biotic components of riverine ecosystems apply to this
section of the Arkansas River as well. Flow regulation can greatly impact aquatic habitat conditions for
fish and invertebrates, and can exert negative direct and indirect effects on their populations and
communities. In terms of this section of the Arkansas River, it is likely that water quality and aquatic
biota were detrimentally impacted by flow regulation on a less sporadic basis than in Reaches 0 and 1,
although not on a continuous basis. The impacts of flow regulation to population and community
characteristics of biota within this reach have likely had a more long-term effect than for the reaches
above; however, the discontinuous nature of extremely high flow augmentations over the years suggests
that fish and macroinvertebrate populations and communities experience infrequent displacement
downstream. When displacement does occur, healthy source populations upriver likely will recolonize
within 90 days, but may take as long as up to a year under extremely high flow augmentation conditions.
Nevertheless, it seems likely that except on rare occasion, biotic communities will be able to bounce back
after perturbations associated with flow regulation.
Livestock Grazing
It is difficult to separate this reach from that of Reach 1 in terms of impacts due to livestock
grazing. Based on historical accounts of livestock grazing in the Arkansas River valley in the Leadville
area in general (Klima and Scherer 2000), this reach was likely occupied by large cattle and/or sheep
ranches and experienced substantial overgrazing not significantly different from Reach 1. This area
currently experiences low to high density cattle grazing. Uncontrolled grazing coupled with flow
augmentation and the presence of mine-waste deposits has led to eroding streambanks in some reaches of
J:\010004\Task3- SCR\Appendices\App_G_Baseline.doc G-12
this section. However, in 1999, the Lake County Soil Conservation District and the Natural Resource
Conservation Service initiated a riparian fencing and rotational grazing program on portions of this reach.
Highway 24
The first point at which the highway meets the 500-year flood plain, and could potentially have
any sort of constraining influence, acting as a hydraulic barrier to the river, is approximately 1500 feet
north of the Highway 24 Bridge. The natural flow of the river would likely take it across the highway
approximately 500 feet north of the bridge.
Railroad
The railroad track first enters the designated 500-year floodplain approximately 3 miles
downstream of the confluence with California Gulch, where it cuts almost due south through the middle
of the floodplain. For about 2000 feet, while traveling within the designated floodplain, it appears that the
railroad track has acted as a hydrological barrier, constricting the path of the river to the western side
along the track. Although the track travels within the designated floodplain for .5 miles, it travels along
the eastern edge for about .33 miles before entering at the north, and travels along the western edge of the
marked floodplain boundary for approximately .66 miles after exiting the marked boundary just south of
the Highway 24 bridge. Because the marked boundary is an arbitrary designation with the floodplain
extending well beyond this conservatively marked perimeter along much of its length, this entire length
(.5 + .33 + .66 miles) was included in the distance the track travels within the designated 500-year flood
plain.
Timber Harvest
Similar to the impacts of livestock grazing for this reach, the impacts of timber harvest do not
substantially differ from those experienced by Reach 1. That is, historically, the upper portion of the 11-
mile reach of the Arkansas River valley, closest to Leadville and, therefore, mining and smelting
operations, was likely heavily logged throughout the 1800s and early 1900s, until recovery took place
through a series of management practices implemented by the BLM and the USFS. It is likely that this
reach has long since recovered from these early silvicultural practices that seriously impacted ecosystem
function.
J:\010004\Task3-SCR\Appendices\App_G_Baseline.doc G-13
Reach 3: Highway 24 Bridge to Constriction Downstream of County Road 55
Flow Regulation
As mentioned under Reach 2, substantial flow augmentation to the Arkansas River occurs south
of Turquoise Lake via Lake Fork Creek. There is no additional source of flow augmentation between
Highway 24 bridge and County Road 55. Therefore, this reach should not significantly differ from Reach
2 with respect to impacts of flow regulation. Impacts may be slightly less since sediments contributed to
the Arkansas River at the confluence with Lake Fork would have had more opportunity to settle out,
improving water quality as one goes further downstream from the major initial source of sedimentation.
However, extremely high flows will contribute sediments in this reach, and will displace
macroinvertebrates and fish as in Reach 2.
Consequently, this reach of the Arkansas River has been substantially impacted by flow
regulation for the past several decades, and will continue to be impacted in the future. It seems likely
that, except on rare occasion, biotic communities will be able to recover following perturbations
associated with flow regulation.
Livestock Grazing
It is difficult to differentiate this reach from that of Reaches 1 or 2 in terms of impacts due to
livestock grazing. Historical accounts of livestock grazing in the Arkansas River valley in the Leadville
area in general suggest that this reach was likely occupied by large cattle and sheep ranches and
experienced substantial overgrazing not significantly different from Reaches 1 and 2. In recent history,
this segment has received moderate to high density grazing. Much of this segment is currently under a
riparian fencing and rotational grazing program. Unrestricted livestock grazing, augmented flows, and
mine-waste-deposits have created highly erodible banks in some portions of this segment.
Highway 24
Approximately 1500 feet south of the Highway 24 bridge, the highway exits the 500-year flood
plain and extends southward for approximately 2 miles before re-entering the western edge of the
floodplain. It then runs parallel to the western edge of the floodplain for approximately 4500 feet, but
does not appear to have any constraining influence. The point at which Highway 24 re-enters the
floodplain on the western edge and could possibly act as a hydraulic barrier, thus constraining the river, is
J:\010004\Task 3 - SCR\Appendices\App_G_Baseline.doc G-14
approximately .5 miles south of County Road 55 at Kobe. At this point, natural topography forces the
highway and river close together for a few hundred feet, after which the flood plain re-opens.
Railroad
The track extends due southeast of the Highway 24 Bridge, and re-enters the 500-year flood plain
approximately .5 miles north of County Road 55 at Kobe. Until the narrow constriction of the floodplain
due to natural topography, the track runs along the western edge of the floodplain about .5 miles south of
County Rd. 55 and does not appear to constrict the path of the river.
Timber Harvest
It is likely that timber harvesting in this reach, in contrast with Reaches 1 and 2, was less intense
and damaging to the Arkansas River resources. Because local soil conditions begin to change in terms of
soil moisture, forests local to Reach 3 are comparatively sparse and sagebrush more dominant compared
with Reach 1 and 2 upstream. While it is possible that significant timber harvest did occur in the reach, it
seems highly unlikely that ecological impacts historically were as significant as further upstream. It is
unlikely, therefore, that impacts to this reach by timber harvest were significant sources of ecological
degradation.
Reach 4: Constriction Downstream of Cty. Rd. 55 to Two-Bit Creek
Flow Regulation
There is no additional source of flow augmentation between County Road 55 and Two-Bit Creek.
Therefore, impacts are likely less in this reach compared with Reach 3 since sediments contributed to the
Arkansas River at the confluence with Lake Fork would continue to settle out, and water quality would
continue to improve downstream from the initial source of sedimentation. It seems likely that, except onuunuuuc iu luipiuvc uuwiiaucmu uuiu uie miuai auui^c ui bcumicuicuiuii. n seems luiciy u
rare occasion during extremely high flow augmentation, biotic communities will be able to
following perturbations associated with flow regulation.
recover
Livestock Grazing
It is likely that this reach experienced historical livestock grazing impacts similar to Reach 1-3.
In recent history, this segment has received moderate to high density grazing. Much of this segment is
currently under the riparian fencing and rotational grazing program described above. Unrestricted
J:\010004\Task 3 - SCR\Appendices\App_G_Baseline.doc G-15
livestock grazing, augmented flows, and mine-waste deposits have created highly erodible banks in some
portions of this segment.
Highway 24
Although the flood plain widens again just south of the constriction at Kobe, both the highway
and railroad tracks run parallel the western edge of the flood plain. While the river meanders along the
eastern edge of the floodplain, apparently unconstrained, for the next 1.5-2 miles, historically, it is
possible that the highway and/or the railroad tracks constrained the river to the eastern portion of the
floodplain, acting as hydraulic barriers. It is not clear by examining the aerial photos whether or not the
river could flow to the western side of the highway or railroad tracks.
Railroad
South of the narrow constriction the track continues to run parallel to Highway 24 for about 1.5
miles, along the western edge of the floodplain to the end of the 11-mile reach. As mentioned above,
historically, it is possible that the highway and/or the railroad tracks constrained the river to the eastern
portion of the floodplain acting as hydraulic barriers—although aerial photos reveal no such evidence.
J:\010004\Task 3 - SCR\Appendices\App_G_Baseline.doc G-16
LITERATURE CITED
Belsky, A.J., A. Matzke, and S. Uselman. 1999. Survey of livestock influences on stream and riparianecosystems in the western United States. Journal of Soil and Water Conservation 54: 419-431.
Blinn, D. W., J. P. Shannon, L. W. Stevens, and J. P. Carder. 1995. Consequences of fluctuatingdischarge for lotic communities. Journal of the North American Benthological Society 14(2):233-248.
Brejda, J.J. 1997. Soil changes following 18 years of protection from grazing in Arizona chaparral. TheSouthwestern Naturalist 42:478-487.
Cereghino, R. and P. Lavandier. 1998. Influence of hypolimnetic hydropeaking on the distribution andpopulation dynamics of Ephemeroptera in a mountain stream. Freshwater Biology 40:385-399.
Colorado Department of Transportation (CDOT). 2000. Personal Communication. Denver, CO.
Converse, Y. K., C. P. Hawkins, and R. A. Valdez. 1998. Habitat relationships of subadult humpbackchub in the Colorado River through Grand Canyon: spatial variability and implications of flowregulation. Regulated Rivers: Research & Management 14:267-284.
Edwards, E. D. and A. D. Huryn. 1996. Effect of riparian land use and contributions of terrestrialinvertebrates to streams. Hydrobiologia 337:151-159.
Fitch, L and B.W.Adams. 1998. Can cows and fish co-exist? Canadian Journal of Plant Science 78: 191-198.
Gislason, J. C. 1985. Aquatic insect abundance in a regulated stream under fluctuating and stable dielflow patterns. North American Journal of Fisheries Management 5:39-46.
Kauffman, J.B. and Krueger, W.C. 1984. Livestock impacts on riparian ecosystems and streamsidemanagement implications: a review. Journal of Range Management 37: 430-438.
Klima, K., and B. Scherer. 2000. DRAFT: Baseline Ecosystem Setting Characterization of the LeadvilleArea. Natural Resource Management Department, Colorado Mountain College. Leadville, CO.
Malmquist, B. and G. Englund. 1996. Effects of hydropower-induced flow perturbations on mayfly(Ephemeroptera) richness and abundance in north Swedish river rapids. Hydrobiologia 341:145-158.
Myers, TJ, and S. Swanson. 1996. Long-term aquatic habitat restoration: Mahogany Creek, Nevada, as acase study. Water Resources Bulletin 32:241-252.
Nelson, S. M., and R. A. Roline. 1995. Aquatic Macroinvertebrate Communities and Probable Impacts ofVarious Discharges, Upper Arkansas River. U.S. Department of the Interior, Bureau ofReclamation. Technical Memorandum No. 8220-95-4.
Ohmart, R. D. 1996. Historical and present impacts of livestock grazing on fish and wildlife resources inwestern riparian habitats. In P.R.Krausman (ed.) Rangeland Wildlife. The Society for RangeManagement, Denver, CO.
Penczak, T. 1995. Effects of removal and regeneration of bankside vegetation on fish populationdynamics in the Warta River, Poland. Hydrobiologia 303:207-210.
J:\010004\Task 3 - SCR\Appendices\App_G_Baseline.doc G-17
Platts, W.S. 1991. Livestock grazing. In W.R.Meehan (ed.) Influences of forest and rangelandmanagement on salmonid fishes and their habitats. American Fisheries Society, Bethesda, MD.Special Publication 19.
Rabeni, C. G., and M. A. Smale. 1995. Effects of siltation on stream fishes and the potential mitigatingrole of buffering riparian zone. Hydrobiologia 303:211-219.
Rothrock, J.A., P.K. Barten, and G.L. Ingman. 1998. Land use and aquatic biointegrity in the BlackfootRiver watershed, Montana. Journal of the American Water Resources Association 34:565-581.
Scheidegger, K. J., and M. B. Bain. 1995. Larval distribution and microhabitat use in free-flowing andregulated rivers. Copeia 1: 125-135.
URS Operating Services, Inc. 1998. Fluvial Geomorphologic Assessment of Upper Arkansas River. By:Inter-Fluve, Inc., Bozeman, MT, and FLO Engineering, Inc., Breckenridge, CO.
Voynick, S.M. 1996. Climax: the History of Colorado's Climax Molybdenum Mine. Mountain PressPublishing Company, Missoula, MT.
Yates, C. J., D. A. Norton, and R. J. Hobbs. 2000. Grazing effects on plant cover, soil and microclimate infragmented woodlands in southwestern Australia: implications for restoration. Austral Ecology25:36-47.
Zhang, Y., B. Malmquist, and G. Englund. 1998. Ecological processes affecting community structure ofblackfly larvae in regulated and unregulated rivers: a regional study. Journal of Applied Ecology35:673-686.
J:\010004\Task 3 - SCR\Appendices\App_G_Baseline.doc G-18
APPENDIX H
Upper Arkansas River Mine-Waste Deposit Ranking
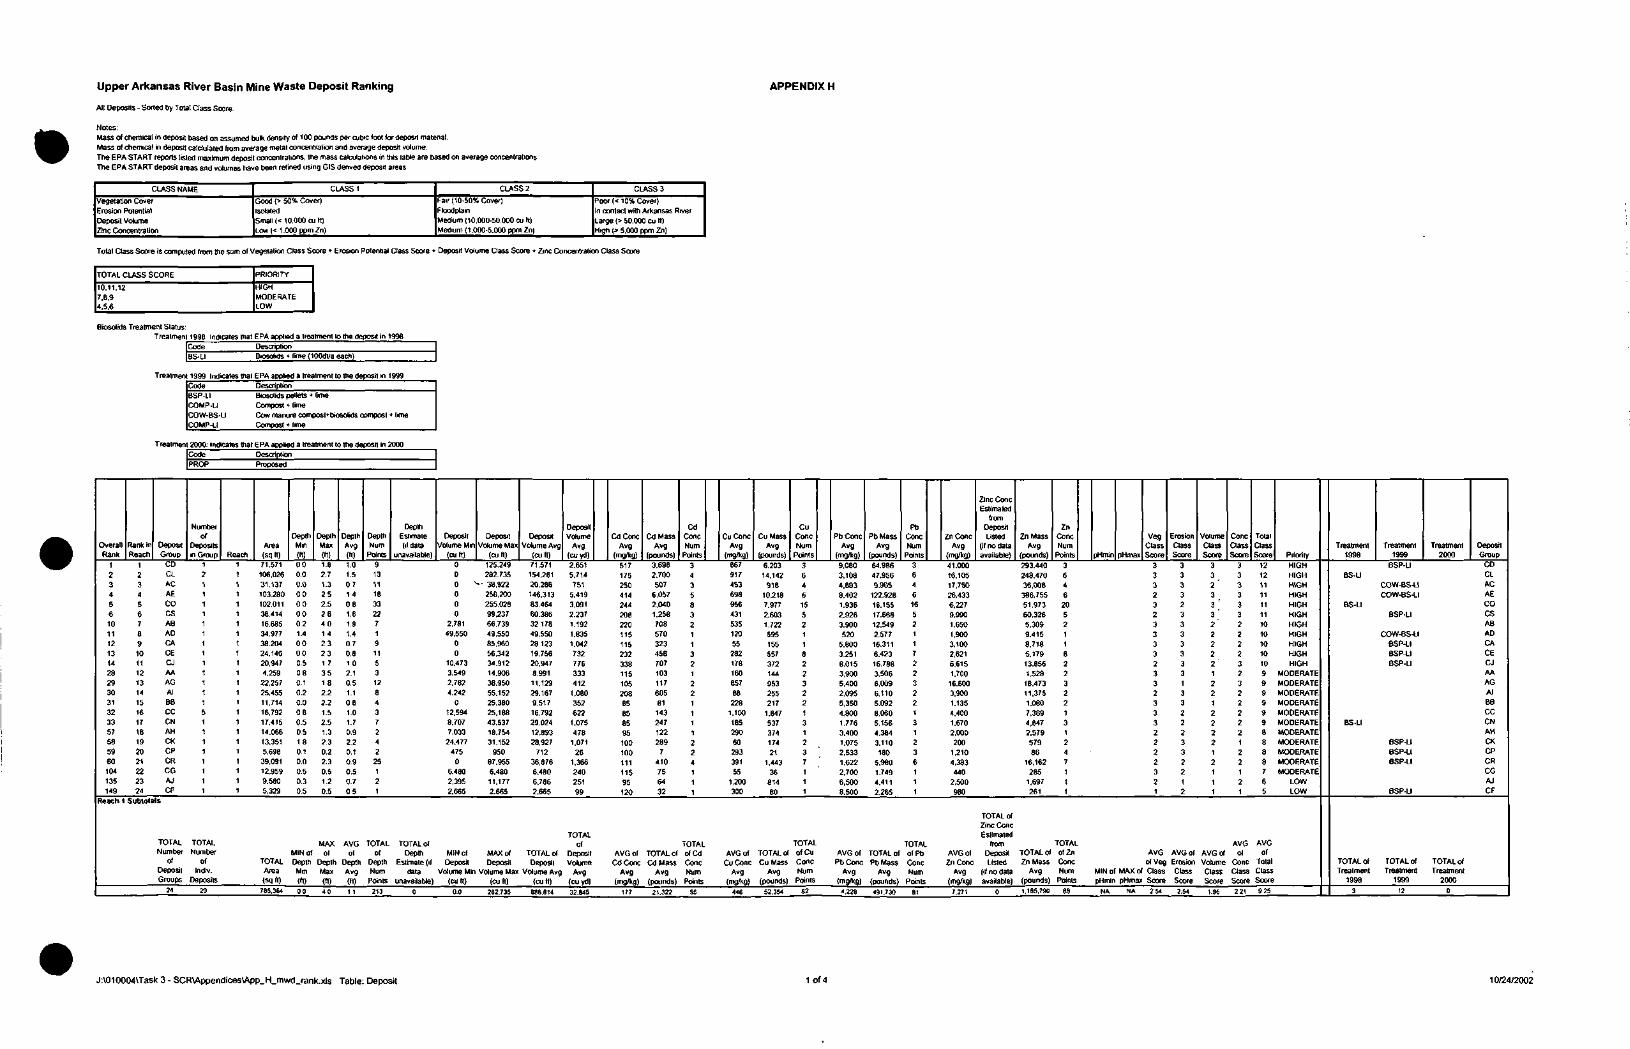
Upper Arkansas River Basin Mine Waste Deposit Ranking
All Deposits - Sorted by Total Class Score.
Notes:Mass of chemical in deposit based on assumed bulk density of 100 pounds per cubic fool for deposit matenal.Mass of chemical in deposit calculated from average metal concentration and average deposit volume.The EPA START reports listed maximum deposit concentrations, the mass calculations in this table are based on average concentrationsThe EPA START deposit areas and volumes have been refined using CIS derived deposit areas
APPENDIX H
CLASS NAME
Vegetation CoverErosion PotentialDeposit VolumeZinc Concentration
CLASS 1
Good (> 50% Cover)IsolatedSmall (< 10.000 cu h)Low (< 1 .000 ppm Zn)
CLASS 2
Fair (10-50% Cover)Flood plainMedium (10.000-50.000 cu It)Medium (1.000-5.000 ppm Zn)
CLASS 3
Poor(< 10% Cover)In contact with Arkansas RiverLarge (> 50.000 cu ft)High (> 5,000 ppm Zn)
Total Class Score Is computed from the sum of Vegetation Class Score + Erosion Potential Class Score + Deposit Volume Class Score + Zinc Concentration Class Score
TOTAL CLASS SCORE
10,11,127,8.94,5.6
PRIORITY
HIGHMODERATELOW
Biosolids Treatment Status:Treatment 1998 indicates that EPA applied a treatment to the deposit in 1998
DescriptionBiosolids * lime (100dl/a each)
Treatment 1999 Indicates that EPA applied a treatment to Hie deposit in 1999CodeBSP-LICOMP-LICOW-BS-LICOMP-LI
DescriptionBiosolids pellets * limeCompost + limeCow manure compost+biosolids compost + limeCompost + lime
Treatment 2000: Indicates that EPA applied a treatment to the deposit in 2000
OverallRank
123456101112131428293031323357585960104135149
Rank inReach
123456789101112131415161718192021222324
DepositGroup
CDCLACAECOCSABADCACECJAAAGAlBBCCCNAHCKCPCRCGAJCF
CodePROP
Numberof
Depositsin Group Re
12111111111
DescriptionProposed
Areaach (sq ft)
71.571106.02631.137103.280102.01138.41416.68534.97738.20424.14620.947
1 1 4.2591 22,2571 1 25,45515111
11,71416.79217.41514.06613.351
1 5.69839.09112.9599.5805.329
DepthMm(ft)000.00.00.000000.21.40.0000.5080.10.20.00.80.5051 80.10.00.50.30.5
DepthMax(ft)1.8271.32.52.5264 01 423231.7351 82.22.21.5251.32 30.22.30.5120.5
DepthAvg
(ft)1.01.5071.4081.61.91.40.70.81.02.10.51.10.81.01.70.92.20.10.90.50.70.5
DepDepth EstimNum (if da
Points unavai91311183322719115312843724225121
thate Depositta Volume Mmable) (cu ft)
000000
2,78149.550
00
10.4733.5492,7824,242
012.5948,7077.033
24.4774750
6.4802.3952.665
DepositVolume Max
(cuft)125.249282.735
-• 38,922258.200255.02899.23766.73949.55085.96056,34234.91214.90638.95055.15225.38025.18843,53718.75431.152
95087.9556,48011,1772,665
DepositVolume Avg
(cuft)71.571154.28120.286146.31383.46460.3863217849.55028 12319.75620.9478.99111.12929.1679.51716.79229.02412.89328.927
71236,8766.4806.7862.665
DepositVolume
Avg(cuyd)2.6515.714751
5.4193.0912.2371.1921.8351.042732776333412
1.080352622
1.075478
1,07126
1,36624025199
CdConcAvg
(mg/kg)5171752504142442082201151152323381151052088585859510010011111595120
CdMassAvg
(pounds)3.6982.700507
6.0572.0401.258708570323458707103117605811432471222897
410756432
CdConeNum
Points343583211321221111224111
Cu ConeAvg
(moAg)8679174536989564315351205528217816085788228
1.1001852906029339155
1.200300
Cu MassAvg
(pounds)6.20314.142
91810.2187.9772.6031.722595155557372144953255217
1,84753737417421
1,44336
81480
CuConeNum
Points3646155211822322131237111
PbConcAvg
(mg/kg)9,0803.1084,8838.4021,9362.9263,900520
5.8003.2518,0153.9005.4002,0955,3504,8001.7763,4001.0752.5331.6222.7006,5008.500
PbMassAvg
(pounds)64.98647.9569,905
122.92816.15517.66812,5492.57716.3116.42316.7883.5066.0096.1105.0928.0605.1564.3843.110180
5.9801.7494.4112.265
PbConeNum
Points3646165211722322131236111
ZnConcAvg
(mg/kg)41.00016.10517.75026,4336,2279.9901.6501,9003,1002,6216.6151,70016.6003,9001,1354,4001,6702.000200
1.2104.383440
2.500980
Zinc ConeEstimated
fromDepositListed
(if no dataavailable)
Zn MassAvg
(pounds)293.440248,47036,008386.75551.97360,3265,3099,4158.7185.17913,8561.528
18,47311,3751.0807.3894.8472,57957986
16,162285
1.697261
ZnConeNum
Points pHrr3646205211822322131247111
vegClass
in pHmax Score333232333323323332222321
ErosionClassScore
333323333333133222332212
VolumeClassScorti
332 '3 t
3 '3 "222221221222212111
ConeClassScore
333333222232322222122121
TotalClassScore
12121111111110101010109999998888765
PriorityHIGHHIGHHIGHHIGHHIGHHIGHHIGHHIGHHIGHHIGHHIGH
MODERATEMODERATEMODERATEMODERATEMODERATEMODERATEMODERATEMODERATEMODERATEMODERATEMODERATE
LOWLOW
Reach 1 Subtotals
TOTALNumber
ofDepositGroups
24
TOTALNumber
ofIndiv.
Deposits29
TOTALArea(sqft)
785.364
MINI ofDepthMin(ft)0.0
MAXof
DepthMax(1)40
AVGof
DepthAvg
(ft)1 i
TOTAL TOTAL ofof Depth MIN of
Depth Estimate (if DepositMAX ofDeposit
Num data Volume Min Volume MaxPoints unavailable) (cu ft)
213 0 0.0(cuft)
282.735
TOTAL ofDeposit
Volume Avg(cuft)
886.814
TOTALof
DepositVolume
Avg(cuyd)32.845
AVG ofCd Cone
Avg(mg/kg)
177
TOTAL ofCd Mass
Avg(pounds)
21.322
TOTALofCdConeNumPoints
55
AVG ofCuConc
Avg(mg/kg)
446
TOTAL ofCu Mass
Avg(pounds)
52 354
TOTALofCuConeNum
Points
82
AVG ofPbConc
Avg(mg/kg)
4.228
TOTAL ofPbMass
Avg(pounds)491.730
TOTALofPbConeNum
Points81
AVG ofZn Cone
Avg(mg/kg)
7.271
TOTAL ofZinc ConeEstimated
fromDepositListed
(if no dataavailable)
0
TOTAL ofZn Mass
Avg(pounds)1.185.790
TOTALofZnCone
AVGof Veg
Num MIN of MAX of ClassPoints pHmin pHmax Score
88 NA NA 254
AVG ofErosionClassScore2.54
AVG ofVolumeClassScore
1.96
AVGOf
ConeClassScore221
AVGof
TotalClassScore925
Treatment Treatment Trea1998 1999 20
BSP-LIBS-LI
COW-BS-LICOW-BS-LI
BS-LIBSP-LI
COW-BS-LIBSP-LIBSP-LIBSP-LI
BS-LI
BSP-LIBSP-LIBSP-LI
BSP-LI
tment Deposit00 Group
CDCLACAECOCSABADCACECJAAAGAlBBCCCNAHCKCPCRCGAJCF
TOTAL of TOTAL of TOTAL ofTreatment Treatment Treatment
1998 1999 20003 12 0
J:\010004\Task 3 - SCR\Appendices\App_H_mwd_rank.xls Table: Deposit 1 of 4 10/24/2002
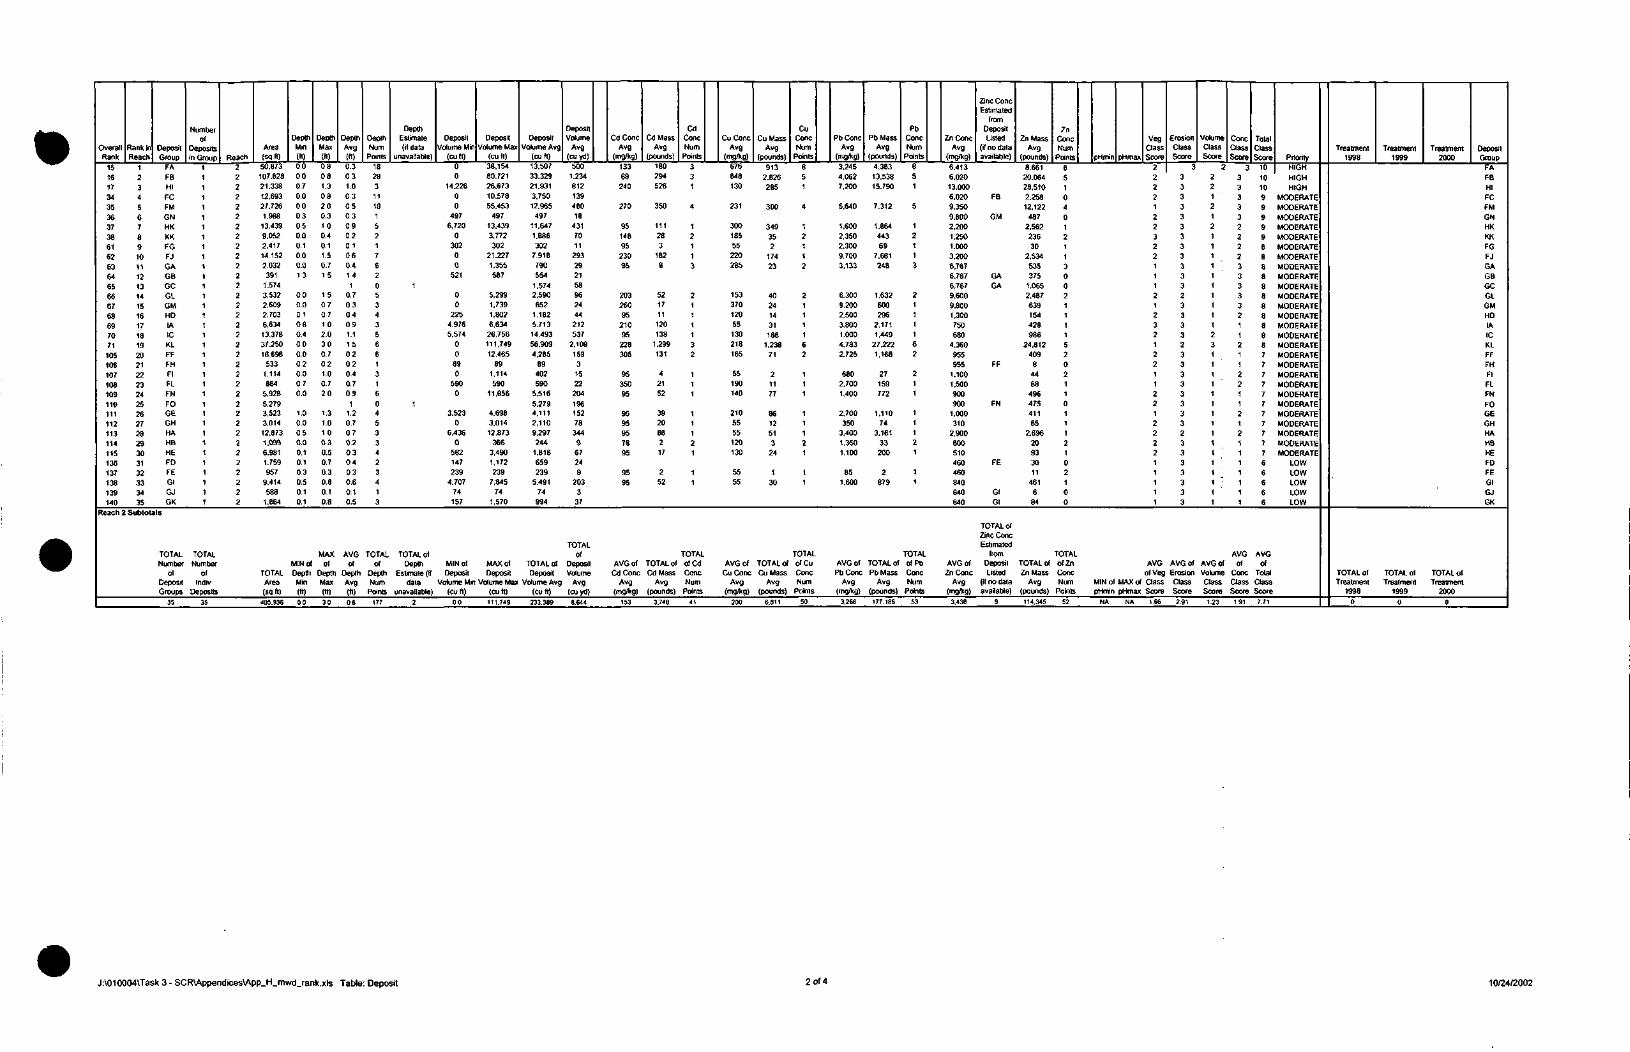
OverallRank
15161734353637386162636465666768697071105106107108109110111112113114115136137138139140
Rank inReach
1234567891011121314151617181920212223242526272829303132333435
DepositGroup
FAFBHIFCFMGNHKKKFGFJGAGBGCGLGMHDIA1CKLFFFHFlFLFNFOGEGHHAHBHEFDFEGlGJGK
Numberof
Depositsin Group
111111111111111111111111
11111111111
Reach
22222222222222222222222222222222222
Area
(sqft)50.873
107.62821.33812,69327.7261.98813.4399,0522,41714.1522.032391
1.5743.532
2.6092.7036.634
13.37837.25018.698
5331.114884
5,928
5.2793.5233.01412.8731,0996.9811.759957
9.414588
1.884
DepthMm(ft)0000070.000030.50.00.10.00.01.3
0.00.001080.4000.0020.00.70.0
1.00.00.50.00.10.10.30.50.10.1
DepthMax(ft)08081.308200.31 00.40.11.50.71.5
1.5070 71.02.03.00.70.21.00.720
1.31.01.0030.50.70.30.80.10.8
DepthAvg(t)0.30.31.0030503090201060.4141
0.70.304091.11.502020.40.7091
1.20.7070.20304030.60.10.5
DeDepth EstiNum (if d
Points unava182831118152
1
7
6205343566131604533423413
pthnate Depositata Volume Minlable) (cu It)
00
14.22600
4976,720
030200
521
00
2254.9765,574
00
890
5900
3,5230
6.4360
582147239
4.70774157
DepositVolume Max
(cuft)38,154
80.72126,673
10.57855.453
49713.4393.772302
21.227
1.355587
5.2991,7391.8026.634
26.756111.74912.465
891.114590
11,856
4.6983,01412.873
3663.4901,172239
7.84574
1,570
DepositVolume Avg
(cuft)13,507
33,32921.931
3,75012,965
49711.647
1,886302
7.918790554
1,5742.590652
1.1825.71314.49356.9094,285
89402590
5.5165.2794,1112,1109.297244
1.818659239
5.49174
994
DepositVolume
Avg(cuyd)
5001.23481213948018
4317011
293292158962444212537
2.1081593152220419615278344967249
2033
37
CO ConeAvg
(mg/kg)
13388240
270
9514895
23095
20326095
21095228305
9535095
9595957895
9595
CdMassAvg
(pounds)180294526
350
111283
1828
521711120138
1,299131
42152
392088217
252
CdConeNum
Points
331
4
12113
2111132
111
11121
11
CuConcAvg
(mg/Vg)676848130
231
30018555220285
15337012055130218165
55190140
2105555120130
5555
Cu MassAvg
(pounds)
9132.826285
300
349352
17423
40241431188
1.23871
21177
8612513
24
130
CuConeNum
Points
851
4
12112
2111162
111
11121
11
PbConcAvg
(mg/kg)
3.2454,0627,200
5,640
1.6002,3502.3009.7003.133
6.3009.2002.5003.8001.0004.7832.725
6802.7001.400
2.700350
3.4001.3501.100
851.600
PbMassAvg
(pounds)
4.38313.53815,790
7.312
1.86444369
7.681248
1.632600296
2.1711.449
27.2221,168
27159772
1.11074
3.16133200
2879
PbConeNum
Points
851
5
12113
2111162
211
11121
11
ZnConcAvg
(mg/kg)
6.4136,02013.0006,0209,3509.8002.2001.2501.0003.2006,7676.7676,767
9.6009.8001.300750680
4,360955955
1.1001,500900900
1,000310
2,900800510460460840840840
Zinc ConeEstimated
fromDepositListed
(if no dataavailable)
FB
GM
GAGA
FF
FN
FE
GlGl
Zn MassAvg
(pounds)
8.66120,064
28.5102,258
12.122487
2,56223630
2,534535375
1.0652.487
639154428986
24.812409
84488
49647541165
2.6%20933011
461684
7nConeNum
Points pHrr
85104012113002111152021101112102100
VegClass
tin pHmax Score
22221223221112123212211221222211111
ErosionClassScore
33333333333332333323333333323333333
VolumeClassScore
222121211111111112311111111111111 '11
ConeClassScore
33333322223333321121122112121111111
TotalClassScore
101010999998888a8888887777777777766666
PriorityHIGH
HIGHHIGH
MODERATEMODERATEMODERATEMODERATEMODERATE
MODERATEMODERATEMODERATEMODERATEMODERATEMODERATEMODERATE
MODERATEMODERATEMODERATEMODERATE
MODERATEMODERATE
MODERATEMODERATEMODERATEMODERATEMODERATEMODERATEMODERATEMODERATEMODERATE
LOWLOWLOWLOWLOW
Reach 2 Subtotals
TOTALNumber
ofDepositGroups
35
TOTALNumber
ofIndiv
Deposits
35
TOTALArea(sqft)
405.936
MIN ofDepthMin
(ft)00
MAXof
DepthMax
(ft)30
AVGof
DepthAvg
TOTAL TOTAL ofof Depth MIN of
Depth Estimate (if DepositMAX ofDeposit
Num data Volume Min Volume Max(ft) Points unavailable) (cuft)
06 177 2 0.0
(cuft)
111.749
TOTAL ofDeposit
Volume Avg(cuft)
233.389
TOTALof
DepositVolume
Avg(cuyd)
8.644
AVG ofCd Cone
Avg(mg/kg)
153
TOTAL ofCdMass
Avg(pounds)
3.746
TOTALofCdConeNum
Points41
AVG ofCu Cone
Avg(mg/kg)
200
TOTAL ofCuMass
Avg(pounds)
6.811
TOTALofCuConeNum
Points
SO
AVG ofPbConc
Avg(mg/kg)
3.266
TOTAL ofPbMass
Avg(pounds)
177.186
TOTALofPbConeNum
Points
53
AVG ofZnConc
Avg(mg/kg)
3.438
TOTAL ofZinc ConeEstimated
fromDepositListed
(if no dataavailable)
9
TOTAL ofZnMass
Avg(pounds)
114.345
TOTALofZnCone
AVGof Veg
Num MIN of MAX of ClassPoints pHmin pHmax Score
52 NA NA 1.66
AVG ofErosionClassScore
2.91
AVG ofVolumeClassScore
1.23
AVGof
ConeClassScore
191
AVGof
TotalClassScore
7.71
Treatment Treatment Treatment Deposit1998 1999 2000 Group
FAFBHIFCFMGNHKKKFGFJGAGBGCGLGMHDIA1CKLFFFHFlFLFNFOGEGHHAHBHEFDFEGlGJGK
TOTAL of TOTAL of TOTAL ofTreatment Treatment Treatment
1998 1999 2000
0 0 0
J:\010004\Task 3 - SCR\Appendices\App_H_mwd_rank.xls Table: Deposit 2 of 4 10/24/2002
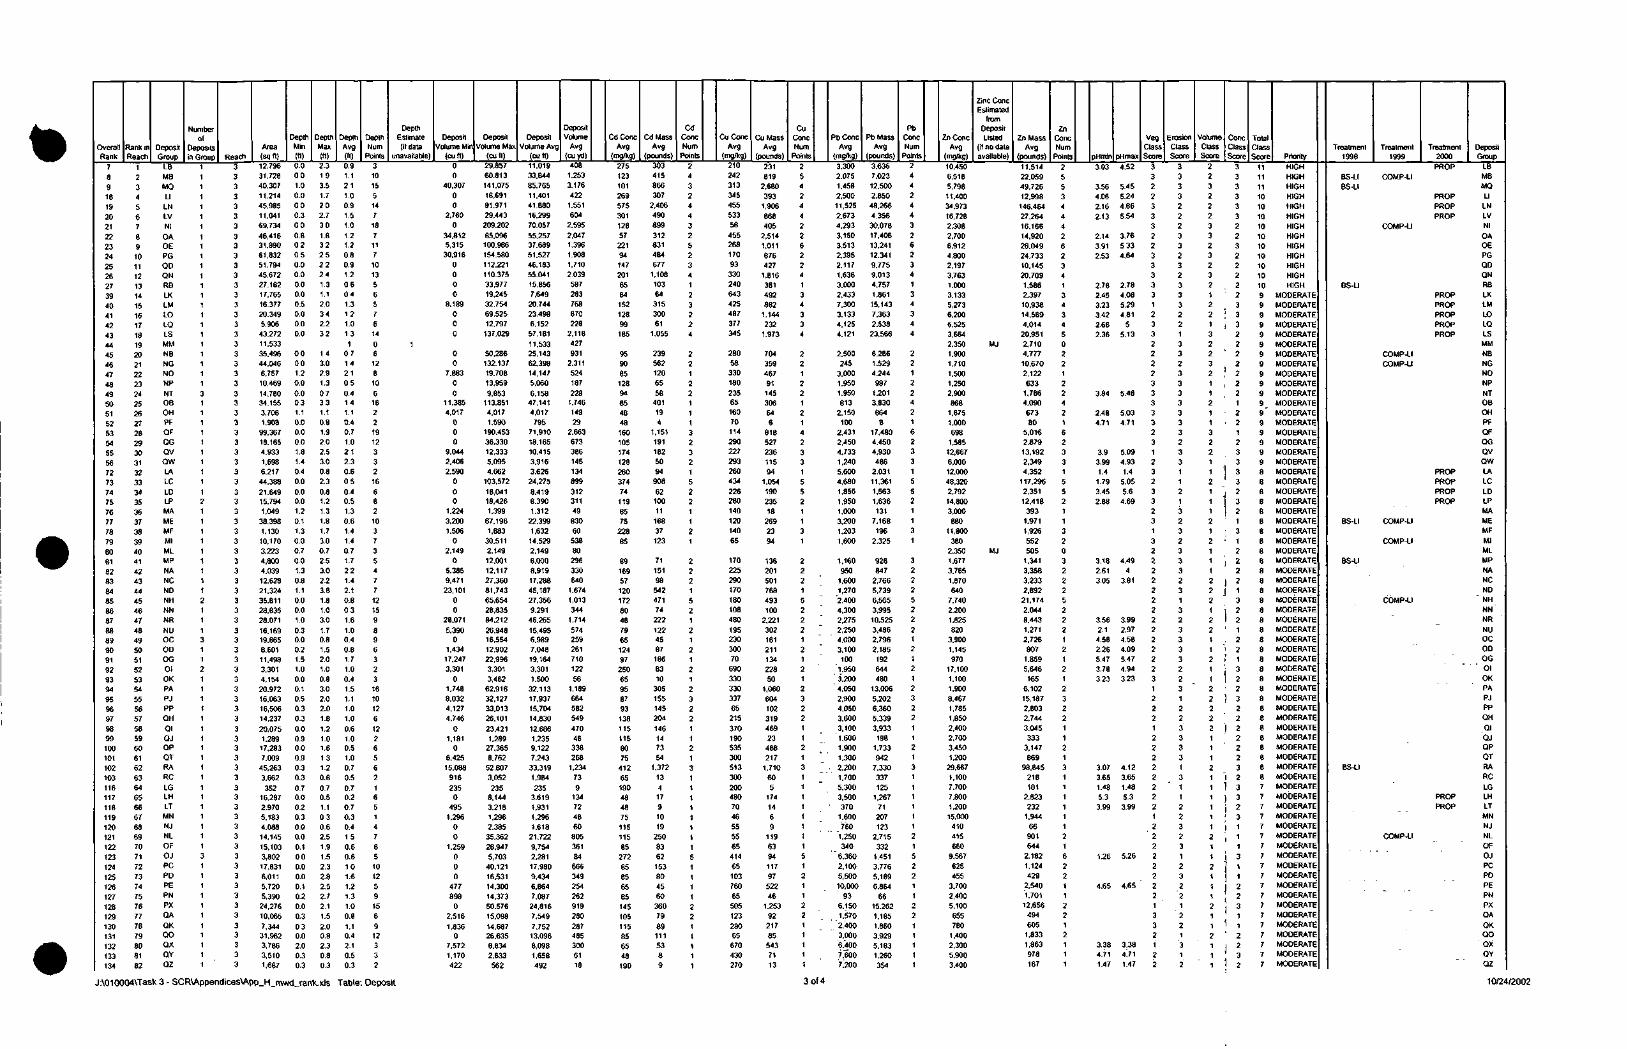
OverallRank
789181920212223242526273940414243444546474849505152535455567273747576777879BO81828384858687888990919293949596979899100101102103116117118119120121122123124125126127128129130131132133134
Rank inReach
12345678910111213141516171819202122232425262728293031323334353637383940414243444546474849SO5152535455565758596061626364656667686970717273747576777879808182
DepositGroup
LBMBMQLILNLVNlOAOEPGQDQNRBLKLMLOLQLSMMNBNGNONPNTOBOHPfQFOGQVQWLALCLDLPMAMEMFMlMLMPNANCNDNHNNNR
NUOCODOGOlOKPAPJPPQH01QJOPOTRARCLGLHLTMNNJNLOFOJPCPDPEPNPXQAOK00OXQYQZ
Numberof
Depositsin Group
1111111
1111111111111111
3111111111
12111111111211131121111111111111111113111111
11111
Reach3333333333333333333333333333333333333333333333333333333333333333333333333333333333
Area(sqft)12.79631.72840.30711.21445.98511.04169,73446,41631.89061,83251,79445.67227.18217.76516.37720.3495.906
43.27211.53335.49644,0466.75710.46914.78034.1553,7081.908
99.36718.1654.9331.6986.21744.38821.64915,7941.049
38.3981,13010.1703,2234,8004,03912.62821,32435,81128.83528.071
16,16919.8658.60111.4983.3014.15420,97216,06316,50614.237
20.0751,28917.2837.009
45.2633,662352
16.2872.9705,1834.08814,14515.1033,80217.8316.0115,7205,39024.27610.0657,34431.9623,7863,5101.687
DepthMin
(It)0.00.01.00.0000.3000.802050.00.00.00.00.50.00.00.0
00001.20.00.0031.10.00.00.01.81.40.40.00.00.01.20.11.30.00.70.01.30.81.10.00.01.0030.00.21.51.00.00.10.50.30.30.00.90.00.90.30.30.70.00.20.30.00.00.1000.00.00.10.20.00.3030.02.00.30.3
DepthMax(ft)2.31.93.51.72.02.7301.8322 522241.31.12.0342232
143.02.91.3073 31.10.81.92.02.53.00.82.30.8121.31.81.73.00.72.53.02.23.81.81.03.01.70.81.52.01.00.83.02.02.0181.21.01.61 31.20.80.70.51.10.30.62.51.91.52.32.82.52.72.11.52.00.82.30.80.3
DepthAvg(ft)091.1211.00.91.51.01.21.20.80.91.2060.41.31.21.01.31
0.71 421050.41 41.10.40.71.02.1230.6050.40.51.30.61.41.40.71.7221.42.10.80.31.61.00.40.81.71.00.41.51.11.01.00.61.00.51.00.70.50.70.2070.30.41.50.60.6101.61.21.31.00.81.10.42.10.50.3
DeDepth EslifNum (if c
Points unava310155147
187
11710135657614
061281061622191233216682103735477121598963231610126122656216514785101259156912332
pthnate Depositata Volume Minlable) (cu ft)
00
40,30700
2.7600
34.8125.31530,916
0000
8.189000
00
7,88300
11.3854,017
000
9.0442,4062,590
000
1,2243.2001.506
02,149
05.3859.47123,101
00
28.071
5.3900
1.43417,2473,301
01,7488,0324.1274.746
01,181
06,42515,088
9162350
4951.296
00
1,259000
4778980
2,5161,836
07,5721,170422
DepositVolume Max
(cult)29.85760.813141.07518.69191.97129.443209.202
85.096100.986154.580112.221110.37533.97719.24532.75469.52512.797137.029
50.286132.13719.70813.9599.853
113.8514,0171.590
190.45336.33012.3335.0954,662
103.57218.04118.4261,399
67.1961,883
30.5112.14912.00112.11727.36081.74365.65428.83584.21226,94816,55412.90222,9963.3013,462
62.91632,12733,01326.10123.4211.289
27.3658,76252.8073.052235
8,1443,2181,2962,38535.36228,9475,703
40.12116,53114.30014.37350,57615.09814.68726.6358.8342.633562
DepositVolume Avg
(cuft)11.01933.84485,76511.40141.88016.29970.05755,25737.68951.52746.18355.04115.8567.649
20.74423.4986.15257.181
11,53325.14362.39814,1475.0606.158
47,1414,017795
71,91018.16510.4153.9163,626
24,2758.4198.3901.312
22.3991.63214.5292,1498,0008,91917,28845,18727,3569.29146.26515,4956,9897,04819.1643,3011.500
32.11317.93715.70414,83012.6861.2359.1227,243
33,3191,984
2353.6191,9311.2961.618
21.7229,7542,28117.9809.4346,8647.087
24,8167,5497.75213,0968,0981,658492
DepositVolume
Avg(cuyd)
4081.2533.176422
1.551604
2.5952.0471.3961.9081.7102.039
587283768870228
2.118427931
2.311524187228
1.74614929
2.66367338614513489931231149
8306053880296330640
1.6741.013344
1,71457425926171012256
1,18966458254947046338268
1,234739
134724860805361846663492542629192802874853006118
Cd ConeAvg
(mg/kg)2751231012695753011285722194147201658415212899185
CdMassAvg
(pounds)303415866307
2,406490899312831484677
1.1081036431530061
1.055
CdConeNum
Points243244325234123224
CuConcAvg
(mg/kg)21024231334545553358
45526817093330240643425487377345
Cu MassAvg
(pounds)
231819
2.680393
1,906868405
2,5141.011876427
1.816381492882
1.144232
1.973
CuConeNum
Points254244226224134334
PbConcAvg
(mg/kg)3.3002.0751.4582,50011,5252.6734.2933.1503.5132,3952.1171.6383.0002.4337,3003,1334,1254,121
PbMassAvg
(pounds)3,6367,02312.5002.850
48.2664.35630.07817.40613.24112.3419.7759.0134.7571.86115.1437.3632.53823.566
PbConeNum
Points244244326234134344
ZincEslin
frcDef
Zn Cone LisAvg (if no
(mg/kg) avai
10.4506.5185.79811.40034.97316,7282.3082.7006.9124.8002.1973.7631.0003.1335,2736.2006.5253.664
Conelated»mnsitted Zn Massdata Avg
able) (pounds)11,51422.05949.72612.998146,46427.26416.16614,92026,04924.73310.14520.7091.5862.39710,93814,5694,01420.951
2.350 MJ 2.71095908512894854848160105174128260374741198575
22885
2395621206558
401194
1.1511911825094908621001116837123
22122111323215221121
280583301802356516070114290227293260434
22628014012014065
70435946791145306646
81852723611594
1.05419023518
2692394
22122121423315521131
2,500245
3.0001.9501.950813
2.150100
2,4312,4504.7331.2405,6004.6801,8561,9501,0003.2001,2031.600
6.2861.5294.244987
1.2013.8308648
17.4804,4504.930486
2.03111.3611.5631.636131
7.168196
2.325
22122421
623315521131
1.9001.7101.5001.2502.900868
1.6751.000698
1,58512,6676.00012.00048.3202.79214.8003,000880
11,800380
4.77710.6702.122633
1.7864.09067380
5.0162.87913.1922,3494,352
117,2962.35112,418
3931.9711.926552
2,350 MJ 50589169571201728048796512497250659587931381151158075
4126519048487511511585
27285856585145105115856548190
711519854247174
22212245871868310
305155145204
146147354
1,3721341791019
250836215380456036079
891115389
222152121212123221121311111111511112211111
17022529017018010848019523030070
690330330337652153701905353005133002004807046555565414651037606550512328065670430270
136201501768493100
2.22130216121113422850
1,06060410231946923
488217
1.710605
1741469
11963941179752246
1.25392217855437113
222152221212123221121311111111512112211111
1.160950
1,6001,2702.4004.3002,2752,2504.0003.100100
1.9503,2004,0502.9004.0503.6003,1001.6001.9001.300
"" . 2.2001,7005,3003,500370
1.600760
" "1.250340
6.3602.1005.50010.000
936.1501.5702,4003,0006.4007.6007,200
928847
2,7665,7396,5653.99510.5253.4862.7962.185192644480
13.0065,2026,3605.3393,933198
1,733942
7,330337125
1,26771207123
2,715332
1.4513,7765.1896.864
6615,2621,1851,8603.9295.1831.260354
3222522212121232211213
21522112211111
1.6773.7651.870640
7,7402.2001.825820
3.9001.145970
17.1001,1001.9008,4671,7851,8502,4002,7003.4501.200
29.6671.1007.7007.8001,20015.000
410415660
9,567625455
3.7002.4005.100655780
1.4002.3005.9003,400
1,3413,3583,2332,89221.1742.0448.4431.2712,726807
1.8595,646165
6.10215.1872.8032.7443.045333
3.147869
98.845218181
2.823232
1.94466901644
2.1821,124429
2,5401.70112.656
494605
1,8331,863978167
ZnConeNum
Points255344
4
2623413434
5022122421
62331
55211320322252221212123221121311111121622112212111
pHmin
3.03
3.564.062.162.13
2.143912.53
2.782.453.233.422.662.36
3.84
2.484.71
3.93.991.41.793.452.88
3.182.61305
3.562.14.582.265.47378323
3.073.651.485.33.99
1.26
4.65
3.384711.47
pHmax4.52
5.455.244.865.54
3.765334.64
2.784.085.294.81
55.13
5.48
5.034.71
5.094.931.4
5.055.6
4.69
4.494
3.81
3.992.974.584.095.474.94323
4.123.651.485.33.99
5.26
4.65
3.384711.47
VegClassScore
33223332233333123322223333323123233231
32222222222222312221222222221222222221332122
ErosionClassScore
3333222332323332213323333333233112132323332313233332231223333131122323123221221
312
VolumeClassScore
223222332323212213223211211322112111
212111222122112112222211121
111121121112112111
ConeClassScore
3333332232222233
32222222122123333
2321312
222
13221221
322
32222223233231
11
31 1
1223112
I 232
TotalClassScore
111111101010101010101010109999999999999'99999888888888888888888888888888888887777777777777777777
PriorityHIGHHIGHHIGHHIGHHIGHHIGHHIGHHIGHHIGHHIGHHIGHHIGHHIGH
MODERATEMODERATEMODERATEMODERATEMODERATEMODERATEMODERATEMODERATEMODERATEMODERATEMODERATEMODERATEMODERATEMODERATEMODERATEMODERATEMODERATEMODERATEMODERATEMODERATEMODERATEMODERATEMODERATEMODERATEMODERATEMODERATEMODERATEMODERATEMODERATEMODERATEMODERATEMODERATEMODERATEMODERATEMODERATEMODERATEMODERATEMODERATEMODERATEMODERATEMODERATEMODERATEMODERATEMODERATEMODERATEMODERATEMODERATEMODERATEMODERATEMODERATEMODERATEMODERATEMODERATEMODERATEMODERATEMODERATEMODERATEMODERATEMODERATEMODERATEMODERATE"MODERATEMODERATEMODERATEMODERATEMODERATEMODERATEMODERATEMODERATE
Treatment Treatment Treatment Deposit1998 1999 2000 Group
PROP LBBS-LI COMP-LI MBBS-LI MQ
PROP LIPROP LNPROP LV
COMP-LI NlOAOEPGQDQN
BS-LI RBPROP LKPROP LMPROP LOPROP LQPROP LS
MMCOMP-LI NBCOMP-LI NG
NONPNTOBOHPFQFOGQVQW
PROP LAPROP LCPROP LDPROP LP
MABS-LI COMP-LI ME
MFCOMP-LI Ml
MLBS-LI MP
NANCND
COMP-LI " NHNNNRNUOCODOGOlOKPAPJPPQH
QlQJOPOT
BS-LI RARCLG
PROP LHPROP LT
MNNJ
COMP-LI NLOFOJPCPDPEPNPXQAQKQOOXQYQZ
J.\010004\Task 3 - SCR\Appendices\App_H_mwd_rank.xls Table: Deposit 3 of 4 10/24/2002
OverallRank
141142143144
145
H6147
148
150
151152
153
Rank inReach
8384
85
86
87
68
89
90
91
92
9394
DepositGroup
LL
LRMG
MH
MJ
MK
PM
QR
LU
QM
RF
Numberof
Depositsin Group Re
Areaach (sq ft)
1 3 5.2241 3 1.1551 3 22,6611 3 6.835
1 3 9.04B1 3 9.943
1 3 1.1141 3 9.954
1 3 5041 3 4.0941 3 4.385
1 3 2.429
DepthMm
(1)0.5
1.3
0.0
0.0
0.3
0.3
0.30.10.7
13
0.9
3.0
DepthMax
(ft)O.B
1.3
O.B
1.0
03
1.3
0.51 B0.7
2.5
09
3.0
DepthAvg
(ft)0.7
1.30.4
0.6
0.3
0.50.4
0.90.7
1.9
0.9
30
DepthNum
Points217
5
3
5
5B1
61
1
DepthEstimate(if data
unavailable)
DepositVolume Mm
(cuft)2.6121.444
0
0
2,2622.486279
830
336
5,4594.0197.287
DepositVolume Max
(cuft)4.3541,444
16.9966.8352.26212.429
557
18.250
33610.2354,0197.287
DepositVolume Avg
(cuft)
3,4831.4449,1724.3292.2625.137446
8.606336
7,9604,0197.287
DepositVolume
Avg(cuyd)
129
53
340
16084
19017
31912
295
149
270
Cd ConeAvg
(mg/kg)
744830092
80
75
75
115
48
75
75
320
CdMassAvg
(pounds)
267
275
40
18
39
3
99
2
60
30
233
CdConeNum
Points
21
1
3
2
11
11
11
1
Cu ConeAvg
(mg/kg)287
470
170
18879
17046
55
210
21046
520
CuMassAvg
(pounds)
100
68
15682
18
87
247
7
167
18379
CuConeNum
Points
31
1
3
21
111
111
PbConcAvg
(mg/kg)3.767
9.9003.300
4.2334,1506.900830
4,7001,5001,2002.0003.100
PbMassAvg
(pounds)
1.3121.4293.027
1.832939
3.54537
4,04550
955804
2.259
PbConeNum
Points31
1
32
111
11
1
1
Zn ConeAvg
(mg/Xg)830
1.800930
2,557
2.350
2.900780
950
590
960
94012.000
Zinc ConeEstimated
fromDepositListed
(if no dataavailable)
ZnMassAvg
(pounds)
289260
8531.107532
1.49035
81820764
3788.744
ZnConeNum
Points pHn
VegClass
lin pHmax Score
3 2.74 3.22 21 3.81 3.81 11
3211
1
2
2
2
2
2
21 2.43 2.43 111
21
1 5.47 5.47 0
ErosionClassScore
2221
11
2221
20
VolumeClassScore
1111111
ConeClassScore
121
2
2
211
11
1
3
TotalClassScore
6
6
6
66
6
6
6
55
54
Priority
LOW
LOWLOW
LOW
LOW
LOW
LOW
LOWLOW
LOWLOW
LOW
Reach 3 Subtotals
TOTALNumber
ofDepositGroups
94
TOTALNumber
ofIndiv.
Deposits
103
TOTALArea(sqft)
1.638612
MINoIDepthMin
(ft)00
MAXof
DepthMax
(«)38
AVGof
DepthAvg
(«)10
TOTALof
DepthNum
Points
654
TOTAL ofDepth
Estimate (ifdata
unavailable)1
MIN ofDeposit
MAX ofDeposit
TOTAL ofDeposit
Volume Min Volume Max Volume Avg(cuft)
00
(cuft)
209.202
(cuft)
1.578 311
TOTALof
DepositVolume
Avg(cuyd)
58.456
AVG ofCdConc
Avg
(mg/kg)129
TOTAL ofCdMass
Avg(pounds)
22.516
TOTALofCdConeNum
Points
172
AVG ofCuConc
Avg
(mg/kg)
258
TOTAL ofCuMass
Avg(pounds)
40.093
TOTALofCuConeNum
Points
187
AVG ofPbConc
Avg(mg/kg)
3.059
TOTAL ofPbMass
Avg(pounds)
736.825
TOTALofPbConeNum
Points
198
AVG ofZnConc
Avg
(mg/kg)4.926
TOTAL ofZinc ConeEstimated
fromDepositListed
(if no dataavailable)
2
TOTAL ofZnMass
Avg(pounds)
866.842
TOTALofZnCone
AVGof Veg
Num MIN of MAX of ClassPoints pHmin pHmax Score
206 1.26 5.60 214
AVG ofErosionClassScore
224
AVG ofVolumeClassScore
154
AVGof
ConeClassScore
206
AVGof
TotalClassScore
799
Treatment Treatment Trea1996 1999 20
men! Deposit00 Group
PROP LL
COMP-LICOMP-UICOMP-LICOMP-LI
LR
MG
MH
MJ
MKPM
OR
LUQM
RF
TOTAL of TOTAL of TOTAL ofTreatment Treatment Treatment
199B 1999 2000
6 12 16
GRAND TOTALS AND AVERAGES
TOTAL TOTALNumber Number
of ofDeposit Indiv.Groups Deposits
153 167
MAX AVG TOTAL TOTAL ofMIN of of of of Depth MIN of
TOTAL Depth Depth Depth Depth Estimate (if Deposit
TOTALof
MAX of TOTAL of DepositDeposit Deposit Volume
Area Min Max Avg Num data Volume Min Volume Max Volume Avg Avg(sqft) (ft) (ft) (ft) Points unavailable) (cuft)
2.829.911 00 40 09 1.044 3 0(cu ft) (cu ft) (cu yd)
282.735 2.698.514 99945
TOTALAVG Of TOTAL of OfCdCd Cone Cd Mass Cone
Avg Avg Num(mg/kg) (pounds) Points
153 47.586 268
TOTALAVG of TOTAL of OfCu
Cu Cone Cu Mass ConeAvg Avg Num
(mg/kg) (pounds) Points301 99.259 319
TOTALAVG of TOTAL of of Pb
Pb Cone Pb Mass ConeAvg Avg Num
(mg/kg) (pounds) Points3.517 1.405.741 332
TOTAL ofZinc ConeEstimated
from TOTALAVG of Deposit TOTAL of ofZn
Zn Cone Listed Zn Mass ConeAvg (if no data Avg Num
(mg/kg) available) (pounds) Points5.212 11 2.166.976 346
AVG AVGAVG AVG of AVG of of of
of Veg Erosion Volume Cone TotalMIN of MAX of Class Class Class Class ClasspHmin pHmax Score Score Score Score Score
126 560 2.11 2.57 1.58 206 8.32
TOTAL ofTreatment
19989
TOTAL ofTreatment
199924
TOTAL ofTreatment
200016
J:\010004\Task 3 - SCR\Appendices\App_H_mwd_rank.xls Table: Deposit 4 of 4 10/24/2002
APPENDIX I
Surface Water Figures
Arkansas River BasinArk R5, Periods 1,2,3
• Detects o Non Detects • PeriodBreak
001
OOOQ .
oonft -_jD)E n on? .
"5 n 006 •>oM n Q05 .w u.uuo
5- 0004 -
_3
E O Q 0 3 -T>(0
O n 002 •
0001 •
0 -« i
•
*•!« *•
^C
1360 -865 B70 S75 980 flSS -B90 B95 2000
rittA
lample Media Flow Period Parameter Units
Surface Water | | All Flows | [ Cadmium, Dissolved | | mg/L |
Min Max Avg Std Dev
49 0.00015 0.004 0.001246JL
0.001106
Sources Station Count Source Count
LNRD-001, 015, 055
Records off chart
vu r
8/26/2002
0.1
0.09
0.08
0.07
_ 0.06
5,2 0.05
I 0.04
O)E
0.03O
0.02
0.01
04-•860
Arkansas River BasinArk R5, Periods 1,2,3
• Detects o NonDetects PeriodBreak
•865 •870 B75 •880 S85 •890 B95 2000
Date
Sample Media Flow Period Parameter Units
Surface Water | | All Flows ] | Cadmium, Total | | mg/L |
Min Max Avg Std Dev
22 0.00034 0.00349 0.001009 0.000795
Sources Station Count Source Count
LNRD-015, 055
Records off chart
8/26/2002
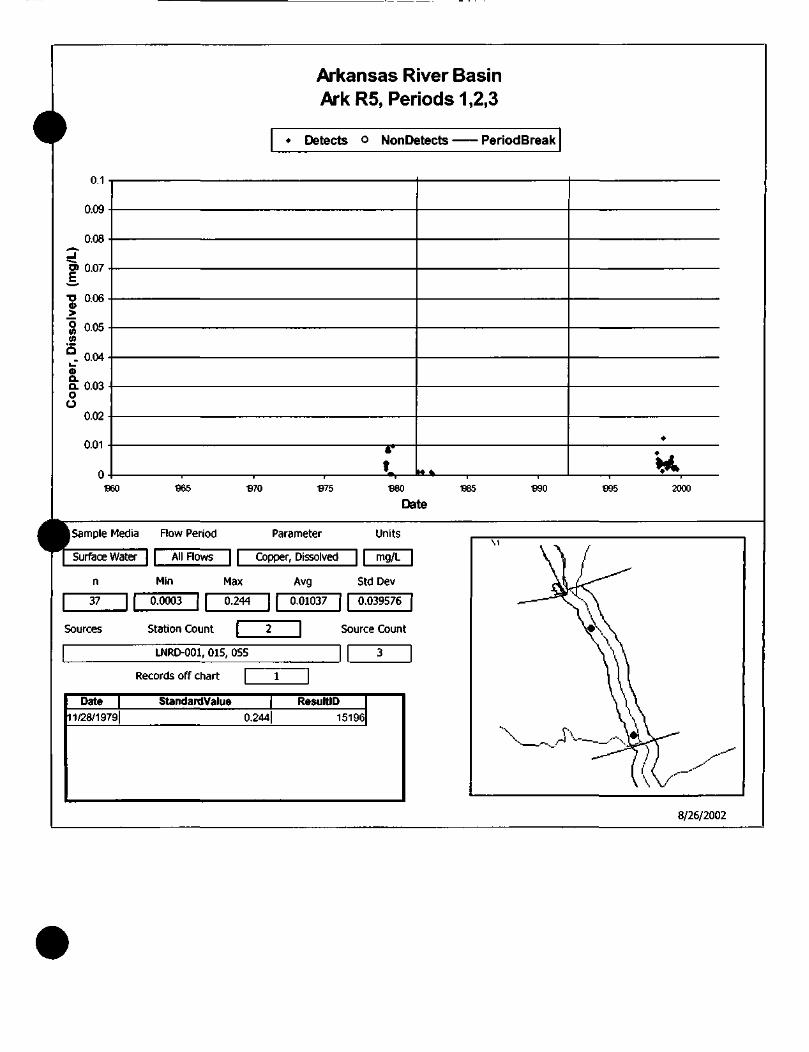
0.1
0.09
D)
1 0.04o>Q.
OO
0.02
0.01
•B60
Arkansas River BasinArk R5, Periods 1,2,3
« Detects o NonDetects PeriodBreak
-965 -B70 975 B80 B85 -090 fi95 2000
Date
Sample Media Flow Period Parameter Units
Surface Water | \ All Flows | | Copper, Dissolved | | mg/L |
Min Max Avg Std Dev
37 0.0003 0.244 0.01037 0.039576
Sources Station Count Source Count
LNRD-001, 015, 055
Records off chart
Date11/28/1979
StandardValue0.244
ResultID
15196
8/26/2002
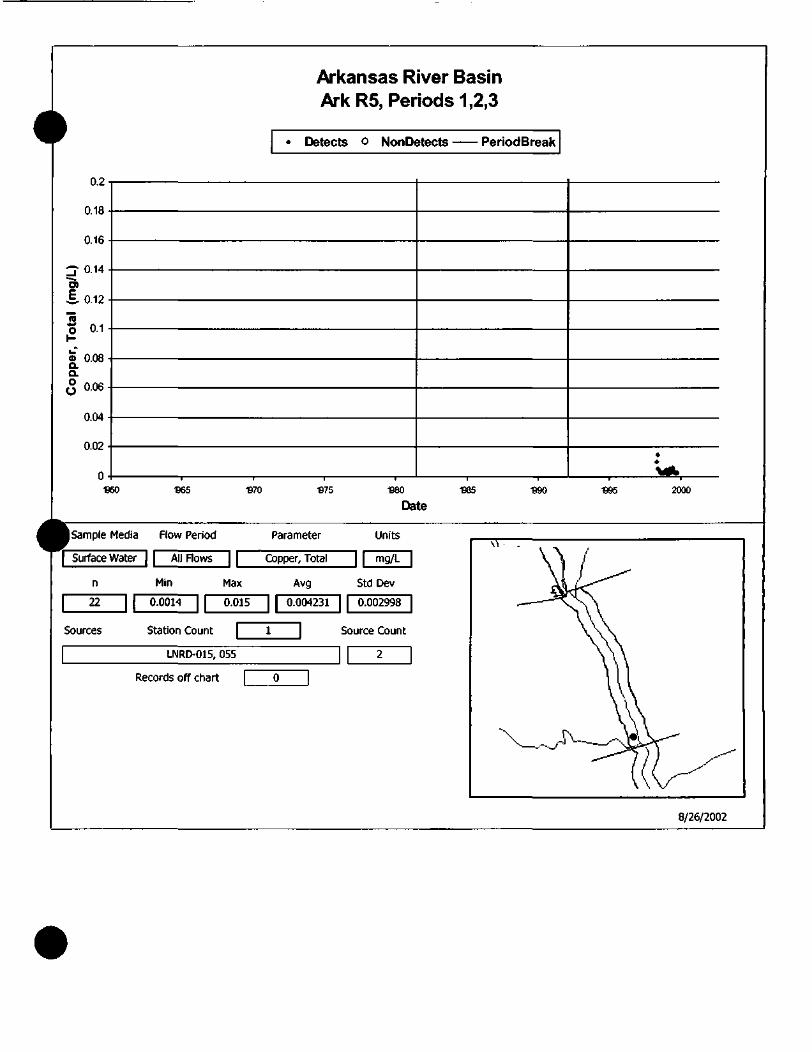
Arkansas River BasinArk R5, Periods 1,2,3
rn°
0 1ft .
0 16 •
'T 0 14 •)
^ n 19 -
1 01-
a> 008 •&a.O 006 •y u-uo
004 -
nn? -
0 -
« Detects o NonD<_ . ._itects renootiresK
•B60 965 -870
*•
S75 -B80 B85 B90 fi95 2000n_t_
I Sample Media Flow Period Parameter Units
"j Surface Water | | All Flows ~| | Copper, Total | [ mg/L |
Min Max Avg Std Dev
22 0.0014 0.015 0.004231 0.002998
Sources Station Count | 1 | Source Count
LNRD-015, 055
Records off chart
8/26/2002
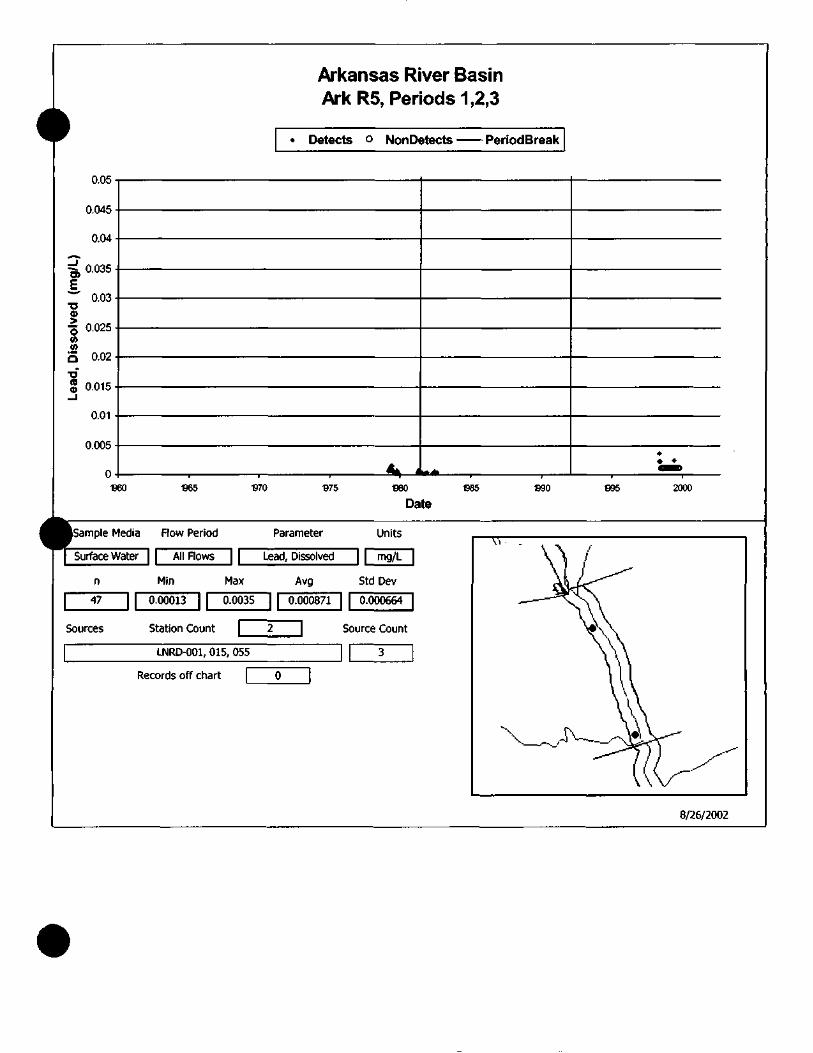
Arkansas River BasinArk R5, Periods 1,2,3
• Detects ° NonDetects - PeriodBreak
004*} -
004 •
^ 0035 •
E' — ' 001 •TJ
— o 025 .VIw« on? •
•o"55 noi"5 •_i
nm -
nnrvi -
n . 4ft 4 tf A
•• *_
•B60 •B65 •B70 B75 •B80 BBS B90 B95 2000
Date
iSample Media Flow Period Parameter Units
Surface Water | | All Flows | | Lead, Dissolved | | mg/L |
Min Max Avg Std Dev
47 0.00013 JL 0.0035 0.000871 0.000664
Sources Station Count L Source Count
LNRD-001, 015, 055
Records off chart
8/26/2002
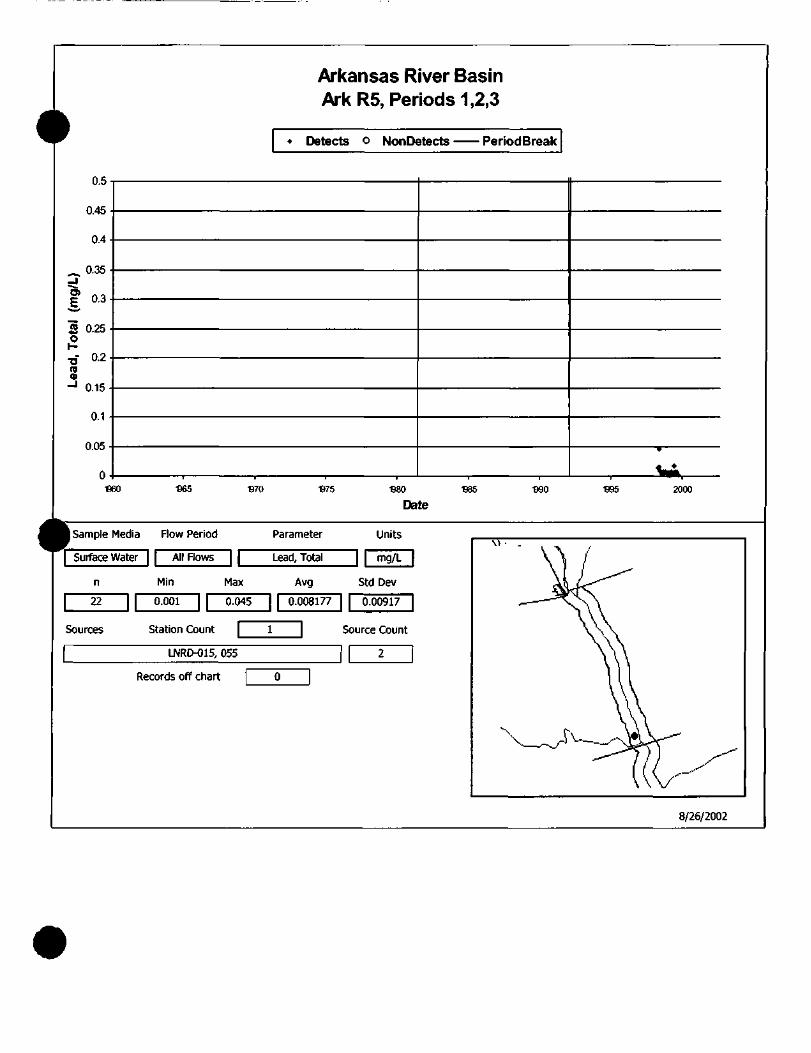
0.5
0.4
0.35
0.3
S
0.15
0.1
O-l-€60
Arkansas River BasinArkRS, Periods 1,2,3
• Detects o NonDetects PeriodBreak
965 1970 «75 B80 -B85 990 -B95 2000
Date
Sample Media Flow Period Parameter Units
Surface Water | | All Flows | | Lead, Total | | mg/L |
Min Max Avg Std Dev
22 0.001 0.045 0.008177 0.00917
Sources Station Count Source Count
LNRD-015, 055
Records off chart
8/26/2002
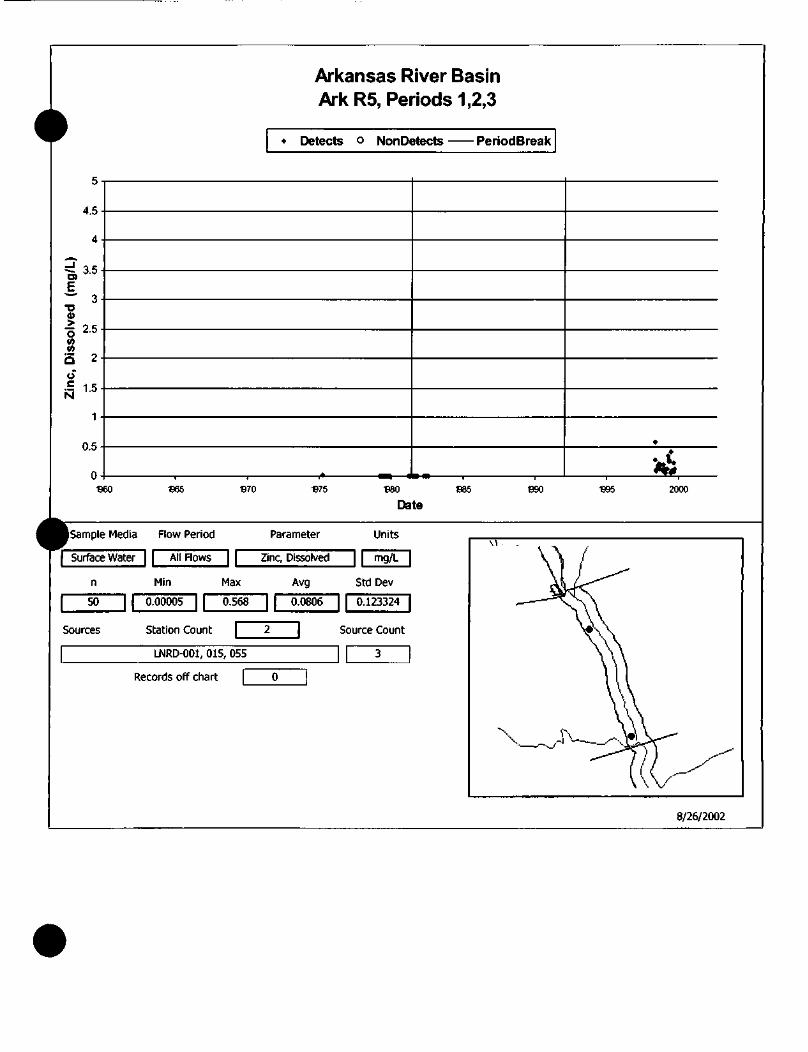
^Arkansas River BasinArk R5, Periods 1,2,3
rA ^
— •
E~— -3 .
2,ro * -°Min« 5 -Q ^o"
N 1'5
1 .
n ^ -
n .
• Detects o NonD<
•B60 B65 -B70
•
'*&
•B75 B80 B85 B90 -995 2000rv,*«
I Sample Media Flow Period Parameter Units
| Surface Water] | All Flows | | Zinc, Dissolved | | mg/L |
Min Max Avg Std Dev
50 0.00005 0.568 0.0806 0.123324
Sources Station Count Source Count
LNRD-001, 015, 055
Records off chart
8/26/2002

Arkansas River BasinArk R5, Periods 1,2,3
• Detects o NonDetects • PeriodBreak
5
4.5
4
*
m
0C
1.5
0.5
•B60 S65 •B70 S75 fl80 •B85 B90 •B95 2000
Date
ISample Media Flow Period Parameter Units
[Surface Water | [ All Flows | [ Zinc, Total | | mg/L |
Min Max Avg Std Dev
22 0.052 0.692 0.224409 0.158326
Sources Station Count Source Count
LNRD-015, 055
Records off chart
8/26/2002
^Arkansas River BasinArk R6, Periods 1,2,3
rn m
n OOQ .
000ft •
n>E 0 007 -
"m 0 OOfi •
>
0(A 0005 •(/) U.VUO
5- noo4 -
_3
E nom -•oraO n nn? .
0 001 -
0-w
» Detects o NonD<. .
jtects PeriodBresk
50 B65 B70
.OOOOODOOOOOO 0
• o« t . • —v^y^v •''&
•B75 «80 «85 B90 flQS 2000n_4._
(Sample Media Flow Period Parameter Units
| Surface Water | | All Flows | | Cadmium, Dissolved | | mg/L |
Min Max Avg Std Dev
538 0.00005 0.029 JL 0.000479 0.0017
Sources Station Count | 12 | Source Count
LNRD-001, 010, Oil, 015, 031, 055
Records off chart
Date5/6/1998
5/6/1998
StandardValue0.029
0.025
ResultID394569
394738
8/26/2002

Arkansas River BasinArk R6, Periods 1,2,3
« Detects o NonDetects PeriodBreak
0.1
0.09
0)0.07
0.06
0.04
<0O
0.02
0.01
0 -B60 965 B70 fl75 B80 B85 B90 •B95 2000
| Sample Media Flow Period Parameter Units
~\ Surface Water | | All Flows ~| | Cadmium, Total | | mg/L |
Min Max Avg Std Dev
560 0.00005 0.028 0.000842 0.001908
Sources Station Count 10 Source Count
LNRD-001, 010, Oil, 015, 055
Records off chart 0
8/26/2002
Arkansas River BasinArk R6, Periods 1,2,3
F
fi 1
n OQ
n rw
?"ni n c\7
TI nnfio
S n (v*u.uow
n rw .
00
a n n^oo
nro
A A1
n -
• Detects o NonDc
«
_ . ._ .
»
«
:. .V4*
llJtmaoapaajP*
B60 •965 B70 •875 S80 S85 990 B95 2000
Date
I Sample Media Flow Period Parameter Units
| Surface Water | [ All Flows | | Copper, Dissolved | | mg/L |
Min Max Avg Std Dev
486 0.0001 0.138 0.002614 0.0065
Sources Station Count 11 Source Count
LNRD-001, 010, Oil, 015, 031, 055
Records off chart 1
Date11/11/1991
StandardValue
0.138
ResultID151010
8/26/2002
•Arkansas River BasinArk R6, Periods 1,2,3
F
ft 9 -,
ft 1ft •
0 1fi .
""T1 n 14 -
^ ft 17 -
"55"K 01-
Q.Q.
0
002 -
n .
« Detects ° NonDt
•
•
«
*• ^
*
•
/i i • LxB60 -865 fl70 "875 "880 B85 B90 B95 2000
Date
Sample Media Flow Period Parameter Units
| Surface Water | | All Flows | | Copper, Total ] | mg/L
Min Max Avg Std Dev
[507 0.0005 0.175 0.004278 0.009288
Sources Station Count | 10 | Source Count
LNRD-001, 010, Oil, 015, 055
Records off chart 0
8/26/2002
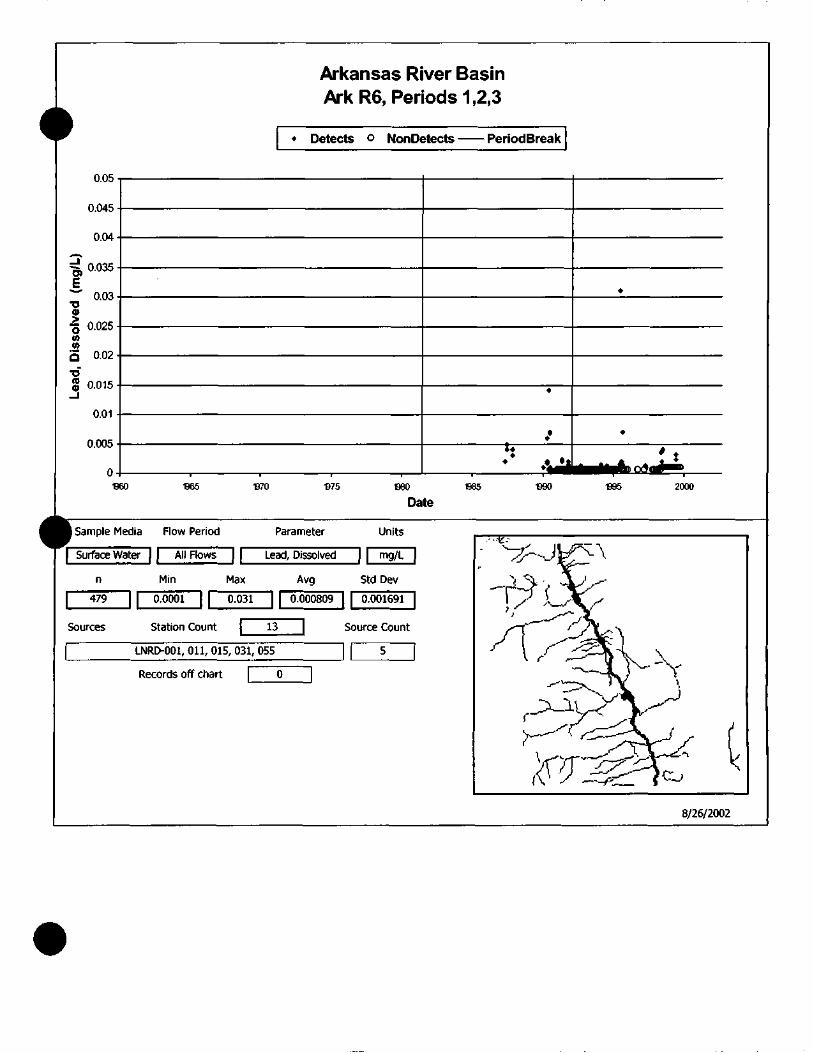
Arkansas River BasinArk R6, Periods 1,2,3
» Detects o NonDetects PeriodBreak
0.05
=3, 0-035
0.03
•§ 0.025M(A
T>10
0.01
0.005
•B60 -B65 -B70 fl75 B80 B85 "690 •B95
Date
I Sample Media Flow Period Parameter Units
| Surface Water| | All Flows | | Lead, Dissolved | | mg/L |
Min Max Avg Std Dev
479 0.0001 0.031 0.000809 0.001691
Sources Station Count 13 Source Count
LNRD-001, Oil, 015, 031, 055
Records off chart 0
8/26/2002
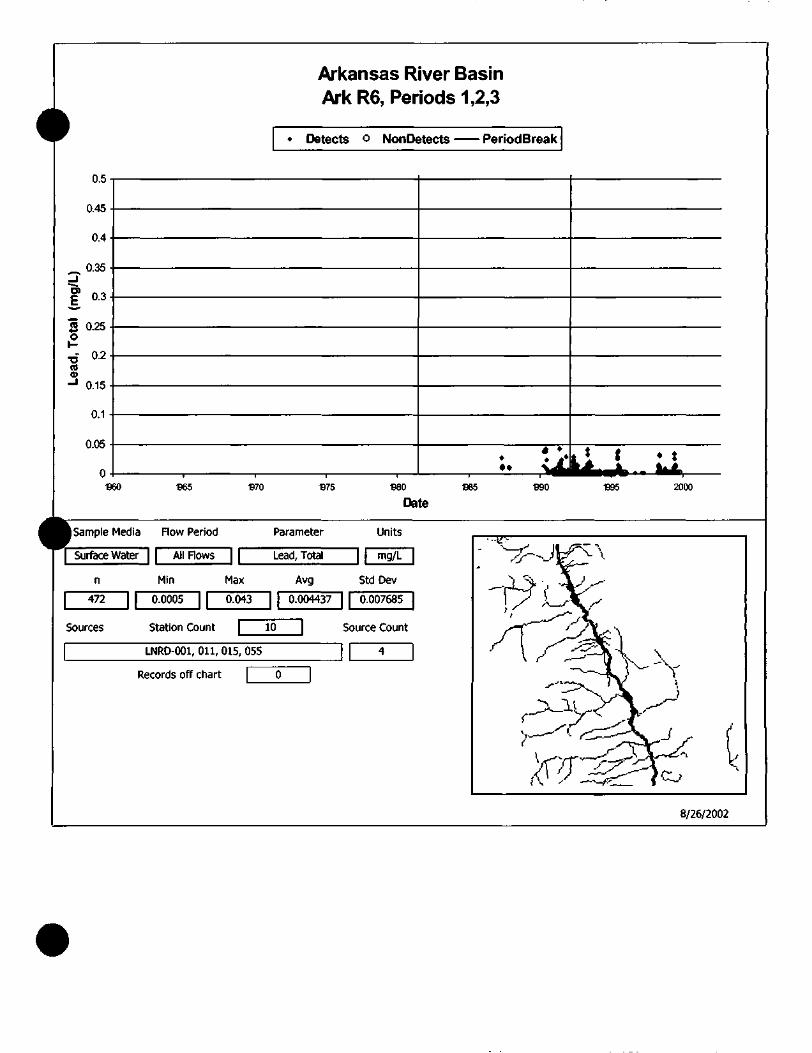
Arkansas River BasinArk R6, Periods 1,2,3
• Detects o NonDetects • PeriodBreak
0.5
0.45
0.4
-. O-35
O> noc 0.3
TJrao>
,- 0.2
0.15
0.1
0.05
04—-B60
'• •
* • 1
965 •B70 •B75 •880 B85 B90 •B95 2000
Date
Sample Media Flow Period Parameter Units
Surface Water | | All Flows | | Lead, Total | | mg/L |
Min Max Avg Std Dev
472 0.0005 0.043 0.004437 0.007685
Sources Station Count [_ 10 Source Count
LNRD-001, Oil, 015, 055
Records off chart
8/26/2002

IArkansas River BasinArk R6, Periods 1,2,3
• Detects o NonDetects PeriodBreak
5
4.5
4
i 25
Mlit
OcN
0.5
'«:B60 -B65 -B70 B75 B80 -B85 S90 •B95
Date
2000
ISample Media Flow Period Parameter Units
| Surface Water) | All Flows | | Zinc, Dissolved | | mg/L |
Min Max Avg Std Dev
496 0.00001 0.82 0.088794 0.099556
Sources Station Count 12 Source Count
LNRD-001, 010, Oil, 015, 031, 055
Records off chart
8/26/2002
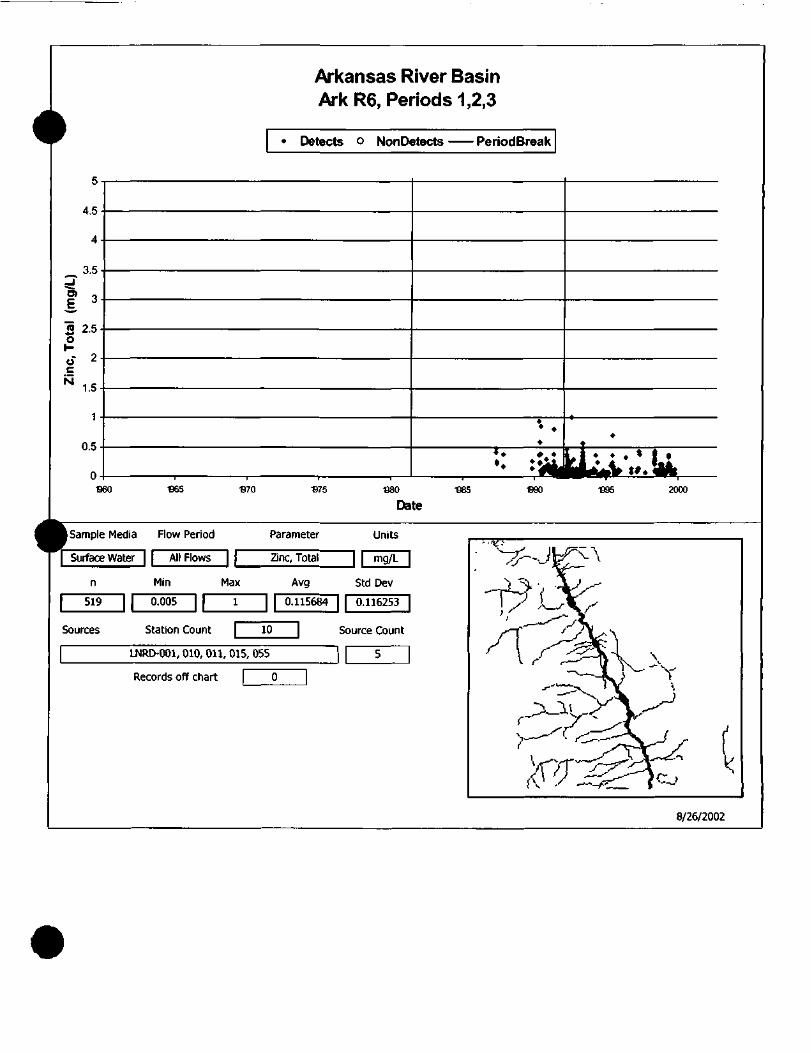
Arkansas River BasinArk R6, Periods 1,2,3
• Detects o NonDetects PeriodBreak
4.5
3.5
O)
£ 2.5o» 2
N 1.5
0.5
B60 B65 •B70 B80 •B85 B90 B95 2000
Date
•TciSample Media Flow Period Parameter Units
Surface Water All Flows | | Zinc, Total | | mg/L |
Min Max Avg Std Dev
519 0.005 0.115684 0.116253
Sources Station Count 10 Source Count
LNRD-001, 010, Oil, 015, 055
Records off chart 0 Y
8/26/2002
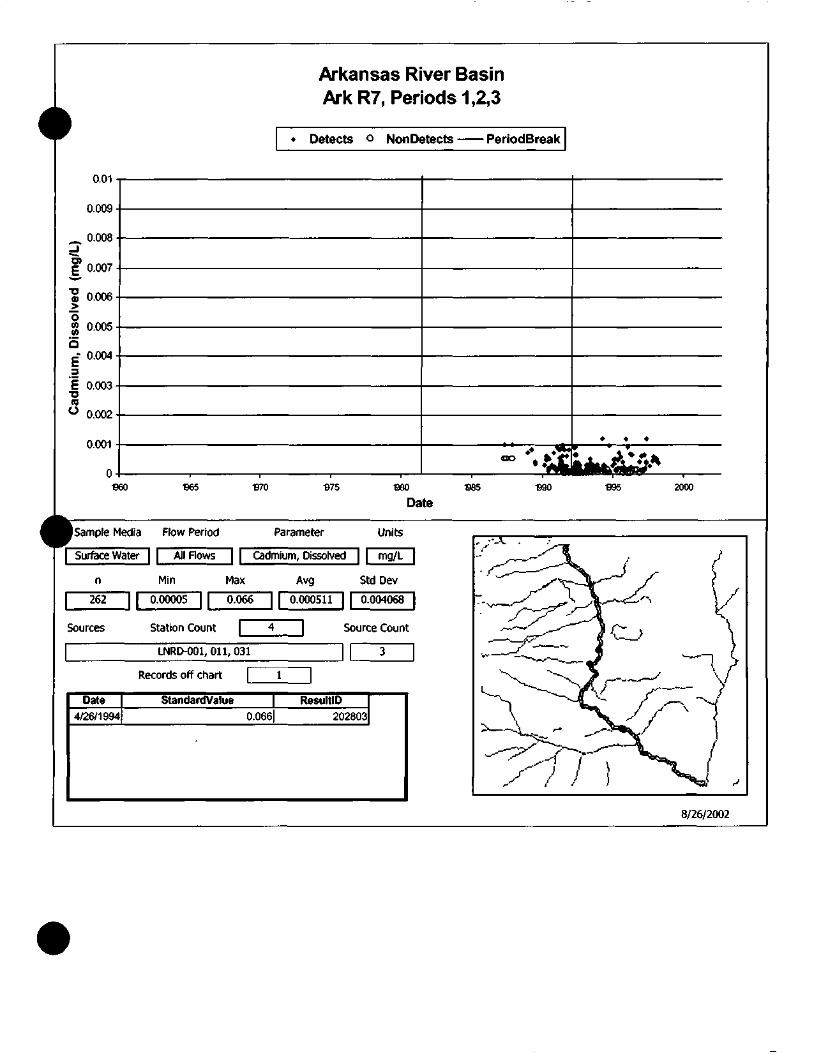
Arkansas River BasinArk R7, Periods 1,2,3
• Detects o Non Detects • PeriodBreak
0.01
0.009
_ 0.008
p 0.007
"S 0.006
O(A(A
5
0.005
»-- 0.004_
E 0.003
ra0.002
0.001
•B60 B65 -B70 •B75 S80 S85 B90
Date
I Sample Media Flow Period Parameter Units
| Surface Water | | All Flows | | Cadmium, Dissolved^ | mg/L |
Min Max Avg Std Dev
262J[
0.00005 0.066 0.000511 0.004068
Sources Station Count L Source Count
LNRD-001, Oil, 031
Records off chart
Date4/26/1994
StandardValue ResultID
0.066| 202803
8/26/2002

Arkansas River BasinArk R7, Periods 1,2,3
• Detects o NonDetects PeriodBreak
009 •
OHft -
— 1 007 •D)
>— 006 -
~!a*rf
O 005 •
§ 004 •
E"O nog .n U-UJ
O
002 -
nm -
n -
•
• A tilA**
00 , «»
fc^i 1 "*•B60 B65 •870 B75 •880 •885 •B90 S95 2000
Date
I Sample Media Flow Period Parameter Units
| Surface Water) | All Flows | | Cadmium, Total | | mg/L |
Win Max Avg Std Dev
283 0.00005 0.01 0.000675 0.001251
Sources Station Count L Source Count
UMRD-001, Oil, 031
Records off chart
8/26/2002
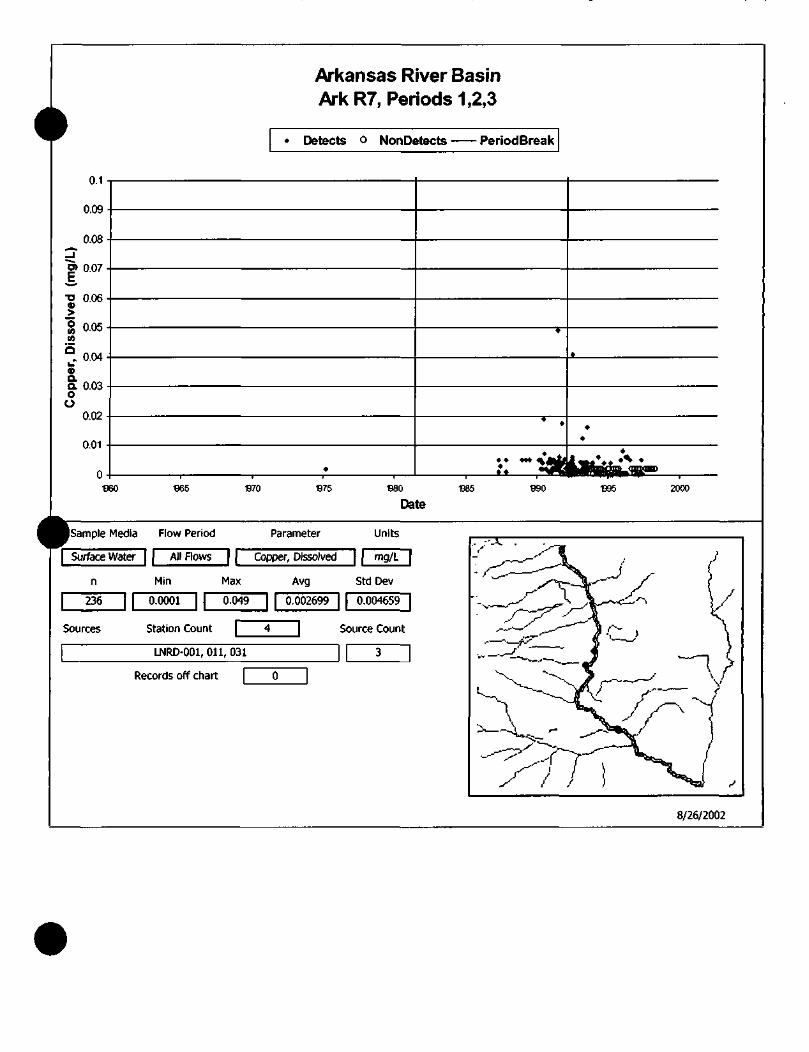
Arkansas River BasinArk R7, Periods 1,2,3
• Detects o NonDetects PeriodBreak
0.1
0.09
0.08
0.07
•a 0.06
0.05
. 0.04
a 0.03oo
0.02
0.01
•B60 965 •870 •875 •980 B85 990 •995 2000
Date
(Sample Media Flow Period Parameter Units
| Surface Water | | All Flows | | Copper, Dissolved ] | mg/L |
Min Max Avg Std Dev
236 0.0001 0.049 0.002699 0.004659
Sources Station Count | 4 | Source Count
LNRD-001, Oil, 031
Records off chart
8/26/2002

Arkansas River BasinArk R7, Periods 1,2,3
F
09 -
0 1H .
n IK j
*—• n 14 .
"ro£ n 1? •
1 01
Q.Q.? nnfi .
no? .
n .
« Detects o NonD<
• ^
* **^
t
rfXM^U &, ^
«»
v •N* *&J»4J»J
-960 •865 •870 •B75 S80 B85 B90 •B95 2000
Date
I Sample Media Flow Period Parameter Units
"| Surface Water | | All Flows ~| | Copper, Total | | mg/L |
Min Max Avg Std Dev
244 0.0005 0.06 0.005759 0.007733
Sources Station Count Source Count
LNRD-001, Oil, 031
Records off chart
8/26/2002

Arkansas River BasinArk R7, Periods 1,2,3
» Detects o NonDetects • PeriodBreak
OO4S •
nn4 .
=J n nvi -^> °-OJ5
' 003 •T35— n 09^ .v>wQ"~ 0 02 -
•o5 ooi1)-_i
nm -
nons -
n.
•
«
»
t •n *^t
« «
^>"""*j2^-»^
S60 •865 •B70 975 •B80 •885 •890 B95 2000
Date
(Sample Media Flow Period Parameter Units
Surface Water) | All Flows | | Lead, Dissolved ] | mg/L |
Min Max Avg Std Dev
240 0.0005 0.026 0.001524 0.002928
Sources Station Count Source Count
LNRD-001, Oil, 031
Records off chart
8/26/2002
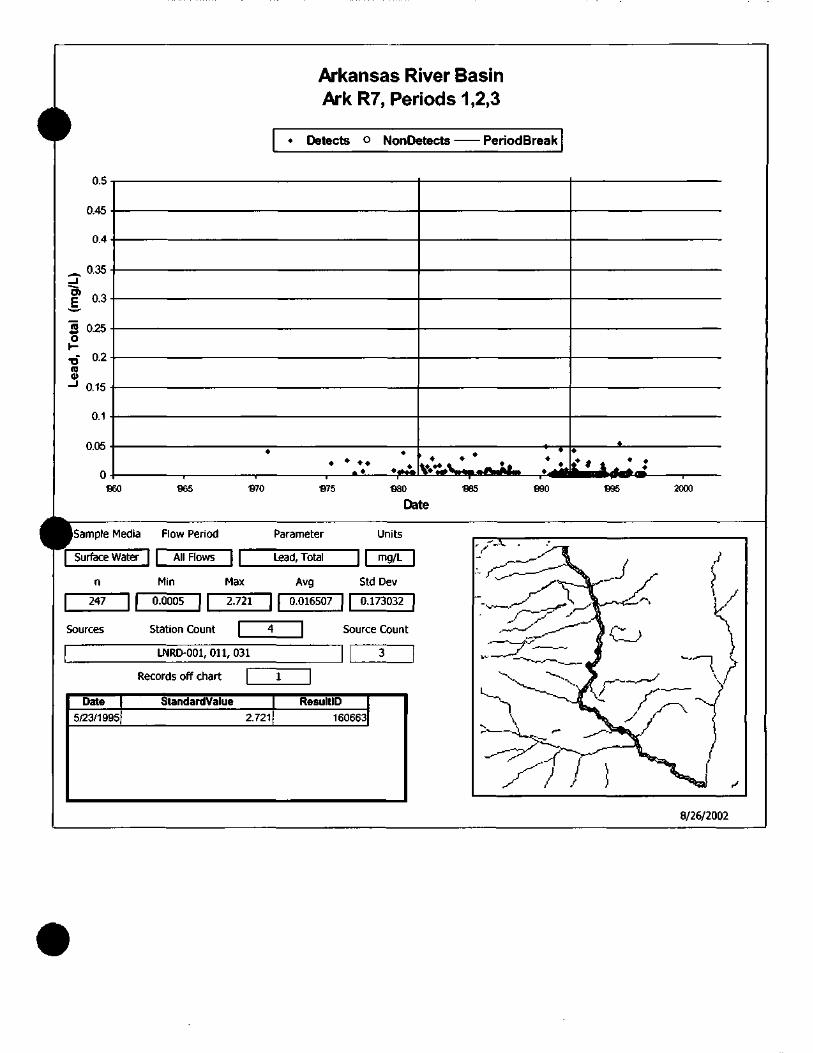
Arkansas River BasinArk R7, Periods 1,2,3
• Detects ° NonDetects PeriodBreak
0.5
0.45
0.4
~ 0.35
f 0.3
$ 0.25o
0.2
0.15
0.1
0.05
0+-•B60 965 -B70 1375 •880 •B85 •B95 2000
Date
(Sample Media Flow Period Parameter Units
| Surface Water] | All Flows | | Lead, Total | | mg/L |
Win Max Avg Std Dev
247 0.0005 2.721 0.016507 0.173032
Sources Station Count L Source Count
LNRD-001, Oil, 031
Records off chart
Date
5/23/1995
StandardValue
2.721ResultID
160663
8/26/2002

^Arkansas River BasinArk R7, Periods 1,2,3
r
e:
4 ^ H
1
O)
"""* ^ -•o
S o 50 "</>w'JI 9 .Q ^
Oc 1 5N
1 .
0 "5 •
0 -
« Detects o NonDf
»*
•860 B65 B70
•• *--• Aj .A^ fc A^^ ii •
B75 B80 -885 B90 -895 2000n«4A
[Sample Media Flow Period Parameter Units
Surface Water [ | All Flows | | Zinc, Dissolved | | mg/L |
Min Max Avg Std Dev
241 J[ 0.004 0.19 0.04546 0.02986
Sources Station Count Source Count
LNRD-001, Oil, 031
Records off chart
8/26/2002
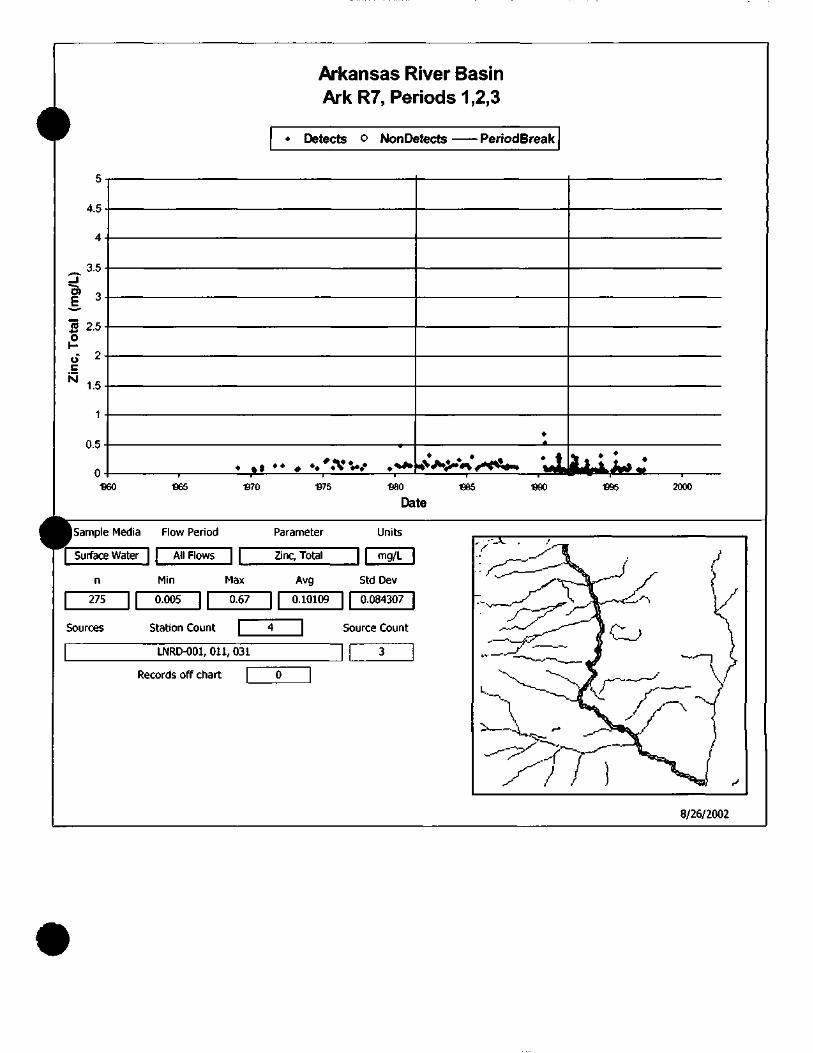
Arkansas River BasinArk R7, Periods 1,2,3
• Detects o NonDetects PeriodBreak
4.5
3.5
« 2.5O
O
N 1.5
0.5
•860 •865 970 •875 •D80 B85 -890 2000
Date
UnitsISample Media Flow Period Parameter
1 Surface Water"] | All Flows "| | Zinc, Total | | mg/L |
Min Max Avg Std Dev
275 0.005 0.67 0.10109 0.084307
Sources Station Count | 4 | Source Count
LNRD-001, Oil, 031
Records off chart
8/26/2002

Arkansas River BasinArk R8, Periods 1,2,3
Detects o Non Detects • • PeriodBreak
0.01
0.009
_ 0.008
g 0.007
"% 0.006
«-- 0.004
E 0.003•oraO
0.001
0-
00 00
-B65 B70 975 B80 -B85 B90 fl95 2000
Date
ISample Media Flow Period Parameter Units
| Surface Water | | All Flows | | Cadmium, Dissolved ] | mg/L
Win Max Avg Std Dev
516 0.00005 0.01 0.000219 0.000559
Sources Station Count | 10 \ Source Count
LNRD-001, Oil, 031
Records off chart
8/26/2002
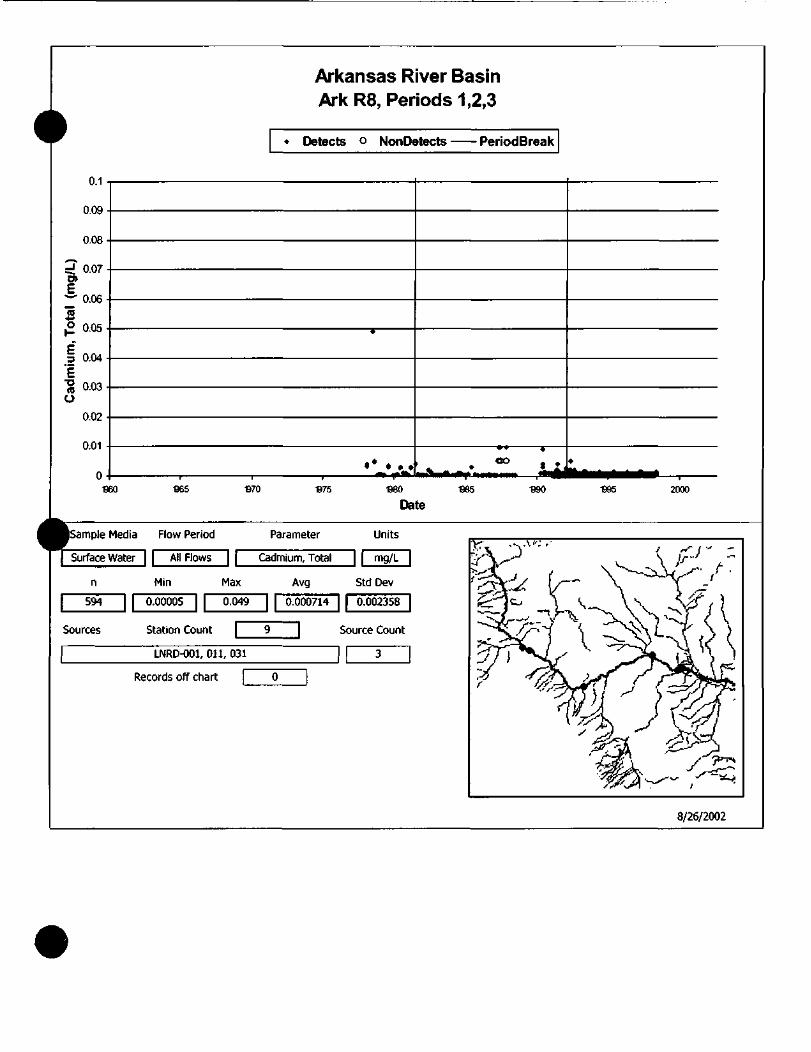
Arkansas River BasinArk R8, Periods 1,2,3
• Detects ° NonDetects • PeriodBreak
0.1
0.09
0.07o>
5o
=j 0.04
E
raO
0.02
0.01
-960 B65 B70 B75 •985 B90 •B95
<»To
Date2000
Sample Media Flow Period Parameter Units
Surface Water | | All Flows | | Cadmium, Total | | mg/L |
Min Max Avg Std Dev
594 0.00005 0.049 0.000714 0.002358
Sources Station Count Source Count
LNRD-001, Oil, 031
Records off chart
8/26/2002
Arkansas River BasinArk R8, Periods 1,2,3
« Detects o NonDetects PeriodBreak
0.1
0.09
0.08
o> 0.07
0)0.06
0.05
0.04
a. 0.03oO
0.02
0.01
O-l-B60 •B65 B70 •B75 «80 «85 990 •B95 2000
Date
I Sample Media Flow Period Parameter Units
| Surface Water] | All Flows \ \ Copper, Dissolved | | mg/L |
Min Max Avg Std Dev
466 0.0001 0.039 0.001952 0.002904
Sources Station Count Source Count
LNRD-001, Oil, 031
Records off chart
8/26/2002
0.2
0.18
0.16
• 0.14
. 0.12
•§ 0.1
« 0.08o.Q.OO 0.06
0.04
0.02
fl60
Arkansas River BasinArk R8, Periods 1,2,3
« Detects o NonDetects PeriodBreak
965 B70 •B75 •880 B85 B90 2000
Date
ISample Media Flow Period Parameter Units
"| Surface Water | | All Flows ~| | Copper, Total | | mg/L |
Min Max Avg Std Dev
552 0.0005 0.18 0.00609 0.01201
Sources Station Count Source Count
LNRD-001, Oil, 031
Records off chart
8/26/2002
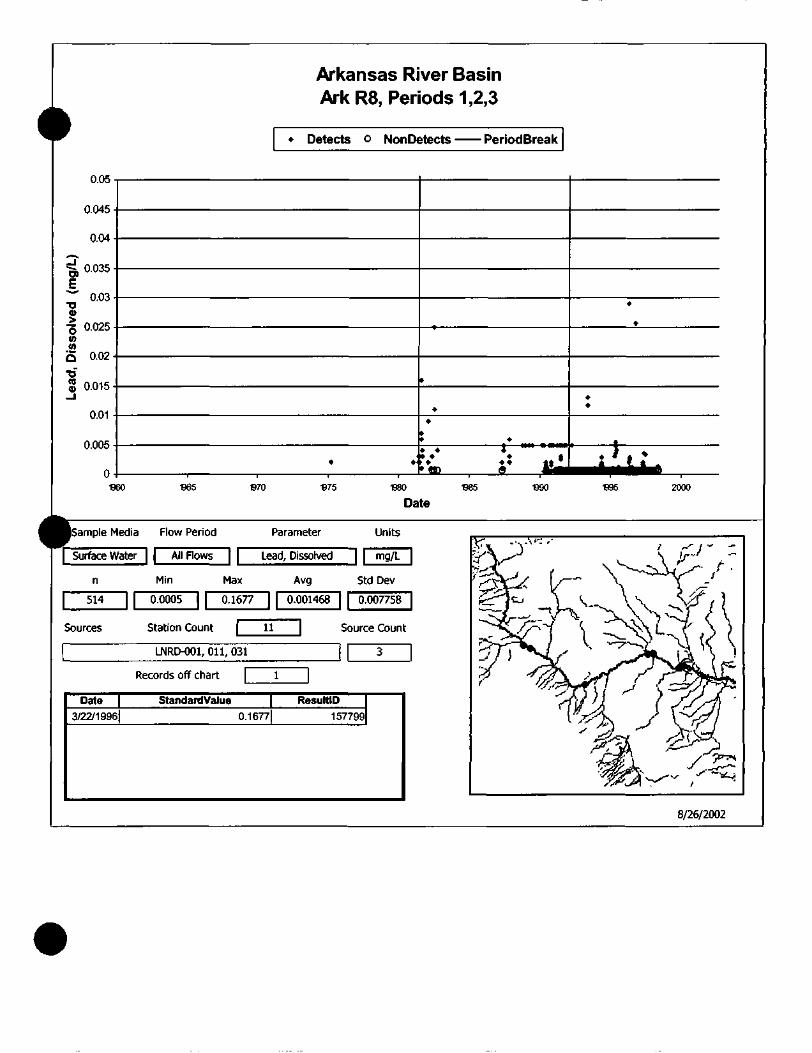
Arkansas River BasinArk R8, Periods 1,2,3
» Detects o NonDetects • PeriodBreak
0.045
0)E
0.03
•5 0.025<A(A
5 0.02
•orav 0.015
0.01
0.005
•860 •B65 B70 •875 •B80 S85 •D90 •B95
Date2000
Isample Media Flow Period Parameter Units
| Surface Water| | All Flows | | Lead, Dissolved | | mg/L
Min Max Avg Std Dev
514 0.0005 0.1677 0.001468 0.007758
Sources Station Count 11 Source Count
LNRD-001, Oil, 031
Records off chart
Date3/22/1996
StandardValue0.1677
ResultID
157799
8/26/2002

0.5
£ 0.3
« 0.25
•2-,- 0.2ra
0.15
0.1
0.05
O-l—•B60 965
Arkansas River BasinArk R8, Periods 1,2,3
« Detects o NonDetects PeriodBreak
B75 •B80 B85 2000
Date
Sample Media Flow Period Parameter Units
| Surface Water~| | All Flows ~"| | Lead, Total | | mg/L |
Min Max Avg Std Dev
559 0.0005 0.2 0.006725 0.015251J
Sources Station Count Source Count
LNRD-001, Oil, 031
Records off chart
8/26/2002
Arkansas River BasinArk R8, Periods 1,2,3
r
A. -
5 35-0) J b
*-* •».•o2
— 9 S •0 ^ °(A(A
'<S 9 -O *•
OC 1 K
N
n .
0 -
• Detects o NonD<
0<
B60 fl65 -B70
it — — ^ ^fcti^!^it
•B75 680 B85 B90 -B95 2000rv>»n
Sample Media Flow Period Parameter Units
Surface Water | | All Flows [ | Zinc, Dissolved \ \ mg/L |
Min Max Avg Std Dev
457 0.001 0.226 0.037475 0.02905
Sources Station Count | 8 | Source Count
LNRD-001, Oil, 031
Records off chart
8/26/2002
Arkansas River BasinArk R8, Periods 1,2,3
• Detects o NonDetects PeriodBreak
5
4.5
4
0c
1.5
0.5
•D60 -B65 -870 fl75 980 •B85 B90
DateS95 2000
mple Media Flow Period Parameter Units
Surface Water) | All Flows | | Zinc, Total | | mg/L |
Min Max Avg Std Dev
574 0.003 J[ 0.86 0.093717 0.102489
Sources Station Count Source Count
LNRD-001, Oil, 031
Records off chart
f-.
8/26/2002
4Arkansas River BasinArk R9, Periods 1,2,3
• Detects o NonDetects PeriodBreak
\J.\J I •
n OOQ .
n nnft
O)E n fin? .
"5 n fififi .
"ow> n nn^JJ) U.UUO
5- n nn^ .
_3
E n nm .•o(0O n f\O9
A nn-i
n -OOSDO OO O O tmn ^ BOOIQDIO^BOC .
t_jf ^ ^ "\ n»|f7*
B60 •865 B70 B75 •B80 •B85 •B90 •B95 2000
Date
| Sample Media Flow Period Parameter Units
Surface Water | | All Flows | | Cadmium, Dissolved [ | mg/L |
Min Max Avg Std Dev
131 0.00005 0.004 0.000515 0.000771
Sources Station Count | 3 \ Source Count
LNRD-011, 031
Records off chart
8/26/2002
Arkansas River BasinArkR9, Periods 1,2,3
r
n 1 .
nnft -
—i nn? •D>
o nn6; -
5 nn/i -E' nm .re u-Ui3
0
nm -
n -
* Detects o NonDc
* * *o Vnnmtw
D • *JD b.
•^^ 0 sftl ^M^ p amk.
B60 965 •B70 B75 B80 •B85 990 •995 2000
Date
ISample Media Flow Period Parameter Units
~\ Surface Water | | All Flows ~"| | Cadmium, Total | | mg/L |
Min Max Avg Std Dev
129 0.00005 JL 0.01 J[ 0.001351 0.001919
Sources Station Count Source Count
LNRD-011, 031
Records off chart
8/26/2002
Arkansas River BasinArk R9, Periods 1,2,3
« Detects o Non Detects • PeriodBreak
0.1
0.08
0.07
-O 0.06
". 0.04
Q.
OO
0.02
0.01
O-l--965 -B70 •B75 -B80 fi85 B90 -995 2000
ISample Media Flow Period Parameter Units
| Surface Water | | All Flows | | Copper, Dissolved | | mg/L |
Min Max Avg Std Dev
136 0.0001 0.034JL
0.004425 0.005618
Sources Station Count Source Count
LNRD-011,031
Records off chart
8/26/2002

Arkansas River BasinArk R9, Periods 1,2,3
r
n 9 -,
n iw .
0 1fi •
*"- n 1/1 .
c n 19 .
"5« n 1 -i-m 008 -O.a.® nofi -
nru .
nn9 -
n .
« Detects ° NonD<
• «
»•*.* * orfMo
»
^ f*•* :Jb
«*/W • 3rV
-B60 B65 •B70 •B75 •B80 •B85 B90 •B95 2000
Date
Sample Media Flow Period Parameter Units
1 Surface Water~| | All Flows "| | Copper, Total | | mg/L
Min Max Avg Std Dev
120 0.0015 0.07 0.010231 0.01188
Sources Station Count | 4 | Source Count
LNRD-011, 031
Records off chart
8/26/2002
Arkansas River BasinArk R9, Periods 1,2,3
F
OfW -
004S -
nru -
s n rn<; .•- U.U.35
— n noc .
(0.2
•o? n niR .
001 -
n .
» Detects o NonD<
o *
» • *
m •t °
mgf orn^p
S60 •B65 B70 •B75 •B80 •B85 •B90 •995 2000
Date
} Sample Media Flow Period Parameter Units
| Surface Water| | All Flows | | Lead, Dissolved | | mg/L
n Min Max Avg Std Dev
130 0.00025 0.069 0.001899 0.006363
Sources Station Count | 3 | Source Count
LNRD-011, 031
Records off chart
Date6/25/1980
StandardValue
0.069
ResultID
241196
8/26/2002
Arkansas River BasinArk R9, Periods 1,2,3
r0 *5
OAR .
04 -
OT5 -1
? 0 1 •
o
"om
—^ rf\^ •
n 1 .
nn"i .
0 -s
« Detects o NonD<_ . ._ .
Jtects KeriodDresK
• ^
•
30 965 B70
* J^k Lk8fji ^ .«*•-.fi75 B80 fl85 B90 -995 2000
rVk^A
[Sample Media Flow Period Parameter Units
| Surface Water] | All Flows | | Lead, Total | | mg/L |
Min Max Avg Std Dev
120 0.0005 0.019755 0.092598
Sources Station Count | 4 | Source Count
LNRD-011, 031
Records off chart
Date
12/11/1991
StandardValue ResultID
168448
r^ \< \\
8/26/2002
1>Arkansas River BasinArk R9, Periods 1,2,3
w
4 t\ -
4 •
5" 35.o> •**
"""" ^ .TJ
S o 5O "(0w>
'«!? 0 •Q ^
Oc 15-N 1'5
•1 .
0 ^ •
0 -
• Detects o NonD<
^* * »
S60 B65 B70 •B75 980rv.
•B85 -B90i~
telt * TIT*•B95 2000
| Sample Media Flow Period Parameter Units
| Surface Water| | All Flows | | Zinc, Dissolved | | mg/L |
Win Max Avg Std Dev
130 0.001 9.6 0.189753 1.129426
Sources Station Count L Source Count
LNRD-011, 031
Records off chart
Date
6/19/1969
10/16/1968
3/17/1969
StandardValue
9.6
6.4
6
ResultID
246292
246183
246252
8/26/2002
Arkansas River BasinArkR9, Periods 1,2,3
• Detects o NonDetects • PeriodBreak
4.5
3-5
2.5
ocN 1.5
0.5
•B60 •D65 •B70 S75 B80 2000
Date
imple Media Flow Period Parameter Units
Surface Water | | All Flows | | Zinc, Total | | mg/L |
Min Max Avg Std Dev
123 0.005 0.79 0.099146 0.123896
Sources Station Count Source Count
LNRD-011, 031
Records off chart
8/26/2002
Arkansas River BasinArk R10, Periods 1,2,3
• Detects o NonDetects PeriodBreak
nni
0009 .
nnnft -_jO)E n r\r\7 .
"5 n nnfi -
"oin n new .j/j U.UU3
5- nnrtd -
_3
E nnm -•onO fi rvrvp .
nnm -
n -
_^_ a •
»t**..jj
^ ^-B60 B65 B70 fl75 fl80 «85 S90 fl95 2000
Date
Sample Media Flow Period Parameter Units
Surface Water | | All Flows [ | Cadmium, Dissolved | | mg/L |
Min Max Avg Std Dev
236 0.00005][
0.024 0.00106 0.002341
Sources Station Count Source Count
LNRD-001, Oil, 031
Records off chart
Date
7/19/1985
7/19/1985
StandardValue
0.024
0.021
ResultID
344402
344415
8/26/2002
Arkansas River BasinArk R10, Periods 1,2,3
« Detects o NonDetects Period Break
n 1 -,
000 .
nnA -
-J 007 -
o>*~* nnfi ."35o nns -
5 nrvd •
E"O rino .(0 u-uo
O
nn9 -
001 •
0 .«50 965 S70 975 B80
Da
^ £ jT -|.0.
fi85 -B90
te•895 2000
Sample Media Flow Period Parameter Units
Surface Water| | All Flows | | Cadmium, Total ] | mg/L |
Min Max Avg Std Dev
215 0.00005 JL 0.01 0.002318 0.00283
Sources Station Count | 5 \ Source Count
LNRD-001, Oil, 031
Records off chart
8/26/2002

0.1
0.09
0.08
0> 0.07
•O 0.06
8 0.05</>
° 0.04
a 0.03oO
0.02
0.01
04-B60
Arkansas River BasinArk R10, Periods 1,2,3
« Detects o NonDetects PeriodBreak
965 970 975 980 •885 990 995 2000
Date
Sample Media Flow Period Parameter
Surface Water"") | All Flows ~| | Copper, Dissolved | | mg/L |
Min Max Avg Std Dev
214 0.0002 0.013 0.002161 JL 0.001846
Sources Station Count Source Count
LNRD-001, Oil, 031
Records off chart
8/26/2002
•Arkansas River BasinArk R10, Periods 1,2,3
F0°
n 1R .
n ifi -
-— •* n id. .
^>E 0 19 -
1 01-
0> 008 •Q.Q.
O 006 •
OO4 -
nr»9 .
0 -•a
• Detects ° NonD<_ . ._ .
50 fl65 B70
•
• •t *
9&s iU* . ^1^ »«75 B80 B85 B90 B95 2000
Date
Sample Media Flow Period Parameter Units
Surface Water | | All Flows | | Copper, Total | fmg/L |
Min Max Avg Std Dev
223 0.0005 ][ 0.43 0.007344 0.028992
Sources Station Count Source Count
LNRD-001, Oil, 031
Records off chart
Date6/11/1990
StandardValue0.43
ResultID10608
8/26/2002
Arkansas River BasinArk R10, Periods 1,2,3
» Detects o NonDetects PeriodBreak
noR -,
HOAR -
004 •
c; n ms --g, U.UJO
E*""* HIT* .•o%M(0« nn? -
TJi? 001S-_l
001 -
nnn^ -
n .050 -B65 -B70 S75 -880
Da
»
•« «• «»i «U *• • » . «i• • « • & A V«» itnMMM m mA
•B85 fl90
te•B95 2000
Sample Media Flow Period Parameter Units
Surface Water ] | All Flows | | Lead, Dissolved | | mg/L |
Min Max Avg Std Dev
232 0.00025 0.022 0.001655 0.002035
Sources Station Count Source Count
LNRD-001, Oil, 031
Records off chart
8/26/2002

Arkansas River BasinArk R10, Periods 1,2,3
• Detects o NonDetects PeriodBreak
n R -,
ftA^ .
ft A. .
ft *V> -_l|> 03-
"*5 ftO* .
£0 9 -•o u-*
(00)
— ' n 1*1 -
0 1 -
006 -
n -«30 B65 -870 B75 "880
Da
«
* « .9**** f -n Ar«f
•B85 -B90
te
— -^ • *^^fc^»*^i^^
B95 2000
Sample Media Flow Period Parameter Units
Surface Water) | All Flows | | Lead, Total | | mg/L |
Win Max Avg Std Dev
216 0.0005 0.08 0.004015 0.006399
Sources Station Count Source Count
LNRD-001, Oil, 031
Records off chart
8/26/2002

«>Arkansas River BasinArk R10, Periods 1,2,3
• Detects o NonDetects PeriodBreak
4.5
0)
d)
I"wM
O
N
0.5
0-1—•960 S65 -B70 •B75 B80 -B85 -990 -B95 2000
Date
Sample Media Flow Period Parameter Units
Surface Water | | All Flows | [ Zinc, Dissolved | | mg/L |
Min Max Avg Std Dev
201 0.0005 0.12 0.010528 0.014209
Sources Station Count Source Count
LNRD-001, Oil, 031
Records off chart
8/26/2002
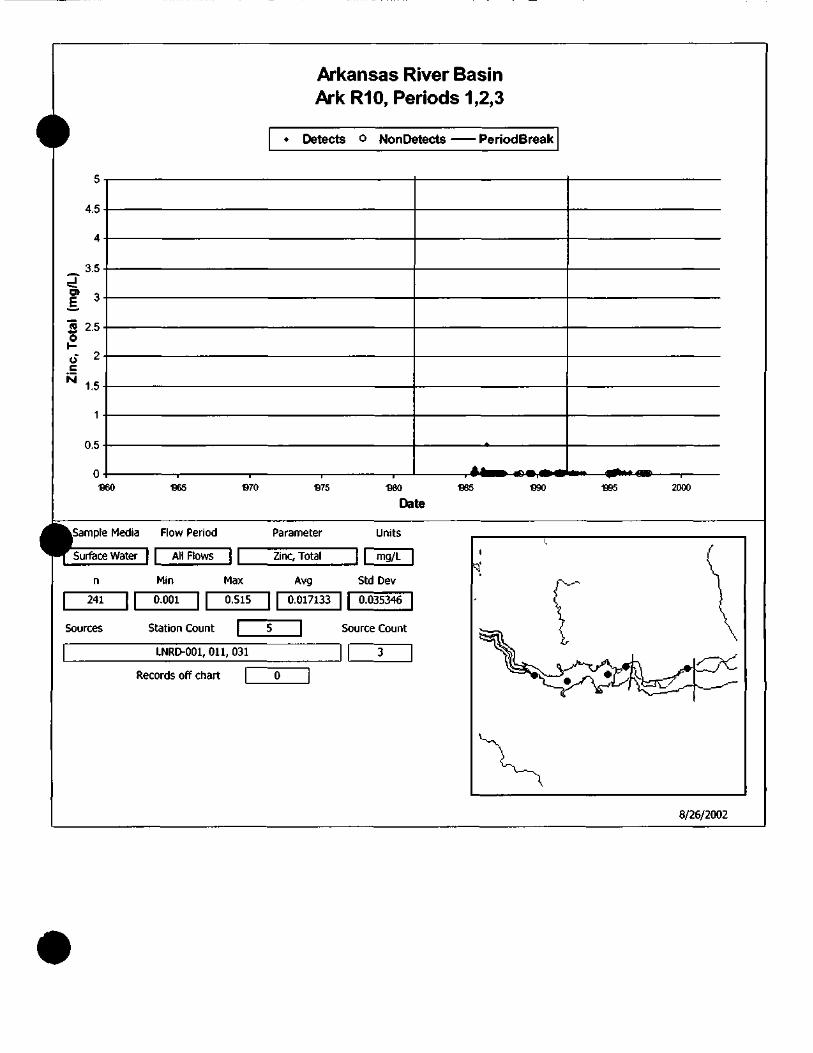
5
4.5
4
-. 3-5
_J
1 3
5 2.5
ucN 1.5
1
0.5
•B60
Arkansas River BasinArk R10, Periods 1,2,3
• Detects o NonDetects PeriodBreak
B65 •870 B75 •B80 985 •B90 B95 2000
Date
Sample Media Flow Period Parameter Units
Surface Water] | All Flows | | Zinc, Total | | mg/L |
Min Max Avg Std Dev
241 0.001 0.515 0.017133 0.035346
Sources Station Count Source Count
LNRD-001, Oil, 031
Records off chart
8/26/2002
APPENDIX J
Terrestrial White Paper
UPPER ARKANSAS RIVER BASINSITE CHARACTERIZATION REPORT - SUPPORTING ANALYSIS:
CHARACTERIZATION OF THE POTENTIAL FOR INJURY TOMAMMALIAN WILDLIFE
TABLE OF CONTENTS
1.0 INTRODUCTION 1
2.0 PATHWAYS 2
2.1 Conceptual Model 2
3.0 SUMMARY OF AVAILABLE DATA 3
4.0 CHARACTERIZATION OF POTENTIAL INJURY 5
4.1 Small Mammals 6
4.1.1 Histopathology 6
4.1.2 Metal Concentrations in Tissues 8
4.1.3 Conclusions - Small Mammals 10
4.2 Large Mammals 11
4.2.1 Characterization of Potential Injury -Concentration-Based Benchmarks
for Forage 13
4.2.2 Characterization of Potential Injury - Estimated Metal Ingestion Rates. 13
4.2.3 Conclusions - Large Mammals 15
5.0 REFERENCES 17
1.0 INTRODUCTION
This paper supplements analysis of potential injury to mammalian wildlife presented in the Site
Characterization Report (SCR) prepared for the 11-Mile Reach of the Upper Arkansas River Basin near
Leadville, Colorado. The Consulting Team (CT) was tasked with reviewing the existing data for the 11-
Mile Reach and describing injuries to natural resources based upon that information. This supplemental
analysis is consistent with the Memorandum of Understanding (MOU) Work Plan for the SCR and
considers the U.S. Department of the Interior (DOI) Natural Resource Damage Assessment (NRDA)
regulations [43 CFR 11].
According to NRDA regulations [43 CFR 11.62(f)(3)], determining injury to biological resources,
including mammalian wildlife, must be based on establishing a statistically significant difference in
response levels between the population in the study area and that of a control area. The regulations also
define specific categories of injury for biological resources and state that injury determination must be
based on measurement methodologies that are capable of demonstrating the specific biological response
under consideration. For the 11-Mile Reach, there are limited data that allow for direct determination of
injury to mammalian wildlife. Because there are limitations in the amount and extent of injury-specific
data, the existing information is combined with data from the nearby California Gulch Superfund Site and
information from the ecotoxicological literature to characterize the potential for injury to mammals using
a weight-of-evidence approach consistent with ecological risk assessment methodologies (e.g., USEPA
1997b). In general, this includes evaluation and comparison of known and estimated exposure of wildlife
to ecotoxicological benchmarks corresponding to known levels of toxicity. This approach is consistent
with the goals of the MOU, and the approach that the CT has taken in the SCR. This paper describes
available information that is applicable to characterizing the potential for adverse effects in mammals, and
summarizes the potential for injury in response to a series of questions from the MOU Parties (see
Attachment A).
2.0 PATHWAYS
2.1 Conceptual Model
A conceptual model describes the sources of contamination and the pathways by which resources
of concern could be exposed to contaminants. A complete pathway, which results in an exposure, does
not necessarily constitute an injury to natural resources as defined in DOI's NRDA regulations. The
exposure must elicit an effect or response which can be measured and which is statistically different
between the study area and a control area.
Conceptual models for exposure of mammals in the 11-Mile Reach have been described in two
ecological risk assessments (ERAs) (Woodward Clyde 1993; USEPA 1997a). The primary sources of
contamination in the 11 -Mile Reach are mining and mineral processing wastes from the Leadville mining
district. ERAs have shown that the primary chemicals of concern in the 11-Mile Reach are the metals
cadmium, lead, and zinc.
Historically, California Gulch has been a major pathway for transport of solid and soluble forms
of the metals to downgradient areas; including the Arkansas River. Periodic flooding has resulted in
deposition of mine wastes along the river. In addition, floodplain soils may have been affected by
overland runoff and irrigation of pasturelands with contaminated water. Mammals may be exposed to
metals through direct contact with mine wastes or secondarily through contaminated surface water, soil,
or sediment; or through ingestion of forage or prey that may have accumulated metals from biotic and
abiotic sources. Injuries to surface water, soil, sediment and vegetation that comprise habitat for
mammalian wildlife are described and evaluated in the SCR.
The frequency and duration of contact with contaminated media are important in characterizing
the potential for injury to mammalian wildlife. Habitat quality and availability in contaminated areas are
major factors affecting the frequency and duration of contact. This is especially true for large, mobile
species such as elk, deer, and coyotes that range over large areas and may spend only a portion of their
time in the area of concern. Smaller, less mobile species such as rodents (e.g., mice and voles) and
lagomorphs (e.g., rabbits) range over smaller areas and may contact contaminated media more frequently.
3.0 SUMMARY OF AVAILABLE DATA
Information available to characterize the potential for injury to mammals includes
histopathological data for small mammals in the 11-Mile Reach, data on target organ metal
concentrations, and metal concentrations in exposure media (e.g. soil, water, vegetation). In addition,
similar data are available from nearby areas in the California Gulch Superfund Site (but outside the 11-
Mile Reach), and information from the ecotoxicological literature can be used to characterize the potential
for injury based on exposure estimates.
Site-specific information from the 11-Mile Reach and the upstream reference area (Reach 0)
includes:
• Histopathological analyses of vole and short-tailed weasel tissue samples from Reaches 0
and 2 (WCC 1993);
• Metal concentrations in kidney and liver tissue from small mammals (WCC 1993); and
• Metal concentrations in vegetation, soil, and water in Reaches 1, 2, and 3 (Keammerer
1987; Levy et al. 1992; WCC 1993).
Data from outside the 11-Mile Reach, but within the nearby California Gulch Superfund Site
include:
• Histopathological analyses of mouse, vole, and chipmunk tissue samples from several
locations with varying levels of mine waste contamination (WCC 1993; Stoller 1996);
• Metal concentrations in kidney and liver tissue from small mammals (WCC 1993; Stoller
1996); and
• Metal concentrations in vegetation, soil, and water (WCC 1993; Stoller 1996).
Data available from the scientific literature include ecotoxicological benchmarks for:
• Metal concentrations in mammalian tissues from laboratory and field studies;
• Metal concentrations in mammalian tissues associated with specific effects;
• Metal intake rates [i.e., Toxicity Reference Values (TRVs)]; and
• Metal concentrations in forage and prey items.
The above information is used to help evaluate whether metal concentrations in mammal tissues or abiotic
media in the 11-Mile Reach are consistent with nearby conditions for which more data on injury are
available. In some cases, the data from the California Gulch Superfund Site reflect higher metal
concentrations and bioavailability than in the 11-Mile Reach, and represent a reasonable worst-case
scenario. The characterization is further supported by literature-based ecotoxicological benchmarks that
correspond to known levels of toxicity and/or injury.
Data on metal content and histopathology in larger mammals (e.g. elk, deer, fox) are lacking for
the 11-Mile Reach. However, data on injury to small mammals are available to help characterize the
potential for injury to larger species that are more mobile and spend less of their life cycles in the 11-Mile
Reach.
4.0 CHARACTERIZATION OF POTENTIAL INJURY
The CT's characterization of the potential for injury to mammals follows a weight-of-evidence
approach consistent with DOI's NRDA regulations and EPA's ecological risk assessment methodologies.
Histopathological data from the 11-Mile Reach and from Reach 0 are used to directly assess injury to
small mammals. The histopathologic data is important because the presence of lesions in biological
tissues associated with contaminants exposure is specifically identified as an injury in the NRDA
regulations [43 CFR 11.62(f)(4)(vi)(D)]. Because there is a limited amount of injury-specific data, other
types of data are used as supporting weight-of-evidence to evaluate the uncertainty associated with the
small histopathological data set.
Metal concentrations in kidney and liver samples are compared to ecotoxicological benchmarks
that are associated with known levels of histopathological or physiological dysfunction. Internal organ
and soft tissue malformation and histological lesions are the most common metals effects reported in the
literature and associated with benchmark values. Several recently published secondary sources report
benchmark values for wild mammals that are based on comprehensive reviews of field and laboratory
studies (Hoffman et al. 1995; Beyer et al. 1996; Eisler 2000; Shore and Rattner 2001). A large number of
laboratory and field studies were reviewed and it was determined that the majority of the literature is
consistent with the benchmarks and associated effects presented in these secondary sources. Of the
studies reviewed, most of the mammalian studies, which evaluated metals exposure and accumulation,
were conducted on mining impacted sites and are therefore appropriate for consideration in the Upper
Arkansas River Basin (UARB).
To further evaluate the level of uncertainty associated with limited histopathological data, metal
concentrations in vegetation, small mammals, soil, and water are used to estimate the rate at which
wildlife may ingest metals while feeding and drinking. These estimates are compared to TRVs, which are
intake rates corresponding to known toxicological effects or lack thereof (EPA 1993, 1997b; Eisler 2000).
In addition to data collected from the 11-Mile Reach, information from California Gulch and the
scientific literature are used to help evaluate the potential for injury to mammals in the 11-Mile Reach.
Because of the proximity to mine-waste tailings and smelter residues, data from California Gulch reflect
higher metal concentrations and greater bioavailability than conditions in the 11-Mile Reach and,
therefore, represent a worse case scenario that can be used as a point of comparison. The characterization
was further developed by comparing non-injury specific data from both the 11-Mile Reach and California
Gulch to literature-based ecotoxicological benchmarks that correspond to known levels of toxicity and/or
injury. This includes benchmarks comparable to metal concentrations in tissues as described above, as
well as dose-based (i.e., intake) benchmarks that are commonly used in ERAs.
4.1 Small Mammals
4.1.1 Histopathology
WCC (1993) sampled small mammals from locations in Reach 2, the California Gulch Superfund
Site outside the 11-Mile Reach, and nearby reference areas along Tennessee Creek and the upper
Arkansas River (Reach 0). Approximately 28 tissues from each of 36 animals were examined
histologically using light microscopy. From Reach 2, WCC collected four southern red-backed voles
(Clethrionomys gapperi), two long-tailed voles (Microtus longicaudatus^and two short-tailed weasels
(Mustela ermined) for histological analysis. Samples from Reach 0 included four red-backed voles and
five long-tailed voles.
The sampling locations in Reach 2 were irrigated pastures downstream of the confluence of
California Gulch with the Arkansas River and reflect contamination from deposition of mine wastes,
floodwater, and/or irrigation water. Data on soils and vegetation indicate that the animals were
potentially exposed to elevated metal concentrations in soil and vegetation. The animals were collected
from sites where mean metal concentrations in floodplain soils were 36 ppm cadmium, 968 ppm copper,
4,665 ppm lead, and 6,055 ppm zinc, representing some of the highest concentrations along the 11-Mile
Reach. To a lesser extent, concentrations of the same metals were elevated in vegetation.
As noted, data from WCC (1993) are directly applicable to characterizing injury in the 11-Mile
Reach. Besides the direct applicability for evaluating injury, these data were collected from an area of
confirmed mine waste with contamination-level metal concentrations and from potentially mixed
sources/transport mechanisms. In addition, vegetation from the area contains elevated metal
concentrations creating a true metals exposure scenario. The data set also includes samples from
reference areas of similar habitat.
Results of WCC's histologic analysis indicated no abnormal histopathology or injury that could
be attributed to metals exposure. Although the kidney is the primary site of toxic action of cadmium,
6
WCC did not submit kidneys for histopathology from any of the animals collected. Based on the
experience of the pathologist who conducted these analyses (Dr. Terry Spraker, Colorado State
University), lesions associated with cadmium exposure would not be expected at the tissue concentrations
found in these animals (T. Spraker, Pers. Comm.). This conclusion (that tissue lesions would not be
expected to occur at the cadmium concentrations present in vole kidney tissues from Reaches 0 and 2) is
also supported by the ecotoxicological literature (Cooke and Johnson 1996; Eisler 2000; Ma and Talmage
2001).
WCC (1993) also collected liver and kidney samples from areas on the Superfund Site (St.
Josephs Cemetery and Hamm's Mill) in which soils metal concentrations were higher than those found in
the 11-Mile Reach. Cadmium, lead, and zinc concentrations in kidney and liver samples from these
Superfund Site locations were equal to or higher than concentrations from Reach 2. Despite the higher
concentrations in soils and equivalent or higher concentrations in tissues, kidney and liver samples from
the Superfund Site locations did not exhibit abnormal histopathology that could be attributed to metal
toxicity. This supports the view that there is low risk of this type of injury for small mammals in the 11-
Mile Reach, Based on this information, the absence of kidney histologic analysis is not critical to
evaluating small mammal injury for the WCC data set.
Histopathological analyses of small mammal liver and kidney tissue are also available from
Upper California Gulch (Stoller 1996). Upper California Gulch is part of the Superfund Site and contains
soils, mill tailing and waste rock with varying metal concentrations. Sample locations included uplands
as well as locations containing fluvial tailings deposits and waste rock in riparian areas. A total of
twenty-five animals including primarily least chipmunks (Eutamias minumus) and deer mice (Peromyscus
maniculatus), but also a southern red-backed vole and a long-tailed vole were collected from locations
representing a wide range of metal contamination. Animals were collected directly from waste rock and
tailing piles; from locations near, but not on waste piles; and from sites remote from waste piles in the
study area and reference area (Iowa Gulch). In samples from all locations, results indicated "minimal" to
"slight" occurrence of lesions. Neither the frequency nor intensity of lesions was correlated with
proximity to mine waste deposits. These results indicate that these animals showed no signs of
histopathological injury due to metals exposure.
Limitations affecting use of the WCCs (1993) histopathological data include low sample number
(6 animals) and lack of data from other locations in the 11-Mile Reach. In addition, small mammal data
from Reach 2 are for herbivorous vole species only. The Stoller (1996) data are not from the 11-Mile
Reach, but samples were collected from a gradient of contamination including animals inhabiting waste
rock piles with high metal concentrations (cadmium over 100 ppm, lead over 40,000 ppm, and zinc over
15,000 ppm); as well as areas of nearby soils with lower metal concentrations. The histopathology results
can be used in conjunction with data on metal concentrations in liver, kidney, soils, and vegetation in the
weight of evidence approach to characterize the potential for injury. Limitations on use of the Stoller
(1996) data include the lack of samples from the 11-Mile Reach and the lack of data from species other
than granivorous/herbivorous species.
Insectivorous species such as shrews, may accumulate more cadmium than granivores (seed
eaters) and herbivores (vegetation eaters) because terrestrial insects (their main dietary component)
generally accumulate higher cadmium concentrations than vegetation (Cooke and Johnson 1996). Several
shrew species potentially occur in the Upper Arkansas River Valley. WCC (1993) captured 3 montane
shrews (Sorex monticolus) during their small mammal trapping effort to determine relative abundance,
but they did not capture any shrews when they sampled for tissue collection.
4.1.2 Metal Concentrations in Tissues
It is generally accepted that diagnosis of metals poisoning as cause of death is established
through a synthesis of necropsy observations, pathological findings, and tissue concentrations. Death
(from metal poisoning) cannot be diagnosed on the basis of tissue concentrations only, but metal
poisoning can be diagnosed from concentrations if sufficient data exist from the same or related species
showing a relation between illness and concentrations (Franson 1996). Metal concentrations in biological
tissues are not a direct measure of injury endpoints cited in DOI's NRDA regulations. However,
toxicological studies of metal exposure have resulted in estimates of tissue metal concentrations that are
correlated with histological effects and/or adverse physiological and biochemical effects. These types of
effects are specific injury categories cited in the NRDA regulations. Thus, benchmark concentrations can
be used in conjunction with tissue concentrations in samples from the site and reference areas to support
the direct measures of injury and further characterize the potential for injury due to metals exposure.
Metals are not degraded by metabolism; therefore, measure of metal concentrations in target organs is a
relatively direct measure of exposure. As noted above, kidney and liver are important sites of metal
toxicity in vertebrates. Therefore, data on metal residues in kidney and liver can be used to characterize
the risk of adverse effects and the potential for injury.
Benchmark levels cited in the following discussion were taken from 1996 summaries of scientific
literature on cadmium and lead toxicity in small mammals (Cooke and Johnson 1996, Ma 1996). For
cadmium, Cooke and Johnson (1996) recommend 100 mg/Kg (wet wt) (350 mg/Kg dry wt) as critical
concentration in kidneys of small mammals. No analogous recommendations for cadmium in liver tissue
were provided since the kidney is the primary target organ in cadmium toxicity. For lead, Ma (1996) cites
concentrations of 6 to 10 mg/Kg (dry wt) in kidney and 2.5 to 5 mg/Kg (dry wt) in liver as no-observed-
adverse-effects levels (NOAELs) for effects ranging from changes in the somatic organ index to
reproductive effects.
Data on metal residues in small mammal kidney and liver samples from Reach 0 and Reach 2 are
available from WCC (1993). For Reach 2, there are individual and composite liver and kidney samples
from voles and short-tailed weasels (Table 1). For Reach 0, there are kidney and liver composite samples
from voles only (Table 2). Ideally, composite samples represent an average value of those individuals
making up the composite sample. However, the variability around that average value is unknown as is
the case with the composite samples submitted by WCC (1993). As with the histopathology studies,
chemical residue data are also available from other sampling locations in California Gulch outside the 11-
Mile Reach (WCC 1993; Stoller 1996). Data are available for red-backed voles, long-tailed voles, deer
mice, and least chipmunks from locations representing a wide range of metal concentrations in soils.
Kidney cadmium concentrations in small mammals did not exceed NOAEL, lowest observed,
adverse effect level (LOAEL), or critical concentrations associated with injury in small mammals (Figure
1). Maximum cadmium concentrations in kidneys from Reach 0 or Reach 2 did not approach the 350
mg/Kg (dry wt) critical concentration identified by Cooke and Johnson (1996). The maximum cadmium
concentration identified in Reach 2 was 39 mg/Kg dry wt. (11.1 mg/Kg wet wt), while the maximum
concentrations from the entire WCC study was 69 mg/Kg dry wt. (19.7 mg/Kg wet wt) (WCC 1993,
Table 7-15). The maximum cadmium concentration in surface soils co-located with small mammal
samples was approximately 55 mg/Kg. By contrast, the maximum cadmium concentration in chipmunk
kidneys from Upper California Gulch was 119 mg/Kg dry wt. (34 mg/Kg wet wt.) and was associated
with concentrations in surface soil of less than 15 mg/Kg (Stoller 1996, Figure 3-8).
These results indicate that maximum cadmium concentrations in small mammals from Reach 2,
and from the overall Superfund site do not exceed the recommended threshold concentrations for
physiological and histopathological effects (Cooke and Johnson 1996). In addition, the results suggest
that overall cadmium bioavailability from soils and plant materials may be less along the 11-Mile Reach
than in some areas of the Superfund Site.
Lead concentrations in liver and kidney also did not exceed concentrations associated with
ecologically important effects (Figure 2). The maximum concentration in kidney and liver was
approximately equal to NOAEL-based concentrations for sublethal effects. Lead was detected in only
one of three liver samples collected from Reach 0 and Reach 2 (Detection Limit <0.5 mg/Kg)(WCC
1993).
Limitations of chemical residue data from the WCC (1993) study are similar to those cited for
histopathology. The sample size for 11-Mile Reach is small, and samples are not available from segments
downstream of Reach 2. However, the samples represent maximal, or near maximal exposures for the 11-
Mile Reach.
Only herbivorous voles were included in the WCC samples, and only granivorous/herbivorous
chipmunks were collected from Upper California Gulch. Small mammals with more insectivorous diets,
such as shrews, might be expected to accumulate greater amounts of cadmium (Cooke and Johnson 1996;
Ma and Talmage 2001). Based on data from the literature, cadmium accumulation in shrew kidneys can
be more than 25 times that of herbivorous rodents (Cooke and Johnson 1996). Tissues from the captured
shrews in the 11-Mile Reach were not analyzed, but concentrations 25 times that of vole kidneys would
exceed Cooke and Johnson's critical levels for adverse effects on renal function and structure, and may be
consistent with a positive injury determination. However, the literature also indicates that in comparison
to rodents, shrews may be more resistant to cadmium exposure through a greater metallothionein-related
detoxication capacity of the target organs (i.e., liver and kidney) (Shore and Douben 1994; Cooke and
Johnson 1996; Eisler 2000; Ma and Talmage 2001). Therefore, literature-based benchmarks used for
rodents may not be appropriate for insectivores such as shrews and it is unclear whether the
concentrations present at the site cause injury to shrews.
4.1.3 Conclusions - Small Mammals
Data are available for directly evaluating injury to small mammals in the 11-Mile Reach,
although sample sizes are small and geographical coverage is limited. Six samples of voles are available
from Reach 0 and Reach 2. Overall, histopathological analyses of these samples show no injury to small
10
mammals in either Reach 0 or Reach 2. While the kidney is the primary organ associated with cadmium
toxicity in mammals, kidneys were not analyzed for histopathology in samples collected from Reach 0 or
Reach 2. The small sample size, limited geographical coverage, and lack of kidney histological analysis
creates some uncertainty in the data; however, this uncertainty is reduced by the following:
(1) Metal concentrations in kidney and liver samples from Reach 2 samples did not
exceed benchmarks associated with physiological and histopathological effects;
(2) Samples from the Superfund Site (areas of potentially higher exposure) also did not
contain metal concentrations in excess of benchmarks and;
(3) Samples from the Superfund site (areas of potentially higher exposure) did not
exhibit liver or kidney histopathology, which could be related to effects from metals
exposure.
The results from each of these three data sets are consistent with each other and support the results
reported by WCC (1993). While none of these data sets alone are sufficient to evaluate injury, the
weight-of-evidence provided by one injury-specific data set and three supporting data sets lends more
confidence to the overall injury assessment.
Species with more insectivorous diets, such as shrews, may have higher exposures due to higher
dietary cadmium concentrations, but data are not available for direct evaluation of these species. Existing
literature indicates that benchmarks appropriate for rodents may not be appropriate for insectivores, as
insectivores appear to be more tolerant of increased metals exposure.
The apparent lack of effects on individual small mammals receiving maximal or near-maximal
metals exposure indicates a corresponding lack of injury to local populations in the 11-Mile Reach.
Additional samples would reduce the uncertainty in evaluating potential injury, but may not significantly
aid in restoration planning for the 11-Mile Reach (see SCR).
4.2 Large Mammals
Tissue metal data and histopathology analyses for larger mammals (e.g., elk, deer, fox) are not
available for the 11-Mile Reach. However, the potential for injury to large mammals was characterized
by evaluating exposure through the comparison of metal concentrations in forage and estimates of metal
intake rates to benchmarks values. In addition, data on injury to small mammal populations was used to
11
help evaluate the potential for injury to larger species that are more mobile and spend less of their life-
cycles in the 11-Mile Reach. Because small mammals have a relatively small home range, they are likely
to receive a more constant exposure to contaminated media. The 11-Mile Reach is a ribbon of habitat
within the Upper Arkansas River Basin and it is expected that larger mammals will migrate through and
may spend periods of time there. However, large mammal exposure will be considerably less as
compared to that of small mammals.
Generally, data for direct measurement of injury to large mammals are not available, and
characterizing the potential for injury is more difficult and uncertain. In the absence of data on
histopathology or metal residues in tissues, the potential for injury can be estimated using risk assessment
techniques in which the intake of metals is calculated and compared to benchmark intakes of known
toxicity to the receptor or similar species. Data on metal content in food and other ingested materials is
used along with estimates of the daily intake of each medium (Alldredge et al. 1974; EPA 1993, 1997;
Beyer etal. 1994).
Large mammals of greatest concern in the 11-Mile Reach are elk (Cervus elaphus) and mule deer
(Odecoileus hemionus). Elk and mule deer use the 11-Mile Reach seasonally during fall and winter, but
migrate to higher elevations in spring and summer. However, a few individuals may remain through
spring and summer. Elk feed both by grazing on grasses and forbs, and browsing on woody vegetation
(Fitzgerald 1994). Deer are primarily browsers, but opportunistically feed on grasses and forbs
(Fitzgerald 1994). Ungulates could be exposed to metals in forage plants, incidentally ingested soils, and,
to a lesser extent, in surface waters. Data on metal content of grasses, forbs, and shrubs (e.g., willows)
are available from Reach 0, 1, 2 and 3; grass and forb data are available from more downstream areas.
Vegetation data are from Keammerer (1987) and were collected from locations in the floodplain, but
distinct from mine waste deposits. Soils in these areas contain elevated metals concentrations, which tend
to decrease with distance downstream from Reach 1.
Carnivorous mammals such as the coyote (Canis latrans), red fox (Vulpes wipes), North
American badger (Taxidea taxus), and short-tailed weasel (Mustela ermined) also inhabit the 11-Mile
Reach. Individual fox and coyote occupy large areas ranging from several hundred to over 3,000 hectares
(USEPA 1993; Fitzgerald 1994). Badgers and weasels have more restricted home ranges and individual
may spend a large proportion of their time in the 11-Mile Reach. Coyotes, badgers, fox, and weasels are
primary carnivorous, feeding on small mammals and birds. Small mammal whole-body data from
California Gulch (Stoller 1996; USEPA 1997a) and other mine sites suggest that metals are not
12
effectively translocated to the primary prey of these species, thus bioaccumulation is low limiting the
potential for metals exposure to predators.
The potential for injury can be characterized by comparing the potential metals exposure of large
mammals to ecotoxicologically-based benchmarks. This was conducted using two approaches: (1)
comparing metal concentrations in forage plants to benchmarks from the scientific literature and (2)
estimating daily intake of metals from forage foods and soils, and comparing the intakes to TRVs which
represent rates corresponding to known levels of toxicity and injury (EPA 1993, 1997b, Eisler 2000).
4.2.1 Characterization of Potential Injury -Concentration-Based Benchmarks for Forage
There are few ecotoxicological benchmarks available for wild ungulates, therefore, benchmark
metal concentrations recommended for ruminant wildlife and livestock forage or feed are used (Table 3).
The most complete data set available for chemical concentrations in vegetation in the 11-mile reach is that
of Keammerer (1987). Metal concentrations in vegetation for Reaches 0, 1,2, and 3 are shown in Table
4. Except for lead, metal concentrations tended to be higher in forbs than in grasses. Mean metal
concentrations were less than benchmarks for all metals except cadmium. Mean cadmium concentration
exceeded the lowest benchmark of 0.5 mg/Kg for livestock (NAS 1980; Church 1988; Eisler 2000) in all
reaches, including Reach 0. Cadmium exceeded the no-effects criterion (3-5 mg/Kg) in only Reach 3,
and concentrations did not exceed those associated with mild renal dysfunction (10 mg/Kg) in any reach.
Cadmium concentrations in vegetation, especially forbs, were not significantly higher in Reach 1
or 2 than in Reach 0. Forb cadmium concentrations were highest in Reach 3, but differences may not be
significant. These results suggest that concentrations in the downstream sampling locations are not
different from Reach 0 (Figure 3), and that the corresponding potential for injury from cadmium in
vegetation does not differ from baseline conditions represented by Reach 0.
4.2.2 Characterization of Potential Injury - Estimated Metal Ingestion Rates
The potential for injury to large mammals was characterized using standard risk assessment
methodology to estimate the ingestion of metals in food and incidentally ingested soils (USEPA 1993,
1997b). The ingestion rates were then compared to TRVs representing known levels of potential toxicity
and injury. The characterization was phased, starting with a screening-level analysis (USEPA 1997b),
13
which includes conservative assumptions about exposure (i.e., ingestion) and toxicity (i.e., most sensitive
endpoints) in order to minimize the chance of underestimating the potential for injury.
The potential for injury was characterized for mule deer to represent grazing/browsing ungulates.
Mule deer were selected because they feed on a variety of vegetation types in the area and may remain in
the valley lowland for longer periods of time than elk, which migrate to higher elevations for a large
proportion of the year. Mule deer food and incidental soil ingestion rates were taken from the scientific
literature:
• Food ingestion rate: 0.02 Kg food/Kg bw/day (Alldredge et al. 1974)
• Soil ingestion rate: 0.0004 Kg soil/Kg bw/day (Beyer et al. 1994)
Conservative assumptions about bioavailability and contact rate were also used:
• Assuming that 100 percent of metal ingested in food is absorbed (i.e., 100 percent bioavailability)
• The receptor obtains 100 percent of food and incidentally ingested soil from the 11 -Mile Reach
Both of these assumptions tend to overestimate exposure since only a small fraction of ingested metals is
generally absorbed from the intestinal lumen (Klaassen 1995; Cooke and Johnson 1996; Eisler 2000), and
individual animals are unlikely to feed exclusively in the 11-Mile Reach.
Estimated ingestion rates were compared to the following NOAEL-based TRVs:
• Cadmium: 0.27 mg/Kg bw/day (Sutou et al. 1980 as cited in Sample et al. 1996)
• Lead: 5 mg/Kg bw/day (Horwitt and Cowgill 1971)
• Zinc: 45 mg/Kg bw/day (Schlicker and Cox 1968 as cited in Sample et al. 1996)
Risk of adverse effect was characterized using the hazard quotient approach (HQ)(USEPA
1997b). The HQ is the ratio of estimated site exposure to the TRY (i.e. [site exposure] / [TRY]). An HQ
greater than 1 indicates site exposures that exceed the TRY. NOAELs represent concentrations below
those expected to elicit adverse effects; the threshold exposure for inducing effects is higher than the
NOAEL and lies between it and the LOAEL. Since the TRVs used in this characterization are based on
NOAELs for sublethal systemic or reproductive effects and chronic exposure durations, an HQ less than 1
is indicative of conditions under which no effects are expected. The conservatism of using NOAEL-
14
based TRVs is compounded by that associated with the exposure estimation methods (i.e., 100 percent
bioavailability, 100 percent site use).
Exposures and risk were estimated for ingestion of cadmium, lead, and zinc in Reaches 0, 1,2,
and 3. The exposure point concentrations in forage plants and soil were assumed to be the mean +1
standard error for each reach (Tables 4 and 5). Since the exposure and risk estimates are based on
conservative, screening-level assumptions, this approach is consistent with the methods used to
characterize injury to plants in floodplain soils.
Calculations and HQs are shown in Table 6, and HQs are summarized in Figure 4. No HQs
exceeded 0.6 for any metal or reach, indicating that exposures are not expected to exceed NOAELs. This
result can be further interpreted as indicating a very low likelihood of injury to ungulates feeding in the
11-Mile Reach, and an even lower likelihood of significant injury or adverse effects on local populations.
4.2.3 Conclusions - Large Mammals
Data on metal concentrations in vegetation suggest that ruminant herbivores such as mule deer
and elk are at some risk from cadmium concentrations in vegetation that exceed the lower range of
recommended levels (0.5 mg/Kg) for livestock (NAS 1980; Church 1988; Eisler 2000). However,
Church (1988) also indicates that cattle are not affected by cadmium concentrations of 3-5 mg/Kg,
suggesting that this range may be more appropriate for characterizing injury. Although cadmium
concentration tend to be higher in samples from downstream reaches, cadmium concentrations in grasses
and forbs from Reach 1, 2, and 3 are not significantly higher than Reach 0 samples, suggesting that the
risk of injury in downstream reaches may not be greater than baseline. Estimations of cadmium intake
from ingestion of forage and soils from each reach do not exceed NOAEL-based TRVs for mammals,
even when conservative screening-level assumptions are used to estimate intake.
Results from small mammals data also suggests that risk of injury to large mammals is minimal.
Small mammals occupy much more restricted home ranges than larger, more mobile species. Therefore,
individuals that occupy contaminated areas experience much longer duration exposures. The lack of
effects observed in small mammals from Reach 2 and the Superfund site suggests that larger species are
not at risk.
15
As noted above, this approach is not a direct measure of injury to large mammals. Rather, it
helps characterize the potential for injury based on application of general toxicological information to site
conditions. Conservative assumptions were used in the exposure and risk estimation process to minimize
the likelihood that the risk of injury is underestimated. The effects of this conservatism are illustrated by
comparing the estimates of exposure and risk generated by EPA in the site wide ERA (USEPA 1997), to
the actual effects described in this document. EPA's assessments shows hazard indices between 10 and
100 in Reach 1 and 2. However, the exposure assessment presented above, combined with information
on small mammals, is not consistent with significant risk to mammalian wildlife in the 11-Mile Reach.
Taken together, these results suggest that individual ruminants are not likely to be injured in the
11-Mile Reach unless they feed exclusively in the areas of highest contamination. Elk and deer
populations that utilize the 11-Mile Reach are not likely to be injured due to the small proportion of the
11-Mile Reach that is covered by mine wastes and the fact that they do not continually utilize the
contaminated areas.
16
5.0 REFERENCES
Alldredge, A.W., J.F. Lipscomb, and F.W. Wicker. 1974. Forage intake rates of mule deer estimatedwith fallout cesium-137. J. Wildl. Manage. 38:508-816.
Beyer, W.N., G Heinz, and A. W. Redmond-Norwood (Editors). 1996. Environmental Contaminants inWildlife: Interpreting Tissue Concentrations. SETAC Special Publication Series. LewisPublishers.
Beyer, W.N., E.E. Connor, and S. Gerould. 1994. Estimates of soil ingestion by wildlife. J. Wildl.Manage. 58:375-382.
Church, D.C. 1988. The Ruminant Animal-Digestive Physiology and Nutrition. Prentice Hall, NewJersey.
Cooke, J.A. and M.S. Johnson. 1996. Cadmium in small mammals. In: Environmental Contaminants inWildlife: Interpreting Tissue Concentrations. Beyer, W.N., G.H. Heinz, and A.W. Redmon-Norwood (eds.). SETAC Special Publication Series. Lewis Publishers.
Eisler, R. 2000. Handbook of Chemical Risk Assessment: Health Hazards to Humans, Plants, andAnimals. Volume 1 Metals, CRC Press, Boca Raton, FL, 738 pp.
Eisler, R. 1985. Cadmium hazards to Fish, Wildlife, and Invertebrates: A Synoptic Review. U.S. Fish andWildlife Service, Biological Report 85(1.2) 46 pp.
Eisler, R. 1988. Lead Hazards to Fish Wildlife And Invertebrates: A Synoptic Review. U.S. Fish andWildlife Service, Biological Report 85 (1.14) 134 pp.
Eisler, R. 1993. Zinc Hazards to Fish Wildlife And Invertebrates: A Synoptic Review. U.S. Fish andWildlife Service, Biological Report 10, 106 pp.
Fitzgerald, J.P., C.A. Meaney, and D.M. Armstrong. 1994. Mammals of Colorado. Denver Museum ofNatural History, University Press of Colorado 467 pp.
Franson, J.C. 1996 . Cadmium in small mammals. In: Environmental Contaminants in Wildlife:Interpreting Tissue Concentrations. Beyer, W.N., G.H. Heinz, and A.W. Redmond-Norwood(eds.). SETAC Special Publication Series. Lewis Publishers.
Hoffman, D.J., B.A. Rartner, G.A. Burton Jr., J. Cairns Jr. (Editors). 1995. Handbook of Ecotoxicology.CRC Press Inc., Boca Raton, Florida.
Horwitt, M.K., and C.R. Cowgill. 1931. The effects of ingested lead on the organism: H. Studies on thedog. J. Pharmacol. Exper. Therapy. 66:289-301.
Keammerer, W. 1987. Vegetation Studies in the Upper Arkansas River. Unpublished data collected forAsarco.
Levy, D. E., K.A. Barbarick, E.G. Seimer, L.E. Somers. 1992. Distribution and Partitioning of TraceMetals in Contaminated Soils Near Leadville, CO. J. Environ. Quality 21:185-195.
17
Ma, W., and S. Talmage. 2001. Insectivora. In: Ecotoxicology of Wild Mammals. Shore, R.F. and B.A.Rattner (eds.)- pp!23-158. Ecological and Environmental Toxicology Series. John Wiley andSons LtD, West Sussex, England.
Ma, W. 1996. Lead in mammals. In: Environmental Contaminants in Wildlife: Interpreting TissueConcentrations. Beyer, W.N., G.H. Heinz, and A.W. Redmon-Norwood (eds.). pp. 281-296.SETAC Special Publication Series. Lewis Publishers.
NAS. 1980. Mineral Tolerance of Domestic Animals. National Academy of Sciences, Washington D.C.577pp.
Klaasen, C.D. 1995. Casarett and Doulls Toxicology, the Basic Science of Poisons, 5th edition. McGraw-Hill Health Professions Division.
Sample, B.E., D.M. Opresko, and G.W. Suter II. 1996. Toxicological benchmarks for wildlife. 1996revision. Prepared for the US Department of Energy by Lockheed Martin Energy Systems, Inc.ES/ER/TM-86/R3.
Schlicker, S. A. and D. H. Cox. 1968. Maternal dietary zinc, and development and zinc, iron, andcopper content of the rat fetus. J. Nutr. 95: 287-294.
Shore, R.F. and B. A. Rattner (Editors). 2001. Ecotoxicology of Wild Mammals. John Wiley and Sons,West Sussex, England.
Shore, R.F. and P.E.T. Douben. 1994. The Ecotoxicological Significance of Cadmium Intake andResidues in Terrestrial Small Mammals. Ecotoxicology and Environmental Safety, 29:101-113.
Spraker, T. 2001. Personal Communication with Dr. Terry Spraker, Pathologist, Veterinary TeachingHospital, Colorado State University, Fort Collins, CO.
Sutou, S., K. Yamamoto, H. Sendota, and M. Sugiyama. 1980. Toxicity, fertility, teratogenicity, anddominant lethal tests in rats administered cadmium subchronically. I. Fertility, teratogenicity,anddominant lethal tests. Ecotoxicol. Environ. Safety. 4:51-56.
S.M. Stoller Corporation, 1996. Screening Level Ecological Risk Assessment, Operable Unit No. 4,California Gulch Superfund Site. Prepared for Resurrection Mining Company, December 19,1996.
USEPA (United States Environmental Protection Agency). 1993. Wildlife Exposure Factors Handbook.Volume II. " USEPA/600/R93/187b, Office of Research and Development, Washington, D.C.
USEPA (United States Environmental Protection Agency). 1997a. Ecological Risk Assessment for theTerrestrial Ecosystem, California Gulch NPL Site. Prepared for USEPA by Roy F. Weston, Inc.and Terra Technologies. January.
USEPA (United States Environmental Protection Agency). 1997b. Ecological Risk Assessment Guidancefor Superfund: Process for Designing and Conducting Ecological Risk Assessments.Environmental Response Team, Edison, NJ. Interim Final. June 5, 1997.
WCC (Woodward Clyde Consultants). 1993. Terrestrial Ecosystem Evaluation Report California GulchSite, Leadville, Colorado. Prepared for ASARCO Inc., Denver, CO.
18
ATTACHMENT A
QUESTIONS FROM THE MOU PARTIES REGARDING TERRESTRIAL WILDLIFE
1. Clarify difference between literature benchmarks indicating injury and literature benchmarks
indicating risk of injury, (i.e. : the difference between tissue residues that results in effects vs.
soil/vegetation residues that pose a risk of injury)
2. Explain how the existing small mammal data can be used as an indicator of overall mammalian
population health (i.e. based on small mammal life history, they could represent a worst-case
scenario for all mammals) or explain if such an extrapolation is not appropriate.
3. Discuss the representativeness of using the existing small mammal data (primarily herbivores) to
extrapolate to other small mammals (i.e. insect!vores).
4. Explain the selection and application of specific benchmarks and why they are applicable to the
Upper Arkansas River Basin.
5. Explain how the actual injury data is used in conjunction with benchmarks.
6. Present the range of benchmark values considered, their effects, and the basis for choosing
specific ones.
7. Potential shortcomings of Woodward-Clyde not having sent the kidneys from the small mammal
study to the pathologist
8. Discussion of other factors that affect/influence metals exposure and (i.e., species, home range,
diet, etc)
9. How will soil ingestion by mammals be evaluated as a route of exposure?
10. Explain why co-location of Woodward-Clyde samples is a legitimate (conservative ?) approach
19
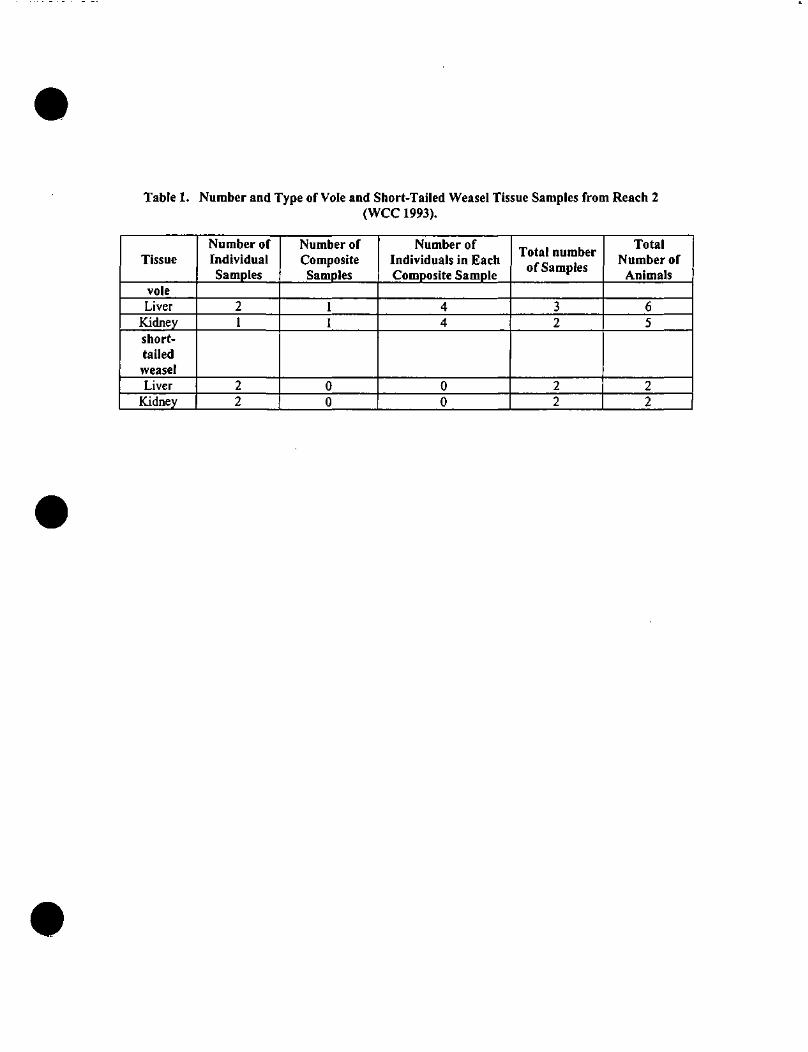
Table 1. Number and Type of Vole and Short-Tailed Weasel Tissue Samples from Reach 2(WCC 1993).
Tissue
voleLiver
Kidneyshort-tailedweaselLiver
Kidney
Number ofIndividualSamples
21
22
Number ofCompositeSamples
11
00
Number ofIndividuals in EachComposite Sample
44
00
Total numberof Samples
32
22
TotalNumber of
Animals
65
22
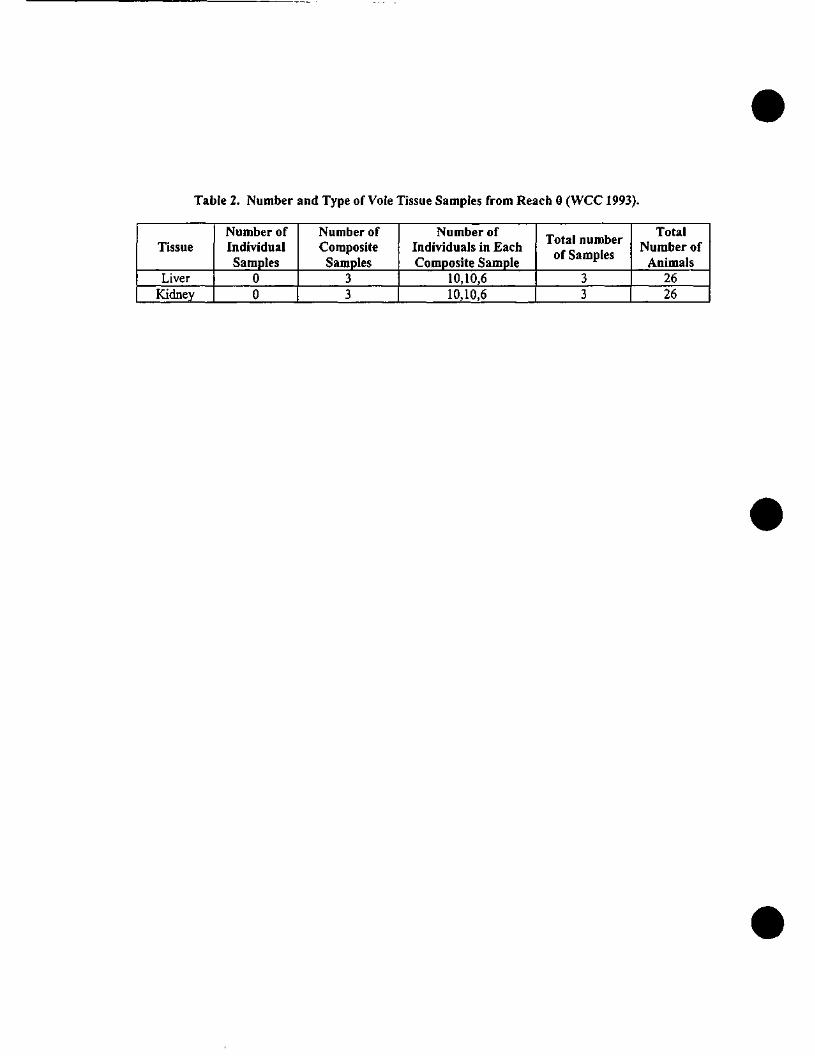
Table 2. Number and Type of Vole Tissue Samples from Reach 0 (WCC 1993).
Tissue
LiverKidney
Number ofIndividualSamples
00
Number ofComposite
Samples33
Number ofIndividuals in EachComposite Sample
10,10,610,10,6
Total numberof Samples
33
TotalNumber of
Animals2626
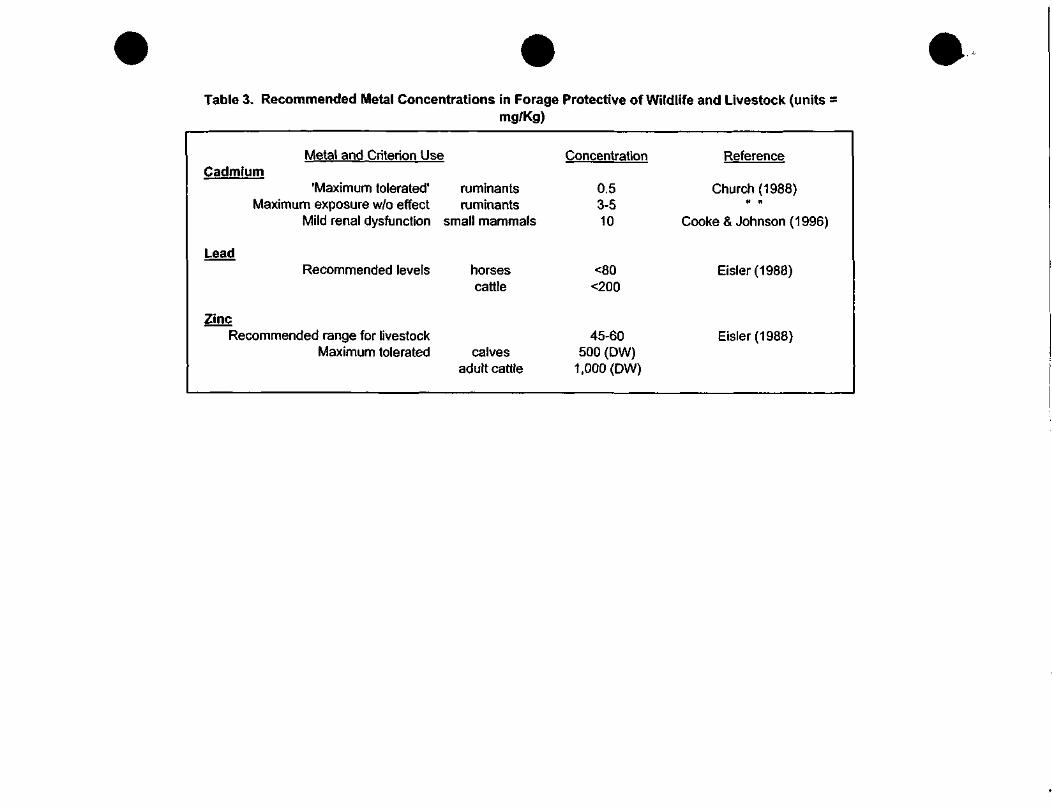
Table 3. Recommended Metal Concentrations in Forage Protective of Wildlife and Livestock (unitsmg/Kg)
Metal and Criterion UseCadmium
'Maximum tolerated1
Maximum exposure w/o effectMild renal dysfunction
Lead
Zinc
Recommended levels
Recommended range for livestockMaximum tolerated
ruminantsruminants
small mammals
horsescattle
calvesadult cattle
Concentration
0.53-510
<80<200
45-60500 (DW)
1,000(DW)
Reference
Church (1988)it ii
Cooke & Johnson (1996)
Eisler(1988)
Eisler(1988)
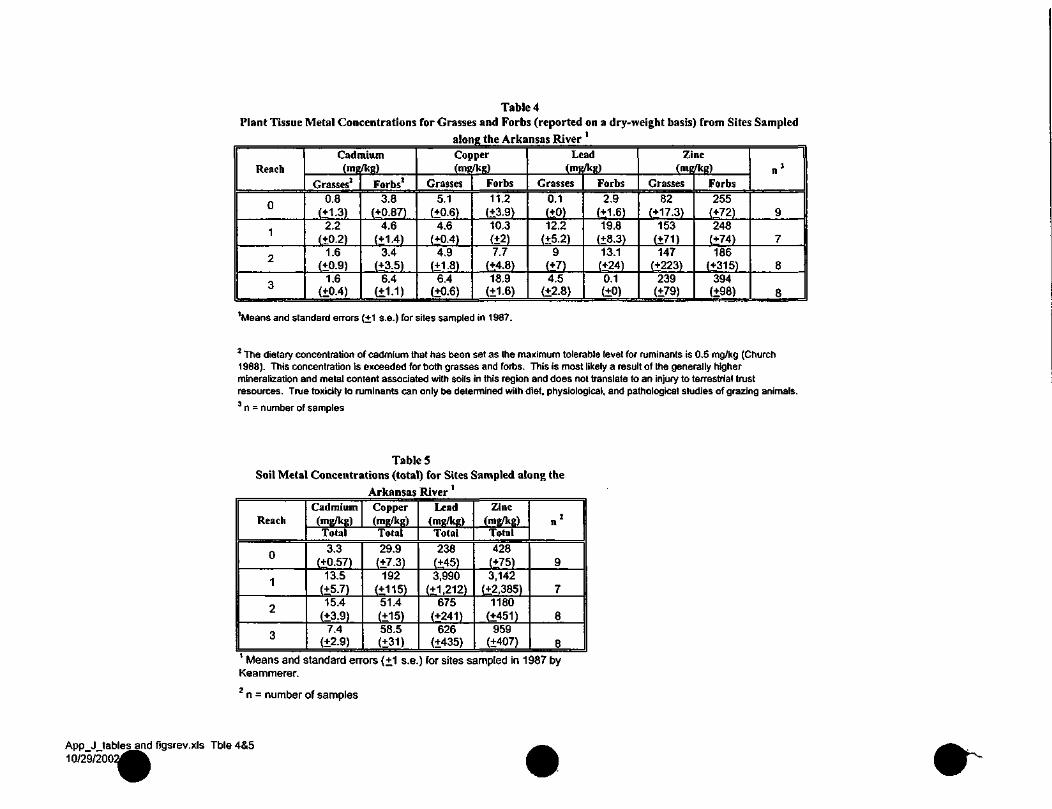
Table 4Plant Tissue Metal Concentrations for Grasses and Forbs (reported on a dry-weight basis) from Sites Sampled
along the Arkansas River '
Reach
0
1
2
3
Cadmium(mg/kg)
Grasses1
0.8(±1.3)
2.2(+0.2)
1.6(±0.9)
1.6(±0.4)
Forbs2
3.8(+0.87)
4.6(+1.4)
3.4(±3.5)
6.4(±1.1)
Copper(mg/kg)
Grasses5.1
(+0.6)4.6
(+0.4)4.9
(±1.8)6.4
(±0.6)
Forbs11.2
(+3.9)10.3(±2)7.7
(±4-8)18.9
(±1-6)
Lead(mg/kg)
Grasses0.1(+0)12.2
(+5.2)9
(±7)4.5
(±2.8)
Forbs2.9
(+1.6)19.8
(+8.3)13.1(±24)0.1(±0)
Zinc(mg/kg)
Grasses82
(+17.3)153
(+71)147
(±223)239
(±79)
Forbs255
(+72)248
(+74)186
(+315)394
(±98)
n 3
9
7
8
8
'Means and standard errors (±1 s.e.) for sites sampled in 1987.
The dietary concentration of cadmium that has been set as the maximum tolerable level for ruminants is 0.5 mg/kg (Church1988). This concentration is exceeded for both grasses and forbs. This is most likely a result of the generally highermineralization and metal content associated with soils in this region and does not translate to an injury to terrestrial trustresources. True toxicity to ruminants can only be determined with diet, physiological, and pathological studies of grazing animals.3 n = number of samples
Table 5Soil Metal Concentrations (total) for Sites Sampled along the
Arkansas River'
Reach
0
1
2
3
Cadmium(mg/kg)
Copper(mg/kg)
Total Total
3.3(±0.57)
13.5(±5.7)15.4
(+3.9)7.4
(±2-9)
29.9(±7.3)192
(±115)51.4(±15)58.5(±31)
Lead(mg/kg)Total
238(±45)3,990
(+1,212)675
(+241)626
(+435)
Zinc(mg/kg)Total
428(±75)3,142
(+2,385)1180
(±451)959
(+407)
in
9
7
8
81 Means and standard errors (±1 s.e.) for sites sampled in 1987 byKeammerer.2 n = number of samples
App J tables_and figsrev.xls Tble 4&510/29/2002
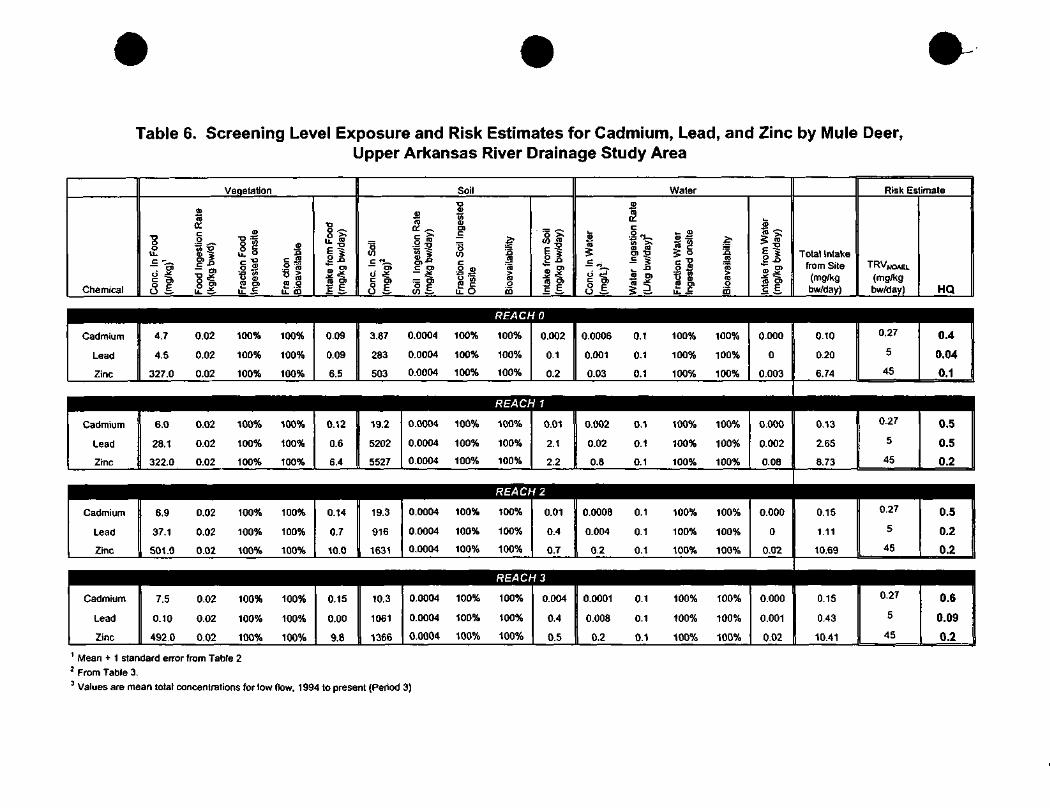
Table 6. Screening Level Exposure and Risk Estimates for Cadmium, Lead, and Zinc by Mule Deer,Upper Arkansas River Drainage Study Area
Chemical
Vegetation
ce-n <= „ S.O •- ,-* O 52 mO Wl ^ O fc -^
U_ 0> ^ U_ ° -^
-n f! P ifo ? § o > r a p i r a . SO.H' u.^ u_c u_co
TJ
8s;
Inta
ke fr
om F
(mg/
kg b
w/d
a
Soil•o
S S<B (D
c ^ ™
=5 II =5 fUD « 5 y) J3
~ '3 c o> o o> 'S
If =s | i 1 .1O <£• t/) -H- u_ O CD
'o ~>i
Inta
ke f
rom
S(m
g/kg
bw
/da
Water0ro
•- o >- »
I It 11 1c 1* 1 c f -— ru ^ 5 o S <Dc =5, - S> "B o roo ? 5 ^ 2 DI oO i- > v IJ- ffi
<u<° •>;
Inta
ke fr
om W
(mg/
kg b
w/d
a
Total Intakefrom Site(mg/kgbw/day)
Risk Estimate
TRVNOAEL
(mg/kgbw/day) HQ
REACH 0
Cadmium
Lead
Zinc
4.7 0.02 100% 100%
4.5 0.02 100% 100%
327.0 0.02 100% 100%
0.09
0.09
6.5
3.87 0.0004 100% 100%
283 0.0004 100% 100%
503 0.0004 100% 100%
0.002
0.1
0.2
0.0006 0.1 100% 100%
0.001 0.1 100% 100%
0.03 0.1 100% 100%
0.000
0
0.003
0.10
0.20
6.74
0.27
5
45
0.4
0.04
0.1
REACH 1
Cadmium
Lead
Zinc
6.0 0.02 100% 100%
28.1 0.02 100% 100%
322.0 0.02 100% 100%
0.12
0.6
6.4
19.2
5202
5527
0.0004 100% 100%
0.0004 100% 100%
0.0004 100% 100%
0.01 0.002 0.1 100% 100%
2.1 0.02 0.1 100% 100%
2.2 | 0.8 0.1 100% 100%
0.000
0.002
0.08
0.13
2.65
8.73
0.27
5
45
0.5
0.5
0.2
REACH 2
Cadmium
Lead
Zinc
6.9 0.02 100% 100%
37.1 0.02 100% 100%
501.0 0.02 100% 100%
0.14
0.7
10.0
19.3
916
1631
0.0004 100% 100%
0.0004 100% 100%
0.0004 100% 100%
0.01
0.4
0.7
0.0008 0.1 100% 100%
0.004 0.1 100% 100%
0.2 0.1 100% 100%
0.000
0
0.02
0.15
1.11
10.69
0.27
5
45
0.5
0.2
0.2
REACH 3
Cadmium
Lead
Zinc
7.5 0.02 100% 100%
0.10 0.02 100% 100%
492.0 0.02 100% 100%
0.15
0.00
9.8
10.3
1061
1366
0.0004 100% 100%
0.0004 100% 100%
0.0004 100% 100%
0.004
0.4
0.5
0.0001 0.1 100% 100%
0.008 0.1 100% 100%
0.2 0.1 100% 100%
0.000
0.001
0.02
0.15
0.43
10.41
0.27
5
45
0.6
0.09
0.2
1 Mean + 1 standard error from Table 22 From Table 3.3 Values are mean total concentrations for low flow, 1994 to present (Period 3)
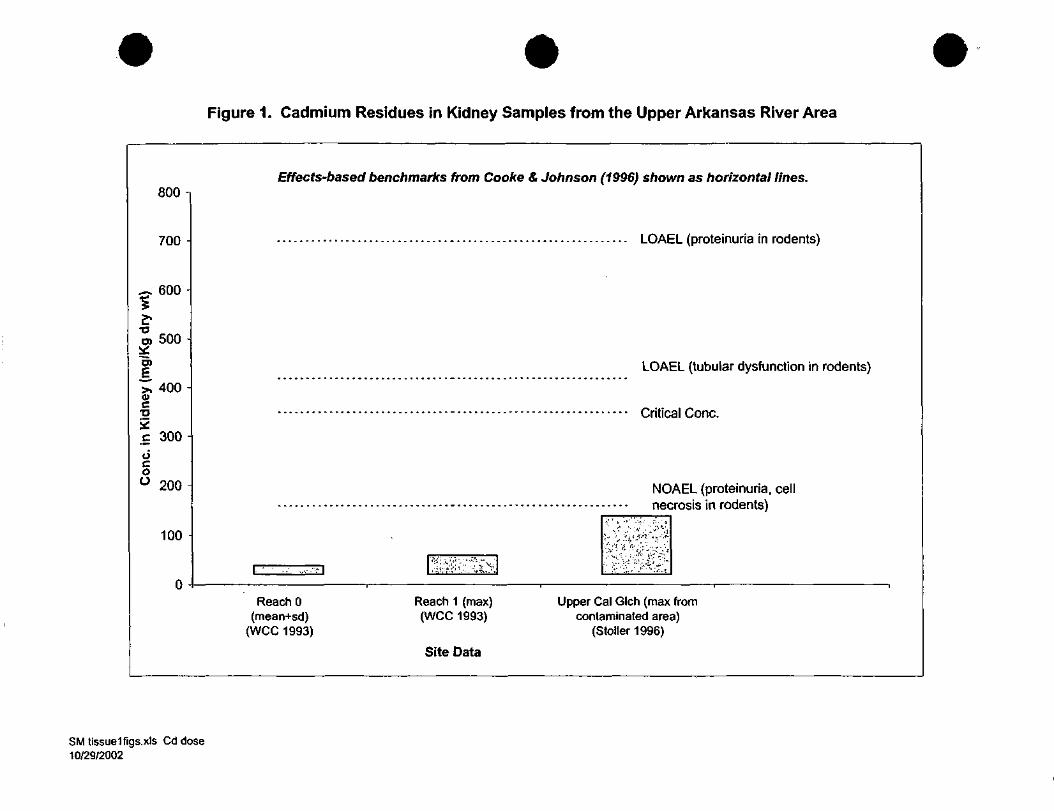
Figure 1. Cadmium Residues in Kidney Samples from the Upper Arkansas River Area
800 -i
700 -
C- 600 -I
500 -
en
400 -03
c 300 -uo0 200
100
Effects-based benchmarks from Cooke & Johnson (1996) shown as horizontal lines.
L
Reach 0(mean+sd)
(WCC 1993)
LOAEL (proteinuria in rodents)
LOAEL (tubular dysfunction in rodents)
Critical Cone.
NOAEL (proteinuria, cellnecrosis in rodents)
Reach 1 (max)(WCC 1993)
Site Data
Upper Cal Glch (max fromcontaminated area)
(Stoller1996)
SMtissue1figs.xls Cd dose10/29/2002
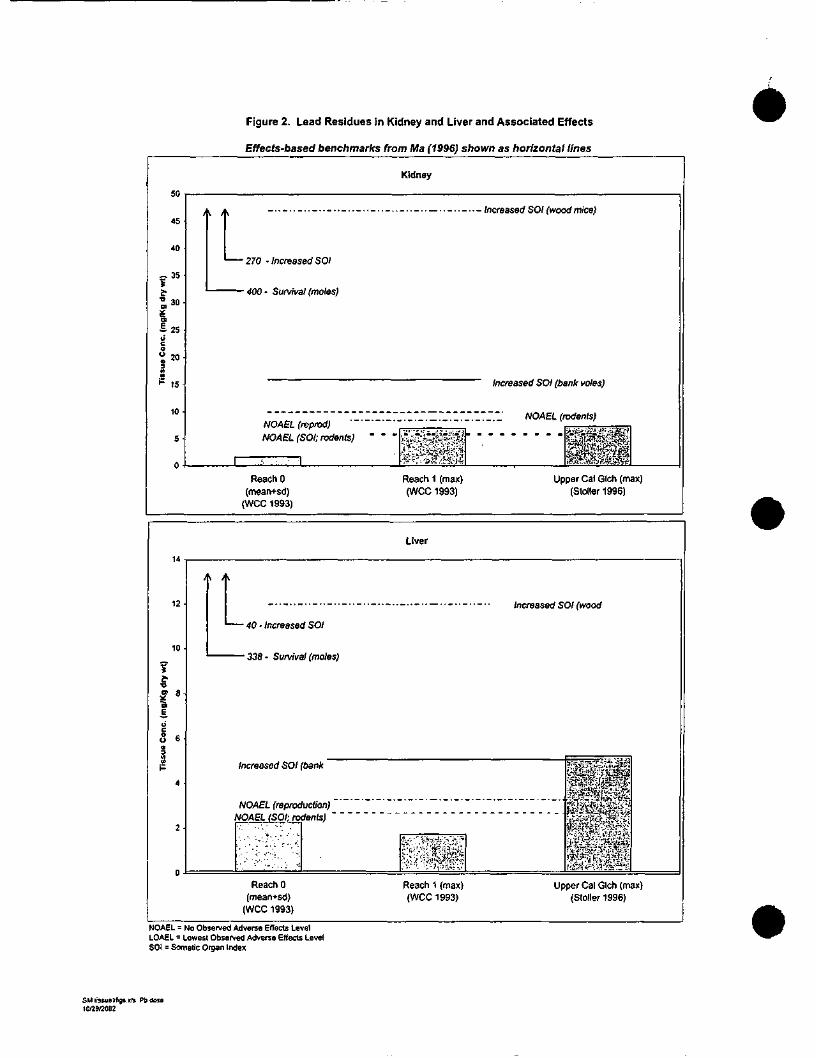
Figure 2. Lead Residues in Kidney and Liver and Associated Effects
Effects-based benchmarks from Ma (1S96) shown as horizontal lines
50
45
40 •
I'"
£25yo" 20-
nnp 15
10-
5 -
0 -
Kidney
' 270 -Increased SOI
' 400 - Survival (moles)
increased SOI (oanK vole
._ _ NOAEL (rodents)NOAEL (reprod)NOAEL (SOI; rodents) m m " giSv~p5p| ££$*£
• m*••. - • - •;••-<-. --4-3 ,-:™SM4< ite*&ia
s;
" • §'^S^v^f^-
5§^JJSSSflH'
Reach 0 Reach 1 (max) Upper Cal Glch (max)(mean+sd) (WCC 1993) (Stoller 1996)
(WCC 1993)
Tis
sue
Con
e. (
mg/
Kg
dry
wt)
3r
of
et
nc
oo
ru
£k
Liver
A A
' 40 - Increased SOI
1 — • • 338- Suivivat (mules)
Increased SOI (bank 5>:5»35£p£|j|_
NOAEL (reproduction) rp i JNOAEL (SOIirodents) ~ ' ' fejsjtF"" ••'-.: • • • . • $3S£
• - ' - • • " ' ' ' : ' • \ ,* -1 <•- '$&&
^;;i-5::>1 ' •" IS
^
--•f'C- .-.b'i
^Sif |f.«?frK
|IMIW
Reach 0 Reach 1 (max) Upper Cal Glch (max)(mean+sd) (WCC 1993) (Stoller 1996)
(WCC 1993)
NOAEL = No Observed Adverse Effects LevelLOAEL = Lowest Observed Adverse Effects LevelSOI = Somatic Organ Index
SM Eisxuo1figs.xls Pb dose10/29/2002
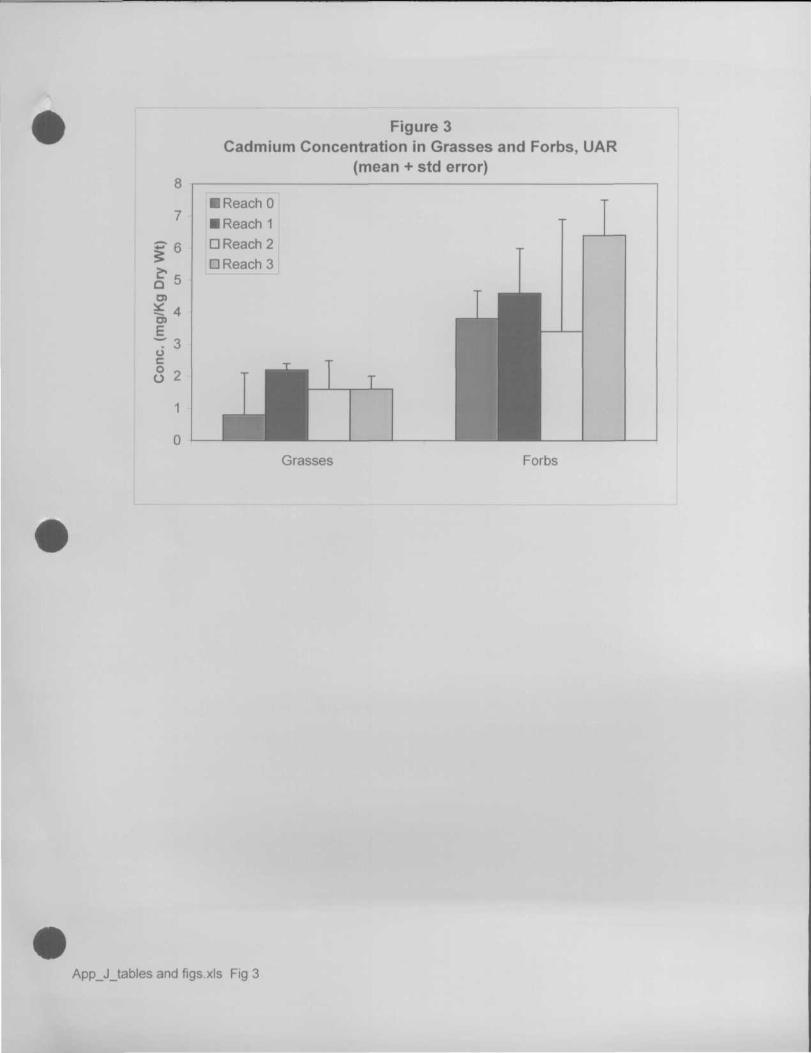
I6
§*01
* 4O)Er 3ucO 0O 2
Figure 3Cadmium Concentration in Grasses and Forbs, UAR
(mean + std error)
• Reach 0
• Reach 1
D Reach 2D Reach 3
Grasses Forbs
App_J_tables and figs.xls Fig 3
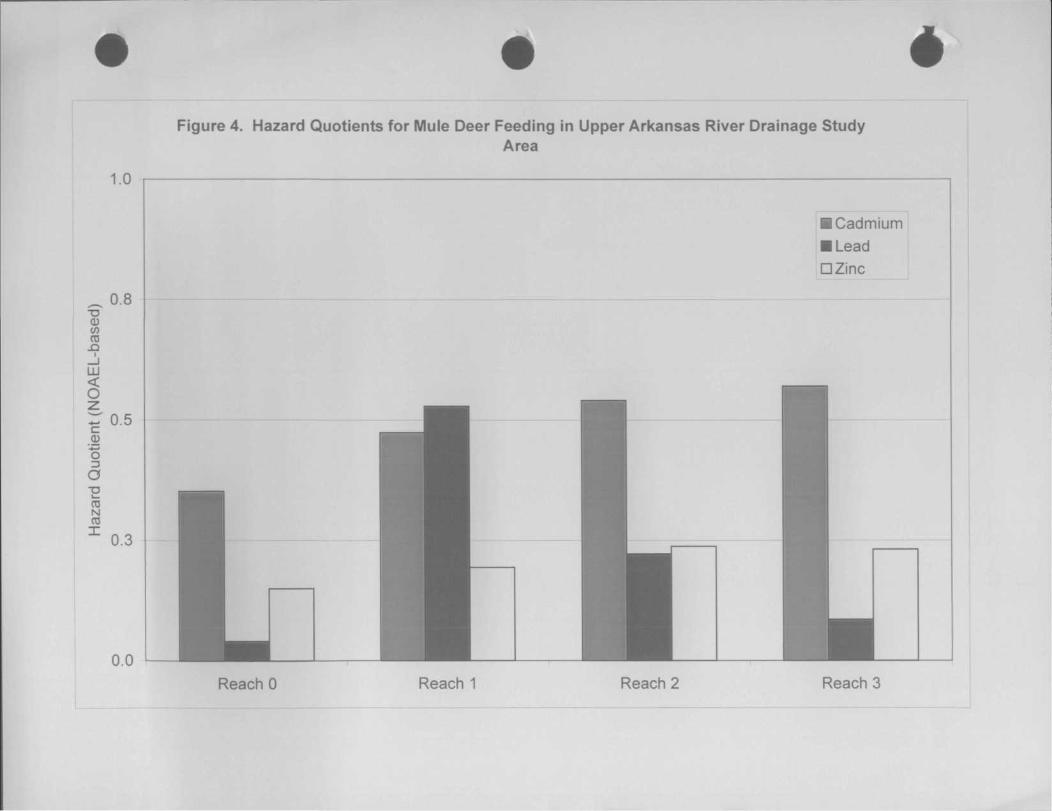
Figure 4. Hazard Quotients for Mule Deer Feeding in Upper Arkansas River Drainage StudyArea
1.0
0.8T30)(ACO.0
LU
r 0.5.0)
"o3O
CDNCOI
0.3
0.0
• Cadmium• LeadDZinc
Reach 0 Reach 1 Reach 2 Reach 3
Related Documents