This report is protected by copyright and was prepared by R.V. Anderson Associates Limited for the account of the City of Ottawa. The material in it reflects our best judgment in light of the information available to R.V. Anderson Associates Limited at the time of preparation. Any use which a third party makes of this report, or any reliance on or decisions to be made based on it, are the responsibility of such third parties. R.V. Anderson Associates Limited accepts no responsibility for damages, if any, suffered by any third party as a result of decisions made or actions based on this report. STUDY REPORT WEST URBAN COMMUNITY – WASTEWATER COLLECTION SYSTEM MASTER SERVICING PLAN – STUDY FINAL Prepared for: City of Ottawa July 2012 RVA102174

Welcome message from author
This document is posted to help you gain knowledge. Please leave a comment to let me know what you think about it! Share it to your friends and learn new things together.
Transcript
This report is protected by copyright and was prepared by R.V. Anderson Associates Limited for the account of the City of Ottawa. The material in it reflects our best judgment in light of the information available to R.V. Anderson Associates Limited at the time of preparation. Any use which a third party makes of this report, or any reliance on or decisions to be made based on it, are the responsibility of such third parties. R.V. Anderson Associates Limited accepts no responsibility for damages, if any, suffered by any third party as a result of decisions made or actions based on this report.
STUDY REPORT
WEST URBAN COMMUNITY – WASTEWATER COLLECTION SYSTEM MASTER SERVICING PLAN – STUDY
FINAL Prepared for: City of Ottawa July 2012 RVA102174
July 5th, 2012 RVA 102174 City of Ottawa Planning and Environment Infrastructure Policy Branch 4th Floor, 110 Laurier Ave. West Ottawa, ON K1P 1J1 Attention: Mr. Joseph Zagorsky, P.Eng. Dear Mr. Zagorsky: Re: West Urban Community Wastewater Collection System Master Servicing Plan – future projection study Thank you for providing comments on the draft version of our Master Servicing Plan study for the West Urban Community Wastewater Collection System. We are now pleased to present two copies of the final version herein. It was a pleasure working with you and we look forward future projects. Yours very truly, R.V. ANDERSON ASSOCIATES LIMITED
Adrian Munteanu, P.Eng. Project Manager RA:de Encls. (2 copies)

City of Ottawa TOC -1
WUC- Wastewater Collection System FINAL Master Servicing Plan - Study Report JULY, 2012 RVA 102174
WEST URBAN COMMUNITY WASTEWATER COLLECTION SYSTEM – MASTER SERVICING PLAN – STUDY REPORT
TABLE OF CONTENTS
Page
EXECUTIVE SUMMARY ................................................................................................... 1
Background / Servicing Strategies ................................................................... 5
Flow Scenarios ................................................................................................... 6
Evaluation of Alternative Servicing Strategies .............................................. 10
Cost and Phasing Schedule ............................................................................ 13
1 INTRODUCTION .............................................................................. 14
1.1 Background and Authorization ............................................................ 14
1.2 Objectives ............................................................................................... 15
1.3 Scope of Work ........................................................................................ 16
1.4 Previous Relevant Studies .................................................................... 16
2 EXISTING WASTEWATER COLLECTION SYSTEM ...................... 18
2.1 Study area and existing configuration ................................................. 18
2.2 Existing conditions and constraints .................................................... 20
2.2.1 Acres Rd. – pump station and sewer trunks: ........................................... 21
2.2.2 Area serviced by March Rd. PS and Signature Ridge PS: ...................... 22
2.2.3 Area serviced by Hazeldean PS and Glen Cairn Trunk: .......................... 22
3 MODELING SCENARIO SELECTION ............................................. 23
3.1 Projected expansion and growth ......................................................... 23
3.2 Design Scenario selection .................................................................... 24
3.3 Future constraints and issues .............................................................. 27
4 SANITARY SEWER SERVICING STRATEGIES – ANALYSIS....... 28
4.1 Investigation approach .......................................................................... 28
4.2 Initial screening ..................................................................................... 31

City of Ottawa TOC -2
WUC- Wastewater Collection System FINAL Master Servicing Plan - Study Report JULY, 2012 RVA 102174
4.2.1 Initial Screening Strategy #1 .................................................................... 31
4.2.2 Initial Screening Strategy #2 .................................................................... 31
4.2.3 Initial Screening Strategy #3 .................................................................... 33
4.2.4 Development of Additional Strategies ...................................................... 33
4.3 Technical Screening – Development of Servicing Options ................ 34
4.3.1 Sewer Corridors Investigation .................................................................. 34
4.3.2 Servicing Options for Strategy #1: ........................................................... 40
4.3.3 Servicing Options for Strategy #2: ........................................................... 45
4.3.4 Servicing Options for Strategy #4: ........................................................... 49
4.4 Evaluation and ranking of sanitary sewer servicing options ............. 53
4.4.1 Evaluation Categories and Criteria .......................................................... 53
4.4.2 Servicing Options Ranking ...................................................................... 53
4.5 Modeling Scenario 3 results for Option 1B ......................................... 56
4.6 Enhancement Opportunities for Option 1B ......................................... 58
4.6.1 Lower Tri-Township Collector .................................................................. 58
4.6.2 Move KWPS to Palladium Drive .............................................................. 59
4.6.3 Acres Road Pumping Station................................................................... 59
4.7 Cost and Phasing Schedule .................................................................. 60
5 CONCLUSION AND RECOMMENDATIONS .................................. 62

City of Ottawa TOC -3
WUC- Wastewater Collection System FINAL Master Servicing Plan - Study Report JULY, 2012 RVA 102174
LIST OF FIGURES
Figure 1-1: Location Plan ............................................................................................................ 15
Figure 2-1: Study Area ................................................................................................................ 19
Figure 3-1: Expansion / growth projection for 2060 .................................................................... 24
Figure 4-1: Servicing Strategy #2 – general plan ........................................................................ 29
Figure 4-2: Servicing Strategy #3 – general plan ........................................................................ 30
Figure 4-3: Proposed Sewer Trunk Corridors for Strategies #1 and #2 ...................................... 37
Figure 4-4: Proposed Sewer Trunk Corridors for Strategy #4 .................................................... 39
Figure 4-5: Strategy #1 – Option 1A ........................................................................................... 41
Figure 4-6: Strategy #1 – Option 1B and Option 1C ................................................................... 42
Figure 4-7: Strategy #1 – Option 1B / interceptor sewer routing options (reference – Stantec’s Technical Memorandum) .......................................................................... 44
Figure 4-8: Strategy #2 – Option 2A ........................................................................................... 47
Figure 4-9: Strategy #2 – Option 2B ........................................................................................... 48
Figure 4-10: Strategy #4 – Option 4A ......................................................................................... 51
Figure 4-11: Strategy #4 – Option 4B ......................................................................................... 52
LIST OF TABLES Table ES 1: WUC Flow Generation Scenarios ............................................................................. 7
Table ES 2: WUC growth development summary ........................................................................ 8
Table ES 3: WUC summary of flow generation scenarios ............................................................ 9
Table ES 4: Option Evaluation Results ....................................................................................... 11
Table ES 5: WUC Flow Generation Summary /preferred servicing solution _ Option 1B ........... 12
Table ES 6: Cost and Phasing Schedule .................................................................................... 13
Table 3-1: Projected area expansion and population growth (includes Bells Corners and Carp) ........................................................................................................................ 23
Table 3-2: WUC – Analysis of Design Flow Generation ............................................................. 25
Table 3-3: WUC wastewater flow generation / pumping stations and trunk sewers ................... 26
Table 4-1: Initial screening for Strategy #2 – gravity sewer from KW PS location to NKT sewer upstream end (tr01000) ................................................................................. 32
Table 4-2: Initial screening for Strategy #2 – gravity sewers from Hazeldean PS and Signature Ridge PS to the location of KW PS .......................................................... 32
Table 4-3: Initial Screening for Strategy #3 / inverts, distances and resulting trunk slopes ........ 33

City of Ottawa TOC -4
WUC- Wastewater Collection System FINAL Master Servicing Plan - Study Report JULY, 2012 RVA 102174
Table 4-4: Initial Screening for Strategy #4 / inverts, distances and resulting trunk slopes ........ 34
Table 4-5: Capital Cost Estimation of Servicing Options* ........................................................... 54
Table 4-6: Life-Cycle Cost Analysis of Servicing Options* ......................................................... 55
Table 4-7: Option Evaluation Results ......................................................................................... 56
Table 4-8: Option 1B – change from 2031 to 2060 Scenario 1 and Scenario 3 ......................... 57
Table 4-9: Cost and Phasing Schedule for Option 1B ................................................................ 60
Table 5-1: Flow generation Scenario 1 ....................................................................................... 63
APPENDICES
APPENDIX A – Previous Relevant Studies
APPENDIX B – Wastewater Collection Model – development and system capacity assessment
APPENDIX C – Technical Screening – sewer calculation
APPENDIX D – Capital Cost and Life-cycle Cost Analysis
City of Ottawa Page -5
WUC- Wastewater Collection System FINAL Master Servicing Plan - Study Report JULY 11, 2012 RVA 102174
EXECUTIVE SUMMARY The City of Ottawa (the City) retained the services of R.V. Anderson Associates Limited (RVA) to undertake a study to evaluate existing wastewater servicing strategy, and to develop and evaluate alternative strategies if necessary to service the planned development in the West Urban Community (WUC) up to the year 2031 and as far as 2060. This study is intended to determine the preferred servicing strategy, whether it results from the previously developed strategies, or from a completely new strategy.
The study is being led by the Infrastructure Policy Unit, with direction being provided by a Technical Advisory Committee (TAC) with representation from the Environmental Services, Infrastructure Services and Planning & Growth Management departments. The process being followed constitutes an internal review of wastewater master planning in the WUC that will be used by staff to update the time lines for project implementation, and to determine the extent of changes to the existing Master Plan projects which may warrant consideration in advance of the 2014 Infrastructure Master Plan (IMP) update.
Our study investigation formulated seven specific options for the WUC wastewater collection system servicing plan and the preferred solution was identified as Option 1B. This option incorporates the following infrastructure components (including the time-line for their implementation):
1. Construction of 1200mm dia. 2100m long North Kanata Trunk – Phase 2 from March Pumping Station (PS) to the end of Phase 1 North Kanata Trunk including connection of Marchwood Trunk to allow gravity flow and bypassing March PS – to be completed by 2014;
2. March PS upgrades (conversion into a low lifting station) including abandonment of the existing forcemain along March Road to be completed by 2014;
3. Replacement and lowering (to allow for future elimination of Watts Creek sewer siphon) of 1650mm dia., 1230m long Tri-Township Collector between Glen Cairn Trunk and the end of Phase 1 of North Kanata Trunk to be completed between 2014- 2017;
4. Signature Ridge PS upgrades Phase 1 (overflow / wet well) to be completed by 2013 and Phase 2 (twining of forcemain) to be completed by 2017 to be coordinated with the proposed Campeau Drive expansion;
5. New Kanata West PS (KW PS) including forcemains to be completed by 2016;
6. Fernbank Trunk sewer to Hazeldean PS to be completed by 2013;
7. New gravity trunk sewer – Interceptor Sewer, and Interceptor Chamber – from the Stittsville / new Fernbank Trunk sewers to KW PS (approximately 3040m long) to be completed by 2021
8. Acres Rd. PS and Watt’s Creek overflow chamber upgrades – to be completed by 2016
The cost estimate for the implementation of Option 1B is $62,860,000 including a 50% allowance for contingency and engineering.
The results of this study will be presented in an information report to Planning Committee and Council in Summer of 2012.
Background / Servicing Strategies
The current WUC wastewater servicing strategy consists of a complex system of pump stations, forcemains and gravity sewers converging to a single pumping station at Acres Road that pumps flows to the Lynwood Collector sewer that ultimately conveys the sewer flows to the

City of Ottawa Page -6
WUC- Wastewater Collection System FINAL Master Servicing Plan - Study Report JULY, 2012 RVA 102174
Robert O Pickard Environmental Center (ROPEC) for treatment. Several communities such as Carp, Kanata, Stittsville, Munster, Richmond and Bells Corners are serviced by this sanitary sewer collection system, which drains to the Acres Road pump station. The study area incorporates approximately 8175ha (gross area) upstream of the Acres Road pump station.
The current Infrastructure Master Plan (IMP) approved by Ottawa City Council in 2009, identifies sanitary sewer infrastructure needs mainly for servicing the planned growth in Kanata and Stittsville based on master servicing studies prepared separately for new communities like Kanata West and Fernbank. While the infrastructure needed to service the growth areas is feasible, it has not been evaluated in conjunction with the existing infrastructure and planned infrastructure upgrades in the WUC, which may provide opportunities to improve the system as a whole and provide a more cost effective solution.
In addition, separate investigations have been undertaken due to a number of overflows at pumping stations and flooding incidents reported in the WUC (i.e. July 2009), and resulted in a number of recommendations aimed at reducing flood risk in the wastewater collection system. As the planned upgrades in the community relies heavily on the expansion of existing pump stations and the construction of a new pump station (Kanata West PS), the need exists to develop a high level sanitary servicing strategy for the WUC that minimizes, as much as possible, the risk to public safety and health.
Four (4) servicing strategies were developed for the 2031 growth projection, those being:
1. Servicing Strategy #1: Upgrades proposed in the Infrastructure Master Plan Update-Wastewater Collection System Assessment (Stantec, May 2009), considered as the base line.
2. Servicing Strategy #2: A gravity sewer from the location of the proposed Kanata West Pumping Station to the North Kanata Trunk Sewer with a gravity sewer extending from the Hazeldean PS, which is to be abandoned, to the location of the proposed Kanata West Pumping Station.
3. Servicing Strategy #3: A gravity sewer from the Hazeldean Pumping Station (which would be abandoned) to the Lynwood Collector.
4. Servicing Strategy #4: A new gravity sewer from Hazeldean Pumping Station (which would be converted to a low lifting station) to the Lynwood Collector.
Flows throughout the sanitary sewer system were projected to the year 2060, which was based on growth projections as a high level approximation of potential growth beyond the current official plan boundary as provided by the City of Ottawa. The intent is to determine if substantial changes to proposed 2031 infrastructure needs would be required to accommodate the future projected flows.
Flow Scenarios
Following the technical advisory committee (TAC) meeting of November 2010, it was agreed that various flow generating scenarios would be modelled, with the results being considered in the evaluation of the servicing strategies. Spreadsheet calculations and a hydraulic model were used to estimate the sanitary sewer rates. The hydraulic model was developed for the City of Ottawa by Stantec under a separate assignment – Wastewater Collection System Dynamic Model – WEST (Stantec, August 2010).
The flow generation scenarios resulted in an envelope of flow conditions calculated at key locations in the WUC study area that can assist in establishing and assessing the sensitivity and robustness of the alternative sanitary sewer servicing strategies. Different combinations of
City of Ottawa Page -7
WUC- Wastewater Collection System FINAL Master Servicing Plan - Study Report JULY, 2012 RVA 102174
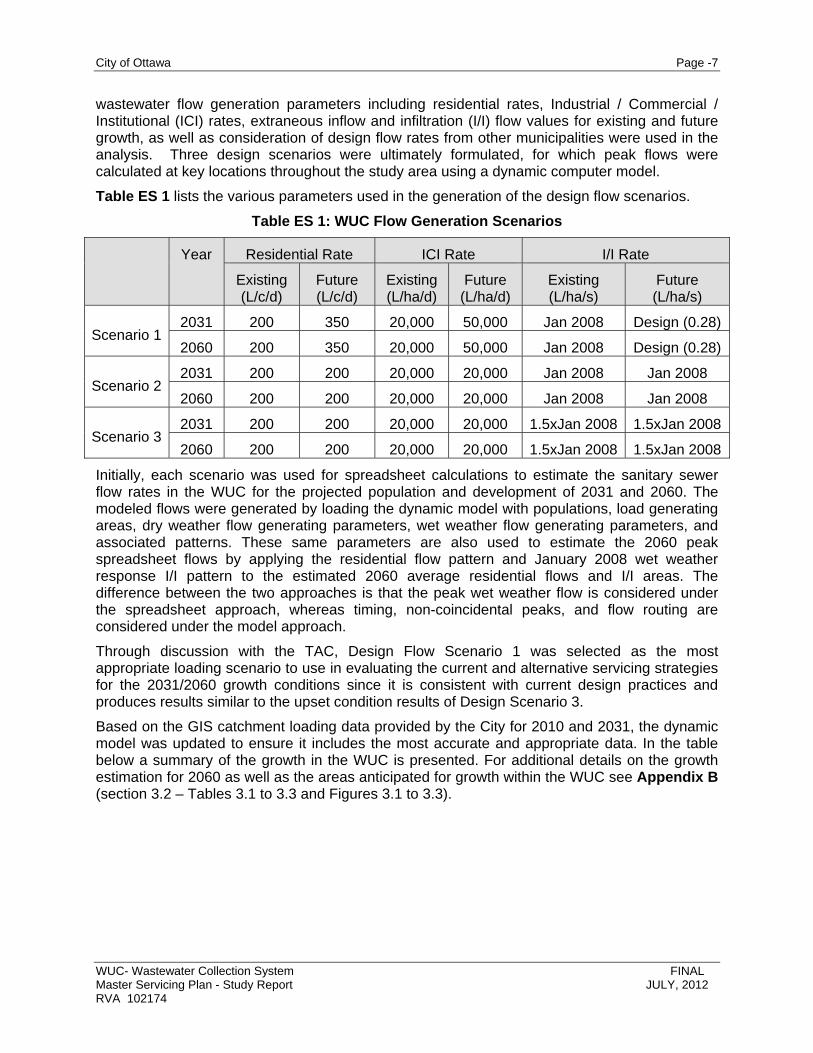
wastewater flow generation parameters including residential rates, Industrial / Commercial / Institutional (ICI) rates, extraneous inflow and infiltration (I/I) flow values for existing and future growth, as well as consideration of design flow rates from other municipalities were used in the analysis. Three design scenarios were ultimately formulated, for which peak flows were calculated at key locations throughout the study area using a dynamic computer model.
Table ES 1 lists the various parameters used in the generation of the design flow scenarios.
Table ES 1: WUC Flow Generation Scenarios
Year Residential Rate ICI Rate I/I Rate
Existing (L/c/d)
Future (L/c/d)
Existing (L/ha/d)
Future (L/ha/d)
Existing (L/ha/s)
Future (L/ha/s)
Scenario 1 2031 200 350 20,000 50,000 Jan 2008 Design (0.28)
2060 200 350 20,000 50,000 Jan 2008 Design (0.28)
Scenario 2 2031 200 200 20,000 20,000 Jan 2008 Jan 2008
2060 200 200 20,000 20,000 Jan 2008 Jan 2008
Scenario 3 2031 200 200 20,000 20,000 1.5xJan 2008 1.5xJan 2008
2060 200 200 20,000 20,000 1.5xJan 2008 1.5xJan 2008
Initially, each scenario was used for spreadsheet calculations to estimate the sanitary sewer flow rates in the WUC for the projected population and development of 2031 and 2060. The modeled flows were generated by loading the dynamic model with populations, load generating areas, dry weather flow generating parameters, wet weather flow generating parameters, and associated patterns. These same parameters are also used to estimate the 2060 peak spreadsheet flows by applying the residential flow pattern and January 2008 wet weather response I/I pattern to the estimated 2060 average residential flows and I/I areas. The difference between the two approaches is that the peak wet weather flow is considered under the spreadsheet approach, whereas timing, non-coincidental peaks, and flow routing are considered under the model approach.
Through discussion with the TAC, Design Flow Scenario 1 was selected as the most appropriate loading scenario to use in evaluating the current and alternative servicing strategies for the 2031/2060 growth conditions since it is consistent with current design practices and produces results similar to the upset condition results of Design Scenario 3.
Based on the GIS catchment loading data provided by the City for 2010 and 2031, the dynamic model was updated to ensure it includes the most accurate and appropriate data. In the table below a summary of the growth in the WUC is presented. For additional details on the growth estimation for 2060 as well as the areas anticipated for growth within the WUC see Appendix B (section 3.2 – Tables 3.1 to 3.3 and Figures 3.1 to 3.3).
City of Ottawa Page -8
WUC- Wastewater Collection System FINAL Master Servicing Plan - Study Report JULY, 2012 RVA 102174
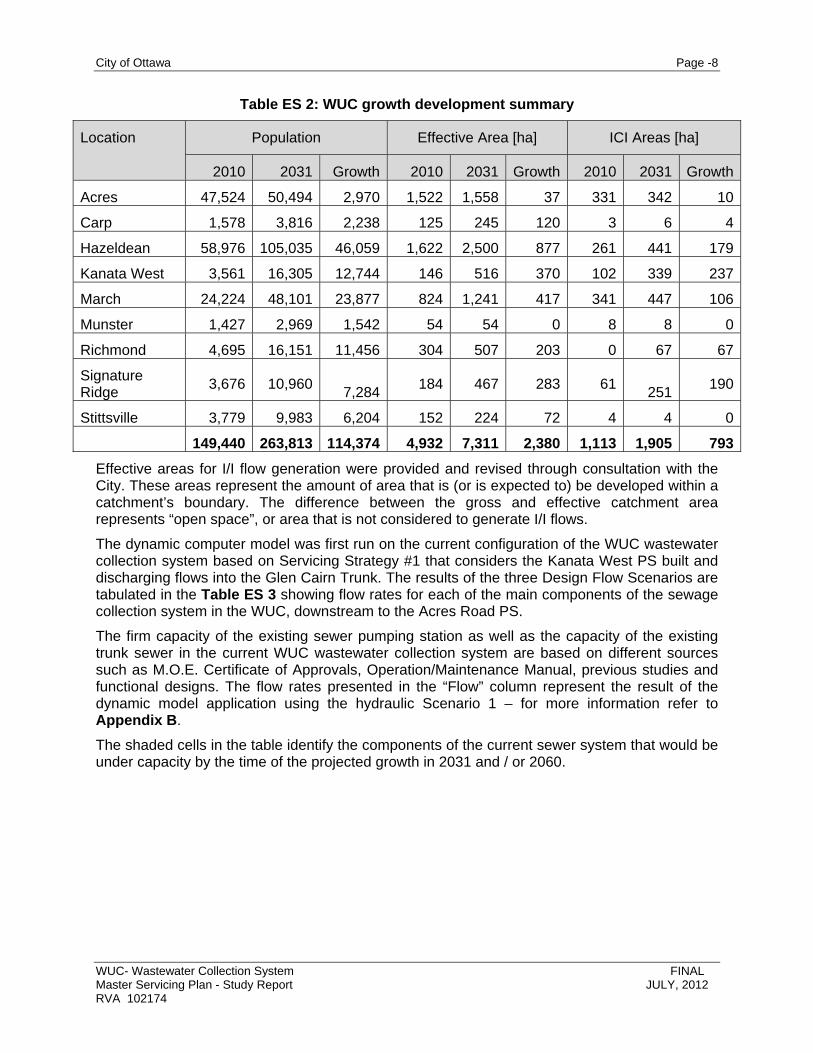
Table ES 2: WUC growth development summary
Location Population Effective Area [ha] ICI Areas [ha]
2010 2031 Growth 2010 2031 Growth 2010 2031 Growth
Acres 47,524 50,494 2,970 1,522 1,558 37 331 342 10
Carp 1,578 3,816 2,238 125 245 120 3 6 4
Hazeldean 58,976 105,035 46,059 1,622 2,500 877 261 441 179
Kanata West 3,561 16,305 12,744 146 516 370 102 339 237
March 24,224 48,101 23,877 824 1,241 417 341 447 106
Munster 1,427 2,969 1,542 54 54 0 8 8 0
Richmond 4,695 16,151 11,456 304 507 203 0 67 67
Signature Ridge
3,676 10,960 7,284
184 467 283 61 251
190
Stittsville 3,779 9,983 6,204 152 224 72 4 4 0
149,440 263,813 114,374 4,932 7,311 2,380 1,113 1,905 793
Effective areas for I/I flow generation were provided and revised through consultation with the City. These areas represent the amount of area that is (or is expected to) be developed within a catchment’s boundary. The difference between the gross and effective catchment area represents “open space”, or area that is not considered to generate I/I flows.
The dynamic computer model was first run on the current configuration of the WUC wastewater collection system based on Servicing Strategy #1 that considers the Kanata West PS built and discharging flows into the Glen Cairn Trunk. The results of the three Design Flow Scenarios are tabulated in the Table ES 3 showing flow rates for each of the main components of the sewage collection system in the WUC, downstream to the Acres Road PS.
The firm capacity of the existing sewer pumping station as well as the capacity of the existing trunk sewer in the current WUC wastewater collection system are based on different sources such as M.O.E. Certificate of Approvals, Operation/Maintenance Manual, previous studies and functional designs. The flow rates presented in the “Flow” column represent the result of the dynamic model application using the hydraulic Scenario 1 – for more information refer to Appendix B.
The shaded cells in the table identify the components of the current sewer system that would be under capacity by the time of the projected growth in 2031 and / or 2060.

City of Ottawa Page -9
WUC- Wastewater Collection System FINAL Master Servicing Plan - Study Report JULY, 2012 RVA 102174
Table ES 3: WUC summary of flow generation scenarios
(Year) 2010 2031 2060 2031 2060 2031 2060(L/s) (L/s) (L/s) (L/s) (L/s) (L/s) (L/s) (L/s) (L/s)
Richmond Pump Station 360 151 340 340 314 314 407 407
Stittsville PS 108 39 106 506 77 300 91 353
Hazeldean Pump Station 1225 832 1537 1937 1373 1596 1741 2003
Kanata West
Pump Station (2) 765 152 593 689 462 555 561 678
Signature Ridge
Pump Station (3) 360 54 309 423 218 302 256 351
March Pump Station 490 326 771 941 668 814 820 1008
Acres Road Pump Station 4600 2119 4186 4966 3774 4320 4437 5099
Glen Cairn Trunk2815 to 2988
1139 2512 3008 2192 2508 2758 3137
Stittsville Trunk 519 to 972 358 485 885 444 679 572 732
Main Street Sewer 307 to 739 138 330 444 237 321 342 399
Penfield Sewer 398 to 734 170 360 474 267 351 342 437
March Ridge Trunk (Above March Forcemain)
1223 245 434 548 339 423 428 523
March Ridge Trunk (Below March Forcemain)
1016 571 1205 1489 1007 1237 1248 1531
Watts Creek Siphon 1014 571 1205 1489 1007 1237 1248 1531
Tri-Township Collector1595 to 1803
1705 3717 4497 3199 3745 4006 4668
March Wood Trunk 1100 230 574 705 502 616 608 752
East March Trunk 550 96 172 211 141 173 187 231
North Kanata Trunk - Phase I
4047 to 4640
1705 3717 4497 3199 3745 4006 4668
Nepean Collector 190 190 197 197 193 193 234 234
Watt's Creek Trunk5418 to 6640
1891 3914 4694 3392 3938 4240 4902
FLOW (1)
CURRENT SEWER CONFIGURATION
Scenario 1 Scenario 2 Scenario 3
FIR
M C
AP
AC
ITY
PUMPING STATION OR TRUNK SEWER
EX
IST
ING
C
AP
AC
ITY
The coloured cells in the table identify the component of the current sewer system that is under capacity by the time of the projected growth in 2031 or 2060. (1) – flow results based on the dynamic model calculation;
City of Ottawa Page -10
WUC- Wastewater Collection System FINAL Master Servicing Plan - Study Report JULY, 2012 RVA 102174
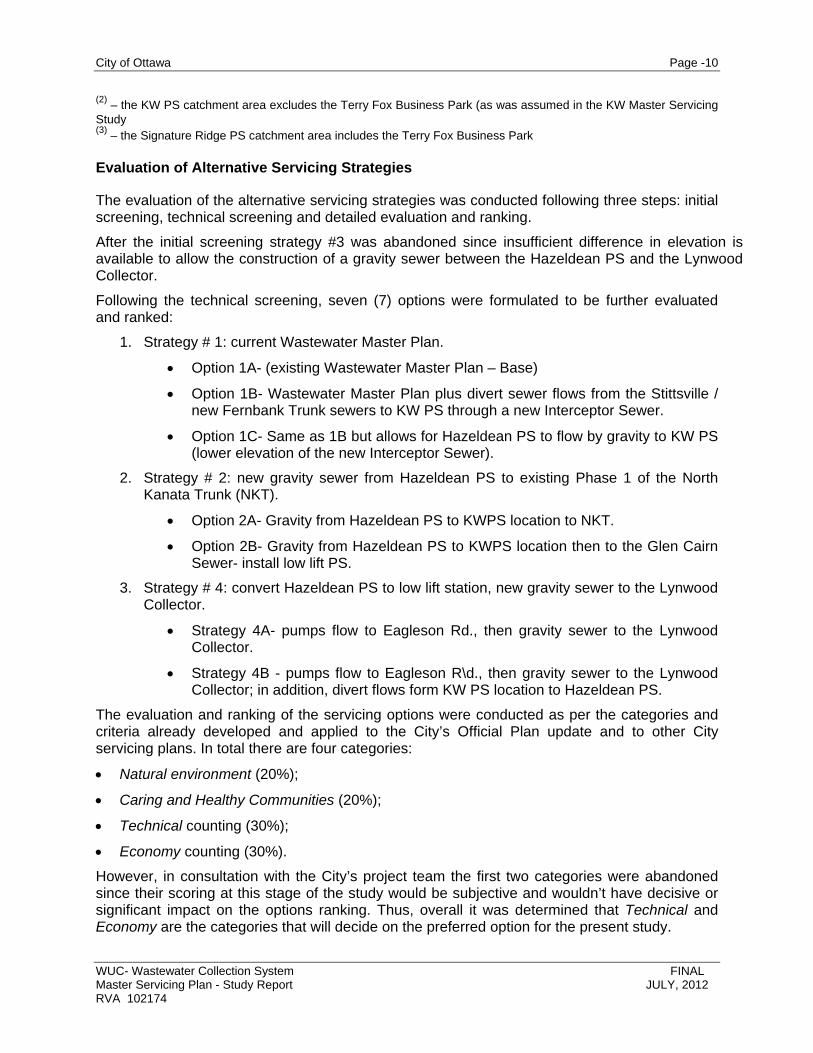
(2) – the KW PS catchment area excludes the Terry Fox Business Park (as was assumed in the KW Master Servicing Study (3) – the Signature Ridge PS catchment area includes the Terry Fox Business Park
Evaluation of Alternative Servicing Strategies
The evaluation of the alternative servicing strategies was conducted following three steps: initial screening, technical screening and detailed evaluation and ranking.
After the initial screening strategy #3 was abandoned since insufficient difference in elevation is available to allow the construction of a gravity sewer between the Hazeldean PS and the Lynwood Collector.
Following the technical screening, seven (7) options were formulated to be further evaluated and ranked:
1. Strategy # 1: current Wastewater Master Plan.
Option 1A- (existing Wastewater Master Plan – Base)
Option 1B- Wastewater Master Plan plus divert sewer flows from the Stittsville / new Fernbank Trunk sewers to KW PS through a new Interceptor Sewer.
Option 1C- Same as 1B but allows for Hazeldean PS to flow by gravity to KW PS (lower elevation of the new Interceptor Sewer).
2. Strategy # 2: new gravity sewer from Hazeldean PS to existing Phase 1 of the North Kanata Trunk (NKT).
Option 2A- Gravity from Hazeldean PS to KWPS location to NKT.
Option 2B- Gravity from Hazeldean PS to KWPS location then to the Glen Cairn Sewer- install low lift PS.
3. Strategy # 4: convert Hazeldean PS to low lift station, new gravity sewer to the Lynwood Collector.
Strategy 4A- pumps flow to Eagleson Rd., then gravity sewer to the Lynwood Collector.
Strategy 4B - pumps flow to Eagleson R\d., then gravity sewer to the Lynwood Collector; in addition, divert flows form KW PS location to Hazeldean PS.
The evaluation and ranking of the servicing options were conducted as per the categories and criteria already developed and applied to the City’s Official Plan update and to other City servicing plans. In total there are four categories:
Natural environment (20%);
Caring and Healthy Communities (20%);
Technical counting (30%);
Economy counting (30%).
However, in consultation with the City’s project team the first two categories were abandoned since their scoring at this stage of the study would be subjective and wouldn’t have decisive or significant impact on the options ranking. Thus, overall it was determined that Technical and Economy are the categories that will decide on the preferred option for the present study.

City of Ottawa Page -11
WUC- Wastewater Collection System FINAL Master Servicing Plan - Study Report JULY, 2012 RVA 102174
A relative evaluation and ranking of the servicing options was for each criterion. The alternative servicing strategy options were rated as having High (3 points), Medium (2 points) and Low (1 point) scores compared to the other strategies For example, a high preference rating would indicate that the relative merit / impact of one option is superior to others under a particular criterion. The resulting scores were then weighted and summed to produce a total score for each option.
Table ES 4: Option Evaluation Results
Ref. No.
Weight [%]
CRITERIA OPTIONS
1A 1B 1C 2A 2B 4A 4B
Technical (30%)
T1 8 Short-Term reliability H H H M M H L
T2 14 Long-Term reliability L M M H H M M
T3 8 Meets redundancy requirements
L M H H H M L
Score 46 68 76 82 82 68 44
Economy (30%)
E1 17 Capital Cost and O&M H H M L L L L
E2 8 Life-Cycle cost H H M M M L L
E3 5 Readiness for implementation
H M M L L M L
Score 90 85 60 38 38 35 30
60 Total Score 136 153 136 120 120 103 74
The results of the evaluation indicate that the current servicing strategy that relies on pump stations and forcemains generally ranks higher than the gravity servicing strategies. Overall, Option 1B scored the highest. The main advantages of the Servicing Strategy Option 1B compared to the other options are:
It is ready to be implemented: studies are already approved for most infrastructure needed by 2016, and thus, no significant delays for the developments in the area are anticipated;
Constructing a new interceptor sewer to off-load flows in the Stittsville Trunk sewer and the new Fernbank Trunk sewer from the Hazeldean PS to the Kanata West PS creates a more balanced sewage pumping system with two main stations that provides more control over sewer flows and system reliability, thus, lowering the risk for overflows and basement flooding during pump failure or extreme wet weather events;
Low capital cost and life-cycle cost
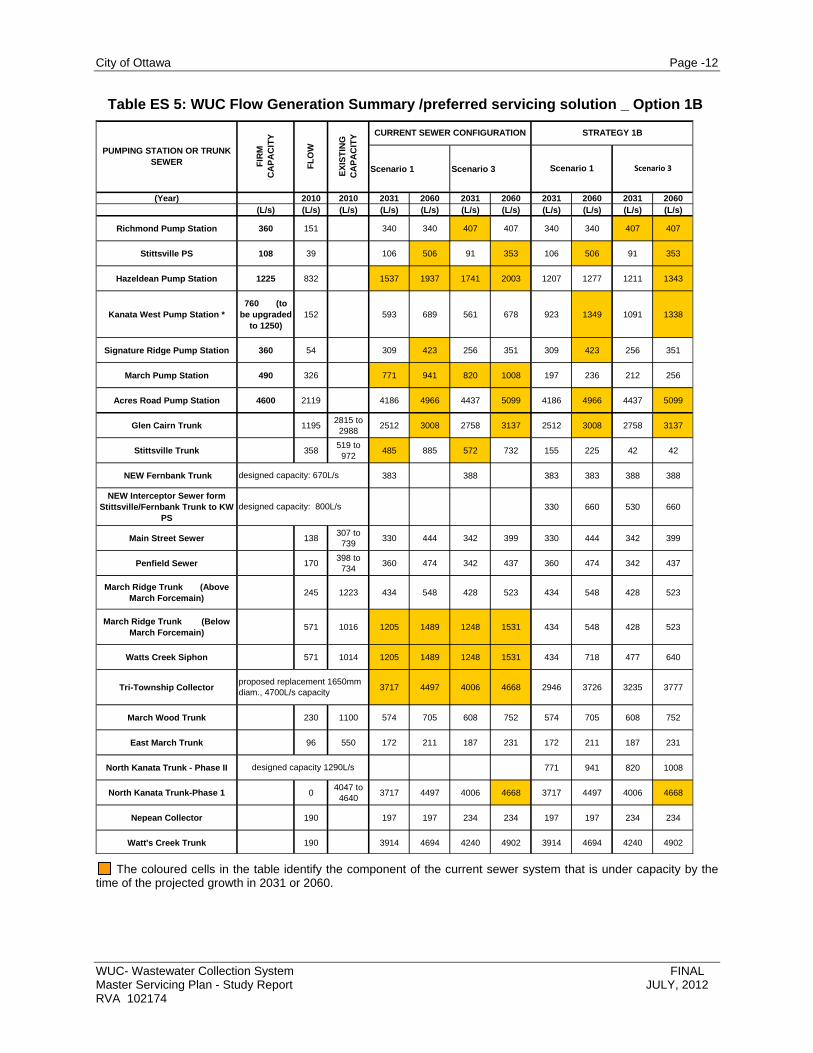
As a result, Option 1B derived from the initial servicing Strategy #1 is considered the preferred solution for the WUC sanitary sewer servicing plan. In the following Table ES 5, the sewer flows corresponding for Option 1B under hydraulic Scenarios 1 and 3 are shown for each of the main components of the sewage collection system in the WUC, downstream to the Acres Road PS.
City of Ottawa Page -12
WUC- Wastewater Collection System FINAL Master Servicing Plan - Study Report JULY, 2012 RVA 102174
Table ES 5: WUC Flow Generation Summary /preferred servicing solution _ Option 1B
Scenario 1 Scenario 3
(Year) 2010 2010 2031 2060 2031 2060 2031 2060 2031 2060(L/s) (L/s) (L/s) (L/s) (L/s) (L/s) (L/s) (L/s) (L/s) (L/s) (L/s)
Richmond Pump Station 360 151 340 340 407 407 340 340 407 407
Stittsville PS 108 39 106 506 91 353 106 506 91 353
Hazeldean Pump Station 1225 832 1537 1937 1741 2003 1207 1277 1211 1343
Kanata West Pump Station *760 (to
be upgraded to 1250)
152 593 689 561 678 923 1349 1091 1338
Signature Ridge Pump Station 360 54 309 423 256 351 309 423 256 351
March Pump Station 490 326 771 941 820 1008 197 236 212 256
Acres Road Pump Station 4600 2119 4186 4966 4437 5099 4186 4966 4437 5099
Glen Cairn Trunk 11952815 to
29882512 3008 2758 3137 2512 3008 2758 3137
Stittsville Trunk 358519 to
972485 885 572 732 155 225 42 42
NEW Fernbank Trunk 383 388 383 383 388 388
NEW Interceptor Sewer form Stittsville/Fernbank Trunk to KW
PS330 660 530 660
Main Street Sewer 138307 to
739330 444 342 399 330 444 342 399
Penfield Sewer 170398 to
734360 474 342 437 360 474 342 437
March Ridge Trunk (Above March Forcemain)
245 1223 434 548 428 523 434 548 428 523
March Ridge Trunk (Below March Forcemain)
571 1016 1205 1489 1248 1531 434 548 428 523
Watts Creek Siphon 571 1014 1205 1489 1248 1531 434 718 477 640
Tri-Township Collector 3717 4497 4006 4668 2946 3726 3235 3777
March Wood Trunk 230 1100 574 705 608 752 574 705 608 752
East March Trunk 96 550 172 211 187 231 172 211 187 231
North Kanata Trunk - Phase II 771 941 820 1008
North Kanata Trunk-Phase 1 04047 to
46403717 4497 4006 4668 3717 4497 4006 4668
Nepean Collector 190 197 197 234 234 197 197 234 234
Watt's Creek Trunk 190 3914 4694 4240 4902 3914 4694 4240 4902
Scenario 3Scenario 1
CURRENT SEWER CONFIGURATION STRATEGY 1B
designed capacity: 800L/s
PUMPING STATION OR TRUNK SEWER F
IRM
C
AP
AC
ITY
FL
OW
EX
IST
ING
C
AP
AC
ITY
designed capacity: 670L/s
proposed replacement 1650mm diam., 4700L/s capacity
designed capacity 1290L/s
The coloured cells in the table identify the component of the current sewer system that is under capacity by the time of the projected growth in 2031 or 2060.
City of Ottawa Page -13
WUC- Wastewater Collection System FINAL Master Servicing Plan - Study Report JULY, 2012 RVA 102174
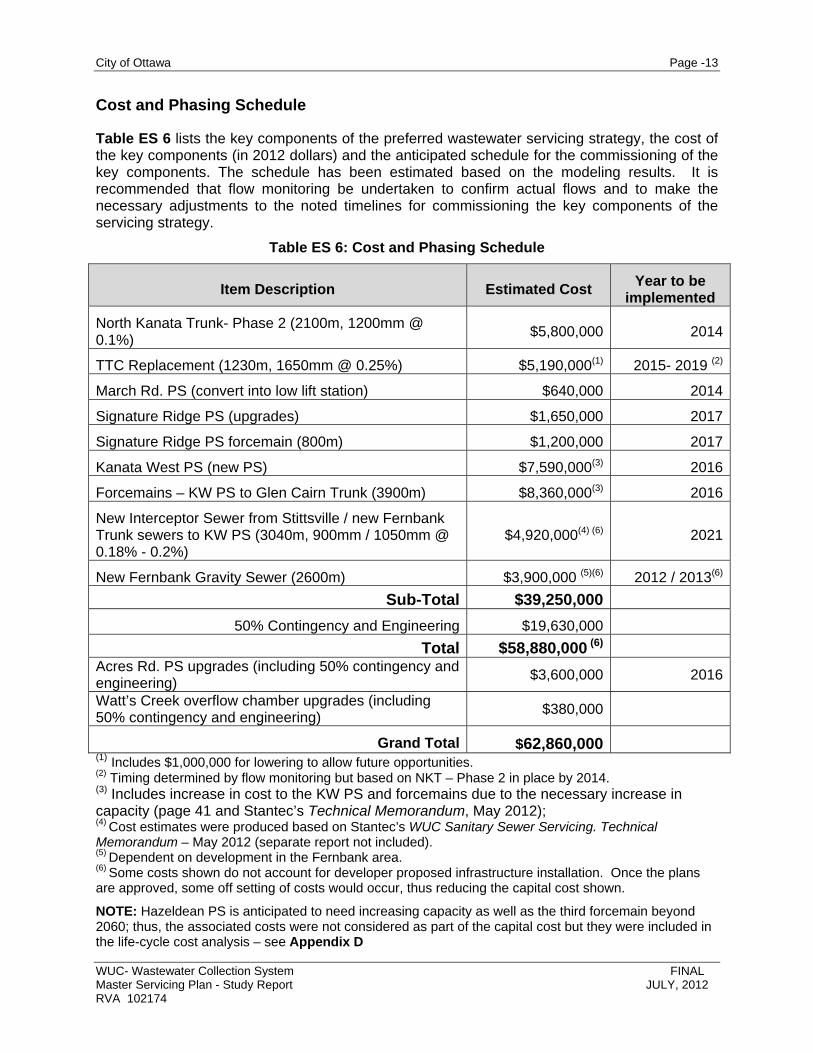
Cost and Phasing Schedule
Table ES 6 lists the key components of the preferred wastewater servicing strategy, the cost of the key components (in 2012 dollars) and the anticipated schedule for the commissioning of the key components. The schedule has been estimated based on the modeling results. It is recommended that flow monitoring be undertaken to confirm actual flows and to make the necessary adjustments to the noted timelines for commissioning the key components of the servicing strategy.
Table ES 6: Cost and Phasing Schedule
Item Description Estimated Cost Year to be
implemented
North Kanata Trunk- Phase 2 (2100m, 1200mm @ 0.1%)
$5,800,000 2014
TTC Replacement (1230m, 1650mm @ 0.25%) $5,190,000(1) 2015- 2019 (2)
March Rd. PS (convert into low lift station) $640,000 2014
Signature Ridge PS (upgrades) $1,650,000 2017
Signature Ridge PS forcemain (800m) $1,200,000 2017
Kanata West PS (new PS) $7,590,000(3) 2016
Forcemains – KW PS to Glen Cairn Trunk (3900m) $8,360,000(3) 2016
New Interceptor Sewer from Stittsville / new Fernbank Trunk sewers to KW PS (3040m, 900mm / 1050mm @ 0.18% - 0.2%)
$4,920,000(4) (6) 2021
New Fernbank Gravity Sewer (2600m) $3,900,000 (5)(6) 2012 / 2013(6)
Sub-Total $39,250,000
50% Contingency and Engineering $19,630,000
Total $58,880,000 (6) Acres Rd. PS upgrades (including 50% contingency and engineering)
$3,600,000 2016
Watt’s Creek overflow chamber upgrades (including 50% contingency and engineering)
$380,000
Grand Total $62,860,000 (1) Includes $1,000,000 for lowering to allow future opportunities. (2) Timing determined by flow monitoring but based on NKT – Phase 2 in place by 2014. (3) Includes increase in cost to the KW PS and forcemains due to the necessary increase in capacity (page 41 and Stantec’s Technical Memorandum, May 2012); (4) Cost estimates were produced based on Stantec’s WUC Sanitary Sewer Servicing. Technical Memorandum – May 2012 (separate report not included). (5) Dependent on development in the Fernbank area. (6) Some costs shown do not account for developer proposed infrastructure installation. Once the plans are approved, some off setting of costs would occur, thus reducing the capital cost shown.
NOTE: Hazeldean PS is anticipated to need increasing capacity as well as the third forcemain beyond 2060; thus, the associated costs were not considered as part of the capital cost but they were included in the life-cycle cost analysis – see Appendix D

City of Ottawa Page -14
WUC- Wastewater Collection System FINAL Master Servicing Plan - Study Report JULY, 2012 RVA 102174
1 INTRODUCTION
The City of Ottawa retained the services of R.V. Anderson Associates Limited to undertake a study to evaluate the current wastewater servicing strategy, develop and evaluate alternative strategies if necessary to service the planned development in the West Urban Community (WUC) up to the year 2031. The servicing strategies were also to be assessed in the context of a longer-term (50-year) growth horizon based on estimates of potential residential and employment demands to test the system for flexibility to meet longer term servicing needs. This study is intended to determine the preferred servicing strategy, whether it results from the previously developed strategies, or from a completely new strategy.
The study is being led by the Infrastructure Policy Unit, with direction being provided by a Technical Advisory Committee with representation from the Environmental Services, Infrastructure Services and Planning & Growth Management departments. The process being followed constitutes an internal review of wastewater master planning in the WUC that will be used by staff to update the time lines for project implementation, and to determine the extent of changes to the existing Master Plan projects which may warrant consideration in advance of the 2014 Infrastructure Master Plan (IMP) update.
The results of this study will be presented in an information report to Planning Committee and Council in Summer of 2012.
The scope of work was also to include the preparation of a dynamic computer model of the wastewater sanitary sewer system for the WUC to be used to assist RVA in determining the flows and planning horizons.
1.1 Background and Authorization
The current WUC wastewater servicing strategy consists of a complex system of pump stations, forcemains and gravity sewers converging at a single pumping station at Acres Road that pumps flows to the Lynwood Collector sewer that conveys drainage further downstream, and ultimately to the Robert O. Pickard Environmental Center (ROPEC) for treatment. The collection system, which drains to the Acres Road pump station, services the communities of Carp, Kanata, Stittsville, Munster, Richmond and Bells Corners. The study area encompasses approximately 8175ha (gross area) upstream of the Acres Road pump station, as shown in Figure 1-1.
The current IMP approved by Ottawa City Council in 2009, identifies necessary sanitary infrastructure largely attributed to servicing the planned growth in Kanata and Stittsville. These infrastructure needs were, for the most-part, developed in separate master servicing studies prepared at the time the City was approving Community Development Plans for new communities like Kanata West and Fernbank. Although the infrastructure needed to service the growth areas is feasible, it has not been evaluated in conjunction with the existing infrastructure and planned infrastructure upgrades in the WUC, which may provide opportunities to improve the system as a whole and provide a more cost effective solution.

City of Ottawa Page -15
WUC- Wastewater Collection System FINAL Master Servicing Plan - Study Report JULY, 2012 RVA 102174
Figure 1-1: Location Plan
In addition, there have been a number of overflows at wastewater pumping stations and flooding incidents reported in the WUC, most notably in July 2009, which has resulted in separate investigations being undertaken that have identified a number of recommendations aimed at reducing flood risk in the wastewater collection system. As the planned upgrades in the community relies heavily on the expansion of existing pump stations and the construction of a new pump station (Kanata West PS), the need exists to develop a high level sanitary servicing strategy for the WUC that minimizes, as much as possible, the risk to public safety and health.
1.2 Objectives
The objective of this assignment is to prepare a master wastewater servicing plan for the WUC to the year 2031, while considering projected growth to the year 2060. There are three (3) servicing strategies identified by the City to be developed further for the 2031 growth projection:
1. Servicing Strategy #1: Upgrades proposed in the Infrastructure Master Plan Update-Wastewater Collection System Assessment (Stantec, May 2009), considered as the base line.
Acres Rd. PS
Hazeldean PS
Signature Ridge PS
March Rd. PS
City of Ottawa Page -16
WUC- Wastewater Collection System FINAL Master Servicing Plan - Study Report JULY, 2012 RVA 102174
2. Servicing Strategy #2: A gravity sewer from the location of the proposed Kanata West Pumping Station to the North Kanata Trunk Sewer with a gravity sewer extending from the Hazeldean PS, which is to be abandoned, to the location of the proposed Kanata West Pumping Station.
3. Servicing Strategy #3: A gravity sewer from the Hazeldean Pumping Station (which would be abandoned) to the Lynwood Collector.
The evaluation of those strategies as well as the development of other strategies (with the definition of 2031 and 2060) was based on the development projections for lands within the approved Official Plan (OP) boundary provided by the City. The intent is to confirm that the current proposed infrastructure (Strategy #1) provides the best servicing strategy for the WUC, or identify if other servicing strategies (strategies #2, #3 or other) should be pursued. Opportunities for flow removal, diversions or other infrastructure work including replacement of pumping station with gravity trunk sewers that could reduce operation and maintenance (O&M), improve reliability or provide robustness to the wastewater collection system between Hazeldean PS, Kanata West PS and North Kanata Trunk /Acres Rd. PS will also be considered.
1.3 Scope of Work
The work will be completed in the following tasks:
Data collection and background review: collect and undertake a preliminary review of the available background reports, modeling documentation and the City’s development projection for the years 2031 and 2060, aerial mapping and the 1:2000 mapping, along with any relevant record drawings required;
Model input: collaborate with the City’s modeling group to review the model, its development and system configuration. The calibrated dynamic model of the WUC developed in PCSWWM by Stantec will be used in the 2031 and 2060 servicing strategy analyses.
Confirmation of design criteria and service levels: work with the City to confirm the design criteria and service levels that have been used for the City’s model and determine if they are still valid for this project. Consideration will be given to the City’s current design criteria, monitored flow data and extreme events.
Development and evaluation of servicing strategies and corresponding options for each strategy: develop in conjunction with the City PM and TAC, through a workshop, a list of criteria for use in the evaluation of the servicing strategies (for both initial screening, technical screening and for detailed analysis evaluation) and consequently the selection of a preferred strategy and option to service development in the WUC beyond 2031, along with a long list of servicing alternatives. Projected 2060 developments will provide a test of assessing adequacy of existing and proposed searching strategies.
Final report preparation: upon completion of the detailed evaluation, a draft report will be prepared and submitted to the City for review and comments. The report will include the technical memorandums, identified previously, integrated into the report and details of the evaluation
1.4 Previous Relevant Studies
Future wastewater needs for the communities in the City’s west end were previously studied and identified; however, most of those studies were investigating specific community needs
City of Ottawa Page -17
WUC- Wastewater Collection System FINAL Master Servicing Plan - Study Report JULY, 2012 RVA 102174
within the WUC and not all the communities as a whole. The following is a list of studies which have been completed regarding the sanitary sewer collection needs for different communities in the study area. A summary of these reports is included in Appendix A.
Village of Richmond Water and Sanitary Master Servicing Study and Class Environmental Assessment Phases 1, 2, 3 & 4 (draft dated May 2010)
Village of Carp Class Environmental Assessment for Water and Wastewater Infrastructure Upgrade / Expansion (dated May 2009)
Infrastructure Master Plan Update – Wastewater Collection System Assessment (dated May 5, 2009)
Fernbank Community Design Plan – Master Servicing Study
Master Sanitary Servicing Plan – Kanata Lakes, Broughton & Interstitial Lands (2007)
Signature Ridge Pump Station Feasibility Study Report (dated October 2006)
Kanata West Master Servicing Study, Volume 1 of 2 (dated June 16, 2006)
North Kanata Sanitary Sewer Infrastructure Upgrade Study, Functional Design Report (dated August 2001)
The information provided in those studies combined with the current configuration of the existing sanitary sewer system provides the basis to confirm whether the proposed infrastructure is the best servicing strategy for the WUC or that exists the opportunity to identify other strategies which could include removal or diversion of sewer flows, replacement of pump stations with gravity sewer or modifications to pump stations to provide a collection system with reduced operation and maintenance costs, improved reliability and robustness.
The present assignment consists of three (3) phases. The first phase examines on the existing wastewater collection system to identify its current configuration and condition (age, capacity, operating costs, etc.), and the constraints in the system (capacity threshold).
The next phase provides the hydraulic modeling of the sewer system with respect to the development projection for 2031 and 2060. Different design criteria was determined based on the City’s current design guidelines, existing monitored flows and extreme events recorded in the area. The sewer flows from the modeling application are further used in the analysis of the proposed servicing strategies and for developing new strategies.
The final phase of the assignment provides the detailed analysis of the servicing strategies, preparation of different options for each strategy and the evaluation and ranking process to determine the recommended option for providing the WUC with a reliable, robust and cost efficient sanitary sewer servicing plan.

City of Ottawa Page -18
WUC- Wastewater Collection System FINAL Master Servicing Plan - Study Report JULY, 2012 RVA 102174
2 EXISTING WASTEWATER COLLECTION SYSTEM
2.1 Study area and existing configuration
The area to be investigated in this study is part of the approved urban area as defined in the City’s current Official Plan and includes all communities west of Acres Rd. pump station: Bells Corner, Kanata, Carp, Stittsville, Richmond and Munster.
Figure 2-1 below depicts the study area, the corresponding communities as well as the existing main components of the wastewater collection system: pump stations and trunk sewers. Currently the wastewater collection in those communities is serviced by 7 main pump stations:
Acres Road PS,
Hazeldean Road PS,
March Road PS,
Signature Ridge PS,
Stittsville PS,
Carp PS, and
Richmond PS.
These stations convey wastewater flows from the various areas within the WUC to the main trunk sewers and eventually to the Acres Road pump station. The general servicing operation involves conveying flows from the rural communities of Carp, Munster, and Richmond to Kanata, where these rural contributions are combined with flows from the Stittsville, Hazeldean, Signature Ridge, March, Bells Corners, and Acres/Crystal Beach areas. However, the servicing of the WUC varies depending on the flow conditions at two specific locations:
Village of Munster: under dry weather conditions, flows from the Village of Munster are conveyed to Acres Rd PS via Richmond PS, Glen Cairn Trunk, Tri-Township Collector and North Kanata Trunk. Under extreme wet weather flow conditions, contributions from Munster are stored locally and conveyed to Acres Rd. PS at a later time.
Crystal Beach Pump Station: this pump station is only operational during extreme wet weather events, specifically when a diversion gate along the West Nepean Collector is closed. During dry weather conditions, flows from the Crystal Beach area are directed along the West Nepean Collector towards the Ottawa Interceptor sewer, the Ottawa Outfall sewer, and eventually to ROPEC. Thus, only during extreme events portions of the flows from Crystal Beach area are pumped to Acres Rd. pump station.
In addition, each of the communities included in the study area are serviced by several other pump stations that conveys the wastewater flows to the main pump stations of the system:
in the Stittsville community there are 8 pump stations all discharging eventually into Stittsville Trunk sewer which is discharging at Hazeldean PS: Fairwind, Fringewood, Cedarow, Joseph Circle, Amberwood, Jackson Trail, John Street and Echowood pump stations all located west of Terry Fox Dr. and north of Abbott St. In addition, Hopeside Rd. pumping station which services Kanata South community along the east side of Eagleson Rd. (between Hazeldean Rd. and Fernbank St.) uses South Glaincairn Trunk sewer to discharge at Hazeldean PS.

City of Ottawa Page -19
WUC- Wastewater Collection System FINAL Master Servicing Plan - Study Report JULY, 2012 RVA 102174
in Stittsville south community there is Friendly pump station discharging into Stittsville PS, which discharges further into Stittsville Trunk sewer and into Hazeldean PS.
Figure 2-1: Study Area
in Kanata north community there is Briarridge pump station discharging at March Rd. PS and from here through the March Rd. Collector the flows are conveyed to Watt’s Creek siphon into Tri-Township Collector and further downstream into North Kanata Trunk.
in the Carp community there is Donald Munro pump station discharging into Carp PS which discharges further into Marchwood Trunk sewer and finally into March Rd. PS.
in the Munster community, in the south, there is Munster 2 pump station discharging flows to Munster 1 pump station which discharges all flows from the community to

City of Ottawa Page -20
WUC- Wastewater Collection System FINAL Master Servicing Plan - Study Report JULY, 2012 RVA 102174
Richmond PS. From here the flows are pumped to Glen Cairn Trunk sewer near Eagleson Rd. and Hazeldean Rd. intersection.
As seen above, the wastewater collection system in the WUC relies heavily on pumping stations and forcemains. Out of all the pump stations servicing the WUC, four (4) stations are identified to be critical to the collection system because in the event of failure a large urban area including several communities is at risk of flooding:
Hazeldean PS which services a significant area of the Kanata west and south, and Stittsville communities;
Signature Ridge PS which services a large area (approximately 592ha) north and south of HWY 417;
March Rd. PS which services Kanata north and Carp communities;
Acres Rd. PS which is where all WUC wastewater is collected and transmitted further south through two 1050mm forcemains into the Lynwood Collector.
The service of all the pump stations in the WUC is complemented by a network of gravity sanitary sewers that collects and conveys the wastewater from consumers to the pump stations, and by several forcemains and gravity trunk sewers the wastewater is ultimately conveyed to Acres Rd. PS. The main trunk sewers of the system are:
Stittsville Trunk sewer receiving the flows from the pump stations servicing Stittsville community, and conveying them to Hazeldean PS.
Glen Cairn Trunk sewer receiving the flows from Hazeldean PS (including Kanata South area) and Richmond PS at Eagleson Rd. / Kakulu Rd. intersection, and conveying them further downstream to Tri-Township Collector;
Watts Creek siphon sewer receiving the flows from Signature Ridge PS (through Main Street Trunk), March Rd. PS (through March Rd. Collector) and other areas encompassed within the Kanata north communities. The flows are conveyed further downstream into the Tri-Township Collector.
Tri-Township Collector receiving the flows from all the above mentioned areas and discharging them into the North Kanata Trunk sewer;
North Kanata Trunk sewer conveying all flows from Tri-Township Collector downstream to Watts Creek Collector;
Nepean Collector servicing Bells Corner community and discharging into Watts Creek Collector, and
Watts Creek Collector conveying all flows from the WUC (from North Kanata Trunk and Nepean Collector) and discharging at Acres Rd. PS. From here the flows are pumps through two 1050mm diameter forcemains into Lynwood Collector.
2.2 Existing conditions and constraints
The study focuses on the main components of the sewer system in the core of the WUC, since they are critical for the system reliability. The condition of those key components currently includes several known capacity constraints located at different points in the system where upgrades are needed. For study purposes, the WUC wastewater drainage basin was divided into three parts or geographic areas:

City of Ottawa Page -21
WUC- Wastewater Collection System FINAL Master Servicing Plan - Study Report JULY, 2012 RVA 102174
Acres Rd. PS and the corresponding infrastructure directly related to the station operation i.e. Overflow Chamber, Watts Creek Collector, Phase 1 of North Kanata Trunk and Tri-Township Collector;
Area serviced by March Rd. PS (including Carp community), Signature Ridge PS. and the corresponding sewer system mainly located north of Highway 417 and west of March Rd.;
Area currently serviced by Hazeldean PS and Glen Cairn Trunk (including Kanata West, Stittsville, Kanata South, Richmond and Munster communities);
Below, the existing conditions of sewer trunks, collectors, pumping stations and adjacent infrastructure corresponding to each of the three parts of the WUC sanitary sewer system are presented based on information provided by previous studies (refer to section 1.4) and through communication with the City’s project team.
2.2.1 Acres Rd. – pump station and sewer trunks:
Tri-Township Collector: built in 1968, 1067mm diameter, 1240m long with 1803L/s capacity. Flows monitored in 2010 showed 1802L/s; over 40 years in service, appears to be in poor condition, under capacity and as identified in many previous studies, it needs to be replaced between the joint chamber TR 02100 and the TR 01000 at the North Kanata Trunk (approximately 1.2km). Regardless the sewer servicing strategy to be recommended, rehabilitation of the Tri-Township Collector must be part of it due to its poor condition. However, when this rehabilitation is to be implemented depends on the recommended strategy – the capacity of the sewer could be either increased by upsizing or freeing-up capacity by redirecting upstream sewer flows through other routes. Freeing-up some capacity will only delay the necessary replacement of the sewer but will provide additional time for budgeting and approvals.
North Kanata Trunk – Phase 1: built in 2003, 1800mm in diameter, 940m long with 4050 to 4640L/s capacity. Flows monitored in 2010 showed 1802L/s; new trunk sewer with sufficient capacity to accommodate future development in the WUC. Previous studies identified the need to extend the North Kanata Trunk with Phase 2 from the upstream end TR 01000 to the March Rd. PS at Legget Dr. In this situation flows from Carp communities and some of the Kanata north lands will be diverted from the Watts Creek siphon freeing sufficient capacity in the siphon for future land development associated to Signature Ridge PS servicing.
Watts Creek Collector: built in 1990 is a 1950mm diameter, 4100m long sewer pipe with 5418 to 6640L/s capacity conveying in 2010 approximately 1992L/s; provides sufficient capacity to accommodate future development in the WUC.
Acres Rd. PS: built in late 80’s (1989) has 2700L/s current firm capacity, and the station recorded 2119L/s flows in 2010. The current station configuration provides the 2700L/s capacity with 4 out of 5 pumps running. In addition, the station’ Certificate of Approval allows for 3 more pumps to reach a maximum net station capacity of 4600L/s. In the light of the sewer flows projected for 2031 and 2060, the pump station will need to increase its capacity gradually in the following years. However, the upgrades will need to include the replacement of current pumps with more energy efficient pumps in order to avoid the supplementary replacement of the station power generators.
Watts Creek Relief System: built in 1988 is a key component in the WUC sanitary sewer system operation, specifically in the Acres Rd. PS operation. This system comprises an Overflow Chamber, with a sluice gate operated manually, a 1350mm diam. overflow pipe at 0.2% slope and 2390L/s capacity, stop logs arrangement for maintenance of the sluice gate and

City of Ottawa Page -22
WUC- Wastewater Collection System FINAL Master Servicing Plan - Study Report JULY, 2012 RVA 102174
overflow monitoring system. The sluice gate appears to be in poor condition including the manoeuvring system showing a high risk of failure. Thus, upgrades to this Overflow Chamber are mandatory specifically to the sluice gate and the operating system – a new system with electronic actuator for the gate operation should be implemented. In addition, the ability to operate this gate from ROPEC should also be considered for implementation. Regardless the sewer servicing strategy to be recommended, the overflow chamber must be rehabilitated soon as this component is critical to the proper operation of Acres Rd. PS, the WUC sanitary sewer system and against the risk of basement flooding occurrences.
2.2.2 Area serviced by March Rd. PS and Signature Ridge PS:
Watts Creek Siphon: built in 1969, 900mm diameter, 410m long with 1014L/s capacity. Flows monitored in 2010 showed 863L/s; over 40 years in service, getting close to the trunk capacity. Future development on Kanata north, Carp community and lands north of HWY417 (associated to Signature Ridge PS and March Rd. PS) cannot be accommodated by the siphon. For this component, the recommendation is to increase capacity by either upsizing the siphon or freeing-up capacity by redirecting flows upstream through other routes.
March Rd. PS and forcemain: built in 1976 have the current capacity at 480L/s and the flow in 2010 was recorded to approximately 326L/s. Approaching firm capacity, March PS was identified in previous studies (Signature Ridge PS – Feasibility Study Report 2006 and North Kanata Trunk – Phase 2, 2001) as a key constraint point in the system. The same studies identified the solution for this constraint – construction of a new gravity sewer North Kanata Trunk – Phase 2 from the pump station to the existing Phase 1 of North Kanata Trunk, gravity connection of the Marchwood Trunk and the conversion of the pump station into a low lifting station. In this situation the upgrading of the station would be minimized – no capacity increase, no forcemain upsizing replacement. Consequently, the current forcemain would be decommissioned and additional capacity will become available in the Watts Creek siphon and the Tri-Township Collector. As a result, no sewer upsizing for Watts Creek siphon is needed and design and construction of the Tri-Township upsizing could be deferred.
Signature Ridge PS and forcemain: built in 1992 with the current capacity of 140L/s and 54L/s recorded flow in 2010; 25 years in service, the pump station was recommended for capacity upgrade to 358L/s (Signature Ridge PS – Feasibility Study Report 2006). The upgrading includes pumps, valves, wet well, overflow and second forcemain installation. Currently the pump station upgrading is under design. Tendering and construction of the upgrades to station is expected in 2012/2013. Second forcemain installation is going to be coordinated with the proposed Campeau Drive expansion.
2.2.3 Area serviced by Hazeldean PS and Glen Cairn Trunk:
Glen Cairn Trunk: built in 1999, 1200mm diameter, 3460m long with 2988L/s capacity. In 2010 the monitored sewer flows showed 1128L/s; sewer trunk is in good condition, only 12 years in service, it is able to accommodate the future new Fernbank land development.
Hazeldean PS and forcemain: built in 1976 with the current capacity 1225L/s (recently upgraded – 2010/2011) the pumping station has been over 35 years in service. The Infrastructure Master Plan Update (2009) recommends upgrading the pump station to 1550L/s capacity for the 2031 development growth projection and to approximately 1933L/s for the 2060 projection. Currently, two 600mm diam. forcemains are in service. A third, older cast iron; 400mm diam. forcemain is not in use because of poor condition and is not considered operational. To obtain the future required 1550L/s output capacity will require the construction of

City of Ottawa Page -23
WUC- Wastewater Collection System FINAL Master Servicing Plan - Study Report JULY, 2012 RVA 102174
a new 600mm diam. forcemain. An overflow to the Glen Cairn stormwater pond is to be constructed in 2012 – 2013.
Most of the constraints identified above were already identified in previous studies and they are: Hazeldean PS, Signature Ridge PS, March PS, Tri-Township Sewer Collector, and construction of Kanata West PS to accommodate new development in the Kanata west community. In addition, in the Infrastructure Master Plan Update – 2009 (IMP), the cost for implementing some of the upgrades were estimated to approximately $43M and it includes the following:
North Kanata Trunk – phase 2 $8.5M
Tri-Township replacement $4.0M
Kanata West PS and forcemains $21.25M
March PS conversion $0.95M
Hazeldean PS upgrades $3.71M
Upgrades to Signature Ridge PS and forcemain $4.3M
The study also estimated $2.5M for the construction of a new sanitary sewer trunk to accommodate the proposed Fernbank Lands development. This sewer is proposed parallel to the Stittsville Trunk sewer to discharge at Hazeldean PS and is to be implemented by 2012 / 2013.
3 MODELING SCENARIO SELECTION
3.1 Projected expansion and growth
The study area’s catchments were assessed and area, population, ICI, and employment summaries under various conditions identified in collaboration with the City are as follows:
Table 3-1: Projected area expansion and population growth (includes Bells Corners and Carp)
Sanitary Catchment Characteristics
Existing Ultimate (2031) Additional Assumed Growth (2060)
Area (ha) 4932 (Effective) 7311 (Effective) 1200 (Effective)
Population 149,440 263,813 60,000
ICI (ha) 1113 1905
Employees 25,000
The existing population for this assignment is based on 2010 values and the existing area has been based on 2008 tallies and is assumed representative and applicable. The area expansion and population growth for 2060 should be considered conceptual only to be used solely for assessing impact of growth. The 2060 projection is depicted in Figure 3-1. The areas shown are only meant as a high level approximation of potential growth areas beyond the current official plan boundary.

City of Ottawa Page -24
WUC- Wastewater Collection System FINAL Master Servicing Plan - Study Report JULY, 2012 RVA 102174
March PS‐ Up to 15000 people‐ Up to 300 ha
Signature Ridge PS‐ Up to 10000 people‐ Up to 12500 employees‐ Up to 150 ha
Kanata West PS‐ Up to 5000 people‐ Up to 12500 employees‐ Up to 150 ha
Outlet to KW and / or Hazeldean PS‐ Up to 30000 people‐ Up to 600 ha
March PS‐ Up to 15000 people‐ Up to 300 ha
Signature Ridge PS‐ Up to 10000 people‐ Up to 12500 employees‐ Up to 150 ha
Kanata West PS‐ Up to 5000 people‐ Up to 12500 employees‐ Up to 150 ha
Outlet to KW and / or Hazeldean PS‐ Up to 30000 people‐ Up to 600 ha
Figure 3-1: Expansion / growth projection for 2060
3.2 Design Scenario selection
The Technical Advisory Committee (TAC) meeting of November 2010 agreed that various flow generating scenarios would be modelled, with the results being considered in the model runs. These scenarios generation were to provide a solution envelope which would aid in establishing and assessing the sensitivity and robustness of a sanitary sewer servicing strategy. Different combinations of wastewater flow generation parameters including residential rates, ICI rates, extraneous I/I flows values for existing and future growth, as well as consideration of design flow rates from other municipalities were investigated.
These scenarios represent the following:
Scenario 1 – Use of monitored flows for existing and design values for future growth.
Scenario 2 – Monitored values for existing and future growth.
Scenario 3 – Monitored values of existing and future growth for residential and ICI and a 50% safety factor applied to existing and future growth for I/I rates.
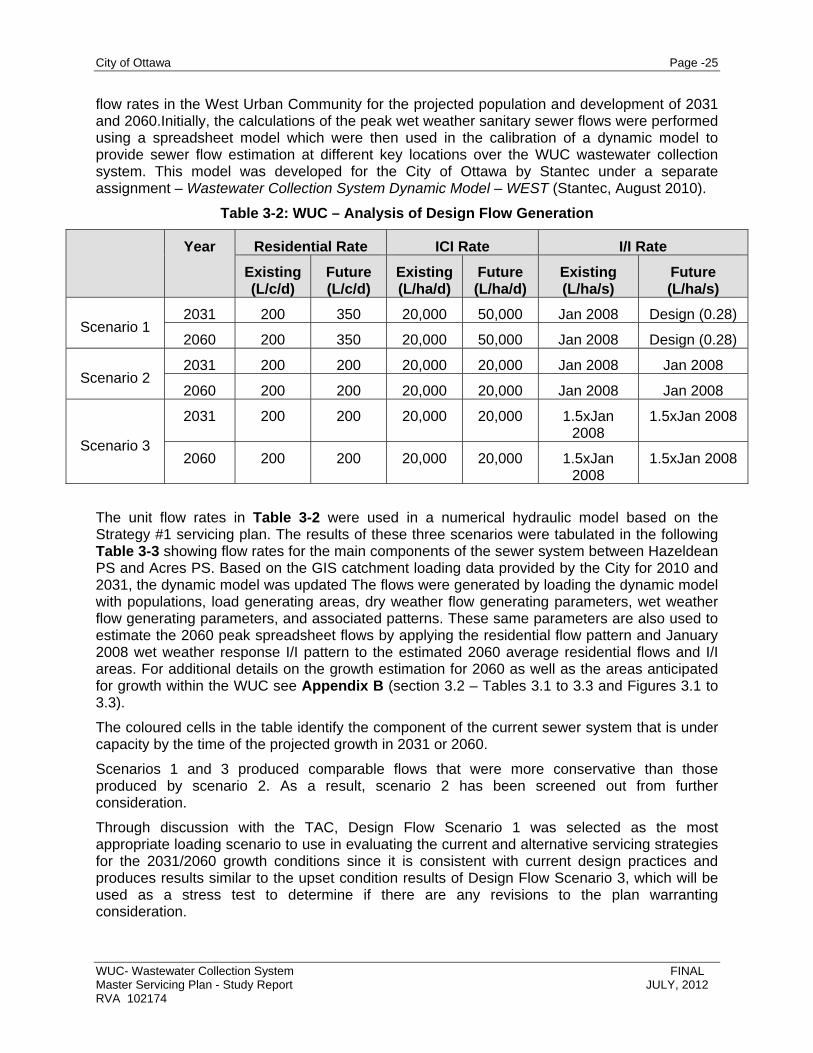
Table 3-2 below presents the design criteria used to create the three design scenarios for the analysis of the development strategies. Each scenario was used to estimate the sanitary sewer
City of Ottawa Page -25
WUC- Wastewater Collection System FINAL Master Servicing Plan - Study Report JULY, 2012 RVA 102174
flow rates in the West Urban Community for the projected population and development of 2031 and 2060.Initially, the calculations of the peak wet weather sanitary sewer flows were performed using a spreadsheet model which were then used in the calibration of a dynamic model to provide sewer flow estimation at different key locations over the WUC wastewater collection system. This model was developed for the City of Ottawa by Stantec under a separate assignment – Wastewater Collection System Dynamic Model – WEST (Stantec, August 2010).
Table 3-2: WUC – Analysis of Design Flow Generation
Year Residential Rate ICI Rate I/I Rate
Existing (L/c/d)
Future (L/c/d)
Existing (L/ha/d)
Future (L/ha/d)
Existing (L/ha/s)
Future (L/ha/s)
Scenario 1 2031 200 350 20,000 50,000 Jan 2008 Design (0.28)
2060 200 350 20,000 50,000 Jan 2008 Design (0.28)
Scenario 2 2031 200 200 20,000 20,000 Jan 2008 Jan 2008
2060 200 200 20,000 20,000 Jan 2008 Jan 2008
Scenario 3
2031 200 200 20,000 20,000 1.5xJan 2008
1.5xJan 2008
2060 200 200 20,000 20,000 1.5xJan 2008
1.5xJan 2008
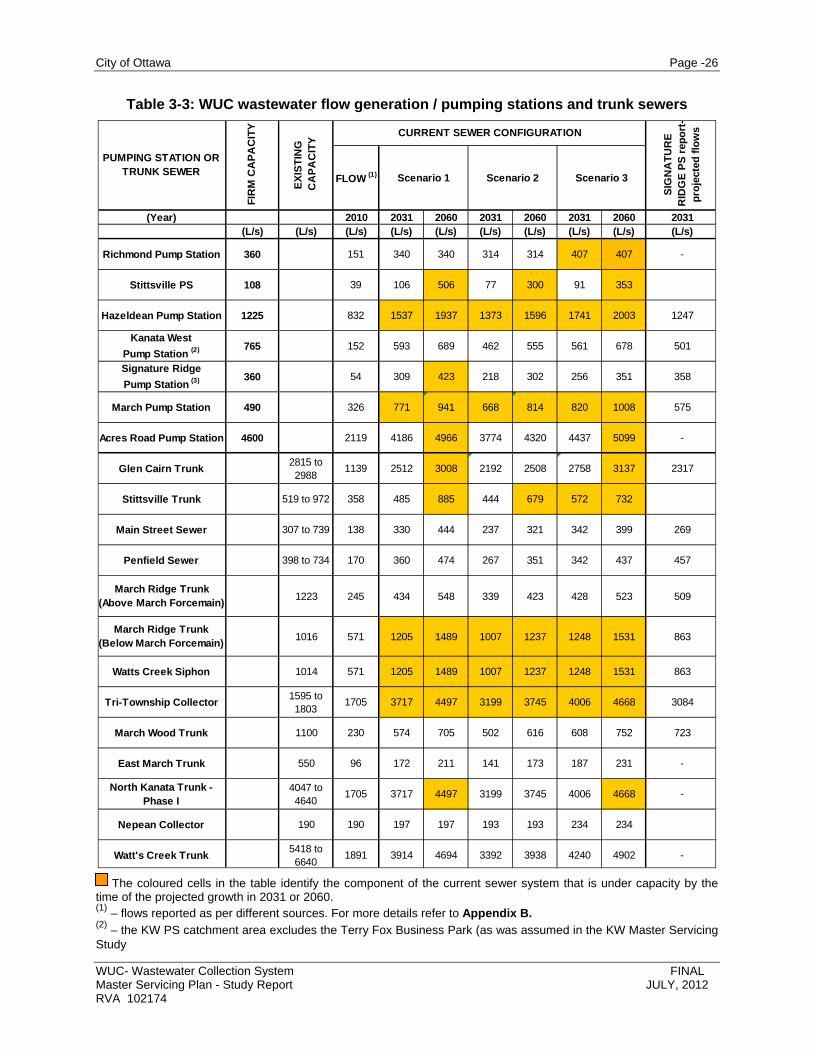
The unit flow rates in Table 3-2 were used in a numerical hydraulic model based on the Strategy #1 servicing plan. The results of these three scenarios were tabulated in the following Table 3-3 showing flow rates for the main components of the sewer system between Hazeldean PS and Acres PS. Based on the GIS catchment loading data provided by the City for 2010 and 2031, the dynamic model was updated The flows were generated by loading the dynamic model with populations, load generating areas, dry weather flow generating parameters, wet weather flow generating parameters, and associated patterns. These same parameters are also used to estimate the 2060 peak spreadsheet flows by applying the residential flow pattern and January 2008 wet weather response I/I pattern to the estimated 2060 average residential flows and I/I areas. For additional details on the growth estimation for 2060 as well as the areas anticipated for growth within the WUC see Appendix B (section 3.2 – Tables 3.1 to 3.3 and Figures 3.1 to 3.3).
The coloured cells in the table identify the component of the current sewer system that is under capacity by the time of the projected growth in 2031 or 2060.
Scenarios 1 and 3 produced comparable flows that were more conservative than those produced by scenario 2. As a result, scenario 2 has been screened out from further consideration.
Through discussion with the TAC, Design Flow Scenario 1 was selected as the most appropriate loading scenario to use in evaluating the current and alternative servicing strategies for the 2031/2060 growth conditions since it is consistent with current design practices and produces results similar to the upset condition results of Design Flow Scenario 3, which will be used as a stress test to determine if there are any revisions to the plan warranting consideration.
City of Ottawa Page -26
WUC- Wastewater Collection System FINAL Master Servicing Plan - Study Report JULY, 2012 RVA 102174
Table 3-3: WUC wastewater flow generation / pumping stations and trunk sewers
(Year) 2010 2031 2060 2031 2060 2031 2060 2031(L/s) (L/s) (L/s) (L/s) (L/s) (L/s) (L/s) (L/s) (L/s) (L/s)
Richmond Pump Station 360 151 340 340 314 314 407 407 -
Stittsville PS 108 39 106 506 77 300 91 353
Hazeldean Pump Station 1225 832 1537 1937 1373 1596 1741 2003 1247
Kanata West
Pump Station (2) 765 152 593 689 462 555 561 678 501
Signature Ridge
Pump Station (3) 360 54 309 423 218 302 256 351 358
March Pump Station 490 326 771 941 668 814 820 1008 575
Acres Road Pump Station 4600 2119 4186 4966 3774 4320 4437 5099 -
Glen Cairn Trunk2815 to 2988
1139 2512 3008 2192 2508 2758 3137 2317
Stittsville Trunk 519 to 972 358 485 885 444 679 572 732
Main Street Sewer 307 to 739 138 330 444 237 321 342 399 269
Penfield Sewer 398 to 734 170 360 474 267 351 342 437 457
March Ridge Trunk (Above March Forcemain)
1223 245 434 548 339 423 428 523 509
March Ridge Trunk (Below March Forcemain)
1016 571 1205 1489 1007 1237 1248 1531 863
Watts Creek Siphon 1014 571 1205 1489 1007 1237 1248 1531 863
Tri-Township Collector1595 to 1803
1705 3717 4497 3199 3745 4006 4668 3084
March Wood Trunk 1100 230 574 705 502 616 608 752 723
East March Trunk 550 96 172 211 141 173 187 231 -
North Kanata Trunk - Phase I
4047 to 4640
1705 3717 4497 3199 3745 4006 4668 -
Nepean Collector 190 190 197 197 193 193 234 234
Watt's Creek Trunk5418 to 6640
1891 3914 4694 3392 3938 4240 4902 -
FLOW (1)
CURRENT SEWER CONFIGURATION
SIG
NA
TU
RE
R
IDG
E P
S r
epo
rt-
pro
ject
ed f
low
s
Scenario 1 Scenario 2 Scenario 3
FIR
M C
AP
AC
ITY
PUMPING STATION OR TRUNK SEWER
EX
IST
ING
C
AP
AC
ITY
The coloured cells in the table identify the component of the current sewer system that is under capacity by the time of the projected growth in 2031 or 2060. (1) – flows reported as per different sources. For more details refer to Appendix B. (2) – the KW PS catchment area excludes the Terry Fox Business Park (as was assumed in the KW Master Servicing Study

City of Ottawa Page -27
WUC- Wastewater Collection System FINAL Master Servicing Plan - Study Report JULY, 2012 RVA 102174
(3) – the Signature Ridge PS catchment area includes the Terry Fox Business Park
3.3 Future constraints and issues
Based on the table above, the existing constraints previously identified are now addressed based on the sewer flow projections for 2031 and 2060 under Scenario 1. Using a standard linear extrapolation from 2010 to the projected years for each of the sewer components with capacity issues, the approximate time when those components are in need for capacity upgrading in order to accommodate the projected sewer flows were determined.
Pumping Stations upgrades are required:
- for Acres Rd. PS by no later than 2016 when the existing 2700L/s firm capacity will be reached. As mentioned before, upgrades for Acres PS involve replacement of the existing 4 pumps and addition of three new pumps;
- Overflow Chamber upstream Acres Rd. PS rehabilitation by 2012
- for March Rd. PS capacity increase by no later than 2022 when the existing 490L/s firm capacity will be reached. However, the North Kanata Trunk – Phase 2 is to be implemented by 2014, and thus, March PS will be modified to low lifting PS by the same time.
- for Signature Ridge PS capacity increase by 2043. The upgrades to the 360L/s firm capacity are undergoing and are expected to be implemented by 2012 / 2013;
- for Hazeldean PS capacity increase and construction of a third forcemain by 2021;
- for Stittsville PS capacity increase by 2031/2032 since it will reach almost the existing firm capacity
Trunk sewer capacity upgrades are required:
- for Tri-Township Collector replacement and upsizing by 2017, provided that the NKT Phase 2 is implemented by 2014.
- for North Kanata Trunk – Phase 2 to be completed by 2014
- for March Ridge Trunk and Watts Creek siphon replacement and upsizing by 2026. However, since NKT – Phase 2 is to be implemented by 2014, all flows from March PS shall be then diverted directly to the NKT, and thus, significant capacity will be freed up in those trunks, avoiding therefore, upgrading in the near future.
City of Ottawa Page -28
WUC- Wastewater Collection System FINAL Master Servicing Plan - Study Report JULY, 2012 RVA 102174
4 SANITARY SEWER SERVICING STRATEGIES – ANALYSIS
4.1 Investigation approach
At the onset of this project, the City identified three (3) sanitary sewer servicing strategies to be assessed for the 2031 projection scenario. Additional strategies were to be developed following the investigation of these first strategies and finally they would in turn be used as a baseline to which further options were identified in order to provide servicing for 2060 development projection. The three servicing strategies are:
1. Servicing Strategy #1: Upgrades proposed in the Infrastructure Master Plan Update-
Wastewater Collection System Assessment (Stantec, May 2009), considered as the base line. These upgrades include the following infrastructure work
Second phase of North Kanata Trunk sewer: approx. 2100m from MH tr01000 to Herzberg Rd. to the 1200mm diam. concrete pipe stub from March Rd. PS;
March Rd. PS conversion into a low lifting station, decommissioning of the stations forcemains, the March Rd. Collector and connection of the pump station to the North Kanata Trunk (second phase);
Kanata West PS and forcemains: new construction; upgrades to Hazeldean PS: to accommodate additional flows from Fernbank
Lands development; upgrades to Signature Ridge PS and forcemains: include upgrades to the wet
well, the pumps and the forcemains to support the proposed development proceeding in the immediate area;
replacement of the Tri-Township Collector: the existing sewer collector is too small to accommodate the expected flows from the projected developments (Fernbank Lands, area near Signature Ridge PS and new Kanata West PS)
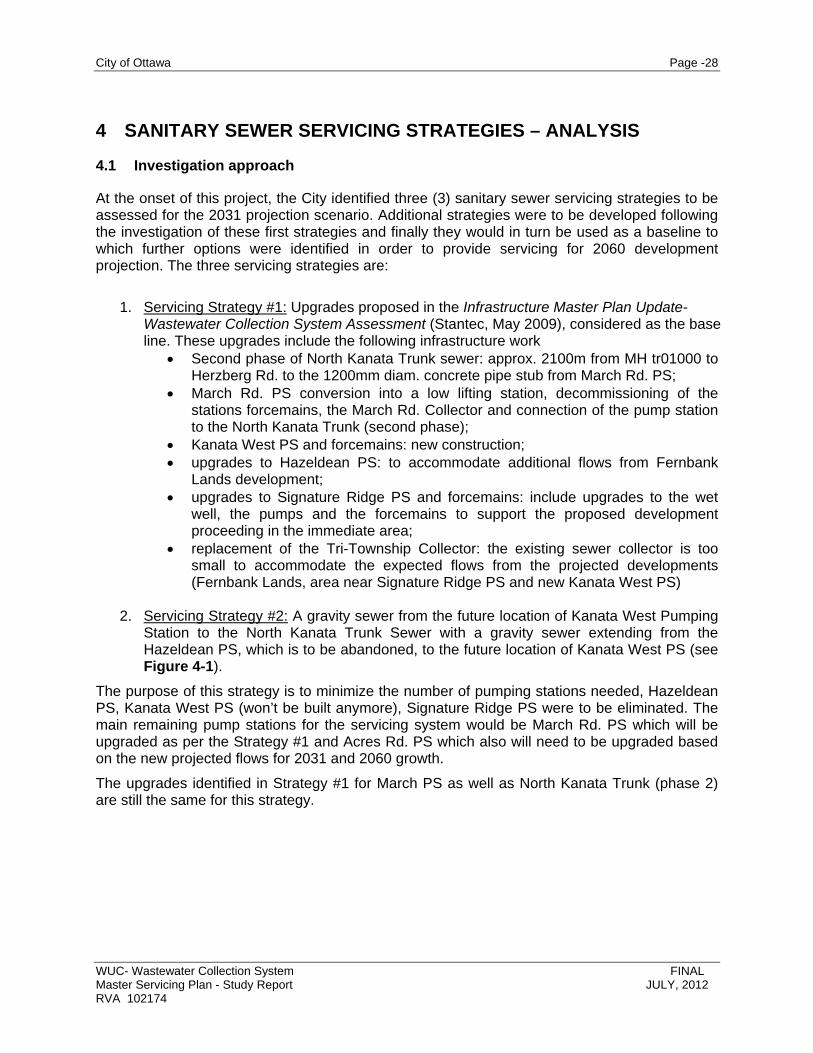
2. Servicing Strategy #2: A gravity sewer from the future location of Kanata West Pumping
Station to the North Kanata Trunk Sewer with a gravity sewer extending from the Hazeldean PS, which is to be abandoned, to the future location of Kanata West PS (see Figure 4-1).
The purpose of this strategy is to minimize the number of pumping stations needed, Hazeldean PS, Kanata West PS (won’t be built anymore), Signature Ridge PS were to be eliminated. The main remaining pump stations for the servicing system would be March Rd. PS which will be upgraded as per the Strategy #1 and Acres Rd. PS which also will need to be upgraded based on the new projected flows for 2031 and 2060 growth.
The upgrades identified in Strategy #1 for March PS as well as North Kanata Trunk (phase 2) are still the same for this strategy.
City of Ottawa Page -29
WUC- Wastewater Collection System FINAL Master Servicing Plan - Study Report JULY, 2012 RVA 102174
Figure 4-1: Servicing Strategy #2 – general plan
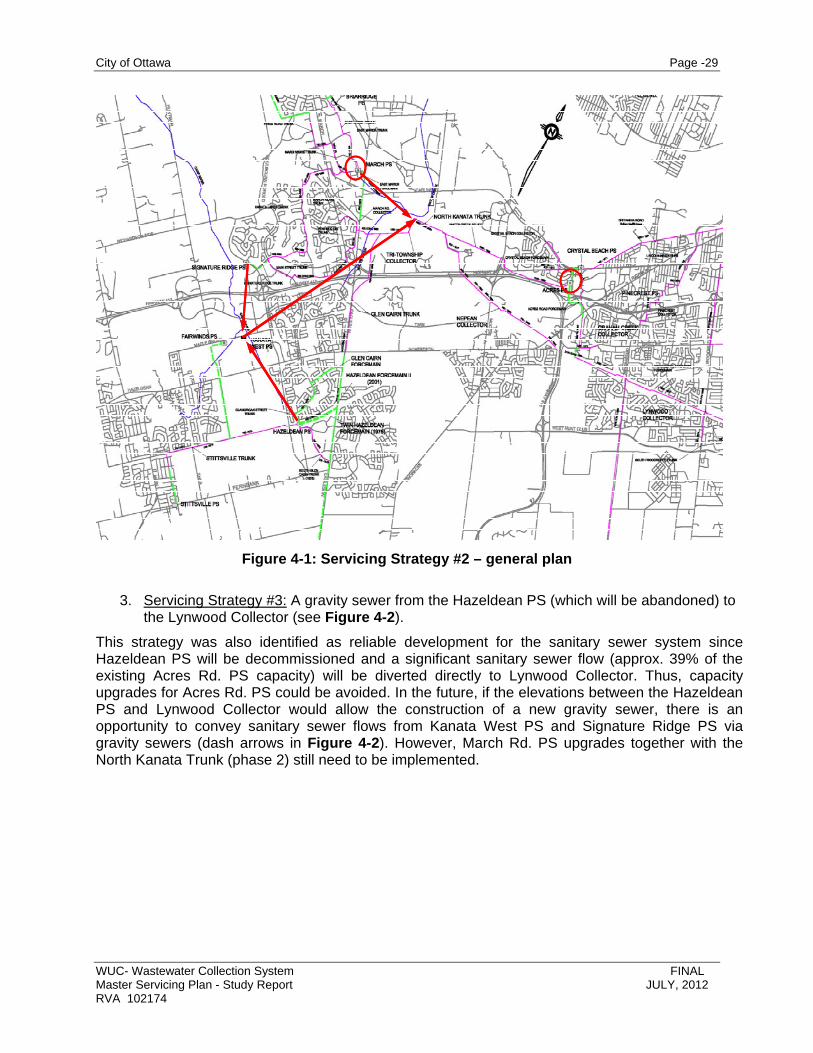
3. Servicing Strategy #3: A gravity sewer from the Hazeldean PS (which will be abandoned) to
the Lynwood Collector (see Figure 4-2).
This strategy was also identified as reliable development for the sanitary sewer system since Hazeldean PS will be decommissioned and a significant sanitary sewer flow (approx. 39% of the existing Acres Rd. PS capacity) will be diverted directly to Lynwood Collector. Thus, capacity upgrades for Acres Rd. PS could be avoided. In the future, if the elevations between the Hazeldean PS and Lynwood Collector would allow the construction of a new gravity sewer, there is an opportunity to convey sanitary sewer flows from Kanata West PS and Signature Ridge PS via gravity sewers (dash arrows in Figure 4-2). However, March Rd. PS upgrades together with the North Kanata Trunk (phase 2) still need to be implemented.

City of Ottawa Page -30
WUC- Wastewater Collection System FINAL Master Servicing Plan - Study Report JULY, 2012 RVA 102174
Figure 4-2: Servicing Strategy #3 – general plan
The strategy evaluation process included three steps:
Initial screening: determine whether the alternative servicing strategies are hydraulically feasible - a ”go-no go” assessment. If they were feasible, then the alternative strategy was considered further in the second step, and if not, the alternative strategy was discarded from further analysis – but only after the strategies were re-examined to determine if minor modifications to the strategies could make them feasible. Furthermore, refinements and variations of the alternative servicing strategies were developed with the objective of enhancing the performance of the individual strategies.
Technical screening: first a brief analysis was conducted in order to determine the possible routes (corridors) available for sewer trunks and forcemains – location, construction, risks, and social / environmental impact. Once the preferred corridors were identified, several servicing options were formulated for each strategy based on the sewer flows projected under modeling Scenario 1. For each option a brief evaluation was performed with respect to risks, construction methods, impact on capital cost, future operation and maintenance costs, phasing of the construction, and also with respect to requirements for approval from different agencies, EA investigation and property acquisition requirements (or sewer easement requirements).
Detailed evaluation and ranking: the options of each strategy were ranked against each other as per the established evaluation criteria that includes environmental and social

City of Ottawa Page -31
WUC- Wastewater Collection System FINAL Master Servicing Plan - Study Report JULY, 2012 RVA 102174
impact, technical capacity (phasing flexibility, short-term and long-term reliability, and implementation time-frame) and economy (capital cost, life-cycle cost, and operation and maintenance costs).
4.2 Initial screening
For the initial “go – no go” analysis, the hydraulics of the proposed strategies were investigated at a high level to identify if the existing elevation of the outlets and the ground surface considered for each strategy would allow the implementation of the proposed infrastructure work.
4.2.1 Initial Screening Strategy #1
Strategy #1 is based on infrastructure proposed by previous studies. Two significant gravity sewers are proposed in this strategy and are briefly reviewed below:
North Kanata Trunk – Phase 2: March Rd. PS is to be converted into a low lift pumping station discharging into a 1200mm diam. concrete pipe stub left between the pump station and Herzberg Rd. / Legget Dr. intersection. The pipe invert at the intersection is 70.45m and the length to NKT (TR01000 invert 67.00m) following the alignment already determined in the North Kanata Sanitary Sewer Infrastructure Upgrade Study (2001) is approximately 2100m. Thus, the slope is approximately 0.16% which is within the City’s Sewer Design Guidelines.
Replacement for the Tri-Township Collector from the joint chamber with Glen Cairn Trunk and Watts Creek sewer siphon to the North Kanata Trunk (NKT) at the upstream end (TR01000). The collector is in poor condition and its current diameter (1050mm) cannot provide enough capacity for near future flow increase. The collector will be replaced by a larger size pipe following the same alignment. It could be replaced at the same current elevation or at a deeper elevation. Regardless the servicing strategy recommended for implementation at the end of this assignment, the Tri-Township Collector is recommended to be replaced at a deeper elevation to create an opportunity in the future for the decommissioning of the Watts Creek sewer siphon;
The rest of the infrastructure work proposed in Strategy #1 refers to upgrades to sewage pump stations and construction of a new pumping station and forcemains (Kanata West PS). Thus, Strategy #1 is considered further in the technical screening where different options will be formulated.
4.2.2 Initial Screening Strategy #2
This strategy minimizes pump stations by building a gravity sewer to convey sewage flows from south to north, specifically from the location of Kanata West PS (KW PS) to the NKT – Phase 1 at the upstream end (MH TR01000). For the purpose of this investigation a few possible routes for the new gravity sewer were considered. For example, from the location of KW PS following the Maple Grove Rd. alignment through to Eagleson Rd. and from here following the alignment of the Glen Cairn Trunk sewer and Tri-Township Collector to NKT. Another route was considered from the location of KW PS to Eagleson Rd. via Katimavik Blvd. Table 4-1 below shows the anticipated invert at the KW PS location as determined in previous studies for Kanata West lands (i.e. Kanata West Master Servicing Study, Volume 1 of 2 – June 16, 2006) and the existing invert at the upstream end of the NKT.

City of Ottawa Page -32
WUC- Wastewater Collection System FINAL Master Servicing Plan - Study Report JULY, 2012 RVA 102174
Table 4-1: Initial screening for Strategy #2 – gravity sewer from KW PS location to NKT sewer upstream end (tr01000)
Pumping Station and Trunk Sewer
Inlet Invert [m]
Approx. distances to NKT [m]
Slope Ground elevations at different points along the gravity sewer routes
location of KW PS
86.5 6600 to 7100 0.30% to 0.27%
96m – KW PS, 103.6m – Maple Grove/Terry Fox, 109.8m – Katimavik/Terry Fox, 102m – Kakulu/Eagleson 97m – HWY 417 84.75m – Tri-Township /GlenCairn/ Watts Creek siphon 75.77m – NKT (tr01000)
North Kanata Trunk
67.00 (@ TR01000)
Based on the resulting slopes and the ground elevation variation the new gravity sewer shows enough cover and slopes that are well within the City’s Sewer Design Guidelines (min. 0.1%).
However, as mentioned before, for this strategy the investigation checked the possibility of building a gravity sewer from Hazeldean PS and respectively from Signature Ridge PS to the location of Kanata West PS. In this case the inlet invert at Kanata West PS as determined in previous studies might need to be deeper in order to accommodate both mentioned gravity sewers. Table 4-2 below indicates the minimum elevation of the inlet at KW PS corresponding to minimum slope gravity sewers (0.1%) from Hazeldean PS and Signature Ridge PS as well as the recommended values to provide enough allowances to permit design and construction of the sewers.
Table 4-2: Initial screening for Strategy #2 – gravity sewers from Hazeldean PS and Signature Ridge PS to the location of KW PS
Pumping Station
Exist. inlet inverts [m]
Approx. distances to KW PS location [m]
Min. invert at KW PS location [m]
Recom’d. slope [%]
Recom’d. invert at KW PS location [m]
Ground elevations
Hazeldean PS
88.1 2800 to
3000
85.3 to
85.1
0.12% 84.5 96m – Hazeldean PS 102m – Hazeldean Rd. /Terry Fox 96.9m – Silver Seven / Maple Grove 97.2m – Silver Seven / Palladium 97m – HWY417 at Silver Seven 94m – at Signature Ridge PS
Signature Ridge PS
87.55 1820 85.68
Based on the resulting slopes and ground elevation, Strategy #2 is identified as feasible and considered for further analysis in the technical screening.

City of Ottawa Page -33
WUC- Wastewater Collection System FINAL Master Servicing Plan - Study Report JULY, 2012 RVA 102174
4.2.3 Initial Screening Strategy #3
This strategy diverts a portion of south Kanata to the Lynwood Collection Sewer. It proposed a gravity sewer to convey sewage flows from west to east, specifically from Hazeldean PS to the Lynwood Collector. For the purpose of this analysis three locations were considered for connection to Lynwood Collector: MH LC01700 the upstream end, MH LC01000 at Greenbank St. and MH LC00700 at Woodroffe Dr. Table 4-3 below shows the inlet invert at Hazeldean PS compared to the sewer collector invert at the three proposed connection points.
Table 4-3: Initial Screening for Strategy #3 / inverts, distances and resulting trunk slopes
Pumping Station and Trunk Sewer
Inlet Invert [m]
Approx. distances to Lynwood Collector [m]
Slope Ground elevations at different points along the gravity sewer routes
Hazeldean PS
88.1 96m – Hazeldean PS 109m – Eagleson Rd. at pedestrian path;105m – Eagleson Rd. at Hydro easement; 116m – Stonehaven Dr. at Hydro easement; 117m – Richmond Rd. / West Hunt Club Rd. 104.2m – West Hunt Club Rd. / Moodie Dr. 94m – HWY 416 at West Hunt Club Rd. 86m – Lynwood Collector (LC01700) 92 to 96m – West Hunt Club from HWY 416 to Greenbank Rd. 96 to 90.5m – West Hunt Club Rd. from Greenbank Rd. to Woodroffe Ave.
Lynwood Collector
80.13 (@ LC01700 upstream end)
9570 to 10600
0.083% to 0.075%
Lynwood Collector
78.18 (@ LC01000 – Greenbank St.)
11200 to 12200
0.088% to 0.08%
Lynwood Collector
75.34 (@ LC00700 – Woodroffe Dr.)
13300 to 14300
0.096% to 0.089%
Based on approximate possible routes for a gravity sewer from Hazeldean PS to Lynwood Collector the resulting slopes are smaller than the 0.1% recommended in the City’s Sewer Design Guidelines; therefore, Strategy #3 is disregarded from further analysis.
4.2.4 Development of Additional Strategies
Strategy #1 and #2 are considered feasible but Strategy #3 is a “no go” case. However, a new Strategy #4 was formulated instead and further investigated. The concept of this strategy includes modification to Hazeldean PS and forcemains to pump into a new gravity sewer that will convey the sewer flows from the station to the Lynwood Collector, with the station servicing as a low lift station.
Table 4-4 below shows what invert is required at the Hazeldean PS outlet in order to have a gravity sewer at a minimum 0.1% slope connecting into the Lynwood Collector respectively to the three connection points. The proposed inverts also include allowance for the inherent drops in the maintenance holes along the trunk sewer routes.

City of Ottawa Page -34
WUC- Wastewater Collection System FINAL Master Servicing Plan - Study Report JULY, 2012 RVA 102174
Table 4-4: Initial Screening for Strategy #4 / inverts, distances and resulting trunk slopes
Pumping Station and Trunk Sewer
Inlet Invert [m]
Approx. distances to Lynwood Collector [m]
Slope [%]
Proposed invert of outlet at Hazeldean PS
Difference between inlet /outlet inverts
Hazeldean PS 88.1
Lynwood Collector
80.13 (@ LC01700 upstream)
9570 to 10600
0.11% to 0.10%
~92.23 4.13
Lynwood Collector
78.18 (@ LC01000 – Greenbank St.)
11200 to 12200
0.11% to 0.1%
~91.88 3.78
Lynwood Collector
75.34 (@ LC00700 – Woodroffe Dr.)
13300 to 14300
0.11% to 0.10%
~91.14 3.04
This strategy appears feasible and provides numerous advantages, such as:
modification of Hazeldean PS into a low lifting station which could result in decommissioning of the existing forcemains. In addition, future upgrades will only involve the pumping capacity.
a significant sewer flow will be diverted from the Glen Cairn Trunk; therefore, providing more capacity for future development in the Kanata west lands.
the same sewer flow will also be diverted from Acres Rd. PS, thus, avoiding pumping capacity upgrades in the near future.
In conclusion, there are three servicing strategies considered for further analysis: Strategy#1 following the Infrastructure Servicing Master Plan Upgrades – study, Strategy #2 that conveys through a gravity sewer trunk flows from Hazeldean PS to the North Kanata Trunk via the location of the Kanata West PS and Strategy #4 where flows from Hazeldean PS are pumped into a new gravity sewer trunk to discharge into the Lynwood Collector.
4.3 Technical Screening – Development of Servicing Options
4.3.1 Sewer Corridors Investigation
The following represents a brief analysis of possible routes to be used for alignment of the proposed infrastructure in each strategy. The corridors are ranked based on the constructability issues (i.e. right of way width, road configuration – street lights poles, sidewalks, grass boulevard etc.), risk of social and environmental impact (corridors through parks, bicycle paths, next to highways, traffic characteristics), requirements for approval and property purchase, and they were considered as follows:
- low: when construction of the sewer trunk will involve significant safety issues related to construction procedures, traffic control, operation and maintenance, significant social impact during construction and operation of the trunk, and will require approvals from several different agencies (RVCA, DFO, NCC) and acquire large easements from different owners (NCC, MTO, or private);

City of Ottawa Page -35
WUC- Wastewater Collection System FINAL Master Servicing Plan - Study Report JULY, 2012 RVA 102174
- medium: when construction does not pose significant issues, but there are some concerns and potential high risk of social and environmental impacts, requires approval from different agencies, and large easement purchase from different owners;
- high: when construction does not pose significant issues, there is low risk for social and environmental impacts, and there is a minimum requirement for approvals and property purchase.
Sewer Corridors for Servicing Strategies #1 and #2
In Figure 4-3 below, several sewer corridors were identified between Hazeldean PS, Kanata West PS location and North Kanata Trunk. Those corridors are considered for servicing options related to Strategy #1 and #2. Out of those corridors, two were ranked lowest in our list due to the many challenges and risks they would add to the sewer trunk construction, and thus, not considered further in the options analysis:
Corridor #6 (north side of HWY 417) since involves working next to a highway with insufficient area for a safe construction environment (access and egress from construction site, traffic safety and control, etc.), crossing a highway bridge (Kanata Ave.) and crossing a pedestrian overpass. Other issues and risks involve operation and maintenance procedures as well as property ownership (most likely to be located on MTO property) and easements to be acquired
Corridor #10 (March Rd.) because of the relation to the other corridors; it is actually in a valid location for a sewer trunk, even though it involves working on a heavy traffic City arterial road with several intersections and ramps to/from HWY 417. On the east side of March Rd., there is a good 8m width between the outer asphalt traffic lane and the property limit where the trunk could be installed. However, this corridor is only linked to corridor #6, and there is no other opportunity yet identified to be used in conjunction with other corridors;
Regarding Strategy #1, the routes for the proposed new sewers were already investigated and approved. For example, North Kanata Trunk – Phase 2 as per the North Kanata Sanitary Sewer Infrastructure Upgrade Study (August 2001), the replacement of the TTC will take place under the same alignment and the forcemains for Kanata West PS will follow Katimavik Blvd alignment to Eagleson Rd where it connects into the Glen Cairn Trunk (Kanata West Master Servicing Study – 2006).
With respect to Strategy #2, there are several possible routes for gravity sewer from Hazeldean PS to KW PS location and to the North Kanata Trunk. From Hazeldean PS to the KW PS location there are corridors #1, #7 and #8 that could be used. Corridor #1 is approximately 500m longer than corridor #7 and approximately 1000m longer than corridor #8 but is located on the City’s right of way along Terry Fox Dr. and Maple Grove Rd. Both corridors #7 and #8 are located on private land, thus requesting land acquisition. However, with respect to sewer constructability corridors #7 and #8 are preferred depending on the strategy and the corresponding potential options because they present several advantages compared to corridor #1:
there is no traffic disruption expected, thus, significant reduction in cost;

City of Ottawa Page -36
WUC- Wastewater Collection System FINAL Master Servicing Plan - Study Report JULY, 2012 RVA 102174
based on the calculated inverts and ground surface elevations, a gravity trunk sewer will most likely be installed by open-cut on both corridors #7 and #8 while on corridor #1 a large portion would be installed by tunnelling due to the fact that Terry Fox Dr. towards Maple Grove Rd. is gaining in elevation. Therefore, significant reduction in cost is expected for using corridor #7 or #8;
both corridors are located on lands already proposed for development (surrounding KWPS area and the Fernbank lands), thus, a gravity sewer trunk can be integrated as part of those developments.
For the routes from Kanata West PS location to the North Kanata Trunk, the recommended corridors are #3 through Maple Grove Rd. alignment to Eagleson Rd. and #9 which is the current alignment for Glen Cairn Trunk and Tri-Township Collector. Even though Katimavik Blvd. (corridor #4) presents a better route from Terry Fox to Eagleson Rd. due to low traffic disruption during construction (large grass boulevard on the north side), corridor #3 was recommended because based on the calculated inverts and ground surface elevations, a gravity trunk sewer would be installed by tunnelling regardless the route taken and corridor #4 (Katimavik Blvd.) is approximately 700m longer, thus adding significant cost to the construction.

City of Ottawa Page -37
WUC- Wastewater Collection System FINAL Future projection Study Report JULY, 2011 RVA 102174
Figure 4-3: Proposed Sewer Trunk Corridors for Strategies #1 and #2

City of Ottawa Page -38
WUC- Wastewater Collection System FINAL Master Servicing Plan - Study Report JULY, 2012 RVA 102174
Sewer Corridors for Servicing Strategy #4
Similar to corridors for Strategies #1 and #2, in Figure 4-4 several sewer corridors were identified between Hazeldean PS and Lynwood Collector for the servicing options related to Strategy #4. The main constraints identified for this strategy are related to the fact that sewer infrastructure has to cross federal land (approximately 2.0km of sewer is located on NCC property and on a heavy forested and swamp landscape) and HWY 416. Out of those corridors, two were ranked lowest in our list due to the many challenges and risks they would add to the sewer trunk construction, and thus, not considered further in the options analysis.
Corridor #5 is considered low – proposing to use the Hydro easement nearby Hazeldean PS to install the new sewer trunk from the pumping station to Richmond Rd. The easement is not wide enough through the residential area to provide a safe distance from the Hydro power towers and the private properties adjacent to the easement.
Corridor #6 is considered low – along Robertson Rd. and Richmond Rd. a new sewer trunk would be possible to install even though some higher costs could be triggered by traffic control issues since both streets shows heavy traffic and several intersections with traffic lights to cross. However, this corridor is disregarded due to the eastern end where the proposed sewer trunk would have to cross HWY 416. At this location the highway is approximately 10m lower than the ground elevation on both sides and very difficult ground condition encountered during the highway rehabilitation would make the crossing very difficult and very expensive.
For the section from Hazeldean PS to the intersection Richmond Rd. / West Hunt Club Rd., the preferred corridors are #1 and #3. Corridor #4 is entirely on the City’s right of way, however, it is approximately 1km longer and will involve traffic disruption and social impact since is going through the main urban way of the Kanata south community. This will significantly increase the construction cost compared to corridors #1 and #3 where no traffic disruption is anticipated. Corridor #3, however, crosses NCC lands, which in turn implies some additional costs and scheduling to produce a federal EA, obtain approvals and sewer easement acquisition.
For the following section from Richmond Rd. / West Hunt Club Rd. intersection to the Lynwood Collector, three corridors were investigated: #8, #9 and #10 Corridors #9 and #10 provide the connection to Lynwood Collector at Greenbank Rd. and Woodroffe Ave and are located on the City’s right of way. Compared to #8, they are respectively 0.7km and 2.7km longer. Corridor #8 is approximately 1.9km long, however, by using this route approximately 1km of the Lynwood Collector section needs be replaced which will add significant cost to the construction due to sewer bypass and easement size issues. Further in the option development for Strategy #4, corridors #9 and #10 are considered.

City of Ottawa Page -39
WUC- Wastewater Collection System FINAL Master Servicing Plan - Study Report JULY, 2012 RVA 102174
Figure 4-4: Proposed Sewer Trunk Corridors for Strategy #4

City of Ottawa Page -40
WUC- Wastewater Collection System FINAL Master Servicing Plan - Study Report JULY, 2012 RVA 102174
4.3.2 Servicing Options for Strategy #1:
In developing different servicing options for this strategy, our investigation assessed the distribution and direction of the sewer flows in the system, specifically between Hazeldean and Kanata West PS.
Regarding the Kanata north lands, Carp and lands serviced by Signature Ridge PS, the preferred servicing solution is the modification of March PS (low lifting station) and the construction of the North Kanata Trunk – Phase 2. As a result, significant current and future sewer flows are diverted from the Watts Creek siphon providing enough capacity for future development of the land serviced by Signature Ridge PS. In addition, the Tri-Township Collector needs to be replaced regardless of the sewer configuration upstream since it is nearing its capacity.
Therefore our focus is on the area south of HWY 417, in the Kanata West, Stittsville, Fernbank and Kanata South lands. Currently the main pump station in this area is Hazeldean PS with a firm capacity of 1225L/s (achieved - 2010/2011) and a future capacity need of 1533L/s (for 2031) and 1933L/s (for 2060) as per the sewer flow projections under modeling Scenario 1. The Kanata West PS, as proposed in the Kanata West Master Servicing Study – 2006 should have a 765L/s capacity. The Hazeldean PS ultimately would be 2.5 times larger in capacity than Kanata West PS. In order to create a more balanced system, two servicing options aside from the initial Strategy #1 option were developed. The net effect is to reduce flows to the older Hazeldean PS and create a more robust system.
Option 1A: This initial servicing option based strictly on the previous Infrastructure Master Plan Update recommendation (Figure 4-5), and includes the following infrastructure components:
1. Construction of North Kanata Trunk – Phase 2 (from March PS to North Kanata Trunk)
2. March PS upgrades (conversion into a low lifting station)
3. Replacement of Tri-Township Collector between Glen Cairn Trunk and North Kanata Trunk;
4. Signature Ridge PS upgrades (overflow / wet well / forcemain);
5. Hazeldean PS upgrades (capacity increase / third forcemain)
6. New Kanata West PS (KW PS) including forcemains;
7. Fernbank Trunk sewer to Hazeldean PS
Two additional options (1B and 1C) were produced for this strategy and they are based on a new gravity interceptor sewer, and interceptor chamber used to divert flows from the Hazeldean PS to the KW PS.
The rational for this interceptor sewer is to control and divert portion of sewer flows from the Stittsville Trunk and future Fernbank Trunk to the Kanata West PS, avoiding the additional need of upgrades to Hazeldean PS and third forcemain (item 5 in the above list is removed for Options 1B and 1C). In addition, depending on the configuration of the interceptor sewer (i.e. larger size, deeper installation) it creates the opportunity for a future gravity sewer from Hazeldean PS to KW PS to Tri-Township Collector.

City of Ottawa Page -41
WUC- Wastewater Collection System FINAL Master Servicing Plan - Study Report JULY, 2012 RVA 102174
Figure 4-5: Strategy #1 – Option 1A
MARCH PS – conv. to low lifting
FERNBANK TRUNK sewer

City of Ottawa Page -42
WUC- Wastewater Collection System FINAL Master Servicing Plan - Study Report JULY, 2012 RVA 102174
Figure 4-6: Strategy #1 – Option 1B and Option 1C
MARCH PS – conv. to low lifting
FERNBANK TRUNK sewer
INTERCEPTOR SEWER
INTERCEPTOR CHAMBER
City of Ottawa Page -43
WUC- Wastewater Collection System FINAL Master Servicing Plan - Study Report JULY, 2012 RVA 102174
Option 1B was created to avoid additional upgrades to Hazeldean PS. Thus, the new interceptor sewer and the diversion chamber will have to convey, at a minimum, the flow difference between the current capacity of the pumping station (1225L/s) and the future pumping flows projections – at least 312L/s up to 2031 and 712L/s up to 2060. In this case, the recommended size for the new sewer would be 975mm in diameter installed at 0.15% slope which will provide approximately 900L/s capacity. The connection at the KW PS would then be approximately 87.64m elevation, which is about 1.14m above the anticipated inlet invert of 86.50m (Kanata West Master Servicing Study – June 2006). Capacity of the KW PS and forcemains would be increased to 1920L/s.
A recent study conducted by Stantec under a separate cover analyzed and detailed the routing of the proposed interceptor sewer and the flows to be diverted from the Stittsville / new Fernbank Trunk sewers to KW PS as well as the potential of decommissioning some of the local sewage pumping stations in the west area of the KW PS. For more information refer to West Urban Community Sanitary Sewer Servicing. Technical Memorandum – Stantec, May 2012.
The study selected for the new interceptor sewer four routes from the Stittsville / new Fernbank Trunk sewers located on Trans Canada Trail to KW PS (Figure 4-7). Based on discussion with various developers and/or their representatives about where each of the developments in the area is in terms of planning, approval or construction process, several sub-routes were developed for each of the four routes initially selected.
Based on the results of the study that analyzed several sewer flow diversion, the impact on KW PS future configuration, the impact on Hazeldean PS future configuration and HGL control, as well as of the cost associated with each sub-route, the City staff considered sub-route R4-C as the preferred option for the new interceptor sewer. This option includes the following:
two diversion chambers: on the Stittsville Trunk and on the new Fernbank Trunk (Street A / Trans Canada Trail intersection)
interceptor sewer of 900mm diam. at 0.18% slope (approximately 800L/s capacity) for approximately 2220m to Trinity Development (north of Hazeldean Rd.)
interceptor sewer of 975mm diam. at 0.16% slope (approximately 905L/s capacity) for approximately 600m to Maple Groove Rd, and
upsize existing Maple Groove sewer to 1050mm diam. at 0.2% slope for approximately 220m to KW PS.
The solution also proposed two gates for each chamber to limit and/or divert all flows to either KW PS or Hazeldean PS. This configuration will provide the most flexibility to operating the system under all conditions.
This interceptor sewer route provides additional interim residual capacity at the Hazeldean PS and also flexibility in operation of the Hazeldean and KW pumping stations. Based on the projection flows for 2031, capacity increase of the KW PS and forcemains will be required. The estimated capital costs (including 50% contingency and engineering) for proposed interceptor sewer are $6.21M with additional cost to KW PS at $1.48M and KW PS forcemains at $1.14M. The estimated capital costs (including 50% contingency and engineering) for the third Hazeldean PS forcemain which would no longer be required are $7.40M.
As a result, further in our analysis, Option 1B will include the new interceptor sewer from the Stittsville and new Fernbank Trunk Sewers to KW PS as per the route R4-C identified in Stantec’s Technical Memorandum (May 2012)

City of Ottawa Page -44
WUC- Wastewater Collection System FINAL Master Servicing Plan - Study Report MAY, 2012 RVA 102174
Figure 4-7: Strategy #1 – Option 1B / interceptor sewer routing options (reference – Stantec’s Technical Memorandum)
(fu
ture
art
eria
l rd
.)
Trinity Development

City of Ottawa Page -45
WUC- Wastewater Collection System FINAL Master Servicing Plan - Study Report JULY, 2012 RVA 102174
Option 1C uses the same idea as Option 1B but it takes into perspective the future configuration of the entire WUC wastewater collection system. This option proposed the construction of a new similar Interceptor Sewer and Chamber to divert sewer flows in excess of the Hazeldean PS capacity of 1225L/s to KW PS but with the possibility that in the future an overall gravity sewer system to be implemented from Hazeldean PS to KW PS to Tri-Township Collector.
In order to facilitate this option, the diversion must take place closer to the Hazeldean PS compared to Option 1B. The new Interceptor Sewer will be designed to convey all the sewer flows from the Hazeldean PS projected for 2060. As previously identified in section 4.3.1 in the Technical Screening, corridor #7 (Figure 4-3) or similar to route R2 shown in Figure 4-7 (approximately 2700m), is considered the preferred alignment for the new interceptor sewer, which would be sized to 1500mm in diameter and installed at 0.1% slope. The connection to KW PS would be approximately 2.5 to 3m deeper than previously anticipated (from 86.50m to approx. 83.60m) such that in the future other gravity sewers could be put into service connecting Hazeldean PS to the Interceptor Chamber and KW PS to the Tri-Township Collector. This way, a gravity sanitary sewer system from Hazeldean PS to Acres Rd. PS would be created and both Hazeldean and KW pumping stations would be decommissioned. Another advantage of this option could be the fact that the new proposed inlet elevation for the KW PS will allow in the future to build a gravity sewer from Signature Ridge to discharge at KW PS location, and thus, decommissioning the former pumping station.
Overall, both Option 1B and 1C provides a better, more reliable and robust sewer system than option 1A. In addition, Option 1C allows in the long term for switching from a sewage pumping system to a gravitational sewer system. However, implementing one of these options will imply modifications to the proposed KW PS: firm capacity will need to be increased (from the current approved capacity of 765L/s to at least 925L/s and 1420L/s corresponding respectively to 2031 and 2060 projections) in the near future (by 2022 / 2023) and in particular for option 1C the pumping station inlet invert would need to be deeper and has to be implemented now during the design of the pump station. For both options, however, additional increase in capacity for Hazeldean PS and the construction of the corresponding third forcemain are not required anymore.
All three options will be further investigated with respect to impact on the environment and communities, short term and long term reliability as well as construction cost, life cycle cost and operation and maintenance costs.
4.3.3 Servicing Options for Strategy #2:
From the concept of this strategy (gravity sewer from Hazeldean PS to North Kanata Trunk via Kanata West PS location, and elimination of the Hazeldean PS, Signature Ridge PS and also avoiding the construction of Kanata West PS), two options were developed for the WUC sanitary sewer system. Option 2A (Figure 4-8) which includes the following infrastructure components:
1. Construction of North Kanata Trunk – Phase 2 (from March PS to North Kanata Trunk)
2. March PS upgrades (conversion into a low lifting station)
3. New gravity trunk sewer from the KW PS location to North Kanata Trunk (6860m); thus replacing the Tri-Township Collector;
4. New gravity trunk sewer from Hazeldean PS to KW PS location (3250m);
5. New gravity trunk sewer from Signature Ridge PS to KW PS location (1820m)
City of Ottawa Page -46
WUC- Wastewater Collection System FINAL Master Servicing Plan - Study Report JULY, 2012 RVA 102174
6. Signature Ridge PS upgrades (overflow / wet well / forcemain);
7. Hazeldean PS upgrades (capacity increase)
8. Fernbank Trunk sewer to Hazeldean PS
As seen, upgrades to Signature Ridge PS and Hazeldean PS are still part of the option since the construction of the corresponding gravity sewers (points 4 and 5) will not be finished before the time when those upgrades are needed. Ultimately this option will eliminate Hazeldean PS and Signature Ridge PS and will avoid the construction of Kanata West PS, thus providing a gravity sewer spine from south to north across the WUC.
However, construction of the new gravity sewer from the location of Kanata West PS all the way to North Kanata Trunk – 6.9km, needs upfront capital and to be finished by the end of 2016 when the Kanata West PS is anticipated to be commissioned. The construction cost requires a significantly higher investment compared to the construction of Kanata West PS (including the corresponding forcemains) because the new gravity sewer will be mainly built by tunnelling – approximately 4.9km of tunnel out of the total 6.9km. In addition the time frame for implementing this option is very tight because new studies are required: EA study, sewer easement widening, preliminary design, detailed design etc. would take approximately 2 years and the actual construction of the sewer would take approximately 2-3 years which most likely is over the 2016 infrastructure need. These delays may not be acceptable in light of current development commitments.
Option 2B (Figure 4-9) was developed as a phasing solution for the gravity sewer construction of Option 2A. This option proposes a first phase for the construction of a shorter gravity sewer through tunnelling (3.1km) from the location of KW PS to Eagleson Rd. and a new low lifting PS there to discharge flows into the Glen Cairn Trunk. In addition, the Tri-Township Collector must also be replaced as part of this first phase. The second phase includes the construction of another trunk sewer from the low lifting PS on Eagleson Rd to the new Tri-Township Collector. Thus, the PS on Eagleson Rd. will be decommissioned.
The advantage of this option compared to Option 1A is that there are less costs needed up front and Glen Cairn Trunk which is a new sewer (only 12 years in service) will be used for at least another 35 years when it will reach its capacity. At that time, the second phase will need to be implemented which provides the City with plenty of time for budget planning.

City of Ottawa Page -47
WUC- Wastewater Collection System FINAL Master Servicing Plan - Study Report JULY, 2012 RVA 102174
Figure 4-8: Strategy #2 – Option 2A
MARCH PS – conv. to low lifting
FERNBANK TRUNK sewer

City of Ottawa Page -48
WUC- Wastewater Collection System FINAL Master Servicing Plan - Study Report JULY, 2012 RVA 102174
Figure 4-9: Strategy #2 – Option 2B
MARCH PS – conv. to low lifting
FERNBANK TRUNK sewer
NEW PS – low lifting

City of Ottawa Page -49
WUC- Wastewater Collection System FINAL Master Servicing Plan - Study Report JULY, 2012 RVA 102174
4.3.4 Servicing Options for Strategy #4:
Investigating this strategy further, critical constraints were identified with respect to the initial form presented in section 4.2.4.: conversion of Hazeldean PS into a low lift station and construction of a gravity sewer outlet from the pump station to Lynwood Collector. Investigating the cover depth associated with the construction of this gravity sewer along the corridors identified in section 4.3.1., determined that the construction of this sewer will be almost entirely by tunnelling (depths ranging between 15m and 26m). In this situation, the construction cost for over 10.5km of tunnelling is excessive with respect to the options of the other strategies, and thus other options were ought to be examined.
Maintaining the same concept of Strategy #4, two options, 4A and 4B were developed. Option 4A (Figure 4-10) concept is as follow: Hazeldean PS will not be modified, however the sewage flows will be only pumped to Eagleson Rd. (instead of Glen Cairn Trunk), and from Eagleson Rd. a gravity sewer will be built to Lynwood Collector following the same corridors as previously determined. The difference from the initial concept is that at Eagleson Rd. the gravity will be at a much higher elevation such that only approximately 3.2km out the total 10.5km of the gravity sewer are required to be built by tunnelling, which decreases the cost and the time for implementing this option.
The infrastructure components included in this option are:
1. Construction of North Kanata Trunk – Phase 2 (from March PS to North Kanata Trunk)
2. March PS upgrades (conversion into a low lifting station)
3. Replacement of Tri-Township Collector between Glen Cairn Trunk and North Kanata Trunk;
4. Signature Ridge PS upgrades (overflow / wet well / forcemain);
5. New Kanata West PS (KW PS) including forcemains;
6. Hazeldean PS upgrades (capacity increase / forcemains from the pump station to Eagleson Rd. to discharge into a new gravity sewer; see point 8);
7. Fernbank Trunk sewer to Hazeldean PS;
8. New gravity trunk sewer from Eagleson Rd. to Lynwood Collector (via West Hunt Club Rd., and Greenbank)
Option 4B (Figure 4-11) developed further Option 4A to include sewer flows from Kanata West land development. This option includes the following infrastructure:
1. Construction of North Kanata Trunk – Phase 2 (from March PS to North Kanata Trunk)
2. March PS upgrades (conversion into a low lifting station)
3. Replacement of Tri-Township Collector between Glen Cairn Trunk and North Kanata Trunk;
4. Signature Ridge PS upgrades (overflow / wet well / forcemain);
5. Hazeldean PS modification and upgrades (capacity increase/ forcemains from the pump station to Eagleson Rd. to discharge into a new gravity sewer; see point 8 and deepen the pump station inlet to accommodate flows from Kanata West)
6. Fernbank Trunk sewer to Hazeldean PS;

City of Ottawa Page -50
WUC- Wastewater Collection System FINAL Master Servicing Plan - Study Report JULY, 2012 RVA 102174
7. New gravity trunk sewer from Eagleson Rd. to Lynwood Collector (via West Hunt Club Rd., and Greenbank);
8. New gravity trunk sewer from KW PS location to Hazeldean PS;
Option 4B was intended to divert all flows south of HWY 417 – Stittsville, Kanata West, Kanata South, future Fernbank lands and some of the lands north of HWY 417 that are serviced by Signature Ridge PS to Hazeldean PS and from there to Lynwood Collector at Greenbank Rd. The Signature Ridge PS will be decommissioned and Kanata West PS will not need to be built.
However, there are many constraints and issues with this option. First, it involves a large up front capital in a very short time frame: Kanata West PS needs to be built by 2016, which means the gravity sewer (~10.3km) from Eagleson Rd. to Lynwood Collector and the gravity sewer (~3.1km) from the KW PS location to Hazeldean PS has to be in place by 2016. In addition, Hazeldean PS inlet needs to be modified (deepen) to be able to accommodate flows from Kanata West lands. There is no study done to date for the routes of those two gravity sewers as presented in Figure 4-11. They are crossing different types of lands (private and/or NCC land, MTO, MNR etc.) which will involve approximately 2.5 to 3 years for studies (EA studies, requirements and approval from different federal agencies and owners, preliminary studies, and design) and around 3.5 to 4 years to build them.
Secondly, in this configuration the Hazeldean PS becomes the main pump station in the WUC sanitary sewer system turning the existing trunks and collectors (Glen Cairn Trunk, North Kanata Trunk, and Watts Creek Collector) as well as Acres Rd. PS into components with considerable space capacity which may increase the future operation and maintenance needs in the system. Currently the existing trunks and collectors in the system, excepting Tri-Township Collector have enough capacity to sustain the future development in the WUC up to 2060. Acres Rd. PS with minor upgrades could easily provide capacity for the 2060 growth projections. Thus, there is a significant existing capability of the system that will not be used to its full potential.
In Appendix C sewer calculation with respect to each of the options investigated above are provided as well as a sewer flow table (Table C-1) similar to Table 3-3 (modeling results for the sewer system / pumping stations and trunk sewers) which includes each of the options and the resulting flows in the existing components of the WUC sanitary sewer system that are not modified or abandoned.

City of Ottawa Page -51
WUC- Wastewater Collection System FINAL Master Servicing Plan - Study Report JULY, 2012 RVA 102174
Figure 4-10: Strategy #4 – Option 4A
FERNBANK TRUNK sewer
MARCH PS – conv. to low lifting
10.3km TRUNK sewer ~0.12%
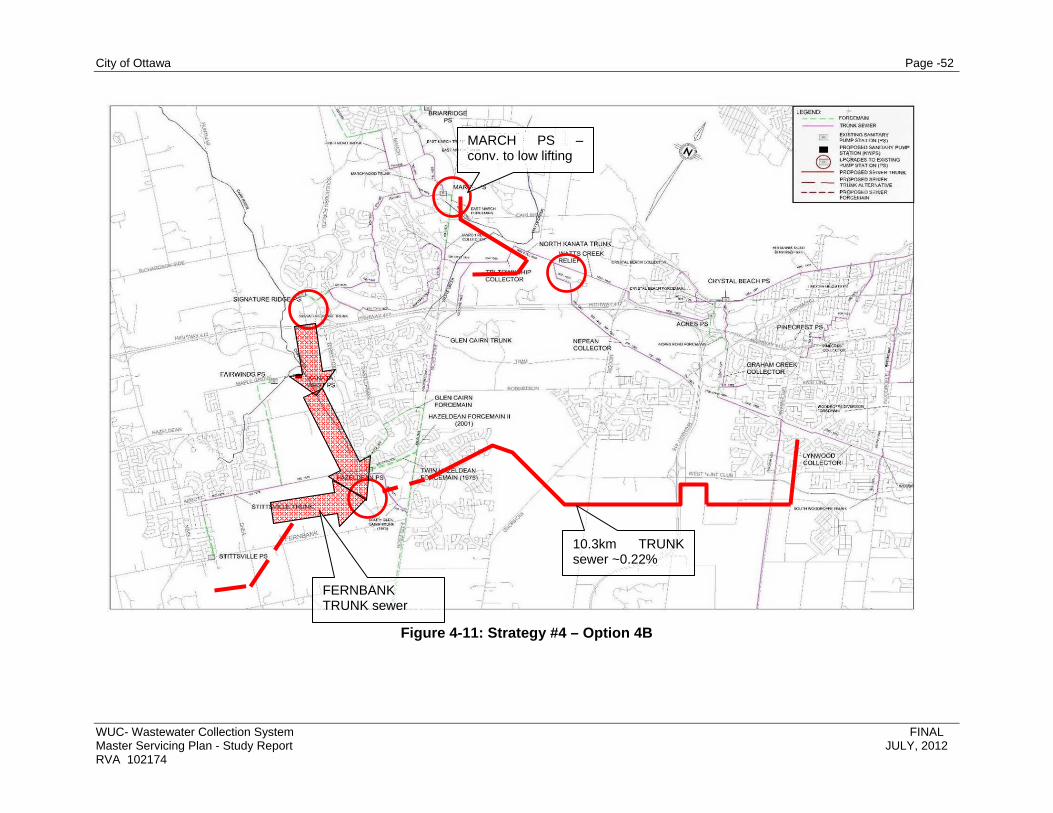
City of Ottawa Page -52
WUC- Wastewater Collection System FINAL Master Servicing Plan - Study Report JULY, 2012 RVA 102174
Figure 4-11: Strategy #4 – Option 4B
FERNBANK TRUNK sewer
MARCH PS – conv. to low lifting
10.3km TRUNK sewer ~0.22%

City of Ottawa Page -53
WUC- Wastewater Collection System FINAL Master Servicing Plan - Study Report JULY, 2012 RVA 102174
4.4 Evaluation and ranking of sanitary sewer servicing options
4.4.1 Evaluation Categories and Criteria
At a functional design / EA level of assessment, the evaluation and ranking of the servicing options considers:
Natural environment counting for 20% of the scope and evaluating with respect to the impact on local terrestrial systems, on local aquatic systems and to the long term impact on ecological processes;
Caring and Healthy Communities counting for 20% of the scope and evaluating with respect to the disruption to community, compatibility with planning policies and to the impacts to archaeological / heritage values;
Technical counting for 30% of the scope and evaluating with respect to the short-term reliability, the long-term reliability and the redundancy requirements;
Economy counting for 30% of the scope and evaluating the servicing options with respect to capital cost and the operation and maintenance costs, the life-cycle cost and the readiness for implementation.
However, in consultation with the City’s project team, it was determined that for the first two categories, scoring at this stage of the study would be too subjective and wouldn’t have decisive or significant impact on the options ranking. For example, all servicing options are using the same corridors in the core of the WUC between Hazeldean PS and North Kanata Trunk: same alignment for North Kanata Trunk – Phase 2, same sewer easement for Tri-Township Collector replacement or new gravity sewer trunk, same corridors for forcemains or gravity sewers from or to Kanata West PS. Therefore, impact on terrestrial and aquatic systems as well as disruption to community will be very close the same for all of the options or not significantly different. Options 4A and 4B due to the sewer route from Eagleson Rd. to Lynwood collector crossing NCC lands which also include some marsh area might score less for impact on aquatic system but might score high for disruption to community. Thus, overall it was determined that Technical and Economy are the categories that will decide on the preferred option for the present study.
4.4.2 Servicing Options Ranking
Technical – Reliability
As mentioned under this category, the evaluations focus on the short-term and long-term reliability. Short term considers the level of risk during construction and commissioning during each stage of implementation of a servicing option and the ability to meet growth needs. Risk over a long-term system considers failure and the ability to mitigate risk through Operation and Maintenance practices and contingency planning.
For Options 1A, 1B and 1C the short-term reliability is considered high since there is a low risk for delays in construction or commissioning the proposed infrastructure. Forcemains for all the pump stations (new and upgrades) will be constructed under standard open-cut method (2.4 to 3m deep), and gravity sewers (Options 1B and 1C) will also be constructed open-cut deeper this time but in field with no delays from traffic disruption, or social impact.
As per the City’s sewer guidelines, all sewage pumping stations require overflow provision to reduce the possibility of basement flooding should a pump station suffer loss of capacity. However, Options 1B and 1C reduce the potential for overflows by providing an inter-connection

City of Ottawa Page -54
WUC- Wastewater Collection System FINAL Master Servicing Plan - Study Report JULY, 2012 RVA 102174
(interceptor sewer) between the Hazeldean PS and the KW PS. Thus, over long-term reliability, Option 1B and 1C would score higher than 1A.
Options 2A, 2B and 4B show low short-term reliability due to the fact that there is a high risk associated to the construction of the proposed infrastructure. Tunnelling is required for the construction of the main proposed infrastructure and construction progress is highly dependent on the ground condition, thus, there might be a high risk of delaying the commissioning of the infrastructure on time for the development requirements. In addition, for all these three options, the time frame for approval is very tight as mentioned in the earlier screening. Option 4A, shows great short-term and long-term reliability since Kanata West PS could be built on time, and the gravity sewer from Eagleson Rd. to Lynwood Collector could be built at a later date. However, a new pump station and approximately 10.5km of gravity sewer need to be built which will have a significant impact on capital costs and life-cycle cost (see table below).
In terms of long-term reliability, Options 2A and 2B will score high since eventually three pump stations are eliminated from the system: Hazeldean PS, Signature Ridge PS and the proposed Kanata West PS. Option 4B could also score high since Signature Ridge PS is to be decommissioned and Kanata West does not need to be built anymore.
Economy - Capital Cost and Life-Cycle Cost Estimates
In the table below, the capital cost estimates for each option presented include 50% for engineering and contingency. However, the values presented in the table do not show what and when the infrastructure components for each option are to be implemented. Details of the cost calculation based on construction method, diameter of pipes and pump station upgrades as well as the year when different components for each option are to be implemented, major upgrades as well as full replacement (i.e. for pump station life cycle) are presented in Appendix D.
Table 4-5: Capital Cost Estimation of Servicing Options*
OPTIONS
1A 1B 1C 2A 2B 4A 4B
Cost Estimates [1,000$]
45,360 39,250 54,680 81,760 73,410 91,120 100,310
Engineering and Contingency (50%) [1000$]
22,680 19,630 27,340 40,880 36,210 45,560 50,150
Total Capital Cost [1,000$]
68,040 58,880 82,020 122,640 108,620 136,680 150,460
* all estimated costs have been rounded up to nearest $10,000.
The life cycle cost analysis is based on the following parameters:
1. Life span for - sewer trunks = 100 years, with upgrades (lining) or replacement at the end;
- forcemain = 75 years, with upgrades (lining) or replacement at the end;
- pumping station = 40 years with major upgrades at 25 years;
2. Operation and Maintenance costs for
- sewer trunks = 0.2% of Capital Cost (CC) – more realistic than 5.0% considered in RMOC Wastewater Master Plan 1997

City of Ottawa Page -55
WUC- Wastewater Collection System FINAL Master Servicing Plan - Study Report JULY, 2012 RVA 102174
- forcemain= 0.2% of CC – more realistic than 5.0% considered in RMOC Wastewater Master Plan, 1997
- pumping station = 2.5% of CC – based on the operation & maintenance cost and electricity cost values received for the last two years for March Rd. PS, Signature Ridge PS and Hazeldean PS (see Table D-2 in Appendix D). This value is slightly smaller than 3.6% used in Stantec’s Kanata West Master Servicing Study 2006
3. Pump Stations major upgrades are based on the Infrastructure Master Plan Update and are considered to be 40% of the pump station full replacement capital cost (see Appendix B for more details)
4. Financial parameters:
- annual average discount interest rate = 5% - similar in Stantec's Kanata West Master Servicing Study 2006
- annual average inflation interest rate = 2% - similar in Stantec’s Kanata West Master Servicing Study 2006
- combined interest inflation factor = 2.94% - similar in Stantec’s Kanata West Master Servicing Study 2006
The results of the life-cycle cost analysis in more detail are also presented in Appendix D (Tables D-3 to D-5) where values for different discount rates are also shown for sensitivity analysis. In the Table below the Net Present Value at year 2012 using a 5% discount interest rate is presented for each option.
Table 4-6: Life-Cycle Cost Analysis of Servicing Options*
OP
TIO
NS
Capital Cost [$1,000]
Net Present Value (disc. rate 5%) at year 2012
Trunk Sewer [$1,000]
Forcemains [$1,000]
Pumping Station [$1,000]
Total Estimate [$1,000]
1A 68,040 22,390 17,850 49,720 89,960
1B 58,880 28,910 13,190 45,100 87,200
1C 82,020 48,700 12,170 39,500 100,370
2A 122,640 110,550 1,950 9,100 121,600
2B 108,620 95,360 1,870 18,490 115,710
4A 136,680 94,290 14,600 38,350 147,240
4B 150,460 127,250 5,040 49,360 181,650
* all estimated costs have been rounded up to nearest $10,000.
Servicing Option Evaluation
For each criterion, the alternative servicing strategy options were rated as having High (3 points), Medium (2 points) and Low (1 point) scores compared to the other strategies. For example, a high preference rating would indicate that the relative merit / impact of one option is superior to others under a particular criterion. The resulting scores were then weighted and summed to produce a total score for each option.

City of Ottawa Page -56
WUC- Wastewater Collection System FINAL Master Servicing Plan - Study Report JULY, 2012 RVA 102174
Table 4-7: Option Evaluation Results
Ref. No.
Weight [%]
CRITERIA OPTIONS
1A 1B 1C 2A 2B 4A 4B
Technical (30%)
T1 8 Short-Term reliability H H H M M H L
T2 14 Long-Term reliability L M M H H M M
T3 8 Meets redundancy requirements
L M H H H M L
Score 46 68 76 82 82 68 44
Economy (30%)
E1 17 Capital Cost and O&M H H M L L L L
E2 8 Life-Cycle cost H H M M M L L
E3 5 Readiness for implementation
H M M L L M L
Score 90 85 60 38 38 35 30
60 Total Score 136 153 136 120 120 103 74
The results of the evaluation indicate that the current servicing strategy that relies on pump stations and forcemains generally ranks higher than the gravity servicing strategies. Overall, Option 1B scored the highest. The main advantages of Servicing Strategy Option 1B compared to the other options are:
This option is ready to be implemented: studies are already approved for most infrastructure needed by 2016, and thus, no significant delays for the developments in the area are anticipated;
Constructing a new interceptor sewer to off-load flows in the Stittsville Trunk sewer and the new Fernbank Trunk sewer from the Hazeldean PS to the Kanata West PS creates a more balanced sewage pumping system with two main stations that provides more control over sewer flows and system reliability, thus, reducing the risk for overflows and basement flooding during pump failure or extreme wet weather events. In addition, compared to Option 1A, it provides opportunity for decommissioning several pumping stations located in the Stittsville community (i.e. John Street PS, Joseph Circle PS, Amberwood PS, Fringewood and Fringewood North PS, etc)
Low capital cost life-cycle costs
As a result, Option 1B, derived from the initial servicing Strategy #1 is considered the preferred solution for the WUC sanitary sewer servicing plan.
4.5 Modeling Scenario 3 results for Option 1B
The following Table 4-8 shows the impact on the infrastructure components of the projected flows from 2031 to 2060 based on modeled results under Scenario 1 and 3. The intent is to

City of Ottawa Page -57
WUC- Wastewater Collection System FINAL Master Servicing Plan - Study Report JULY, 2012 RVA 102174
determine if the changes in flows can be accommodated without requiring substantial changes to the preferred option.
Table 4-8: Option 1B – change from 2031 to 2060 Scenario 1 and Scenario 3
FLOW
(Year) 2010 2031 2060 2031 2060 2031 2060 2031 2060 % L/s % L/s(L/s) (L/s) (L/s) (L/s) (L/s) (L/s) (L/s) (L/s) (L/s) (L/s) (L/s)
Richmond Pump Station 360 151 340 340 407 407 340 340 407 407 0 0 0 0
Stittsville PS 108 39 106 506 91 353 106 506 91 353 377 400 288 262
Hazeldean Pump Station 1225 832 1537 1937 1741 2003 1207 1207 1211 1473 0 0 22 262
Kanata West Pump Station *
760 (to be
upgraded to 1250)
152 593 689 561 678 923 1419 1091 1208 54 496 11 117
Signature Ridge Pump Station 360 54 309 423 256 351 309 423 256 351 37 114 37 95
March Pump Station 490 326 771 941 820 1008 197 236 212 256 20 39 21 44
Acres Road Pump Station 4600 2119 4186 4966 4437 5099 4186 4966 4437 5099 19 780 15 662
Glen Cairn Trunk2815 to 2988
1139 2512 3008 2758 3137 2512 3008 2758 3137 20 496 14 379
Stittsville Trunk519 to 972
358 485 885 572 732 155 155 42 42 0 0 0 0
NEW Fernbank Trunk 383 383 388 388 0 0 0 0
NEW Interceptor Sewer form Stittsville/Fernbank Trunk to
KW PS330 730 530 530
Main Street Sewer307 to 739
138 330 444 342 399 330 444 342 399 35 114 17 57
Penfield Sewer398 to 734
170 360 474 342 437 360 474 342 437 32 114 28 95
March Ridge Trunk (Above March Forcemain)
1223 245 434 548 428 523 434 548 428 523 26 114 22 95
March Ridge Trunk (Below March Forcemain)
1016 571 1205 1489 1248 1531 434 548 428 523 26 114 22 95
Watts Creek Siphon 1014 571 1205 1489 1248 1531 434 718 477 640 65 284 34 163
Tri-Township Collector 1705 3717 4497 4006 4668 2946 3726 3235 3777 26 780 17 542
March Wood Trunk 1100 230 574 705 608 752 574 705 608 752 23 131 24 144
East March Trunk 550 96 172 211 187 231 172 211 187 231 23 39 24 44
North Kanata Trunk - Phase II 771 941 820 1008 22 170 23 188
North Kanata Trunk-Phase 14047 to 4640
1705 3717 4497 4006 4668 3717 4497 4006 4668 21 780 17 662
Nepean Collector590
190 197 197 234 234 197 197 234 234 0 0 0 0
Watt's Creek Trunk5418 to
66401891 3914 4694 4240 4902 3914 4694 4240 4902 20 780 16 662
CURRENT SEWER CONFIGURATION
PUMPING STATION OR TRUNK SEWER F
IRM
CA
PA
CIT
Y
EX
IST
ING
C
AP
AC
ITY STRATEGY 1B Change from 2031 to 2060
designed capacity 1290L/s
designed capacity: 800L/s
Scenario 3Scenario 1Scenario 3Scenario 1
proposed replacement 1650mm diam., 4700L/s capacity
Scenario 1 Scenario 3
designed capacity: 670L/s
The coloured cells in the table identify the component of the current sewer system that is under capacity by the time of the projected growth in 2031 or 2060.
* for KW PS the current Certificate of Approval is 760L/s capacity, however, the pumping station is proposed to be upgraded to 1250L/s as per the Stantec’s Technical Memorandum (May 2012)
Results show some impacts to pump stations occurring at the following locations:

City of Ottawa Page -58
WUC- Wastewater Collection System FINAL Master Servicing Plan - Study Report JULY, 2012 RVA 102174
Richmond PS as anticipated, needs capacity increase under Scenario 3 by 2027;
Stittsville PS, as identified previously needs capacity increase by 2031/2032 (regardless of the hydraulic scenario considered);
Hazeldean PS remains at the current capacity (1225L/s) until 2031 and further to 2060 depending on how much flows are to be diverted through the new interceptor sewer to KW PS;
Kanata West PS needs capacity upgrade for pumps and forcemains under both scenarios by 2022 / 2023 to function for the 2031 projected flow; depending on the upgraded capacity; a second increase might be required for the 2060 projected flow.
Signature Ridge PS as identified previously, only under Scenario 1 would need capacity increase by 2043
Acres Rd. PS projected flows slightly exceeds the station’s approved firm capacity (4600L/s) when compared to the 2060 projections flows under both scenarios. It is recommended that flows to the station be monitored and assess the need for further changes.
With respect to the trunk sewers, the Glen Cairn Trunk and the North Kanata Trunk, both show minor needs for increased capacity for the 2060 flow projections. The March Ridge Trunk will be able to meet flows to 2060 without an increase in capacity, based on the March Pump Station modifications to a low loft and the installation of the North Kanata Trunk - Phase 2. Capacity increase will be required in the upstream section of the Penfield and Main Street Sewer before 2060.
4.6 Enhancement Opportunities for Option 1B
Option 1B provides the WUC with the preferred sanitary sewer servicing strategy. A number of additional opportunities exist that would allow enhancement to the system in order to provide future flexibility for sewer flows and management of the system. These include:
Lowering the Tri-Township Collector to allow for the removal of the Watts Creek Siphon and for future gravity sewer to tie-in if necessary.
Move KW PS to Palladium Drive allowing lower overflow.
Upgrades to Acres Road PS (replacement of existing pumps and additional new pumps for capacity increase) and rehabilitation of the overflow chamber (new sluice gate, electronic actuator, level monitoring and access gate control from ROPEC)
The following provides additional discussion on each enhancement:
4.6.1 Lower Tri-Township Collector
As identified from the beginning (section 2.2.1), the Tri-Township Collector is in poor condition and needs to be replaced. However, the replacement could be done by lowering the invert of the new collector starting at the junction of Glen Cairn Trunk / March Ridge Trunk / Tri-Township Collector in order to allow in the future removal of the Watt’s Creek siphon from the March Ridge Trunk.
In addition, lowering the Tri-Township Collector replacement could provide opportunity for future gravity sewer to tie-in. For example, if Glen Cairn Trunk sewer would need to be upsized in the future, a deeper trunks sewer could be installed, thus, providing opportunity for other
City of Ottawa Page -59
WUC- Wastewater Collection System FINAL Master Servicing Plan - Study Report JULY, 2012 RVA 102174
gravitational sewers upstream to tie-in, i.e. gravitational sewer from KW PS. Further detailed investigation during the design of the Tri-Township Collector replacement would be required to better refine the elevation of the new invert.
The cost to lower the sewer to allow for future gravity sewer to tie-in was estimated to $1,000,000 and has been carried in the cost estimates shown in this report.
4.6.2 Move KWPS to Palladium Drive
Moving the KWPS to Palladium Drive from the proposed Maple Grove, downstream along the Carp River may allow for a lower overflow elevation. As the Carp River is a very low sloped river, an assessment would be required to determine how much the proposed overflow could be lowered. The distance between the two roads is about 500m and may cost more due to deeper trunk sewer installation than the shallower twin forcemains. This change could be assessed in further detail at the design stage to determine if the cost and flexibility outways the reduced risk due to a lower overflow.
4.6.3 Acres Road Pumping Station
The Acres Road PS current capacity is 2700 l/s based on 4 out of 5 pumps in operation. The station has the capacity to add three more pumps for a total of 8 pumps. The stations configuration has two 1050mm diameter forecemains and backup power is provided by two generators (air cooled 1300kw).
In assessing the existing pumps and backup power, each generator can only run three pumps which will not provide the future required capacity. In order to run four pumps on each generator, keeping the same type of pumps, the generators would have to be upsized and therefore changed to a water cooled system. It is uncertain if the area water system has the capacity to meet the cooling needs of the generator when in operation, this would need to be confirmed.
Another option to consider may be to change out the pumps. The current pumps have been in operation for approximately 22 years and are nearing the end of their normal life expectancy. Also, the stations existing capacity requires increasing and thus the need for more pumps or more efficient pumps now available due to technology changes over the last two decades. An example of this would be to install 3-CT3531ITT pumps in the dry pit by replacing existing pumps on each forcemain. Each set of three pumps would only require 680KW of back up power so a fourth pump could be added to each existing generator. Thus, as the pumps require changing in the near future, the new pumps would negate the need to change the backup generators. It is also anticipated that the future pump efficiencies should allow the station to pump more than the 4600 l/s existing capacity as shown on the certificate of approval.
In assessing the forcemains, 5200 l/s can be pumped through the two forcemains keeping the velocity below 3 m/sec (max. as per city design guidelines).
The estimated capital costs to change each of the pumps out is:
$300,000 for materials
$50,000 for installation
For eight pumps, total capital cost is estimated at $2.4 million. If a 50% contingency and engineering is added ($1.2 million) the cost is $3.6 million.
Modifications are also required on the Watts Creek Sewer to allow for flows greater than 2000L/s to be recorded. This may involve raising the monitors, provision of new monitors or

City of Ottawa Page -60
WUC- Wastewater Collection System FINAL Master Servicing Plan - Study Report JULY, 2012 RVA 102174
type or system modifications. The extent of necessary modifications will require further investigations. It must also be noted that the Watts Creek overflow chamber may require upgrades to the operating gate if more reliance is put on this overflow. It is also noted that the capacity of this overflow will not have the capacity of a fully flowing Watts Creek Sewer. Further investigation as to the impacts of this limitation on potential systems flooding and impacts is recommended. However, rehabilitation of the existing sluice gate including the operation system, access control and monitoring levels is estimated to approximately $250,000.
4.7 Cost and Phasing Schedule
The table below lists the key components of the preferred wastewater servicing strategy, the cost of the key components (in 2012 dollars) and the anticipated schedule for the commissioning of the key components. The schedule has been estimated based on the modeling results. It is recommended that flow monitoring be undertaken to confirm actual flows and to make the necessary adjustments to the noted timelines for commissioning the key components of the servicing strategy.
Table 4-9: Cost and Phasing Schedule for Option 1B
Item Description Estimated Cost Year to be
implemented
North Kanata Trunk- Phase 2 (1200mm @ 0.1%) $5,800,000 2014
TTC Replacement (1650mm @ 0.25%) $5,190,000(1) 2015- 2019 (2)
March Rd. PS (convert into low lift station) $640,000 2014
Signature Ridge PS (upgrades) $1,650,000 2017
Signature Ridge PS forcemain (800m) $1,200,000 2017
Kanata West PS (new PS) $7,590,000(3) 2016
Forcemains – KW PS to Glen Cairn Trunk (3800m) $8,360,000(3) 2016
New Interceptor Sewer from Stittsville / new Fernbank Trunk sewers to KW PS ((3040m, 900mm / 1050mm @ 0.18% - 0.2%)
$4,920,000 (4) (6) 2021
New Fernbank Gravity Sewer $3,900,000 (5)(6) 2012 / 2013(6)
Sub-Total $39,250,000
50% Emergency/ Contingency $19,630,000
Total $58,880,000(6) Acres Rd. PS upgrades (including 50% contingency and engineering)
$3,600,000 2016
Watt’s Creek overflow chamber upgrades (including 50% contingency and engineering)
$380,000
Grand Total $62,860,000 (1) Includes $1,000,000 for lowering to allow future opportunities. (2) Timing determined by flow monitoring but based on NKT – Phase 2 in place by 2014. (3) Includes increase in cost to the KW PS and forcemains due to the necessary increase in capacity (page 41 and Stantec’s Technical Memorandum, May 2012)

City of Ottawa Page -61
WUC- Wastewater Collection System FINAL Master Servicing Plan - Study Report JULY, 2012 RVA 102174
(4) Cost estimates were produced based on Stantec’s WUC Sanitary Sewer Servicing. Technical Memorandum – May 2012. (5) Dependent on development in the Fernbank area. (6) Some costs shown do not account for developer proposed infrastructure installation. Once the plans are approved, some off setting of costs would occur, thus, reducing the capital cost shown. Note: for Option 1B, Hazeldean PS is anticipated to require increasing capacity as well as the third forcemain beyond 2060; thus, the associated costs were not considered part of the capital cost but they were included in the life-cycle cost analysis – see Appendix D

City of Ottawa Page -62
WUC- Wastewater Collection System FINAL Master Servicing Plan - Study Report JULY, 2012 RVA 102174
5 CONCLUSION AND RECOMMENDATIONS
The existing wastewater collection system servicing the West Urban Community consists of a complex system of pumps and gravity sewers converging on a single pump station at Acres Rd. With respect to growth considerations, separate master servicing studies have been conducted for communities within the WUC, and although the proposed works are feasible they have not been evaluated as being part of a system and there may be opportunities for improvement. Thus, it is necessary to confirm that either the current strategy, that remains reliant on new or existing pump stations, is maintained or is there a better option that could possibly reduce the vulnerability of pump stations during wet weather flow conditions, the operation costs, and improve the system reliability.
RV Anderson Associates Limited (RVA) was retained to undertake this assignment to evaluate developed servicing strategies or to develop new strategies if necessary to service the planned development in the WUC up to the year 2031 and as far as 2060.
Three servicing strategies were identified by the City for investigation:
1. Servicing Strategy #1: Upgrades proposed in the Infrastructure Master Plan Update-Wastewater Collection System Assessment (Stantec, May 2009), considered as the base line.
2. Servicing Strategy #2: A gravity sewer from the location of the proposed Kanata West Pumping Station to the North Kanata Trunk Sewer with a gravity sewer extending from the Hazeldean PS, which is to be abandoned, to the location of the proposed Kanata West Pumping Station.
3. Servicing Strategy #3: A gravity sewer from the Hazeldean Pumping Station (which would be abandoned) to the Lynwood Collector.
This study provided the following:
1. Identify constraints to growth in the existing sanitary sewer system.
2. Assess the hydraulics of the system; a hydraulic modeling application was developed and used with respect to the growth projection for 2031 and 2060. Design criteria were determined based on the current City’s design guidelines, existing monitored flows and records of extreme wet weather events in the area.
3. Develop new strategies and evaluation and ranking process for the recommendation of the preferred sewer servicing option.
Existing Constraints:
with respect to the main sewer trunks in the system:
o Tri-Township Collector needs replacement due to its current reduce capacity;
o Watts Creek sewer siphon appears close to reach its full current capacity; however, if planned North Kanata Trunk – Phase 2 (a new gravity sewer from March Rd. PS to the upstream of North Kanata Trunk- Phase 1) is implemented, significant capacity would be freed up from the Watts Creek sewer siphon;

City of Ottawa Page -63
WUC- Wastewater Collection System FINAL Master Servicing Plan - Study Report JULY, 2012 RVA 102174
with respect to the main pumping stations:
o Acres Rd. PS needs pump upgrades (replacement by more energy efficient pumps) and capacity upgrades (three extra pumps);
o March Rd. PS to be converted into low lifting station once the North Kanata Trunk – Phase 2 is implemented;
o Signature Ridge PS needs upgrades – wet well, pumps and forcemains, and
o Hazeldean PS needs upgrades – pump capacity and a third forcemain;
Hydraulic Modeling scenario
The hydraulic model was run based on the proposed servicing Strategy #1 considering Kanata West PS built and discharging into Glen Cairn sewer Trunk. Different combinations of parameters including residential rates, ICI rates, extraneous I/I flows values for existing and future growth as well as design rates from other municipalities were investigated and three scenarios were formulated. Scenarios 1 and 3 produced comparable flows more conservative than scenario 2 which was discarded from further consideration.
Ultimately, Scenario 1 was selected as the most appropriate to carry through the investigation of the servicing strategies for the 2031/2060 conditions. The design criteria used for the Scenario 1 modeling application is presented in the table below.
Table 5-1: Flow generation Scenario 1
Year Residential Rate ICI Rate I/I Rate
Existing (L/c/d)
Future (L/c/d)
Existing (L/ha/d)
Future (L/ha/d)
Existing (L/ha/s)
Future (L/ha/s)
Scenario 1 2031 200 350 20,000 50,000 Jan 2008 Design (0.28)
2060 200 350 20,000 50,000 Jan 2008 Design (0.28)
Based on the modeling results, projected flows for each of the main components of the sewer system between Hazeldean PS and Acres Rd. PS as well as for other components in the system were pointed out at different key locations throughout the system. As a result, the existing constraints previously identified were reviewed and a time frame for upgrades was formulated:
- for sewer trunks: Tri-Township Collector to be replaced by 2015, Watts Creek sewer siphon to be upgraded by 2027; however, the construction of North Kanata Trunk – Phase 2 is estimated to be completed by 2014 including modifications at March PS (convert into a low lifting PS), and thus the capacity constraint in the sewer siphon will be eliminated and the time for replacement of the Tri-Township Collector pushed to 2017.
- for pumping stations: upgrades to Stittsville PS by 2031/2032, upgrades to Hazeldean PS by 2021 (current firm capacity at 1225L/s ), upgrades to Signature Ridge PS by 2043 provided that 360L/s firm capacity is implemented by 2012, conversion of March PS by 2014 and upgrades to Acres PS by 2016.
Investigation and detailed analysis of the servicing strategies

City of Ottawa Page -64
WUC- Wastewater Collection System FINAL Master Servicing Plan - Study Report JULY, 2012 RVA 102174
Initial screening of the proposed servicing strategies identified Strategies #1 and #2 feasible, and Strategy #3 not feasible due to insufficient vertical drop from the Hazeldean PS inlet elevation to the invert of the connection point at Lynwood Collector (which was considered at upstream end, or at Greenbank Rd., or at Woodroffe Ave.). However, a new Strategy #4 was formulated instead: Hazeldean PS to pump sewer flows to Eagleson Rd. from where a new gravity sewer will convey the flows to the Lynwood Collector.
The next screening was conducted to determine possible sewer corridors available for the sewer trunks and forcemains associated with the servicing strategies based on location, construction, risks and social/environmental impacts. Several corridors were identified common for all the strategies including infrastructure works in the core of the WUC.
Once the preferred corridors were identified, seven specific options were formulated. The evaluation and ranking of the servicing options were conducted as per categories and criteria previously applied to different City servicing master plans. The evaluation focused mainly on the short-term and long-term reliability, and on the capital costs and the life-cycle cost analysis of the options. Overall, Option 1B scored the highest, and thus, considered the preferred solution for the WUC sanitary sewer servicing plan. This option comprises the following infrastructure components including the time line for their completion:
1. Construction of 1200 mm dia. 2100 m long North Kanata Trunk – Phase 2 from March PS to the end of Phase 1 of North Kanata Trunk including connection of Marchwood trunk to allow gravity flow and bypassing March PS. To be completed by 2014.
2. March PS upgrades (conversion into a low lifting station) including abandonment of the existing forcemain along March Road to be completed by 2014.
3. Replacement and lowering (to allow for future elimination of Watts Creek sewer siphon) of 1650 mm dia. 1230 m long Tri-Township Collector between Glen Cairn Trunk and the end of Phase 1 of North Kanata Trunk to be completed between 2014 – 2017.
4. Signature Ridge PS upgrades Phase 1 (overflow/wet well) to be completed by 2013 and Phase 2 (twining of forcemain) by 2017 to be coordinated with the proposed Campeau Drive expansion.
5. New Kanata West PS (KW PS) including forcemains by 2016
6. Fernbank Trunk sewer to Hazeldean PS to be completed by 2013.
7. New gravity trunk sewer – Interceptor Sewer, and Interceptor Chamber – from the Stittsville / new Fernbank Trunk sewers to KW PS (approximately 3040m long) by 2021
The advantages provided by this option compared to the other options are:
It is ready to be implemented, thus, no significant delays for the developments in the WUC are anticipated;
By building the new interceptor sewer between Stittsville and new Fernbank Trunk sewers and Kanata West PS will allow to divert sewer flows from Hazeldean PS and will create a better control over the operation of the sewer flows and provide robustness to the system and reliability during pump failure occurrences and extreme wet weather events.
There is no need for capacity upgrade at Hazeldean PS or for the construction of a third forcemain up until 2060;
Low capital cost and life-cycle cost.
City of Ottawa Page -65
WUC- Wastewater Collection System FINAL Master Servicing Plan - Study Report JULY, 2012 RVA 102174
The estimated costs for Option 1B (which includes a 50% mark-up to contingency and engineering) is $58,880,000.00 and including upgrades to the Acres Rd. PS and to the Watt’s Creek overflow chamber the estimated cost is $62,860,000.00.
During this review of the WUC wastewater system, a range of issues with the Acres Road PS were uncovered that warrant a more detailed assessment to identify the full scope of operational improvements and upgrades, in addition to capacity upgrades to service future growth. The detailed assessment of the Acres Road PS would need to investigate the following:
Modifications to the flume and overflow structure located upstream of the Acres Road PS along the Watts Creek Relief Sewer;
Modifications to the SCADA system to enable reliable monitoring of inflows
Recommendations concerning the timing of changing over the existing pumps; the addition of pumps required for growth; and any upgrades required in the emergency back-up power generators.
Moreover, additional issues have been identified that warrant consideration when the City proceeds with the imminent design assignments for the Kanata West PS and Fernbank Trunk Sewer. The preferred location and configuration of the Kanata West PS may warrant adjustment due to a number of issues related to the future widening of Maple Grove Road in the vicinity of the PS. The conceptual designs of the Fernbank Trunk Sewer and associated chambers at the inlet to the Hazeldean PS that had been developed in the Fernbank MSS and the Glen Cairn Flood Investigation should be coordinated and adjusted to be consistent with recommendations of this study.

APPENDIX A WUC Wastewater Collection System – Previous Relevant Studies

City of Ottawa Page 1
WUC- Wastewater Collection System Appendix A Master Servicing Plan – Study Report May 2012 RVA 102174
A. Previous Relevant Studies
1.A.1 Village of Richmond Water and Sanitary Master Servicing Study and Class Environmental Assessment Phases 1, 2, 3 & 4 (draft dated May 2010)
Description
This Master Servicing Study (MSS) was prepared by Stantec as part of the Class Environmental Assessment for the water and sanitary servicing for the village of Richmond, located within the City of Ottawa. The purpose of the MSS was to provide recommendations for the long term servicing requirements for existing and future potential development within the entire village boundary. A Schedule “C” Class EA was conducted for both the water and sanitary servicing components. During Phase 1 & 2 of the Class EA process, an evaluation of several alternative servicing solutions was undertaken for water and sanitary servicing. During phase 3 of the EA process, an evaluation of several design concepts alternative for the preferred solutions was carried out for water and sanitary servicing. The summaries of the preferred alternatives for each phase are presented in this memorandum.
Phase 2: Wastewater Servicing
Preferred Sanitary Servicing Solution
The recommended solution for servicing the entire village is to expand the existing collection system and continue to pump the wastewater to the City’s central wastewater treatment facility (ROPEC). This solution includes options A-D (Figures 5-10 to 5-13 in Stantec’s draft report, May 2010) as briefly described below.
Connection to Central Collection Systems – Existing, infill and future growth
Option A – Upgrade and expand Richmond PS, twin existing 500mm diam. forcemain with a 900mm diam. forcemain.
Option B – Upgrade and expand Richmond PS, twin existing 500mm diam. forcemain with a 500mm diam. forcemain and construct a new booster station on the existing 500mm diam. forcemain.
Option C – Upgrade and expand Richmond PS, abandon existing 500mm forcemain and construct two new 600mm diam. forcemains.
Option D – Abandon the existing Richmond PS facility and construct a new PS, biofilter and two new 600 mm F/M
Phase 3: Wastewater Servicing Design Concept
Preferred Sanitary Servicing Solution Design Concept

City of Ottawa Page 2
WUC- Wastewater Collection System Appendix A Master Servicing Plan – Study Report May 2012 RVA 102174
Wastewater servicing for the village of Richmond will be provided by the existing Richmond Pump Station which will be upgraded to accommodate all planned development within the Village. The preferred solution design concept consists of the following:
Upgrade/ expand the existing Richmond pump station;
Retain the existing 500mm diam. forcemain, but replace the segment that has broken in the past for increased reliability; and,
Construct a second 600mm diam. forcemain.
The costs of the upgrades to the gravity collection system and the pump station are estimated to be $23 M.
1.A.2 Village of Carp Class Environmental Assessment for Water and Wastewater Infrastructure Upgrade / Expansion (dated May 2009)
Description
The purpose of this study was to select the preferred water and sanitary servicing upgrades / expansions required to support the projected growth within the Village of Crap as identified in the 2004 Community Development Plan. The study also includes improvements required to provide water service to the Carp Airport development. The project is being undertaken following Schedule B of the Municipal Class Environmental Assessment Report.
Land Use
The existing village population is approximately 1600 people. It is projected that the full build-out of the village will occur by 2033 and the population will grow to 3,574 people and a total of 6.42ha of ICI development will exist in the village (excluding the Carp airport development). The Approved Draft Plan of Subdivision for the Carp Airport lands includes 329 dwelling units with a corresponding population of 1,119 people and 18.6ha of business park commercial area.
Sanitary Servicing
The projected growth in the village according to the Community Development Plan (CDP) will result in an increase in sanitary flows in the collection and pumping systems. The current capacity of these systems are sufficient to handle a portion of the projected increased flows.
The preferred solution to the Carp wastewater system includes emergency overflows at both sewage pumping stations, twinning existing forcemains, upgrading existing pumps and undersized sewers including a section of Hines Road trunk sewer in Kanata.
The following table (Table 3-7 of this study report) summarizes the preferred wastewater infrastructure upgrades / expansions to accommodate the full development expected in the Village:

City of Ottawa Page 3
WUC- Wastewater Collection System Appendix A Master Servicing Plan – Study Report May 2012 RVA 102174
EA Recommendation for Wastewater System
Infrastructure Upgrade / Expansion
Action Required When Required 2007 Capital Cost
Emergency Sanitary Pumping Station
Overflows
Introduction of emergency overflows
Immediate $120,000
Donald B. Munro Pumping Station Pump Upgrade
Upgrade Existing Pumps
Flow = 8.5 L/s
Population = 2550
Year = 2023
$79,000
Donald B. Munro Second Forcemain
Add Second Forcemain
Year = 2023 (With PS Upgrade)
$237,000
Carp Pumping Station Second Forcemain
(4Km)
Add Second Forcemain
Year = 2019 (With PS upgrade)
$2,528,000
Carp Pumping Station Pump Upgrade
Upgrade Existing Pumps
Flow = 57.7 L/s, Population = 2625,
Year 2019
$158,000
Sanitary Collection System Upgrades & Hines Road Trunk
Replace Undersized Pipes
Coordinated with Road Maintenance and / or
surcharging complaints
$2,079,000
1.A.3 Infrastructure Master Plan Update – Wastewater Collection System Assessment (Dated May 05, 2009)
Description
The purpose of this study is to provide an assessment of the upgrade requirements on the trunk wastewater collection system to service the projected build-out development levels. The approved urban area boundaries were defined as the City’s official plan throughout this report. In the first phase of the work the following components were documented:
1. Model Development and Calibration
2. Evaluation of Existing and Build-Out System Constraints
3. Infrastructure Upgrade Requirements for Existing and Build-Out Conditions
A steady state sanitary hydraulic model was setup, and developed using existing and future sanitary infrastructure and sanitary catchments which were provided by the City and further expanded upon by Stantec.
Infrastructure Expansion Needs

City of Ottawa Page 4
WUC- Wastewater Collection System Appendix A Master Servicing Plan – Study Report May 2012 RVA 102174
Sewer along Klondike & March Valley Drive (4.7km-900mm dia.)
Sewer along Terry Fox Drive to SPRS (1.4km-375mm dia.)
Sewer along Campeau drive to SPRS (2.5km-600mm dia.)
Upgrade SPRS and forcemains (New PS Capacity-554 L/s)
Sewer along Maple Grove Dr. to KWPS (4.2km-675mm dia.)
Upgrade Hazeldean PS and forcemains (New PS capacity-1550L/s)
Upgrade TTC u/s of the connection to the NKT (1.2km-1350mm dia.)
Upgrade NKT d/s of the connection to the TTC (0.9km-1950mm dia.)
Upgrade Acres PS and forcemains (New PS capacity-5200 L/s)
Upgrade the Lynwood Collector d/s of the Acres forcemain connection (1km-2100mm dia.)
Conclusion
Existing Conditions
Under existing conditions the sanitary trunk sewer system outside of the greenbelt is generally adequate with sufficient capacity available. However, the following sections of the sewer were identified as undersized:
Tri-Township Collector – From the junction of the March Ridge Trunk and Glen Cairn Trunk to the future connection of North Kanata Trunk
Cumberland Collector – From Wilson Avenue to the junction with the Orleans-Cumberland Collector
The status of the sanitary pumping stations was analyzed as well. Under existing conditions, the following two stations were found to be undersized:
Richmond Pumping Station
Hemlock Pumping Station
Future Growth
Two modeling scenarios were considered in analyzing the future build-out level growth within the current urban boundary:
Existing and Future Development under Existing Monitored Parameters
Future Development under Design Parameters with Existing Development using Monitored Parameters
In addition to the constraints identified under existing conditions, the following section were also identified as constraints warranting further analysis:
Tri-Township Collector (Upstream of the North Kanata Trunk Junction)
Conroy Road Collector
Green creek Collector (South)
Development Scenarios

City of Ottawa Page 5
WUC- Wastewater Collection System Appendix A Master Servicing Plan – Study Report May 2012 RVA 102174
Development Scenarios for both intensification and expansion type growth were analyzed up until 2061:
Scenario 1 – Intensification within the Urban Boundary
This may not be the growth strategy to pursue.
Scenario 2 & 3 – Expansion Outside of the Urban Boundary
In short-term, the expansion beyond the urban boundary would be accommodated.
In long-term, major upgrades to the existing collection system and construction of a new east-west trunk in the south-end of the City and a new trunk sewer in the east end of the City would be required.
Either a second treatment plant may be necessary or growth would be restricted.
1.A.4 Signature Ridge Pump Station Feasibility Study Report (dated October 2006)
Description
This report detailed the feasibility analysis for increasing the capacity of the Signature Ridge Pumping Station (SRPS) based on projected development demands in the community. Eight (8) alternatives were identified and assessed according to a standard evaluation criterion under four general topics: the natural environment, the caring and healthy community, technical considerations and the economy.
Preferred alternative
To provide for the predicted flows from the development area, the existing station will require expansion beyond its current capacity of 140L/s up to 300L/s. The following components form part of the preferred option to meet the demands predicted based on future development needs:
Provide a second wet well and pumps;
Expand remote control building;
Provide a second force main;
Reconfigure sewers outside of wet well;
Modify surface portion of wet well or remove.
Also, the following downstream infrastructure upgrades are required:
Rehabilitate 1300m of Tri-Township Collector;
The second phase of the proposed north Kanata and conversion of the March Pump Station to a low lift station; and
120m of Penfield sewer providing additional capacity.
The estimated total cost of this alternative is $16,660,000.

City of Ottawa Page 6
WUC- Wastewater Collection System Appendix A Master Servicing Plan – Study Report May 2012 RVA 102174
1.A.5 Kanata West Master Servicing Study, Volume 1 of 2 (date June 16, 2006)
Description
The Kanata West Master Servicing Study serves as an update to the 2002 Concept Plan prepared by FoTenn Consulting. The Objective of this study is to provide a macro level servicing plan for the KWCP (Kanata West Concept Plan), identifying an internal servicing scheme which takes into account changes in land uses and development densities.
Sanitary Servicing Study Recommendations
The preferred wastewater servicing plan for the Kanata West area provides a flexible cost effective servicing scheme allowing for phased construction of the new wastewater infrastructure. This is achieved by making use of residual capacity and maximizing the potential existing infrastructure. The ultimate servicing scenario increases the efficiency of the City’s overall wastewater system by minimizing the number of new pumping stations and facilitating the ultimate decommissioning of up to eight existing public and private pumping stations and one siphon. The major features of this plan (illustrated on Drawing S-1 of the Kanata West Master Servicing Study Report) are the following:
An upgraded Signature Ridge Pumping Station (SRPS) to service all the KWCP lands north of the Queensway, the existing urban area north of the Queensway currently proposed to drain to the SRPS, and the Broughton/Richardson Interstitial lands.
A single new pumping station and forcemain located south of Maple Grove Road and west of the Carp River.
The Signature Ridge Pumping Station is currently not equipped with catastrophic failure in the form a gravity overflow. A hydraulic analysis of the proposed sewer system demonstrated that catastrophic protection can be provided by gravity.
The new pumping station ultimately services all the KWCP south of Highway 417, the lands south of the 417 originally tributary to the SRPS, and the lands in the Village of Stittsville, along Hazeldean Road which are currently unserviceable by gravity to the Stittsville Sanitary Sewer System. This new PS is also designed to accommodate the decommissioning of up to eight small public and private pumping stations along Hazeldean Road without deepening the Kanata West system (refer to Figure 4.2-1, 4.2-3 and 4.2-4. in Appendix 4.3 of this report for more details).
1.A.6 North Kanata Sanitary Sewage Infrastructure Upgrade Study, Functional Design Report (Dated August 2001)
Description
The main trunk wastewater collection system in North Kanata had no longer capacity to accommodate future growth projected for the community. Furthermore, much of the infrastructure has been subject to corrosion or is otherwise in need of repair or replacement. The main objectives of this study were as follows:
Review the alternatives for upgrading the wastewater collection system for the North Kanata area in consideration of updated growth projections and current system conditions;

City of Ottawa Page 7
WUC- Wastewater Collection System Appendix A Master Servicing Plan – Study Report May 2012 RVA 102174
Revise the Master Plan recommendations as required;
Prepare a preliminary odor and corrosion control plan;
Meet the Phase 1 and 2 requirements of the provincial Class Environmental Assessment process for municipal projects;
Address preliminary Federal Environmental Assessment requirements; and
Develop the preferred solution to meet the needs of the study area conveying flows to 2021 based on current estimates.
Preferred Solution
The following lists the main components required to meet the service needs in the Study area. The Study concluded that the required infrastructure should be designed to convey build-out flows.
Construct an 1800mm dia. sewer 1000m long from tr01000 to wa03000 to provide the capacity to meet the projected flows. Connect existing Tri-Township Collector to the NKT at tr01000 and abandon the downstream section of the Tri-Township Collector. (this work has been completed)
Construct the first 200m of 1200mm dia. NKT on Legget Drive. This is required to accommodate the 2001 upgrade of Legget Drive. The infrastructure connecting the Marchwood Trunk, forcemain and overflow must be constructed at the same time. (this work has been completed)
Construct the NKT from Legget Drive to tr01000 which crosses under Carling Avenue to coincide with the upgrade of the Kizell Drain culvert, to meet projected flows at the March Pumping Station. At the same time convert the station to a low lift and finalize connections to the NKT. The March Forcemain and March Road Trunk would then be abandoned. Along the new NKT a gravel access road would be constructed.
The Odor and Corrosion Plan is a combination of O&M modifications and monitoring of the sewers in the WUC. As the effect of the Glen Cairn Biofilter is still under investigation, it must be noted that this plan is preliminary in nature and revaluated as data continues to be collected. As such, the plan recommends further monitoring at strategic locations in the WUC, completion of a system wide OCC plan, continued swabbing of forcemains, modify pumping rates to flush forcemains, chemical addition at the Carp Pumping Station, and the installation of a jumper at the March Ridge Siphon.
The Tri-Township Collector (tr01000 to tr02200) will require rehabilitation (relining).
In addition to these sewers, a number of maintenance items are required at the March Pumping Station and Watts Creek Siphon due to deterioration.
1.A.7 Master Sanitary Servicing Plan - Kanata Lakes, Broughton & Interstitial Lands
Description
Stantec was retained to undertake a high level review of the suggested master sanitary servicing plan for the Broughton and Interstitial Lands. Observations were also made on the

City of Ottawa Page 8
WUC- Wastewater Collection System Appendix A Master Servicing Plan – Study Report May 2012 RVA 102174
impact of the development of these lands on downstream infrastructure including the Signature Ridge Pumping Station (SRPS), the Kanata North Lands and Kanata Lakes Sewer, as well as the Main Street and Penfield Sewer within the North Kanata Trunk Sewer system.
Conclusion
Drainage Area Splits
Due to topography of the area, servicing the entire area with a unique outlet towards the Kanata Lakes development area is not possible. A portion of the sanitary servicing area must be directed towards the Signature Ridge Pumping Station.
Signature Ridge Pumping Station
▪ Upgrades to the SRPS beyond 300 L/s may not be necessary;
▪ On-going monitoring of flows and assessment of actual flow conditions should be an integral component of a staged upgrading plan for the SRPS
▪ The use of a second forcemain as a means of providing extra capacity should be evaluated.
Main Street/Penfield Drive Sewer
Isolated capacity constraints were identified in the Penfield Drive Sewer under future development conditions, however following further assessment it was found that these constraints do not result in the generation of an elevated hydraulic grade line that would lead to basement flooding concerns.
Kanata Lakes Trunk
Results of the hydraulic modeling of the system show that allocation of 140 L/s of the Interstitial Lands slated flows from the SRPS to the Kanata Lakes Sewer do not result in surcharging of this trunk sewer.
Overall North Kanata Servicing
Downstream capacity constraints were found to be consistent with the findings of previous studies under full build-out conditions and no additional areas are determined to be affected.
Local Servicing
A preliminary review of the sewer profiles and existing topographies suggested that the local sewers within the study area have sufficient capacity to convey the peak design flows.
The HGL in the sanitary trunk sewer along Terry fox Drive shows that the HGL under emergency overflow conditions at the SPRS would surcharge to the ground at several locations along Terry Fox Drive. Given expected HGL’s and assuming typical basement depths and the appropriate freeboard, basements should not be permitted where the ground elevation is below 0.97 m. Regardless, it is recommended that the City direct the developers to investigate alternative scenarios which would mitigate the risk of surface spills and/ or basement flooding in the area.

City of Ottawa Page 9
WUC- Wastewater Collection System Appendix A Master Servicing Plan – Study Report May 2012 RVA 102174
1.A.8 Fernbank Community Design Plan - Master Servicing Study
Description
To provide wastewater service to the Fernbank CDP lands, a sewer capacity analysis and pump station evaluation was completed. The analysis considers background growth and planned wastewater modifications from the 2009 Draft Infrastructure Master Plan. The purpose of the evaluation was to:
Identify where capacity constraints exist within the sewershed
Recommend feasible design solutions where constraints exist
Project timelines to implement municipal wastewater upgrades
Summary and Recommendations
The North Kanata Trunk has adequate capacity to build-out
The Tri-Township Collector is undersized for both existing and future design flows; this sewer needs to be upgraded given the development pressure throughout the west urban community.
The Glen Cairn Trunk has adequate capacity to build-out
Hazeldean pump station upgrades
The planned third submersible pump will be required by 2012.
A subsequent capacity upgrade will be required by 2016 to replace four pump and impeller units
Actual flow monitoring at the station is recommended to determine when the upgrades are required
An overflow can be constructed at the Hazeldean Pump Station into Cell 1 of Monahan Constructed Wetlands for protection of homes should a catastrophic failure occur at the pump station.
When Kanata West Pump Station comes online, wastewater from both Kanata West and a portion of the Stittsville area near Hazeldean Road will be routed away from the Hazeldean pumping station
The south Glen Cairn Trunk has adequate capacity to build-out.
An alternative analysis of the internal Fernbank wastewater system found that conveyance of all sanitary drainage to the Hazeldean Pump Station was the preferred solution.
The Fernbank CDP lands will be entirely serviced using free-flow gravity sewers. A new trunk sewer within the Hydro One easement will provide a wastewater outlet that discharges into the Hazeldean Pumping Station.

APPENDIX B Wastewater Collection Model – scenario selection

West Urban Community (WUC)
Wastewater Collection Model
Development & System Capacity
Assessment
FINAL REPORT
May 2012

WEST URBAN COMMUNITY (WUC) WASTEWATER COLLECTION MODEL
DEVELOPMENT & SYSTEM CAPACITY ASSESSMENT
kma v:\01-634\active\1634_01026_wuc_wastewater_analysis\planning\report\final\may 2012 rev\rpt_wucww_rev may 2012.docx i
Table of Contents
1.0 INTRODUCTION & OBJECTIVE ...................................................................................... 1.1
2.0 MODEL DEVELOPMENT BACKGROUND ...................................................................... 2.1
2.1 DEVELOPMENT DETAILS ............................................................................................... 2.1
2.1.1 Pump Stations .................................................................................................... 2.1
2.1.2 Flow Diversions/Control Structures..................................................................... 2.2
2.2 MODEL CALIBRATION .................................................................................................... 2.2
2.2.1 Flow Generation ................................................................................................. 2.3
2.2.2 Average Dry Weather Flow & Patterns ............................................................... 2.3
2.2.2.1 Dry Weather Diurnal Patterns ............................................................................. 2.4
2.2.2.2 Average Dry Weather Flow – Residential Contribution ....................................... 2.7
2.2.2.3 Groundwater Infiltration (GWI) ............................................................................ 2.7
2.2.2.4 Industrial, Commercial and Institutional (ICI) Contributions ................................ 2.8
2.2.3 Wet Weather Flow .............................................................................................. 2.8
2.3 CALIBRATION RESULTS ............................................................................................... 2.10
2.3.1 Dry Weather Flow Calibration results ............................................................... 2.10
2.3.2 Wet Weather Flow Calibration .......................................................................... 2.12
2.3.2.1 September 9, 2004 Event ................................................................................. 2.12
2.3.2.2 January 8, 2008 Event...................................................................................... 2.13
2.4 GENERAL DISCUSSION ................................................................................................ 2.13
3.0 WUC MODEL DEVELOPMENT ........................................................................................ 3.1
3.1 MODELLING APPROACH MODIFICATIONS ................................................................... 3.1
3.1.1 Switch to Area based Inflow & Infiltration (I/I) Loading ........................................ 3.1
3.1.2 Pump Station Operation Simplification ............................................................... 3.1
3.1.3 Signature Ridge, Kanata West, and Future ICI Loading Approach ..................... 3.2
3.2 DATA BASE UPDATES .................................................................................................... 3.3
3.2.1 2010 & 2031 WUC Database Summary ............................................................. 3.3
3.2.2 2060 WUC Growth Projections ........................................................................... 3.4
3.2.3 Additional Federal Campus Areas ...................................................................... 3.5
4.0 LOADING PARAMETERS & SCENARIOS SELECTION ................................................. 4.1
4.1 LOADING PARAMETER SELECTION & GENERATION .................................................. 4.1
4.1.1 Dry Weather Flow Generation Parameters ......................................................... 4.1
4.1.1.1 Groundwater Inflow/Infiltration (GWI) Rates ....................................................... 4.1
4.1.2 Wet Weather Flow Generation Parameters ........................................................ 4.2
4.2 SCENARIO SELECTION .................................................................................................. 4.6
5.0 MODEL RESULTS – EXISTING INFRASTRUCTURE ..................................................... 5.1
5.1 2010 & 2031 EXISTING INFRASTRUCTURE DEFICIENCIES ......................................... 5.1
5.1.1 Tri-Township Collector........................................................................................ 5.1
5.1.2 Signature Ridge & Kanata West ......................................................................... 5.1
5.1.3 Stittsville Trunk ................................................................................................... 5.1

WEST URBAN COMMUNITY (WUC) WASTEWATER COLLECTION MODEL DEVELOPMENT & SYSTEM CAPACITY ASSESSMENT
Table of Contents
ii kma v:\01-634\active\1634_01026_wuc_wastewater_analysis\planning\report\final\may 2012 rev\rpt_wucww_rev may 2012.docx
5.1.4 Richmond ........................................................................................................... 5.1
5.2 2060 FLOW GENERATION .............................................................................................. 5.1
5.3 PREFERRED SCENARIO SELECTION ........................................................................... 5.1

WEST URBAN COMMUNITY (WUC) WASTEWATER COLLECTION MODEL
DEVELOPMENT & SYSTEM CAPACITY ASSESSMENT
kma v:\01-634\active\1634_01026_wuc_wastewater_analysis\planning\report\final\may 2012 rev\rpt_wucww_rev may 2012.docx 1.1
1.0 Introduction & Objective
The West Urban Community (WUC) sanitary sewer system consists of a system of gravity
sewers, pumps and forcemains all converging at a single pumping station at Acres Road. The
WUC collection system services the communities of Carp, Kanata, Stittsville, Munster,
Richmond and Bells Corners (see Figure 1-1). The infrastructure needs in Kanata and Stittsville
were developed in separate master servicing studies, prepared by the respective proponents.
Although the infrastructure needed to service the growth areas is feasible, it has not been
evaluated in conjunction with the existing infrastructure and planned infrastructure upgrades in
the WUC, which may provide opportunities to improve the system as a whole. In addition, there
have been a number of overflows and flooding incidents at the wastewater pumping stations in
the WUC. As the planned upgrades in the WUC rely heavily on the expansion of existing pump
stations and the construction of a new pump station, the need exists to develop a servicing
strategy for the WUC that minimizes, as much as possible, the risk to public safety and health.
The objectives of this assignment were to revise and update the existing dynamic sanitary
sewer modeling tool and assess the existing infrastructure within the WUC with the goal of
facilitating the development of an ultimate servicing strategy for the WUC.
The capacity assessment for this assignment was completed using the dynamic model tool
developed by Stantec (August, 2010) as part of the City of Ottawa’s Wastewater Collection
System Dynamic Model assignment. The inputs to this network assessment tool were revised
and updated based on City of Ottawa updated sanitary catchments to represent existing (2010),
buildout (2031), and beyond buildout (2060) loading scenarios.
This report provides background information on the general approach to the original modeling
tool developed by Stantec in 2010, discussions regarding adjustments or updates made to the
modeling approach, as well as present the various scenarios considered and identifies existing
network constraints generated based on this assignment.

WEST URBAN COMMUNITY (WUC) WASTEWATER COLLECTION MODEL DEVELOPMENT &
SYSTEM CAPACITY ASSESSMENT Introduction & Objective
May 11, 2012
1.2 kma v:\01-634\active\1634_01026_wuc_wastewater_analysis\planning\report\final\may 2012 rev\rpt_wucww_rev may 2012.docx
Figure 1-1. WUCWW Study Area.

WEST URBAN COMMUNITY (WUC) WASTEWATER COLLECTION MODEL
DEVELOPMENT & SYSTEM CAPACITY ASSESSMENT
kma v:\01-634\active\1634_01026_wuc_wastewater_analysis\planning\report\final\may 2012 rev\rpt_wucww_rev may 2012.docx 2.1
2.0 Model Development Background
The dynamic model developed for this WUC assessment is an update to the model developed
by Stantec for the City of Ottawa’s Wastewater Collection System Dynamic Model assignment
(August, 2010). The 2010 model was prepared using PCSWMM 2010 Standard and was
developed by expanding on the steady state ‘trunk sewer’ model prepared by Stantec as part of
the Infrastructure Master Plan Update (May, 2009). These models were built based on
wastewater infrastructure details taken from the City’s GIS databases and operation and
maintenance (O&M) manuals in the case of pump stations.
The following subsections provide summaries of how the initial dynamic model was developed.
The reader is directed to the Wastewater Collection System Dynamic Model – WEST (Stantec,
August 2010) report for further details and discussion on how the original modeling tool was
developed and calibrated, as well as to view complete calibration and model scenario results.
Note that Section 3.0 of this report will present the updates made to the model, as well as
any modifications to the approaches used to represent the WUC sanitary network.
2.1 DEVELOPMENT DETAILS
2.1.1 Pump Stations
Operations information for the 22 pump stations modeled was obtained from the Pumping
Station Pump Capacity Assessment (Stantec, September 2009). Wet well dimensions were
used to develop wet-well storage relationships, which were input into the model. Pump curves,
float levels, pump sequencing and forcemains details were also input into the dynamic model to
simulate the system response at each of the following pumping stations:
• Acres Road • Briarridge • Carp
• Crystal Beach1 • Cedarow • CWM Carp
• Donald B. Munro • Echowoods • Fairwinds
• Friendly • Fringewood • Hazeldean
• Hopeside • Jackson Trails • John Street
• Joseph Circle • March • Munster 12
• Munster 22 • Richmond • Signature Ridge
• Stittsville
1 The Crystal Beach Pump Station is only operational during extreme wet weather events. It is included in the wet
weather flow simulations; however it is omitted from the dry weather flow simulation. The Crystal Beach Pump Station

WEST URBAN COMMUNITY (WUC) WASTEWATER COLLECTION MODEL DEVELOPMENT &
SYSTEM CAPACITY ASSESSMENT Model Development Background
May 11, 2012
2.2 kma v:\01-634\active\1634_01026_wuc_wastewater_analysis\planning\report\final\may 2012 rev\rpt_wucww_rev may 2012.docx
is only operational when the diversion gate at manhole MHSA01767 is closed and flows are redirected from the West
Nepean Collector during extreme wet weather events.
2 The Munster 1 & Munster 2 Pump Stations are only operational during the dry weather simulation. These pump
stations are removed from the wet weather simulations as the flows are diverted to a local storage facility during
extreme wet weather events.
2.1.2 Flow Diversions/Control Structures
There is one (1) flow diversion structure in the WUC collection system and it is located
downstream of the Signature Ridge Pumping Station. The diversion structure is designed to
restrict the flow into the Kanata Lakes Trunk to 140L/s. To model the diversion structure, a
control was set that restricts the flow into the downstream Kanata Lakes Trunk to a maximum of
140L/s. In addition, a side weir was added to initially direct all flows to the Kanata Lakes Trunk
until the depth of flow in the sewer reaches the weir sill elevation at which time flow will be
allowed to flow to the Main Street/Penfield Drive sewers.
2.2 MODEL CALIBRATION
The model was initially calibrated by applying City of Ottawa generated water consumption rates
and diurnal patterns specific to the west-end for the current system configuration as supplied by
the City of Ottawa’s engineering and planning groups. At each step of the model calibration
process, the project’s Technical Advisory Committee (which included staff from various City
departments) provided feedback and direction on the calibration process and assessment
method.
The model was loaded with the residential sanitary rate, which was applied to the population
totals within each of the sub-catchments, to establish the average dry weather flow (DWF)
within the individual sub-catchments. The weekday and weekend water consumption patterns
were applied to the average DWF to simulate the varying diurnal DWF response within the
study area. The consumption rate used to simulate the current wastewater generation was
200L/person/day.
PCSWMM does not allow the user to apply multiple average flows and diurnal patterns to the
same manhole. This functionality would be useful to more accurately simulate the residential
responses, and the institutional, commercial, and industrial (ICI) responses within each of the
sub-catchments. Alternatively, if an ICI pattern were provided, a combined pattern and average
flow could be generated by pro-rating the percentage of ICI and residential area within a sub-
catchment; however, the non-coincident peaking of residential and ICI flows would create a
dampened pattern. Given the limitations in the model’s capabilities and in the data provided, it
was decided that the relatively limited ICI contributions would not be modeled separately, but
rather would be accounted for in the GWI contributions as a constant inflow.

WEST URBAN COMMUNITY (WUC) WASTEWATER COLLECTION MODEL DEVELOPMENT &
SYSTEM CAPACITY ASSESSMENT Model Development Background
May 11, 2012
kma v:\01-634\active\1634_01026_wuc_wastewater_analysis\planning\report\final\may 2012 rev\rpt_wucww_rev may 2012.docx 2.3
Running the model with the City of Ottawa provided water consumption rate and diurnal
patterns provided preliminary results at all of the monitoring locations throughout the study area.
The modeled results were compared to the monitored results and the difference in the average
flows was assumed to account for the ground water infiltration (GWI). The GWI flow was
divided by the total number of dwellings in the tributary area to establish a GWI rate per lateral,
which was multiplied by the number of dwellings within the individual sub-catchments.
To calibrate the wet weather model response the dry weather scenario model was used and a
wet weather flow (WWF) pattern applied. The pattern was developed by subtracting the
monitored DWF response from the monitored response during a rainfall event to estimate the
WWF. The WWF pattern was divided by the total number of dwellings in the tributary area to
establish a unitless WWF pattern per lateral, which was multiplied by the number of dwellings
within the individual sub-catchments.
2.2.1 Flow Generation
Flow monitoring records from 2004-2009 were provided from the City for seven (7) monitoring
locations within the study area:
• Acres Road Flume
• Upstream of the Hazeldean Pump Station
• Upstream of the March Pump Station
• Upstream of the Signature Ridge Pump Station
• Upstream of the Stittsville Pump Station
• Upstream of the Richmond Pump Station
• Upstream of the Carp Pump Station
The City provided Stantec with monitoring data for dry weather periods, as well as for the two
(2) wet weather calibration events: September 9, 2004 and January 8, 2008. Level data within
the wet wells at each of the pump stations listed above was also provided for these events.
2.2.2 Average Dry Weather Flow & Patterns
Periods of consistent dry weather flow from between 2004-2009 were analyzed to obtain the
average dry weather flow rates at all 7 monitoring locations. The average dry weather flow
values were used to approximate the GWI and to complete the dry weather calibration. Figure
2.1 is provided as an example of this analysis and shows the results from the Hazeldean pump
Station.
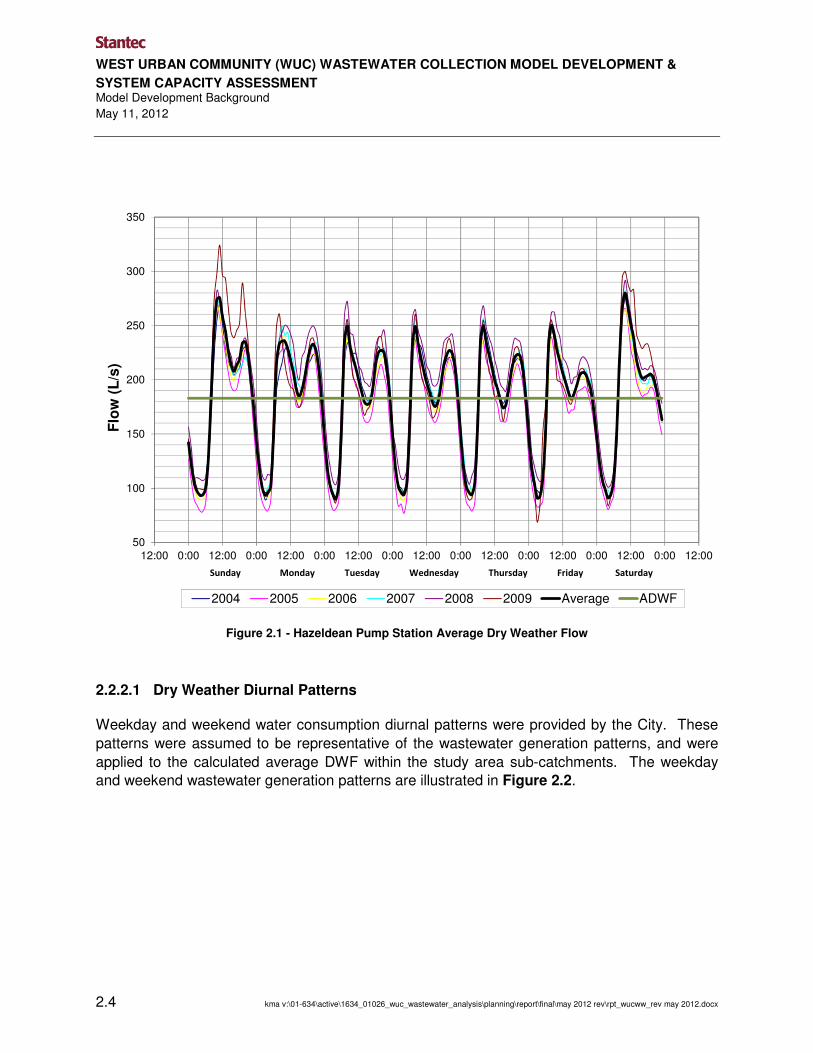
WEST URBAN COMMUNITY (WUC) WASTEWATER COLLECTION MODEL DEVELOPMENT &
SYSTEM CAPACITY ASSESSMENT Model Development Background
May 11, 2012
2.4 kma v:\01-634\active\1634_01026_wuc_wastewater_analysis\planning\report\final\may 2012 rev\rpt_wucww_rev may 2012.docx
Figure 2.1 - Hazeldean Pump Station Average Dry Weather Flow
2.2.2.1 Dry Weather Diurnal Patterns
Weekday and weekend water consumption diurnal patterns were provided by the City. These
patterns were assumed to be representative of the wastewater generation patterns, and were
applied to the calculated average DWF within the study area sub-catchments. The weekday
and weekend wastewater generation patterns are illustrated in Figure 2.2.
50
100
150
200
250
300
350
12:00 0:00 12:00 0:00 12:00 0:00 12:00 0:00 12:00 0:00 12:00 0:00 12:00 0:00 12:00 0:00 12:00
Flo
w (
L/s
)
2004 2005 2006 2007 2008 2009 Average ADWF
Sunday Monday Tuesday Wednesday Thursday Friday Saturday
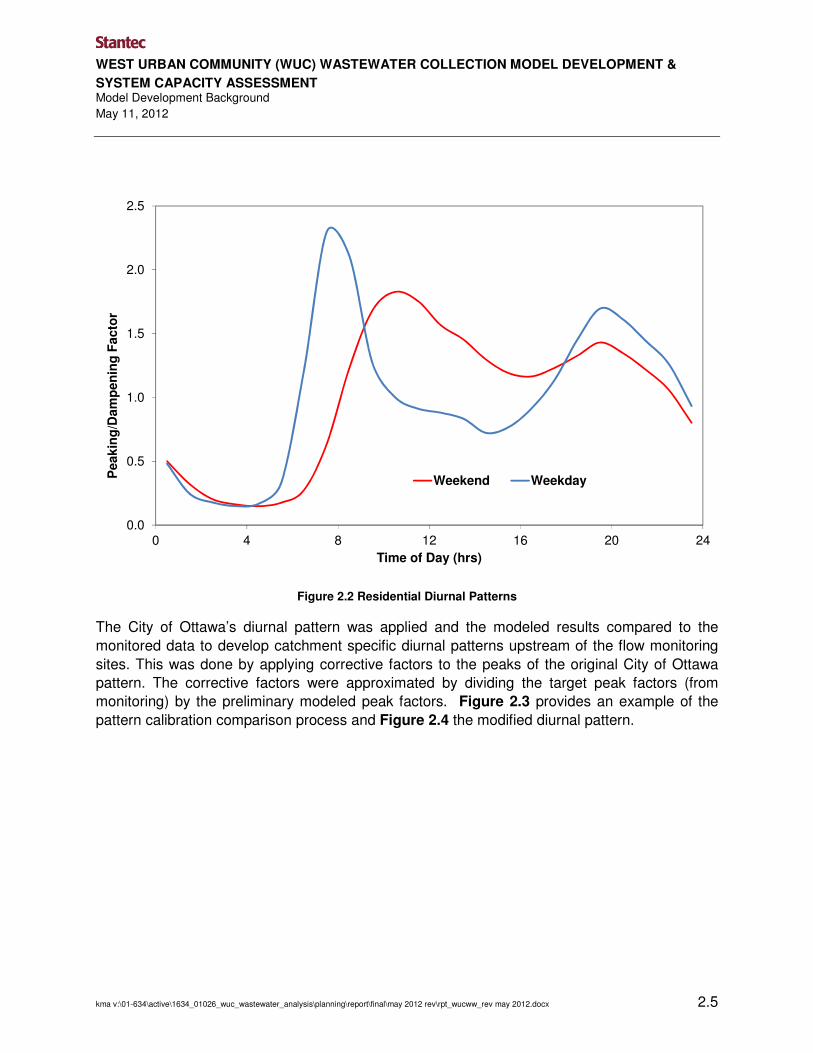
WEST URBAN COMMUNITY (WUC) WASTEWATER COLLECTION MODEL DEVELOPMENT &
SYSTEM CAPACITY ASSESSMENT Model Development Background
May 11, 2012
kma v:\01-634\active\1634_01026_wuc_wastewater_analysis\planning\report\final\may 2012 rev\rpt_wucww_rev may 2012.docx 2.5
Figure 2.2 Residential Diurnal Patterns
The City of Ottawa’s diurnal pattern was applied and the modeled results compared to the
monitored data to develop catchment specific diurnal patterns upstream of the flow monitoring
sites. This was done by applying corrective factors to the peaks of the original City of Ottawa
pattern. The corrective factors were approximated by dividing the target peak factors (from
monitoring) by the preliminary modeled peak factors. Figure 2.3 provides an example of the
pattern calibration comparison process and Figure 2.4 the modified diurnal pattern.
0.0
0.5
1.0
1.5
2.0
2.5
0 4 8 12 16 20 24
Peakin
g/D
am
pen
ing
Facto
r
Time of Day (hrs)
Weekend Weekday

WEST URBAN COMMUNITY (WUC) WASTEWATER COLLECTION MODEL DEVELOPMENT &
SYSTEM CAPACITY ASSESSMENT Model Development Background
May 11, 2012
2.6 kma v:\01-634\active\1634_01026_wuc_wastewater_analysis\planning\report\final\may 2012 rev\rpt_wucww_rev may 2012.docx
Figure 2.3 Residential Diurnal Pattern Comparisons (Hazeldean PS DWF)
Figure 2.4 Modified Diurnal Pattern (Hazeldean PS DWF)
0
0.5
1
1.5
2
2.5
12:00 0:00 12:00 0:00 12:00 0:00 12:00
Pe
ak
Fa
cto
rHazeldean DWF Calibration Diurnal Patterns
City Pattern (Input) Modeled (Output) Monitored (Target)
Weekend Weekday
0
0.5
1
1.5
2
2.5
12:00 0:00 12:00 0:00 12:00 0:00 12:00
Pe
ak
Fa
cto
r
Hazeldean DWF Pattern Calibration
City Pattern Stantec Modified Pattern
Weekend Weekday

WEST URBAN COMMUNITY (WUC) WASTEWATER COLLECTION MODEL DEVELOPMENT &
SYSTEM CAPACITY ASSESSMENT Model Development Background
May 11, 2012
kma v:\01-634\active\1634_01026_wuc_wastewater_analysis\planning\report\final\may 2012 rev\rpt_wucww_rev may 2012.docx 2.7
2.2.2.2 Average Dry Weather Flow – Residential Contribution
The average residential DWF was estimated using the populations in the catchments and an
average DWF rate of 200L/person/day. The rate is based on residential water usage records in
the Kanata area and was provided by the City for use in the model.
2.2.2.3 Groundwater Infiltration (GWI)
The model was run using the diurnal patterns, the average DWF rates, and the GWI estimated
contributions. These GWI contributions were estimated to be the difference between the
monitored average DWF (see Figure 2.5) and the model generated average dry weather flow.
In the model, the GWI is represented on a flow per service connection basis. This approach
assumes that the total number of water meters is representative of the total number of service
connections. A GWI rate per lateral was calculated by dividing the total GWI rate by the total
water meter count in the monitored catchment area and applied to the individual sub-
catchments.
Figure 2.5 Dry Weather Groundwater (GWI) Rate Derivation.
86L/s
52L/s
0
20
40
60
80
100
120
140
Flo
w (
L/s)
Monitored Data Preliminary Modeled - No GWI
34L/s

WEST URBAN COMMUNITY (WUC) WASTEWATER COLLECTION MODEL DEVELOPMENT &
SYSTEM CAPACITY ASSESSMENT Model Development Background
May 11, 2012
2.8 kma v:\01-634\active\1634_01026_wuc_wastewater_analysis\planning\report\final\may 2012 rev\rpt_wucww_rev may 2012.docx
2.2.2.4 Industrial, Commercial and Institutional (ICI) Contributions
The average DWF from the ICI areas was estimated using the number of employees in the
catchments and an average DWF rate of 85L/employee/day. The rate is based on employment
water usage records outside of the Greenbelt and was provided by the City for use in the model.
The Hazeldean area is one of the more established, or built out, areas within the WUC. Using
the average dry weather flow rate of 85L/employee/day provided by the City for ICI lands
outside of the Greenbelt, the average ICI DWF within the Hazeldean catchment was estimated
to be 11L/s, and represents 4% of the total calculated average DWF of 277L/s at this location.
Given the limitations in the model’s capabilities, it was decided that the relatively limited ICI
contributions would not be modeled separately, but rather would be accounted for in the GWI
contributions as a constant baseflow.
2.2.3 Wet Weather Flow
The model was calibrated for two significant wet weather events: the rainfall event of September
9, 2004 and the snowmelt event of January 8, 2008. Monitoring records for the 7 flow
monitoring locations were provided by the City for both wet weather events. Removing the
monitored dry weather flow contributions from the monitored wet weather flow provides an
estimate of the wet weather infiltration/inflow (I/I) contribution. Figure 2.6 provides an example
of this wet weather I/I separation procedure.
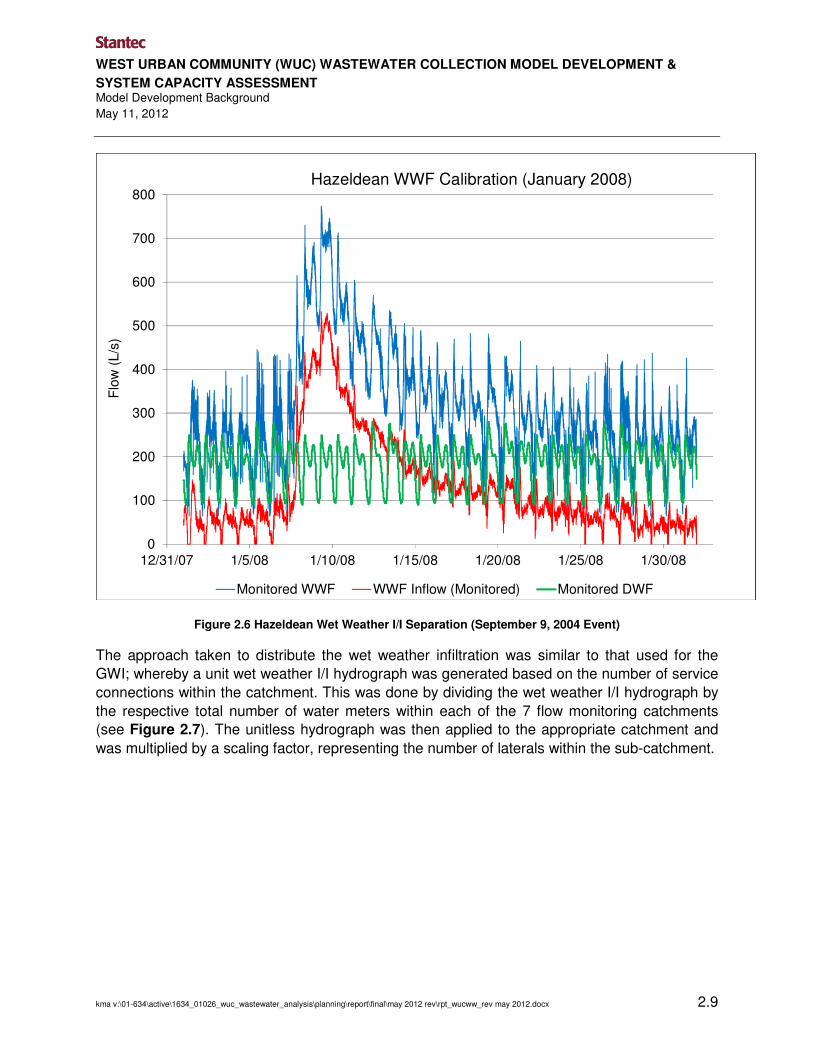
WEST URBAN COMMUNITY (WUC) WASTEWATER COLLECTION MODEL DEVELOPMENT &
SYSTEM CAPACITY ASSESSMENT Model Development Background
May 11, 2012
kma v:\01-634\active\1634_01026_wuc_wastewater_analysis\planning\report\final\may 2012 rev\rpt_wucww_rev may 2012.docx 2.9
Figure 2.6 Hazeldean Wet Weather I/I Separation (September 9, 2004 Event)
The approach taken to distribute the wet weather infiltration was similar to that used for the
GWI; whereby a unit wet weather I/I hydrograph was generated based on the number of service
connections within the catchment. This was done by dividing the wet weather I/I hydrograph by
the respective total number of water meters within each of the 7 flow monitoring catchments
(see Figure 2.7). The unitless hydrograph was then applied to the appropriate catchment and
was multiplied by a scaling factor, representing the number of laterals within the sub-catchment.
0
100
200
300
400
500
600
700
800
12/31/07 1/5/08 1/10/08 1/15/08 1/20/08 1/25/08 1/30/08
Flo
w (
L/s
)
Hazeldean WWF Calibration (January 2008)
Monitored WWF WWF Inflow (Monitored) Monitored DWF

WEST URBAN COMMUNITY (WUC) WASTEWATER COLLECTION MODEL DEVELOPMENT &
SYSTEM CAPACITY ASSESSMENT Model Development Background
May 11, 2012
2.10 kma v:\01-634\active\1634_01026_wuc_wastewater_analysis\planning\report\final\may 2012 rev\rpt_wucww_rev may 2012.docx
Figure 2.7 Hazeldean Wet Weather I/I Contribution per Lateral (January 8, 2008 Event)
2.3 CALIBRATION RESULTS
2.3.1 Dry Weather Flow Calibration results
Following the calibration efforts, a comparison of the modeled and monitored flow results at all 7
calibration locations was completed. The modeled average DWF flows were found to be within
1.4% to 13.2% of the monitored values and with the exception of Acres Road the peak DWF
flows within 0.3% to 19.4% of the monitored values. The modeled DWF volumes were found to
be within 1.5% to 12.8% of the monitored values. Tables 2-1 and 2-2 provide a summary of the
dry weather calibration results. In review of the calibration results, the project team considered
the level of accuracy obtained based on the level of effort applied within an acceptable range for
a hydraulic model to be used as a long term planning tool.
0.000
0.005
0.010
0.015
0.020
0.025
0.030
0.035
12/31/07 1/5/08 1/10/08 1/15/08 1/20/08 1/25/08 1/30/08
L/s
/ Late
ral
Time

WEST URBAN COMMUNITY (WUC) WASTEWATER COLLECTION MODEL DEVELOPMENT &
SYSTEM CAPACITY ASSESSMENT Model Development Background
May 11, 2012
kma v:\01-634\active\1634_01026_wuc_wastewater_analysis\planning\report\final\may 2012 rev\rpt_wucww_rev may 2012.docx 2.11
Table 2.1 Dry Weather Flow Calibration Results
Location Average Flow Peak Flow
Modeled (L/s)
Monitored (L/s)
Difference (%)
Modeled (L/s)
Monitored (L/s)
Difference (%)
Acres 394 379 4.0 604 506 19.4
Carp 5.8 6.0 2.0 8.2 9.1 9.4 Hazeldean 178 183 2.7 292.3 276.8 5.6
March 92.7 86.2 7.5 130.7 121.6 7.5 Richmond 22.1 22.8 2.9 30.3 31.2 2.8
SRPS 14.7 14.9 1.4 21.0 20.2 4.0 Stittsville 6.8 7.9 13.2 13.0 13.1 0.3
Table 2.2 Dry Weather Volume Calibration Results
Location Volume
Modeled (m3)
Monitored (m3)
Difference (%)
Acres 133,403 127,724 4.4 Carp 1,976 2,019 2.2
Hazeldean 60,294 61,811 2.5 March 31,371 29,112 7.8
Richmond 7,485 7,747 3.4 SRPS 4,967 5,041 1.5
Stittsville 2,318 2,658 12.8

WEST URBAN COMMUNITY (WUC) WASTEWATER COLLECTION MODEL DEVELOPMENT &
SYSTEM CAPACITY ASSESSMENT Model Development Background
May 11, 2012
2.12 kma v:\01-634\active\1634_01026_wuc_wastewater_analysis\planning\report\final\may 2012 rev\rpt_wucww_rev may 2012.docx
2.3.2 Wet Weather Flow Calibration
2.3.2.1 September 9, 2004 Event
A comparison of the modeled and monitored flow results at all 7 calibration locations was
completed. The modeled peak WWF flows were found to be within 3.6% to 16.3% of the
monitored values. The modeled WWF volumes were found to be within 1.4% to 12.8% of the
monitored values. Table 2-3 provides a summary of the September 9, 2004 calibration results.
Table 2.3 September 9, 2004 Wet Weather Event Calibration Results
Location Peak Flow Event Volume
Modeled (L/s)
Monitored (L/s)
Difference (%)
Modeled (m3)
Monitored (m3)
Difference (%)
Acres 1,443 1,393 3.6 1,215,191 1,138,722 6.7 Carp1 30.4 26.2 16.3 18,320 16,416 11.6
Hazeldean 610 589 3.6 588,873 576,512 2.1 March2 267 282,467
Richmond3 194 219 11.5 67,212 59,587 12.8
SRPS 35.3 39.7 11.0 40,757 40,210 1.4 Stittsville 28.8 25.7 11.8 21,868 20,877 4.7
1The rising limb of the wet weather flow monitoring records at the Carp PS look irregularly low. Inaccurate flow monitoring data is
suspected.
2Incomplete flow monitoring data was provided for the March PS for the September 9, 2004 WWF event. Due to this, the Hazeldean
PS based unitless hydrograph was applied to the March PS sub-catchments and their laterals to approximate the WW I/I response.
3The rising limb of the wet weather records at the Richmond PS appear irregularly high. This may have been due to a higher than
usual ground water infiltration rate experienced prior to the event or simply inaccurate flow monitoring data.
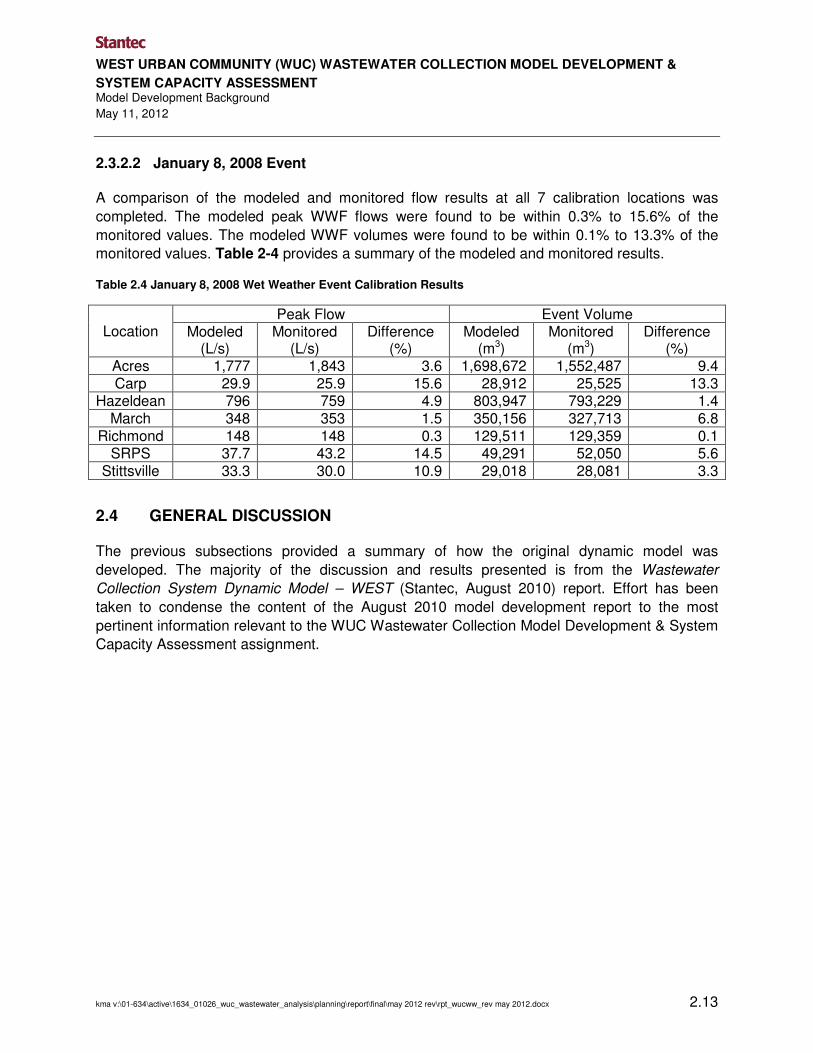
WEST URBAN COMMUNITY (WUC) WASTEWATER COLLECTION MODEL DEVELOPMENT &
SYSTEM CAPACITY ASSESSMENT Model Development Background
May 11, 2012
kma v:\01-634\active\1634_01026_wuc_wastewater_analysis\planning\report\final\may 2012 rev\rpt_wucww_rev may 2012.docx 2.13
2.3.2.2 January 8, 2008 Event
A comparison of the modeled and monitored flow results at all 7 calibration locations was
completed. The modeled peak WWF flows were found to be within 0.3% to 15.6% of the
monitored values. The modeled WWF volumes were found to be within 0.1% to 13.3% of the
monitored values. Table 2-4 provides a summary of the modeled and monitored results.
Table 2.4 January 8, 2008 Wet Weather Event Calibration Results
Location Peak Flow Event Volume
Modeled (L/s)
Monitored (L/s)
Difference (%)
Modeled (m3)
Monitored (m3)
Difference (%)
Acres 1,777 1,843 3.6 1,698,672 1,552,487 9.4 Carp 29.9 25.9 15.6 28,912 25,525 13.3
Hazeldean 796 759 4.9 803,947 793,229 1.4 March 348 353 1.5 350,156 327,713 6.8
Richmond 148 148 0.3 129,511 129,359 0.1 SRPS 37.7 43.2 14.5 49,291 52,050 5.6
Stittsville 33.3 30.0 10.9 29,018 28,081 3.3
2.4 GENERAL DISCUSSION
The previous subsections provided a summary of how the original dynamic model was
developed. The majority of the discussion and results presented is from the Wastewater
Collection System Dynamic Model – WEST (Stantec, August 2010) report. Effort has been
taken to condense the content of the August 2010 model development report to the most
pertinent information relevant to the WUC Wastewater Collection Model Development & System
Capacity Assessment assignment.
WEST URBAN COMMUNITY (WUC) WASTEWATER COLLECTION MODEL
DEVELOPMENT & SYSTEM CAPACITY ASSESSMENT
kma v:\01-634\active\1634_01026_wuc_wastewater_analysis\planning\report\final\may 2012 rev\rpt_wucww_rev may 2012.docx 3.1
3.0 WUC Model Development
The WUC system capacity assessment task was completed by updating the existing City of
Ottawa PCSWMM model and running it under various loading scenarios. The model updates
were based on directions and updated GIS data provided by the City.
3.1 MODELLING APPROACH MODIFICATIONS
Certain modifications were made to the model loading approach. The ultimate purpose of all of
the modifications was to generate a model loaded with the data of the highest levels of
confidence that would provide the results needed.
3.1.1 Switch to Area based Inflow & Infiltration (I/I) Loading
The original PCSWMM model developed for the City was loaded on a per lateral basis for
ground water and wet weather infiltration (GWI & WWI). During the initial data manipulation and
initial model runs, both lateral and net area based loading approaches were considered. The
lateral based approach employs a distribution of flows based on the number of laterals in a
particular catchment. The area based loading approach is a broader approach that considers
the gross area of a particular catchment and the application of uniform loading across the entire
catchment area.
Under existing conditions runs, the model findings tracked well, however under buildout
conditions (2031) there were often large discrepancies in the flow generation. The reasoning
behind this was found to be that the densities of the catchments with regards to laterals/area
varied throughout the study area. Furthermore, the current City of Ottawa Sewer Design
Guidelines provides GWI and WWI design rates on an area basis. To minimize the risk of
confusion regarding which rates are used, and also to simplify the assessment, the loading
approach for GWI and WWI was switched to an area based approach.
3.1.2 Pump Station Operation Simplification
The pump stations located throughout the WUC were originally created by using wet well, pump
operation characteristics, and forcemain details. The goal was to set up the pump stations with
as much detail as possible such that they would function as their respective designs specified.
For the WUC system assessment, this approach was greatly simplified such that pump stations
are setup as “ideal” stations. Essentially, the stations pass the inflow they see downstream,
disregarding how the station would operate in actuality. This was done for two reasons:
• The pump station behavior in the original model was at times inaccurate due to the
required level of detail needed to properly represent pump stations. Many of the pump

WEST URBAN COMMUNITY (WUC) WASTEWATER COLLECTION MODEL DEVELOPMENT &
SYSTEM CAPACITY ASSESSMENT WUC Model Development
May 11, 2012
3.2 kma v:\01-634\active\1634_01026_wuc_wastewater_analysis\planning\report\final\may 2012 rev\rpt_wucww_rev may 2012.docx
stations contained within the WUC contain relatively long forcemains with many gradient
transitions. There are also various valves located along these forcemains. Although
effort was spent imputing these details in the original model, the simulation results often
did not track the equivalent design sheet findings.
• The purpose of the WUC system capacity assessment is to revise the ultimate servicing
strategy for the entire WUC. Conceptually, this would require all intermediate pump
stations to be allowed to convey their inflow downstream to the receiving infrastructure,
as all pump stations would be assumed to have sufficient capacity to do so. Setting the
model up in this manner allows the identification of undersized pump stations by
comparing their existing/future capacities against the simulated existing/future flows.
This also allows ultimate bottlenecks to be identified in the wastewater collection system
as flows would not be “held up” by undersized pump stations.
3.1.3 Signature Ridge, Kanata West, and Future ICI Loading Approach
The original model accounted for ICI contributions by applying a greater amount of GWI. This
was done due to the limited amount of ICI generation in the majority of the subcatchments.
While reviewing the model results at the Signature Ridge pump station, Kanata West pump
station, and under future conditions, it became evident that flows were being under-
approximated using this approach. To correct for this, secondary “ICI generation” nodes were
introduced for these areas. These nodes are easily identified in the model as they have been
given the prefix “ICI” for existing ICI generation or “FUT_ICI” for future ICI generation.
This modification to the ICI load generation approach was important to introduce specifically to
the Signature Ridge and Kanata West areas as these areas are slated to develop primarily as
ICI lands. As such the simplified approach taken for the majority of the remainder of the WUC
study area was not as appropriate for these areas.
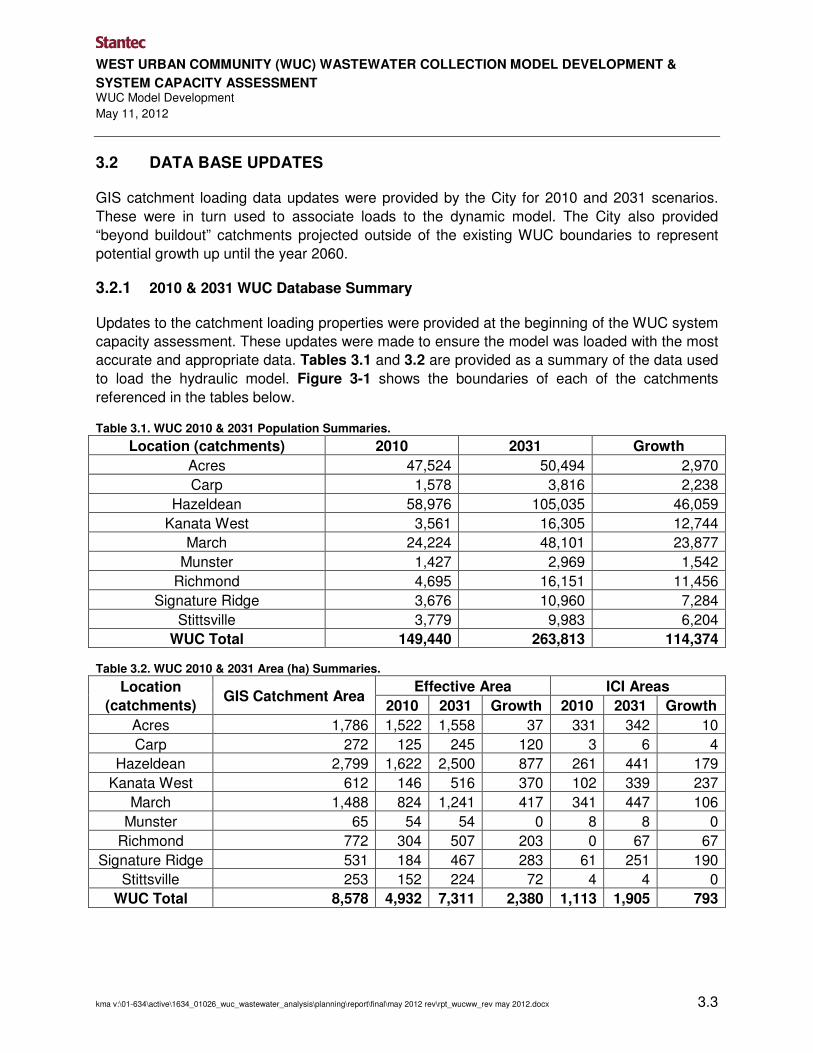
WEST URBAN COMMUNITY (WUC) WASTEWATER COLLECTION MODEL DEVELOPMENT &
SYSTEM CAPACITY ASSESSMENT WUC Model Development
May 11, 2012
kma v:\01-634\active\1634_01026_wuc_wastewater_analysis\planning\report\final\may 2012 rev\rpt_wucww_rev may 2012.docx 3.3
3.2 DATA BASE UPDATES
GIS catchment loading data updates were provided by the City for 2010 and 2031 scenarios.
These were in turn used to associate loads to the dynamic model. The City also provided
“beyond buildout” catchments projected outside of the existing WUC boundaries to represent
potential growth up until the year 2060.
3.2.1 2010 & 2031 WUC Database Summary
Updates to the catchment loading properties were provided at the beginning of the WUC system
capacity assessment. These updates were made to ensure the model was loaded with the most
accurate and appropriate data. Tables 3.1 and 3.2 are provided as a summary of the data used
to load the hydraulic model. Figure 3-1 shows the boundaries of each of the catchments
referenced in the tables below.
Table 3.1. WUC 2010 & 2031 Population Summaries.
Location (catchments) 2010 2031 Growth
Acres 47,524 50,494 2,970
Carp 1,578 3,816 2,238
Hazeldean 58,976 105,035 46,059
Kanata West 3,561 16,305 12,744
March 24,224 48,101 23,877
Munster 1,427 2,969 1,542
Richmond 4,695 16,151 11,456
Signature Ridge 3,676 10,960 7,284
Stittsville 3,779 9,983 6,204
WUC Total 149,440 263,813 114,374 Table 3.2. WUC 2010 & 2031 Area (ha) Summaries.
Location
(catchments) GIS Catchment Area
Effective Area ICI Areas
2010 2031 Growth 2010 2031 Growth
Acres 1,786 1,522 1,558 37 331 342 10
Carp 272 125 245 120 3 6 4
Hazeldean 2,799 1,622 2,500 877 261 441 179
Kanata West 612 146 516 370 102 339 237
March 1,488 824 1,241 417 341 447 106
Munster 65 54 54 0 8 8 0
Richmond 772 304 507 203 0 67 67
Signature Ridge 531 184 467 283 61 251 190
Stittsville 253 152 224 72 4 4 0
WUC Total 8,578 4,932 7,311 2,380 1,113 1,905 793

WEST URBAN COMMUNITY (WUC) WASTEWATER COLLECTION MODEL DEVELOPMENT &
SYSTEM CAPACITY ASSESSMENT WUC Model Development
May 11, 2012
3.4 kma v:\01-634\active\1634_01026_wuc_wastewater_analysis\planning\report\final\may 2012 rev\rpt_wucww_rev may 2012.docx
3.2.2 2060 WUC Growth Projections
This assessment also considered growth beyond “buildout” (2031) to the year 2060. Projections
for this time frame were provided by the City for four (4) large clusters within the WUC study
area (see Figure 3-2 & Table 3.3). The projections provided are very approximate in nature as
it is admittedly challenging to project how, as well as what type of, growth will occur so far in to
the future. The contributions from these areas were considered when assessing the existing
infrastructure network and establishing 2031/2060 servicing alternative strategies.
Figure 3-2 WUC 2060 Growth Projections.

WEST URBAN COMMUNITY (WUC) WASTEWATER COLLECTION MODEL DEVELOPMENT &
SYSTEM CAPACITY ASSESSMENT WUC Model Development
May 11, 2012
kma v:\01-634\active\1634_01026_wuc_wastewater_analysis\planning\report\final\may 2012 rev\rpt_wucww_rev may 2012.docx 3.5
Table 3.3. WUC 2060 Growth Summary
Location Population Employees (ICI) Effective Area (ha)
March 15,000 0 300
Signature Ridge 10,000 12,500 150
Kanata West 5,000 12,500 150
Stittsville 30,000 0 600
Total WUC 60,000 25,000 1,200
3.2.3 Additional Federal Campus Areas
Generation characteristics from two additional federal campus areas were identified and provided by the City for this assessment as well. These areas are located as shown in Figure 3-3, and were assigned as follows:
• Shirley’s Bay Communications o Upstream and to the East of March PS (manhole ID MHSA12598)
• Energy Mines Resource Campus (EMR) o Along Glen Cairn south of Highway 417 (manhole ID MHSA00704)
Figure 3-3 Additional Federal Campus Areas

��
��
��
��
��
��
��
��
��
��
��
��
��
��
��
��
��
��
��
��
��
��
��
��
��
��
��
��
��
��
��
��
��
KWPSAcres
March
Friendly
Echowood
CWM Carp
Amberwood
Hazeldean
Briarridge
Stittsville
Crystal Beach
Jackson Trail
Hopeside Road
Signature Ridge
Client/Project:
Figure No.:
Title:
3.1
WUCWW Catchment GroupingsCITY OF OTTAWAWUCWW1634-01026 May 2012
1634-01026
!
!
!
!
!
!
��
��
Carp
Donald Munro
��Richmond
��
��
Munster 1
Munster 2
1:34,000
1:53,302
$Legend
Acres
Carp
Hazeldean
Kanata West
March
Munster
Richmond
SRPS
Stittsville
1:34,000
1:34,000

WEST URBAN COMMUNITY (WUC) WASTEWATER COLLECTION MODEL
DEVELOPMENT & SYSTEM CAPACITY ASSESSMENT
kma v:\01-634\active\1634_01026_wuc_wastewater_analysis\planning\report\final\may 2012 rev\rpt_wucww_rev may 2012.docx 4.1
4.0 Loading Parameters & Scenarios Selection
4.1 LOADING PARAMETER SELECTION & GENERATION
In collaboration with the City, the project team selected loading parameter combination
strategies, with the goal of providing the most appropriate flow estimations. The dry weather
flow parameters were maintained from the previous City of Ottawa’s Wastewater Collection
System Dynamic Model assignment carried out by Stantec in 2010. The wet weather
parameters where taken from the Jan 2008 wet weather event. The following sections describe
the loading parameters and scenarios selection process in further detail.
4.1.1 Dry Weather Flow Generation Parameters
The model was loaded with the dry weather flow parameters using the same approach as
described in Sections 2.2.2.2 and 2.2.2.4 of this report. Table 4.1 provides a summary of these
rates which were based on City of Ottawa Sewer Design Guidelines as well as monitored
values.
Table 4.1 Dry Weather Flow Generation Parameters
Flow Generation Rate Type Monitored Based Design Guideline Based
Residential (L/c/d) 200 350
ICI (L/ha/d) 20,000 50,000
4.1.1.1 Groundwater Inflow/Infiltration (GWI) Rates
As discussed in Section 3.0 the loading approach for GWI rates was modified for the WUC
assignment. These rates are now based on an area basis, and are provided in Table 4.2.
Table 4.2 GWI Rate Summary
Location GWI Rate (L/ha/s)
Acres 0.15
Carp 0.02
Hazeldean 0.04
March 0.04
Richmond 0.05
Signature Ridge 0.04
Stittsville 0.02
City of Ottawa Design Guidelines 0.08

WEST URBAN COMMUNITY (WUC) WASTEWATER COLLECTION MODEL DEVELOPMENT &
SYSTEM CAPACITY ASSESSMENT Loading Parameters & Scenarios Selection
May 11, 2012
4.2 kma v:\01-634\active\1634_01026_wuc_wastewater_analysis\planning\report\final\may 2012 rev\rpt_wucww_rev may 2012.docx
4.1.2 Wet Weather Flow Generation Parameters
The January 2008 wet weather event was selected for the wet weather flow parameters as the responses to it were more critical than that of the September 2004 event. The event response summaries for the pump stations where flow monitoring data was provided are show in Table 4.3. The model was setup and run under various scenarios using a combination of January 2008 event and City of Ottawa Sewer Design Guideline rates. Table 4.3 Wet Weather Event Response Comparison
Location September 2004 Event
Monitored Peak Flow (L/s)
January 2008 Event
Monitored Peak Flow (L/s)
Acres 1,393.0 1,843.0
Carp 26.2 25.9
Hazeldean 589.0 759.0
March1 NA 353.0
Richmond 219.0 148.0
Signature Ridge 39.7 43.2
Stittsville 25.7 30.0 1Flow monitoring data provided for the March PS for the September 9, 2004 WWF event was incomplete as this station was flooded
out during this event and useable monitoring data was not available
The assessment of the existing infrastructure was based on the historical monitored responses to the extreme wet weather event of January 2008, as well as the current City of Ottawa Sewer Design Guidelines. The Sewer Design Guidelines are provided as constant rates though, and to apply them as such in the dynamic model would remove the benefit of using such a model. To accommodate both the dynamic nature of the model as well as the City Guideline based rates, design events were generated by pro-rating the monitored January 2008 event response rates (see Table 4.4) such that their peak I/I rates matched with the City of Ottawa Design Guideline rate of 0.28L/ha/s. This approach resulted in an increase, or a decrease, in the applied wet weather I/I rate depending on the location, as shown in Figures 4-1 through 4-7. It should be noted that the monitored dry weather groundwater based infiltration values were assumed constant and were based on flow monitoring data provided. Table 4.4 WWI Rate Summary
Location Peak WWI Rate (L/ha/s)
Acres 0.39
Carp 0.17
Hazeldean 0.37
March 0.35
Richmond 0.47
Signature Ridge 0.18
Stittsville 0.15
City of Ottawa Design Guidelines 0.28
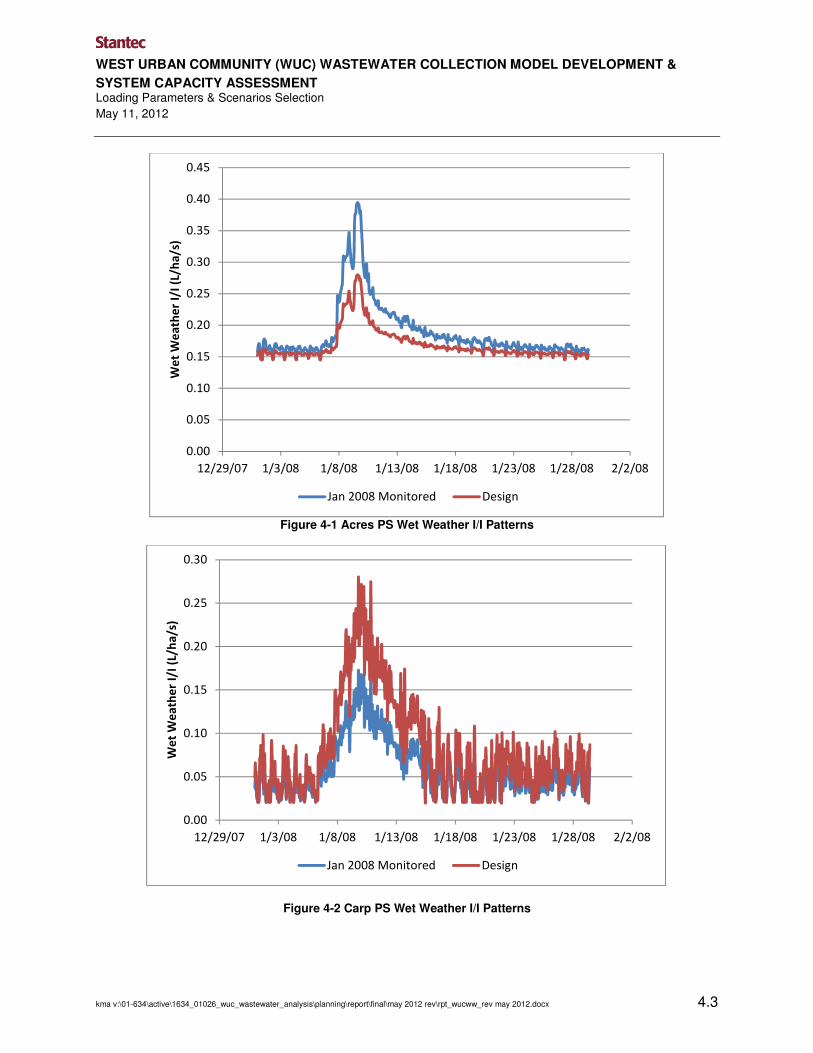
WEST URBAN COMMUNITY (WUC) WASTEWATER COLLECTION MODEL DEVELOPMENT &
SYSTEM CAPACITY ASSESSMENT Loading Parameters & Scenarios Selection
May 11, 2012
kma v:\01-634\active\1634_01026_wuc_wastewater_analysis\planning\report\final\may 2012 rev\rpt_wucww_rev may 2012.docx 4.3
Figure 4-1 Acres PS Wet Weather I/I Patterns
Figure 4-2 Carp PS Wet Weather I/I Patterns
0.00
0.05
0.10
0.15
0.20
0.25
0.30
0.35
0.40
0.45
12/29/07 1/3/08 1/8/08 1/13/08 1/18/08 1/23/08 1/28/08 2/2/08
We
t W
ea
the
r I/
I (L
/ha
/s)
Jan 2008 Monitored Design
0.00
0.05
0.10
0.15
0.20
0.25
0.30
12/29/07 1/3/08 1/8/08 1/13/08 1/18/08 1/23/08 1/28/08 2/2/08
We
t W
ea
the
r I/
I (L
/ha
/s)
Jan 2008 Monitored Design

WEST URBAN COMMUNITY (WUC) WASTEWATER COLLECTION MODEL DEVELOPMENT &
SYSTEM CAPACITY ASSESSMENT Loading Parameters & Scenarios Selection
May 11, 2012
4.4 kma v:\01-634\active\1634_01026_wuc_wastewater_analysis\planning\report\final\may 2012 rev\rpt_wucww_rev may 2012.docx
Figure 4-3 Hazeldean PS Wet Weather I/I Patterns
Figure 4-4 March PS Wet Weather I/I Patterns
0.00
0.05
0.10
0.15
0.20
0.25
0.30
0.35
0.40
12/29/07 1/3/08 1/8/08 1/13/08 1/18/08 1/23/08 1/28/08 2/2/08
We
t W
ea
the
r I/
I (L
/ha
/s)
Jan 2008 Monitored Design
0.00
0.05
0.10
0.15
0.20
0.25
0.30
0.35
0.40
12/29/07 1/3/08 1/8/08 1/13/08 1/18/08 1/23/08 1/28/08 2/2/08
We
t W
ea
the
r I/
I (L
/ha
/s)
Jan 2008 Monitored Design
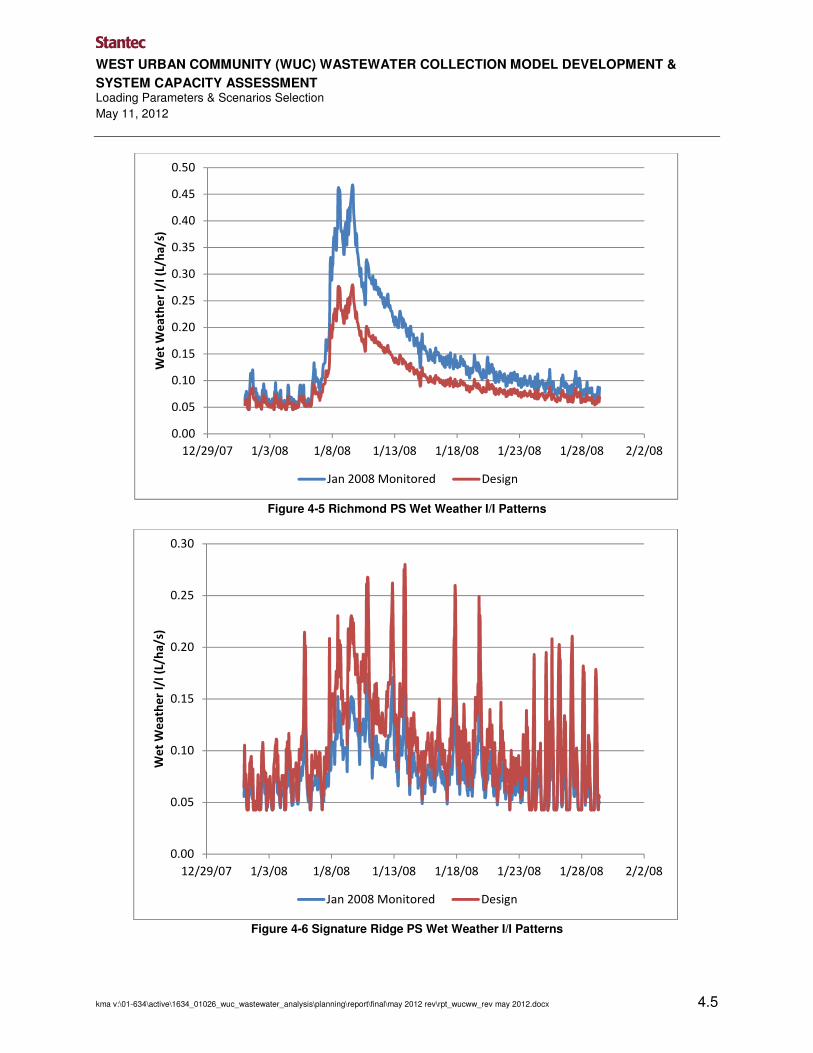
WEST URBAN COMMUNITY (WUC) WASTEWATER COLLECTION MODEL DEVELOPMENT &
SYSTEM CAPACITY ASSESSMENT Loading Parameters & Scenarios Selection
May 11, 2012
kma v:\01-634\active\1634_01026_wuc_wastewater_analysis\planning\report\final\may 2012 rev\rpt_wucww_rev may 2012.docx 4.5
Figure 4-5 Richmond PS Wet Weather I/I Patterns
Figure 4-6 Signature Ridge PS Wet Weather I/I Patterns
0.00
0.05
0.10
0.15
0.20
0.25
0.30
0.35
0.40
0.45
0.50
12/29/07 1/3/08 1/8/08 1/13/08 1/18/08 1/23/08 1/28/08 2/2/08
We
t W
ea
the
r I/
I (L
/ha
/s)
Jan 2008 Monitored Design
0.00
0.05
0.10
0.15
0.20
0.25
0.30
12/29/07 1/3/08 1/8/08 1/13/08 1/18/08 1/23/08 1/28/08 2/2/08
We
t W
ea
the
r I/
I (L
/ha
/s)
Jan 2008 Monitored Design

WEST URBAN COMMUNITY (WUC) WASTEWATER COLLECTION MODEL DEVELOPMENT &
SYSTEM CAPACITY ASSESSMENT Loading Parameters & Scenarios Selection
May 11, 2012
4.6 kma v:\01-634\active\1634_01026_wuc_wastewater_analysis\planning\report\final\may 2012 rev\rpt_wucww_rev may 2012.docx
Figure 4-7 Stittsville PS Wet Weather I/I Patterns
4.2 SCENARIO SELECTION
Following the technical advisory committee (TAC) meeting of November 2010, it was agreed that various flow generating scenarios would be considered in the model runs. These scenarios were to provide a “solution envelope” which would aid in establishing the sensitivity of the sanitary infrastructure. From these initial assessments, a preferred set of parameters were to be selected for further assessments. Following this approach, a number of initial combinations of parameters were selected and evaluated: Scenario 1
• Existing – Monitored Dry Weather Flow + January 2008 Wet Weather Response
• Future – City of Ottawa Sewer Design Guidelines (I/I - 0.28L/ha/s, Residential Generation - 350L/c/d, ICI Generation - 50,000L/ha/d)
Scenario 2
• Existing – Monitored Dry Weather Flow + January 2008 Wet Weather Response
0.00
0.05
0.10
0.15
0.20
0.25
0.30
12/29/07 1/3/08 1/8/08 1/13/08 1/18/08 1/23/08 1/28/08 2/2/08
We
t W
ea
the
r I/
I (L
/ha
/s)
Jan 2008 Monitored Design
WEST URBAN COMMUNITY (WUC) WASTEWATER COLLECTION MODEL DEVELOPMENT &
SYSTEM CAPACITY ASSESSMENT Loading Parameters & Scenarios Selection
May 11, 2012
kma v:\01-634\active\1634_01026_wuc_wastewater_analysis\planning\report\final\may 2012 rev\rpt_wucww_rev may 2012.docx 4.7
• Future – Monitored Dry Weather Flow + January 2008 Wet Weather Response Scenario 3
• Existing – Monitored Dry Weather Flow + January 2008 Wet Weather Response x 1.5
• Future – Monitored Dry Weather Flow + January 2008 Wet Weather Response x 1.5

WEST URBAN COMMUNITY (WUC) WASTEWATER COLLECTION MODEL
DEVELOPMENT & SYSTEM CAPACITY ASSESSMENT
kma v:\01-634\active\1634_01026_wuc_wastewater_analysis\planning\report\final\may 2012 rev\rpt_wucww_rev may 2012.docx 5.1
5.0 Model Results – Existing Infrastructure
Detailed analysis of existing (2010) and buildout (2031) flow conditions were undertaken, and the results from the three scenarios were compared. The results of these three scenarios were tabulated for key locations and are provided in Tables 5-1a and 5-1b, as well as presented on Figure A-1 through A-6 found in Appendix A.
5.1 2010 & 2031 EXISTING INFRASTRUCTURE DEFICIENCIES
Although there are limited deficiencies with the existing infrastructure, there are nonetheless a
few locations that produce problematic results. These areas are visible in the figures presented
in Appendix A.
5.1.1 Tri-Township Collector
Under all scenarios the Tri-Township Collector shows signs of capacity issues.
5.1.2 Signature Ridge & Kanata West
The infrastructure provided in the model draining to these pump stations was based on the
design reports for these areas. There are various differences in the design flow generation rates
between the reports and the approach taken in this assessment. The drainage areas upstream
of these stations are highly ICI in nature and these generation rates can vary substantially.
These differences account for the capacity issues identified under the 2031 scenarios. It should
be noted that these difference do not result in elevated HGL results.
5.1.3 Stittsville Trunk
Under the 2031 scenarios capacity issues are identified along the Stittsville trunk. Under
scenarios 1 and 2, these issues are very minimal and stretch one link of conduit. The issue is a
little worse under scenario 3 loading conditions. There are no HGL issues apparent under any of
the loading scenarios, and therefore the issues seen along this stretch of network are not
deemed significant.
5.1.4 Richmond
Under the 2031 scenarios capacity issues are identified downstream of the industrial lands
expected to develop to the south of the village and drain along King Street. The infrastructure in
the model is based on the Richmond EA which used a significantly lower ICI generation rate
than that used in this assessment. There are no HGL issues apparent under any of the loading
scenarios, and therefore the issues seen along this stretch of network are not deemed
significant.

WEST URBAN COMMUNITY (WUC) WASTEWATER COLLECTION MODEL DEVELOPMENT & SYSTEM CAPACITY
ASSESSMENT
kma v:\01-634\active\1634_01026_wuc_wastewater_analysis\planning\report\final\may 2012 rev\rpt_wucww_rev may 2012.docx 5.1
5-1a WUC Model Run Results – Pumping Station Infrastructure (2010 & 2031)
Location
Firm Capacity
Source
Scenario 1 Scenario 2 Scenario 3
(L/s) 2010 (L/s)
2031 (L/s)
Flow Increase 2010
(L/s) 2031 (L/s)
Flow Increase 2010
(L/s) 2031 (L/s)
Flow Increase
(2010 to
2031)(L/s) (2010 to
2031)(L/s) (2010 to
2031)(L/s)
Acres PS 4,600 Certificate of Approval 2,119 4,186 2,067 2,119 3,774 1,655 2,750 4,437 1,688
Briarridge PS 53 Operation/Maintenance Manual 32 82 50 32 66 34 42 87 45
Carp PS 91 Carp EA (Stantec 2008) 26 74 48 26 54 28 36 73 37
Crystal Beach PS 280 Operation/Maintenance Manual 241 258 17 241 252 11 294 305 11
DBMunro PS 12 Carp EA (Stantec 2008) 1 7 6 1 4 3 1 5 3
Friendly PS 6 Operation/Maintenance Manual 2 60 58 2 34 32 2 39 37
Hazeldean PS 1,200 Hazeldean Capacity Upgrade (Stantec
2010) 832 1,533 701 832 1,373 541 1,084 1,741 657
Hopeside PS 24 Operation/Maintenance Manual 9 47 38 9 40 31 11 49 39
Jackson PS 56 Operation/Maintenance Manual 27 83 56 27 67 41 35 85 50
March PS 490 North Kanata Sanitary Sewage Infrastructure Upgrade Study -
Functional Design Report (RVA 2001) 96 172 76 96 141 45 132 187 56
Richmond PS 360 Richmond Master Servicing Study +
EA (Stantec 2010) 151 340 190 151 314 163 215 407 193
SRPS 360 SRPS Functional Design (RVA 2010) 54 309 254 54 218 164 81 256 174
Stittsville PS 108 Operation/Maintenance Manual 39 106 67 39 77 38 49 91 42
KWPS 765 KWCP Master Servicing Study
(Stantec/CCL/IBI 2005) 152 593 440 152 462 309 193 561 368
Hazeldean + KWPS + SRPS
2325 1,039 2,435 1,396 1,039 2,053 1,014 1,358 2,558 1,200

WEST URBAN COMMUNITY (WUC) WASTEWATER COLLECTION MODEL DEVELOPMENT & SYSTEM CAPACITY ASSESSMENT Model Results – Existing Infrastructure May 11, 2012
5.2 mat w:\active\1634_01026_wuc_wastewater_analysis\planning\report\final\may 2012 rev\rpt_wucww_rev may 2012.docx
5-1b WUC Model Run Results – Trunk Sewer Infrastructure (2010 & 2031)
Location
Scenario 1 Scenario 2 Scenario 3
2010 (L/s) 2031 (L/s) Flow Increase (2010 to 2031)
(L/s) 2010 (L/s) 2031 (L/s)
Flow Increase (2010 to 2031)
(L/s) 2010 (L/s) 2031 (L/s)
Flow Increase (2010 to 2031)
(L/s)
Glen Cairn Trunk (SAN00722) 1,139 2,512 1,373 1,139 2,192 1,052 1,555 2,758 1,203
Main Street Trunk (SAN11814) 138 330 192 138 237 99 170 304 134
Penfield Trunk (SAN11716) 170 360 190 170 267 97 210 342 133
March Ridge (Above March FM) (SAN00952)
245 434 189 245 339 94 301 428 127
March Ridge (Below March FM) (SAN00943)
245 434 189 245 342 97 301 428 127
Tri-Township Collector (SAN01649) 1,380 2,3821 1,002 1,380 2,3821 1,002 1,840 2,3821 541
1,380 3,001 1,621 1,380 2,588 1,208 1,840 3,252 1,411
Watts Creek Collector (SAN01703) 1,891 3,3321 1,441 1,891 3,2221 1,331 2,476 3,4201 944
1,891 3,951 2,060 1,891 3,428 1,537 2,476 4,290 1,814
Marchwood Trunk (SAN01148) 230 574 343 230 502 272 313 608 295
East March Trunk (SAN12617) 96 172 76 96 141 45 132 187 56
North Kanata Trunk Phase 1 (SAN01639)
1,705 3,1361 1,431 1,705 3,0301 1,325 2,247 3,2021 955
1,705 3,755 2,050 1,705 3,236 1,531 2,247 4,072 1,825
North Kanata Trunk Phase 2(CON59) 339 755 416 339 657 317 463 820 357
Fernbank Trunk (CON60) - 383 383 - 311 311 - 388 388
Nepean Collector (SAN01181) 190 197 8 190 193 3 231 234 3
Kakulu Sewer (SAN12383) 55 55 0 55 55 0 66 65 0
Stittsville Trunk 358 485 127 358 444 86 472 572 100
1Under existing conditions there is a bottleneck along the Tri-Township Collector upstream of the North Kanata junction. This bottleneck results in an elevated hydraulic grade line that causes surface flooding downstream of the Watt’s Creek siphon. For the purposes of this assignment, this lost flow has been conveyed downstream such that the ultimate flows downstream of this problematic location are appropriate and representative.
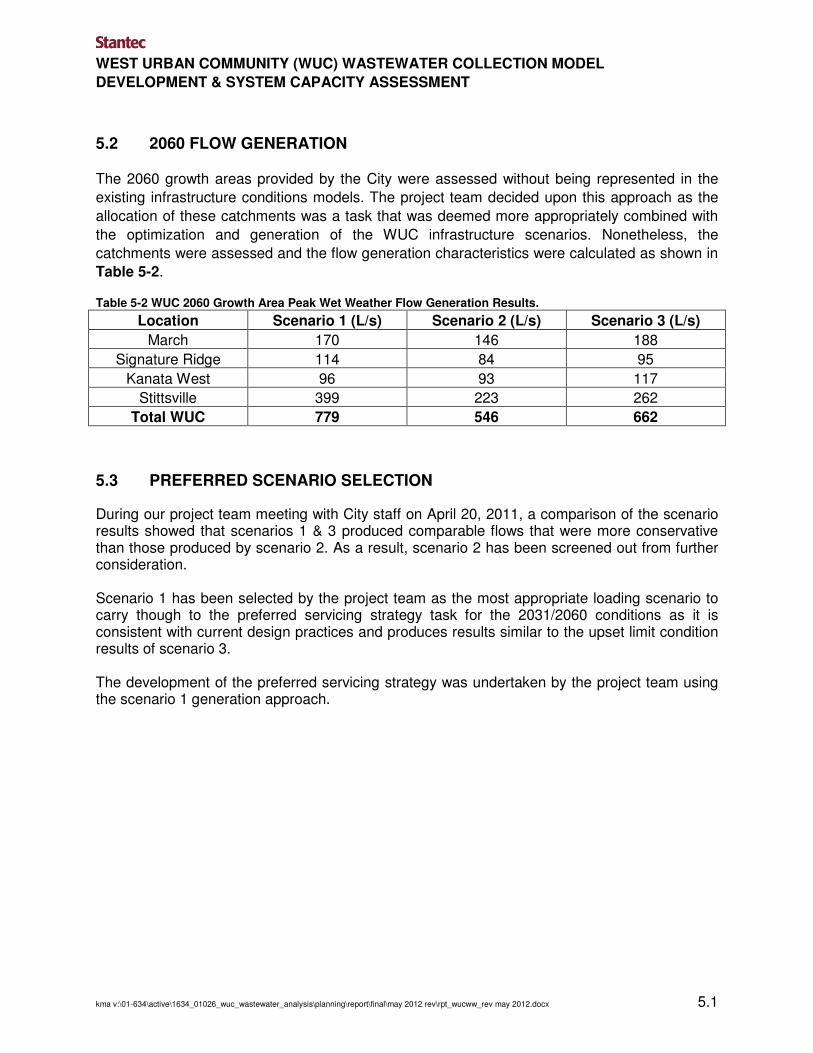
WEST URBAN COMMUNITY (WUC) WASTEWATER COLLECTION MODEL
DEVELOPMENT & SYSTEM CAPACITY ASSESSMENT
kma v:\01-634\active\1634_01026_wuc_wastewater_analysis\planning\report\final\may 2012 rev\rpt_wucww_rev may 2012.docx 5.1
5.2 2060 FLOW GENERATION
The 2060 growth areas provided by the City were assessed without being represented in the
existing infrastructure conditions models. The project team decided upon this approach as the
allocation of these catchments was a task that was deemed more appropriately combined with
the optimization and generation of the WUC infrastructure scenarios. Nonetheless, the
catchments were assessed and the flow generation characteristics were calculated as shown in
Table 5-2.
Table 5-2 WUC 2060 Growth Area Peak Wet Weather Flow Generation Results.
Location Scenario 1 (L/s) Scenario 2 (L/s) Scenario 3 (L/s)
March 170 146 188
Signature Ridge 114 84 95
Kanata West 96 93 117
Stittsville 399 223 262
Total WUC 779 546 662
5.3 PREFERRED SCENARIO SELECTION
During our project team meeting with City staff on April 20, 2011, a comparison of the scenario results showed that scenarios 1 & 3 produced comparable flows that were more conservative than those produced by scenario 2. As a result, scenario 2 has been screened out from further consideration. Scenario 1 has been selected by the project team as the most appropriate loading scenario to carry though to the preferred servicing strategy task for the 2031/2060 conditions as it is consistent with current design practices and produces results similar to the upset limit condition results of scenario 3. The development of the preferred servicing strategy was undertaken by the project team using the scenario 1 generation approach.

APPENDIX C Technical Screening – sewer calculation

WEST URBAN COMMUNITY MASTER SERVICING STUDYTABLE C-1 : EXISTING CAPACITY AND PROJECTED FLOWS / STRATEGY ANALYSISCITY OF OTTAWA
A B C A B A B
(Year) 2010 2011 2031 2060 2031 2060 2031 2060 2031 2031 2031 2031 2031 2031 2031(L/s) (L/s) (L/s) (L/s) (L/s) (L/s) (L/s) (L/s) (L/s) (L/s) (L/s) (L/s) (L/s) (L/s) (L/s) (L/s)
Richmond Pump Station 360 151 340 340 314 314 407 407 340 340 340 340 340 340 340
Stittsville PS 108 39 106 506 77 300 91 353 106 106 106 106 106 106 106
Hazeldean Pump Station 1225 832 1537 1937 1373 1596 1741 2003 1537 1207 1207 O O 1537 3049
Kanata West Pump Station 765 152 593 689 462 555 561 678 593 923 923 O O 593 O
Signature Ridge Pump Station 360 54 309 423 218 302 256 351 309 309 309 O O 309 O
March Pump Station 490 326 771 941 668 814 820 1008 197 197 197 197 197 197 197
Acres Road Pump Station 4600 2119 4186 4966 3774 4320 4437 5099 4186 4186 4186 4186 4186 2649 1137
Glen Cairn Trunk2815 to
29881139 2512 3008 2192 2508 2758 3137 2512 2512 2512 382 382 975 340
Stittsville Trunk 519 to 972 358 485 885 444 679 572 732 485 155 155 485 485 485 485
NEW Fernbank Trunk 0 0 0 0 0 0 0
NEW Interceptor Sewer form Stittsville/Fernbank Trunk to KW
PS330 330 1537 1537
Main Street Sewer 307 to 739 138 330 444 237 321 342 399 330 330 330 161 161 330 161
Penfield Sewer 398 to 734 170 360 474 267 351 342 437 360 360 360 191 191 360 191
March Ridge Trunk (Above March Forcemain)
1223 245 434 548 339 423 428 523 434 434 434 265 265 434 265
March Ridge Trunk (Below March Forcemain)
1016 571 1205 1489 1007 1237 1248 1531 434 434 434 290 290 434 265
Watts Creek Siphon 1014 571 1205 1489 1007 1237 1248 1531 434 434 434 265 265 434 265
Tri-Township Collector 1705 3717 4497 3199 3745 4006 4668 2946 2946 2946 3086 3086 1409 605
March Wood Trunk 1100 230 574 705 502 616 608 752 574 574 574 574 574 574 574
East March Trunk 550 96 172 211 141 173 187 231 172 172 172 172 172 172 172
North Kanata Trunk - Phase II
North Kanata Trunk-Phase 14047 to
46401705 3717 4497 3199 3745 4006 4668 3717 3717 3717 3832 3832 2180 1376
Nepean Collector590
190 197 197 193 193 234 234 197 197 197 197 197 197 197
Watt's Creek Trunk5418 to
66401891 3914 4694 3392 3938 4240 4902 3914 3914 3914 4029 4029 2377 1573
CURRENT SEWER CONFIGURATION
PUMPING STATION OR TRUNK SEWER
FIR
M C
AP
AC
ITY
EX
IST
ING
C
AP
AC
ITY
ST
RA
TE
GY
3
proposed replacement 1650mm diam., 4700L/s capacity
Flow Scenario 3Scenario 2Scenario 1
AB
AN
DO
NE
D (
ins
uff
icie
nt
slo
pe
av
ail
ab
le)
designed capacity: 670L/s
designed capacity: 800L/s (1B), 2200L/s (1C & 2A, 2B)
Development of Strategies for SCENARIO 1
STRATEGY 1 - Options STRATEGY 2 -
OptionsSTRATEGY 4 -
Options
STUDY REPORT ‐ JULY 2012
RVA 102174 WUC‐WASTEWATER COLLECTION SYSTEM / MASTER SERVICING PLAN
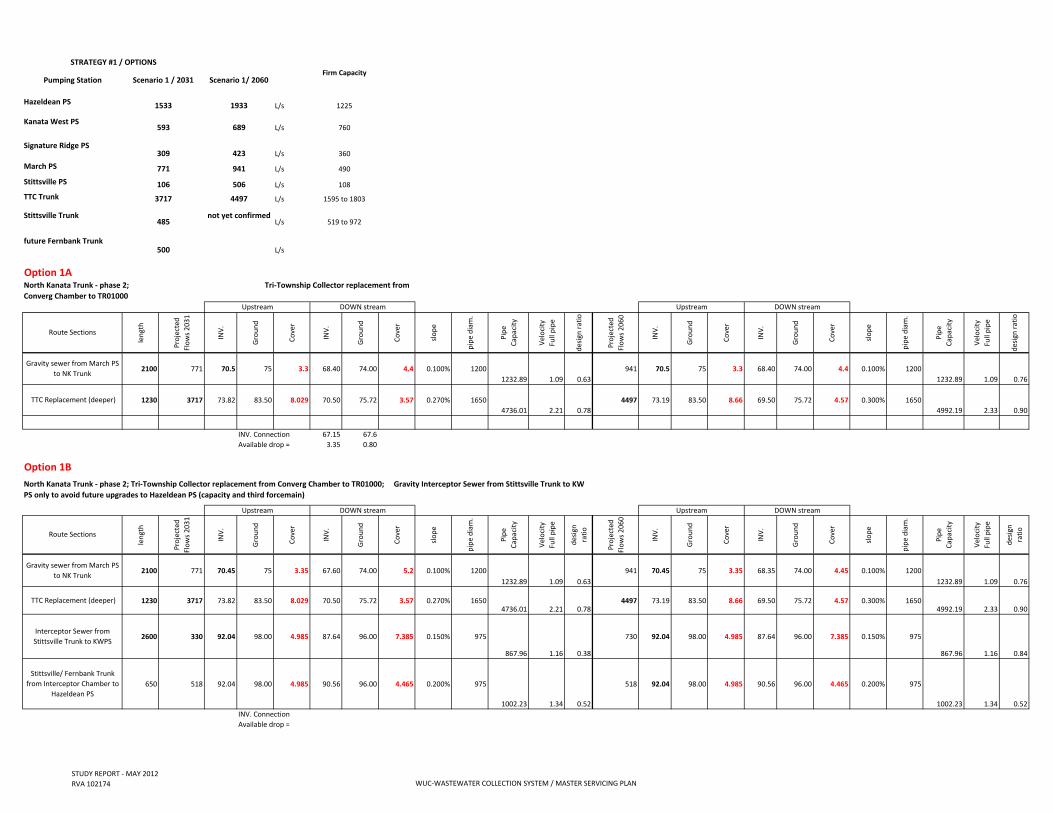
L/s
L/s
L/s
L/s
L/s
L/s
L/s
L/s
Option 1A
length
Projected
Flows 2031
INV.
Ground
Cover
INV.
Ground
Cover
slope
pipe diam.
Pipe
Cap
acity
Velocity
Full pipe
design ratio
Projected
Flows 2060
INV.
Ground
Cover
INV.
Ground
Cover
slope
pipe diam.
Pipe
Cap
acity
Velocity
Full pipe
design ratio
2100 771 70.5 75 3.3 68.40 74.00 4.4 0.100% 1200
1232.89 1.09 0.63
941 70.5 75 3.3 68.40 74.00 4.4 0.100% 1200
1232.89 1.09 0.76
1230 3717 73.82 83.50 8.029 70.50 75.72 3.57 0.270% 1650
4736.01 2.21 0.78
4497 73.19 83.50 8.66 69.50 75.72 4.57 0.300% 1650
4992.19 2.33 0.90
67.15 67.6
3.35 0.80
Option 1B
length
Projected
Flows 2031
INV.
Ground
Cover
INV.
Ground
Cover
slope
pipe diam.
Pipe
Cap
acity
Velocity
Full pipe
design
ratio
Projected
Flows 2060
INV.
Ground
Cover
INV.
Ground
Cover
slope
pipe diam.
Pipe
Cap
acity
Velocity
Full pipe
design
ratio
2100 771 70.45 75 3.35 67.60 74.00 5.2 0.100% 1200
1232.89 1.09 0.63
941 70.45 75 3.35 68.35 74.00 4.45 0.100% 1200
1232.89 1.09 0.76
1230 3717 73.82 83.50 8.029 70.50 75.72 3.57 0.270% 16504736.01 2.21 0.78
4497 73.19 83.50 8.66 69.50 75.72 4.57 0.300% 16504992.19 2.33 0.90
2600 330 92.04 98.00 4.985 87.64 96.00 7.385 0.150% 975
867.96 1.16 0.38
730 92.04 98.00 4.985 87.64 96.00 7.385 0.150% 975
867.96 1.16 0.84
650 518 92.04 98.00 4.985 90.56 96.00 4.465 0.200% 975
1002.23 1.34 0.52
518 92.04 98.00 4.985 90.56 96.00 4.465 0.200% 975
1002.23 1.34 0.52
TTC Replacement (deeper)
North Kanata Trunk ‐ phase 2; Tri‐Township Collector replacement from Converg Chamber to TR01000; Gravity Interceptor Sewer from Stittsville Trunk to KW
PS only to avoid future upgrades to Hazeldean PS (capacity and third forcemain)
106
INV. Connection
Available drop =
North Kanata Trunk ‐ phase 2; Tri‐Township Collector replacement from
Converg Chamber to TR01000
3717TTC Trunk
March PS
Signature Ridge PS
Kanata West PS
future Fernbank Trunk
Hazeldean PS
Scenario 1 / 2031
UpstreamUpstream DOWN stream
Scenario 1/ 2060
771
593
Stittsville Trunk
689
1933
941
DOWN stream
108506
4497
not yet confirmed
309 423
500
485
1595 to 1803
Upstream
INV. Connection
Available drop =
Upstream
Stittsville/ Fernbank Trunk
from Interceptor Chamber to
Hazeldean PS
Interceptor Sewer from
Stittsville Trunk to KWPS
Route Sections
Gravity sewer from March PS
to NK Trunk
TTC Replacement (deeper)
DOWN streamDOWN stream
Firm Capacity
490
360
760
1225
519 to 972
STRATEGY #1 / OPTIONS
Pumping Station
Route Sections
Gravity sewer from March PS
to NK Trunk
1533
Stittsville PS
STUDY REPORT ‐ MAY 2012
RVA 102174 WUC‐WASTEWATER COLLECTION SYSTEM / MASTER SERVICING PLAN

Option 1C
length
Projected
Flows 2031
INV.
Ground
Cover
INV.
Ground
Cover
slope
pipe diam.
Pipe
Cap
acity
Velocity
Full pipe
design ratio
Projected
Flows 2060
INV.
Ground
Cover
INV.
Ground
Cover
slope
pipe diam.
Pipe
Cap
acity
Velocity
Full pipe
design ratio
2100 771 70.45 75 3.35 67.60 74.00 5.2 0.100% 12001232.89 1.09 0.63
941 70.45 75 3.35 68.35 74.00 4.45 0.100% 12001232.89 1.09 0.76
1230 3717 73.82 83.50 8.029 70.50 75.72 3.57 0.270% 16504736.01 2.21 0.78
4497 73.19 83.50 8.66 69.50 75.72 4.57 0.300% 16504992.19 2.33 0.90
2600 1533 86.74 98.00 9.76 83.64 96.00 10.86 0.100% 1500
2235.37 1.26 0.69
1933 86.74 98.00 9.76 83.64 96.00 10.86 0.100% 1500
2235.37 1.26 0.86
650 518 92.04 98.00 4.985 90.56 96.00 4.465 0.200% 975
1002.23 1.34 0.52
518 92.04 98.00 4.985 90.56 96.00 4.465 0.200% 975
1002.23 1.34 0.52
Upstream
North Kanata Trunk ‐ phase 2; Tri‐Township Collector replacement from Converg Chamber to TR01000; Gravity Interceptor Sewer from Hazeldean PS to KW PS
to allow in the future for the ultimate gravitational option for the entire WUC sanitrary sewer system
DOWN stream
INV. Connection
Gravity sewer from March PS
to NK Trunk
TTC Replacement (deeper)
Upstream DOWN stream
Available drop =
Interceptor Sewer from
Stittsville Trunk to KWPS
Stittsville/ Fernbank Trunk
from Interceptor Chamber to
Hazeldean PS
Route Sections
STUDY REPORT ‐ MAY 2012
RVA 102174 WUC‐WASTEWATER COLLECTION SYSTEM / MASTER SERVICING PLAN
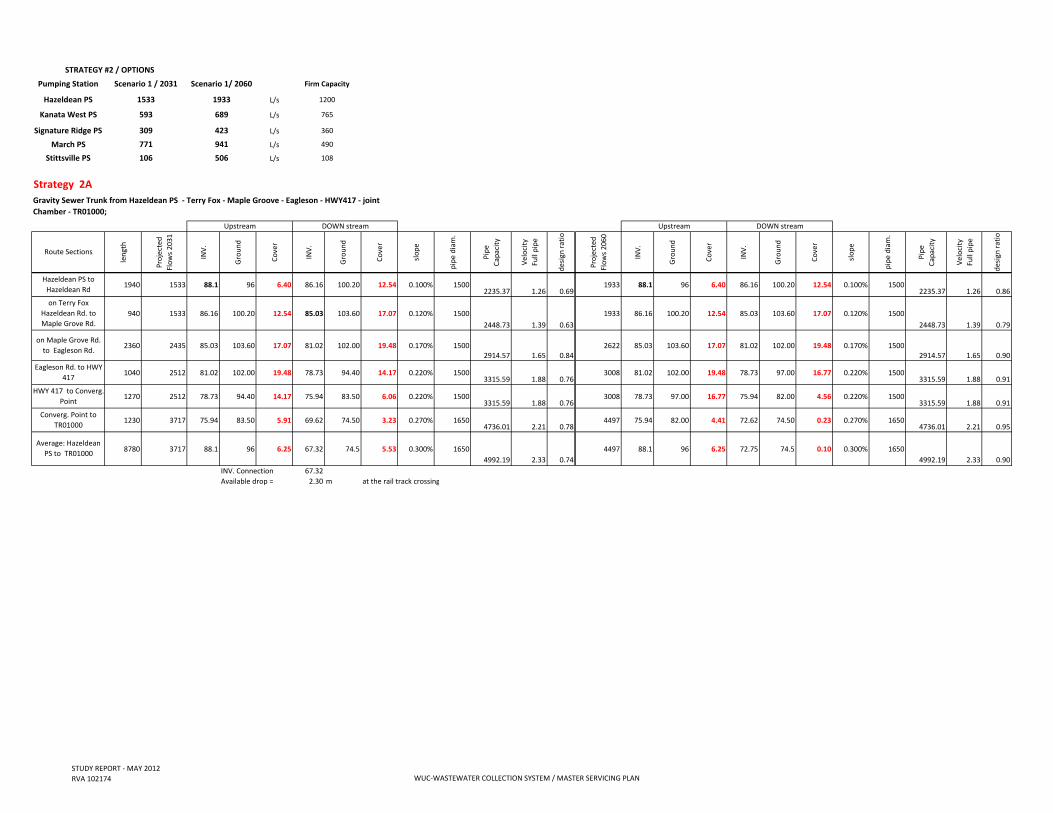
L/s
L/s
L/s
L/s
L/s
Strategy 2A
length
Projected
Flows 2031
INV.
Ground
Cover
INV.
Ground
Cover
slope
pipe diam.
Pipe
Capacity
Velocity
Full pipe
design
ratio
Projected
Flows 2060
INV.
Ground
Cover
INV.
Ground
Cover
slope
pipe diam.
Pipe
Capacity
Velocity
Full pipe
design
ratio
1940 1533 88.1 96 6.40 86.16 100.20 12.54 0.100% 15002235.37 1.26 0.69
1933 88.1 96 6.40 86.16 100.20 12.54 0.100% 15002235.37 1.26 0.86
940 1533 86.16 100.20 12.54 85.03 103.60 17.07 0.120% 1500
2448.73 1.39 0.63
1933 86.16 100.20 12.54 85.03 103.60 17.07 0.120% 1500
2448.73 1.39 0.79
2360 2435 85.03 103.60 17.07 81.02 102.00 19.48 0.170% 15002914.57 1.65 0.84
2622 85.03 103.60 17.07 81.02 102.00 19.48 0.170% 15002914.57 1.65 0.90
1040 2512 81.02 102.00 19.48 78.73 94.40 14.17 0.220% 15003315.59 1.88 0.76
3008 81.02 102.00 19.48 78.73 97.00 16.77 0.220% 15003315.59 1.88 0.91
1270 2512 78.73 94.40 14.17 75.94 83.50 6.06 0.220% 15003315.59 1.88 0.76
3008 78.73 97.00 16.77 75.94 82.00 4.56 0.220% 15003315.59 1.88 0.91
1230 3717 75.94 83.50 5.91 69.62 74.50 3.23 0.270% 16504736.01 2.21 0.78
4497 75.94 82.00 4.41 72.62 74.50 0.23 0.270% 16504736.01 2.21 0.95
8780 3717 88.1 96 6.25 67.32 74.5 5.53 0.300% 1650
4992.19 2.33 0.74
4497 88.1 96 6.25 72.75 74.5 0.10 0.300% 1650
4992.19 2.33 0.90
67.32
2.30 m at the rail track crossing
309
Upstream
Hazeldean PS to
Hazeldean Rd
360
490
Stittsville PS 106 506 108
Gravity Sewer Trunk from Hazeldean PS ‐ Terry Fox ‐ Maple Groove ‐ Eagleson ‐ HWY417 ‐ joint
Chamber ‐ TR01000;
DOWN stream
Route Sections
Upstream
Available drop =
on Terry Fox
Hazeldean Rd. to
Maple Grove Rd.
on Maple Grove Rd.
to Eagleson Rd.
Eagleson Rd. to HWY
417
HWY 417 to Converg.
Point
Converg. Point to
TR01000
Average: Hazeldean
PS to TR01000
DOWN stream
INV. Connection
Scenario 1/ 2060
941
423
689
1933
Firm Capacity
1200
765
STRATEGY #2 / OPTIONS
1533
March PS
Signature Ridge PS
Kanata West PS
Hazeldean PS
Pumping Station Scenario 1 / 2031
771
593
STUDY REPORT ‐ MAY 2012
RVA 102174 WUC‐WASTEWATER COLLECTION SYSTEM / MASTER SERVICING PLAN

Strategy 2B
length
Projected
Flows 2031
INV.
Ground
Cover
INV.
Ground
Cover
slope
pipe diam.
Pipe
Capacity
Velocity
Full pipe
design
ratio
Projected
Flows 2060
INV.
Ground
Cover
INV.
Ground
Cover
slope
pipe diam.
Pipe
Capacity
Velocity
Full pipe
design
ratio
1940 1533 88.1 96 6.40 86.16 100.20 12.54 0.100% 15002235.37 1.26 0.69
1933 88.1 96 6.40 86.16 100.20 12.54 0.100% 15002235.37 1.26 0.86
940 1533 86.16 100.20 12.54 85.03 103.60 17.07 0.120% 1500
2448.73 1.39 0.63
1933 86.16 100.20 12.54 85.03 103.60 17.07 0.120% 1500
2448.73 1.39 0.79
2360 2435 85.03 103.60 17.07 81.02 102.00 19.48 0.170% 1500
2914.57 1.65 0.84
2622 85.03 103.60 17.07 81.02 102.00 19.48 0.170% 1500
2914.57 1.65 0.90
1040 2512 81.02 102.00 19.48 78.73 94.40 14.17 0.220% 15003315.59 1.88 0.76
3008 81.02 102.00 19.48 78.73 97.00 16.77 0.220% 15003315.59 1.88 0.91
1270 2512 78.73 94.40 14.17 75.94 83.50 6.06 0.220% 15003315.59 1.88 0.76
3008 78.73 97.00 16.77 75.94 82.00 4.56 0.220% 15003315.59 1.88 0.91
1230 3717 75.94 83.50 5.91 69.25 74.50 3.60 0.300% 16504992.19 2.33 0.74
4497 75.94 82.00 4.41 72.25 75.77 1.87 0.300% 16504992.19 2.33 0.90
8780 3717 88.1 96 6.25 67.32 74.5 5.53 0.300% 1650
4992.19 2.33 0.74
4497 88.1 96 6.25 72.75 75.77 1.37 0.300% 1650
4992.19 2.33 0.90
67.32
1.93 m at the rail track crossing
Strategy 2
length
Projecte
d Flows
2031
INV.
Ground
Cover
INV.
Ground
Cover
slope
pipe
diam.
Pipe
Capacity
Velocity
Full pipe
design
ratio
Projecte
d Flows
2060
INV.
Ground
Cover
INV.
Ground
Cover
slope
pipe
diam.
Pipe
Capacity
Velocity
Full pipe
design
ratio
800 765 86.5 94 6.45 85.54 100.20 13.61 0.120% 1050
945.95 1.09 0.81
689 88.1 96 6.85 87.14 100.20 12.01 0.120% 1050
945.95 1.09 0.73
1850 309 87.55 94.00 5.625 85.70 96.90 10.375 0.100% 825
453.92 0.85 0.68
423 87.55 100.20 11.825 85.70 103.60 17.075 0.100% 825
453.92 0.85 0.93
3060 1533 88.10 96.00 6.4 85.04 96.00 9.46 0.100% 1500
2235.37 1.26 0.69
1933 88.10 103.60 14 85.04 104.60 18.06 0.100% 1500
2235.37 1.26 0.86
Hazeldean PS to KW
PS location taking
corridor #7 through
the field
Gravity Sewer Trunk from Hazeldean PS ‐ Terry Fox ‐ Maple Groove ‐ Eagleson ‐ HWY417 ‐ joint
Chamber ‐ TR01000;
New PS at Eagleson / Kakulu
First portion of the gravity tunnel to be built between the proposed location of KW PS to the Glen Cairn Trunk at Eagleson (through Maple Grove Rd. Easement). A low
lifting PS will be needed at Eagleson/Kakulu to discharge in the exisitng Glen Cairn Trunk.
KWPS to Maple
Grove/Terry Fox
DOWN stream
HWY 417 to Converg.
Point
on Maple Grove Rd.
to Eagleson Rd.
Upstream
Route Sections
Hazeldean PS to Terry
Fox to Hazeldean Rd
Eagleson Rd. to HWY
417
The rest of the gravity sewer from Hazeldean to Maple Groove/Terry Fox, and from SR PS to Seven Silver/Maple Groove to be built in the following years based on the
projection growth and PS needs
on Terry Fox
Hazeldean Rd. to
Maple Grove Rd.
Available drop =
Upstream DOWN streamDOWN stream Upstream
Part of the Strategy are the gravity sewers from SR PS to Maple Groove Rd. and from proposed KW
PS to Maple Groove / Terry Fox as well as an alternative for sewer from Hazeldean PS to KW PS
through corridor #7
Average: Hazeldean
PS to TR01000
INV. Connection
Upstream
SR PS to Maple
Groove/Silver Seven
Route Sections
Converg. Point to
TR01000
DOWN stream
STUDY REPORT ‐ MAY 2012
RVA 102174 WUC‐WASTEWATER COLLECTION SYSTEM / MASTER SERVICING PLAN

L/s
L/s
L/s
L/s
L/s
Option 4A
length
Projected
Flows 2031
INV.
Ground
Cover
INV.
Ground
Cover
slope
pipe diam.
Pipe
Capacity
Velocity
Full pipe
design
ratio
Projected
Flows 2060
INV.
Ground
Cover
INV.
Ground
Cover
slope
pipe diam.
Pipe
Capacity
Velocity
Full pipe
design
ratio
1650 1533 105 109 2.5 103.02 114.00 9.48 0.120% 15002448.73 1.39 0.63
1933 105 109 2.5 103.02 114.00 9.48 0.120% 15002448.73 1.39 0.79
2130 1533 100.02 114.00 12.48 97.46 111.70 12.736 0.120% 15002448.73 1.39 0.63
1933 103.02 114.00 9.48 98.96 111.70 11.236 0.120% 15002448.73 1.39 0.79
2230 1533 94.46 111.70 15.736 91.79 96.00 2.712 0.120% 1500
2448.73 1.39 0.63
1933 98.96 111.70 11.236 94.29 96.00 0.212 0.120% 1500
2448.73 1.39 0.79
1100 1533 88.79 96.00 5.712 87.69 94.00 4.812 0.100% 15002235.37 1.26 0.69
1933 91.29 96.00 3.212 90.19 94.00 2.312 0.100% 15002235.37 1.26 0.86
1950 1533 84.69 94.00 7.812 82.74 96.00 11.762 0.100% 1500
2235.37 1.26 0.69
1933 87.19 94.00 5.312 85.24 96.00 9.262 0.100% 1500
2235.37 1.26 0.86
1400 1533 80.74 96.00 13.762 79.06 82.00 1.442 0.120% 15002448.73 1.39 0.63
1933 82.24 94.00 10.262 80.56 82.00 ‐0.058 0.120% 15002448.73 1.39 0.79
10460 1533 88.1 94 4.4 78.78 94 13.72 0.150% 1500
2737.76 1.55 0.56
1933 88.1 94 4.4 78.78 94 13.72 0.100% 1500
2235.37 1.26 0.86
Estimated Nr. of MH 20 0.6 78.18 78.18
0 0.88 m 2.38 m
3455 1533 82.74 96.00 11.912 77.56 96.00 17.0945 0.150% 1350
2067.17 1.44 0.74
1933 85.24 96.00 9.412 80.06 96.00 14.5945 0.150% 1350
2067.17 1.44 0.94
75.34 75.34
2.22 m 4.72
Firm Capacity
1200
765
360
Eagleson to
Richmond via
pathway
on Hunt Club from
HWY 416 to
Greeenbank
INV. Connection
Available drop =
Available drop =
INV. Connection
on Hunt Club from
Richmond to HWY
416
INV. Connection
Available drop =
on Greenbank to
Lynwood
to Lynwood at
Woodroffe
crossing HWY 416
Average: Hazeldean
PS to LC01000
Stittsville PS 106 506
Upstream
108
DOWN stream
Route Sections
Gravity Sewer Trunk from Eagleson‐Pathway‐Richmond‐Hunt Club‐Greenbank / or Woodroffe
Upstream DOWN stream
593 689
Signature Ridge PS 309 423
941March PS 771 490
STRATEGY #4 / OPTIONS
Available drop =
Pumping Station Scenario 1 / 2031 Scenario 1/ 2060
Hazeldean PS 1533 1933
Kanata West PS
INV. Connection
STUDY REPORT ‐ MAY 2012
RVA 102174 WUC ‐ WASTEWATER COLLECTION SYSTEM / MASTER SERVICING PLAN 1

Option 4B
length
Projected
Flows 2031
INV.
Ground
Cover
INV.
Ground
Cover
slope
pipe diam.
Pipe
Capacity
Velocity
Full pipe
design
ratio
Projected
Flows 2060
INV.
Ground
Cover
INV.
Ground
Cover
slope
pipe diam.
Pipe
Capacity
Velocity
Full pipe
design
ratio
1650 2435 105 109 2.5 101.37 114.00 11.13 0.220% 15003315.59 1.88 0.73
3121 105 109 2.5 101.37 114.00 11.13 0.220% 15003315.59 1.88 0.94
2130 2435 101.37 114.00 11.13 96.68 111.70 13.516 0.220% 15003315.59 1.88 0.73
3121 101.37 114.00 11.13 96.68 111.70 13.516 0.220% 15003315.59 1.88 0.94
2230 2435 96.68 111.70 13.516 91.78 96.00 2.722 0.220% 1500
3315.59 1.88 0.73
3121 96.68 111.70 13.516 91.78 96.00 2.722 0.220% 1500
3315.59 1.88 0.94
1100 2435 90.78 96.00 3.722 88.36 94.00 4.142 0.220% 1500
3315.59 1.88 0.73
3121 90.78 96.00 3.722 88.36 94.00 4.142 0.220% 1500
3315.59 1.88 0.94
1950 2435 87.36 94.00 5.142 83.07 96.00 11.432 0.220% 15003315.59 1.88 0.73
3121 87.36 94.00 5.142 83.07 96.00 11.432 0.220% 15003315.59 1.88 0.94
1400 2435 83.07 96.00 11.432 79.99 82.00 0.512 0.220% 1500
3315.59 1.88 0.73
3121 83.07 96.00 11.432 79.99 82.00 0.512 0.220% 1500
3315.59 1.88 0.94
10460 2435 88.1 94 4.4 78.78 94 13.72 0.220% 15003315.59 1.88 0.73
3121 88.1 94 4.4 78.78 94 13.72 0.220% 15003315.59 1.88 0.94
Estimated Nr. of MH 20 0.6 78.18 78.18
0 1.81 m 1.81 m
3455 2435 83.07 96.00 11.432 75.47 82.00 5.033 0.220% 1500
3315.59 1.88 0.73
3121 83.07 96.00 11.432 75.47 82.00 5.033 0.220% 1500
3315.59 1.88 0.94
75.34 75.34
0.13 0.13
length
Projected
Flows 2031
INV.
Ground
Cover
INV.
Ground
Cover
slope
pipe diam.
Pipe
Capacity
Velocity
Full pipe
design
ratio
Projected
Flows 2060
INV.
Ground
Cover
INV.
Ground
Cover
slope
pipe diam.
Pipe
Capacity
Velocity
Full pipe
design
ratio
1850 309 87.55 94.00 5.625 85.70 96.90 10.375 0.100% 825453.92 0.85 0.68
423 87.55 94.00 5.625 85.70 96.90 10.375 0.100% 825453.92 0.85 0.93
3280 902 85.33 96.00 9.475 81.39 96.00 13.411 0.120% 1200
1350.56 1.19 0.67
1188 85.70 96.90 10 81.76 96.00 13.036 0.120% 1200
1350.56 1.19 0.88
88.1
‐6.71
23.61
Average: Hazeldean
PS to LC01000
crossing HWY 416
on Hunt Club from
HWY 416 to
Greeenbank
Route Sections
Eagleson to
Richmond via
pathway
on Hunt Club from
Richmond to HWY
416
Available drop =
Upstream
INV. Connection
DOWN stream
Upstream
on Greenbank to
Lynwood
Available drop =
from KW PS to
Hazeldean PS by
Terry Fox
to Lynwood at
Woodroffe
INV. Connection
Available drop =
Gravity Sewer Tunks from Signature Ridge PS to KW PS location to Hazeldean PS
INV. Connection
from SR PS to Maple
Groove/Seven Silver
Route Sections
DOWN stream
INV. Connection
Available drop = Available drop =
INV. Connection
DOWN stream
Upstream
Gravity Sewer Trunk from Eagleson‐Pathway‐Richmond‐Hunt Club‐Greenbank / or Woodroffe;
Gravity sewer Trunks from Signature Ridge to KW PS location and from here to Hazeldean PS;
Upstream DOWN stream
STUDY REPORT ‐ MAY 2012
RVA 102174 WUC ‐ WASTEWATER COLLECTION SYSTEM / MASTER SERVICING PLAN 2

APPENDIX D Capital Cost and Life Cycle Cost Analysis

City of Ottawa Page 1
WUC- Wastewater Collector System Appendix D Master Servicing Plan – Study Report July 2012 RVA 102174
WUC / Sanitary Sewer Servicing Plan – Capital Cost and Life Cycle Analysis
Capital Cost calculation parameters
Trunk Sewer construction
Open-cut: 825mm diam. pipe ~$1,500 to $1,800/m
975mm diam. pipe ~$1,800 to $2,000/m
1050mm diam. pipe ~$2,000 to $2,500/m
1200mm diam. pipe ~$2,000 to $2,500/m
1500mm diam. pipe ~$2,500to $3,000/m
1650mm diam. pipe ~$3,000 to $3,500/m
Trenchless (tunneling): 2.4m diam., 1500mm / 1650mm diam. pipe ~$8,000/m and $7,000/m depending on the length
entrance / exit shafts ~$500,000 and$1,000,000
set-up ~$500,000
for 975mm to 825mm diam. pipe ~$6,000/m to $6,500/m
Forcemains construction (open-cut method) 550mm / 700mm diam. pipe ~$2,200/m if two pipes are installed (unit price x length only once);
450mm / 600mm diam. pipe ~$2,000/m if two pipes are installed (unit price x length only once);
450mm / 600mm diam. pipe ~$1,500/m if one pipe is installed;
Pumping Station all cost for the pumping stations are as per the Infrastructure Master Plan Update:
- Hazeldean PS (50% contingency included) is estimated at $3,720,000 for major upgrades and $9,300,000 for full replacement. For capacity increase an extra 20% is applied to the full replacement estimation;
- Signature Ridge PS (50% contingency included) is estimated at $2,475,000 for major upgrades in 2017 and $6,187,500 for full replacement in 2052;
- March Rd PS (50% contingency included) is estimated at $960,000 for major upgrades in 2014 and $2,400,000 for full replacement in 2052;

City of Ottawa Page 2
WUC- Wastewater Collector System Appendix D Master Servicing Plan – Study Report July 2012 RVA 102174
- Kanata West PS (50% contingency included) is estimated at $9,900,000 construction cost for 2016 and $3,960,000 for major upgrades in 2041. For Option 1B, the station capacity is increased from 760L/s to 1250L/s, and thus, the cost is updated to $11,385,000 as per Stantec’s West Urban Community Sanitary Sewer Servicing - Technical Memorandum (submitted May 2012).
For the capital cost calculation we have considered an additional allowance under contingency which consists of:
Engineering = 20.0%
City staff (field) = 5%
Contingency = 20.0%
Project Management = 5%
Total contingency and engineering = 50.0%
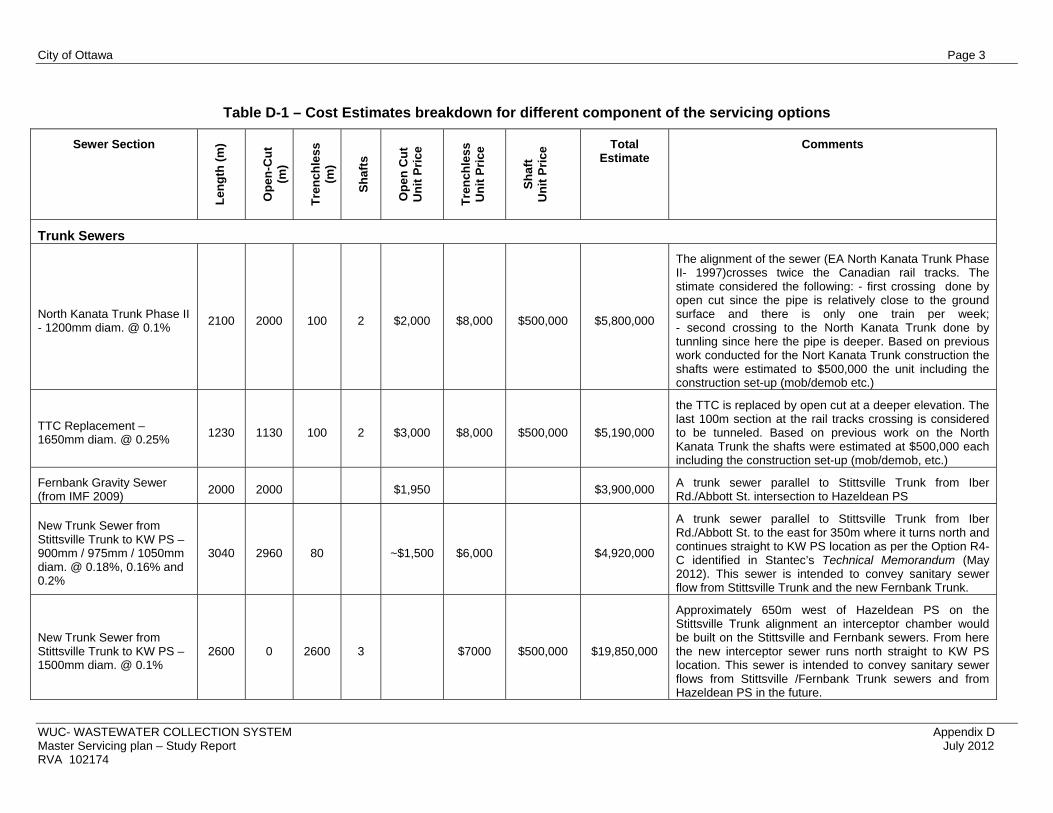
City of Ottawa Page 3
WUC- WASTEWATER COLLECTION SYSTEM Appendix D Master Servicing plan – Study Report July 2012 RVA 102174
Table D-1 – Cost Estimates breakdown for different component of the servicing options
Sewer Section
Len
gth
(m
)
Op
en-C
ut
(m)
Tre
nch
less
(m
)
Sh
afts
Op
en C
ut
Un
it P
rice
Tre
nch
less
U
nit
Pri
ce
Sh
aft
U
nit
Pri
ce Total
Estimate Comments
Trunk Sewers
North Kanata Trunk Phase II - 1200mm diam. @ 0.1%
2100 2000 100 2 $2,000 $8,000 $500,000 $5,800,000
The alignment of the sewer (EA North Kanata Trunk Phase II- 1997)crosses twice the Canadian rail tracks. The stimate considered the following: - first crossing done by open cut since the pipe is relatively close to the ground surface and there is only one train per week; - second crossing to the North Kanata Trunk done by tunnling since here the pipe is deeper. Based on previous work conducted for the Nort Kanata Trunk construction the shafts were estimated to $500,000 the unit including the construction set-up (mob/demob etc.)
TTC Replacement – 1650mm diam. @ 0.25%
1230 1130 100 2 $3,000 $8,000 $500,000 $5,190,000
the TTC is replaced by open cut at a deeper elevation. The last 100m section at the rail tracks crossing is considered to be tunneled. Based on previous work on the North Kanata Trunk the shafts were estimated at $500,000 each including the construction set-up (mob/demob, etc.)
Fernbank Gravity Sewer (from IMF 2009)
2000 2000 $1,950 $3,900,000 A trunk sewer parallel to Stittsville Trunk from Iber Rd./Abbott St. intersection to Hazeldean PS
New Trunk Sewer from Stittsville Trunk to KW PS – 900mm / 975mm / 1050mm diam. @ 0.18%, 0.16% and 0.2%
3040 2960 80 ~$1,500 $6,000 $4,920,000
A trunk sewer parallel to Stittsville Trunk from Iber Rd./Abbott St. to the east for 350m where it turns north and continues straight to KW PS location as per the Option R4-C identified in Stantec’s Technical Memorandum (May 2012). This sewer is intended to convey sanitary sewer flow from Stittsville Trunk and the new Fernbank Trunk.
New Trunk Sewer from Stittsville Trunk to KW PS – 1500mm diam. @ 0.1%
2600 0 2600 3 $7000 $500,000 $19,850,000
Approximately 650m west of Hazeldean PS on the Stittsville Trunk alignment an interceptor chamber would be built on the Stittsville and Fernbank sewers. From here the new interceptor sewer runs north straight to KW PS location. This sewer is intended to convey sanitary sewer flows from Stittsville /Fernbank Trunk sewers and from Hazeldean PS in the future.

City of Ottawa Page 4
WUC- WASTEWATER COLLECTION SYSTEM Appendix D Master Servicing plan – Study Report July 2012 RVA 102174
Table D-1 – Cost Estimates breakdown for different component of the servicing options (cont’d)
Trunk Sewer – from KW PS location to Eagleson: 1500mm diam.@ 0.1% to 0.22%
3260 260 3000 3 $3,000 $8,000 - $7,000
$1,000,000 $27,780,000 -$24,780,000
this gravity sewer is following the Maple Grove Rd. easement from the location of KW PS to Glen Cairn Trunk on Eagleson Rd. The trunk is considered of 1500mm diameter. The unit price for tunneling could go lower ($7,000/m) if multiple sections corresponding to an option require longer tunneling. The unit price for the shafts appears higher for this section since they are between 15 and 20m deep. The price also includes the set-up
Trunk Sewer - SR PS to KW PS location - 825mm diam. @ 0.1%
1850 1450 400 2 $2,000 $6,500 $750,000 $7,000,000
this gravity sewer is following a straight alignment from SR PS, on Didsbury Rd., crosses the HWY417 and continues on Silver Seven Rd. to Maple Grove Rd. Since the sewer is only 825mm diameter, the 400m section under HWY417 will be done by other trenchless method then standard tunneling. The open-cut unit price appears higher due to the burried depths of this sewer - between 6 and 10m
Trunk Sewer – from Eagleson (at Kakulu) to TTC - 1500mm diam. @0.22%
2310 617 1693 3 $3,000 $8,000 $750,000 $17,650,000 this gravity sewer follows the Glen Cairn alignment, however, only the last 617m to the joint chamber at TTC is installed by open cut, the rest being by tunneling.
Trunk Sewer – Hazeldean PS to KW PS location 1500mm diam. @0.12%
3250 650 2600 4 $3,000 $8,000 - $7,000
$500,000 $24,750,000 - $22,150,000
this gravity sewer is starting at Hazeldean PS going west along the Stittsville Trunk for 650m where it turns north and continues straight ot KW PS location.
Trunk Sewer – Eagleson Rd. to Lynwood Collector (for options 4A and 4B)
10460 5850 4610 6 $3,000 $7,000 $750,000 $54,320,000 This alignment contains approx. 3510m of tunneling on NCC and MNR land and 1100m of tunneling under HWY416 at West Hunt Club crossing
Forcemains
Forcemain -from KW PS to Glen Cairn Trunk on Eagleson Rd. at Katimavik Rd.(considering 2 forcemains)
3800 3800 0 0 $2,200 $8,360,000
two forcemains are considered to be installed in the same trench going on Maple Grove Rd., Silver Seven Rd, Palladium Dr., Katimavik Rd. and Eagleson Rd. to discharge into Glen Cairn Trunk.

City of Ottawa Page 5
WUC- WASTEWATER COLLECTION SYSTEM Appendix D Master Servicing plan – Study Report July 2012 RVA 102174
Table D-1 – Cost Estimates breakdown for different component of the servicing options (cont’d)
Hazeldean PS - third forcemain
2600 2600 0 0 $1,500 - $2,500
$5,340,000
a third forcemain (650mm diam.) to be installed from Hazeldean PS going east to Eagleson Rd and north on Eagleson to discharge into Glen Cairn Trunk at Hazeldean Rd. intersection. There is 1160m open-cut of $1,500/m between the PS and Eagleson Rd. (no traffic, gravel road) and 1440m open-cut of $2,500/m on Eagleson Rd.
Forcemain - Hazeldean PS to Eagleson (considering 2 forcemains for options 4A and 4B)
1160 1160 0 0 $1,500 $1,740,000 two forcemains installed in the same trench between the PS and Eagleson Rd. - no traffic, gravel road.

City of Ottawa Page 6
WUC- WASTEWATER COLLECTION SYSTEM Appendix D Master Servicing plan – Study Report July 2012 RVA 102174
OPTION 1A: Capital Cost Estimate
Option 1ATotal
Length (m)Open Cut
(m)Trenchless
(m)Trenchless Shafts (ea)
Estimated CostYear to be
implemented
North Kanata Trunk - phase 2 (1200mm @ 0.1%) 2100 2000 100 2 5,800,000$ 2014TTC replacement (1650mm @ 0.25%) 1230 1130 100 2 5,190,000$ 2016March Rd. PS (convert into low lift station) 0 0 0 0 640,000$ 2014Signature Ridge PS (upgrades) 0 0 0 0 1,650,000$ 2017Signature Ridge PS forcemain 800 800 1,200,000$ 2017Kanata West PS (new PS) 0 0 0 0 6,600,000$ 2016Forcemains KW PS to Glain Cairn Trunk 3800 3800 0 0 7,600,000$ 2016Hazeldean PS (full replacement) * 0 0 0 0 7,440,000$ 2021Hazeldean PS - third forcemain 2600 2600 0 0 5,340,000$ 2021Fernbank gravity sewer 2600 2600 0 0 3,900,000$ 2013Total 13130 12930 200 4 45,360,000$ 50% Engineering/Contingency 22,680,000$ Total 68,040,000$
* Hazeldean PS was built in 1976 and is expected to be fully replaced by 2016. However, recent upgrades were made to increase the capacity of the station to 1225L/s, thus, full replacement is expected for 2021 when capacity needs to be increase and third forcemain also needs to be built. The cost for full replacement is estimated to $6,200,000; however, since capacity increase is necessary, a 20% is added to the estimated full replacement cost = $7,440,000.

City of Ottawa Page 7
WUC- WASTEWATER COLLECTION SYSTEM Appendix D Master Servicing plan – Study Report July 2012 RVA 102174
OPTION 1B: Capital Cost Estimate
Option 1BTotal
Length (m)Open Cut
(m)Trenchless
(m)Trenchless Shafts (ea)
Estimated Cost
Year to be implemented
North Kanata Trunk - phase 2 (1200mm @ 0.1%) 2100 2000 100 2 5,800,000$ 2014TTC replacement (1650mm @ 0.25%) 1230 1130 100 2 5,190,000$ 2016March Rd. PS (convert into low lift station) 0 0 0 0 640,000$ 2014Signature Ridge PS (upgrades) 0 0 0 0 1,650,000$ 2017Signature Ridge PS forcemain 800 800 1,200,000$ 2017Kanata West PS (new PS) 0 0 0 0 7,590,000$ 2016Forcemains KW PS to Glain Cairn Trunk 3800 3800 0 0 8,360,000$ 2016Hazeldean PS (full replacement)* 0 0 0 0 -$ 2061Hazeldean PS - third forcemain* 0 0 0 0 -$ 2061Interceptor Sewer from Stittsville Trunk to KW PS (900mm/1050mm diam. at 0.16% / 0.2%)**
3040 2960 80 0 4,920,000$ 2016
Fernbank new gravity sewer 2600 2600 0 0 3,900,000$ 2013Total 13570 13290 200 4 39,250,000$ 50% Engineering/Contingency 19,625,000$ Total 58,875,000$
Hazeldean PS (full replacement)* 0 0 0 0 7,440,000$ 2061Hazeldean PS - third forcemain 0 0 0 0 5,340,000$ 2061
* Hazeldean PS was built in 1976 and is expected to be fully replaced by 2016. However, recent upgrades (2010-2011) were made to increase the capacity of the station to 1225L/s and with the construction of the new interceptor sewer, Hazeldean PS full replacement and constrcution of third forcemain would be anticipated beyond 2060. The cost for full replacement including increase in capacity was estimated to $7,440,000 and for the third forcemain to $5,340,000

City of Ottawa Page 8
WUC- WASTEWATER COLLECTION SYSTEM Appendix D Master Servicing plan – Study Report July 2012 RVA 102174
OPTION 1C: Capital Cost Estimate
Option 1CTotal
Length (m)Open Cut
(m)Trenchless
(m)Trenchless Shafts (ea)
Estimated Cost
Year to be implemented
North Kanata Trunk - phase 2 (1200mm @ 0.1%) 2100 2000 100 2 5,800,000$ 2014TTC replacement (1650mm @ 0.25%) 1230 1130 100 2 5,190,000$ 2016March Rd. PS (convert into low lift station) 0 0 0 0 640,000$ 2014Signature Ridge PS (upgrades) 0 0 0 0 1,650,000$ 2017Signature Ridge PS forcemain 800 800 1,200,000$ 2017Kanata West PS (new PS) 0 0 0 0 8,090,000$ 2016Forcemains KW PS to Glain Cairn Trunk 3800 3800 0 0 8,360,000$ 2016Hazeldean PS (full replacement)* 0 0 0 0 -$ Hazeldean PS - third forcemain* 0 0 -$ New Interceptor Sewer from Stittsville/ Fernbank Trunk to KW PS (1500mm @ 0.1%) 2600 2600 3 19,850,000$ 2016Fernbank new gravity sewer 2600 2600 0 0 3,900,000$ 2013Total 13130 10330 200 4 54,680,000$ 50% Engineering/Contingency 27,340,000$ Total 82,020,000$
* Hazeldean PS was built in 1976 and is expected to be fully replaced by 2016. However, recent upgrades were made to increase the capacity of the station to 1225L/s, and with the construction of the new interceptor sewer (that will defer sewer flows to KW PS), Hazeldean PS is anticipated to be maintained at the same capacity beyond 2060, thus, only major updates were considered in the life cycle cost analysis. Under this option, capacity is not necessary to be increased.

City of Ottawa Page 9
WUC- WASTEWATER COLLECTION SYSTEM Appendix D Master Servicing plan – Study Report July 2012 RVA 102174
OPTION 2A: Capital Cost Estimate
OPTION 2ATotal
Length (m)Open Cut
(m)Trenchless
(m)Trenchless Shafts (ea)
Estimated Cost
Year to be implemented
North Kanata Trunk - phase 2 (1200mm @ 0.1%) 2100 2000 100 2 5,800,000$ 2014March Rd. PS (convert into low lift station) 0 0 0 0 640,000$ 2014TTC replacement (1650mm @ 0.25%) 1230 1130 100 2 5,190,000$ 2016
New Gravity Trunk Sewer (1500mm @ 0.1% to 0.22% & 1650mm @ 0.3%) from KW PS location to Eagleson to TTC 5630 877 4753 4 39,902,000$ 2016Signature Ridge PS (upgrades) 0 0 0 0 1,650,000$ 2017Signature Ridge PS forcemain 800 800 1,200,000$ 2017Hazeldean PS (upgrades) 0 0 0 0 500,000$ 2012New Interceptor Sewer (1500mm @ 0.1% to 0.22% ) Hazeldean PS to KW PS location 3250 650 2600 4 22,975,000$ 2016New Gravity Sewer SR PS to KW PS location (825mm @ 0.1%) * 1850 1450 400 2
-$ 2037
Fernbank new gravity sewer 2000 2600 0 0 3,900,000$ 2013Total 16860 9507 4953 8 81,757,000$ 50% Engineering/Contingency 40,878,500$ Total 122,635,500$
* this cost is not part of the option immediate capital cost, however, it is considered in the life-cycle cost analysis.
New Gravity Sewer SR PS to KW PS location (825mm @ 0.1%) 1850 1450 400 2 7,725,000$ 2037

City of Ottawa Page 10
WUC- WASTEWATER COLLECTION SYSTEM Appendix D Master Servicing plan – Study Report July 2012 RVA 102174
OPTION 2B: Capital Cost Estimate
OPTION 2BTotal
Length (m)Open Cut
(m)Trenchless
(m)Trenchless Shafts (ea)
Estimated CostYear to be
implemented
North Kanata Trunk - phase 2 (1200mm @ 0.1%) 2100 2000 100 2 5,800,000$ 2014March Rd. PS (convert into low lift station) 0 0 0 0 640,000$ 2014TTC replacement (1650mm @ 0.25%) 1230 1130 100 2 5,190,000$ 2016New Gravity Trunk Sewer (1500mm @ 0.1% to 0.22% & 1650mm @ 0.3%) from KW PS location to Eagleson Rd. 3260 260 3000 3 24,780,000$ 2016
Eagleson PS (new low lift PS at Eagleson/Kakulu replacing the proposed KW PS) 0 0 0 0 6,600,000$ 2016Signature Ridge PS (upgrades) 0 0 0 0 1,650,000$ 2017Signature Ridge PS forcemain 800 800 1,200,000$ 2017Hazeldean PS (upgrades) 0 0 0 0 500,000$ 2012New Gravity Trunk Sewer (1500mm @ 0.1% to 0.22%) Eagleson to TTC * 2310 617 1693 3 -$ 2047New Gravity Trunk Sewer (1500mm @ 0.1% to 0.22% ) Hazeldean to KW PS 3250 650 2600 3 22,150,000$ 2016New Gravity Sewer SR PS to KW PS location (825mm @ 0.1%) * 1850 1450 400 2 -$ 2037Fernbank gravity sewer 2000 2600 0 3,900,000$ 2013Total 16800 9507 7893 15 72,410,000$ 50% Engineering/Contingency 36,205,000$ Total 108,615,000$
* these costs are not part of the option immediate capital cost, however, they are considered in the life-cycle cost analysis.
New Gravity Trunk Sewer (1500mm @ 0.1% to 0.22% ) Eagleson to TTC 0 617 1693 3 17,645,000$ 2047New Gravity Sewer SR PS to KW PS location (825mm @ 0.1%) 1850 1450 400 2 7,000,000$ 2037

City of Ottawa Page 11
WUC- WASTEWATER COLLECTION SYSTEM Appendix D Master Servicing plan – Study Report July 2012 RVA 102174
OPTION 4A: Capital Cost Estimate
OPTION 4ATotal
Length (m)Open Cut
(m)Trenchless
(m)Trenchless Shafts (ea)
Estimated Cost
Year to be implemented
North Kanata Trunk - phase 2 (1200mm @ 0.1%) 2100 2000 100 2 5,800,000$ 2014TTC replacement (1650mm @ 0.25%) 1230 1130 100 2 5,190,000$ 2016March Rd. PS (convert into low lift station) 0 0 0 0 640,000$ 2014Signature Ridge PS (upgrades) 0 0 0 0 1,650,000$ 2017Signature Ridge PS forcemain 800 800 1,200,000$ 2017Kanata West PS (new PS) 0 0 0 0 6,600,000$ 2016Forcemains KW PS to Glain Cairn Trunk 3800 3800 0 0 7,600,000$ 2016Hazeldean PS (upgrades) 0 0 0 0 2,480,000$ 2016Forcemains Hazeldean PS to Eagleson 1160 1160 0 0 1,740,000$ 2016New Gravity Trunk Sewer from Eagleson to Lynwood Collector (1500mm @0.15%) 10460 5850 4610 6 54,320,000$ 2016Fernbank gravity sewer 2000 2600 0 0 3,900,000$ 2013Total 21550 17340 4810 10 91,120,000$ 50% Engineering/Contingency 45,560,000$ Total 136,680,000$

City of Ottawa Page 12
WUC- WASTEWATER COLLECTION SYSTEM Appendix D Master Servicing plan – Study Report July 2012 RVA 102174
OPTION 4B: Capital Cost Estimate
OPTION 4BTotal
Length (m)Open Cut
(m)Trenchless
(m)Trenchless Shafts (ea)
Estimated Cost
Year to be implemented
North Kanata Trunk - phase 2 (1200mm @ 0.1%) 2100 2000 100 2 5,800,000$ 2014TTC replacement (1650mm @ 0.25%) 1230 1130 100 2 5,190,000$ 2016March Rd. PS (convert into low lift station) 0 0 0 0 640,000$ 2014
New Gravity Sewer KW PS location to Hazeldean PS (1200mm @ 0.12%) 3250 650 2600 4 $22,475,000 2016Hazeldean PS (upgrades) 0 0 0 0 6,200,000$ 2012Signature Ridge PS (upgrades) 0 0 0 0 1,650,000$ 2017Signature Ridge PS forcemain 800 800 1,200,000$ 2017Forcemains Hazeldean PS to Eagleson 1160 1160 0 0 2,320,000$ 2016New Gravity Sewer SR PS to KW PS location (825mm @ 0.1%) * 1850 1450 400 2 -$ 2037
New Gravity Trunk Sewer from Eagleson to Lynwood Collector (1500mm @ 0.22%) 10460 6510 3950 5 50,930,000$ 2016Fernbank gravity sewer 2000 2600 0 0 3,900,000$ 2013Total 22850 16300 7150 15 100,305,000$ 50% Engineering/Contingency 50,152,500$ Total 150,457,500$
* this cost is not part of the option immediate capital cost, however, it is considered in the life-cycle cost analysis.
New Gravity Sewer SR PS to KW PS location (825mm @ 0.1%) 1850 1450 400 2 7,725,000$ 2037

City of Ottawa Page 13
WUC- WASTEWATER COLLECTION SYSTEM Appendix D Master Servicing Plan – Study Report July 2012 RVA 102174
Life Cycle Cost Analysis Table
Life span for - sewer trunks = 100years, with upgrades (lining) or replacement at the end;
- forcemain = 75years, with upgrades (lining) or replacement at the end;
- pumping station = 40 years with major upgrades at 25years;
Operation and Maintenance costs for - sewer trunks = 0.2% of Capital Cost (CC) – more realistically than 5.0% considered in RVA Wastewater Master Plan 1997
- forcemain= 0.2% of CC – more realistically than 5.0% considered in RVA Wastewater Master Plan, 1997
- pumping station = 2.5% of CC – based on recent values for O&M and electrical costs at March Rd. PS, Signature Ridge PS and Hazeldean PS for 2010 and 200 – see table below.
Table D-2: Operation and Maintenance cost for the main four pump stations in the WUC sanitary sewer system
Pump Station 2009 2010 Two yrs. Average
% of total
Acres Rd. PS
Labour, parts, tools etc. $129,608 $190,610 $160,109 35.2%
Electricity costs $288,589 $301,753 $295,171 64.8%
Total $418,197 $492,363 $455,280
Hazeldean PS
Labour, parts, tools etc. $76,294 $134,321 $105,307 36.3%
Electricity costs $181,829 $188,038 $184,934 63.7%
Total $258,123 $322,359 $290,241
March Rd. PS
Labour, parts, tools etc. $83,120 $52,518 $67,819 56.7%
Electricity costs $46,595 $56,971 $51,783 43.3%
Total $129,715 $109,489 $119,602
Signature Ridge PS
Labour, parts, tools etc. $44,110 $9,381 26,745 70.2%
Electricity costs $10,803 $11,867 $11,335 29.8%
Total $54,913 $21,248 $38,080
City of Ottawa Page 14
WUC- WASTEWATER COLLECTION SYSTEM Appendix D Master Servicing Plan – Study Report July 2012 RVA 102174
Major upgrades estimations for pumping station = 40% of CC
Financial parameters: - annual average discount interest rate = 5% - similar in Stantec Kanata West Master Servicing Study 2006
- annual average inflation interest rate = 2% - similar in Stantec Kanata West Master Servicing Study 2006
- combined interest inflation factor = 2.94% - similar in Stantec Kanata West Master Servicing Study 2006
Note: as a sensitive analysis the life cycle-cost calculation was also carried out with 3% and 7% for the discount interest rate

City of Ottawa Page 15
WUC- WASTEWATER COLLECTION SYSTEM Appendix D Master Servicing Plan – Study Report July 2012 RVA 102174
Table D-3: Life-cycle cost analysis – Net Present Value at year 2012 (disc. rate 5%)
Date Modified: Jun-12Name: A.M.
BASIC ASSUMPTIONS:
Interest rate: 5.00 %Inflation rate: 2.00 %Combined rate: 2.94 %
Life cycle period: 100 years
Capital Cost Construction O&M Total Estimate Trunk Sewer Forcemains Pumping Stations
$ 68,040,000 64,293,416 25,668,226 $89,961,642 22,391,747 17,851,249 49,718,646
$ 58,875,000 60,492,533 26,713,061 $87,205,594 28,912,710 13,192,260 45,100,624
$ 82,020,000 81,317,140 19,051,921 $100,369,061 48,700,919 12,166,642 39,501,500
$ 122,635,500 108,674,834 12,921,115 $121,595,949 110,548,998 1,950,003 9,096,948
$ 108,615,000 101,570,940 14,141,782 $115,712,722 95,357,356 1,869,297 18,486,069
$ 136,680,000 127,570,319 19,671,991 $147,242,311 94,288,022 14,603,989 38,350,300
$ 150,457,500 147,548,841 34,102,812 $181,651,653 127,248,929 5,042,110 49,360,614
WUC - WASTEWATER COLLECTION SYSTEM - LIFE CYCLE COSTING OF OPTIONS
OPTION 4A
OPTION 4B
OPTIONS
OPTION 1A
Net Present Value Comparison disc.rate 5%
OPTION 1B
OPTION 2A
OPTION 1C
OPTION 2B
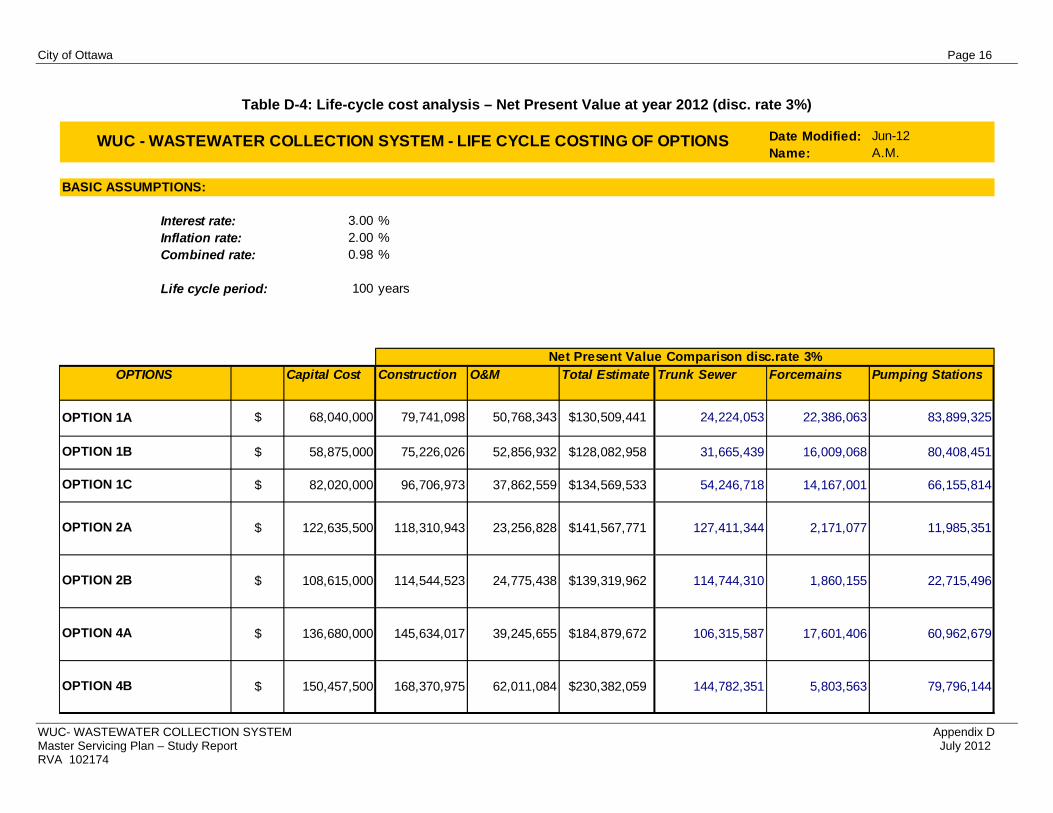
City of Ottawa Page 16
WUC- WASTEWATER COLLECTION SYSTEM Appendix D Master Servicing Plan – Study Report July 2012 RVA 102174
Table D-4: Life-cycle cost analysis – Net Present Value at year 2012 (disc. rate 3%)
Date Modified: Jun-12Name: A.M.
BASIC ASSUMPTIONS:
Interest rate: 3.00 %Inflation rate: 2.00 %Combined rate: 0.98 %
Life cycle period: 100 years
Capital Cost Construction O&M Total Estimate Trunk Sewer Forcemains Pumping Stations
$ 68,040,000 79,741,098 50,768,343 $130,509,441 24,224,053 22,386,063 83,899,325
$ 58,875,000 75,226,026 52,856,932 $128,082,958 31,665,439 16,009,068 80,408,451
$ 82,020,000 96,706,973 37,862,559 $134,569,533 54,246,718 14,167,001 66,155,814
$ 122,635,500 118,310,943 23,256,828 $141,567,771 127,411,344 2,171,077 11,985,351
$ 108,615,000 114,544,523 24,775,438 $139,319,962 114,744,310 1,860,155 22,715,496
$ 136,680,000 145,634,017 39,245,655 $184,879,672 106,315,587 17,601,406 60,962,679
$ 150,457,500 168,370,975 62,011,084 $230,382,059 144,782,351 5,803,563 79,796,144
WUC - WASTEWATER COLLECTION SYSTEM - LIFE CYCLE COSTING OF OPTIONS
OPTION 4A
OPTION 4B
OPTIONS
OPTION 1A
Net Present Value Comparison disc.rate 3%
OPTION 1B
OPTION 2A
OPTION 1C
OPTION 2B

City of Ottawa Page 17
WUC- WASTEWATER COLLECTION SYSTEM Appendix D Master Servicing Plan – Study Report July 2012 RVA 102174
Table D-5: Life-cycle cost analysis – Net Present Value at year 2012 (disc. rate 7%)
Date Modified: Jun-12Name: A.M.
BASIC ASSUMPTIONS:
Interest rate: 7.00 %Inflation rate: 2.00 %Combined rate: 4.90 %
Life cycle period: 100 years
Capital Cost Construction O&M Total Estimate Trunk Sewer Forcemains Pumping Stations
$ 68,040,000 55,980,151 16,144,977 $72,125,128 21,411,689 15,462,511 35,250,928
$ 58,875,000 53,296,415 16,815,273 $70,111,688 27,322,811 11,770,427 31,018,451
$ 82,020,000 72,769,527 11,920,731 $84,690,258 45,260,422 11,081,612 28,348,223
$ 122,635,500 100,926,464 8,721,330 $109,647,794 99,988,222 1,880,943 7,778,629
$ 108,615,000 92,497,686 9,556,340 $102,054,026 84,079,471 1,858,052 16,116,502
$ 136,680,000 116,276,088 12,037,392 $128,313,480 86,573,981 13,158,279 28,581,220
$ 150,457,500 133,863,290 22,625,829 $156,489,119 115,243,883 4,666,191 36,579,046
WUC - WASTEWATER COLLECTION SYSTEM - LIFE CYCLE COSTING OF OPTIONS
OPTION 4A
OPTION 4B
OPTIONS
OPTION 1A
Net Present Value Comparison disc.rate 7%
OPTION 1B
OPTION 2A
OPTION 1C
OPTION 2B
Related Documents


![[WUC 2016] Dr. Mirko Caspar, Managing Director, Mister Spex | Creativity for Performance](https://static.cupdf.com/doc/110x72/58cef7e11a28abab738b5273/wuc-2016-dr-mirko-caspar-managing-director-mister-spex-creativity-for.jpg)


![[WUC 2015] Kevin Anderson, Team Manager Digital Intelligence, ING | Improving Customer Experience Using Analytics?](https://static.cupdf.com/doc/110x72/55c4a86dbb61eb5d1f8b47ef/wuc-2015-kevin-anderson-team-manager-digital-intelligence-ing-improving.jpg)