MODELING OF ADVANCED DAYLIGHTING SYSTEMS TO IMPROVE ILLUMINANCE AND UNIFORMITY IN ARCHITECTURAL DESIGN STUDIOS A Thesis Submitted to the Graduate School of Engineering and Sciences of İzmir Institute of Technology in Partial Fulfillment of the Requirements for the Degree of MASTER OF SCIENCE in Architecture by Pelin FIRAT ÖRS June 2013 İZMİR

Welcome message from author
This document is posted to help you gain knowledge. Please leave a comment to let me know what you think about it! Share it to your friends and learn new things together.
Transcript
MODELING OF ADVANCED DAYLIGHTING
SYSTEMS TO IMPROVE ILLUMINANCE AND
UNIFORMITY IN ARCHITECTURAL DESIGN
STUDIOS
A Thesis Submitted to
the Graduate School of Engineering and Sciences of
İzmir Institute of Technology
in Partial Fulfillment of the Requirements for the Degree of
MASTER OF SCIENCE
in Architecture
by
Pelin FIRAT ÖRS
June 2013
İZMİR
We approve the thesis of Pelin FIRAT ÖRS
Examining Committee Members:
Assoc. Prof. Dr. Zehra Tuğçe KAZANASMAZ
Department of Architecture, İzmir Institute of Technology
Assoc. Prof. Dr. Mustafa Emre İLAL
Department of Architecture, İzmir Institute of Technology
Assist. Prof. Dr. Müjde ALTIN
Department of Architecture, Dokuz Eylul University
24 June 2013
Assoc. Prof. Dr. Zehra Tuğçe KAZANASMAZ
Supervisor, Department of Architecture
İzmir Institute of Technology
Assoc. Prof. Dr. Şeniz ÇIKIŞ
Head of the Department of Architecture
Prof. Dr. R. Tuğrul SENGER
Dean of the Graduate School of
Engineering and Sciences

ACKNOWLEDGMENTS
I would like to express my sincere thanks to my supervisor Assoc. Prof. Dr. Z.
Tuğçe Kazanasmaz for her invaluable guidance, constant encouragement, patience and
support throughout this study.
I also would like to thank to Assoc. Prof. Dr. M. Emre İlal, Assist. Prof. Dr.
Müjde Altın and Assoc. Prof. Dr. Koray Korkmaz for their guiding comments and
suggestions for this thesis.
I would like to thank my friends for their constant encouragement, support and
being there for me when I needed.
I would like to express my deepest gratitude to my parents Sevgül Fırat and
Aydın Fırat and my husband Taylan Örs for their endless support, encouragement, help,
patience and trust throughout my education and my life.
Finally, I am deeply indebted to my grandmother Pervin Fırat, who was my first
teacher and was the person who has believed in me the most.
iv
ABSTRACT
MODELING OF ADVANCED DAYLIGHTING SYSTEMS TO
IMPROVE ILLUMINANCE AND UNIFORMITY IN
ARCHITECTURAL DESIGN STUDIOS
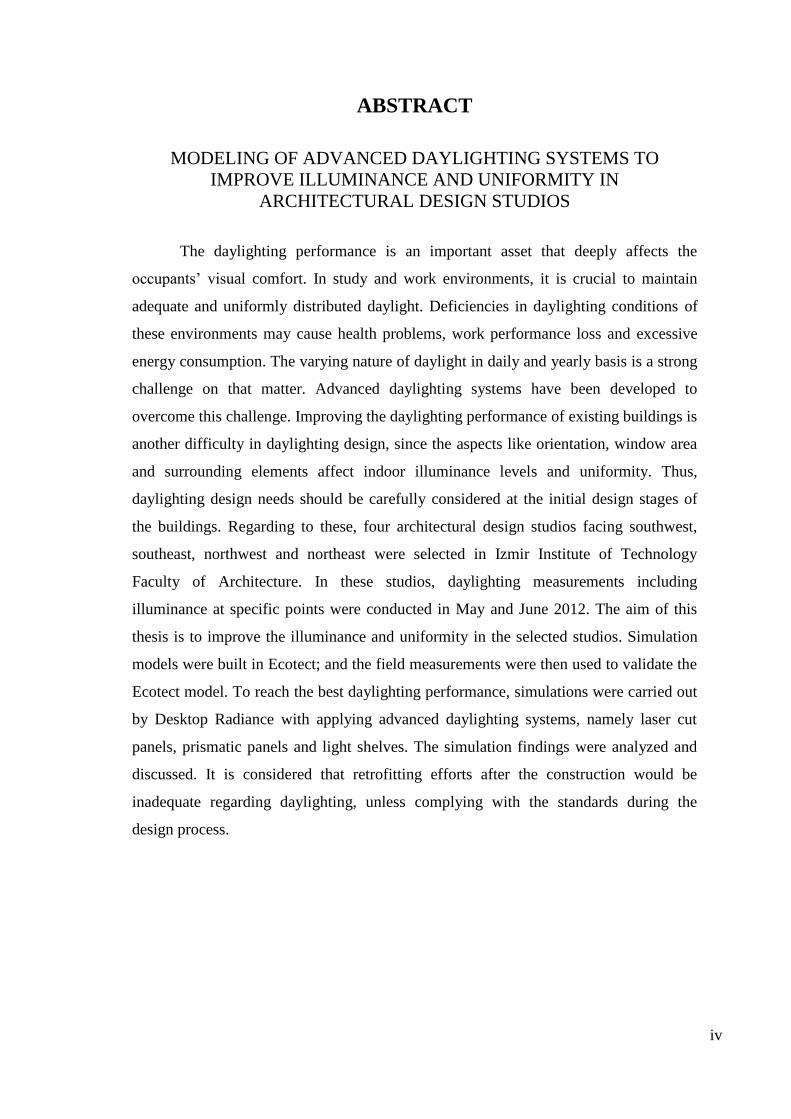
The daylighting performance is an important asset that deeply affects the
occupants’ visual comfort. In study and work environments, it is crucial to maintain
adequate and uniformly distributed daylight. Deficiencies in daylighting conditions of
these environments may cause health problems, work performance loss and excessive
energy consumption. The varying nature of daylight in daily and yearly basis is a strong
challenge on that matter. Advanced daylighting systems have been developed to
overcome this challenge. Improving the daylighting performance of existing buildings is
another difficulty in daylighting design, since the aspects like orientation, window area
and surrounding elements affect indoor illuminance levels and uniformity. Thus,
daylighting design needs should be carefully considered at the initial design stages of
the buildings. Regarding to these, four architectural design studios facing southwest,
southeast, northwest and northeast were selected in Izmir Institute of Technology
Faculty of Architecture. In these studios, daylighting measurements including
illuminance at specific points were conducted in May and June 2012. The aim of this
thesis is to improve the illuminance and uniformity in the selected studios. Simulation
models were built in Ecotect; and the field measurements were then used to validate the
Ecotect model. To reach the best daylighting performance, simulations were carried out
by Desktop Radiance with applying advanced daylighting systems, namely laser cut
panels, prismatic panels and light shelves. The simulation findings were analyzed and
discussed. It is considered that retrofitting efforts after the construction would be
inadequate regarding daylighting, unless complying with the standards during the
design process.
v
ÖZET
MİMARİ TASARIM STÜDYOLARINDA AYDINLIK DÜZEYİ VE
DÜZGÜNLÜĞÜN İYİLEŞTİRİLMESİ AMACIYLA GELİŞMİŞ DOĞAL
AYDINLATMA SİSTEMLERİNİN MODELLENMESİ
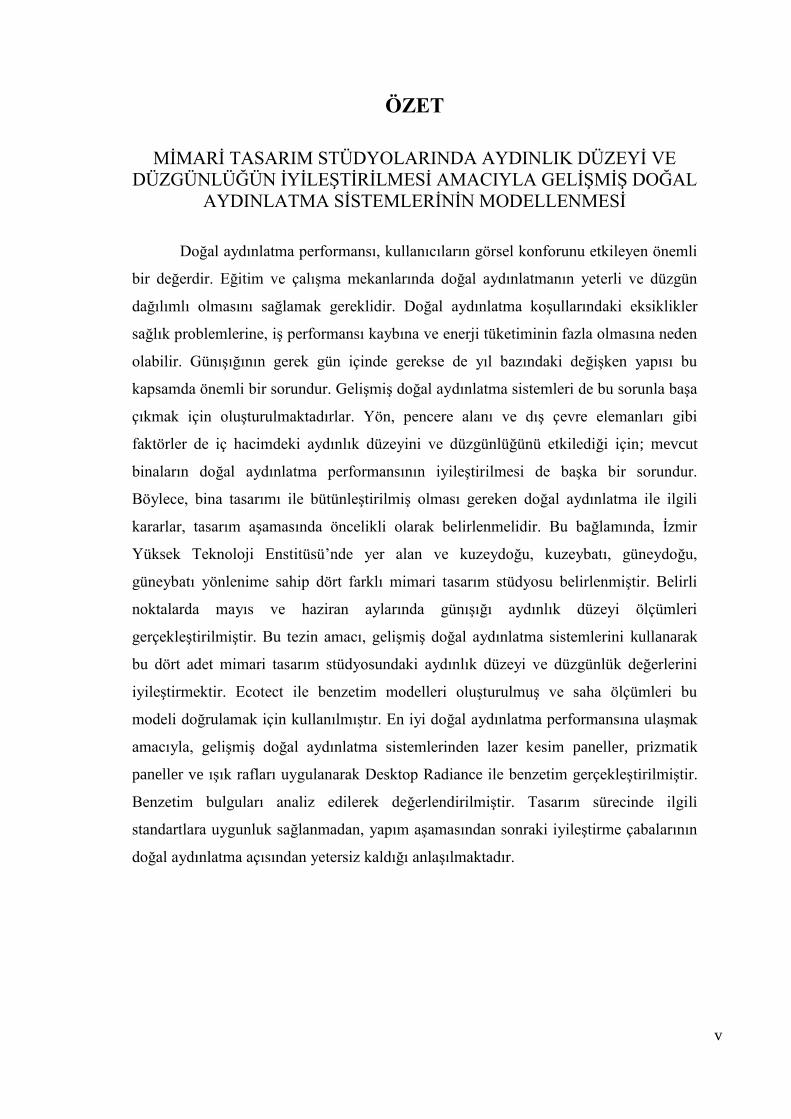
Doğal aydınlatma performansı, kullanıcıların görsel konforunu etkileyen önemli
bir değerdir. Eğitim ve çalışma mekanlarında doğal aydınlatmanın yeterli ve düzgün
dağılımlı olmasını sağlamak gereklidir. Doğal aydınlatma koşullarındaki eksiklikler
sağlık problemlerine, iş performansı kaybına ve enerji tüketiminin fazla olmasına neden
olabilir. Günışığının gerek gün içinde gerekse de yıl bazındaki değişken yapısı bu
kapsamda önemli bir sorundur. Gelişmiş doğal aydınlatma sistemleri de bu sorunla başa
çıkmak için oluşturulmaktadırlar. Yön, pencere alanı ve dış çevre elemanları gibi
faktörler de iç hacimdeki aydınlık düzeyini ve düzgünlüğünü etkilediği için; mevcut
binaların doğal aydınlatma performansının iyileştirilmesi de başka bir sorundur.
Böylece, bina tasarımı ile bütünleştirilmiş olması gereken doğal aydınlatma ile ilgili
kararlar, tasarım aşamasında öncelikli olarak belirlenmelidir. Bu bağlamında, İzmir
Yüksek Teknoloji Enstitüsü’nde yer alan ve kuzeydoğu, kuzeybatı, güneydoğu,
güneybatı yönlenime sahip dört farklı mimari tasarım stüdyosu belirlenmiştir. Belirli
noktalarda mayıs ve haziran aylarında günışığı aydınlık düzeyi ölçümleri
gerçekleştirilmiştir. Bu tezin amacı, gelişmiş doğal aydınlatma sistemlerini kullanarak
bu dört adet mimari tasarım stüdyosundaki aydınlık düzeyi ve düzgünlük değerlerini
iyileştirmektir. Ecotect ile benzetim modelleri oluşturulmuş ve saha ölçümleri bu
modeli doğrulamak için kullanılmıştır. En iyi doğal aydınlatma performansına ulaşmak
amacıyla, gelişmiş doğal aydınlatma sistemlerinden lazer kesim paneller, prizmatik
paneller ve ışık rafları uygulanarak Desktop Radiance ile benzetim gerçekleştirilmiştir.
Benzetim bulguları analiz edilerek değerlendirilmiştir. Tasarım sürecinde ilgili
standartlara uygunluk sağlanmadan, yapım aşamasından sonraki iyileştirme çabalarının
doğal aydınlatma açısından yetersiz kaldığı anlaşılmaktadır.
vi
To my grandmother,
vii
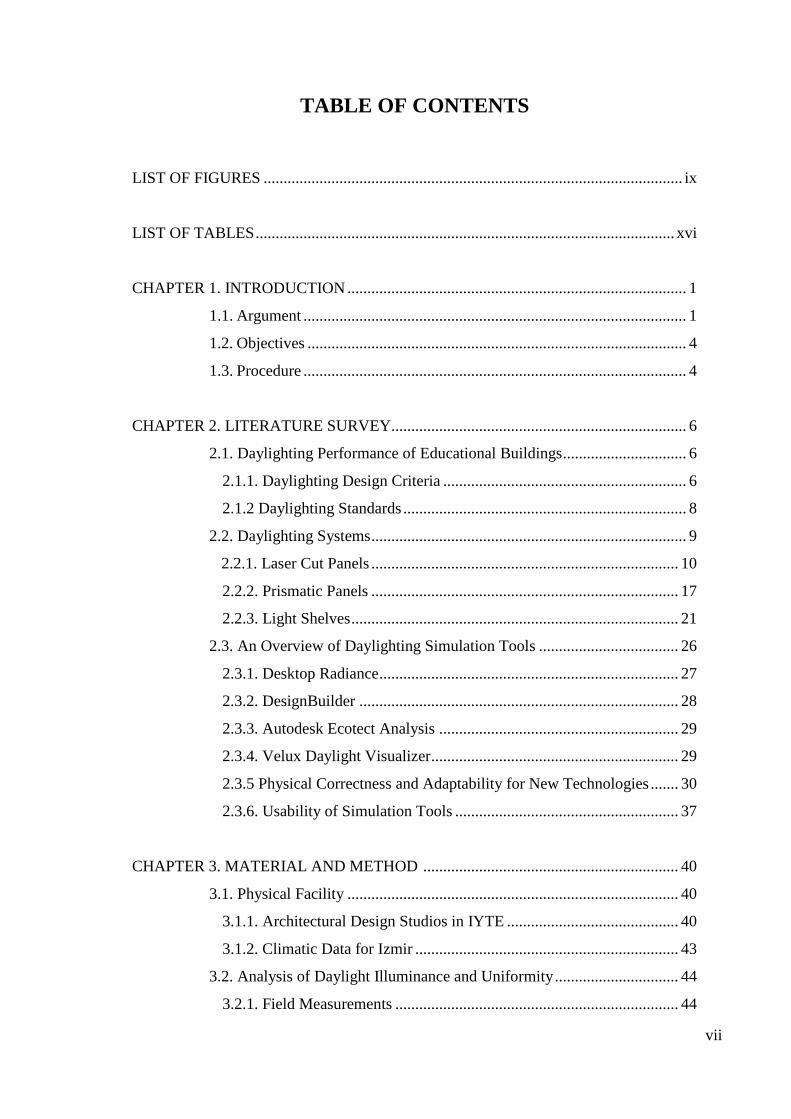
TABLE OF CONTENTS
LIST OF FIGURES ......................................................................................................... ix
LIST OF TABLES ......................................................................................................... xvi
CHAPTER 1. INTRODUCTION ..................................................................................... 1
1.1. Argument ................................................................................................ 1
1.2. Objectives ............................................................................................... 4
1.3. Procedure ................................................................................................ 4
CHAPTER 2. LITERATURE SURVEY .......................................................................... 6
2.1. Daylighting Performance of Educational Buildings ............................... 6
2.1.1. Daylighting Design Criteria ............................................................. 6
2.1.2 Daylighting Standards ....................................................................... 8
2.2. Daylighting Systems ............................................................................... 9
2.2.1. Laser Cut Panels ............................................................................. 10
2.2.2. Prismatic Panels ............................................................................. 17
2.2.3. Light Shelves .................................................................................. 21
2.3. An Overview of Daylighting Simulation Tools ................................... 26
2.3.1. Desktop Radiance ........................................................................... 27
2.3.2. DesignBuilder ................................................................................ 28
2.3.3. Autodesk Ecotect Analysis ............................................................ 29
2.3.4. Velux Daylight Visualizer .............................................................. 29
2.3.5 Physical Correctness and Adaptability for New Technologies ....... 30
2.3.6. Usability of Simulation Tools ........................................................ 37
CHAPTER 3. MATERIAL AND METHOD ................................................................ 40
3.1. Physical Facility ................................................................................... 40
3.1.1. Architectural Design Studios in IYTE ........................................... 40
3.1.2. Climatic Data for Izmir .................................................................. 43
3.2. Analysis of Daylight Illuminance and Uniformity ............................... 44
3.2.1. Field Measurements ....................................................................... 44
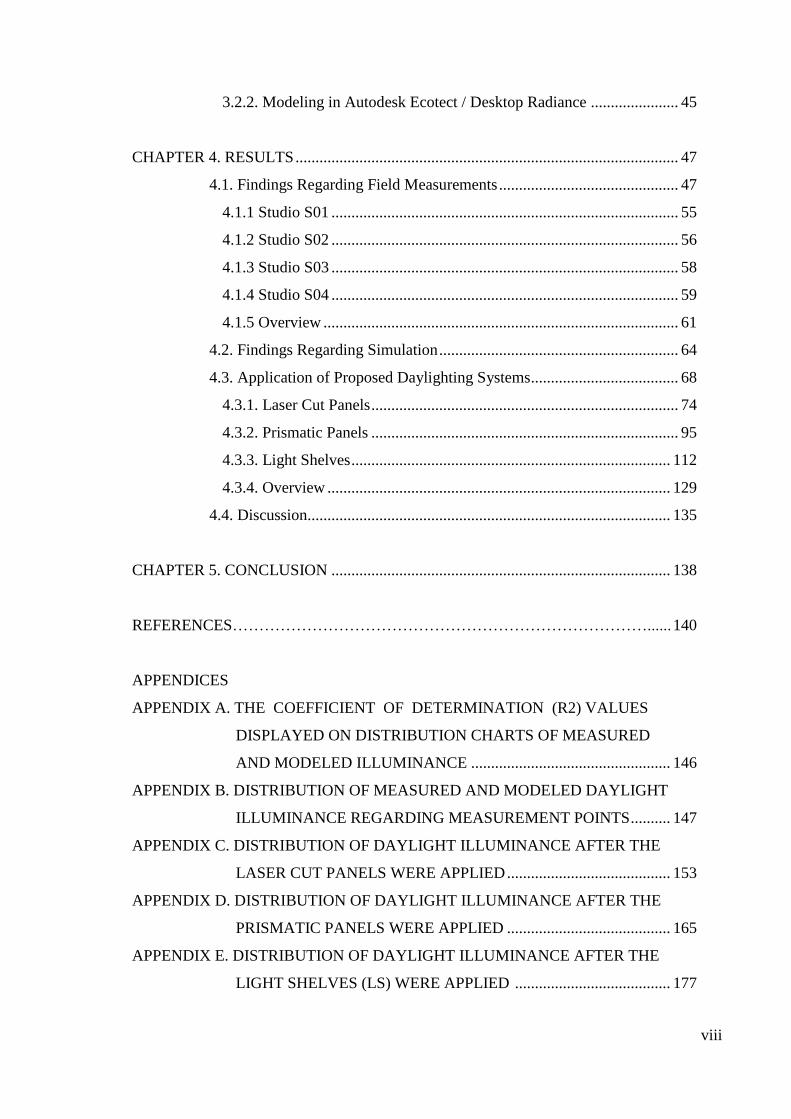
viii
3.2.2. Modeling in Autodesk Ecotect / Desktop Radiance ...................... 45
CHAPTER 4. RESULTS ................................................................................................ 47
4.1. Findings Regarding Field Measurements ............................................. 47
4.1.1 Studio S01 ....................................................................................... 55
4.1.2 Studio S02 ....................................................................................... 56
4.1.3 Studio S03 ....................................................................................... 58
4.1.4 Studio S04 ....................................................................................... 59
4.1.5 Overview ......................................................................................... 61
4.2. Findings Regarding Simulation ............................................................ 64
4.3. Application of Proposed Daylighting Systems..................................... 68
4.3.1. Laser Cut Panels ............................................................................. 74
4.3.2. Prismatic Panels ............................................................................. 95
4.3.3. Light Shelves ................................................................................ 112
4.3.4. Overview ...................................................................................... 129
4.4. Discussion........................................................................................... 135
CHAPTER 5. CONCLUSION ..................................................................................... 138
REFERENCES……………………………………………………………………...... 140
APPENDICES
APPENDIX A. THE COEFFICIENT OF DETERMINATION (R2) VALUES
DISPLAYED ON DISTRIBUTION CHARTS OF MEASURED
AND MODELED ILLUMINANCE .................................................. 146
APPENDIX B. DISTRIBUTION OF MEASURED AND MODELED DAYLIGHT
ILLUMINANCE REGARDING MEASUREMENT POINTS .......... 147
APPENDIX C. DISTRIBUTION OF DAYLIGHT ILLUMINANCE AFTER THE
LASER CUT PANELS WERE APPLIED ......................................... 153
APPENDIX D. DISTRIBUTION OF DAYLIGHT ILLUMINANCE AFTER THE
PRISMATIC PANELS WERE APPLIED ......................................... 165
APPENDIX E. DISTRIBUTION OF DAYLIGHT ILLUMINANCE AFTER THE
LIGHT SHELVES (LS) WERE APPLIED ....................................... 177
ix
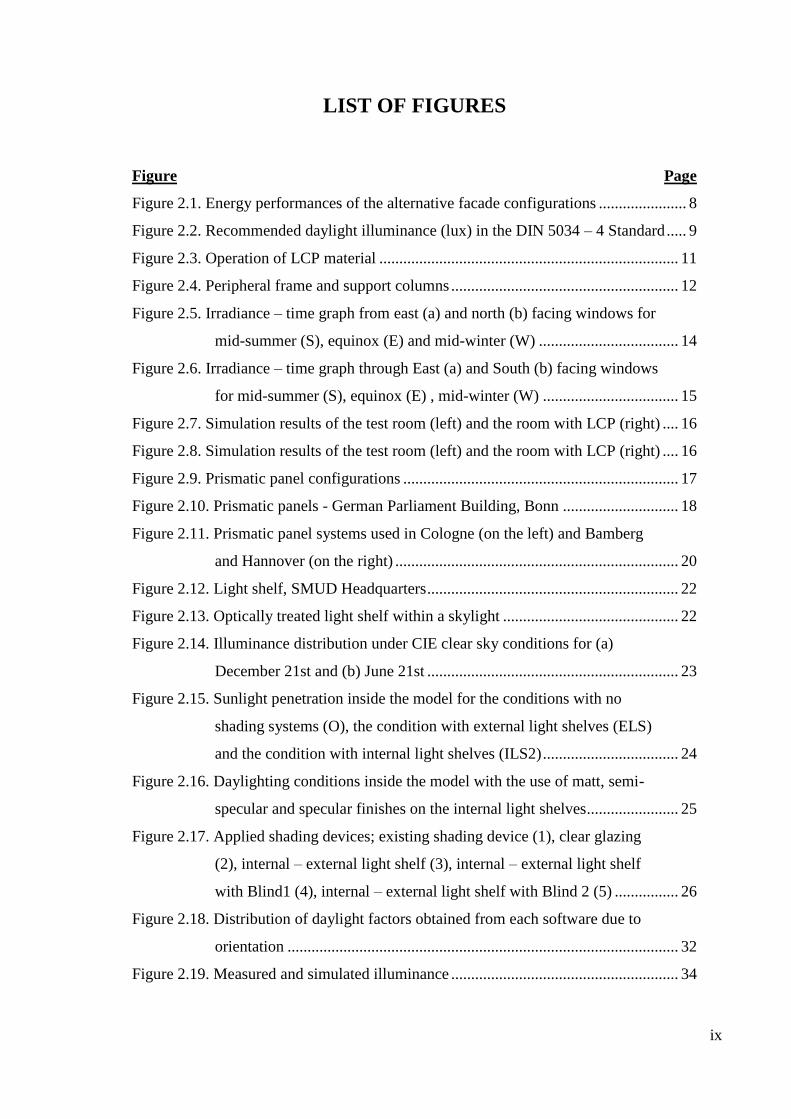
LIST OF FIGURES
Figure Page
Figure 2.1. Energy performances of the alternative facade configurations ...................... 8
Figure 2.2. Recommended daylight illuminance (lux) in the DIN 5034 – 4 Standard ..... 9
Figure 2.3. Operation of LCP material ........................................................................... 11
Figure 2.4. Peripheral frame and support columns ......................................................... 12
Figure 2.5. Irradiance – time graph from east (a) and north (b) facing windows for
mid-summer (S), equinox (E) and mid-winter (W) ................................... 14
Figure 2.6. Irradiance – time graph through East (a) and South (b) facing windows
for mid-summer (S), equinox (E) , mid-winter (W) .................................. 15
Figure 2.7. Simulation results of the test room (left) and the room with LCP (right) .... 16
Figure 2.8. Simulation results of the test room (left) and the room with LCP (right) .... 16
Figure 2.9. Prismatic panel configurations ..................................................................... 17
Figure 2.10. Prismatic panels - German Parliament Building, Bonn ............................. 18
Figure 2.11. Prismatic panel systems used in Cologne (on the left) and Bamberg
and Hannover (on the right) ....................................................................... 20
Figure 2.12. Light shelf, SMUD Headquarters ............................................................... 22
Figure 2.13. Optically treated light shelf within a skylight ............................................ 22
Figure 2.14. Illuminance distribution under CIE clear sky conditions for (a)
December 21st and (b) June 21st ............................................................... 23
Figure 2.15. Sunlight penetration inside the model for the conditions with no
shading systems (O), the condition with external light shelves (ELS)
and the condition with internal light shelves (ILS2) .................................. 24
Figure 2.16. Daylighting conditions inside the model with the use of matt, semi-
specular and specular finishes on the internal light shelves ....................... 25
Figure 2.17. Applied shading devices; existing shading device (1), clear glazing
(2), internal – external light shelf (3), internal – external light shelf
with Blind1 (4), internal – external light shelf with Blind 2 (5) ................ 26
Figure 2.18. Distribution of daylight factors obtained from each software due to
orientation .................................................................................................. 32
Figure 2.19. Measured and simulated illuminance ......................................................... 34
x
Figure 2.20. Criteria concerning (a) usability and graphical visualization usage
pattern, (b) information management according to user’s opinion ............ 38
Figure 3.1. General layout of the building (3rd floor) and the measurement points ...... 41
Figure 3.2. Layout of Studio S01 .................................................................................... 43
Figure 3.3. Basic layout of the studio S02 displaying measurement points, drawing
tables and openings as modeled in Ecotect. ................................................. 45
Figure 4.1. (a) The average, minimum and maximum illuminance in Studio S01
and (b) external illuminance at time of measurements ................................. 48
Figure 4.2. (a) The average, minimum and maximum illuminance in Studio S02
and (b) external illuminance at time of measurements ................................. 49
Figure 4.3. (a) The average, minimum and maximum illuminance in Studio S03
and (b) external illuminance at time of measurements ................................. 50
Figure 4.4. (a) The average, minimum and maximum illuminance in Studio S04
and (b) external illuminance at time of measurements ................................. 51
Figure 4.5. Distribution of daylight illuminance at measurement points on May 4th
for (a) S01, (b) S02, (c) S03, (d) S04 ........................................................... 53
Figure 4.6. Distribution of daylight illuminance at measurement points on June 21st
for (a) S01, (b) S02, (c)S03, (d) S04 ............................................................ 54
Figure 4.7. Average daylight illuminance at measurement rows on (a) May 4th and
(b) June 21st for S01 .................................................................................... 55
Figure 4.8. Average daylight illuminance at measurement rows on (a) May 4th and
(b) June 21st for S02 .................................................................................... 57
Figure 4.9. Average daylight illuminance at measurement rows on (a) May 4th and
(b) June 21st for S03 .................................................................................... 59
Figure 4.10. Average daylight illuminance at measurement rows on (a) May 4th
and
(b) June 21st for S04 ................................................................................... 60
Figure 4.11. Distribution of daylight illuminance measured at studios S01, S02,
S03, S04 on May 4th (a) in the morning, (b) at noon and (c) in the
afternoon ..................................................................................................... 62
Figure 4.12. Distribution of daylight illuminance measured at studios S01, S02,
S03, S04 on June 21st (a) in the morning, (b) at noon and (c) in the
afternoon ..................................................................................................... 63
xi
Figure 4.13. Measured and simulated results at (a) 09:00 for S01, R2=0.96;
(b) 09:25 for S02, R2=0.96 (c) 09:45 for S03, R2=0.97; (d) 10:05
for S04, R2=0.95; on May 4th .................................................................... 65
Figure 4.14. Measured and simulated results at (a) 12:30 for S01, R2=0.94;
(b) 13:00 for S02, R2=0.89; (c) 13:20 for S03, R2=0.92; (d) 13:45
for S04, R2=0.98 on May 4th ..................................................................... 66
Figure 4.15. Measured and simulated results at (a) 16:10 for S01, R2=0.88;
(b) 16:25 for S02, R2=0.92 (c) 16:45 for S03, R2=0.90; (d) 17:00
for S04, R2=0.96; on May 4th .................................................................... 67
Figure 4.16. Simulation results of the proposed systems for May 4th; (a) 09:00,
(b) 12:30, (c) 16:10 for Studio S01 ............................................................ 70
Figure 4.17. Simulation results of the proposed systems for May 4th; (a) 09:25,
(b) 13:00, (c) 16:25 for Studio S02 ............................................................ 71
Figure 4.18. Simulation results of the proposed systems for May 4th; (a) 09:45,
(b) 13:20, (c) 16:45 for Studio S03 ............................................................ 72
Figure 4.19. Simulation results of the proposed systems for May 4th; (a) 10:05,
(b) 13:45, (c) 17:00 for Studio S04 ............................................................ 73
Figure 4.20. Average daylight illuminance at measurement rows for (a) May 4th
and (b) June21st with LCP for studio S01 ................................................. 75
Figure 4.21. Simulated illuminance for May 4th, 09:00 for (a) the current condition
and (b) the condition with LCP for Studio S01 .......................................... 76
Figure 4.22. Illuminance contour lines showing distribution on May 4th, at 09:00
for (a) the current condition and (b) the condition with LCP for
Studio S01 .................................................................................................. 77
Figure 4.23. False colour representations on May 4th, at 09:00 for (a) the current
condition and (b) the condition with LCP for Studio S01 .......................... 78
Figure 4. 24. Radiance scenes showing human sensitivity of the studio S01 on
May 4th, at 09:00 for (a) the current condition and (b) the condition
with LCP .................................................................................................... 79
Figure 4.25. Average daylight illuminance at measurement rows for (a) May 4th
and (b) June 21st with LCP for studio S02 ................................................ 80
Figure 4.26. Simulated illuminance for May 4th, 09:25 for (a) the current condition
and (b) the condition with LCP for Studio S02 .......................................... 81
xii
Figure 4.27. Illuminance contour lines showing distribution on May 4th, at 09:25
for (a) the current condition and (b) the condition with LCP for
Studio S02 .................................................................................................. 82
Figure 4.28. False colour representations on May 4th, at 09:25 for (a) the current
condition and (b) the condition with LCP for Studio S02 .......................... 83
Figure 4.29. Radiance scenes showing human sensitivity on May 4th, at 09:25
for (a) the current condition and (b) the condition with LCP for
Studio S02 .................................................................................................. 84
Figure4.30. Average daylight illuminance at measurement rows for (a) May 4th
and (b) June 21st with LCP for studio S03 ................................................. 85
Figure 4.31. Simulated illuminance for May 4th, 09:45 for (a) the current condition
and (b) the condition with LCP for studio S03 .......................................... 86
Figure 4.32. Illuminance contour lines showing distribution on May 4th, at 09:45
for (a) the current condition and (b) the condition with LCP for
studio S03 ................................................................................................... 87
Figure 4.33. False colour representations on May 4th, at 09:45 for (a) the current
condition and (b) the condition with LCP for studio S03 .......................... 88
Figure 4.34. Radiance scenes showing human sensitivity on May 4th, at 09:45
for (a) the current condition and (b) the condition with LCP for
studio S03 ................................................................................................... 89
Figure 4.35. Average daylight illuminance at measurement rows for (a) May 4th
and (b) June 21st with LCP for studio S04 ................................................ 90
Figure 4. 36. Simulated illuminance for May 4th, 10:05 for (a) the current condition
and (b) the condition with LCP for studio S04 .......................................... 91
Figure 4.37. Illuminance contour lines showing distribution on May 4th, 10:05
for (a) the current condition and (b) the condition with LCP
for studio S04 ............................................................................................. 92
Figure 4.38. False colour representations on May 4th, at 10:05 for (a) the current
condition and (b) the condition with LCP for studio S04 .......................... 93
Figure 4.39. Radiance scenes showing human sensitivity on May 4th, at 10:05
for (a) the current condition and (b) the condition with LCP
for studio S04 ............................................................................................. 94
Figure 4.40. Simulated illuminance for May 4th, 09:00 for (a) the current condition
and (b) the condition with prismatic panel for studio S01 ......................... 96
xiii
Figure 4.41. Illuminance contour lines showing distribution on May 4th, 09:00
for (a) the current condition and (b) the condition with prismatic
panel for S01 .............................................................................................. 97
Figure 4.42. False colour representations for May 4th, 09:00 for (a) the current
condition and (b) the condition with prismatic panel for studio S01 ......... 98
Figure 4.43. Radiance scenes showing human sensitivity on May 4th, at 09:00
for (a) the current condition and (b) the condition with prismatic
panel for studio S01 .................................................................................... 99
Figure 4.44. Simulated illuminance for May 4th, 09:25 for (a) the current condition
and (b) the condition with prismatic panel for studio S02 ....................... 100
Figure 4.45. Illuminance contour lines showing distribution on May 4th, 09:25
for (a) the current condition and (b) the condition with prismatic
panel for S02 ............................................................................................ 101
Figure 4.46. False colour representations for May 4th, 09:25 for (a) the current
condition and (b) the condition with prismatic panel for studio S02 ....... 102
Figure 4.47. Radiance scenes showing human sensitivity on May 4th, at 09:25
for (a) the current condition and (b) the condition with prismatic panel
for studio S02 ........................................................................................... 103
Figure 4.48. Simulated illuminance for May 4th, 09:45 for (a) the current condition
and (b) the condition with prismatic panel for studio S03 ....................... 104
Figure 4.49. Illuminance contour lines showing distribution on May 4th, 09:45
for (a) the current condition and (b) the condition with prismatic
panel for S03 ............................................................................................ 105
Figure 4.50. False colour representations for May 4th, 09:45 for (a) the current
condition and (b) the condition with prismatic panel for studio S03 ....... 106
Figure 4.51. Radiance scenes showing human sensitivity on May 4th, at 09:45
for (a) the current condition and (b) the condition with prismatic
panel for studio S03 .................................................................................. 107
Figure 4.52. Simulated illuminance for May 4th, 10:05 for (a) the current condition
and (b) the condition with prismatic panel for studio S04 ....................... 108
Figure 4.53. Illuminance contour lines showing distribution on May 4th, 10:05
for (a) the current condition and (b) the condition with prismatic
panel for S04 ............................................................................................ 109
xiv
Figure 4.54. False colour representations for May 4th, 10:05 for (a) the
current condition and (b) the condition with prismatic panel for
studio S04 ................................................................................................. 110
Figure 4.55. Radiance scenes showing human sensitivity on May 4th, at 10:05
for (a) the current condition and (b) the condition with prismatic
panel for studio S04 .................................................................................. 111
Figure 4.56. Simulated illuminance for May 4th, 09:00 for (a) the current condition
and (b) the condition with light shelf for the studio S01 .......................... 113
Figure 4.57. Illuminance contour lines showing distribution on May 4th, 09:00
for (a) the current condition and (b) the condition with light shelf
for S01 ...................................................................................................... 114
Figure 4.58. False colour representations for May 4th, 09:00 for (a) the current
condition and (b) the condition with light shelf for the studio S01 .......... 115
Figure 4.59. Radiance scenes showing human sensitivity on May 4th, at 09:00
for (a) the current condition and (b) the condition with light shelf
for the studio S01 ..................................................................................... 116
Figure 4.60. Simulated illuminance for May 4th, 09:25 for (a) the current condition
and (b) the condition with light shelf for the studio S02 .......................... 117
Figure 4.61. Illuminance contour lines showing distribution on May 4th, 09:25
for (a) the current condition and (b) the condition with light shelf
for S02 ...................................................................................................... 118
Figure 4.62. False colour representations for May 4th, 09:25 for (a) the current
condition and (b) the condition with light shelf for the studio S02 .......... 119
Figure 4.63. Radiance scenes showing human sensitivity on May 4th, at 09:25
for (a) the current condition and (b) the condition with light shelf
for the studio S02 ..................................................................................... 120
Figure 4.64. Simulated illuminance for May 4th, 09:45 for (a) the current condition
and (b) the condition with light shelf for studio S03 ................................ 121
Figure 4.65. Illuminance contour lines showing distribution on May 4th, 09:45
for (a) the current condition and (b) the condition with light shelf
for S03 ...................................................................................................... 122
Figure 4.66. False colour representations for May 4th, 09:45 for (a) the current
condition and (b) the condition with light shelf for the studio S03 .......... 123
xv
Figure 4.67. Radiance scenes showing human sensitivity on May 4th, at 09:45
for (a) the current condition and (b) the condition with light shelf
for the studio S03 ..................................................................................... 124
Figure 4.68. Simulated illuminance for May 4th, 10:05 for (a) the current condition
and (b) the condition with light shelf for the studio S04 .......................... 125
Figure 4.69. Illuminance Contour lines showing distribution on May 4th, 10:05
for (a) the current condition and (b) the condition with light shelf
for S04 ...................................................................................................... 126
Figure 4.70. False colour representations for May 4th, 10:05 for (a) the current
condition and (b) the condition light shelf for the studio S04 .................. 127
Figure 4.71. Radiance scenes showing human sensitivity on May 4th, at 10:05
for (a) the current condition and (b) the condition with light shelf
for the studio S04 ..................................................................................... 128
xvi
LIST OF TABLES
Table Page
Table 2.1. An overview of daylighting simulation tools ................................................ 31
Table 2.2 Strengths / weaknesses of usability for Ecotect, Radiance and
DesignBuilder ................................................................................................. 39
Table 3.1. Geometrical properties of the studios ............................................................ 42
Table 3.2. Material characteristics of the Ecotect model ................................................ 46
Table 4.1. Calculated uniformity ratios Dmin / Dmax and Dmin / Dave for
(a) S01, (b) S02, (c) S03 and (d) S04 .......................................................... 129
Table 4.2. Overview of the simulation results of the four architectural studios
for the current condition on May 4th ........................................................... 131
Table 4.3. Overview of the simulation results of the four architectural studios
for the condition with LCP on May 4th ....................................................... 132
Table 4.4. Overview of the simulation results of the four architectural studios
for the condition with prismatic panels on May 4th .................................... 133
Table 4.5. Overview of the simulation results of the four architectural studios
for the condition with light shelves on May 4th ......................................... 134
1
CHAPTER 1
INTRODUCTION
In this chapter are presented first, the general topic of the study. Second,
arguments and research problem are explained in relation to previous studies who
worked on similar subjects. Then, objectives are mentioned as primary and secondary
objectives. The procedure of the study is explained in the next part, and finally the
contents of the study are briefly explained under disposition.
1.1. Argument
Daylighting systems are still the core elements to benefit from daylight to obtain
a satisfactory visual environment and to save energy effectively by allowing optimum
amount of light penetration into the interiors. They are composed of glazing,
fenestration, shading devices and/or light guiding systems. By following recent
technologies, it is almost possible to conclude that their efficiency will increase
considerably. Combination of system elements, application of new materials with
optical properties, and their sizing possibilities led to design advanced daylighting
systems continuously (Cutler, Sheng, Martin, Glaser, & Andersen, 2008; International
Energy Agency [IEA], 2000; Tsangrassoulis, 2008).
Daylighting performance, on the other hand, is the critical issue to design
interiors with adequate and properly distributed daylight illuminance to avoid glare
problems and occupant discomfort (Fontoynont, 1999). Significant energy savings may
also be obtained. Unequally distributed illuminance or disturbing brightness levels may
cause serious health problems and work-performance loss in study and work
environments (Leslie, 2003; Miyazaki, Akisawa, & Kashiwagi, 2005).
Consequently, designers demand to use several design tools to foresee the
outcomes of these issues about daylighting systems and to analyze their performance in
the design stage. It is then possible to correct any deficiencies (glare, uneven
illuminance) before construction. Generally, these tools are scale models, analytical
calculations and simulations (Egan, 2002; Littlefair, 2002). Daylighting simulation tools
2
have recently been more user friendly ones that are the most preferred by architects and
researchers.
Simulation tools have become essential in the design and evaluation process of
buildings. Specifically, they assist in daylighting performance studies and design with a
growing interest (Kim & Chung, 2011; Reinhart & Fitz, 2006). Well-proposed
daylighting strategies may decrease the buildings’ total energy consumption and
enhance user comfort. Thus, it is necessary to evaluate the quantity and quality of
daylight in a space both in the early design stage and during occupation (IEA, 2010;
Kim & Chung, 2011). This is recently a considerable component of sustainable design.
Thus, it is expected that, simulation tools should provide accurate visual and
quantitative outcomes in the preliminary steps of design.
To examine what kind of deficiencies about daylighting systems and
components exist in occupied buildings, simulation tools may be used. Several
daylighting tools are integrated in the comprehensive energy performance calculation
methods and legislations. Thus, it is necessary to obtain daylighting numerical outputs
and visual outcomes close to the real situations. The question related above is how their
physical correctness, adaptability and usability are determined and which one is more
suitable in design decision support and evaluation process than others.
This can be examined by comparing recently-used daylighting simulation
software in daylighting design with the ones integrated in analysis process. The most
reliable, adaptable and usable one would become the prevalent one to develop new
daylighting technologies. The major deficiencies pointed out as a result of a comparison
among software would be inputs to improve such software technologies in future. The
best accuracy obtained from one tool would assist professionals to design high energy
saving potential buildings, high user comfort in interiors, and low construction and
operating costs. The consideration is to seek the proper tool to predict the daylighting
performance and take early-precautions against deficiencies in the early design stages. It
is necessary to determine the appropriate tool to propose daylighting technology
decisions such as innovative shading and light guiding devices as building components.
This determination will depend on pointing out their strength and weaknesses.
Consequently, several criteria such as, compatibility with third party programs, working
as a plug-in or as standalone in nature, user interface, ease of use, characteristics of
output data, existence and source of climatic data, daylighting analysis and calculation
3
methods, 3D modeling capability would be the key points to be examined by several
studies.
In view of the recent and ongoing research, this thesis presents the modeling of
advanced daylighting systems to evaluate illuminance and uniformity in architectural
design studios in Izmir Institute of Technology Faculty of Architecture. First, a
preliminary study was conducted to determine the appropriate tool to propose
daylighting technology decisions such as innovative shading and light guiding devices
as building components (Kazanasmaz & Fırat, 2012). So, literature about the
application of daylighting simulations tools, their technical comparisons and their
strengths/or weaknesses were reviewed. The analysis tool for this thesis was selected by
the comparison of the recently and mostly used daylighting simulation software,
namely, Desktop Radiance, Design Builder, Ecotect and Velux Visualizer, in
daylighting design with the ones integrated in analysis process. Then, the simulation
models were built in Ecotect and lighting analyses were conducted by Desktop
Radiance. The performance of the model and the existing lighting conditions were
quantitatively investigated and validated by measurements. The aim was to determine
the optimum design solution by applying advanced daylighting systems with different
size and material combinations.
Architectural design students need to study in a properly designed visual
environment. The success of their works/or products are directly and initially related
with their visual performance. Detailed drawings and models which are composed of
tiny pieces of materials would easily be seen and perceived by only satisfying a uniform
and high amount of illuminance. At this point, this study would guide all related
professionals who should be aware of this problem. Designers should pay attention to
apply requirements mentioned in the standards/or norms about daylighting in the design
stage. Every retrofitting application to overcome the deficiencies of an improperly-
designed daylighting system might not improve the visual performance of the interior
space. Thus, early precautions should be taken in the design stage by utilizing
appropriate design tools. This study would be a trial one to display this argument.
4
1.2. Objectives
Objectives of this study were suggested and employed by utilizing field
measurements of daylight illuminance and modeling new daylighting systems under the
purpose of evaluating the daylight illuminance and uniformity in architectural design
studios.
The objectives of this study were defined as primary and secondary objectives.
The primary objectives of this study were:
a. to evaluate advanced daylighting systems in order to obtain optimum design
solutions for the architectural design studios by developing Ecotect /
Radiance model;
b. to draw attention to the daylighting simulation tools that might help the
architects to make time and cost effective pre-tests before the construction
stages;
c. to remind professionals / designers about the necessity of daylighting
systems which should be considered at the design stage.
The secondary objectives of this study were:
a. to explore daylighting issues in educational buildings and advanced
daylighting systems;
b. to discover the usability and adaptability of daylighting simulation tools;
c. to calculate uniformity ratios related to daylight illuminance;
d. to compare the illuminance and uniformity ratios for each daylighting
system;
e. to explore the each daylighting system’s applicability in the existing
architectural studios.
1.3. Procedure
This thesis aimed to find an optimum daylighting solution in architectural design
studios by employing a simulation model under the light of field measurements. In the
view of this purpose, this study was carried out in five phases:
5
In the first, a general survey about daylighting design criteria of educational
buildings and an overview of advanced daylighting systems and daylighting simulation
tools was conducted.
In the second, physical description of the educational building which belong to
the Faculty of Architecture in İzmir Institute of Technology and climatic data of İzmir
were introduced briefly. Field measurements of daylight illuminance were carried out in
four architectural studios in the mentioned building in the Faculty of Architecture in
IYTE. Daylight illuminance and uniformity ratios were noted down in separate data
sheets for each measurement time.
In the third, by utilizing the collected data, a simulation model of the existing
studios were prepared after the survey. A comparison between the measurements and
simulation findings was used to validate and finalize the simulation model.
In the fourth, as the simulation model was set, trial models were arranged by
applying proposed advanced daylighting systems in order to improve the illuminance
and uniformity in the studios.
In the fifth, the findings of each model with a daylighting system were compared
and evaluated according to standards, design norms and previous literature in order to
find an optimum solution for an existing building.
6
CHAPTER 2
LITERATURE SURVEY
2.1. Daylighting Performance of Educational Buildings
Providing evenly-distributed and adequate daylight into the educational
buildings is highly substantial, since the daylighting performance of these interiors
deeply affects the students’ learning capability, motivation, study performance, stamina
and psychological conditions (Erlalelitepe, Aral, & Kazanasmaz, 2011; Güvenkaya &
Küçükdoğu, 2009; Kesten & Yener, 2006; Winterbottom & Wilkins, 2009; Yener,
Güvenkaya, & Şener, 2009). Also educational facilities are mostly day time occupied
buildings and optimizing use of daylight in these interiors would prevent excessive use
of electric energy (Erlalelitepe et. al., 2011; Güvenkaya & Küçükdoğu, 2009; Kesten &
Yener, 2006; Yener et. al., 2009). Thus, maintaining adequate amount of daylight and
an even distribution is crucial in daylighting design of these spaces (Erlalelitepe et. al.,
2011; Kesten & Yener, 2006; Yener et. al., 2009).
2.1.1. Daylighting Design Criteria
In the educational buildings, the spaces that learning and teaching activities take
place have special daylighting needs. In order to provide a healthy environment for
conducting the educational tasks in these interiors, the horizontal daylight illuminance
on the working plane levels (on the desk and table surfaces) as well as the vertical
illuminance on the boards and walls should be adequate and uniformly distributed and
glare problems that may occur in these surfaces should be eliminated (Erlalelitepe et.
al., 2011; Yener et. al., 2009). In order to prevent overheating problems and glare,
occupant controlled shading systems should be introduced in the conditions that direct
sun light enters the classrooms. Artificial lighting systems also should be integrated
with daylighting to minimize the electric energy usage (Kesten & Yener, 2006; Yener
et. al., 2009).
7
In a research conducted by Erlalelitepe et. al. (2011), daylighting conditions of
five spaces facing different directions and used for different purposes (lecture hall,
classroom, laboratory, office and hall) at the building of Department of Mechanical
Engineering at Izmir Institute of Technology was analyzed. According to the field
measurements conducted in these spaces in December, daylighting levels in the
southwest and southeast facing spaces, namely, lecture hall, office and classroom, was
adequate in only one measurement day, during the measurements conducted in the
morning and at noon. The illuminance levels measured in the office was lower than the
classroom, although the two spaces had the same amount of glazing ratio and were
facing the same direction. According to Erlalelitepe et. al. (2011), the difference in the
illuminance might be because of the different sun control strategies of the two spaces;
vertical and horizontal elements forming balconies in front of the offices prevented the
sun more than the metal sun shading elements on the classroom windows. Erlalelitepe
et. al. (2011) concluded that, existing façade design of the studied building should be
reconsidered with different shading and glazing systems.
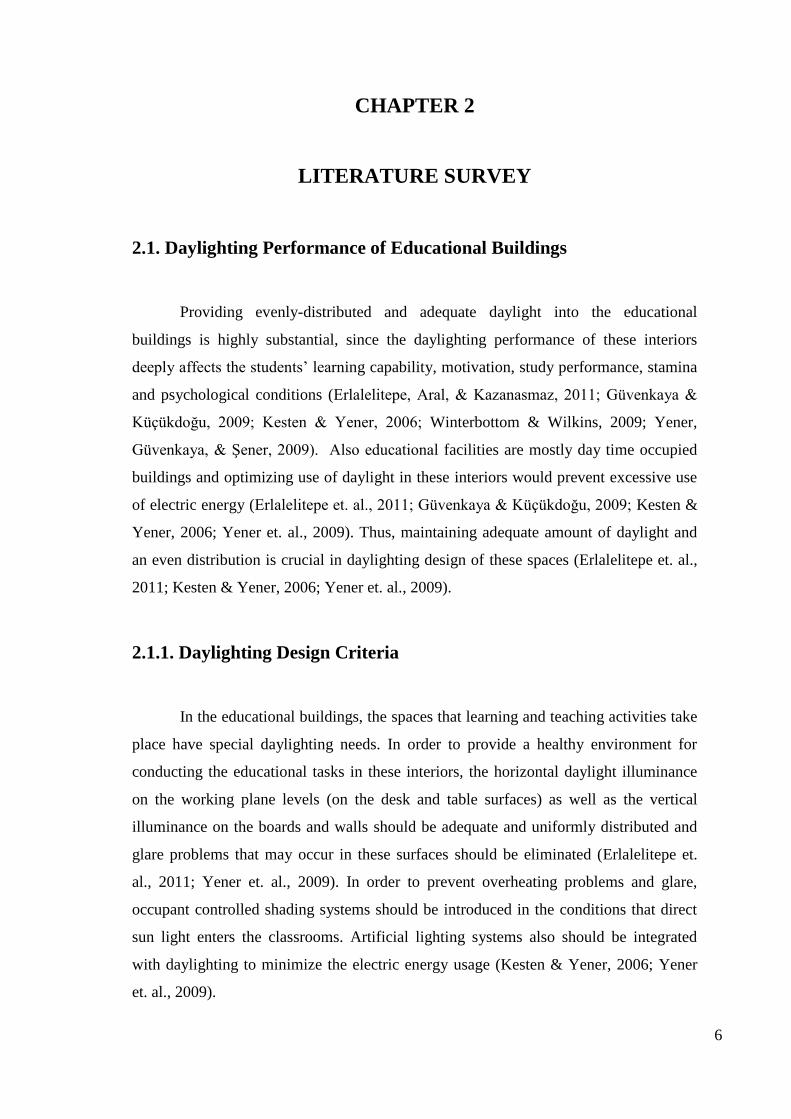
Güvenkaya and Küçükdoğu (2009) conducted a research aiming to determine
“the most appropriate direction dependant façade orientation” in the elementary school
buildings. A typical classroom designed by the Ministry of Public Works and
Settlement was selected for the study and daylighting calculations were conducted using
Radiance; first with the existing façade, latter with the proposed configurations. The
shading devices used in the proposed façades were horizontal and tilted at different
angles regarding the sun’s movement and direction of the applied façade. Two façade
configurations were proposed; first one consisted of fixed shading devices and was
assumed to be used during the whole educational season (proposal 1) and the other one
was assumed to be used only when the shading is needed (proposal 2). The Radiance
simulations indicated that, proposal 1 (fixed configuration throughout the educational
season) was a better alternative than the existing façades when applied to the north and
south facades. Proposal 1 caused 17% to 54% more electric energy consumption than
the existing condition, when applied to east and west facades. The findings indicated
that Proposal 2 was a better alternative than the existing condition; with a reduced
energy consumption of 0.35% to 0.9 % when applied to the north façade, 41% to 74%
to the south façade, 23% to 64% to the west façade and 37% to 78% to the east façade
(Figure 2.1).
8
Figure 2.1. Energy performances of the alternative facade configurations
(Source: Güvenkaya & Küçükdoğu, 2009)
2.1.2 Daylighting Standards
Daylighting legislations could not have been thoroughly identified and
developed due to the unforeseen and unstable nature of daylight. Legislations and
regulations regarding daylight should not only consider illuminance levels but also take
illumination time frame into consideration (Erlalelitepe et. al., 2011).
In some of the developed building codes and regulations, requirements for
educational buildings are present. These standards differ from each other regarding on
which principals they base on; daylight - factor, window – size, daylighting etc.
(Boubekri, 2004; Erlalelitepe et. al., 2011).
A window-size based standard in UK, The British Code BR 8206 (Part 2),
requires a window area of %25 of the total external wall area in institutional buildings,
while DIN 5034 – 4 , a German standard, determines required daylight levels regarding
the difficultness of the conducted visual tasks in the interiors (Boubekri, 2004;
Erlalelitepe et. al., 2011) (Figure 2.2).
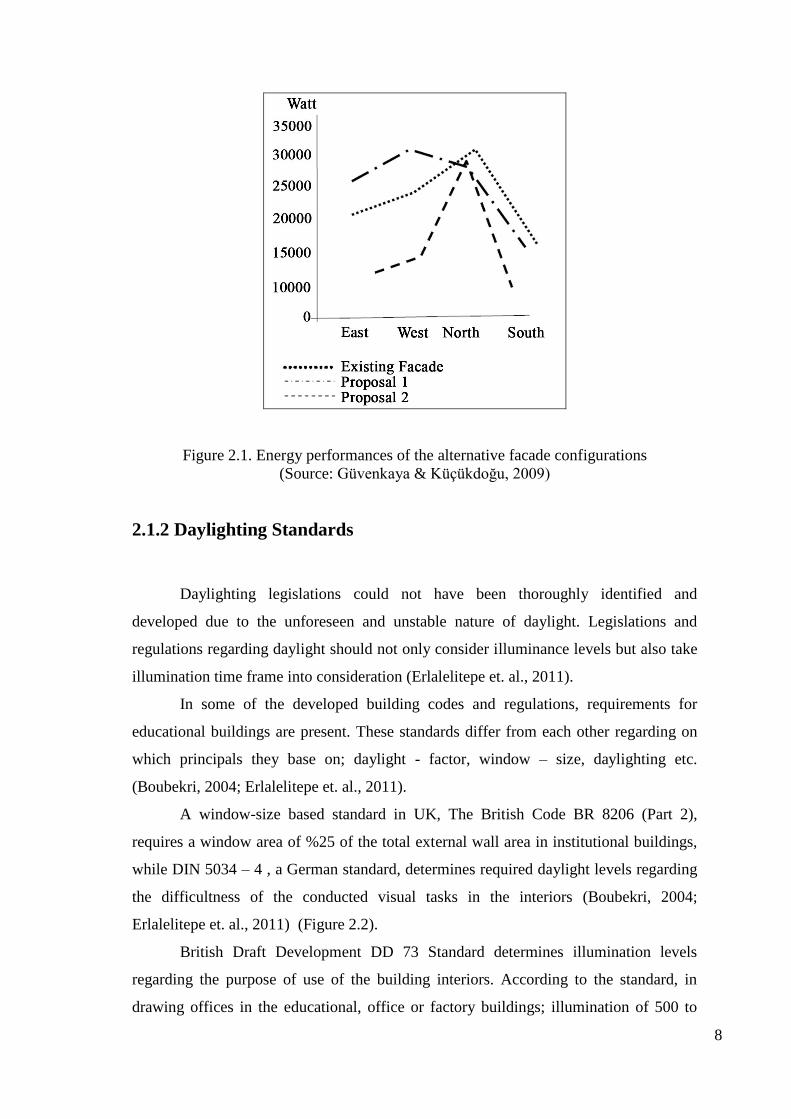
British Draft Development DD 73 Standard determines illumination levels
regarding the purpose of use of the building interiors. According to the standard, in
drawing offices in the educational, office or factory buildings; illumination of 500 to
9
750 lux should be maintained. The standard recommends maintaining illuminance of
300 to 500 lux in formal teaching and seminar rooms, 300 to 500 lux in deep plan
teaching spaces, 300 lux in the music and music practice rooms (Boubekri, 2004;
Erlalelitepe et. al., 2011).
Stage Daylight Illuminance (Lux) Visual Task
1 15
2 30
3 60
4 125
5 250
6 500
7 750
8 1000
9 1500
10 2000
11 3000
12 5000 and moreVery Special Task
Temporary Task
Easy Task
Normal Task
Difficult Task
Very Difficult Task
Figure 2.2. Recommended daylight illuminance (lux) in the DIN 5034 – 4 Standard
(Source: Boubekri, 2004)
2.2. Daylighting Systems
International Energy Agency [IEA] (2010) defines a daylighting system as a
system which “combines simple glazing with some other element that enhances the
delivery or control of light into a space” (p. 3). According to IEA, the functions of the
daylighting systems can be summarized as follows:
10
- Introducing daylight into deeper spaces from the window wall than is possible
with conventional designs.
- Increasing usable daylight at climates with dominant overcast skies or at
climates where sun control is crucial.
- Increasing usable daylight in the case of exterior obstructions and transporting
daylight into windowless spaces.
The working principle of daylighting systems includes adding reflective or
refractive elements into the glazing system, regarding the purpose of their use. The
daylighting behaviours of the systems also depend on where they are installed in the
buildings; to the building façade or to the skylight, for instance. In principal, the
daylighting systems have two main characteristics: they have or do not have shading
capability. The systems that provide shading block direct sunlight entirely and allow
diffuse skylight into the interiors; or they use direct sunlight and redirect it into the
spaces. On the other hand, the systems that do not provide shading redirect sunlight into
deeper spaces away from the daylighting apertures (IEA, 2010; Köster, 2004;
Kischkoweit - Lopin, 2002; Lim & Kim, 2010).
The types of daylighting systems can be summarized as follows; louver and
blind systems (prismatic louvers, light deflecting glass mirror louvers, mirroring
louvers, daylight louvered blinds, turnable lamellas), light shelves, prismatic light-
deflection systems (prismatic panels, laser cut panels), anidolic systems (ceilings,
zenithal openings, solar blinds), shading systems with holographic optical elements,
scattering systems and light transporting systems ( light pipes, solar tubes, heliostats,
fibres) (Bostancı, 2006; Hansen, 2006; IEA, 2000; IEA, 2010; Köster, 2004;
Kischkoweit - Lopin, 2002). In this thesis, three of these systems, namely, laser cut
panels, prismatic panels, and light shelves, which are in close relation with the
conducted study are explained in detail.
2.2.1. Laser Cut Panels
Laser cut panels are daylight-redirecting elements that have been developed by
the Australian physicist Ian Edmonds (Köster, 2004). Laser Cut Panels are effective
light deflection systems and improve the distribution of daylight and reject excessive
solar heat gains in the interiors. The panels have been applied in a wide range of regions
11
throughout the world; from equatorial and subtropical to the high latitudes, where
redirection of daylight is crucial to avoid glare and excessive solar gains, and also where
the panels can redirect low-elevation daylight into low illuminated interiors (Greenup,
Edmonds, & Compagnon, 2000; Reppel & Edmonds, 1998).
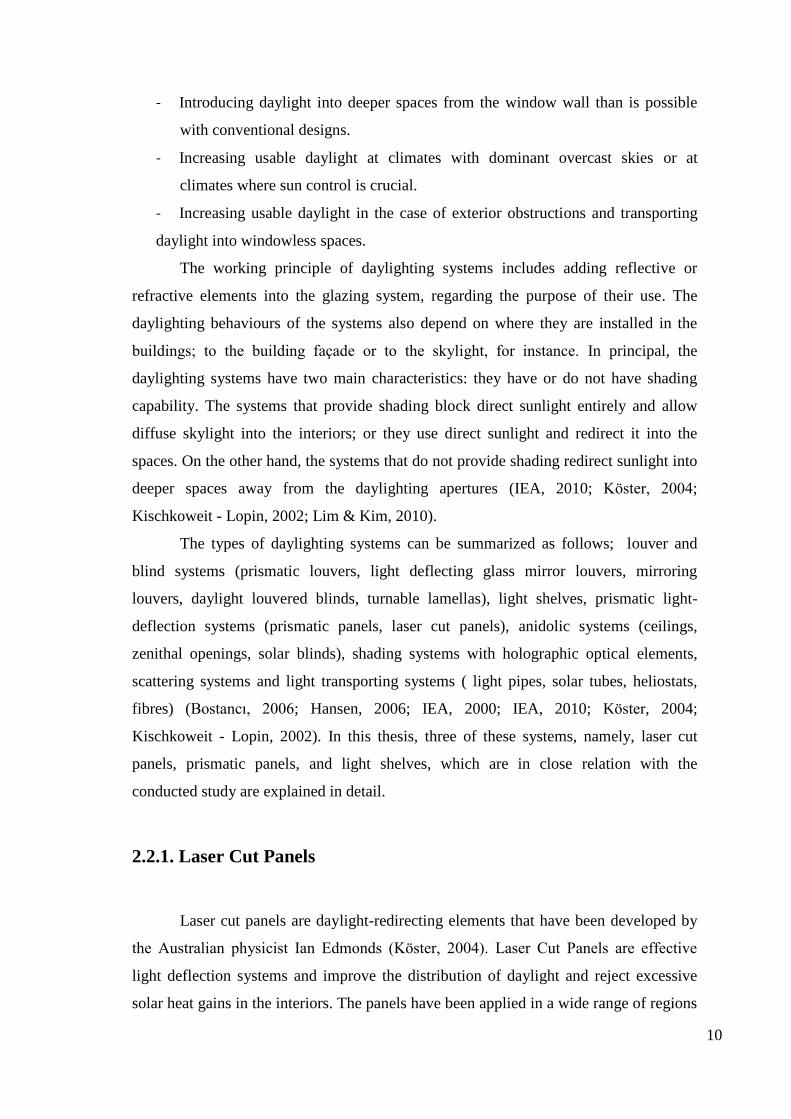
Figure 2.3. Operation of LCP material
(Source: Greenup, Edmonds, & Compagnon, 2000)
Laser cut panels are made of clear acrylic and are produced by laser cutting into
the acrylic sheets that create arrays of rectangular elements. Each cut surface within the
panel acts as a mirror. The panels work on the principle of redirecting daylight coming
to the panel by refraction, internal reflection and then refraction (Figure 2.3). Since all
the deflections are in the same direction, they are highly effective; much more effective
than the prismatic glass (Edmonds & Greenup, 2002; Greenup et. al., 2000; Hocheng,
Huang, Chou, & Yang, 2010; IEA, 2000).
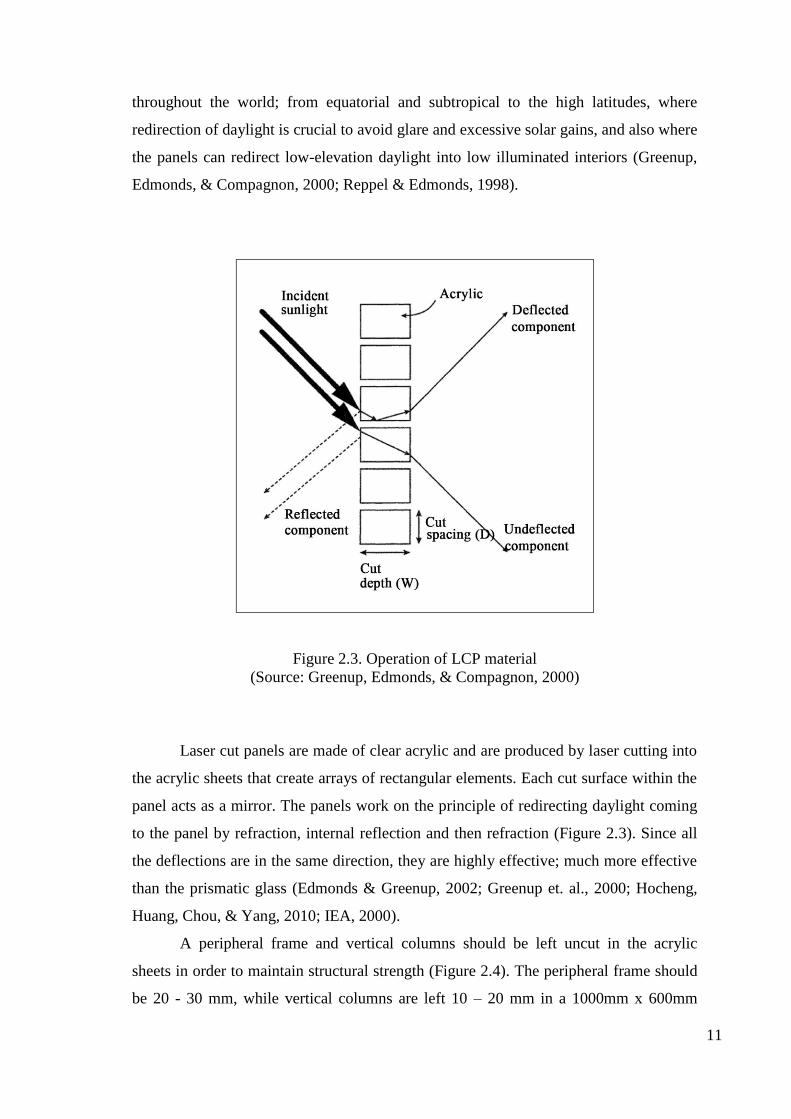
A peripheral frame and vertical columns should be left uncut in the acrylic
sheets in order to maintain structural strength (Figure 2.4). The peripheral frame should
be 20 - 30 mm, while vertical columns are left 10 – 20 mm in a 1000mm x 600mm
12
panel, for instance (IEA, 2000). The laser cuts can be processed throughout the panel or
partway to the panel; although the latter is not preferred due to the manufacturing
difficulties. Making the cuts at an angle to the normal to direct the deflected light to a
more controlled direction is also possible (Edmonds & Greenup, 2002; Greenup et. al.,
2000; IEA 2000; Reppel & Edmonds 1998).
The panels are transparent and they do not prevent exterior view, but some
distortion is inevitable (Figure 2.4). Also, the redirected daylight coming from the
panels may cause glare problems in the interiors when the occupants are near the
windows. Thus, placing the panels to the daylighting openings instead of view windows
or above eye level is suggested (IEA, 2000).
Laser cut panels can be applied to the windows as fixed sun shading systems,
fixed or movable daylight redirecting systems or sun shading – daylight redirecting
systems in louver or venetian forms. The panels can also be applied to the skylights in
fixed configuration (IEA, 2000).
Figure 2.4. Peripheral frame and support columns
(Source: International Energy Agency, 2000)
13
When fixed vertically into a window, the laser cut panels transmit most of the
light incident from below 20o and deflect most of the light incident from above 45
o;
which means a high portion of high elevation light is deflected onto the ceiling. This
deflected light on the ceiling than becomes a secondary light source of diffuse
illumination and illuminate farther back into the rooms; like in the case of using light
shelves (Edmonds & Greenup, 2002; Greenup et. al., 2000; IEA, 2000).
Energy savings that can be obtained by using laser cut panels depend on the
application; but, by using fixed panels in the upper one third of an open window to
deflect light farther back into the room, increase the average level of natural light in the
deeper areas by 10 to 30%, depending on sky conditions (Edmonds & Greenup, 2002;
IEA, 2000).
There are many application examples of laser cut panels, mostly in daytime
occupied buildings like offices or educational facilities.
In a research conducted at an office building in Sandvika, Norway at latitude
59oN, two identical rooms, a control room and a test room, were used to comprehend
the daylighting effects of the laser cut panels. Laser cut panels were positioned above a
view window in the test room. The illuminance measurements were carried out in the
rooms and the results showed that; during overcast sky conditions, the laser cut panels
had almost no effects on the illuminance or the distribution of daylight in the test room.
But in the clear sky conditions, especially in the intermediate zone of the room, the
panels increased the illuminance at most parts of the day, during the year (IEA, 2000).
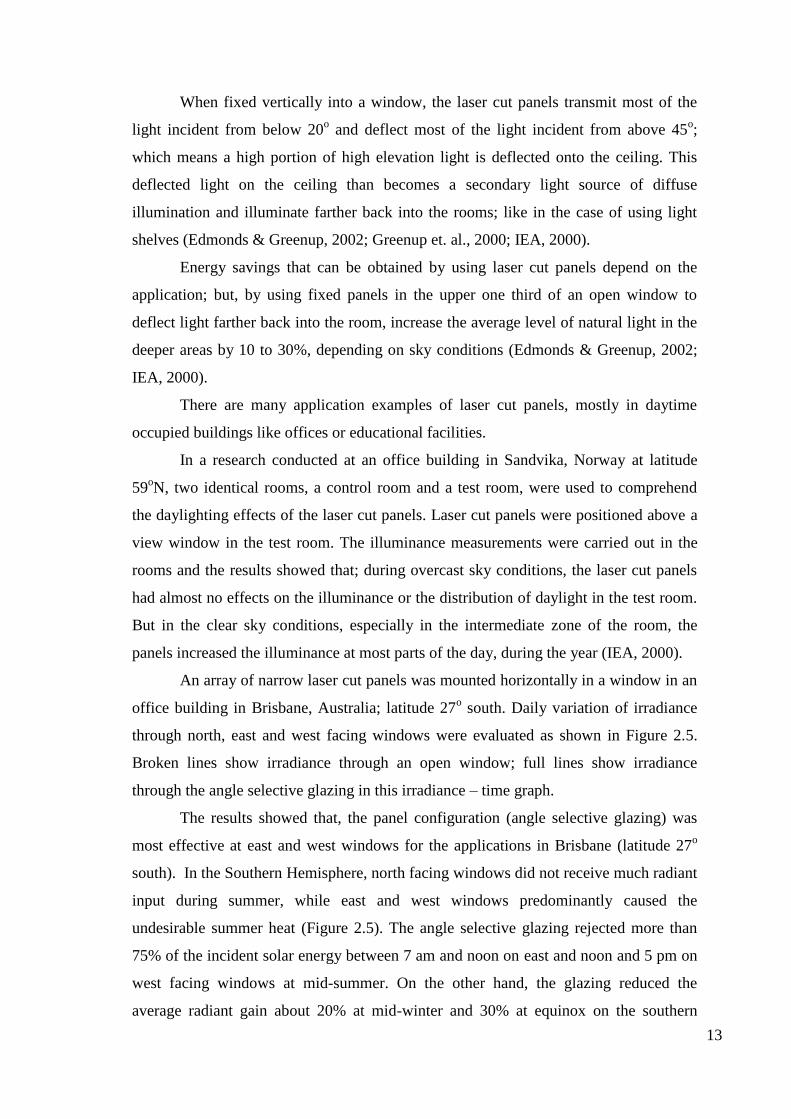
An array of narrow laser cut panels was mounted horizontally in a window in an
office building in Brisbane, Australia; latitude 27o south. Daily variation of irradiance
through north, east and west facing windows were evaluated as shown in Figure 2.5.
Broken lines show irradiance through an open window; full lines show irradiance
through the angle selective glazing in this irradiance – time graph.
The results showed that, the panel configuration (angle selective glazing) was
most effective at east and west windows for the applications in Brisbane (latitude 27o
south). In the Southern Hemisphere, north facing windows did not receive much radiant
input during summer, while east and west windows predominantly caused the
undesirable summer heat (Figure 2.5). The angle selective glazing rejected more than
75% of the incident solar energy between 7 am and noon on east and noon and 5 pm on
west facing windows at mid-summer. On the other hand, the glazing reduced the
average radiant gain about 20% at mid-winter and 30% at equinox on the southern
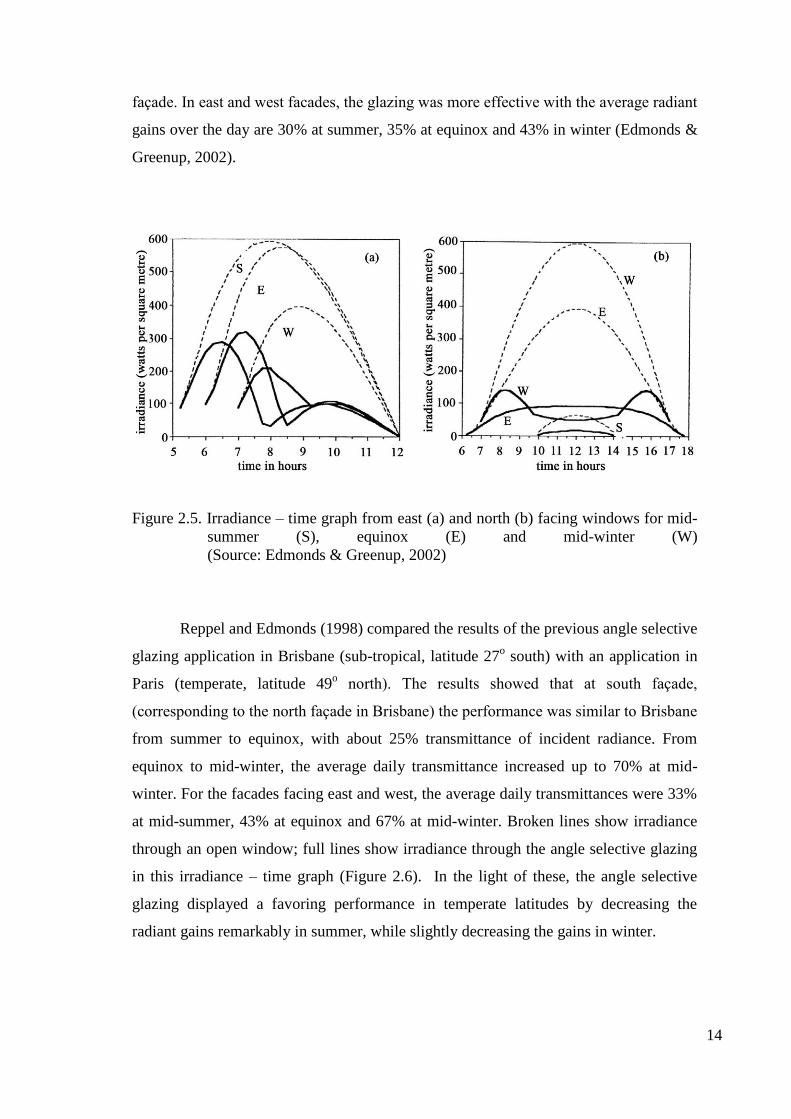
14
façade. In east and west facades, the glazing was more effective with the average radiant
gains over the day are 30% at summer, 35% at equinox and 43% in winter (Edmonds &
Greenup, 2002).
Figure 2.5. Irradiance – time graph from east (a) and north (b) facing windows for mid-
summer (S), equinox (E) and mid-winter (W)
(Source: Edmonds & Greenup, 2002)
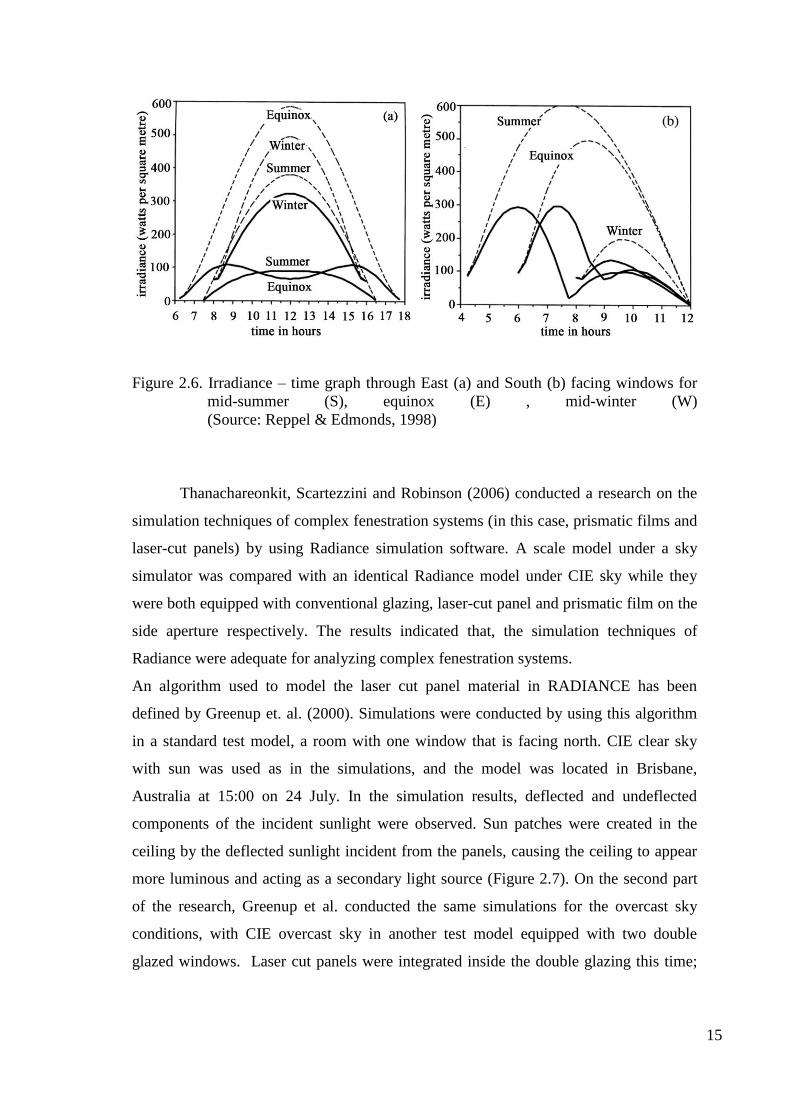
Reppel and Edmonds (1998) compared the results of the previous angle selective
glazing application in Brisbane (sub-tropical, latitude 27o south) with an application in
Paris (temperate, latitude 49o north). The results showed that at south façade,
(corresponding to the north façade in Brisbane) the performance was similar to Brisbane
from summer to equinox, with about 25% transmittance of incident radiance. From
equinox to mid-winter, the average daily transmittance increased up to 70% at mid-
winter. For the facades facing east and west, the average daily transmittances were 33%
at mid-summer, 43% at equinox and 67% at mid-winter. Broken lines show irradiance
through an open window; full lines show irradiance through the angle selective glazing
in this irradiance – time graph (Figure 2.6). In the light of these, the angle selective
glazing displayed a favoring performance in temperate latitudes by decreasing the
radiant gains remarkably in summer, while slightly decreasing the gains in winter.
15
Figure 2.6. Irradiance – time graph through East (a) and South (b) facing windows for
mid-summer (S), equinox (E) , mid-winter (W)
(Source: Reppel & Edmonds, 1998)
Thanachareonkit, Scartezzini and Robinson (2006) conducted a research on the
simulation techniques of complex fenestration systems (in this case, prismatic films and
laser-cut panels) by using Radiance simulation software. A scale model under a sky
simulator was compared with an identical Radiance model under CIE sky while they
were both equipped with conventional glazing, laser-cut panel and prismatic film on the
side aperture respectively. The results indicated that, the simulation techniques of
Radiance were adequate for analyzing complex fenestration systems.
An algorithm used to model the laser cut panel material in RADIANCE has been
defined by Greenup et. al. (2000). Simulations were conducted by using this algorithm
in a standard test model, a room with one window that is facing north. CIE clear sky
with sun was used as in the simulations, and the model was located in Brisbane,
Australia at 15:00 on 24 July. In the simulation results, deflected and undeflected
components of the incident sunlight were observed. Sun patches were created in the
ceiling by the deflected sunlight incident from the panels, causing the ceiling to appear
more luminous and acting as a secondary light source (Figure 2.7). On the second part
of the research, Greenup et al. conducted the same simulations for the overcast sky
conditions, with CIE overcast sky in another test model equipped with two double
glazed windows. Laser cut panels were integrated inside the double glazing this time;
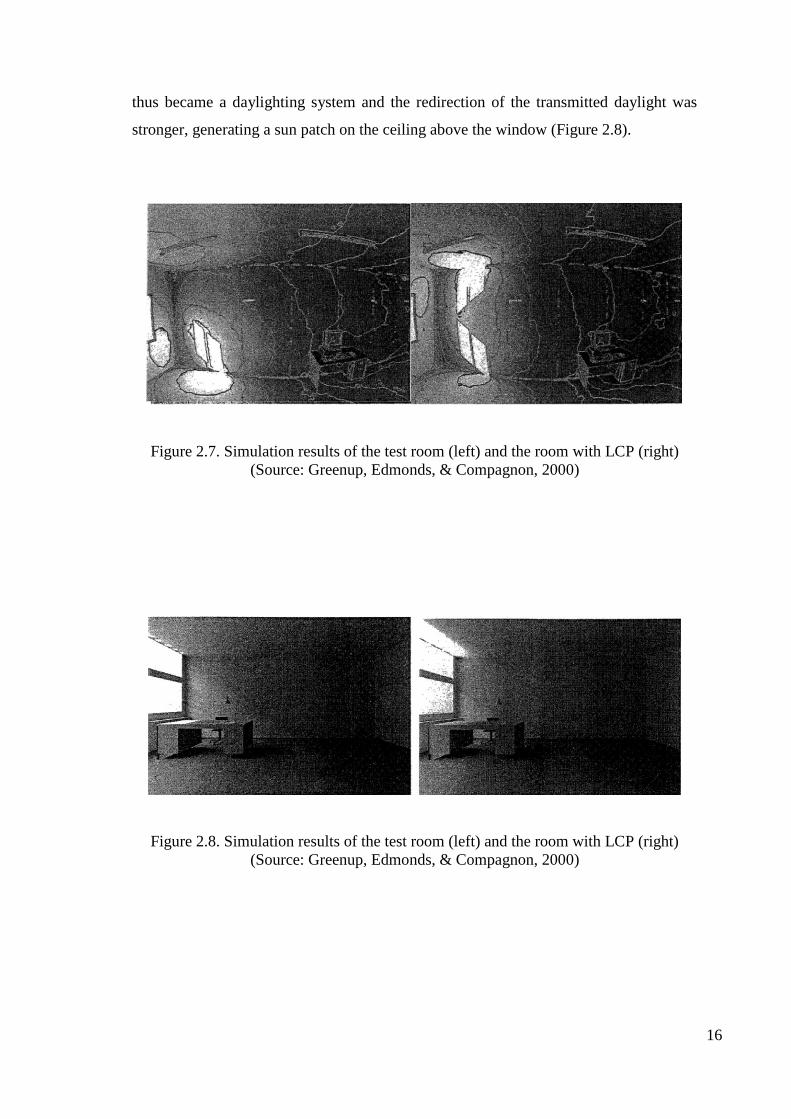
16
thus became a daylighting system and the redirection of the transmitted daylight was
stronger, generating a sun patch on the ceiling above the window (Figure 2.8).
Figure 2.7. Simulation results of the test room (left) and the room with LCP (right)
(Source: Greenup, Edmonds, & Compagnon, 2000)
Figure 2.8. Simulation results of the test room (left) and the room with LCP (right)
(Source: Greenup, Edmonds, & Compagnon, 2000)
17
2.2.2. Prismatic Panels
Prismatic light-guiding systems (prismatic panels) have been developed by
Christian Bartenbach (Köster, 2004). They are used for redirecting or refracting
daylight. The main function of the panels is to deliver daylight into deeper areas away
from the daylighting apertures (Hocheng et. al., 2010; IEA, 2000; IEA, 2010; Laouadi,
Saber, Galasiu, & Arsenault, 2013; Littlefair & Motin, 2001; Sweitzer, 1991).
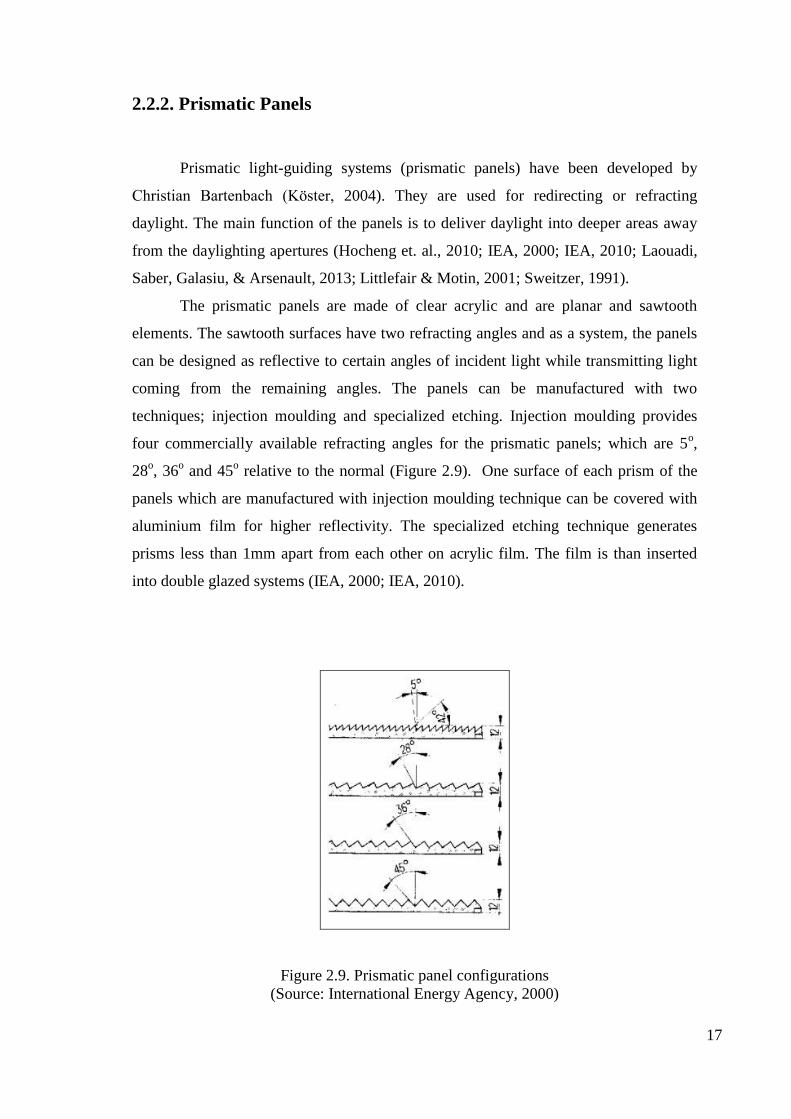
The prismatic panels are made of clear acrylic and are planar and sawtooth
elements. The sawtooth surfaces have two refracting angles and as a system, the panels
can be designed as reflective to certain angles of incident light while transmitting light
coming from the remaining angles. The panels can be manufactured with two
techniques; injection moulding and specialized etching. Injection moulding provides
four commercially available refracting angles for the prismatic panels; which are 5o,
28o, 36
o and 45
o relative to the normal (Figure 2.9). One surface of each prism of the
panels which are manufactured with injection moulding technique can be covered with
aluminium film for higher reflectivity. The specialized etching technique generates
prisms less than 1mm apart from each other on acrylic film. The film is than inserted
into double glazed systems (IEA, 2000; IEA, 2010).
Figure 2.9. Prismatic panel configurations
(Source: International Energy Agency, 2000)
18
Prismatic panels can be used for solar shading or daylight redirection purposes.
When the panels are used for shading, they can be in fixed or movable configurations
and they block the direct sunlight and permit diffuse skylight into the interiors. Fixed
sun-shading prismatic panel systems are usually applied to the glazed roofs and are
designed regarding the sun movement. Movable sun-shading prismatic panel systems
are used in louver forms in vertical or horizontal applications. When used as light
redirecting devices, the panels are mounted to the facades and direct sun light or diffuse
daylight into the rooms (IEA, 2000; IEA, 2010).
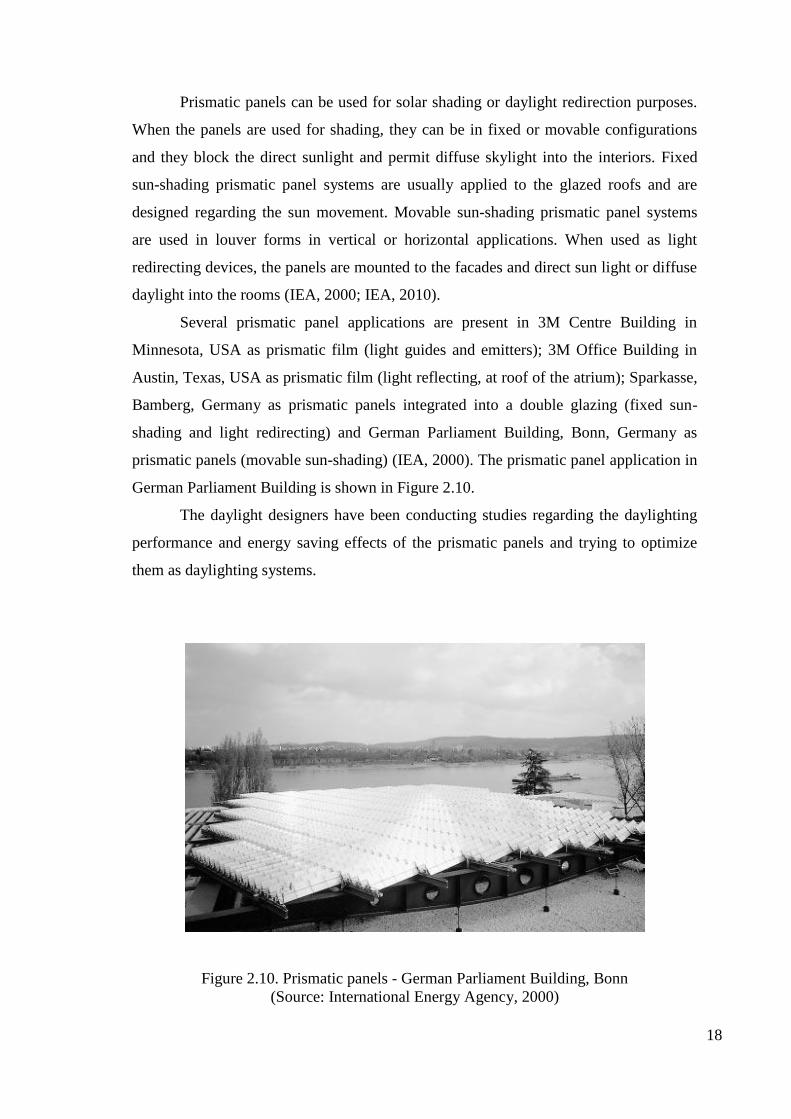
Several prismatic panel applications are present in 3M Centre Building in
Minnesota, USA as prismatic film (light guides and emitters); 3M Office Building in
Austin, Texas, USA as prismatic film (light reflecting, at roof of the atrium); Sparkasse,
Bamberg, Germany as prismatic panels integrated into a double glazing (fixed sun-
shading and light redirecting) and German Parliament Building, Bonn, Germany as
prismatic panels (movable sun-shading) (IEA, 2000). The prismatic panel application in
German Parliament Building is shown in Figure 2.10.
The daylight designers have been conducting studies regarding the daylighting
performance and energy saving effects of the prismatic panels and trying to optimize
them as daylighting systems.
Figure 2.10. Prismatic panels - German Parliament Building, Bonn
(Source: International Energy Agency, 2000)
19
In a research conducted at an office building in Sandvika, Norway at latitude
59oN, the daylighting measurements are conducted in two identical rooms, the test room
and the reference room. In the test room, prismatic panels (45o) were used vertically and
positioned above a view window; occupying 31% of the total glazing area. The window
in the reference room had clear glazing. The results showed that under overcast skies,
prismatic panels decreased the illuminance about % 25 - % 35 in the test room and the
distribution was less uniform. But under summer clear sky conditions, the distribution
was more uniform than the reference room. Also, the average illuminance was increased
by 14% and this increase was up to 30% near the rear wall (IEA, 2000).
In a study conducted by the Building Research Establishment (BRE); a prismatic
film system (62° and 78°) and a prismatic panel with light directing characteristics by
Siemens (45° and 90°) was tested in the BRE office facility in Garston, UK. In summer
and equinox, in direct sun, the illuminance was 10 to 20% higher at the intermediate and
rear zones with prismatic film than the condition with clear glazing. Also, the film
redirected sunlight to the ceiling, and illuminated the middle area. In winter, the
performance of the prismatic film decreased under cloudy conditions (10 to 30%
reduction), although the films prevented the glare. In summer, under clear sky
conditions, prismatic light-directing panels mostly blocked sunlight and reduced
illuminance in the room. In equinox, under clear sky conditions, illuminance increased
at the rear zone over 100%. During overcast sky conditions, the panels reduced the
illuminance in the room by 35 to 45 %. In winter, under clear sky conditions, the
illuminance at the deepest areas in the room was decreased by half, because the panels
prevented the light that would have illuminate the rear zone by redirecting it onto the
front areas of the ceiling. The panels prevented glare in all daylighting conditions (IEA,
2000).
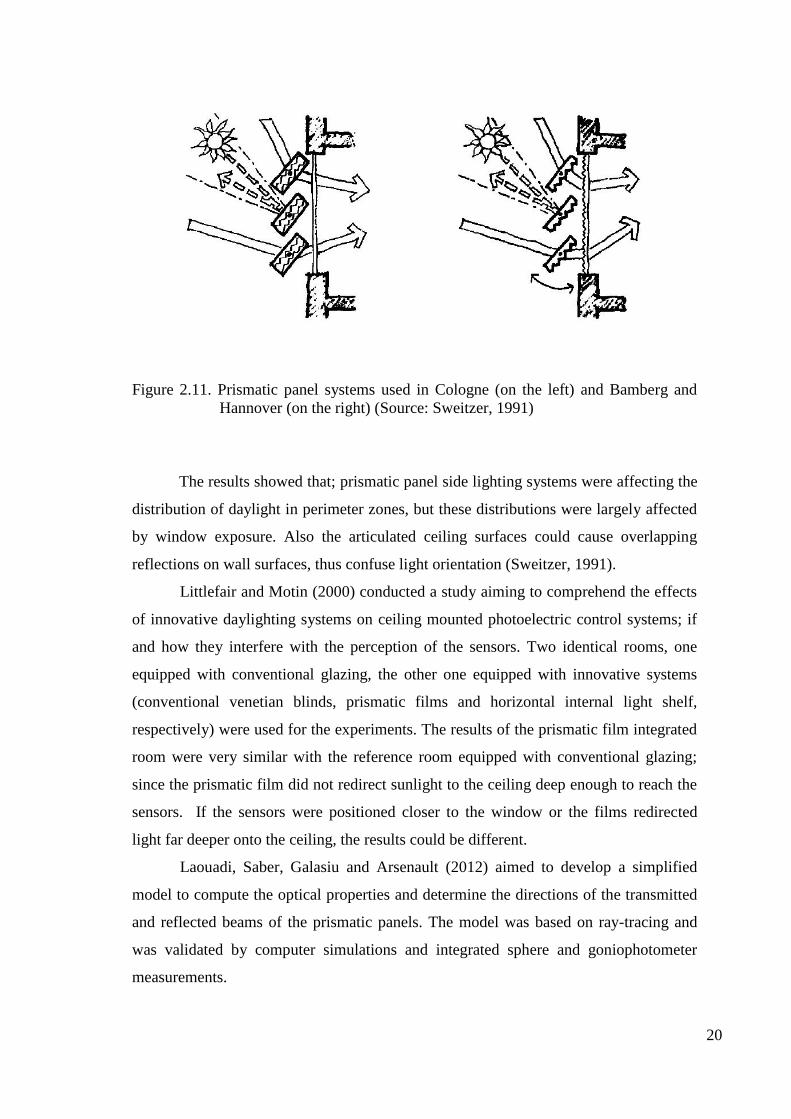
Sweitzer (1991) conducted a study aiming to determine the effects of the
prismatic panel side lighting systems on visual comfort and electric usage in perimeter
office workspace. Therefore, three bank office buildings were selected in Cologne,
Bamberg and Hannover in Germany; all of which equipped with prismatic panel side
lighting systems developed by Siemens AG. The systems consisted of exterior sun
shielding and interior light-guiding prismatic panels (Figure 2.11). In Cologne, the
exterior and interior panels were fixed in parallel, within rotating panels. In Bamberg
and Hannover, the ext. panels were rotating relative to the fixed light- guiding panels.
20
Figure 2.11. Prismatic panel systems used in Cologne (on the left) and Bamberg and
Hannover (on the right) (Source: Sweitzer, 1991)
The results showed that; prismatic panel side lighting systems were affecting the
distribution of daylight in perimeter zones, but these distributions were largely affected
by window exposure. Also the articulated ceiling surfaces could cause overlapping
reflections on wall surfaces, thus confuse light orientation (Sweitzer, 1991).
Littlefair and Motin (2000) conducted a study aiming to comprehend the effects
of innovative daylighting systems on ceiling mounted photoelectric control systems; if
and how they interfere with the perception of the sensors. Two identical rooms, one
equipped with conventional glazing, the other one equipped with innovative systems
(conventional venetian blinds, prismatic films and horizontal internal light shelf,
respectively) were used for the experiments. The results of the prismatic film integrated
room were very similar with the reference room equipped with conventional glazing;
since the prismatic film did not redirect sunlight to the ceiling deep enough to reach the
sensors. If the sensors were positioned closer to the window or the films redirected
light far deeper onto the ceiling, the results could be different.
Laouadi, Saber, Galasiu and Arsenault (2012) aimed to develop a simplified
model to compute the optical properties and determine the directions of the transmitted
and reflected beams of the prismatic panels. The model was based on ray-tracing and
was validated by computer simulations and integrated sphere and goniophotometer
measurements.
21
2.2.3. Light Shelves
A light shelf is a daylighting system that provides shading, redirects down
coming light into the spaces in an upward direction; working on the principal of
improving daylight penetration, decreasing solar heat gains and preventing glare on
work plan levels (Claros & Soler, 2002; Edmonds & Greenup, 2002; IEA, 2000).
The light shelves are used as internal or external devices in horizontal or nearly
horizontal baffle positions (Claros & Soler, 2002; IEA, 2000; Soler & Oteiza, 1996).
Their locations in the facades are determined regarding the room configuration, ceiling
height, window height and eye level (IEA, 2000; Rao, & Tzempelikos, 2012). Their
sizes and other characteristics like materials, shape, and slope should also be defined
specifically regarding window orientation, room configuration and latitude (IEA, 2000).
The daylighting performance of the light shelves is much better in high direct
sunlight climates, because of both their shading and light directing characteristics. They
can also be applied to the south facades of deep interiors in the northern hemisphere
(north façade in the southern hemisphere) with high efficiency. But, the light shelves
do not provide that much satisfying performance in east and west orientations and in
climates with dominant overcast skies (IEA, 2000).
A balance should be determined between the shading and daylighting needs of
spaces when adjusting the position in the façade, orientation and depth of the shelves.
The light shelves can be applied as fixed, solid systems (conventional light shelves),
designed with curved geometry, segmented for passive reflection of sunlight, and may
be coated with highly-reflective, semi - specular optical films (optically treated light
shelves), or may be fixed light shelves that inhabit tracking rollers that have plastic
reflective film surfaces above (sun – tracking light shelf) (IEA, 2000).
Some light shelf applications are present in Sacramento Municipal Utility
District (SMUD) Headquarters, Sacramento, California (internal sloped light shelf,
shown in Figure 2.12) and Palm Springs Chamber of Commerce, Palm Springs,
California (optically treated light shelf integrated to a skylight, shown in Figure 2.13)
(IEA, 2000).
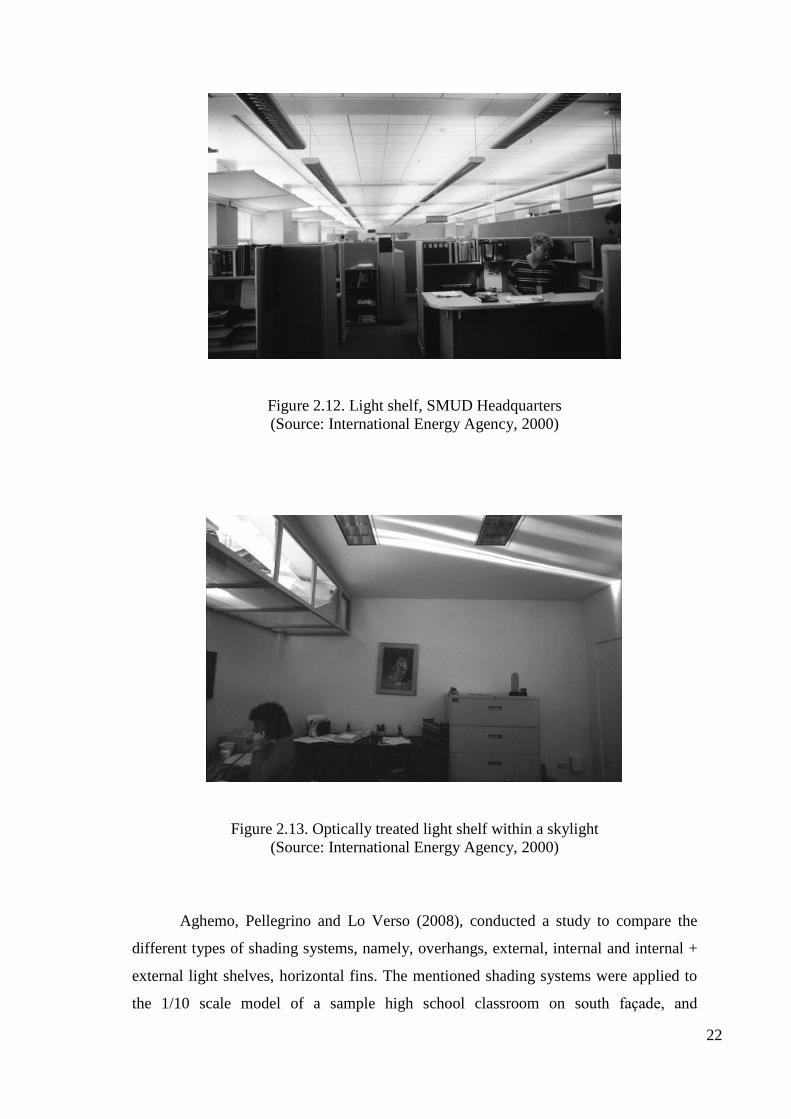
22
Figure 2.12. Light shelf, SMUD Headquarters
(Source: International Energy Agency, 2000)
Figure 2.13. Optically treated light shelf within a skylight
(Source: International Energy Agency, 2000)
Aghemo, Pellegrino and Lo Verso (2008), conducted a study to compare the
different types of shading systems, namely, overhangs, external, internal and internal +
external light shelves, horizontal fins. The mentioned shading systems were applied to
the 1/10 scale model of a sample high school classroom on south façade, and
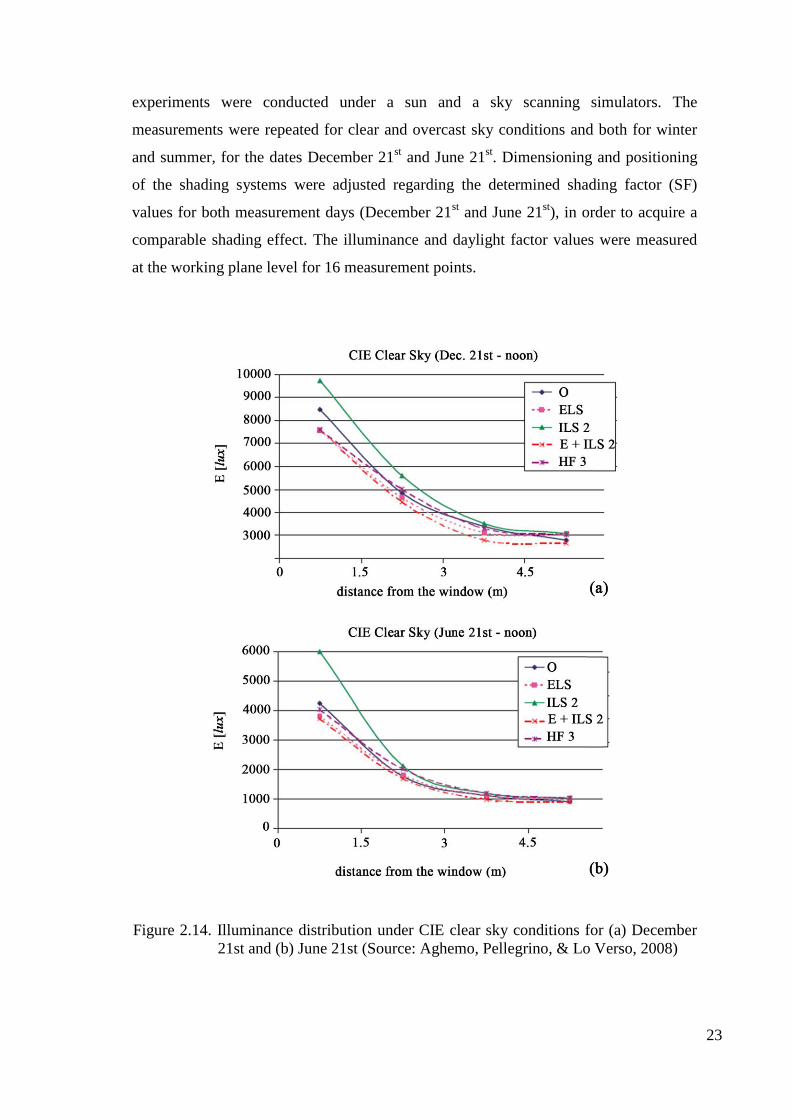
23
experiments were conducted under a sun and a sky scanning simulators. The
measurements were repeated for clear and overcast sky conditions and both for winter
and summer, for the dates December 21st and June 21
st. Dimensioning and positioning
of the shading systems were adjusted regarding the determined shading factor (SF)
values for both measurement days (December 21st and June 21
st), in order to acquire a
comparable shading effect. The illuminance and daylight factor values were measured
at the working plane level for 16 measurement points.
Figure 2.14. Illuminance distribution under CIE clear sky conditions for (a) December
21st and (b) June 21st (Source: Aghemo, Pellegrino, & Lo Verso, 2008)
24
The results showed that, in clear sky conditions, the internal light shelves
provided the highest illuminance, while lowest values among the shading systems were
acquired with external and internal + external light shelves. The illuminance distribution
was better when external and external + internal light shelves were used, while the
uniformity was reduced with the use of internal light shelves. The daylight penetration
was higher when the external light shelves were used and lower with external + internal
and internal light shelves, respectively (Figure 2.14).
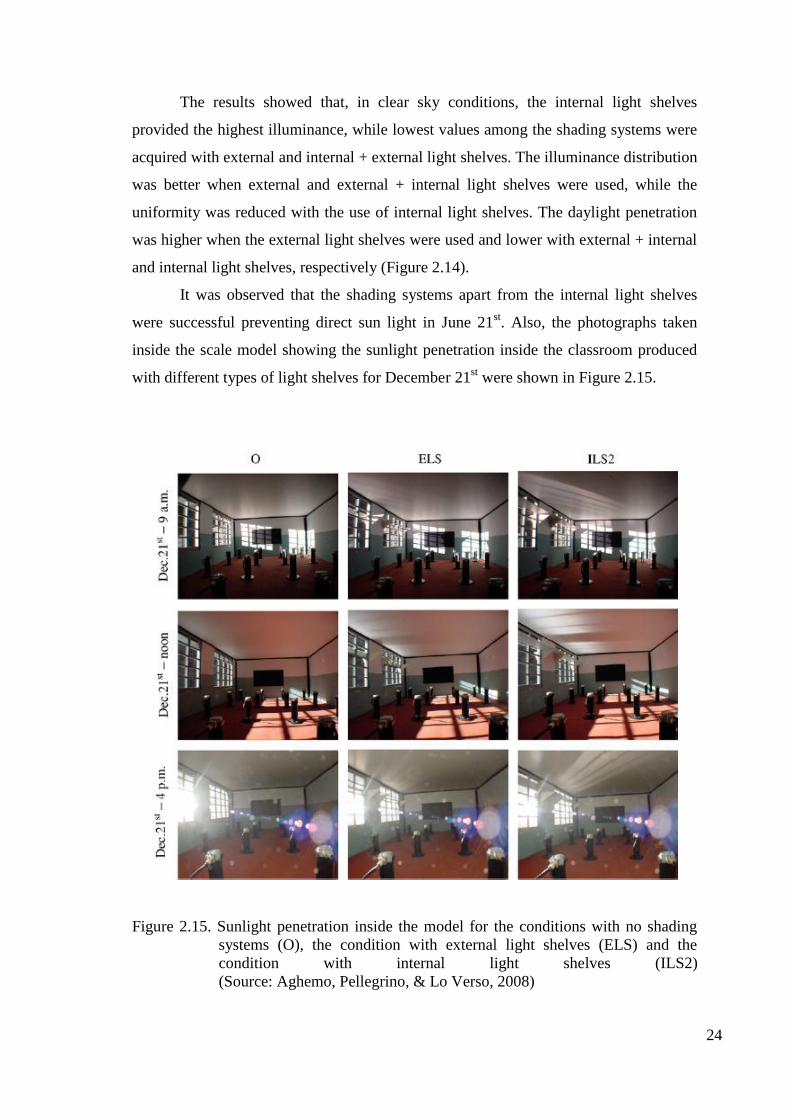
It was observed that the shading systems apart from the internal light shelves
were successful preventing direct sun light in June 21st. Also, the photographs taken
inside the scale model showing the sunlight penetration inside the classroom produced
with different types of light shelves for December 21st were shown in Figure 2.15.
Figure 2.15. Sunlight penetration inside the model for the conditions with no shading
systems (O), the condition with external light shelves (ELS) and the
condition with internal light shelves (ILS2)
(Source: Aghemo, Pellegrino, & Lo Verso, 2008)
25
Figure 2.16. Daylighting conditions inside the model with the use of matt, semispecular
and specular finishes on the internal light shelves
(Source: Aghemo, Pellegrino, & Lo Verso, 2008)
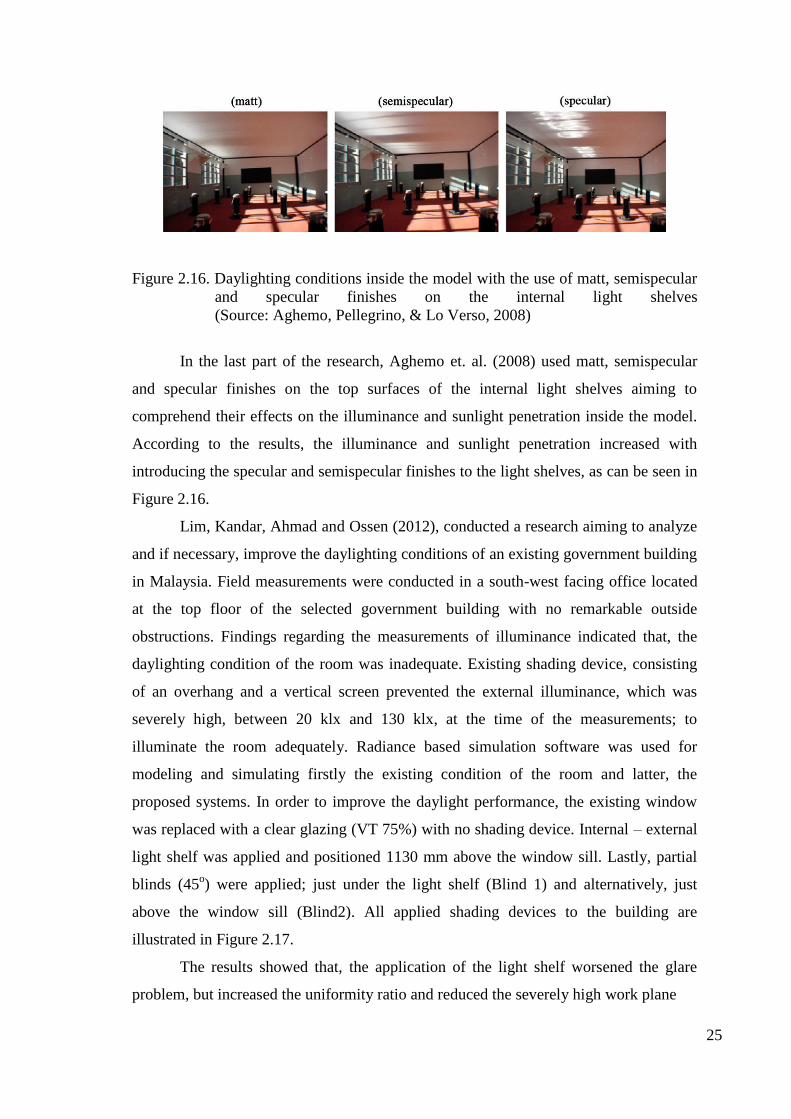
In the last part of the research, Aghemo et. al. (2008) used matt, semispecular
and specular finishes on the top surfaces of the internal light shelves aiming to
comprehend their effects on the illuminance and sunlight penetration inside the model.
According to the results, the illuminance and sunlight penetration increased with
introducing the specular and semispecular finishes to the light shelves, as can be seen in
Figure 2.16.
Lim, Kandar, Ahmad and Ossen (2012), conducted a research aiming to analyze
and if necessary, improve the daylighting conditions of an existing government building
in Malaysia. Field measurements were conducted in a south-west facing office located
at the top floor of the selected government building with no remarkable outside
obstructions. Findings regarding the measurements of illuminance indicated that, the
daylighting condition of the room was inadequate. Existing shading device, consisting
of an overhang and a vertical screen prevented the external illuminance, which was
severely high, between 20 klx and 130 klx, at the time of the measurements; to
illuminate the room adequately. Radiance based simulation software was used for
modeling and simulating firstly the existing condition of the room and latter, the
proposed systems. In order to improve the daylight performance, the existing window
was replaced with a clear glazing (VT 75%) with no shading device. Internal – external
light shelf was applied and positioned 1130 mm above the window sill. Lastly, partial
blinds (45o) were applied; just under the light shelf (Blind 1) and alternatively, just
above the window sill (Blind2). All applied shading devices to the building are
illustrated in Figure 2.17.
The results showed that, the application of the light shelf worsened the glare
problem, but increased the uniformity ratio and reduced the severely high work plane
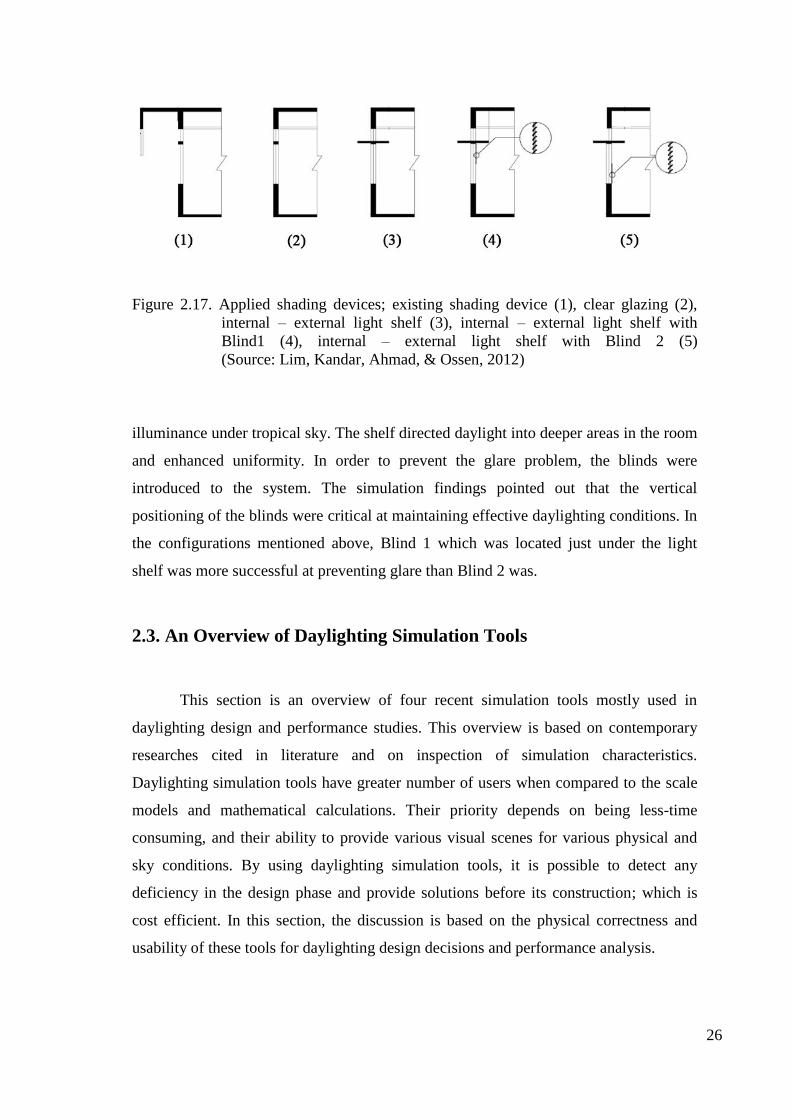
26
Figure 2.17. Applied shading devices; existing shading device (1), clear glazing (2),
internal – external light shelf (3), internal – external light shelf with
Blind1 (4), internal – external light shelf with Blind 2 (5)
(Source: Lim, Kandar, Ahmad, & Ossen, 2012)
illuminance under tropical sky. The shelf directed daylight into deeper areas in the room
and enhanced uniformity. In order to prevent the glare problem, the blinds were
introduced to the system. The simulation findings pointed out that the vertical
positioning of the blinds were critical at maintaining effective daylighting conditions. In
the configurations mentioned above, Blind 1 which was located just under the light
shelf was more successful at preventing glare than Blind 2 was.
2.3. An Overview of Daylighting Simulation Tools
This section is an overview of four recent simulation tools mostly used in
daylighting design and performance studies. This overview is based on contemporary
researches cited in literature and on inspection of simulation characteristics.
Daylighting simulation tools have greater number of users when compared to the scale
models and mathematical calculations. Their priority depends on being less-time
consuming, and their ability to provide various visual scenes for various physical and
sky conditions. By using daylighting simulation tools, it is possible to detect any
deficiency in the design phase and provide solutions before its construction; which is
cost efficient. In this section, the discussion is based on the physical correctness and
usability of these tools for daylighting design decisions and performance analysis.
27
2.3.1. Desktop Radiance
Radiance is developed to assist designers in the prediction process of the
lighting levels and the appearance of a space before application. The lighting simulator
engine of the Radiance uses a hybrid approach of Monte Carlo and deterministic ray
tracing in lighting calculations. The software is initially developed for the Unix
environment and works on a text-based input format (Bhavani & Kahn, 2011; Kim &
Chung, 2011; Minstrick, 2000). On the other hand, Desktop Radiance is a more user-
friendly version of Radiance in terms of its graphical interface and ease of reach
through the integrated pull-down menus within other programs such as AutoCAD,
Autodesk Ecotect Analysis and DesignBuilder. Desktop Radiance works under the
Windows operating system through these programs and its graphical user interface also
allows using most of the key operating features of Radiance. It is also possible to reach
the remaining Radiance features by modifying the original text-based inputs (Lim,
Ahmad, & Ossen, 2010; Minstrick, 2000). The 3D model used in Desktop Radiance is
created either in Radiance or in the above programs. It is also possible to import the
model from other 3D modeling tools in compatible 3D formats.
To obtain proper photometric analysis, the model should include appropriate
amount of details and the exterior should be modeled closely enough to calculate
amount of daylight striking an opening adequately. Before proceeding to simulations,
the complete 3D model should be edited by assigning Radiance materials onto each
surface. These materials can be chosen from the Desktop Radiance Library or the
Material Editor can be used for creating user-defined materials (Minstrick, 2000). The
site location (entering longitude-latitude values or choosing from one of the available
cities), the date, the time and sky condition should also be defined too, before running a
simulation. The sky models used by the Desktop Radiance are the models of
International Commission on Illumination (CIE) which are CIE clear sky, CIE
intermediate sky, CIE overcast sky and uniform sky. It is also possible to discard
daylight computations by entering the time as the middle of the night (Kim & Chung,
2011; Minstrick, 2000). The Desktop Radiance can make analysis on “single reference
points” or “grids of reference points”; the latter is used to compute the horizontal
illuminance. It is also possible to produce “detailed renderings” of the 3D model
through which the illuminance or luminance values of each rendered surface can be
28
learned. The Desktop Radiance has two alternative rendering modes; batch processing
and an interactive mode that utilizes the rview program (Minstrick, 2000).
2.3.2. DesignBuilder
DesignBuilder is a building simulation tool which carries out analysis on energy
consumption, carbon emissions, occupant comfort, daylight availability and works as an
evaluation tool on determining the current conditions of the buildings with regard to
several building regulations and certification standards.
DesignBuilder was launched as the first Graphical User Interface to the
EnergyPlus simulation engine and the latest version of the program (Version 3) includes
the first advanced Graphical User Interface to EnergyPlus HVAC systems and a
daylight evaluation tool that uses the advanced Radiance ray-tracing engine
(DesignBuilder, 2012).
The 3D model used in DesignBuilder can be created by an integrated OpenGL
solid modeler or can also be imported from 3rd party BIM tools supporting the gbXML
standard like ArchiCAD, Microstation and Revit. Imported 2D CAD floor plan data can
be traced by DesignBuilder and used as a base for modeling. DesignBuilder provides
three types of daylighting calculations; “daylight contour plots, average daylight factor
and uniformity outputs by using the Radiance simulation engine”, “reduced electric
lighting and consequent energy and carbon savings through EnergyPlus simulations”
and “photo-realistic renderings by Radiance” (DesignBuilder, 2012). By using the
Radiance simulation engine, it is possible to calculate daylight factors and illuminance
as well as to generate high quality illuminance contour plots within the zones, the
blocks or for a slice through the whole building. The sky models are similar to the ones
used by Radiance (DesignBuilder, 2012). DesignBuilder uses also EnergyPlus
simulations to determine the impact of daylighting strategies (decrease in electric
lighting usage) on energy and carbon savings based on analysis of available daylight,
site conditions, window management regarding solar gain and glare, and various
lighting strategies (DesignBuilder, 2012).
29
2.3.3. Autodesk Ecotect Analysis
Autodesk Ecotect Analysis is a sustainable design analysis tool that provides a
wide range of simulation and building energy analysis functions by using desktop and
web-service platforms. The program uses Green Building Studio web-based service to
carry out whole-building energy, water and carbon analysis and integrates them with
desktop tools for visualizing and simulating building’s performance. The program aims
to help the designers in the schematic phases of their designs and guide their design
decisions on orientation, floor plan depth, glazing sizes, etc. Regarding this purpose, the
3D model used in the software needs to be as simple as possible with no non-essential
details; almost like a massing model with defined zones for air-conditioning or
daylighting (Ecotect, 2012; Green Building Studio Manual, 2011). Ecotect Analysis
together with Green Building Studio can produce data on whole-building energy
analysis, thermal performance, water usage and cost evaluation, solar radiation,
daylighting and shadows and reflections (Ecotect, 2012).
Ecotect Analysis carries out lighting analysis by several different methods. The
program can create daylighting information by using the BRE daylight factor
calculations integrated into Ecotect Analysis or by exporting the model to Radiance.
Autodesk Green Building Studio also performs daylighting calculations using the LEED
prescriptive method for evaluating the buildings for LEED Daylighting Credit Potential.
It is also possible to calculate electric lighting as footcandle levels by BRE daylight
calculation or by Radiance exports (Ecotect, 2012).
2.3.4. Velux Daylight Visualizer
Velux Daylight Visualizer is a daylighting design and analysis tool aiming to
increase the use of daylight in buildings and help designers to predict the daylight
quality of their designs before construction stages. The program runs on both Mac OSX
and Windows7 platforms. The integrated modeling tool of Velux Daylight Visualizer
can be used for creating quick and simple 3D models. The modeler only permits
creating orthogonal shapes as well as the exception of the rotatable custom object entity,
so it can be inflexible and inadequate when trying to model complex geometries. By
using the 3D importer feature, it is possible to import 3D models. The imported 3D
30
models should only be made of polygons and to prevent light leaks, the polygons should
be attached together properly. Furniture created with other programs can be used in the
imported models if they are inserted before importing the model to Daylight Visualizer.
There are some other restrictions in Daylight Visualizer like the textures can only be
applied to horizontal surfaces and there is no undo function in the program. In the
simulations, Velux Daylight Visualizer uses sky types defined by CIE. By utilizing
Velux Daylight Visualizer, the simulation outputs that can be acquired are; luminance,
illuminance, daylight factor and daylight animation (Velux, 2012).
2.3.5 Physical Correctness and Adaptability for New Technologies
In recent years, daylighting simulation tools have become commonly used by
lighting designers and professionals. Increasing trust in their accuracy and decreasing
use of scale models may result in their wider use. However, their users still remain less
than the others using other building simulation software. Since, users may tend to use
easy, practical and reliable daylighting tools and when they cannot reach adequate
information, self-teaching materials, convenient databases, practical user-interface or
reliable analysis results; they avoid using them (Reinhart & Fitz, 2006; Reinhart &
Wienold, 2011). In this section, “physical correctness” and “adaptability to new
technologies” and in the following chapter, “usability” of four programs; Desktop
Radiance, DesignBuilder, Ecotect and Velux Daylight Visualizer, were discussed
through a review of related previous studies. A summarized comparison of the working
principles of these four programs is given in Table 2.1.
Physical correctness depends on competence of 3D models, the various
characteristics of materials, sky conditions and external obstructions. Various sky
model types are used by these tools to indicate different sky conditions. However, it is
almost impossible to cover all real sky conditions since they vary unpredictably due to
time, location and occlusion. This inconsistency between the real sky conditions and the
sky models of daylighting tools cause simulation errors and affect physical correctness
of the tools.
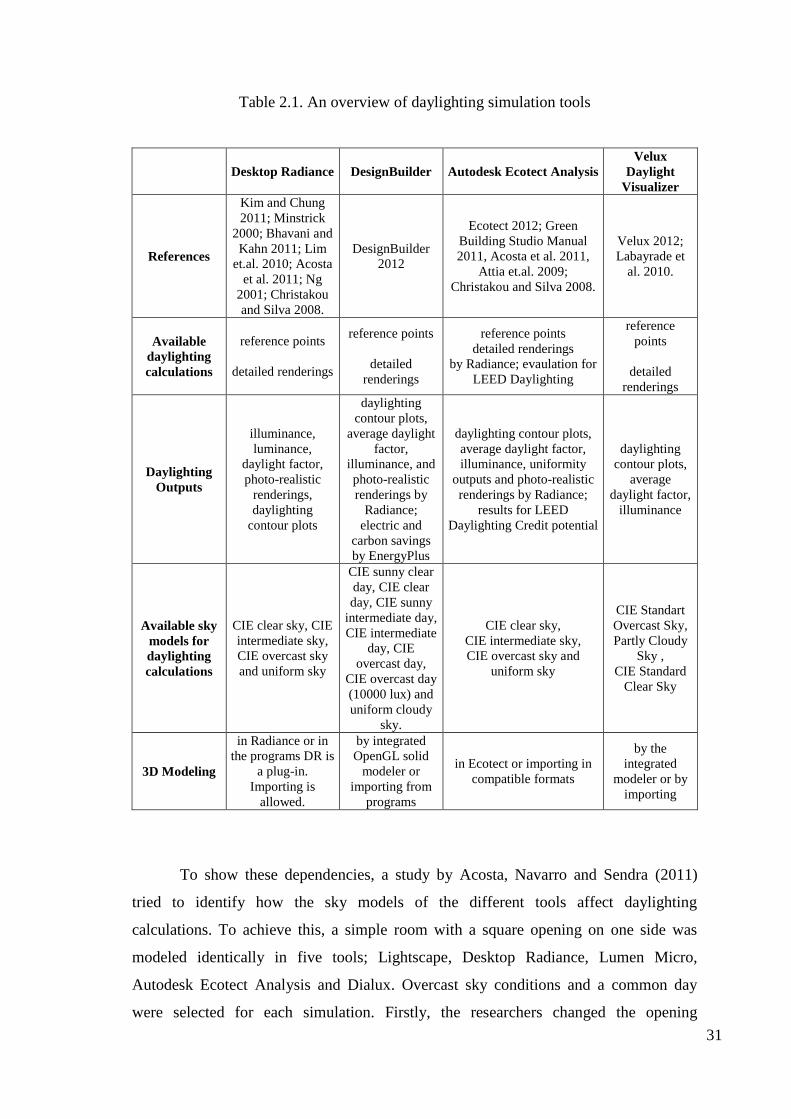
31
Table 2.1. An overview of daylighting simulation tools
Desktop Radiance DesignBuilder Autodesk Ecotect Analysis
Velux
Daylight
Visualizer
References
Kim and Chung
2011; Minstrick
2000; Bhavani and
Kahn 2011; Lim
et.al. 2010; Acosta
et al. 2011; Ng
2001; Christakou
and Silva 2008.
DesignBuilder
2012
Ecotect 2012; Green
Building Studio Manual
2011, Acosta et al. 2011,
Attia et.al. 2009;
Christakou and Silva 2008.
Velux 2012;
Labayrade et
al. 2010.
Available
daylighting
calculations
reference points
detailed renderings
reference points
detailed
renderings
reference points
detailed renderings
by Radiance; evaulation for
LEED Daylighting
reference
points
detailed
renderings
Daylighting
Outputs
illuminance,
luminance,
daylight factor,
photo-realistic
renderings,
daylighting
contour plots
daylighting
contour plots,
average daylight
factor,
illuminance, and
photo-realistic
renderings by
Radiance;
electric and
carbon savings
by EnergyPlus
daylighting contour plots,
average daylight factor,
illuminance, uniformity
outputs and photo-realistic
renderings by Radiance;
results for LEED
Daylighting Credit potential
daylighting
contour plots,
average
daylight factor,
illuminance
Available sky
models for
daylighting
calculations
CIE clear sky, CIE
intermediate sky,
CIE overcast sky
and uniform sky
CIE sunny clear
day, CIE clear
day, CIE sunny
intermediate day,
CIE intermediate
day, CIE
overcast day,
CIE overcast day
(10000 lux) and
uniform cloudy
sky.
CIE clear sky,
CIE intermediate sky,
CIE overcast sky and
uniform sky
CIE Standart
Overcast Sky,
Partly Cloudy
Sky ,
CIE Standard
Clear Sky
3D Modeling
in Radiance or in
the programs DR is
a plug-in.
Importing is
allowed.
by integrated
OpenGL solid
modeler or
importing from
programs
in Ecotect or importing in
compatible formats
by the
integrated
modeler or by
importing
To show these dependencies, a study by Acosta, Navarro and Sendra (2011)
tried to identify how the sky models of the different tools affect daylighting
calculations. To achieve this, a simple room with a square opening on one side was
modeled identically in five tools; Lightscape, Desktop Radiance, Lumen Micro,
Autodesk Ecotect Analysis and Dialux. Overcast sky conditions and a common day
were selected for each simulation. Firstly, the researchers changed the opening
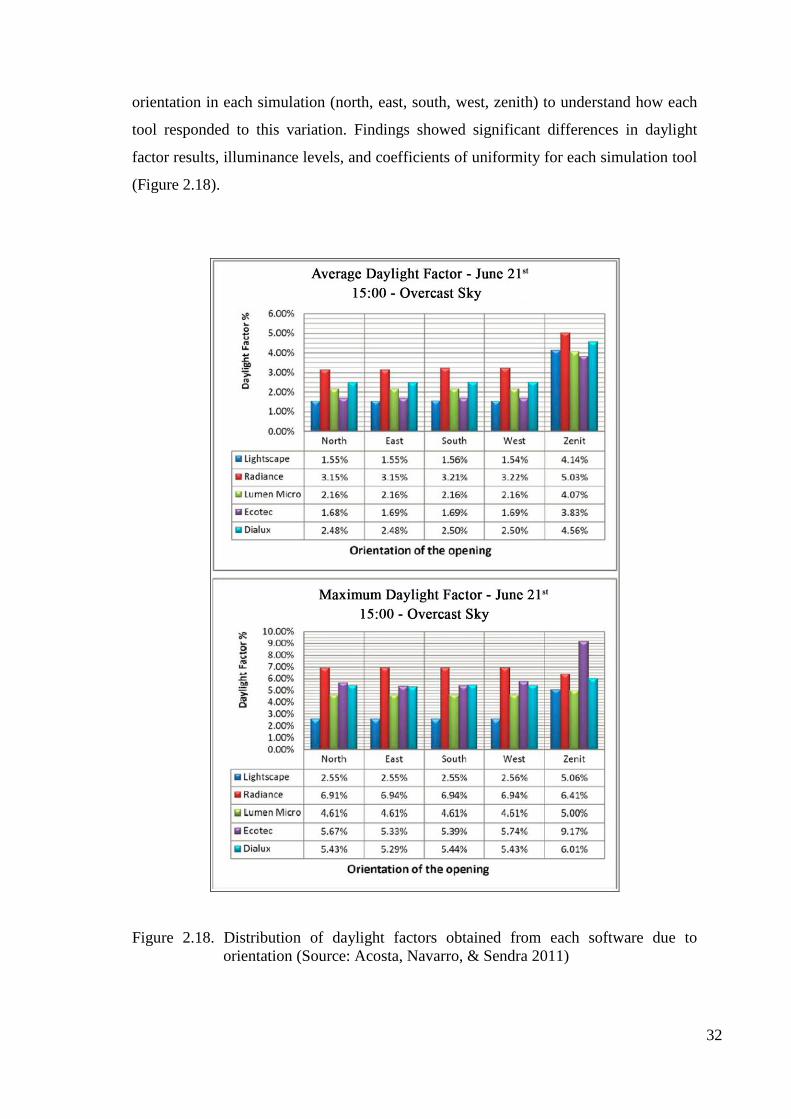
32
orientation in each simulation (north, east, south, west, zenith) to understand how each
tool responded to this variation. Findings showed significant differences in daylight
factor results, illuminance levels, and coefficients of uniformity for each simulation tool
(Figure 2.18).
Figure 2.18. Distribution of daylight factors obtained from each software due to
orientation (Source: Acosta, Navarro, & Sendra 2011)
33
Highest illuminance levels were obtained by Desktop Radiance for all
orientations. Ecotect results were almost half of them. But they were in acceptable
limits for all software. The understanding of overcast sky by each tool was differed
from each other. So, physical correctness of each tool varies due to their sky
interpretation.
Secondly, distribution of light according to time was analyzed in the same study.
Only the uniformity coefficients of Desktop Radiance varied with the time remarkably.
Thus, Desktop Radiance was sensitive to time variation due to the addition of sky-
turbidity-factor in its algorithms. Ecotect results had very small shifts in daylight factor
values for the same time interval, but Desktop Radiance showed inconsistent and
relatively greater values when compared to the other tools. Consequently, in overcast
sky conditions, Desktop Radiance was found to be more sensitive to time when
compared to Ecotect and other tools. Its daylight factor values tend to be higher than
Ecotect in all conducted simulations in that study.
With a similar purpose, another study compared Desktop Radiance results with
scale-model measurements conducted under intermediate and overcast tropical sky
conditions in Malaysia. The simulated results showed high mean differences from the
scale-model measurements such as 81.63%, 71.06% and 49.71% with external
illuminance, absolute work plane illuminance and absolute surface illuminance
respectively (Lim et. al., 2010). Daylight factor and luminance ratios were better
comparisons with 26.06% and 29.75% mean differences. These errors basically based
on the inconsistencies between the tropical sky and CIE sky models. Desktop Radiance
failed to predict the external illumination in acceptable limits, though results were closer
to the actual conditions under the CIE overcast sky when compared to CIE intermediate
sky. According to Lim et al (2010), this was due to the luminance distribution of the
tropical sky being more uniform during overcast conditions (Figure 2.19).
It is challenging for daylighting simulation tools to use sky models that are in
complete harmony with extreme and rapidly changing real sky conditions. One reason
for that may be the tendency of the software developers to constitute sky models that
imitate general sky characteristics worldwide. Using these sky models for extreme sky
conditions like tropical sky, the inconsistencies in the simulation results are inevitable.
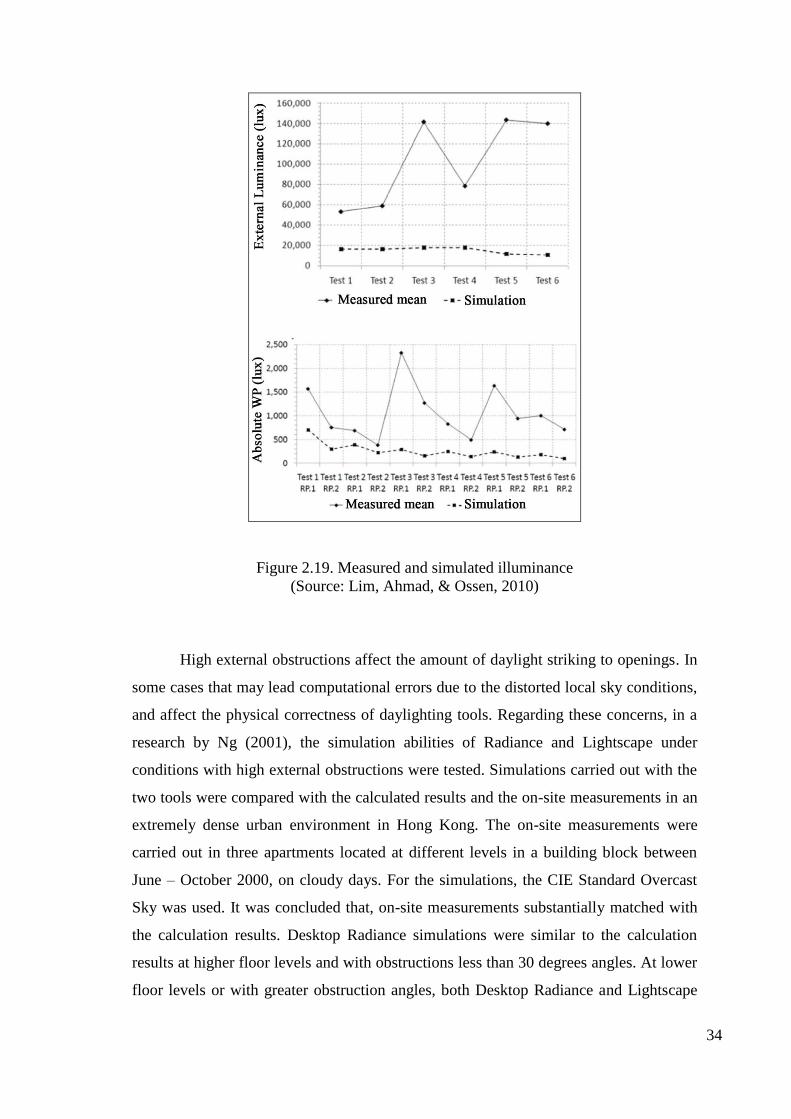
34
Figure 2.19. Measured and simulated illuminance
(Source: Lim, Ahmad, & Ossen, 2010)
High external obstructions affect the amount of daylight striking to openings. In
some cases that may lead computational errors due to the distorted local sky conditions,
and affect the physical correctness of daylighting tools. Regarding these concerns, in a
research by Ng (2001), the simulation abilities of Radiance and Lightscape under
conditions with high external obstructions were tested. Simulations carried out with the
two tools were compared with the calculated results and the on-site measurements in an
extremely dense urban environment in Hong Kong. The on-site measurements were
carried out in three apartments located at different levels in a building block between
June – October 2000, on cloudy days. For the simulations, the CIE Standard Overcast
Sky was used. It was concluded that, on-site measurements substantially matched with
the calculation results. Desktop Radiance simulations were similar to the calculation
results at higher floor levels and with obstructions less than 30 degrees angles. At lower
floor levels or with greater obstruction angles, both Desktop Radiance and Lightscape
35
overestimated the daylight availability. The Desktop Radiance errors increased when
the angle was greater than 35 and the error was close to 50% at 60 degrees. It was
derived from trial-error simulations that, by lowering the reflectance to 0.2 from 0.4,
Desktop Radiance could minimize the errors.
It was proved that external obstructions caused remarkable inconsistencies on
daylighting simulation results and affected physical correctness. The obstruction angle
and height of the simulated environment does also affect the results and may increase
the errors. Under overcast sky conditions Desktop Radiance simulation results can be
remarkably manipulated by external obstructions. Desktop Radiance overestimates
daylight availability with an increasing error at lower floor levels and with obstruction
angles higher than 35 degrees.
The comparison and validation studies of simulation programs in the literature
that could be attained for this thesis mainly included Radiance, testing it alone or among
other simulation tools or simulation results that were validated with measurements. Any
studies of validation or comparison with Velux Daylight Visualizer or with Ecotect and
DesignBuilder could be hardly reached, apart from the ones that are testing the
programs with their Radiance based simulation capabilities. The dominance of Radiance
on these studies can be explained by the previously mentioned survey (Reinhart & Fitz,
2006) results. Among 42 different daylighting simulation programs that the survey
participants routinely used; over 50% of these programs were the ones that operated
with the Radiance simulation engine.
However a study by Labayrade, H.W. Jensen and C.W. Jensen (2010) aimed to
validate Velux Daylight Visualizer against CIE 171:2006 test cases. The validation
results showed an average error of 1.8% and a maximal error of below 6% with respect
to the reference for eight identified settings proving the accuracy of Velux Daylight
Visualizer.
In designing low-energy buildings, material selection becomes an important
criterion. By modifying the material characteristics like transparency, reflectivity or
absorptivity, architects aim to design high energy performance buildings. To evaluate
their daylighting performance, such tools should be adaptable to accurately simulate
these complex new materials. For example, Thanachareonkit, Scartezzini and Robinson
(2006) conducted an error analysis on the complex fenestration systems (prismatic films
and laser-cut panels) simulation techniques by using Radiance. A 1:10 scale model
under a scanning sky simulator and an identical Radiance model under CIE overcast sky
36
were compared while both equipped with conventional glazing, laser-cut panel and
prismatic film on the side opening respectively. With conventional glazing, the results
showed a relative divergence of 1 - 9.2 % proving high accuracy of Radiance. With a
laser-cut panel mounted to the window, it was 0.5 - 16%, while with prismatic film; it
was 2.2 - 35%. Secondly, a sensitivity analysis of surface reflectance was carried out.
10 - 50% overestimation of surface reflectance caused 5 - 52 % relative deviation above
the scale model values, while a similar underestimation range of surface reflectance
caused 10 - 40% lower values. Laser-cut panel and prismatic film results were slightly
differed from each other and both results were comparable with the glazing model.
Thus, simulation techniques of laser-cut panels and prismatic films by using Radiance
were validated.
A similar research was conducted aiming to validate trans and transdata
Radiance material types and to constitute corresponding Radiance material from a
translucent panel by using goniophotometer and integrating sphere measurements. After
adjusting indoor illuminance simulation results with a ratio of measured to simulated
façade illuminance, the errors were under 8% and 10% for transdata (Reinhart&
Andersen, 2006).
As mentioned above, daylighting designers have been rapidly using the complex
materials and advanced daylighting systems in their designs recently. Apart from the
design decisions like orientation, amount of openings, floor plan depth, etc; using these
modified materials and advanced daylighting systems provide remarkable energy
savings. To evaluate the daylighting performance of the buildings with these new
technologies, simulation tools should be adaptable to these consistent changes. As can
be derived from the mentioned studies, simulation techniques of Radiance for complex
fenestration systems (in this case laser-cut and prismatic panels) as well as the trans and
transdata Radiance material types has been verified recently. Also, the ability of
Radiance; constituting corresponding Radiance material from a translucent panel by
using goniophotometer and integrating sphere measurements has been validated. With
the new technological progresses in daylighting systems, materials and co-elements like
paints or isolative films; the adaptability of the simulation tools to new technologies is
crucial.
37
2.3.6. Usability of Simulation Tools
Researchers pointed out that, professionals, in general, prefer to learn the
daylighting simulation tools by themselves. The ones which are easily understood by
intuition and provide easy operation decrease learning period of time for the users.
Even, the longer the time spent in self-teaching, the faster the users avoid from using
these tools. Thus, daylighting simulation tools should offer efficient tutorial options and
simple simulation environment (Reinhart & Fitz, 2006; Reinhart & Wienold, 2011).
User interface is the center of interest for architects, since it is the link between them
and digital processes in the background (Christakou & Silva, 2008).
Related studies mostly based on users’ opinion and preferences, and the concept
named here as “usability”(or user-friendly) involved criteria such as being intuitive and
simple, having less learning time and user manual and data output options. This term
mainly depends on the interface operation (graphical based or text based) and
capability. Menus, on screen clickable items which are perceived immediately are
requisite. Usability secondly based on information management of interface (Attia,
Beltrán, Herde, & Hensen, 2009). In relation to this, Reinhart and Wienold (2011)
defined barriers such as the misleading interpretation of simulation results or outdated
evaluating schemes. Visually accessible simulation results are preferable.
According to the research conducted among users’ opinion about simulation
software (Attia et. al., 2009), usability is related to “better graphical representation, of
simulation input and output, simple navigation and flexible control”. Ecotect and
Design Builder fully matched these criteria except “easy follow up structure” for the
former and “graphical representation of results in 3D spatial analysis” for the latter. Due
to the criteria concerning information management, users considered Ecotect as
insufficient in creation of comparative reports and Design Builder as unsuccessful in the
quality control of simulation input (Figure 2.20).
On the other hand, Radiance’s interface was not defined as friendly by a
reference cited in Christakou and Silva (2008). Their research included both users’
opinion and the application of software in a design process. Findings showed that
Ecotect was not the most suitable software and not intuitive when compared to Relux,
but had user friendly interface.
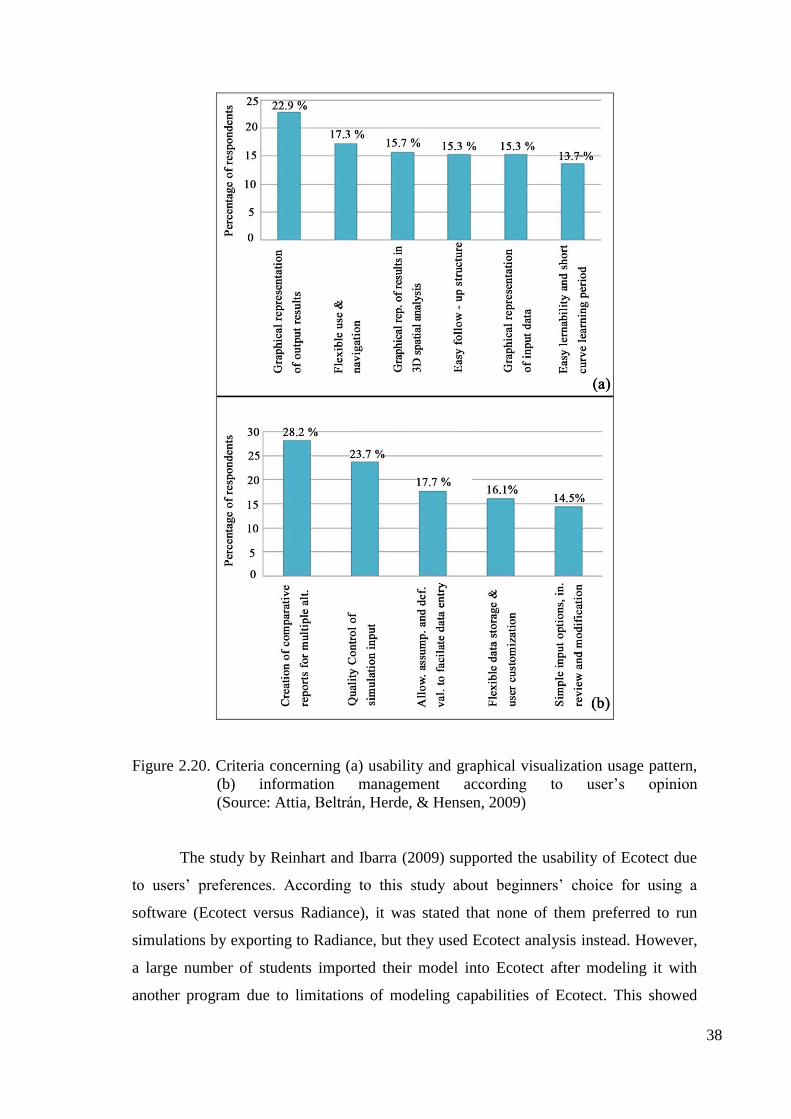
38
Figure 2.20. Criteria concerning (a) usability and graphical visualization usage pattern,
(b) information management according to user’s opinion
(Source: Attia, Beltrán, Herde, & Hensen, 2009)
The study by Reinhart and Ibarra (2009) supported the usability of Ecotect due
to users’ preferences. According to this study about beginners’ choice for using a
software (Ecotect versus Radiance), it was stated that none of them preferred to run
simulations by exporting to Radiance, but they used Ecotect analysis instead. However,
a large number of students imported their model into Ecotect after modeling it with
another program due to limitations of modeling capabilities of Ecotect. This showed
39
that inappropriateness in flexible data storage and input options affected user’s choice
of simulation tool. Users in this study also paid attention to simulation tips which can be
useful for the instructors. Regarding these, it can be derived that, easy learnability and
simple navigation were suitable features in Ecotect. Literature about the usability of
Velux was not cited.
Consequently, a majority of the studies analyzed Radiance as the mostly used
daylighting tool. Output results by Radiance were found to be within acceptable limits,
although its physical correctness might fail in some cases due to real sky conditions
(such as tropical). However, Radiance is sensitive to time variation when compared to
Ecotect. In regard to usability, Ecotect seems to be a practical tool because of its shorter
learning time and simple navigation, user friendly interface and better graphical
representation. It is important to note that Desktop Radiance also uses Ecotect’s user
interface as a plug-in. It can be concluded that, determining the most accurate
daylighting simulation tool among the four compared simulation tools is a complex
task. Each one has its own strengths and weaknesses. And it is obvious that the
developments in the field of simulation technologies will continue with a growing
acceleration aiming to improve these weaknesses. This study suggests that; among the
analyzed simulation tools, Radiance and Ecotect together might be preferred in
daylighting calculations, especially when designing and examining the effects of
advanced daylighting technologies such as laser-cut or prismatic panels (Table 2.2).
Table 2.2 Strengths / weaknesses of usability for Ecotect, Radiance and DesignBuilder
Strengths Weaknesses
Ecotect
Less learning time and simple
navigation (simulation tips for
instructors)
user friendly interface
better graphical representation
inappropriateness in flexible data
storage and input options (Limitations
in 3D modeling)
not easy follow up structure
not intuitive
Design
Builder
simple navigation flexible
control
graphical representation of results in
3D spatial analysis
Radiance not user friendly
not preferred by beginners
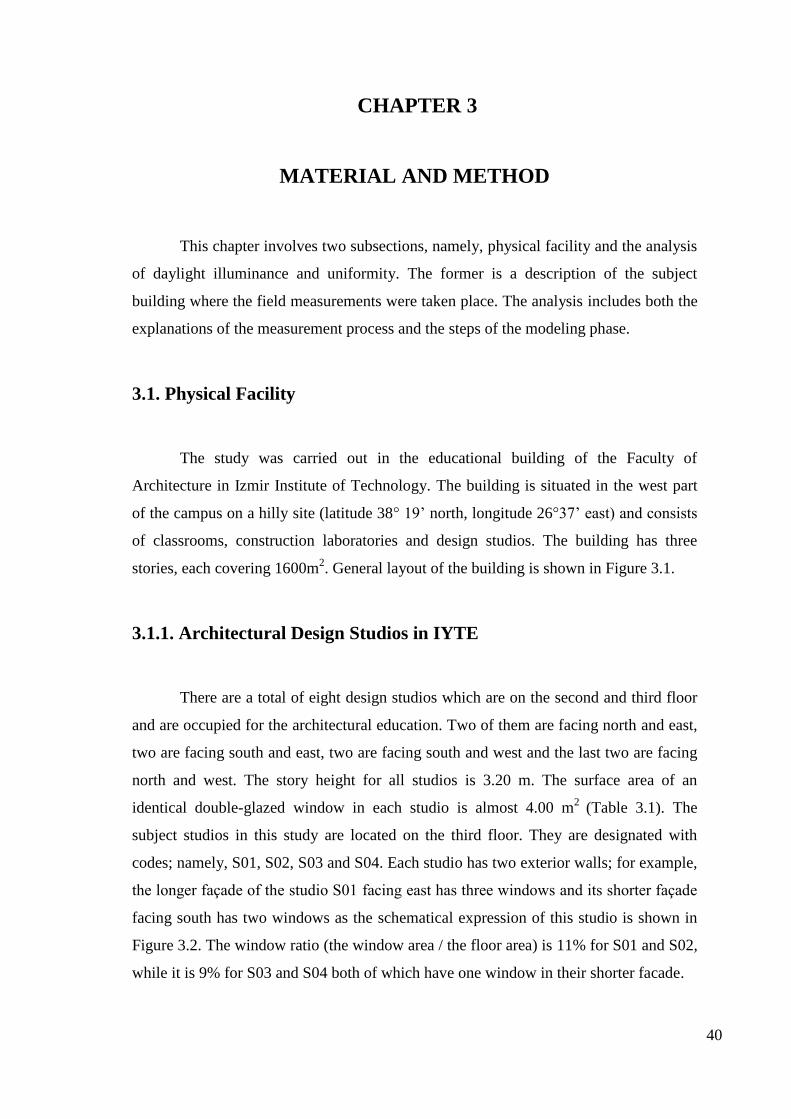
40
CHAPTER 3
MATERIAL AND METHOD
This chapter involves two subsections, namely, physical facility and the analysis
of daylight illuminance and uniformity. The former is a description of the subject
building where the field measurements were taken place. The analysis includes both the
explanations of the measurement process and the steps of the modeling phase.
3.1. Physical Facility
The study was carried out in the educational building of the Faculty of
Architecture in Izmir Institute of Technology. The building is situated in the west part
of the campus on a hilly site (latitude 38° 19’ north, longitude 26°37’ east) and consists
of classrooms, construction laboratories and design studios. The building has three
stories, each covering 1600m2. General layout of the building is shown in Figure 3.1.
3.1.1. Architectural Design Studios in IYTE
There are a total of eight design studios which are on the second and third floor
and are occupied for the architectural education. Two of them are facing north and east,
two are facing south and east, two are facing south and west and the last two are facing
north and west. The story height for all studios is 3.20 m. The surface area of an
identical double-glazed window in each studio is almost 4.00 m2
(Table 3.1). The
subject studios in this study are located on the third floor. They are designated with
codes; namely, S01, S02, S03 and S04. Each studio has two exterior walls; for example,
the longer façade of the studio S01 facing east has three windows and its shorter façade
facing south has two windows as the schematical expression of this studio is shown in
Figure 3.2. The window ratio (the window area / the floor area) is 11% for S01 and S02,
while it is 9% for S03 and S04 both of which have one window in their shorter facade.
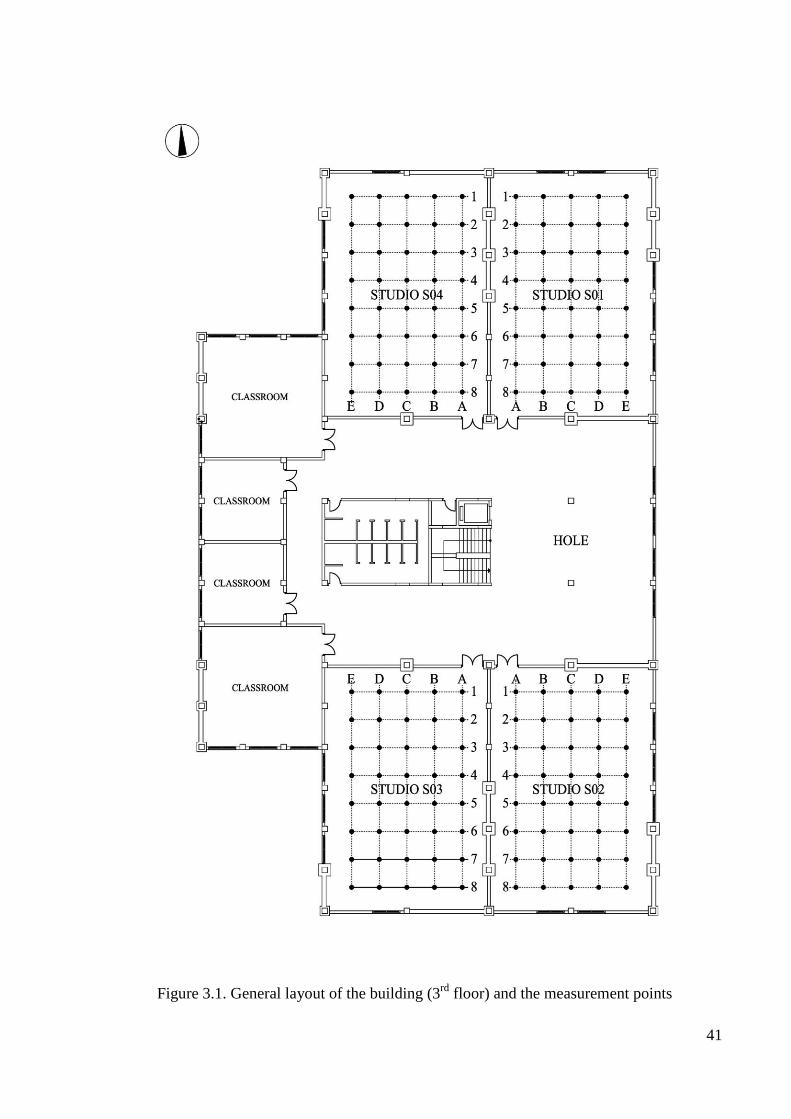
41
Figure 3.1. General layout of the building (3rd
floor) and the measurement points
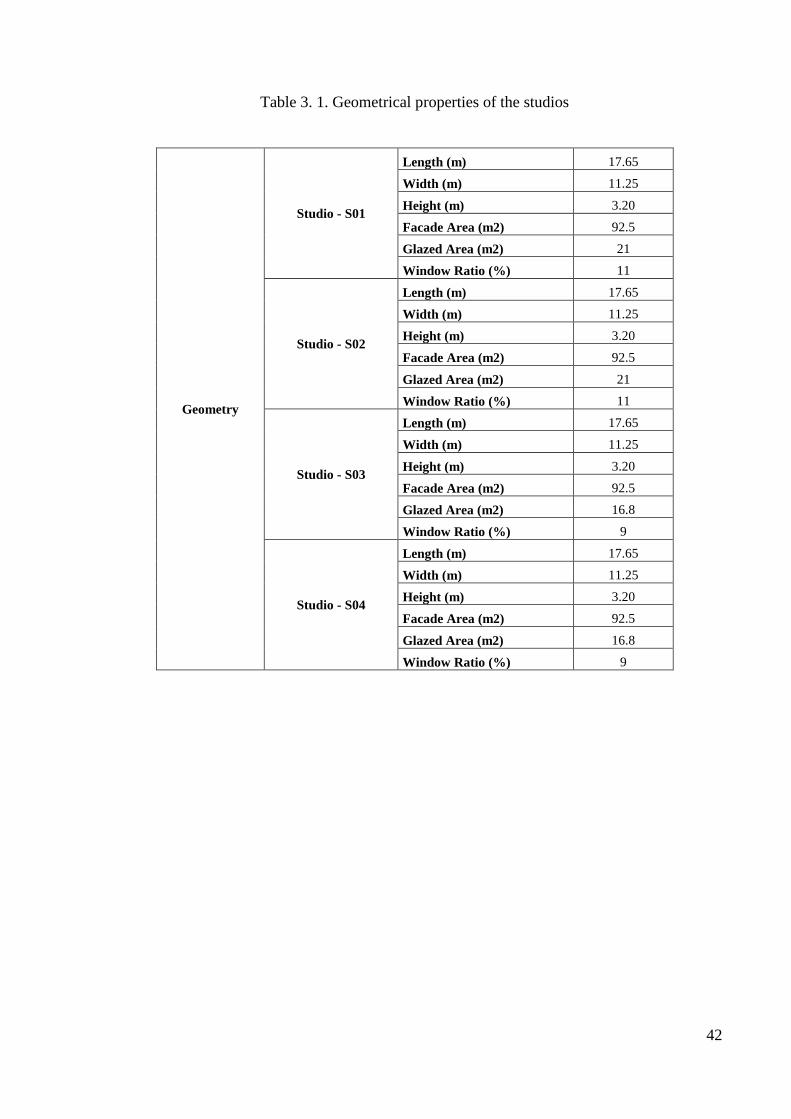
42
Table 3. 1. Geometrical properties of the studios
Geometry
Studio - S01
Length (m) 17.65
Width (m) 11.25
Height (m) 3.20
Facade Area (m2) 92.5
Glazed Area (m2) 21
Window Ratio (%) 11
Studio - S02
Length (m) 17.65
Width (m) 11.25
Height (m) 3.20
Facade Area (m2) 92.5
Glazed Area (m2) 21
Window Ratio (%) 11
Studio - S03
Length (m) 17.65
Width (m) 11.25
Height (m) 3.20
Facade Area (m2) 92.5
Glazed Area (m2) 16.8
Window Ratio (%) 9
Studio - S04
Length (m) 17.65
Width (m) 11.25
Height (m) 3.20
Facade Area (m2) 92.5
Glazed Area (m2) 16.8
Window Ratio (%) 9
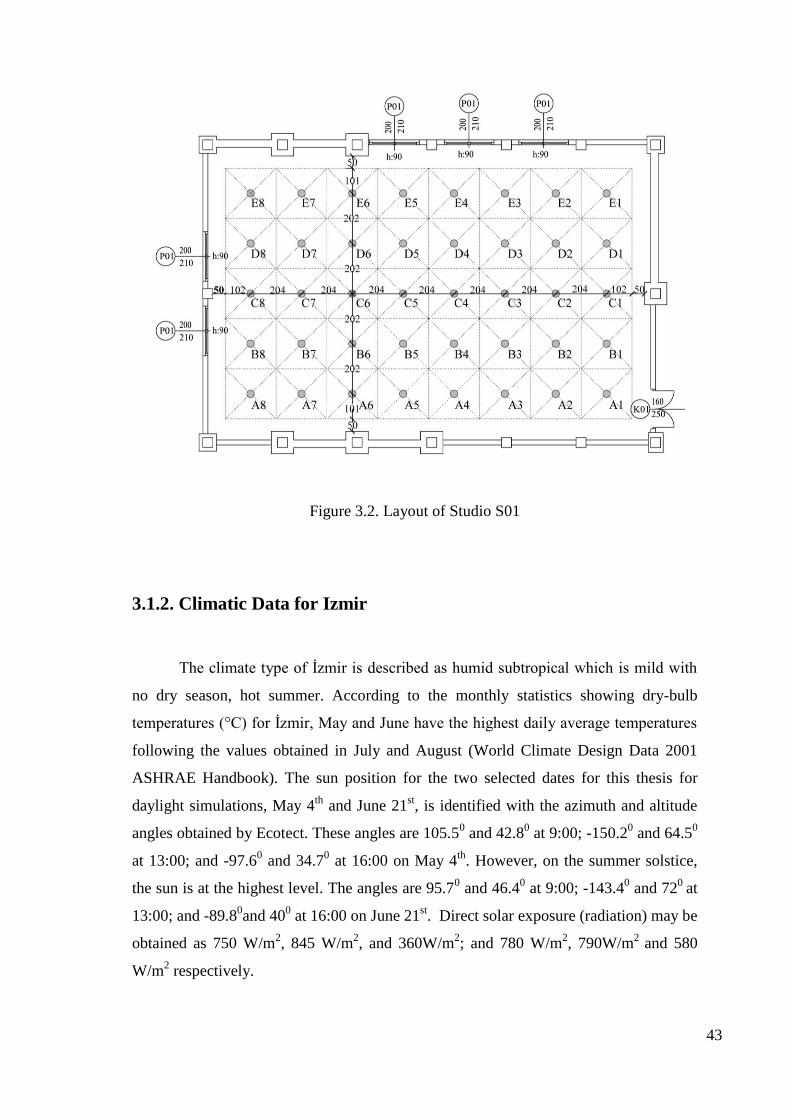
43
Figure 3.2. Layout of Studio S01
3.1.2. Climatic Data for Izmir
The climate type of İzmir is described as humid subtropical which is mild with
no dry season, hot summer. According to the monthly statistics showing dry-bulb
temperatures (°C) for İzmir, May and June have the highest daily average temperatures
following the values obtained in July and August (World Climate Design Data 2001
ASHRAE Handbook). The sun position for the two selected dates for this thesis for
daylight simulations, May 4th
and June 21st, is identified with the azimuth and altitude
angles obtained by Ecotect. These angles are 105.50 and 42.8
0 at 9:00; -150.2
0 and 64.5
0
at 13:00; and -97.60 and 34.7
0 at 16:00 on May 4
th. However, on the summer solstice,
the sun is at the highest level. The angles are 95.70 and 46.4
0 at 9:00; -143.4
0 and 72
0 at
13:00; and -89.80and 40
0 at 16:00 on June 21
st. Direct solar exposure (radiation) may be
obtained as 750 W/m2, 845 W/m
2, and 360W/m
2; and 780 W/m
2, 790W/m
2 and 580
W/m2 respectively.
44
3.2. Analysis of Daylight Illuminance and Uniformity
In this study, the output parameters obtained from the field measurements and
the simulation model were daylight illuminance and uniformity ratios. They were
evaluated in accordance with daylighting design norms. Daylight illuminance defines
the amount of light intensity which penetrates inside through the glazed surfaces. While
daylight illuminance provides information about the amount of light at specific points,
the uniformity gives an idea about the distribution of light intensity throughout the
horizontal working area. It is a measure of the balance of daylight illuminance inside.
3.2.1. Field Measurements
By following certain practical guidance offered by Chartered Institution of
Building Services Engineers [CIBSE] (1996), field measurements were carried out to
determine daylight illuminance at reference points. The number of measurement points
and their locations were also determined according to the recommendations of the
CIBSE Code 1994. The number of measurement points is related with the Room Index
(ratio between room size and height) and their locations should be defined at the centre
of equal small areas which are divisions of the floor area of the room (divided regarding
the number of measurement points needed), each of which are as close to square as
possible. The measurement is taken at the centre of each small area which is defined by
grid points (CIBSE, 1996).
The measurements were carried out in the period between the months of May
and June 2012. It covered mainly such prevailing conditions as clear sky and partly
cloudy sky. A digital light meter with a silicon photo diode detector was used for the
measurements. Measurements were taken 0.5 m away from walls / columns / partitions
and grid points were positioned with equal spacing (Fig. 3.2). The constant height for
each reading was 0.8 m high from the floor level.
According to DIN 5034 (Licht, 2006), the uniformity values for the daylit
interiors should satisfy the equations of Dmin / Dmax > 0.67 and Dmin / Dave > 0.5. In
addition, minimum illuminance values should be 500-750 lux for studios in educational
buildings regarding the CIBSE standards (CIBSE, 1994).
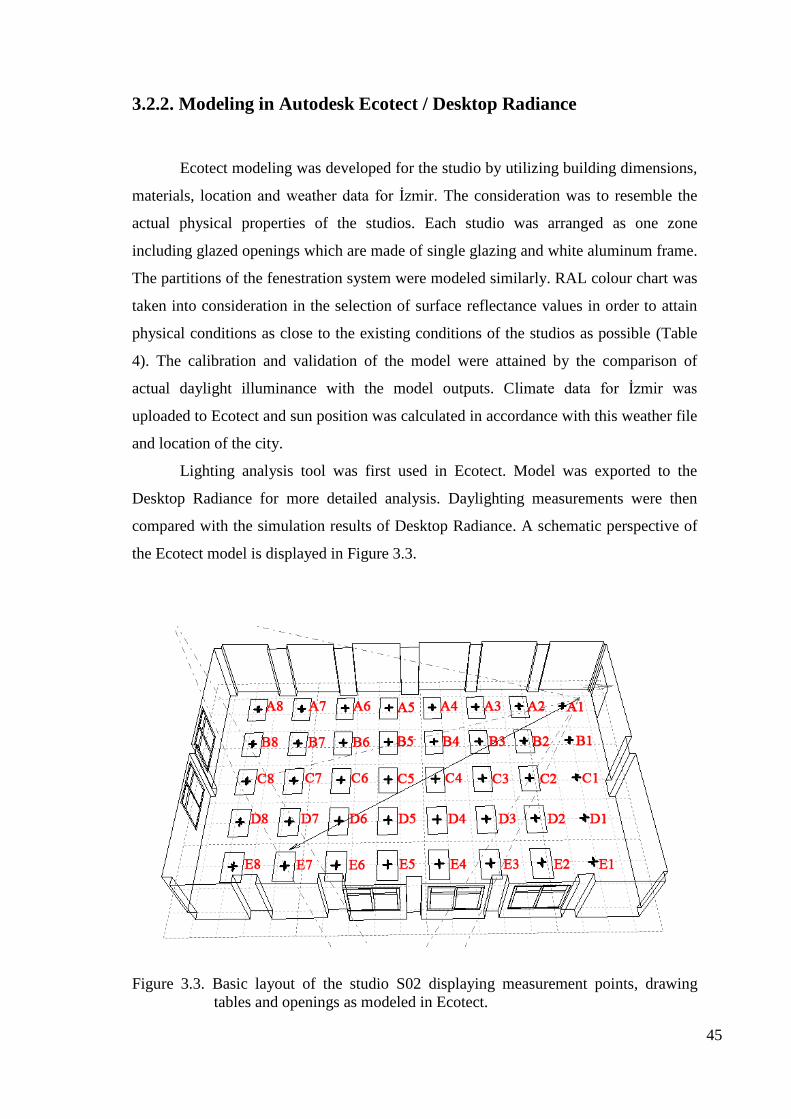
45
3.2.2. Modeling in Autodesk Ecotect / Desktop Radiance
Ecotect modeling was developed for the studio by utilizing building dimensions,
materials, location and weather data for İzmir. The consideration was to resemble the
actual physical properties of the studios. Each studio was arranged as one zone
including glazed openings which are made of single glazing and white aluminum frame.
The partitions of the fenestration system were modeled similarly. RAL colour chart was
taken into consideration in the selection of surface reflectance values in order to attain
physical conditions as close to the existing conditions of the studios as possible (Table
4). The calibration and validation of the model were attained by the comparison of
actual daylight illuminance with the model outputs. Climate data for İzmir was
uploaded to Ecotect and sun position was calculated in accordance with this weather file
and location of the city.
Lighting analysis tool was first used in Ecotect. Model was exported to the
Desktop Radiance for more detailed analysis. Daylighting measurements were then
compared with the simulation results of Desktop Radiance. A schematic perspective of
the Ecotect model is displayed in Figure 3.3.
Figure 3.3. Basic layout of the studio S02 displaying measurement points, drawing
tables and openings as modeled in Ecotect.
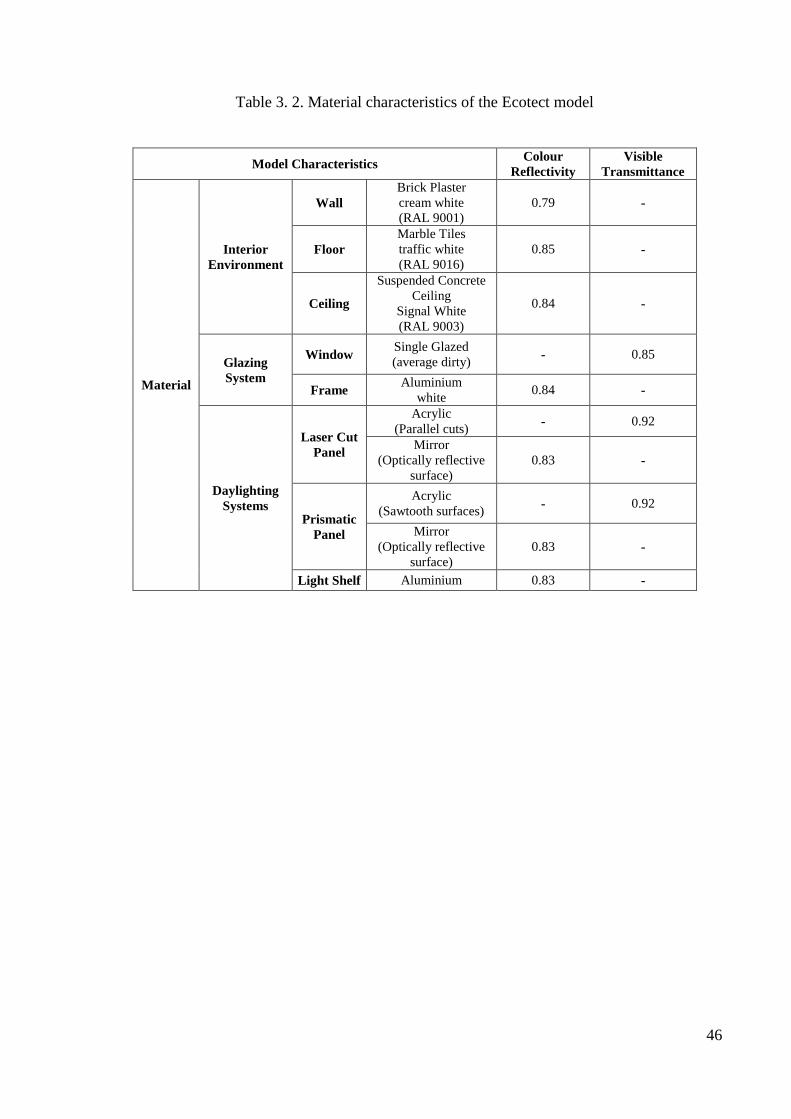
46
Table 3. 2. Material characteristics of the Ecotect model
Model Characteristics Colour
Reflectivity
Visible
Transmittance
Material
Interior
Environment
Wall
Brick Plaster
cream white
(RAL 9001)
0.79 -
Floor
Marble Tiles
traffic white
(RAL 9016)
0.85 -
Ceiling
Suspended Concrete
Ceiling
Signal White
(RAL 9003)
0.84 -
Glazing
System
Window Single Glazed
(average dirty) - 0.85
Frame Aluminium
white 0.84 -
Daylighting
Systems
Laser Cut
Panel
Acrylic
(Parallel cuts) - 0.92
Mirror
(Optically reflective
surface)
0.83 -
Prismatic
Panel
Acrylic
(Sawtooth surfaces) - 0.92
Mirror
(Optically reflective
surface)
0.83 -
Light Shelf Aluminium 0.83 -
47
CHAPTER 4
RESULTS
This chapter involves four subsections; general findings obtained from field
measurements conducted in architectural design studios, findings regarding simulations
based on the field measurements, application of the proposed daylighting systems and a
discussion subsection evaluating all results in regard to literature and general
daylighting design norms.
4.1. Findings Regarding Field Measurements
All measurements of daylight illuminance were conducted in four architectural
design studios in the morning, at noon and in the afternoon. A total of 40 measurement
points were determined at each studio and measurements were carried out on certain
days in May (i.e. May 4th
, May 8th
) and June (i.e. May 4th
, May 8th
, June 20th
, June 21st,
June 25th
; June 27th
and June 28th
) 2012. The reason why the field measurements were
conducted on May and June based on the observation of the highest impact of sunlight
on these months during the educational season in Izmir.
The average, minimum and maximum daylight illuminance at four studios for
each measurement day and the external horizontal illuminance at the time of the
measurements are presented in Figures 4.1 – 4.4.
The average daylight illuminance was in accordance with the external horizontal
illuminance as known from literature. However, the inclination line of the external
horizontal illuminance depicted several divergences from the average internal horizontal
illuminance. For example, although the average illuminance (Eavg) in studio S02 on June
27th
decreased gradually by time, the same pattern cannot be observed in the external
horizontal illuminance for the same day. There was no strict and stable daylight factor
throughout the studios during the measurement days.
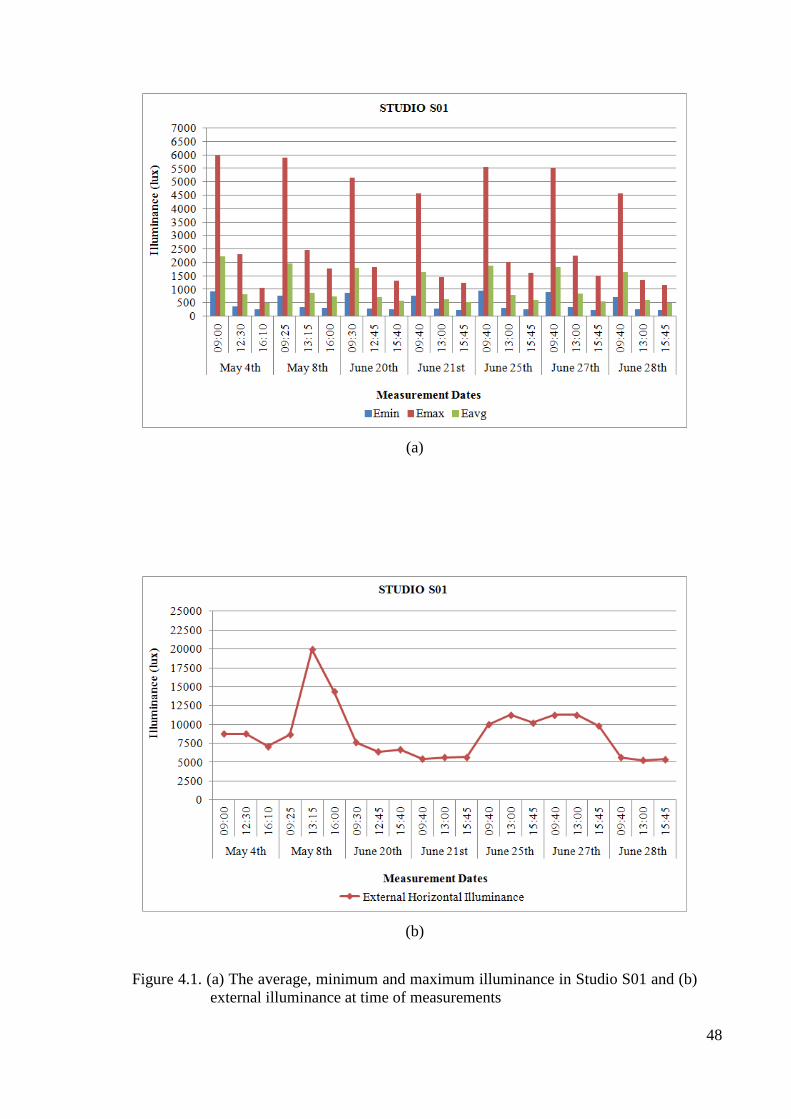
48
(a)
(b)
Figure 4.1. (a) The average, minimum and maximum illuminance in Studio S01 and (b)
external illuminance at time of measurements
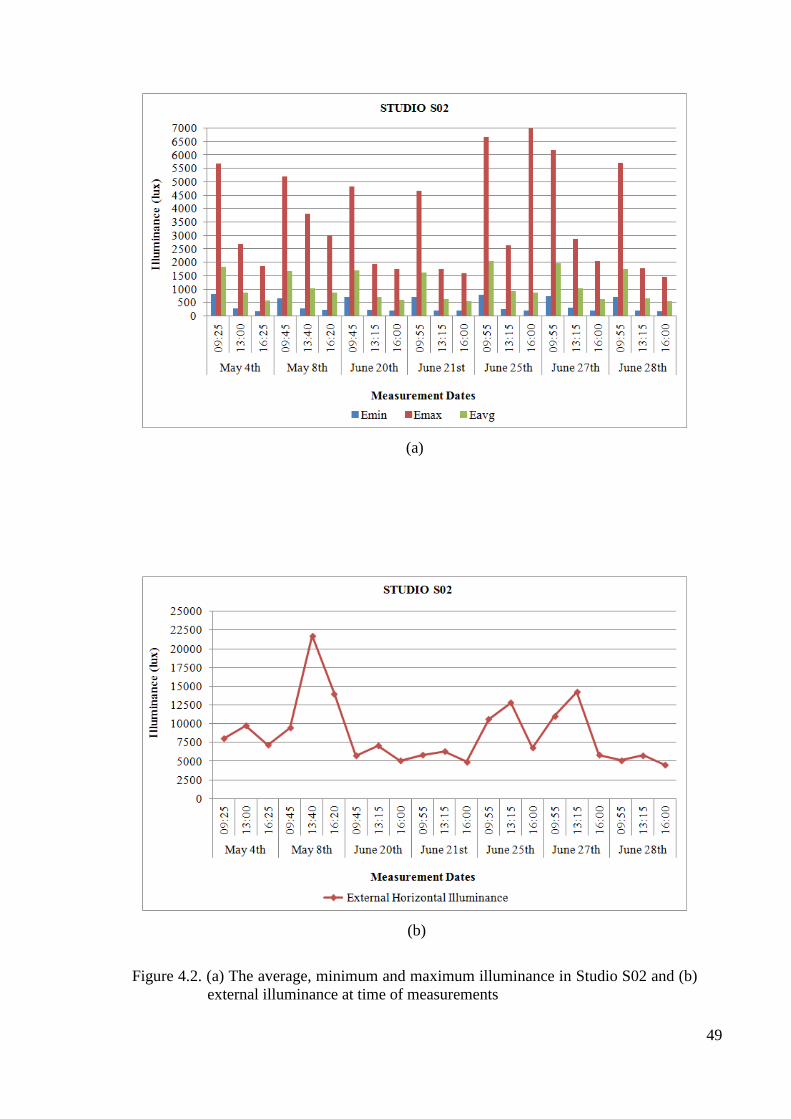
49
(a)
(b)
Figure 4.2. (a) The average, minimum and maximum illuminance in Studio S02 and (b)
external illuminance at time of measurements
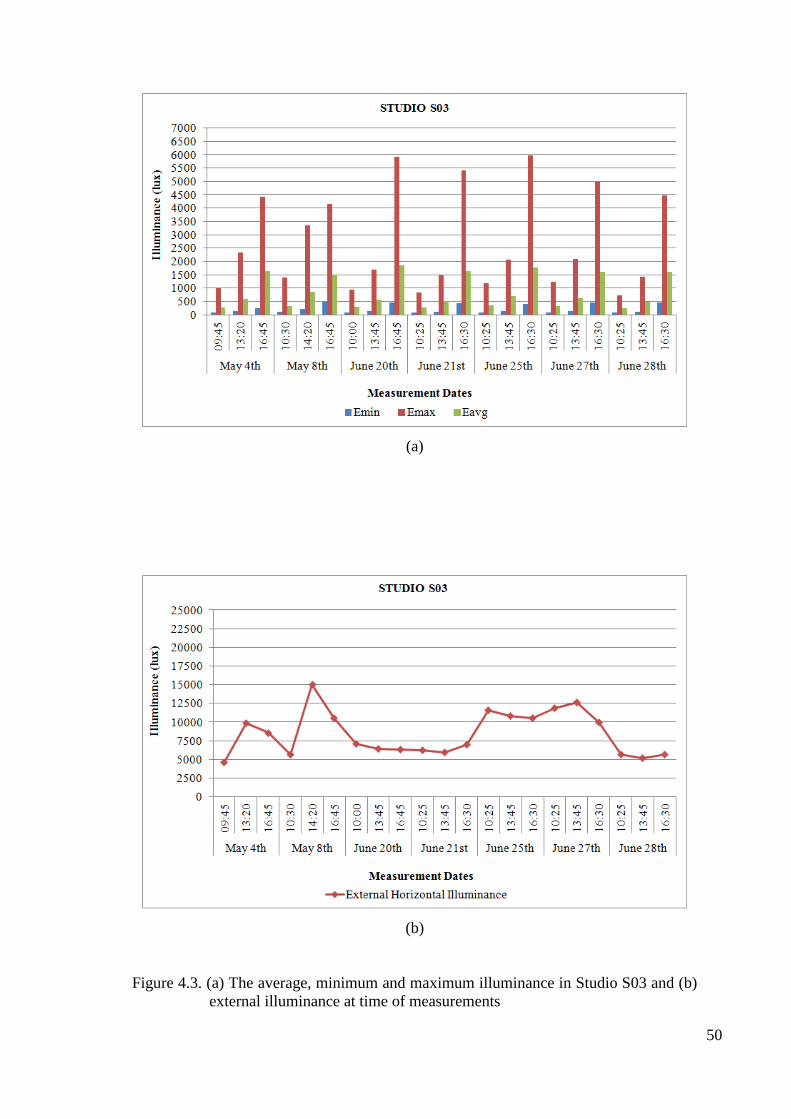
50
(a)
(b)
Figure 4.3. (a) The average, minimum and maximum illuminance in Studio S03 and (b)
external illuminance at time of measurements
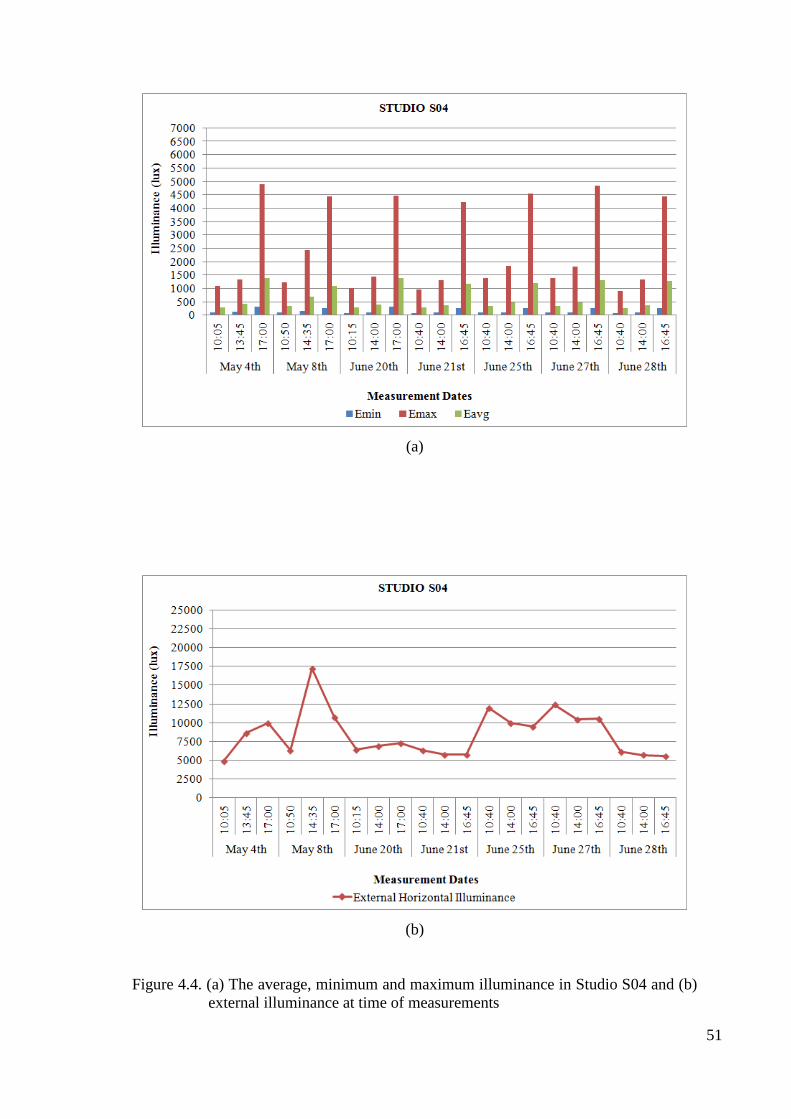
51
(a)
(b)
Figure 4.4. (a) The average, minimum and maximum illuminance in Studio S04 and (b)
external illuminance at time of measurements
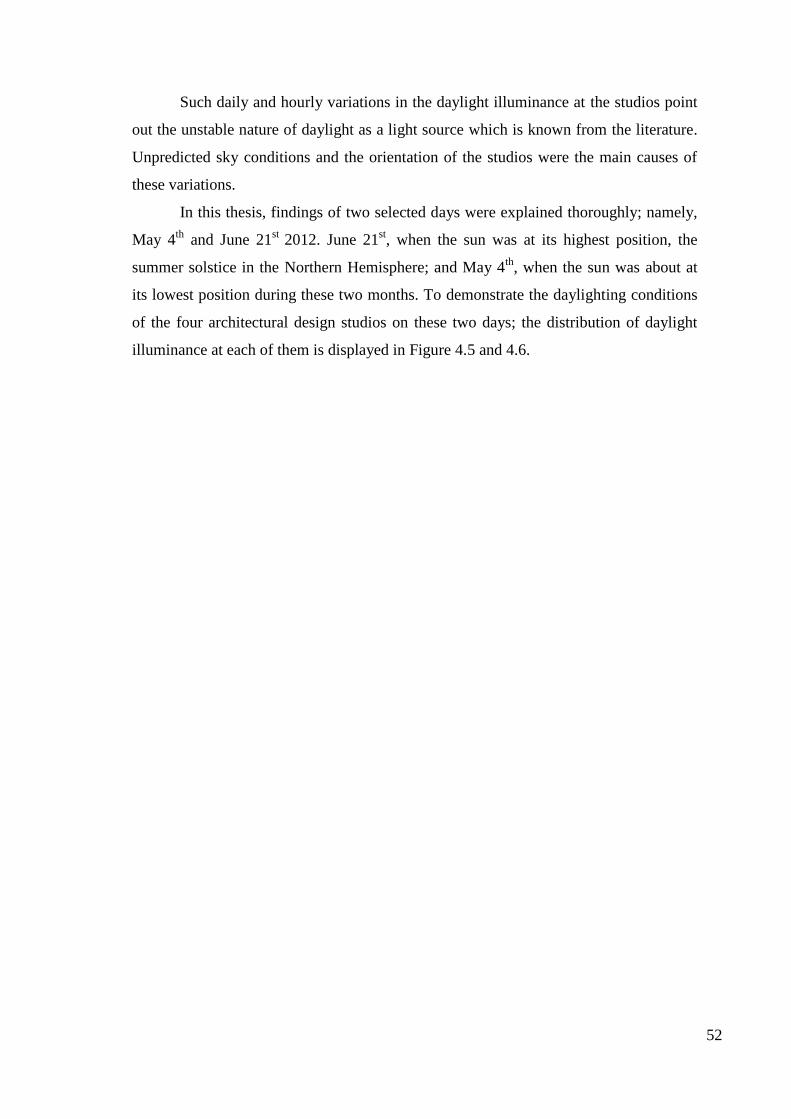
52
Such daily and hourly variations in the daylight illuminance at the studios point
out the unstable nature of daylight as a light source which is known from the literature.
Unpredicted sky conditions and the orientation of the studios were the main causes of
these variations.
In this thesis, findings of two selected days were explained thoroughly; namely,
May 4th
and June 21st
2012. June 21st, when the sun was at its highest position, the
summer solstice in the Northern Hemisphere; and May 4th
, when the sun was about at
its lowest position during these two months. To demonstrate the daylighting conditions
of the four architectural design studios on these two days; the distribution of daylight
illuminance at each of them is displayed in Figure 4.5 and 4.6.
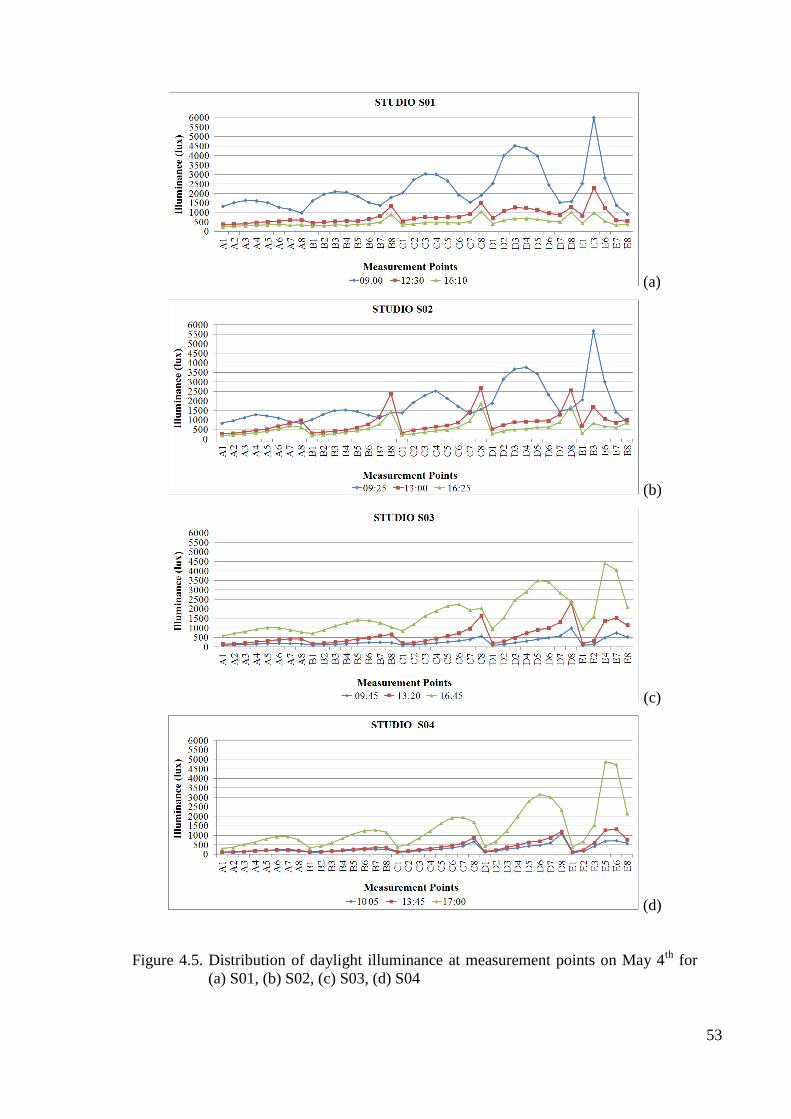
53
(a)
(b)
(c)
(d)
Figure 4.5. Distribution of daylight illuminance at measurement points on May 4th
for
(a) S01, (b) S02, (c) S03, (d) S04
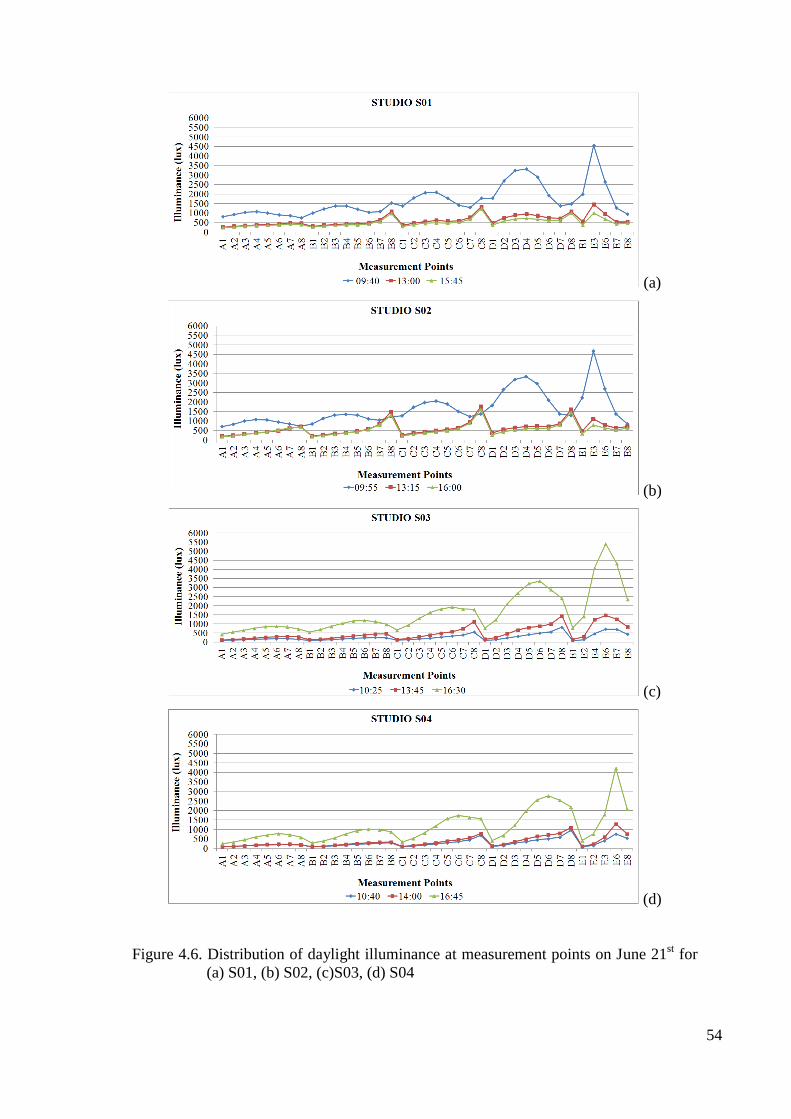
54
(a)
(b)
(c)
(d)
Figure 4.6. Distribution of daylight illuminance at measurement points on June 21st for
(a) S01, (b) S02, (c)S03, (d) S04
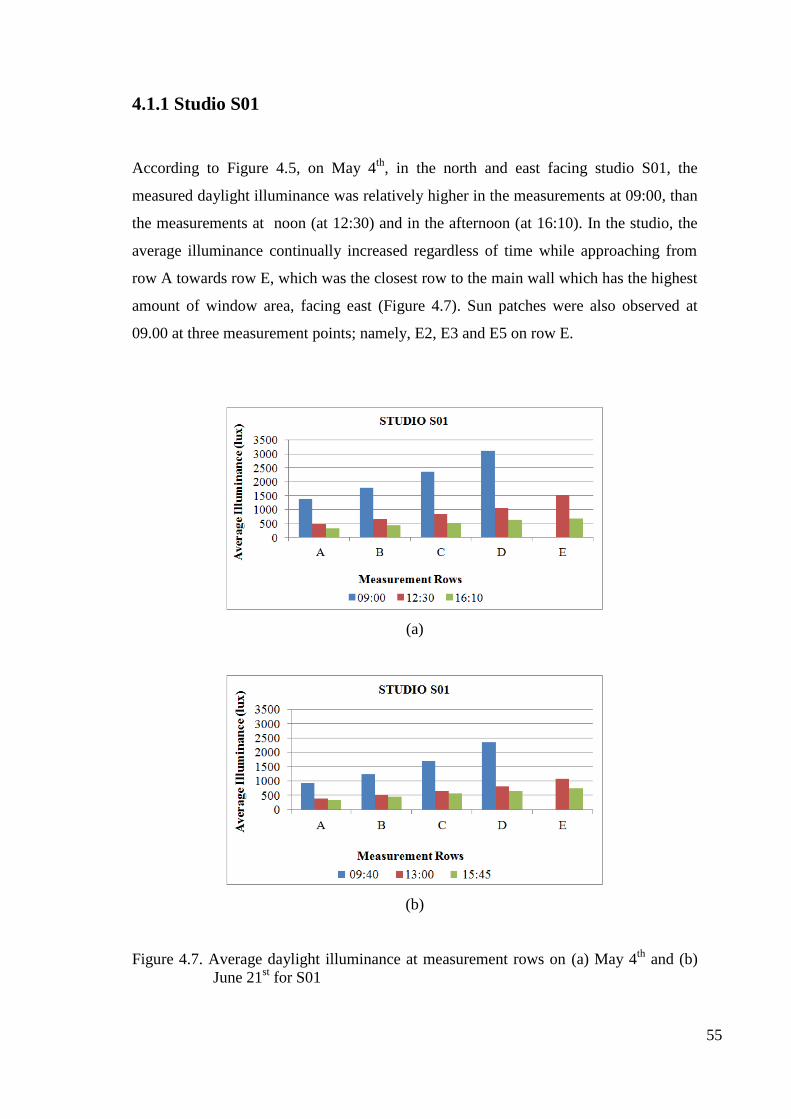
55
4.1.1 Studio S01
According to Figure 4.5, on May 4th
, in the north and east facing studio S01, the
measured daylight illuminance was relatively higher in the measurements at 09:00, than
the measurements at noon (at 12:30) and in the afternoon (at 16:10). In the studio, the
average illuminance continually increased regardless of time while approaching from
row A towards row E, which was the closest row to the main wall which has the highest
amount of window area, facing east (Figure 4.7). Sun patches were also observed at
09.00 at three measurement points; namely, E2, E3 and E5 on row E.
(a)
(b)
Figure 4.7. Average daylight illuminance at measurement rows on (a) May 4th
and (b)
June 21st for S01
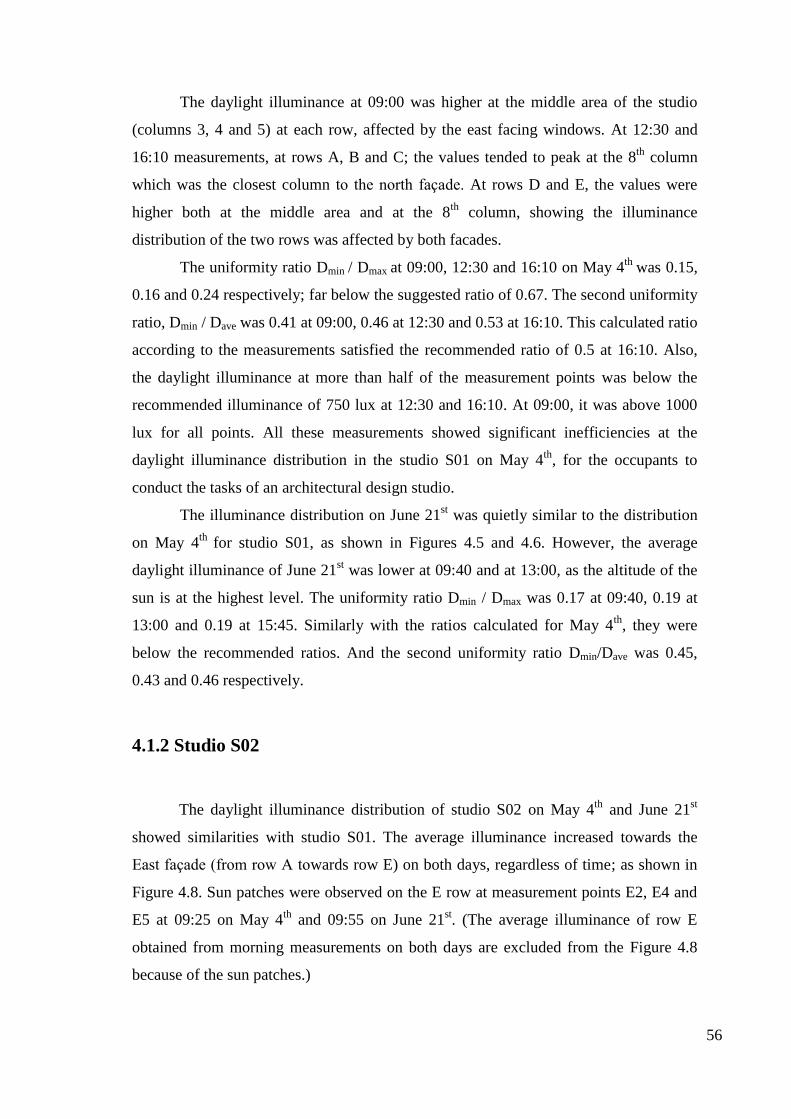
56
The daylight illuminance at 09:00 was higher at the middle area of the studio
(columns 3, 4 and 5) at each row, affected by the east facing windows. At 12:30 and
16:10 measurements, at rows A, B and C; the values tended to peak at the 8th
column
which was the closest column to the north façade. At rows D and E, the values were
higher both at the middle area and at the 8th
column, showing the illuminance
distribution of the two rows was affected by both facades.
The uniformity ratio Dmin / Dmax at 09:00, 12:30 and 16:10 on May 4th
was 0.15,
0.16 and 0.24 respectively; far below the suggested ratio of 0.67. The second uniformity
ratio, Dmin / Dave was 0.41 at 09:00, 0.46 at 12:30 and 0.53 at 16:10. This calculated ratio
according to the measurements satisfied the recommended ratio of 0.5 at 16:10. Also,
the daylight illuminance at more than half of the measurement points was below the
recommended illuminance of 750 lux at 12:30 and 16:10. At 09:00, it was above 1000
lux for all points. All these measurements showed significant inefficiencies at the
daylight illuminance distribution in the studio S01 on May 4th
, for the occupants to
conduct the tasks of an architectural design studio.
The illuminance distribution on June 21st was quietly similar to the distribution
on May 4th
for studio S01, as shown in Figures 4.5 and 4.6. However, the average
daylight illuminance of June 21st was lower at 09:40 and at 13:00, as the altitude of the
sun is at the highest level. The uniformity ratio Dmin / Dmax was 0.17 at 09:40, 0.19 at
13:00 and 0.19 at 15:45. Similarly with the ratios calculated for May 4th
, they were
below the recommended ratios. And the second uniformity ratio Dmin/Dave was 0.45,
0.43 and 0.46 respectively.
4.1.2 Studio S02
The daylight illuminance distribution of studio S02 on May 4th
and June 21st
showed similarities with studio S01. The average illuminance increased towards the
East façade (from row A towards row E) on both days, regardless of time; as shown in
Figure 4.8. Sun patches were observed on the E row at measurement points E2, E4 and
E5 at 09:25 on May 4th
and 09:55 on June 21st. (The average illuminance of row E
obtained from morning measurements on both days are excluded from the Figure 4.8
because of the sun patches.)
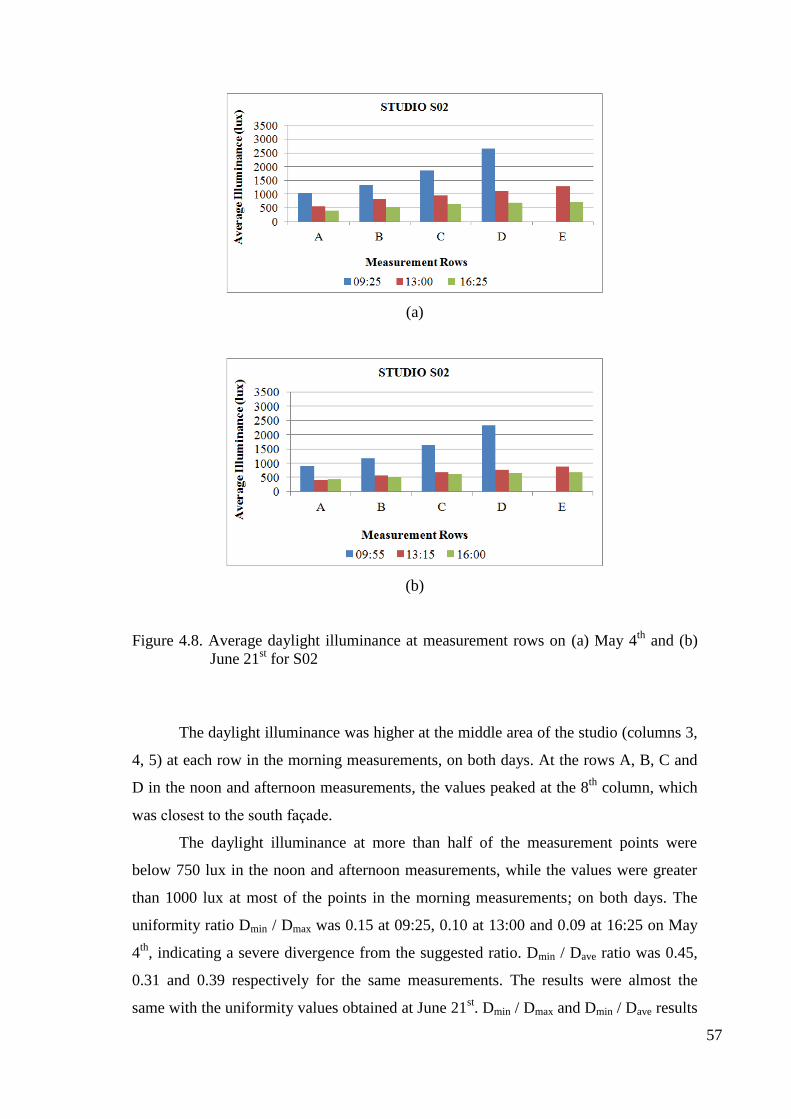
57
(a)
(b)
Figure 4.8. Average daylight illuminance at measurement rows on (a) May 4th
and (b)
June 21st for S02
The daylight illuminance was higher at the middle area of the studio (columns 3,
4, 5) at each row in the morning measurements, on both days. At the rows A, B, C and
D in the noon and afternoon measurements, the values peaked at the 8th
column, which
was closest to the south façade.
The daylight illuminance at more than half of the measurement points were
below 750 lux in the noon and afternoon measurements, while the values were greater
than 1000 lux at most of the points in the morning measurements; on both days. The
uniformity ratio Dmin / Dmax was 0.15 at 09:25, 0.10 at 13:00 and 0.09 at 16:25 on May
4th
, indicating a severe divergence from the suggested ratio. Dmin / Dave ratio was 0.45,
0.31 and 0.39 respectively for the same measurements. The results were almost the
same with the uniformity values obtained at June 21st. Dmin / Dmax and Dmin / Dave results
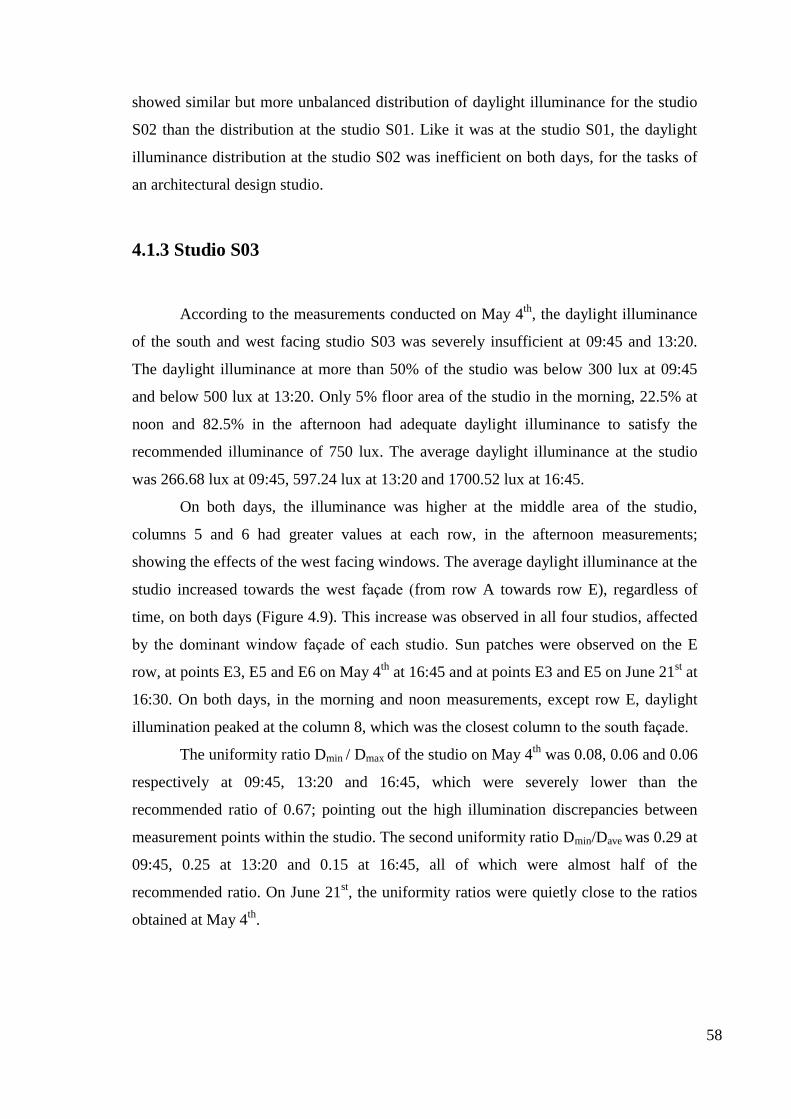
58
showed similar but more unbalanced distribution of daylight illuminance for the studio
S02 than the distribution at the studio S01. Like it was at the studio S01, the daylight
illuminance distribution at the studio S02 was inefficient on both days, for the tasks of
an architectural design studio.
4.1.3 Studio S03
According to the measurements conducted on May 4th
, the daylight illuminance
of the south and west facing studio S03 was severely insufficient at 09:45 and 13:20.
The daylight illuminance at more than 50% of the studio was below 300 lux at 09:45
and below 500 lux at 13:20. Only 5% floor area of the studio in the morning, 22.5% at
noon and 82.5% in the afternoon had adequate daylight illuminance to satisfy the
recommended illuminance of 750 lux. The average daylight illuminance at the studio
was 266.68 lux at 09:45, 597.24 lux at 13:20 and 1700.52 lux at 16:45.
On both days, the illuminance was higher at the middle area of the studio,
columns 5 and 6 had greater values at each row, in the afternoon measurements;
showing the effects of the west facing windows. The average daylight illuminance at the
studio increased towards the west façade (from row A towards row E), regardless of
time, on both days (Figure 4.9). This increase was observed in all four studios, affected
by the dominant window façade of each studio. Sun patches were observed on the E
row, at points E3, E5 and E6 on May 4th
at 16:45 and at points E3 and E5 on June 21st at
16:30. On both days, in the morning and noon measurements, except row E, daylight
illumination peaked at the column 8, which was the closest column to the south façade.
The uniformity ratio Dmin / Dmax of the studio on May 4th
was 0.08, 0.06 and 0.06
respectively at 09:45, 13:20 and 16:45, which were severely lower than the
recommended ratio of 0.67; pointing out the high illumination discrepancies between
measurement points within the studio. The second uniformity ratio Dmin/Dave was 0.29 at
09:45, 0.25 at 13:20 and 0.15 at 16:45, all of which were almost half of the
recommended ratio. On June 21st, the uniformity ratios were quietly close to the ratios
obtained at May 4th
.
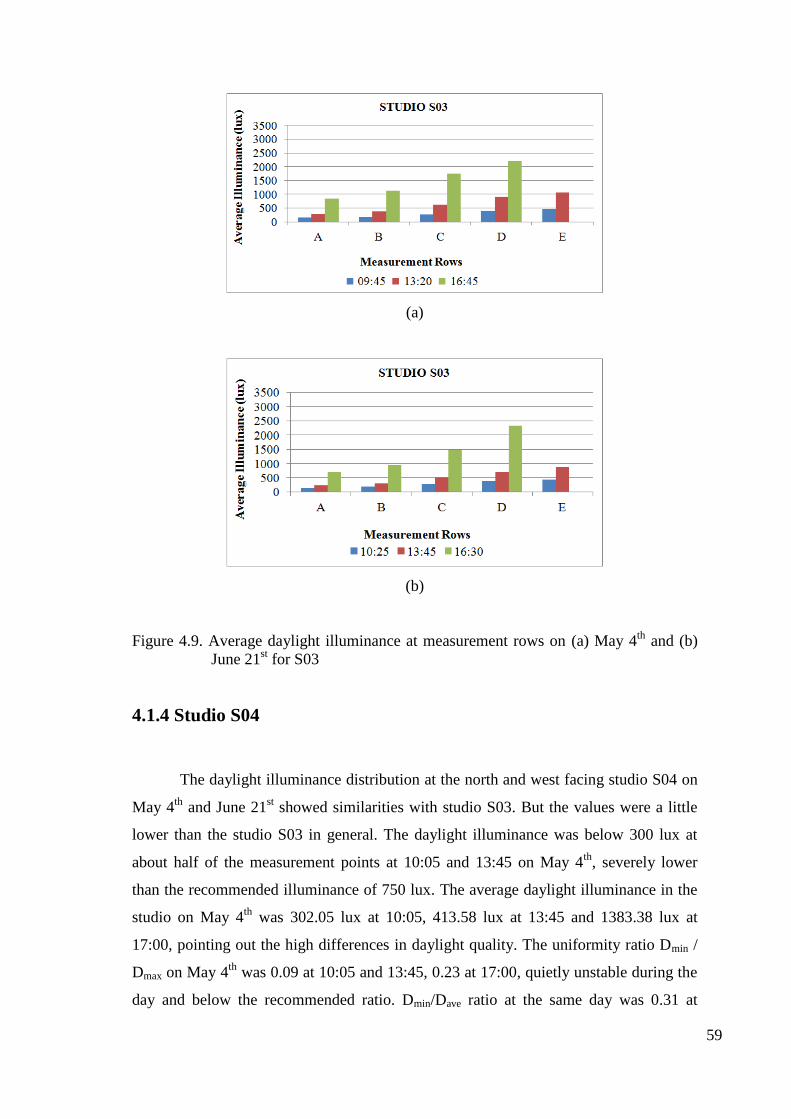
59
(a)
(b)
Figure 4.9. Average daylight illuminance at measurement rows on (a) May 4th
and (b)
June 21st for S03
4.1.4 Studio S04
The daylight illuminance distribution at the north and west facing studio S04 on
May 4th
and June 21st showed similarities with studio S03. But the values were a little
lower than the studio S03 in general. The daylight illuminance was below 300 lux at
about half of the measurement points at 10:05 and 13:45 on May 4th
, severely lower
than the recommended illuminance of 750 lux. The average daylight illuminance in the
studio on May 4th
was 302.05 lux at 10:05, 413.58 lux at 13:45 and 1383.38 lux at
17:00, pointing out the high differences in daylight quality. The uniformity ratio Dmin /
Dmax on May 4th
was 0.09 at 10:05 and 13:45, 0.23 at 17:00, quietly unstable during the
day and below the recommended ratio. Dmin/Dave ratio at the same day was 0.31 at
60
10:05, 0.29 at 13:45 and 0.23 at 17:00, about half of the recommended ratio of 0.50.
The results were very close on June 21st, both pointing out the deficiencies at daylight
illuminance distribution in the studio throughout the day.
The illuminance was higher at the middle area of the studio in the afternoon;
columns 6 and 7 had greater illuminance at each row, affected by the west facing
windows. The average daylight illuminance at the studio also increased towards the
West façade (from row A towards row E), regardless of time, on both days (Figure
4.10). The sun patches were also observed on row E, at points E4 and E7 on May 4th
at
17:00 and E4, E5 and E7 on June 21st at 16:45.
(a)
(b)
Figure 4.10. Average daylight illuminance at measurement rows on (a) May 4th
and (b)
June 21st for S04
61
4.1.5 Overview
The distribution of the daylight illuminance at four studios was severely unstable
on daily and hourly basis as can be derived from the Figures 4.11 and 4.12. In addition,
the daylight distribution among the studios for the same time interval showed
remarkable variations. Regarding the measurements in the morning, the daylight
illumination in the west facing studios S03 and S04 were seriously insufficient for the
required daylighting norms of a design studio in an educational building. The values
were greater in the east facing studios S01 and S02, but severely non uniform;
additionally, at the most of the measurement points, they were far greater than the
desired values. Regarding the measurements at noon, the illuminance distribution
showed similarities among the studios, but uniformity was inadequate and the values
did not reach to the desired interval. According to the measurements in the afternoon,
the east facing studios S01 and S02 showed a similar distribution, and had lower and
more inadequate values than the other studios had. On the other hand, the average
daylight illuminance in S03 and S04 was greater than the illuminance in S01 and S02,
but severely non uniform and mostly far greater than the desired values (Figure 4.11 and
4.12).
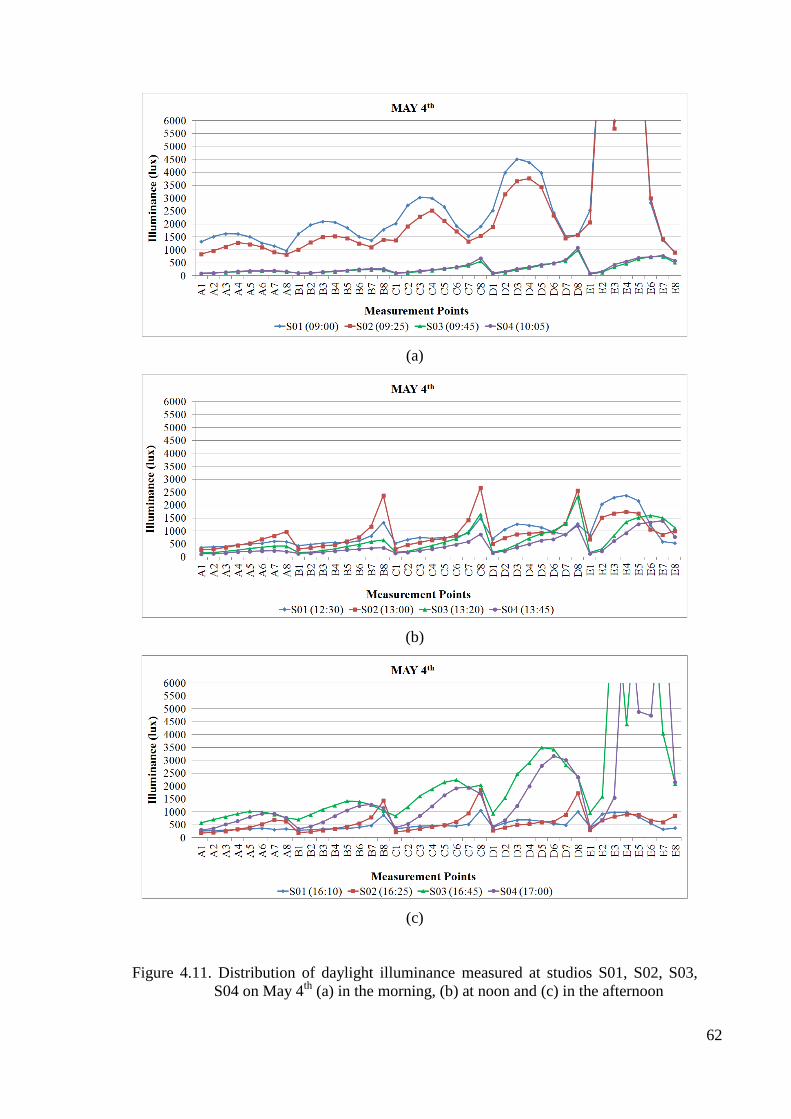
62
(a)
(b)
(c)
Figure 4.11. Distribution of daylight illuminance measured at studios S01, S02, S03,
S04 on May 4th
(a) in the morning, (b) at noon and (c) in the afternoon
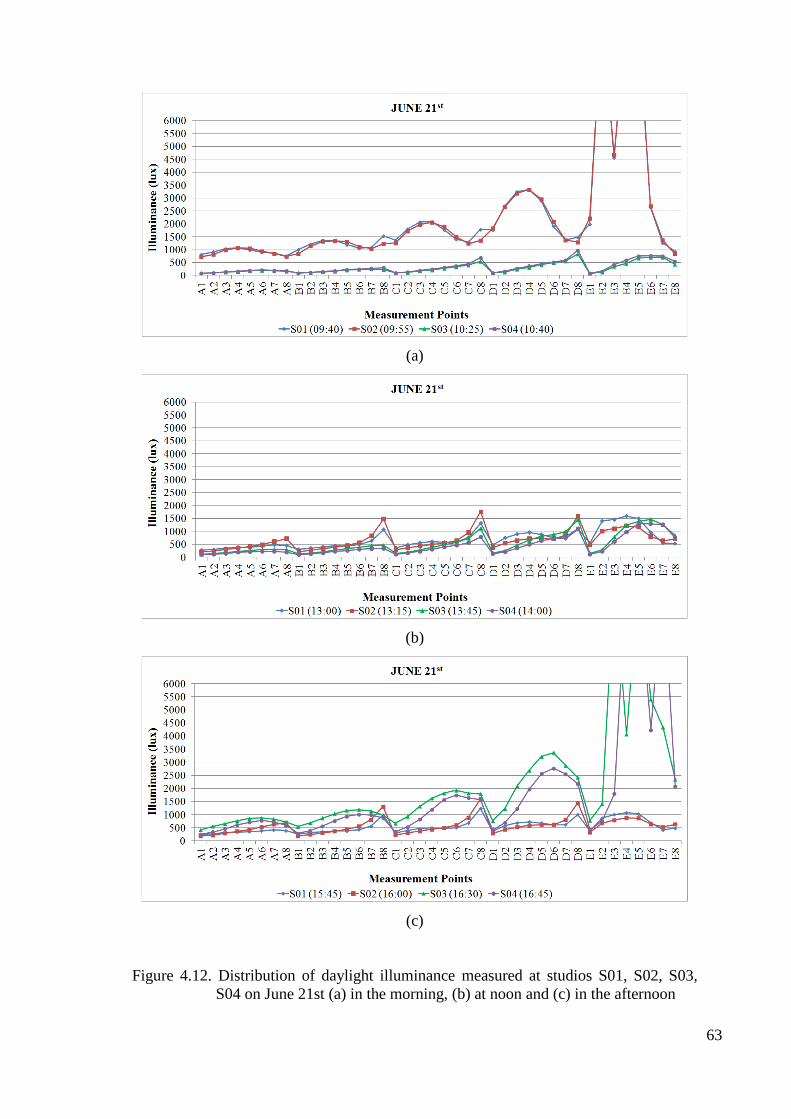
63
(a)
(b)
(c)
Figure 4.12. Distribution of daylight illuminance measured at studios S01, S02, S03,
S04 on June 21st (a) in the morning, (b) at noon and (c) in the afternoon
64
4.2. Findings Regarding Simulation
The simulation model of the four studios was built using Autodesk Ecotect
Analysis, as mentioned before. The actual locations of the drawing tables and openings
were modeled. The color and reflectance of surface materials were selected carefully in
order to resemble the actual materials correctly. The daylight simulations for the
selected two days, May 4th
and June 21st, were conducted on this model, on Autodesk
Ecotect Analysis platform; using Desktop Radiance.
The simulation outputs of Desktop Radiance (daylight illuminance at
measurement points) were compared with the field measurements in order to validate
and finalize the Ecotect model. Linear regression analysis was used to estimate the
relationship between the field measurements and simulation results, and to validate the
model. The coefficient of determination (R2) values ranged between 88% and 98% for
all simulations of May 4th
and between 78% and 97% for June 21st; showing the high
accuracy of the simulation model. Here, only the comparison of May 4th
simulations
with the field measurements are given in detail as shown in Figures 4.13 - 4.15.
According to the simulations which were conducted in the morning on May 4th
,
the daylight illuminance distribution and the field measurements matched mostly. It was
observed that the values were closer at the west facing studios. So, it was thought that
the indirect and diffuse illumination caused by the sky luminance in the morning might
be the reason of this situation in these studios. For all four studios, the simulation results
were greater than the field measurements in the morning as shown in Figure 4.13. In
east facing studios, this difference was greater; however, the distribution remained very
close, as mentioned.
Simulations conducted at noon also slightly overestimated daylight illuminance
for all studios. The illuminance distribution of the simulation results and field
measurements matched very closely at the majority of the points; however they showed
some variations at S02 and S03, at row E, on the points close to the south facing
windows as displayed in Figure 4.14. These areas were exposed to direct sunlight at the
time of the measurements. So, this might cause these divergences.
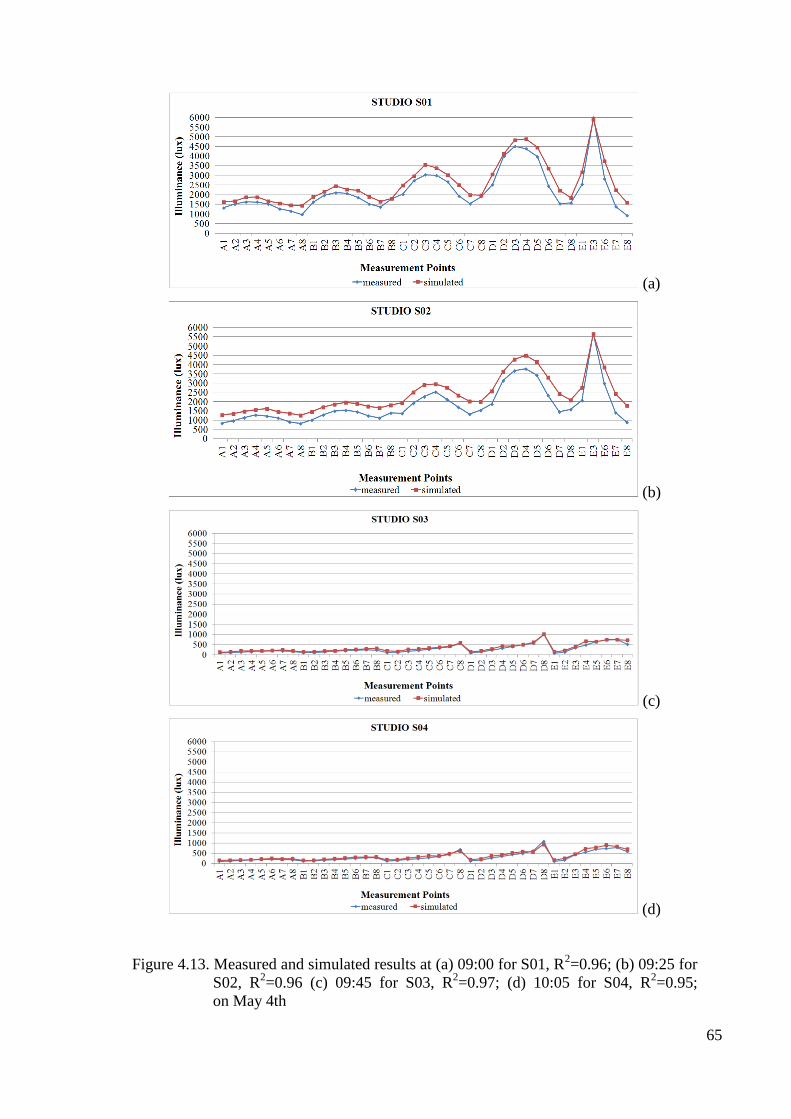
65
(a)
(b)
(c)
(d)
Figure 4.13. Measured and simulated results at (a) 09:00 for S01, R2=0.96; (b) 09:25 for
S02, R2=0.96 (c) 09:45 for S03, R
2=0.97; (d) 10:05 for S04, R
2=0.95;
on May 4th
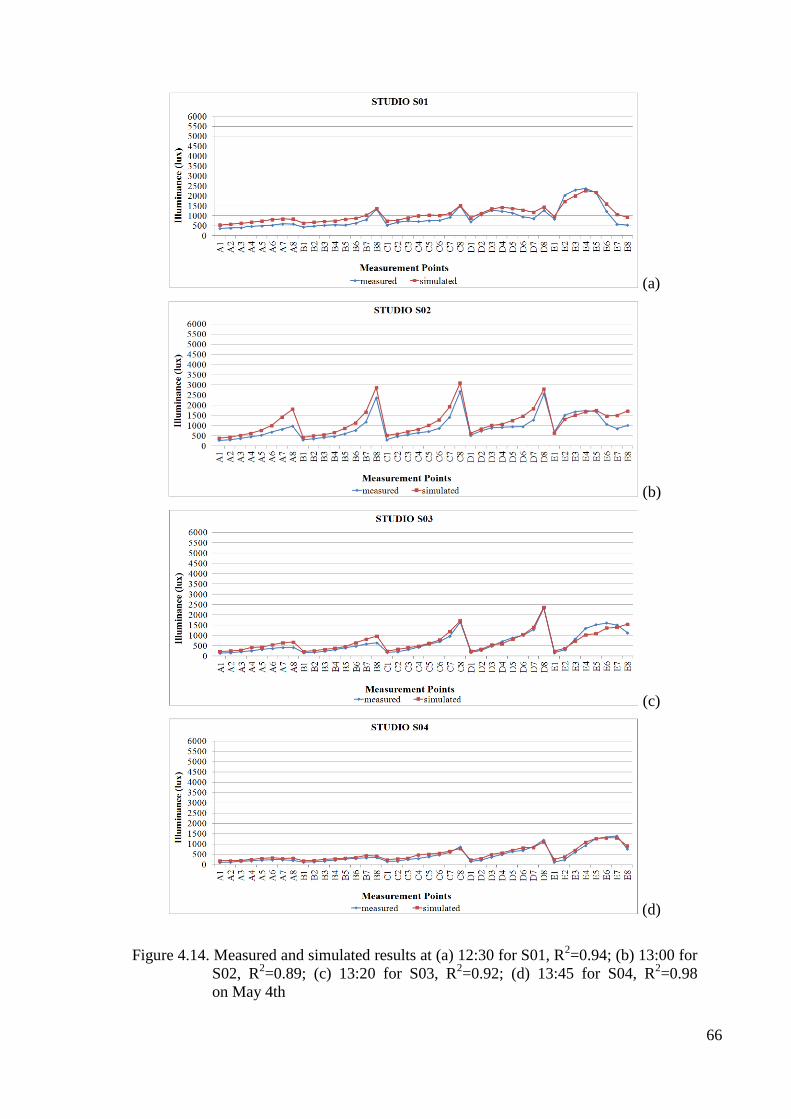
66
(a)
(b)
(c)
(d)
Figure 4.14. Measured and simulated results at (a) 12:30 for S01, R2=0.94; (b) 13:00 for
S02, R2=0.89; (c) 13:20 for S03, R
2=0.92; (d) 13:45 for S04, R
2=0.98
on May 4th
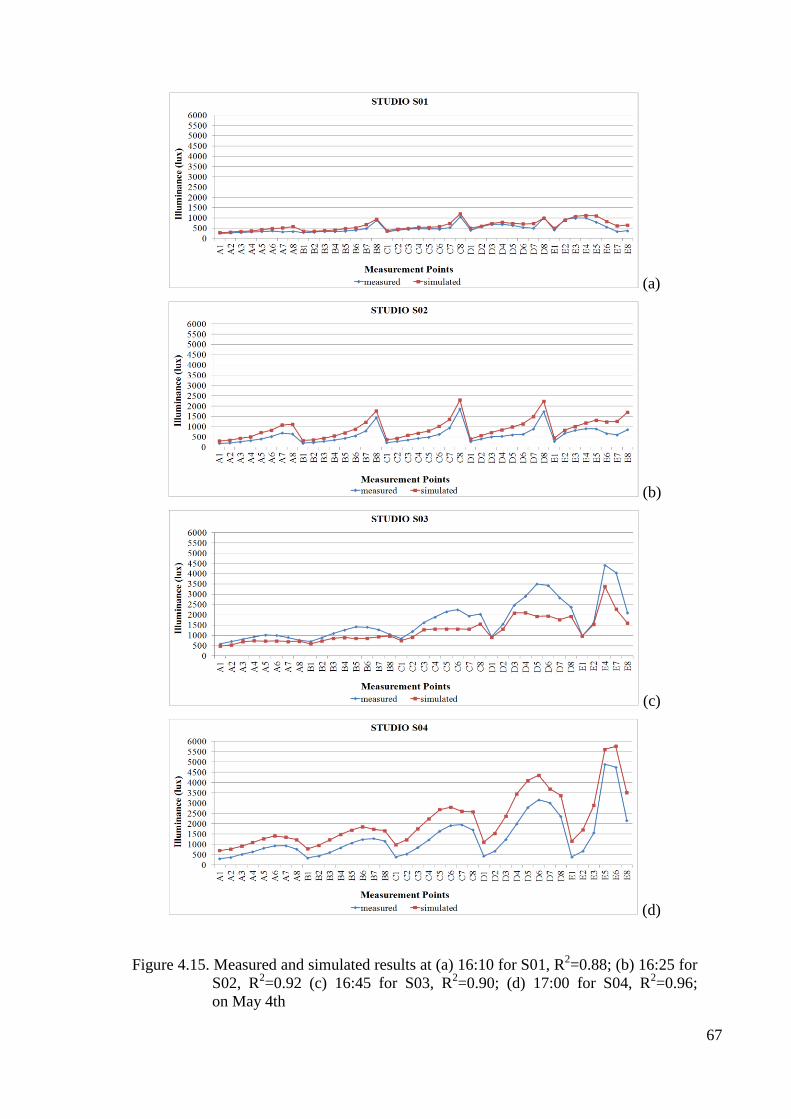
67
(a)
(b)
(c)
(d)
Figure 4.15. Measured and simulated results at (a) 16:10 for S01, R2=0.88; (b) 16:25 for
S02, R2=0.92 (c) 16:45 for S03, R
2=0.90; (d) 17:00 for S04, R
2=0.96;
on May 4th
68
Regarding the simulations carried out in the afternoon, the illuminance
distribution of the simulation results was very close to the measurements at the studio
S01 and S02. However, the differences between them were slightly higher on the rows
A and E, columns 6, 7, 8. On the other hand, the illuminance distribution of the studio
S03 showed significant divergences when compared to other three studios. On the rows
B, C, D and E, and on the columns 4, 5, 6, 7, the shift in the results was greater. Those
points were exposed to direct illumination at the time of the measurements; so, again,
that might have caused the differences. Apart from the simulations conducted in the
other studios, the predicted illuminance by Radiance was lower than the field
measurements in the studio S03. The simulations for the studio S04 also resulted
similarly. In general, the daylight illuminance distribution of the simulation results
showed inconstancies with the field measurements at the points which were exposed to
direct sunlight. Otherwise, they might explicitly display more uniform daylight
distribution than it was; and they would show closer matches to the field measurements
(Figure 4.15).
4.3. Application of Proposed Daylighting Systems
As can be acquired from the findings of field measurements and Desktop
Radiance simulations, the current daylighting condition of the four studios were
severely insufficient for the norms of architectural design studios. The daylight
illuminance distribution of the studios was not uniform and the values did not satisfy the
recommended levels. The differences in the illuminance were remarkably high within
the studios; the measurement points near the rear wall of the studios largely differed
from the points near the exterior walls with the large glazed areas. The horizontal depth
of the studios was 11,25m and the glazing ratio (the window area / the floor area)
differed from 9% to 11% for each studio, strictly lower than the recommended ratios for
educational spaces. The glazing area of the studios was not enough to illuminate the
whole space uniformly.
In the light of all these considerations, this thesis aimed to propose a daylighting
system to improve the daylight illuminance and uniformity in these studios. With regard
to the all mentioned daylighting deficiencies of the studios, these systems should have
light guiding capabilities in order to redirect daylight towards the low illuminated areas
69
away from the window wall. These systems also should have sun shading capabilities in
order to prevent the present sun patches and glare near the window wall.
Regarding these assessments, daylighting simulations were conducted with three
selected advanced daylighting systems; laser cut panels, prismatic panels and lastly,
light shelves in order to comprehend their effects on the daylight illuminance and
uniformity of the studios. For the simulations, the material characteristics and
dimensioning of the elements of the proposed daylighting systems were determined
from the previous studies. Thus, it was aimed to make comparison between the findings
of this study and the literature. The simulation results of the proposed systems for the
four architectural design studios are given as Figures 4.16 – 4.19.
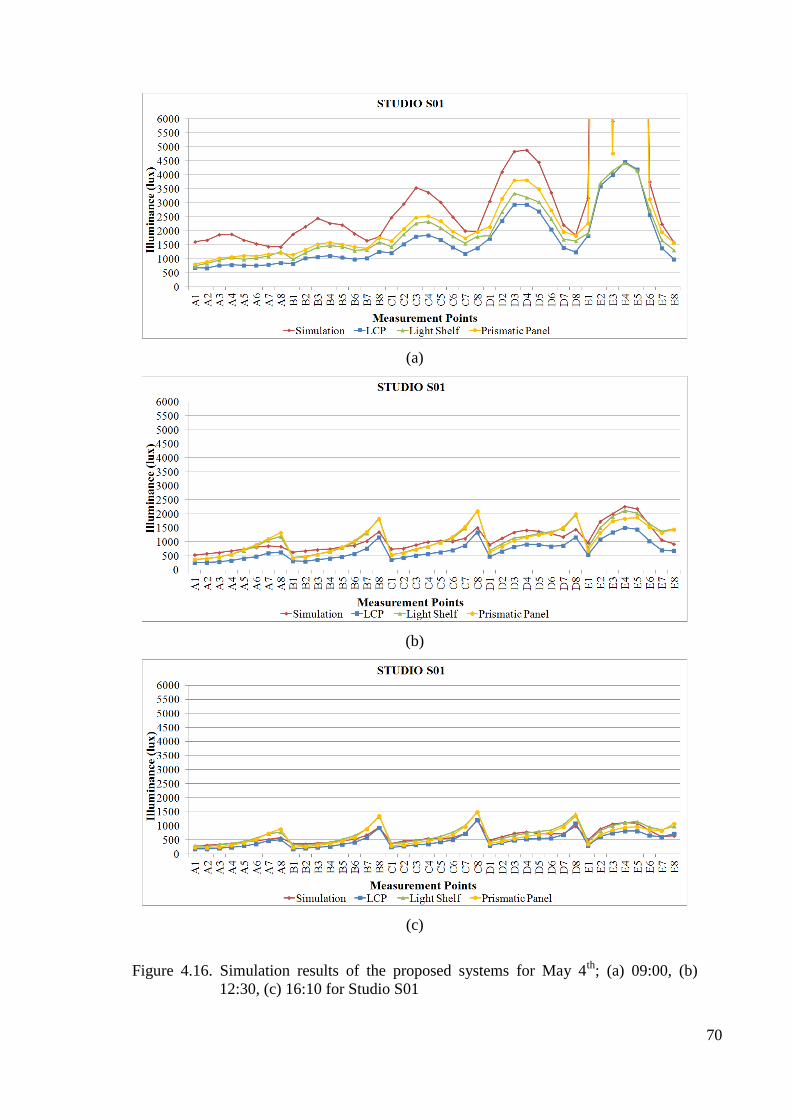
70
(a)
(b)
(c)
Figure 4.16. Simulation results of the proposed systems for May 4th
; (a) 09:00, (b)
12:30, (c) 16:10 for Studio S01
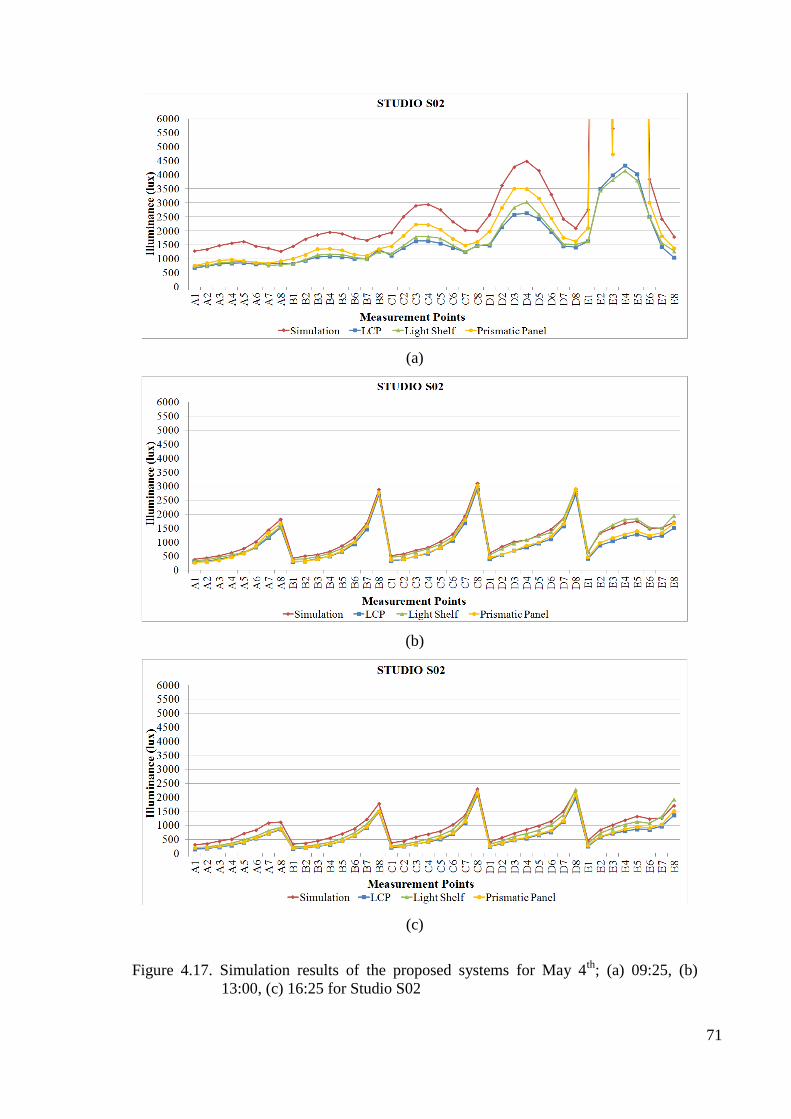
71
(a)
(b)
(c)
Figure 4.17. Simulation results of the proposed systems for May 4th
; (a) 09:25, (b)
13:00, (c) 16:25 for Studio S02
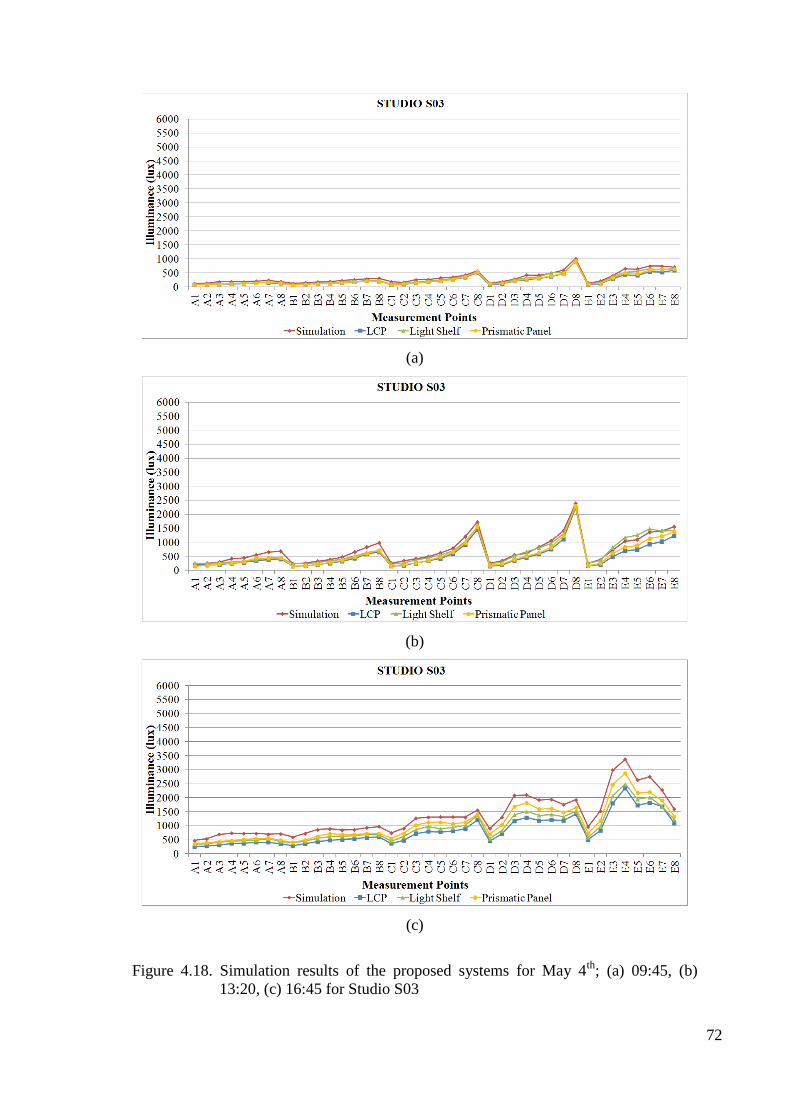
72
(a)
(b)
(c)
Figure 4.18. Simulation results of the proposed systems for May 4th
; (a) 09:45, (b)
13:20, (c) 16:45 for Studio S03
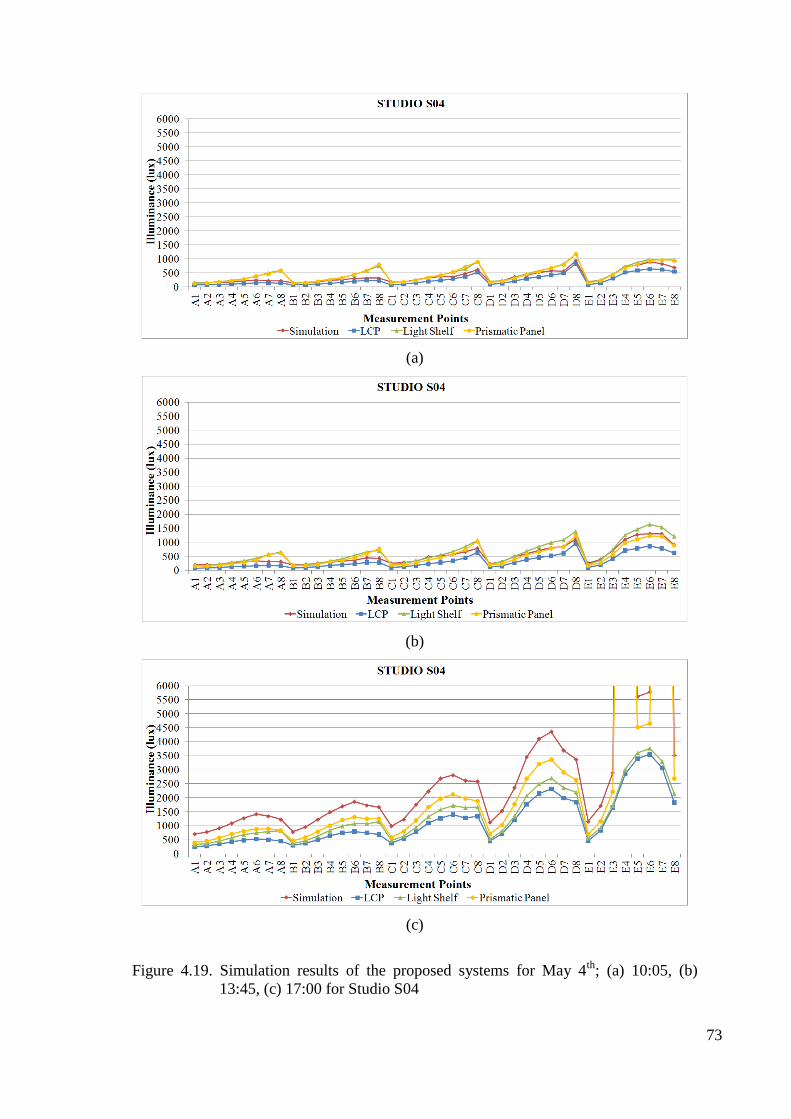
73
(a)
(b)
(c)
Figure 4.19. Simulation results of the proposed systems for May 4th
; (a) 10:05, (b)
13:45, (c) 17:00 for Studio S04
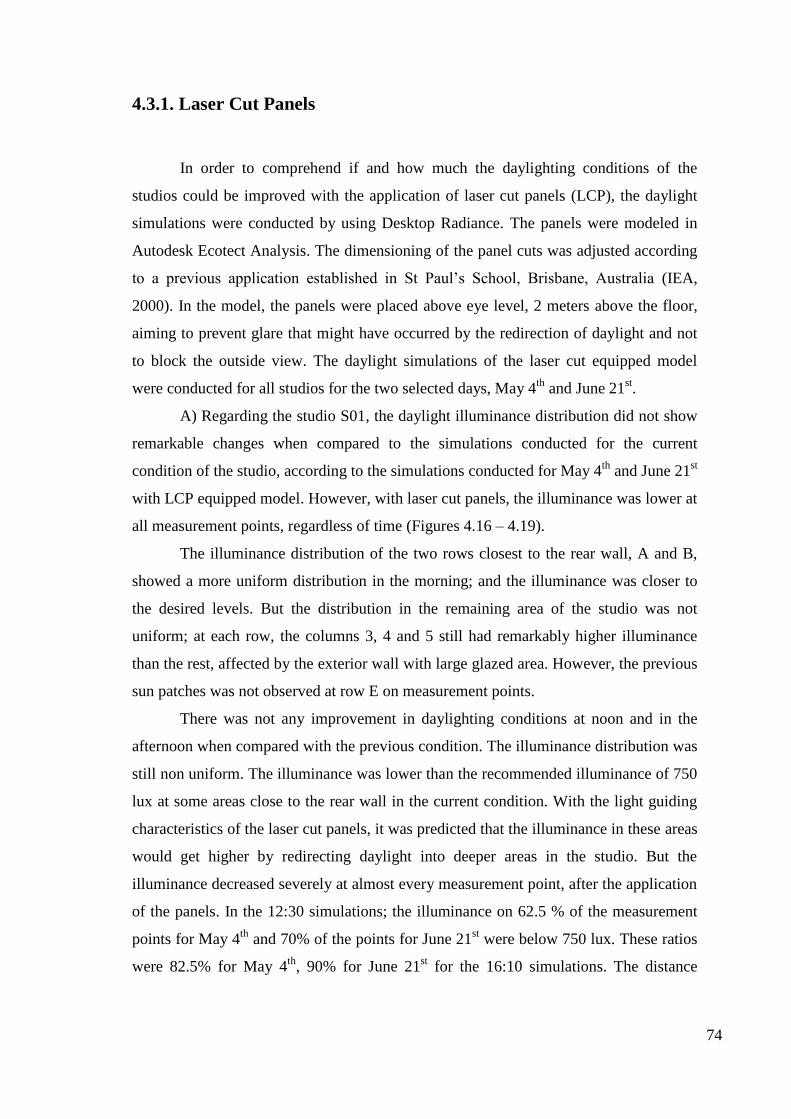
74
4.3.1. Laser Cut Panels
In order to comprehend if and how much the daylighting conditions of the
studios could be improved with the application of laser cut panels (LCP), the daylight
simulations were conducted by using Desktop Radiance. The panels were modeled in
Autodesk Ecotect Analysis. The dimensioning of the panel cuts was adjusted according
to a previous application established in St Paul’s School, Brisbane, Australia (IEA,
2000). In the model, the panels were placed above eye level, 2 meters above the floor,
aiming to prevent glare that might have occurred by the redirection of daylight and not
to block the outside view. The daylight simulations of the laser cut equipped model
were conducted for all studios for the two selected days, May 4th
and June 21st.
A) Regarding the studio S01, the daylight illuminance distribution did not show
remarkable changes when compared to the simulations conducted for the current
condition of the studio, according to the simulations conducted for May 4th
and June 21st
with LCP equipped model. However, with laser cut panels, the illuminance was lower at
all measurement points, regardless of time (Figures 4.16 – 4.19).
The illuminance distribution of the two rows closest to the rear wall, A and B,
showed a more uniform distribution in the morning; and the illuminance was closer to
the desired levels. But the distribution in the remaining area of the studio was not
uniform; at each row, the columns 3, 4 and 5 still had remarkably higher illuminance
than the rest, affected by the exterior wall with large glazed area. However, the previous
sun patches was not observed at row E on measurement points.
There was not any improvement in daylighting conditions at noon and in the
afternoon when compared with the previous condition. The illuminance distribution was
still non uniform. The illuminance was lower than the recommended illuminance of 750
lux at some areas close to the rear wall in the current condition. With the light guiding
characteristics of the laser cut panels, it was predicted that the illuminance in these areas
would get higher by redirecting daylight into deeper areas in the studio. But the
illuminance decreased severely at almost every measurement point, after the application
of the panels. In the 12:30 simulations; the illuminance on 62.5 % of the measurement
points for May 4th
and 70% of the points for June 21st were below 750 lux. These ratios
were 82.5% for May 4th
, 90% for June 21st for the 16:10 simulations. The distance
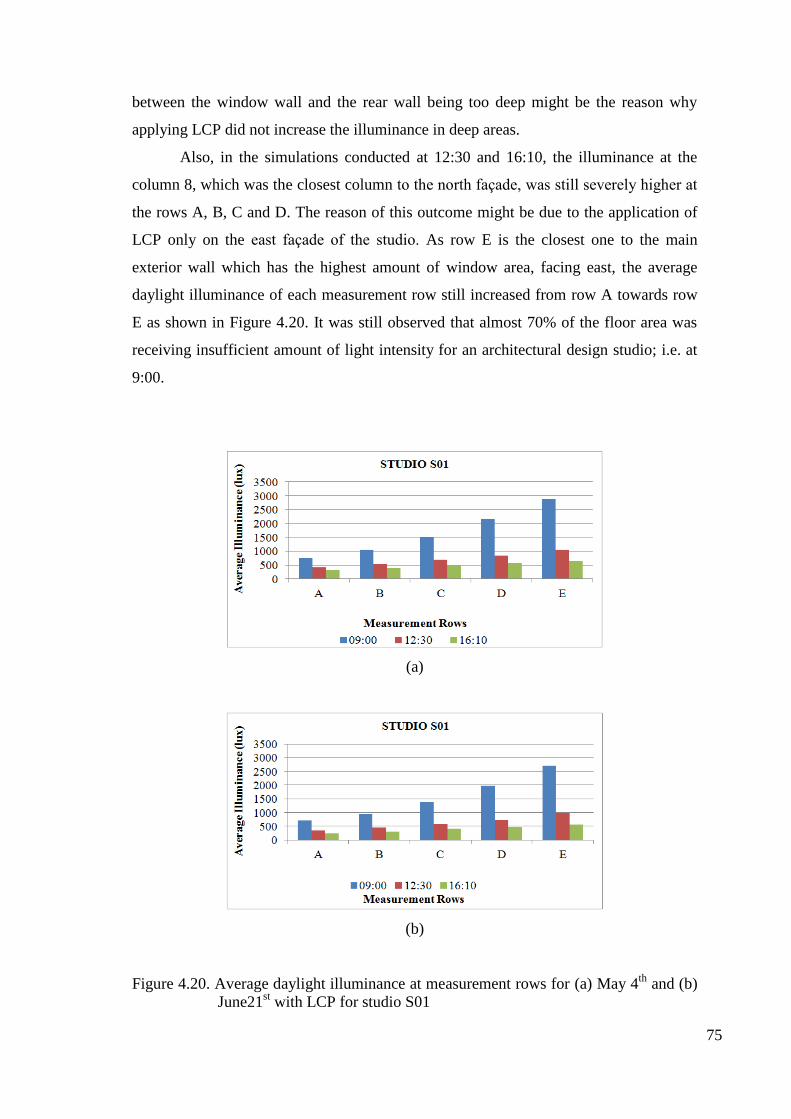
75
between the window wall and the rear wall being too deep might be the reason why
applying LCP did not increase the illuminance in deep areas.
Also, in the simulations conducted at 12:30 and 16:10, the illuminance at the
column 8, which was the closest column to the north façade, was still severely higher at
the rows A, B, C and D. The reason of this outcome might be due to the application of
LCP only on the east façade of the studio. As row E is the closest one to the main
exterior wall which has the highest amount of window area, facing east, the average
daylight illuminance of each measurement row still increased from row A towards row
E as shown in Figure 4.20. It was still observed that almost 70% of the floor area was
receiving insufficient amount of light intensity for an architectural design studio; i.e. at
9:00.
(a)
(b)
Figure 4.20. Average daylight illuminance at measurement rows for (a) May 4th
and (b)
June21st with LCP for studio S01
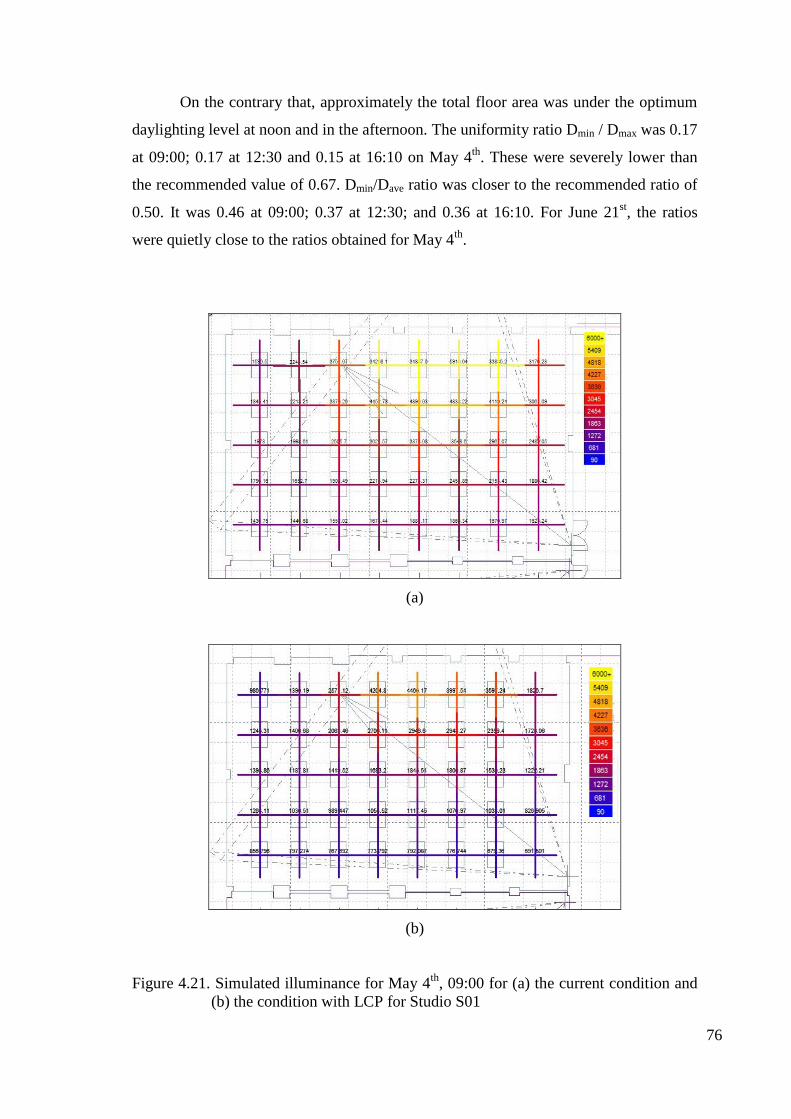
76
On the contrary that, approximately the total floor area was under the optimum
daylighting level at noon and in the afternoon. The uniformity ratio Dmin / Dmax was 0.17
at 09:00; 0.17 at 12:30 and 0.15 at 16:10 on May 4th
. These were severely lower than
the recommended value of 0.67. Dmin/Dave ratio was closer to the recommended ratio of
0.50. It was 0.46 at 09:00; 0.37 at 12:30; and 0.36 at 16:10. For June 21st, the ratios
were quietly close to the ratios obtained for May 4th
.
(a)
(b)
Figure 4.21. Simulated illuminance for May 4th
, 09:00 for (a) the current condition and
(b) the condition with LCP for Studio S01
77
The simulation outputs resulted from Ecotect/ Radiance for studio S01 were
presented to comprehend the changes in the illuminance distribution with the
application of LCP as displayed in Figures 4.21-4.24 with the help of a colored legend.
Regarding these, the most day lit areas (points) were presented as yellow and orange
which are near the main exterior wall. LCP decreased the horizontal daylight
illuminance throughout the floor area and avoided the sun patches (Figure 4.21).
(a)
(b)
Figure 4.22. Illuminance contour lines showing distribution on May 4th
, at 09:00 for (a)
the current condition and (b) the condition with LCP for Studio S01
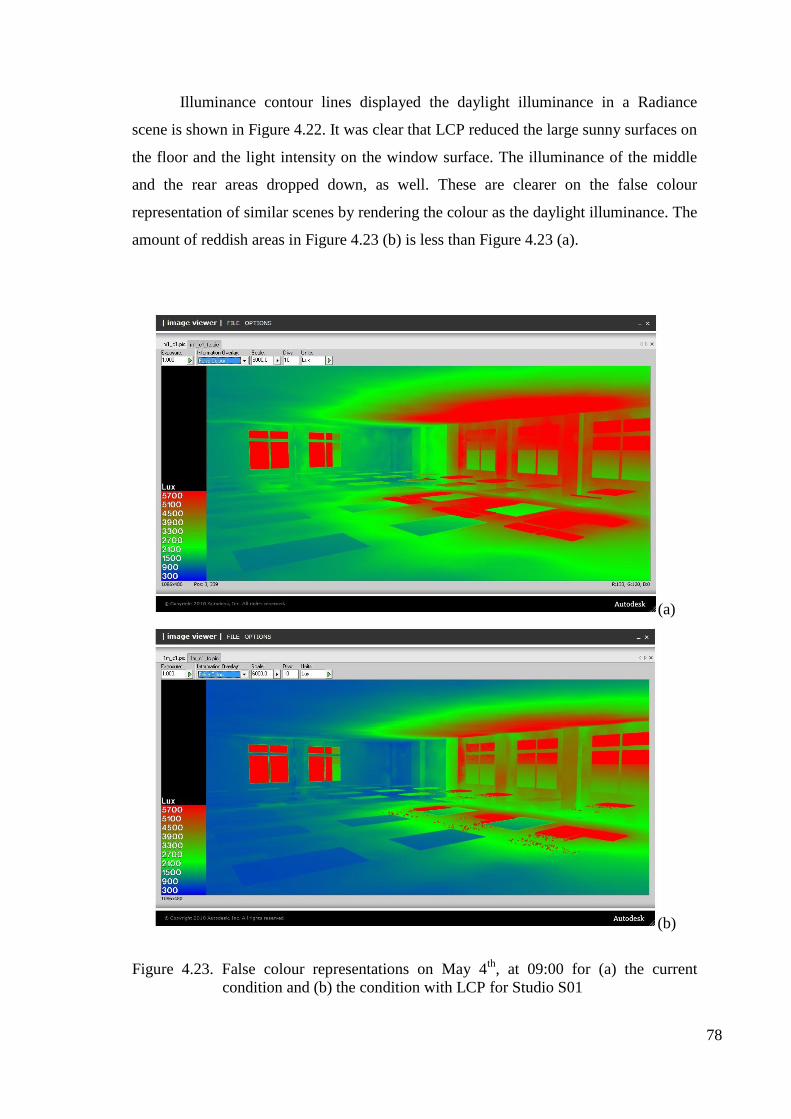
78
Illuminance contour lines displayed the daylight illuminance in a Radiance
scene is shown in Figure 4.22. It was clear that LCP reduced the large sunny surfaces on
the floor and the light intensity on the window surface. The illuminance of the middle
and the rear areas dropped down, as well. These are clearer on the false colour
representation of similar scenes by rendering the colour as the daylight illuminance. The
amount of reddish areas in Figure 4.23 (b) is less than Figure 4.23 (a).
(a)
(b)
Figure 4.23. False colour representations on May 4th
, at 09:00 for (a) the current
condition and (b) the condition with LCP for Studio S01
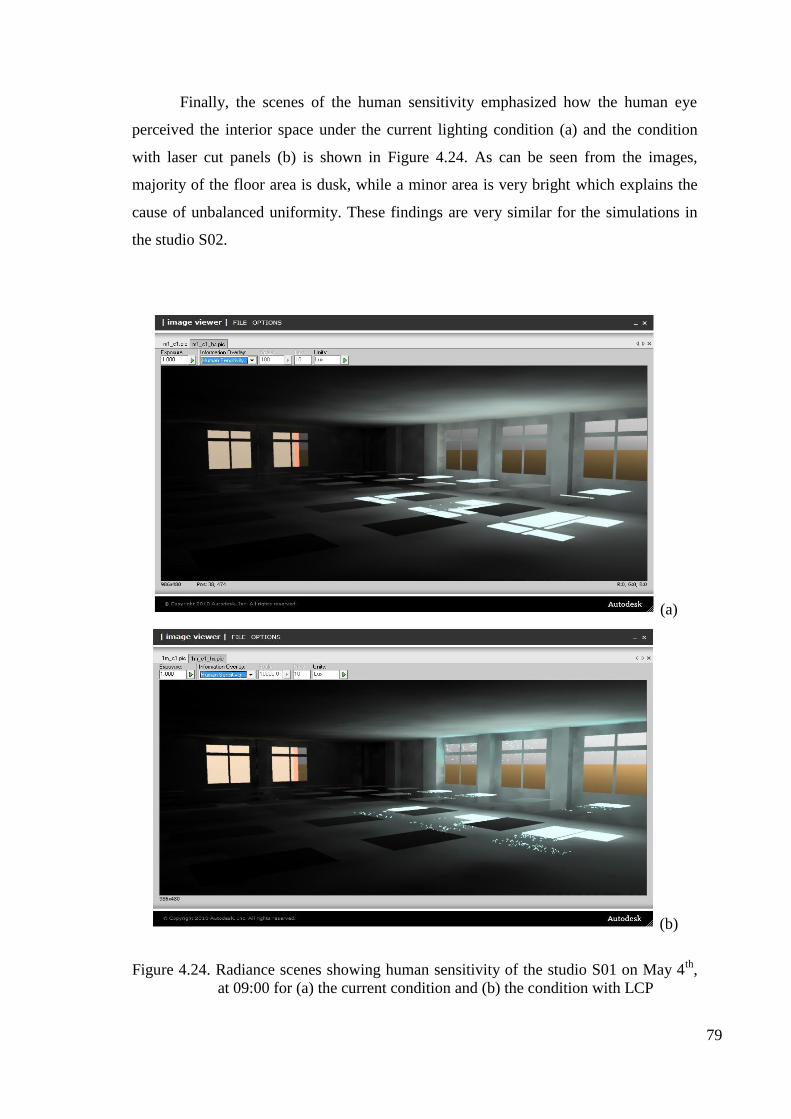
79
Finally, the scenes of the human sensitivity emphasized how the human eye
perceived the interior space under the current lighting condition (a) and the condition
with laser cut panels (b) is shown in Figure 4.24. As can be seen from the images,
majority of the floor area is dusk, while a minor area is very bright which explains the
cause of unbalanced uniformity. These findings are very similar for the simulations in
the studio S02.
(a)
(b)
Figure 4.24. Radiance scenes showing human sensitivity of the studio S01 on May 4th
,
at 09:00 for (a) the current condition and (b) the condition with LCP
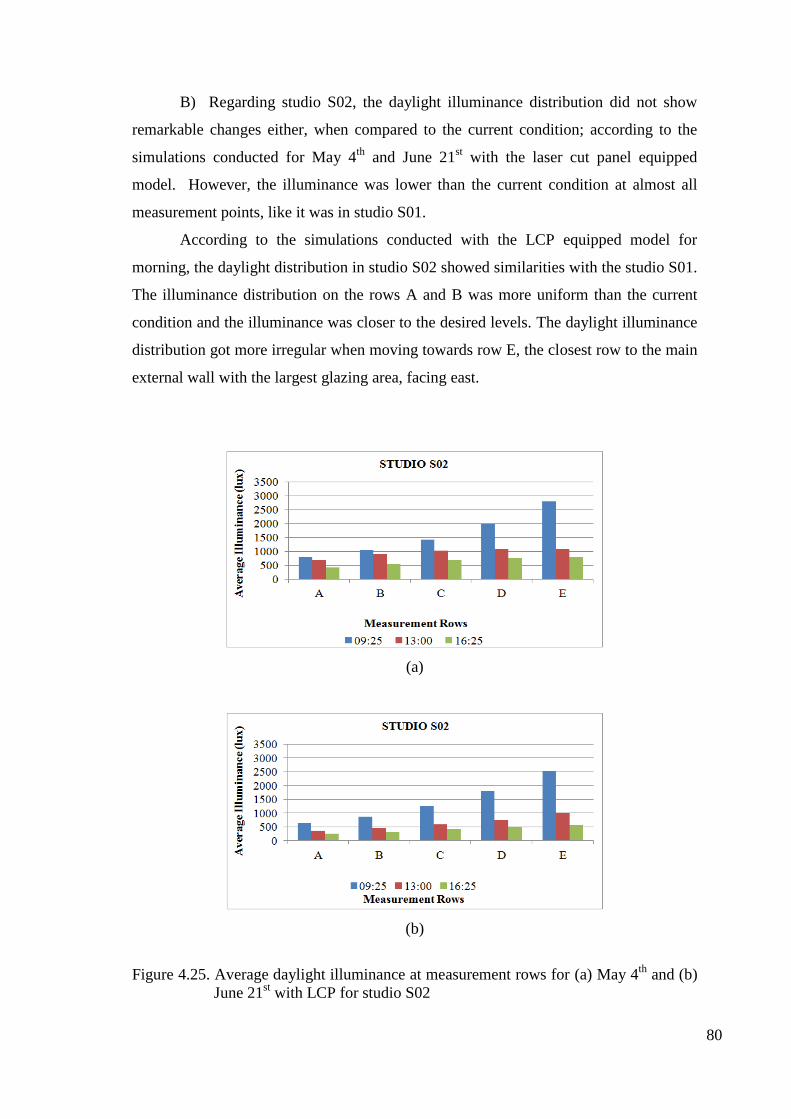
80
B) Regarding studio S02, the daylight illuminance distribution did not show
remarkable changes either, when compared to the current condition; according to the
simulations conducted for May 4th
and June 21st with the laser cut panel equipped
model. However, the illuminance was lower than the current condition at almost all
measurement points, like it was in studio S01.
According to the simulations conducted with the LCP equipped model for
morning, the daylight distribution in studio S02 showed similarities with the studio S01.
The illuminance distribution on the rows A and B was more uniform than the current
condition and the illuminance was closer to the desired levels. The daylight illuminance
distribution got more irregular when moving towards row E, the closest row to the main
external wall with the largest glazing area, facing east.
(a)
(b)
Figure 4.25. Average daylight illuminance at measurement rows for (a) May 4th
and (b)
June 21st with LCP for studio S02
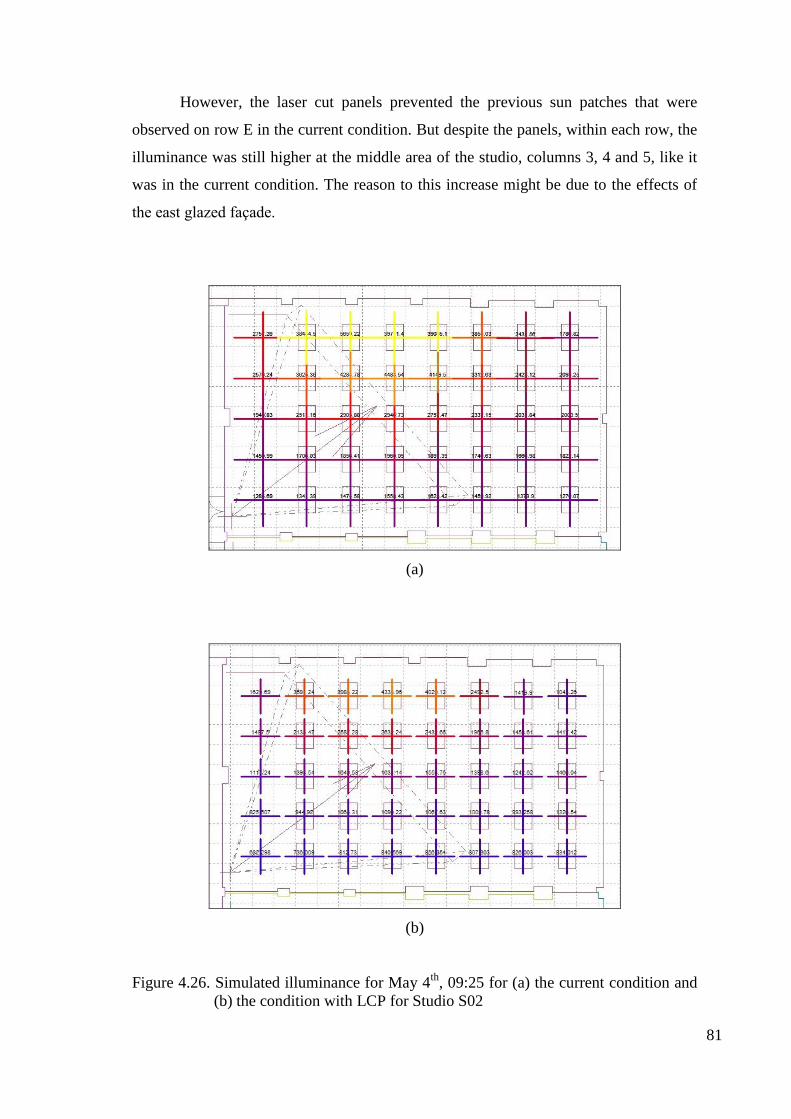
81
However, the laser cut panels prevented the previous sun patches that were
observed on row E in the current condition. But despite the panels, within each row, the
illuminance was still higher at the middle area of the studio, columns 3, 4 and 5, like it
was in the current condition. The reason to this increase might be due to the effects of
the east glazed façade.
(a)
(b)
Figure 4.26. Simulated illuminance for May 4th
, 09:25 for (a) the current condition and
(b) the condition with LCP for Studio S02
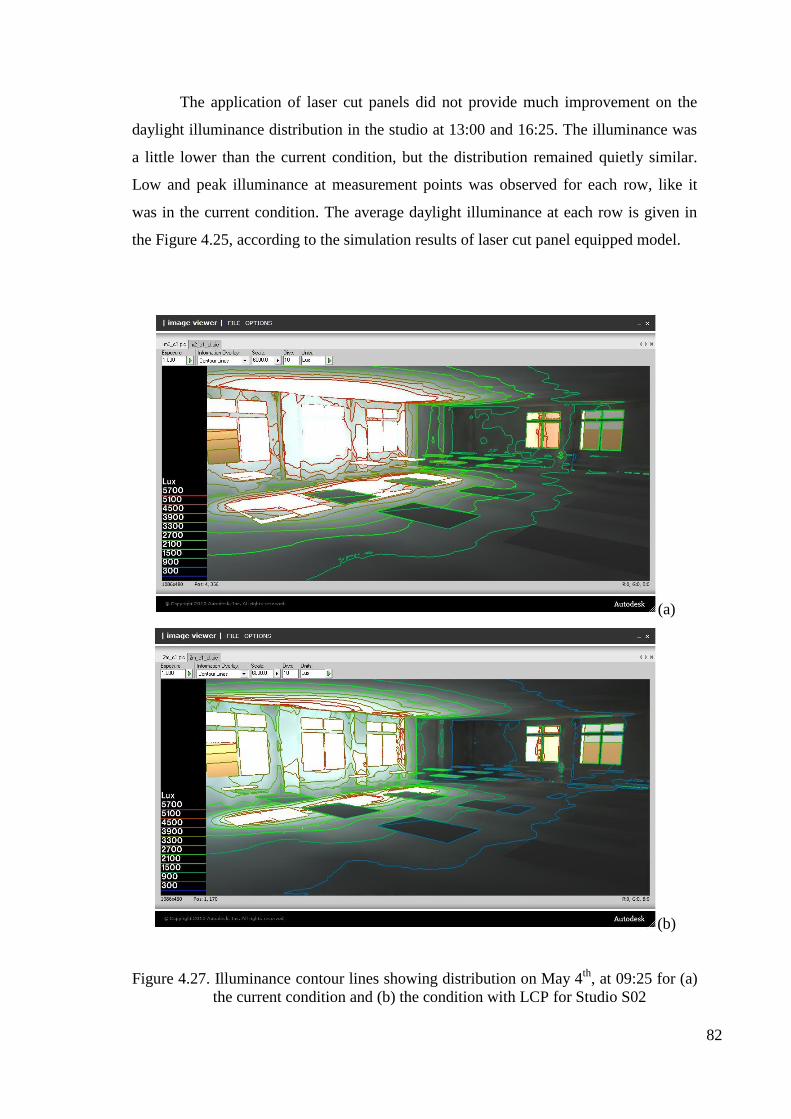
82
The application of laser cut panels did not provide much improvement on the
daylight illuminance distribution in the studio at 13:00 and 16:25. The illuminance was
a little lower than the current condition, but the distribution remained quietly similar.
Low and peak illuminance at measurement points was observed for each row, like it
was in the current condition. The average daylight illuminance at each row is given in
the Figure 4.25, according to the simulation results of laser cut panel equipped model.
(a)
(b)
Figure 4.27. Illuminance contour lines showing distribution on May 4th
, at 09:25 for (a)
the current condition and (b) the condition with LCP for Studio S02
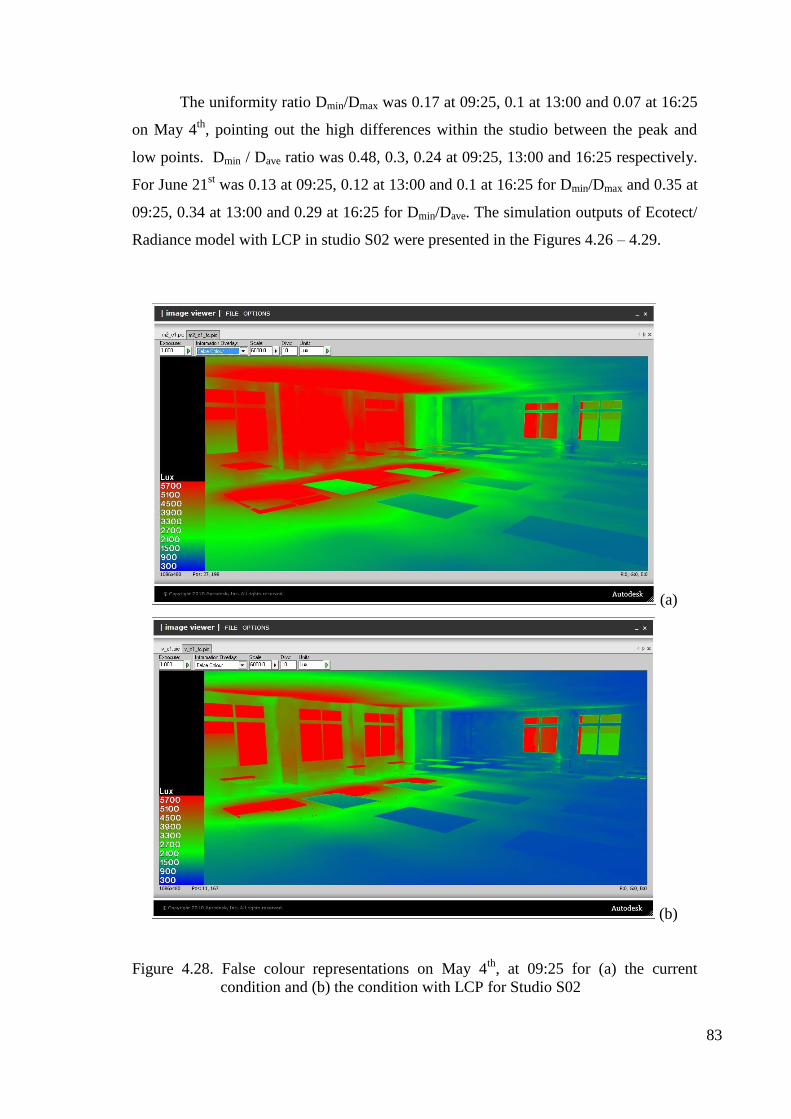
83
The uniformity ratio Dmin/Dmax was 0.17 at 09:25, 0.1 at 13:00 and 0.07 at 16:25
on May 4th
, pointing out the high differences within the studio between the peak and
low points. Dmin / Dave ratio was 0.48, 0.3, 0.24 at 09:25, 13:00 and 16:25 respectively.
For June 21st was 0.13 at 09:25, 0.12 at 13:00 and 0.1 at 16:25 for Dmin/Dmax and 0.35 at
09:25, 0.34 at 13:00 and 0.29 at 16:25 for Dmin/Dave. The simulation outputs of Ecotect/
Radiance model with LCP in studio S02 were presented in the Figures 4.26 – 4.29.
(a)
(b)
Figure 4.28. False colour representations on May 4th
, at 09:25 for (a) the current
condition and (b) the condition with LCP for Studio S02
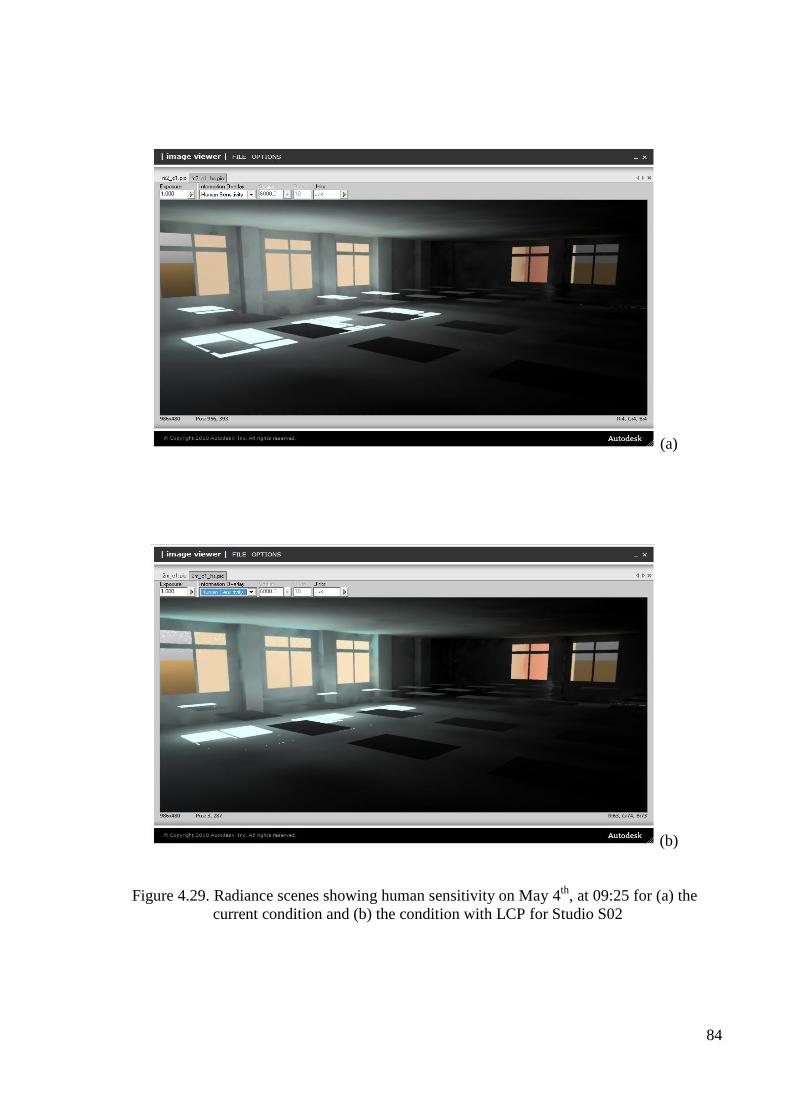
84
(a)
(b)
Figure 4.29. Radiance scenes showing human sensitivity on May 4th
, at 09:25 for (a) the
current condition and (b) the condition with LCP for Studio S02
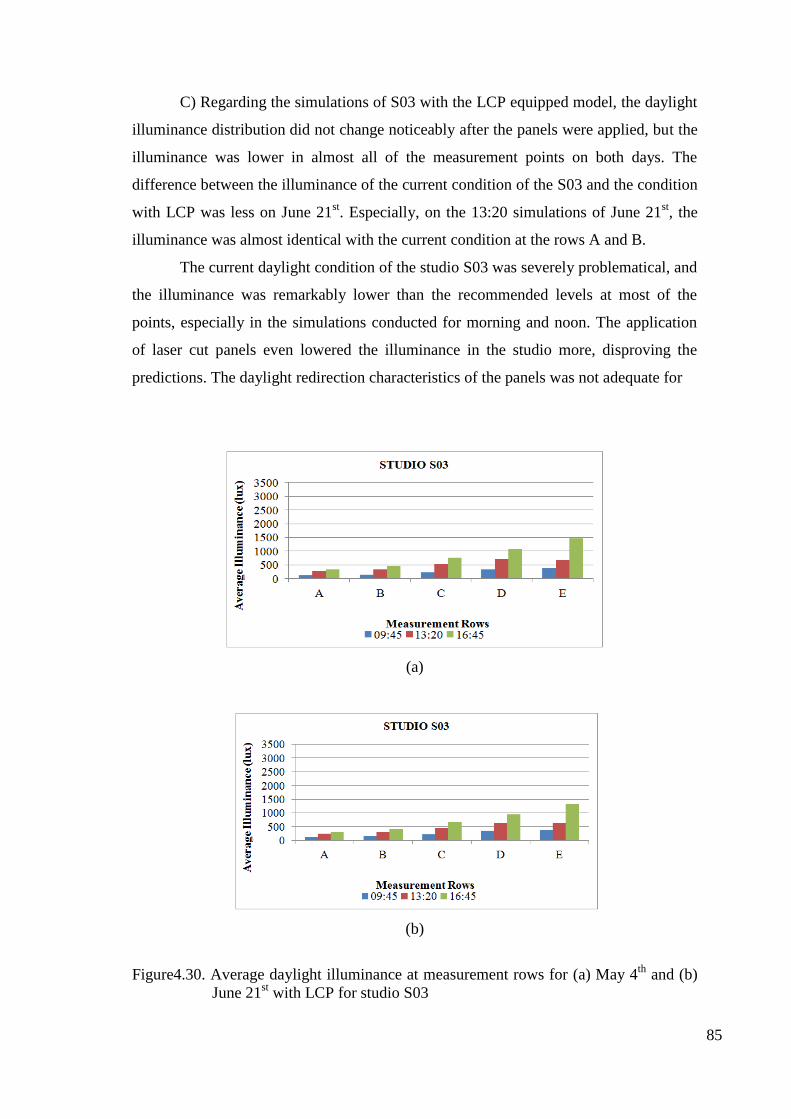
85
C) Regarding the simulations of S03 with the LCP equipped model, the daylight
illuminance distribution did not change noticeably after the panels were applied, but the
illuminance was lower in almost all of the measurement points on both days. The
difference between the illuminance of the current condition of the S03 and the condition
with LCP was less on June 21st. Especially, on the 13:20 simulations of June 21
st, the
illuminance was almost identical with the current condition at the rows A and B.
The current daylight condition of the studio S03 was severely problematical, and
the illuminance was remarkably lower than the recommended levels at most of the
points, especially in the simulations conducted for morning and noon. The application
of laser cut panels even lowered the illuminance in the studio more, disproving the
predictions. The daylight redirection characteristics of the panels was not adequate for
(a)
(b)
Figure4.30. Average daylight illuminance at measurement rows for (a) May 4th
and (b)
June 21st with LCP for studio S03
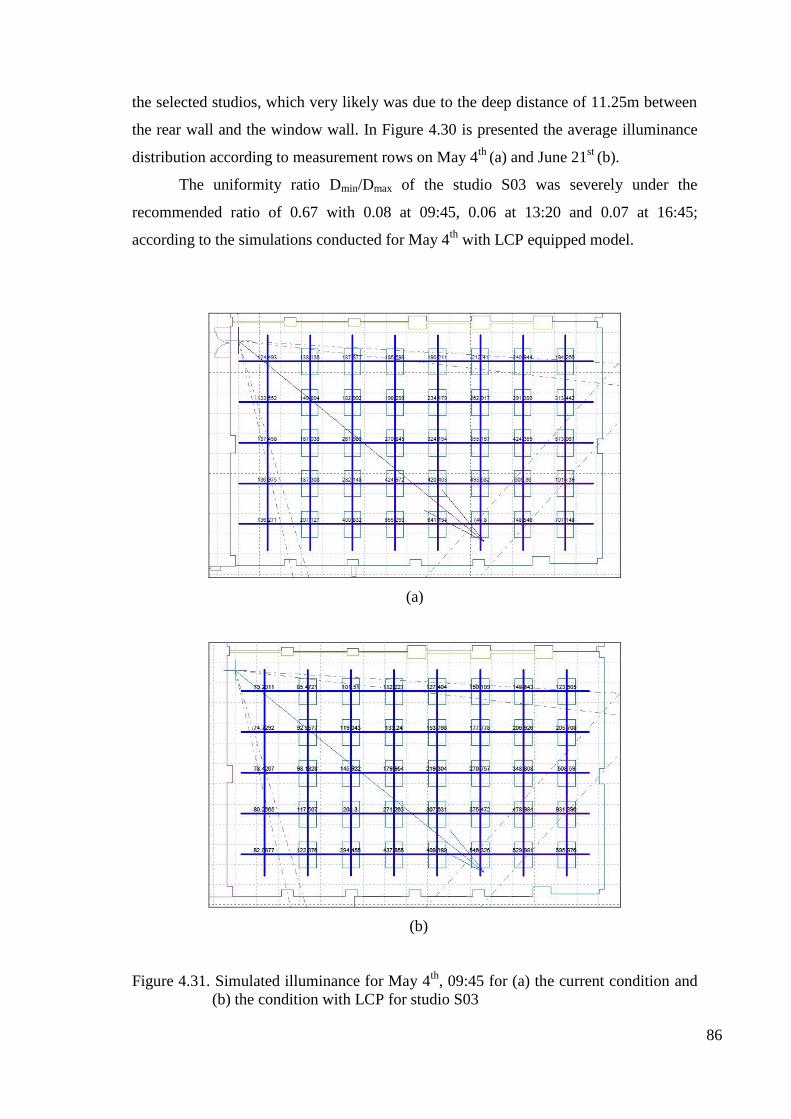
86
the selected studios, which very likely was due to the deep distance of 11.25m between
the rear wall and the window wall. In Figure 4.30 is presented the average illuminance
distribution according to measurement rows on May 4th
(a) and June 21st
(b).
The uniformity ratio Dmin/Dmax of the studio S03 was severely under the
recommended ratio of 0.67 with 0.08 at 09:45, 0.06 at 13:20 and 0.07 at 16:45;
according to the simulations conducted for May 4th
with LCP equipped model.
(a)
(b)
Figure 4.31. Simulated illuminance for May 4th
, 09:45 for (a) the current condition and
(b) the condition with LCP for studio S03
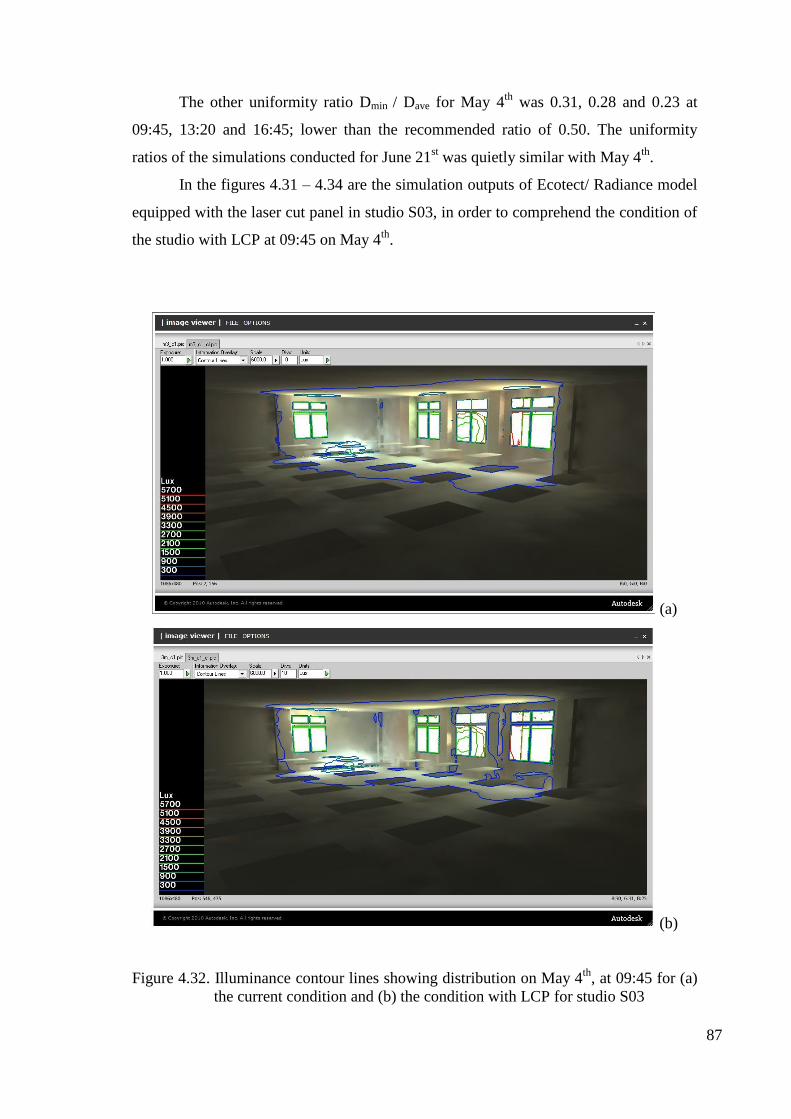
87
The other uniformity ratio Dmin / Dave for May 4th
was 0.31, 0.28 and 0.23 at
09:45, 13:20 and 16:45; lower than the recommended ratio of 0.50. The uniformity
ratios of the simulations conducted for June 21st was quietly similar with May 4
th.
In the figures 4.31 – 4.34 are the simulation outputs of Ecotect/ Radiance model
equipped with the laser cut panel in studio S03, in order to comprehend the condition of
the studio with LCP at 09:45 on May 4th
.
(a)
(b)
Figure 4.32. Illuminance contour lines showing distribution on May 4th
, at 09:45 for (a)
the current condition and (b) the condition with LCP for studio S03
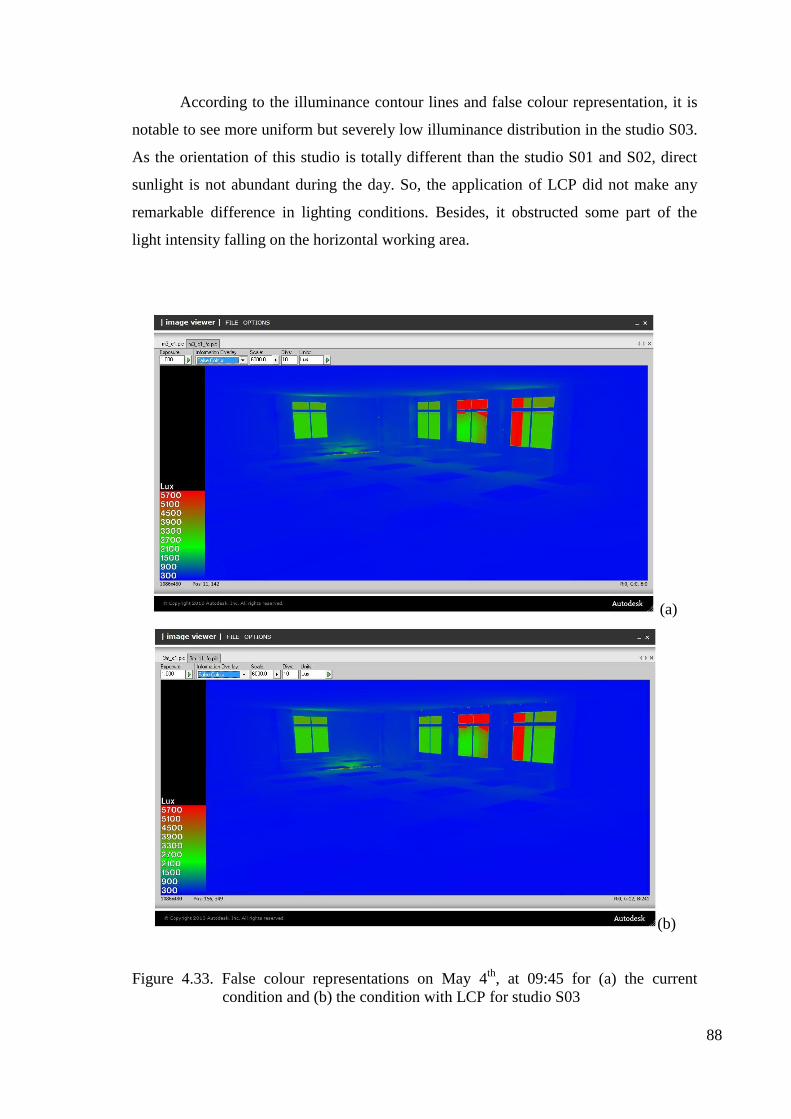
88
According to the illuminance contour lines and false colour representation, it is
notable to see more uniform but severely low illuminance distribution in the studio S03.
As the orientation of this studio is totally different than the studio S01 and S02, direct
sunlight is not abundant during the day. So, the application of LCP did not make any
remarkable difference in lighting conditions. Besides, it obstructed some part of the
light intensity falling on the horizontal working area.
(a)
(b)
Figure 4.33. False colour representations on May 4th
, at 09:45 for (a) the current
condition and (b) the condition with LCP for studio S03
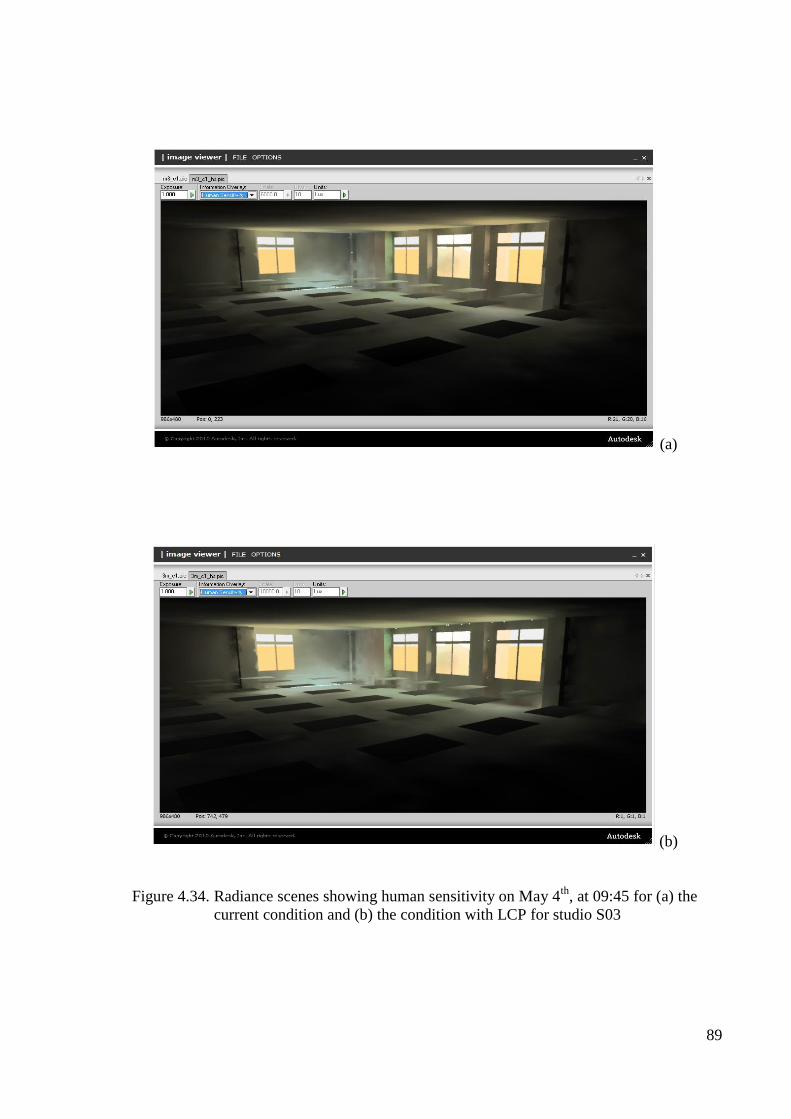
89
(a)
(b)
Figure 4.34. Radiance scenes showing human sensitivity on May 4th
, at 09:45 for (a) the
current condition and (b) the condition with LCP for studio S03
90
D) Regarding the studio S04, the daylight illuminance distribution of the
simulation results of the model with LCP was quietly similar with the current condition
at 10:05 and 13:45 on May 4th
; only the illuminance was lower. The distribution on June
21st was more uniform on the rows A and B, for the same simulations.
The distribution was similar with the current condition at the rest of the studio.
The illuminance at 10:05 and 13:45 at most of the measurement points were below 750
lux at the current condition on both simulated days. The laser cut panels even lowered
the overall illuminance in the studio. The simulations conducted for 17:00 showed that
the panels did not improve the uniformity much, the distribution was quietly similar
with the current condition, only the illuminance was lower in all of the measurement
points. Also, the previous sun patches were not observed at row E.
(a)
(b)
Figure 4.35. Average daylight illuminance at measurement rows for (a) May 4th
and (b)
June 21st with LCP for studio S04
91
In the Figure 4.35 is presented the average illuminance distribution according to
measurement rows on May 4th
(a) and June 21st (b).
The uniformity ratio Dmin/Dmax was 0.08 at 10:05 and 13:45 and 0.07 at 17:00
according to the simulation results of the model with LCP for May 4th
. Dmin/Dave ratio of
the same day was 0.26 at 10:05, 0.23 at 13:45 and 0.23 at 17:00. The uniformity ratios
for June 21st were almost identical to May 4
th.
(a)
(b)
Figure 4. 36. Simulated illuminance for May 4th
, 10:05 for (a) the current condition and
(b) the condition with LCP for studio S04
92
In the Figures 4.36 and 4.39 are presented the simulation outputs of Autodesk
Ecotect Analysis / Desktop Radiance in order to comprehend the distribution of daylight
in the studio.
(a)
(b)
Figure 4.37. Illuminance contour lines showing distribution on May 4th
, 10:05 for (a)
the current condition and (b) the condition with LCP for studio S04
93
(a)
(b)
Figure 4.38. False colour representations on May 4th
, at 10:05 for (a) the current
condition and (b) the condition with LCP for studio S04
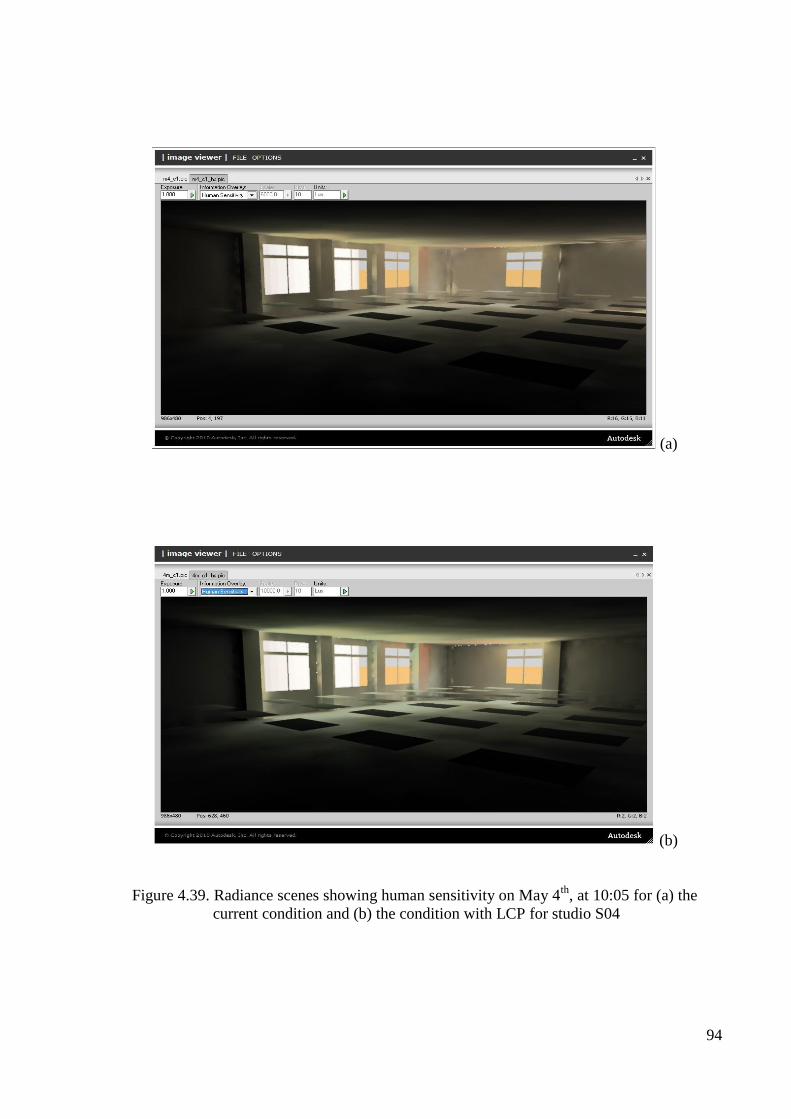
94
(a)
(b)
Figure 4.39. Radiance scenes showing human sensitivity on May 4th
, at 10:05 for (a) the
current condition and (b) the condition with LCP for studio S04
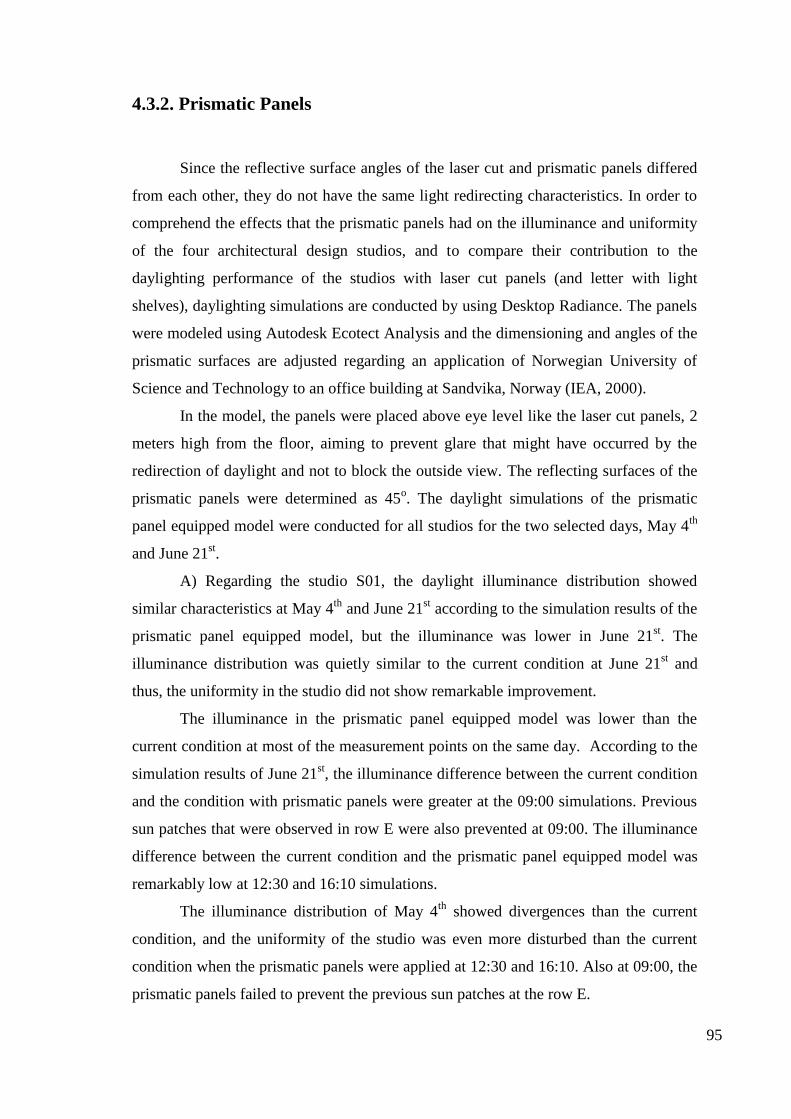
95
4.3.2. Prismatic Panels
Since the reflective surface angles of the laser cut and prismatic panels differed
from each other, they do not have the same light redirecting characteristics. In order to
comprehend the effects that the prismatic panels had on the illuminance and uniformity
of the four architectural design studios, and to compare their contribution to the
daylighting performance of the studios with laser cut panels (and letter with light
shelves), daylighting simulations are conducted by using Desktop Radiance. The panels
were modeled using Autodesk Ecotect Analysis and the dimensioning and angles of the
prismatic surfaces are adjusted regarding an application of Norwegian University of
Science and Technology to an office building at Sandvika, Norway (IEA, 2000).
In the model, the panels were placed above eye level like the laser cut panels, 2
meters high from the floor, aiming to prevent glare that might have occurred by the
redirection of daylight and not to block the outside view. The reflecting surfaces of the
prismatic panels were determined as 45o. The daylight simulations of the prismatic
panel equipped model were conducted for all studios for the two selected days, May 4th
and June 21st.
A) Regarding the studio S01, the daylight illuminance distribution showed
similar characteristics at May 4th
and June 21st according to the simulation results of the
prismatic panel equipped model, but the illuminance was lower in June 21st. The
illuminance distribution was quietly similar to the current condition at June 21st and
thus, the uniformity in the studio did not show remarkable improvement.
The illuminance in the prismatic panel equipped model was lower than the
current condition at most of the measurement points on the same day. According to the
simulation results of June 21st, the illuminance difference between the current condition
and the condition with prismatic panels were greater at the 09:00 simulations. Previous
sun patches that were observed in row E were also prevented at 09:00. The illuminance
difference between the current condition and the prismatic panel equipped model was
remarkably low at 12:30 and 16:10 simulations.
The illuminance distribution of May 4th
showed divergences than the current
condition, and the uniformity of the studio was even more disturbed than the current
condition when the prismatic panels were applied at 12:30 and 16:10. Also at 09:00, the
prismatic panels failed to prevent the previous sun patches at the row E.
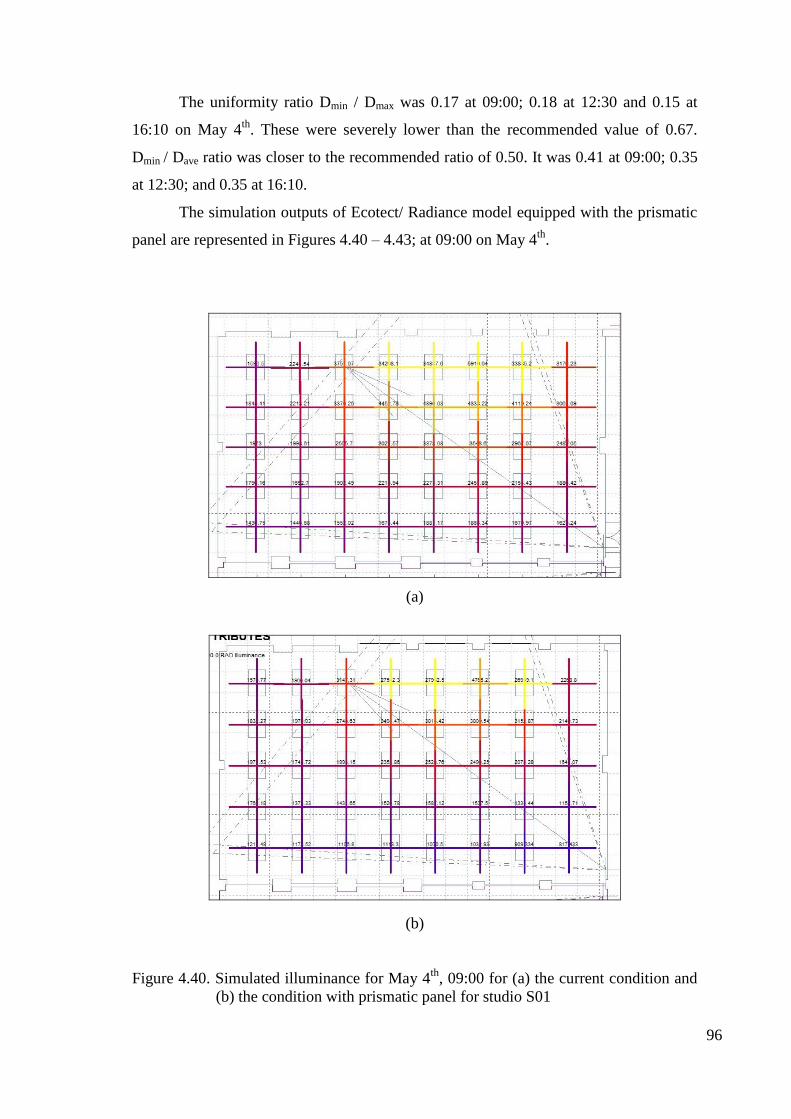
96
The uniformity ratio Dmin / Dmax was 0.17 at 09:00; 0.18 at 12:30 and 0.15 at
16:10 on May 4th
. These were severely lower than the recommended value of 0.67.
Dmin / Dave ratio was closer to the recommended ratio of 0.50. It was 0.41 at 09:00; 0.35
at 12:30; and 0.35 at 16:10.
The simulation outputs of Ecotect/ Radiance model equipped with the prismatic
panel are represented in Figures 4.40 – 4.43; at 09:00 on May 4th
.
(a)
(b)
Figure 4.40. Simulated illuminance for May 4th
, 09:00 for (a) the current condition and
(b) the condition with prismatic panel for studio S01
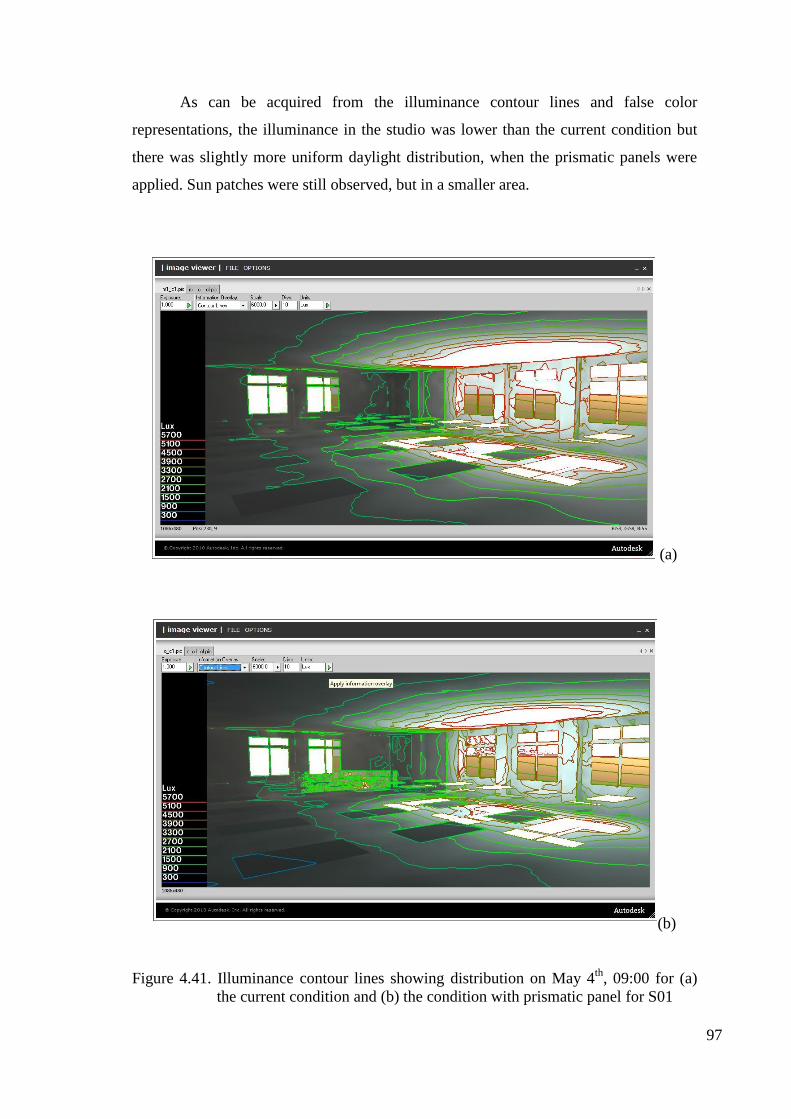
97
As can be acquired from the illuminance contour lines and false color
representations, the illuminance in the studio was lower than the current condition but
there was slightly more uniform daylight distribution, when the prismatic panels were
applied. Sun patches were still observed, but in a smaller area.
(a)
(b)
Figure 4.41. Illuminance contour lines showing distribution on May 4th
, 09:00 for (a)
the current condition and (b) the condition with prismatic panel for S01
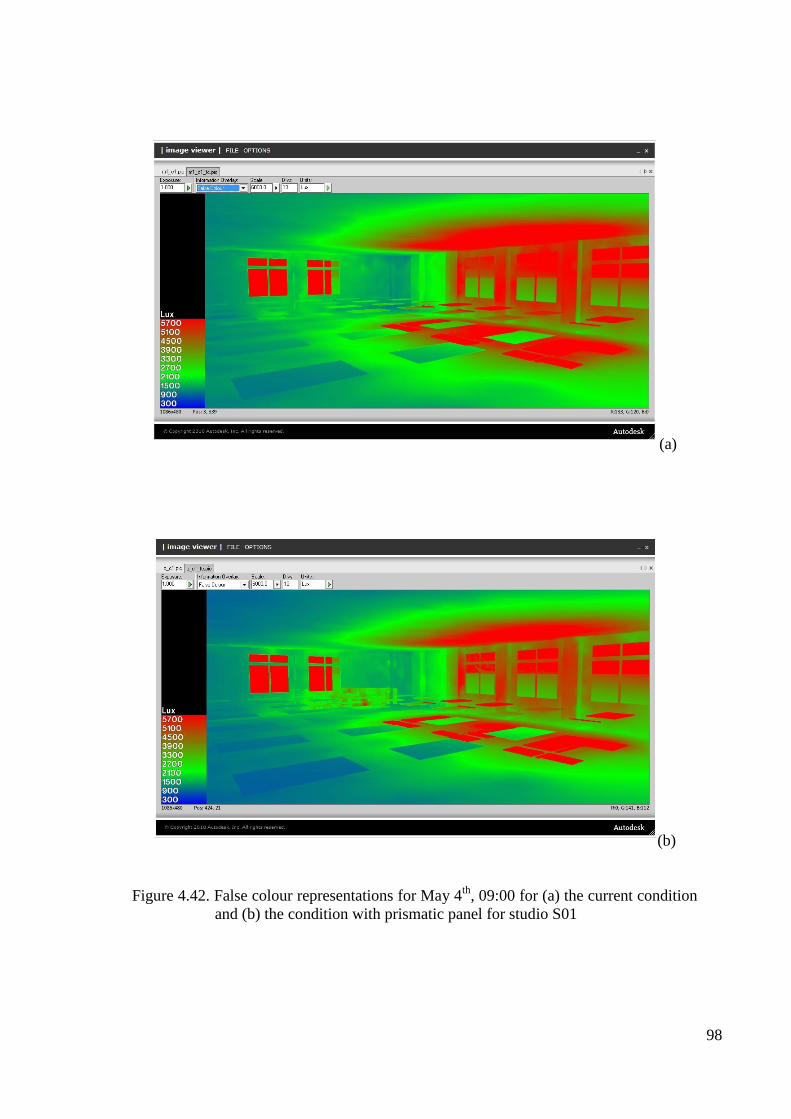
98
(a)
(b)
Figure 4.42. False colour representations for May 4th
, 09:00 for (a) the current condition
and (b) the condition with prismatic panel for studio S01
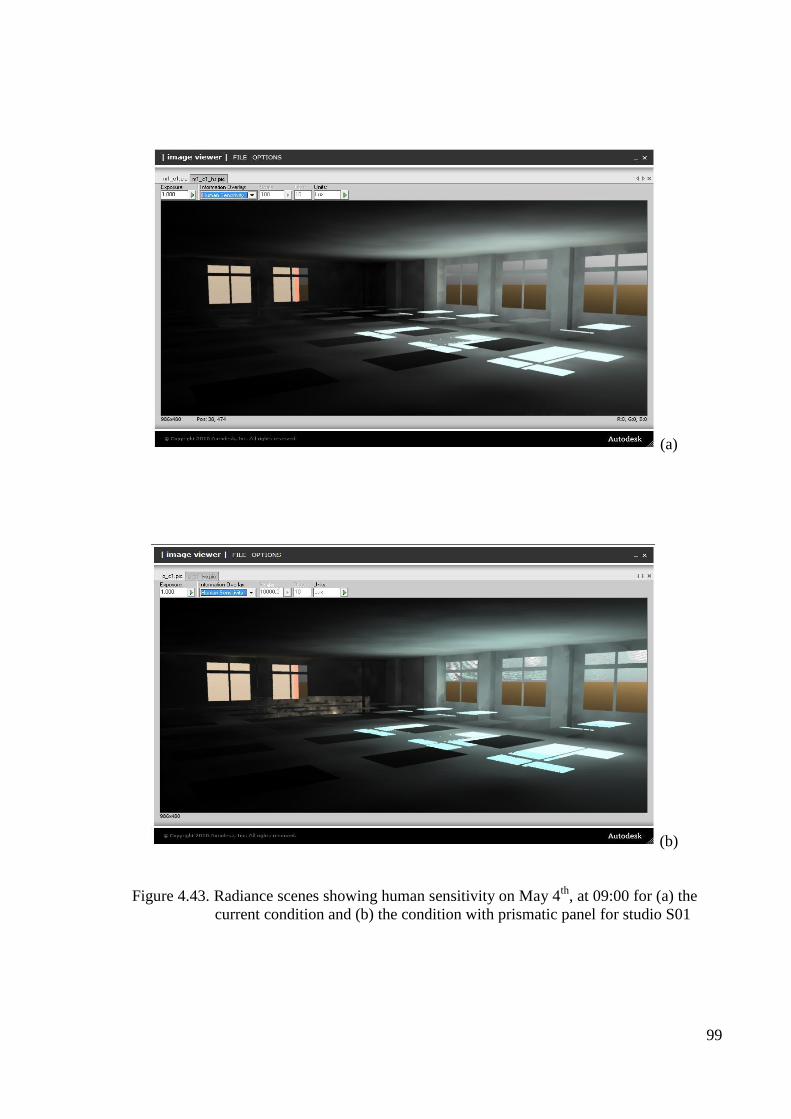
99
(a)
(b)
Figure 4.43. Radiance scenes showing human sensitivity on May 4th
, at 09:00 for (a) the
current condition and (b) the condition with prismatic panel for studio S01
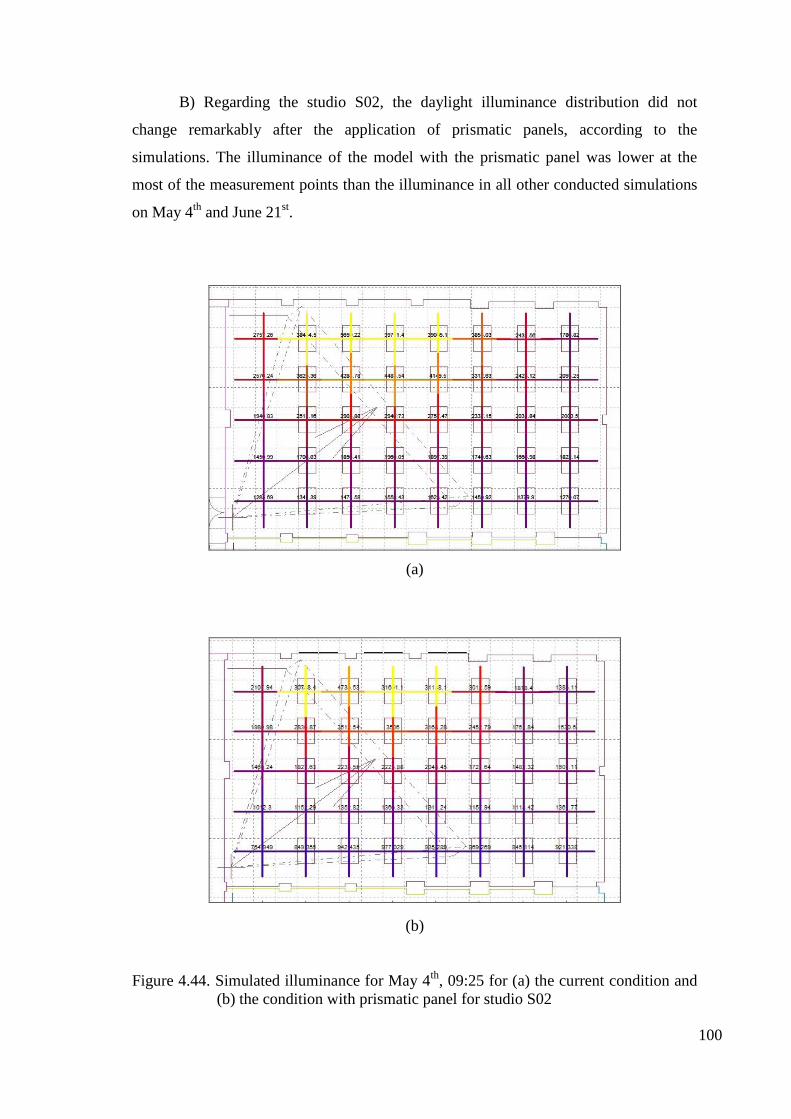
100
B) Regarding the studio S02, the daylight illuminance distribution did not
change remarkably after the application of prismatic panels, according to the
simulations. The illuminance of the model with the prismatic panel was lower at the
most of the measurement points than the illuminance in all other conducted simulations
on May 4th
and June 21st.
(a)
(b)
Figure 4.44. Simulated illuminance for May 4th
, 09:25 for (a) the current condition and
(b) the condition with prismatic panel for studio S02
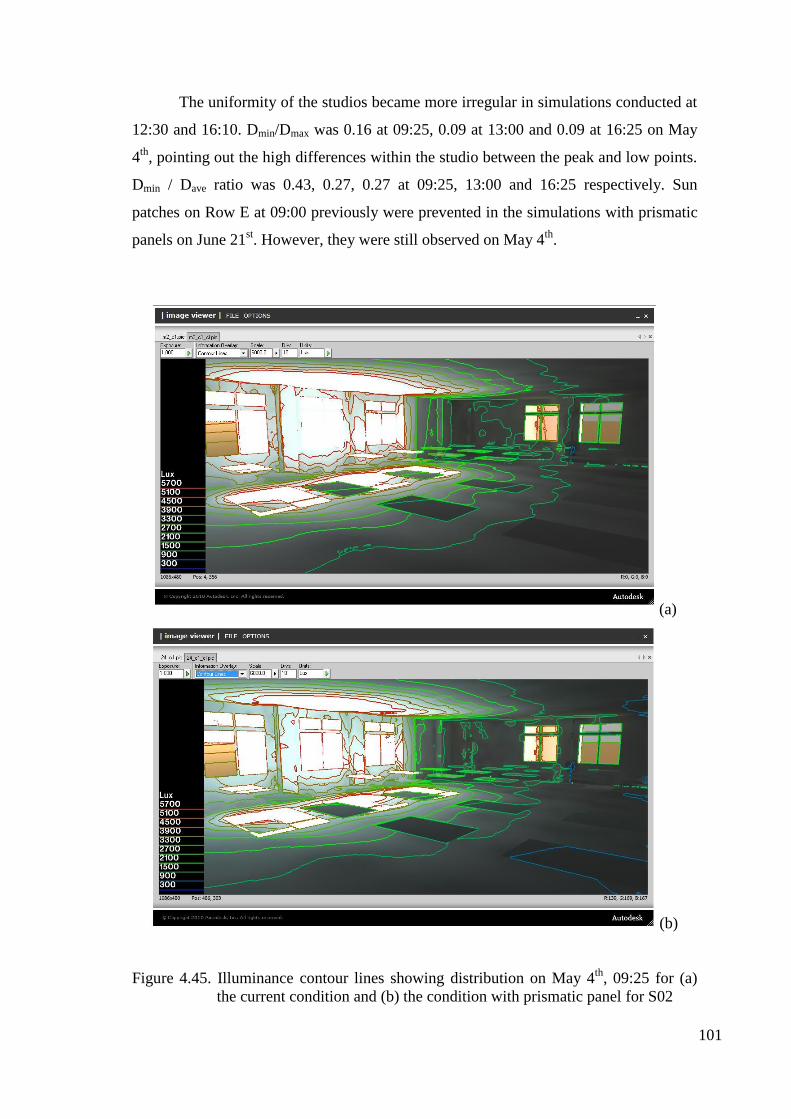
101
The uniformity of the studios became more irregular in simulations conducted at
12:30 and 16:10. Dmin/Dmax was 0.16 at 09:25, 0.09 at 13:00 and 0.09 at 16:25 on May
4th
, pointing out the high differences within the studio between the peak and low points.
Dmin / Dave ratio was 0.43, 0.27, 0.27 at 09:25, 13:00 and 16:25 respectively. Sun
patches on Row E at 09:00 previously were prevented in the simulations with prismatic
panels on June 21st. However, they were still observed on May 4
th.
(a)
(b)
Figure 4.45. Illuminance contour lines showing distribution on May 4th
, 09:25 for (a)
the current condition and (b) the condition with prismatic panel for S02
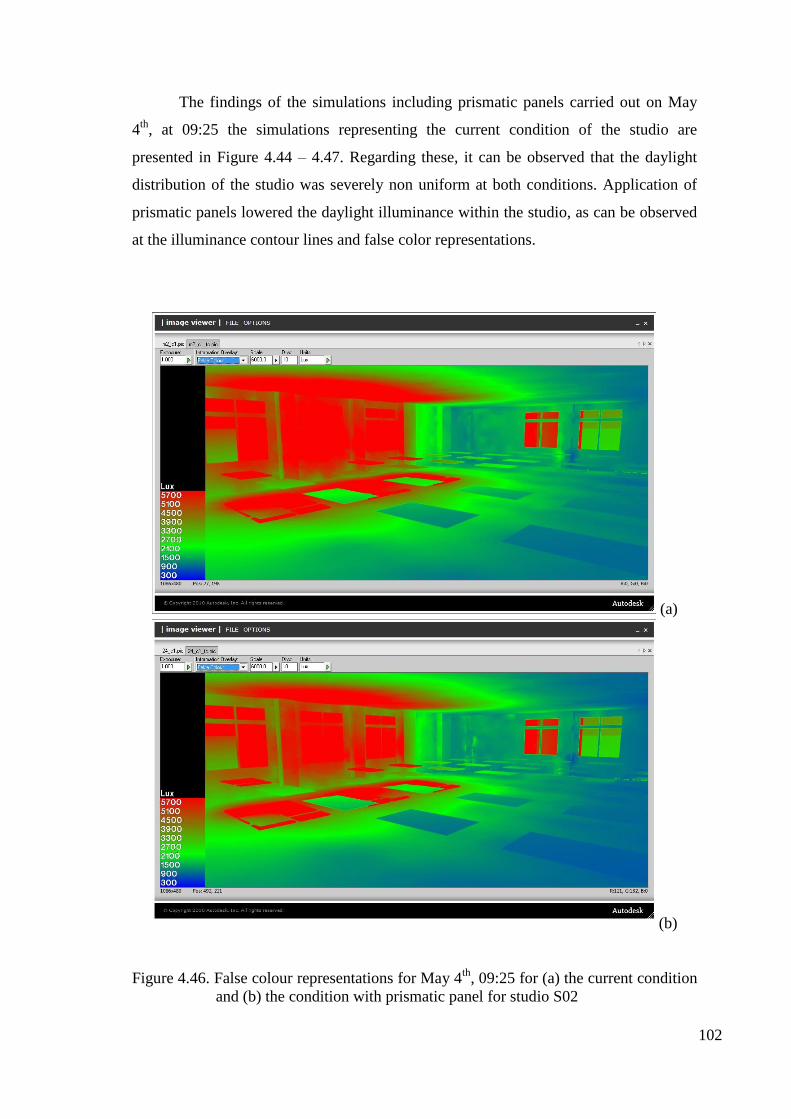
102
The findings of the simulations including prismatic panels carried out on May
4th
, at 09:25 the simulations representing the current condition of the studio are
presented in Figure 4.44 – 4.47. Regarding these, it can be observed that the daylight
distribution of the studio was severely non uniform at both conditions. Application of
prismatic panels lowered the daylight illuminance within the studio, as can be observed
at the illuminance contour lines and false color representations.
(a)
(b)
Figure 4.46. False colour representations for May 4th
, 09:25 for (a) the current condition
and (b) the condition with prismatic panel for studio S02
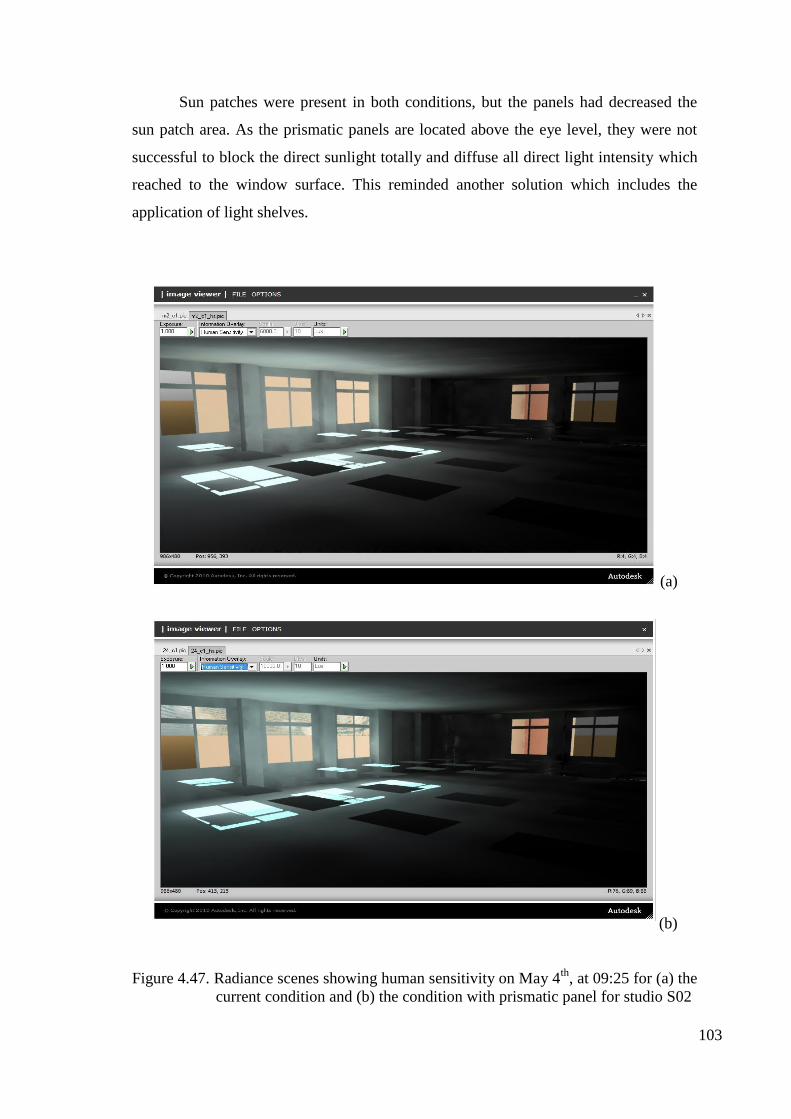
103
Sun patches were present in both conditions, but the panels had decreased the
sun patch area. As the prismatic panels are located above the eye level, they were not
successful to block the direct sunlight totally and diffuse all direct light intensity which
reached to the window surface. This reminded another solution which includes the
application of light shelves.
(a)
(b)
Figure 4.47. Radiance scenes showing human sensitivity on May 4th
, at 09:25 for (a) the
current condition and (b) the condition with prismatic panel for studio S02
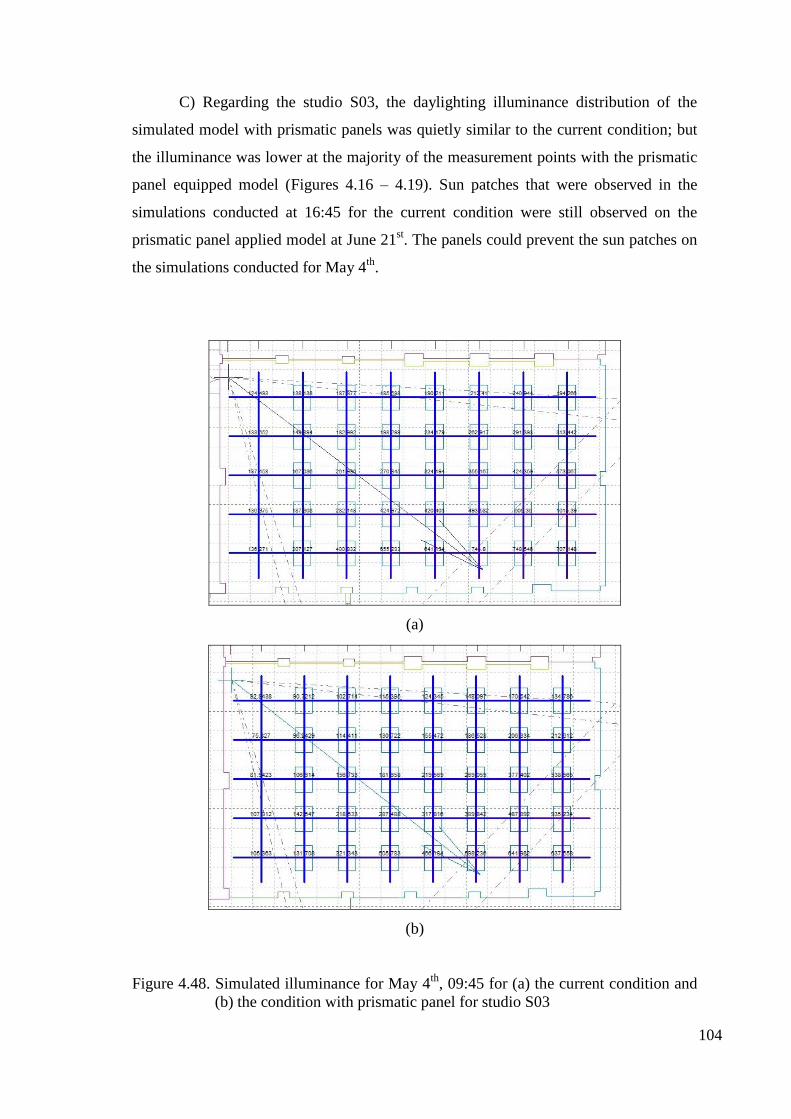
104
C) Regarding the studio S03, the daylighting illuminance distribution of the
simulated model with prismatic panels was quietly similar to the current condition; but
the illuminance was lower at the majority of the measurement points with the prismatic
panel equipped model (Figures 4.16 – 4.19). Sun patches that were observed in the
simulations conducted at 16:45 for the current condition were still observed on the
prismatic panel applied model at June 21st. The panels could prevent the sun patches on
the simulations conducted for May 4th
.
(a)
(b)
Figure 4.48. Simulated illuminance for May 4th
, 09:45 for (a) the current condition and
(b) the condition with prismatic panel for studio S03
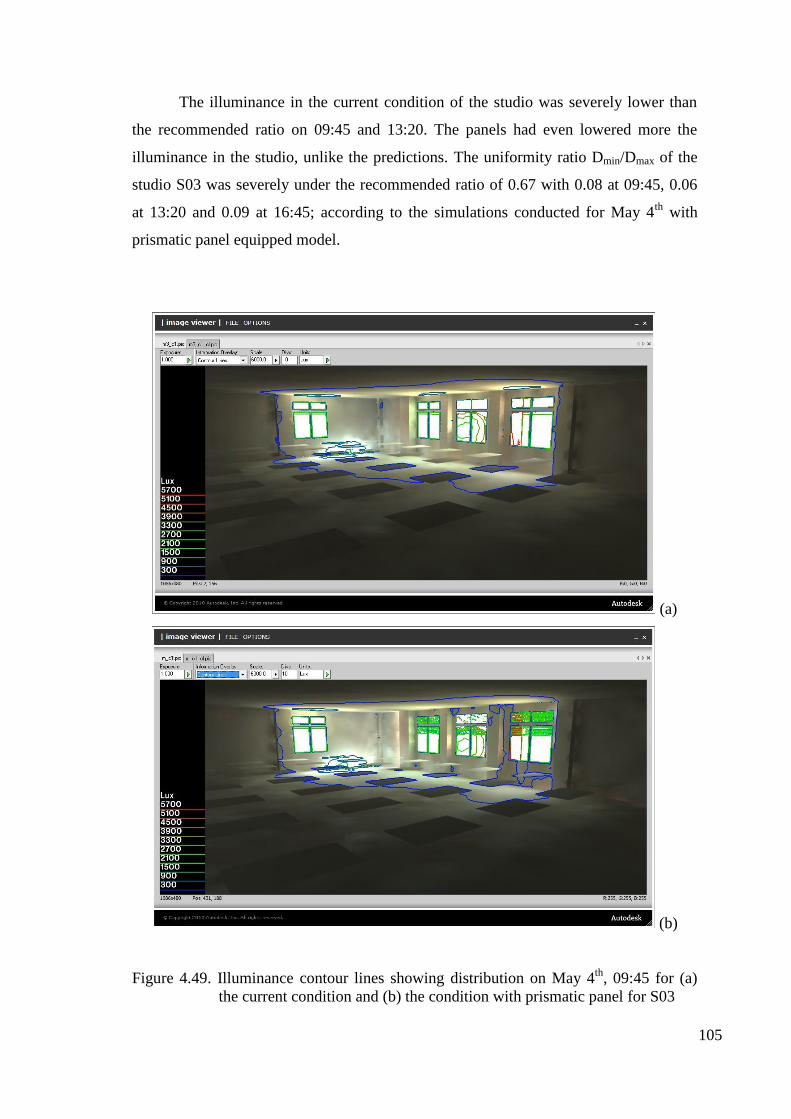
105
The illuminance in the current condition of the studio was severely lower than
the recommended ratio on 09:45 and 13:20. The panels had even lowered more the
illuminance in the studio, unlike the predictions. The uniformity ratio Dmin/Dmax of the
studio S03 was severely under the recommended ratio of 0.67 with 0.08 at 09:45, 0.06
at 13:20 and 0.09 at 16:45; according to the simulations conducted for May 4th
with
prismatic panel equipped model.
(a)
(b)
Figure 4.49. Illuminance contour lines showing distribution on May 4th
, 09:45 for (a)
the current condition and (b) the condition with prismatic panel for S03
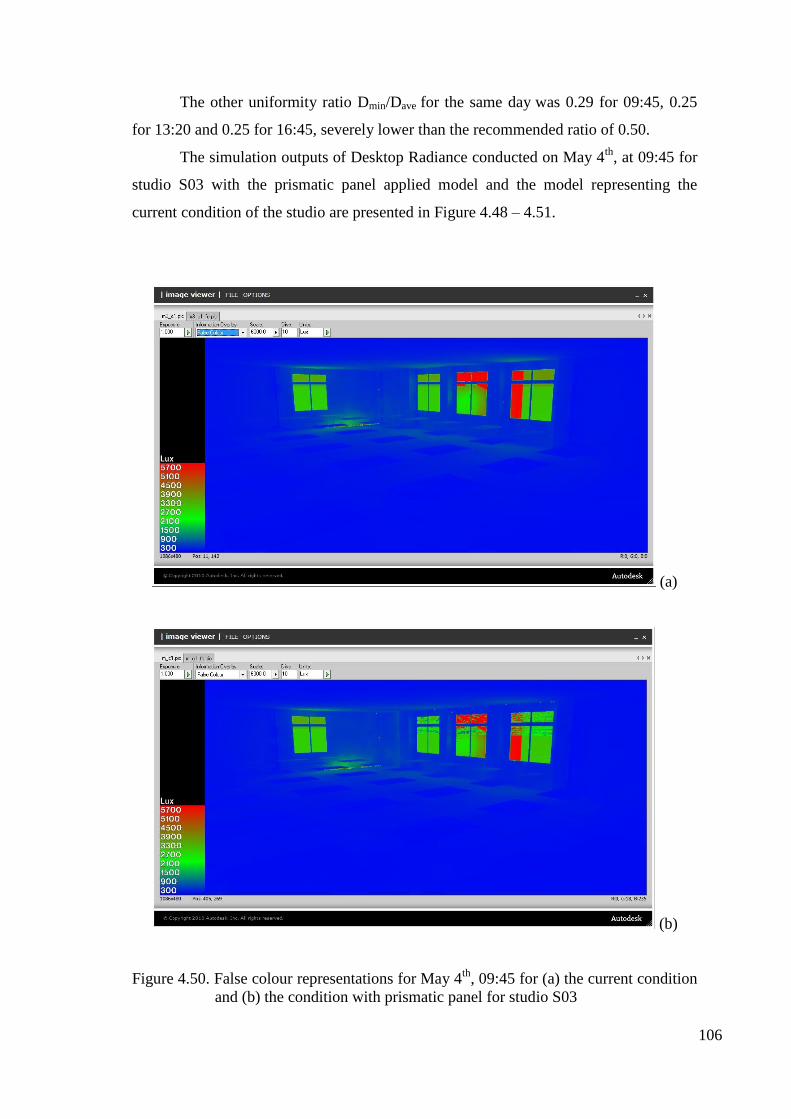
106
The other uniformity ratio Dmin/Dave for the same day was 0.29 for 09:45, 0.25
for 13:20 and 0.25 for 16:45, severely lower than the recommended ratio of 0.50.
The simulation outputs of Desktop Radiance conducted on May 4th
, at 09:45 for
studio S03 with the prismatic panel applied model and the model representing the
current condition of the studio are presented in Figure 4.48 – 4.51.
(a)
(b)
Figure 4.50. False colour representations for May 4th
, 09:45 for (a) the current condition
and (b) the condition with prismatic panel for studio S03
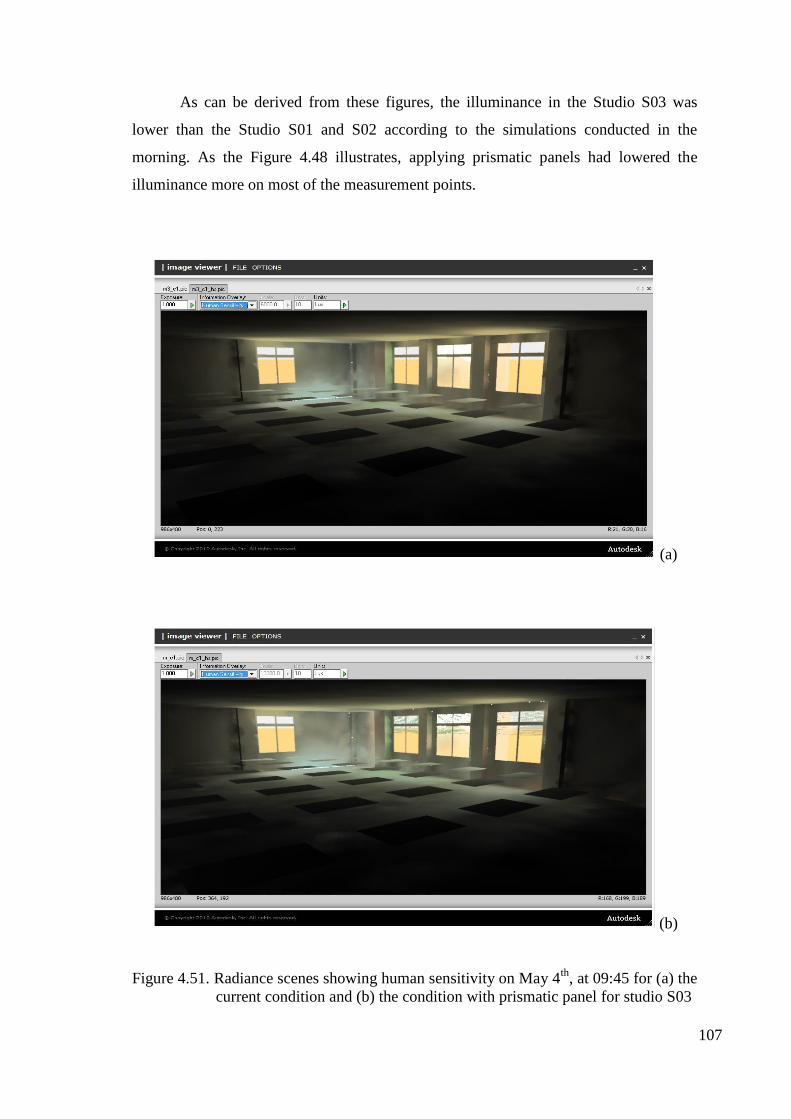
107
As can be derived from these figures, the illuminance in the Studio S03 was
lower than the Studio S01 and S02 according to the simulations conducted in the
morning. As the Figure 4.48 illustrates, applying prismatic panels had lowered the
illuminance more on most of the measurement points.
(a)
(b)
Figure 4.51. Radiance scenes showing human sensitivity on May 4th
, at 09:45 for (a) the
current condition and (b) the condition with prismatic panel for studio S03
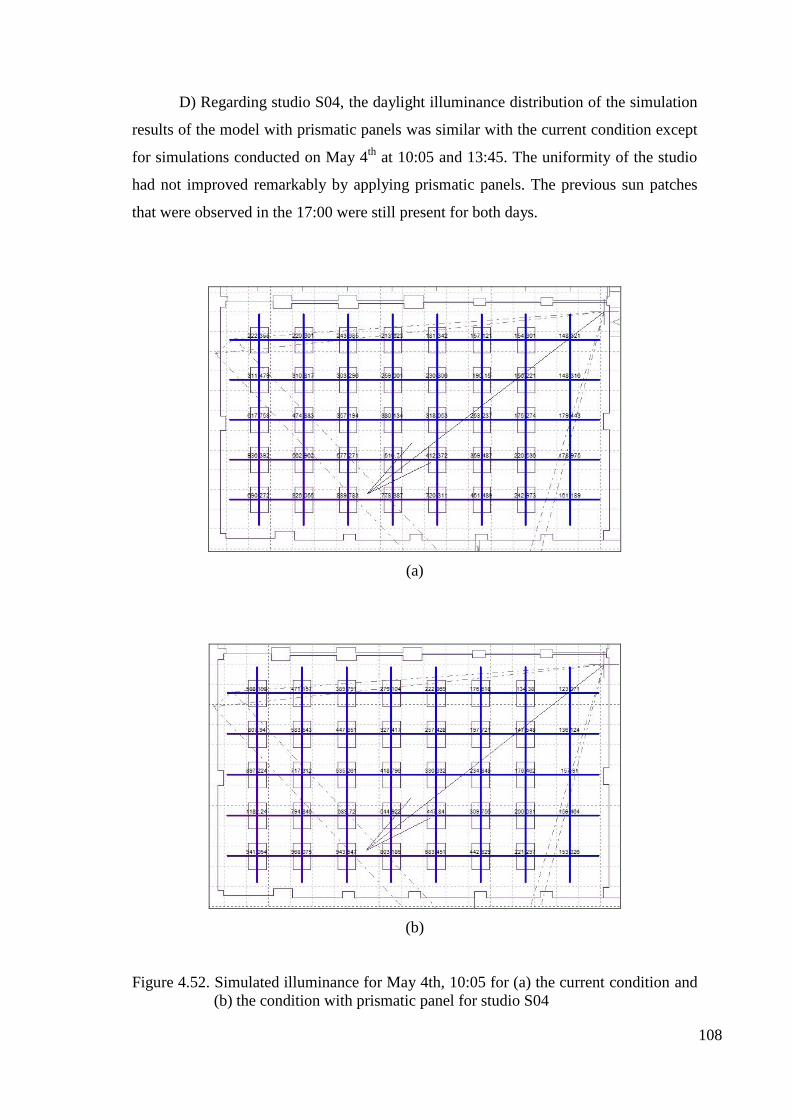
108
D) Regarding studio S04, the daylight illuminance distribution of the simulation
results of the model with prismatic panels was similar with the current condition except
for simulations conducted on May 4th
at 10:05 and 13:45. The uniformity of the studio
had not improved remarkably by applying prismatic panels. The previous sun patches
that were observed in the 17:00 were still present for both days.
(a)
(b)
Figure 4.52. Simulated illuminance for May 4th, 10:05 for (a) the current condition and
(b) the condition with prismatic panel for studio S04
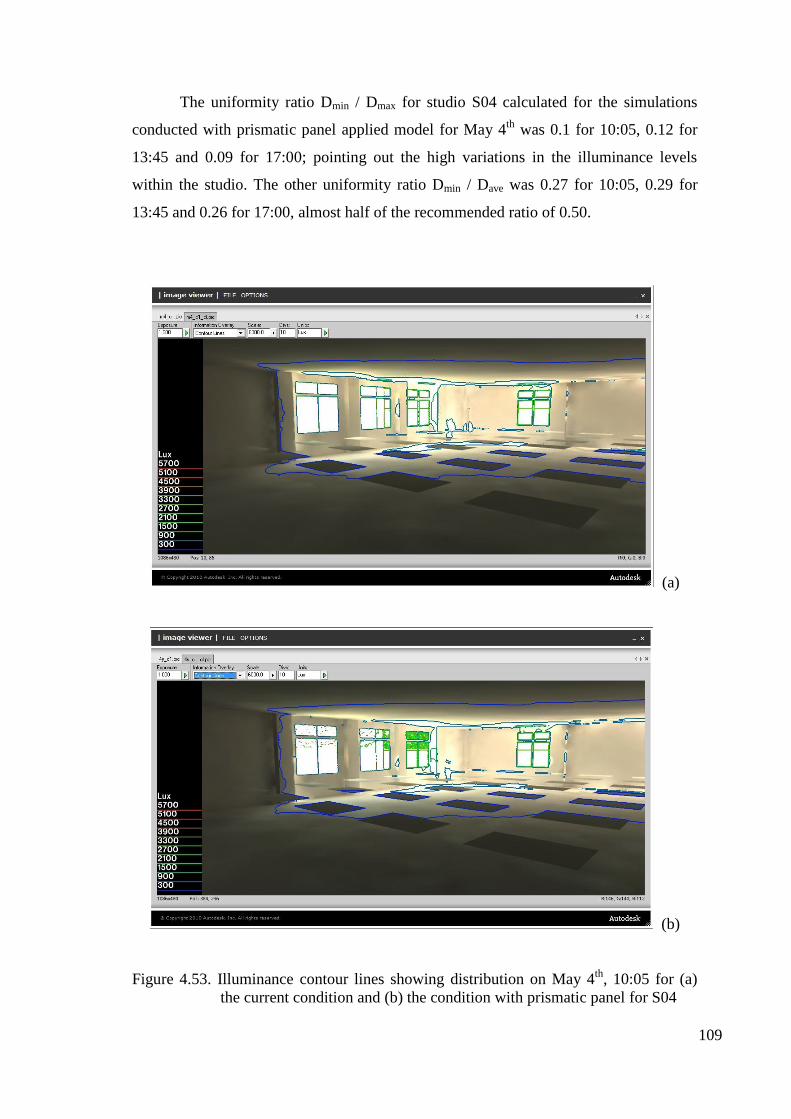
109
The uniformity ratio Dmin / Dmax for studio S04 calculated for the simulations
conducted with prismatic panel applied model for May 4th
was 0.1 for 10:05, 0.12 for
13:45 and 0.09 for 17:00; pointing out the high variations in the illuminance levels
within the studio. The other uniformity ratio Dmin / Dave was 0.27 for 10:05, 0.29 for
13:45 and 0.26 for 17:00, almost half of the recommended ratio of 0.50.
(a)
(b)
Figure 4.53. Illuminance contour lines showing distribution on May 4th
, 10:05 for (a)
the current condition and (b) the condition with prismatic panel for S04
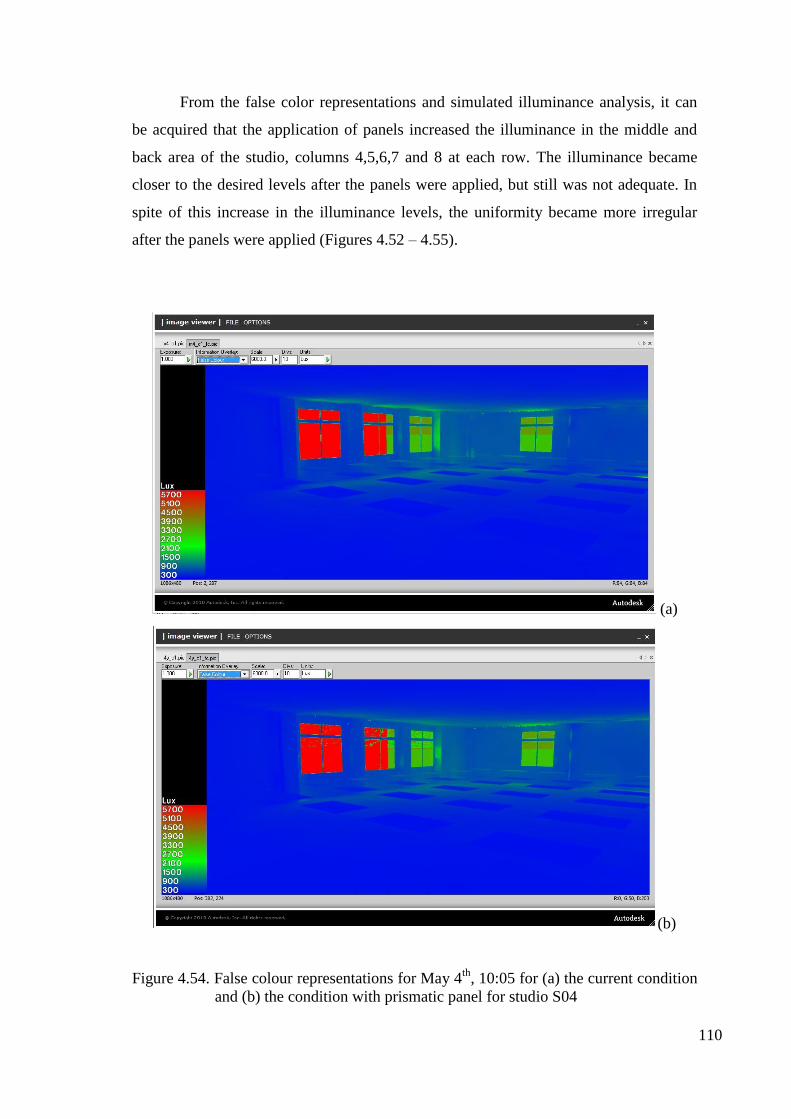
110
From the false color representations and simulated illuminance analysis, it can
be acquired that the application of panels increased the illuminance in the middle and
back area of the studio, columns 4,5,6,7 and 8 at each row. The illuminance became
closer to the desired levels after the panels were applied, but still was not adequate. In
spite of this increase in the illuminance levels, the uniformity became more irregular
after the panels were applied (Figures 4.52 – 4.55).
(a)
(b)
Figure 4.54. False colour representations for May 4th
, 10:05 for (a) the current condition
and (b) the condition with prismatic panel for studio S04
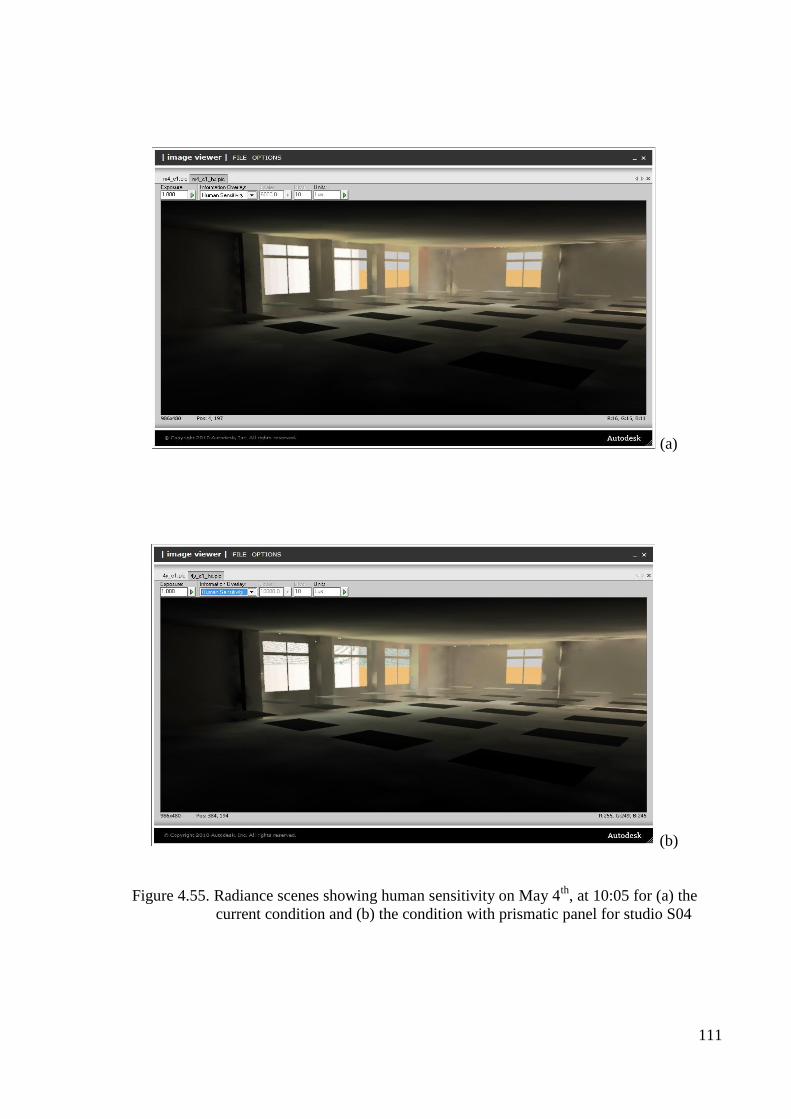
111
(a)
(b)
Figure 4.55. Radiance scenes showing human sensitivity on May 4th
, at 10:05 for (a) the
current condition and (b) the condition with prismatic panel for studio S04
112
4.3.3. Light Shelves
Since the light redirecting capabilities of the applied laser cut and prismatic
panels were not adequate for improving the illuminance and uniformity of the four
selected design studios, light shelves were selected to comprehend and compare how
much effect they would make to improve these conditions.
Since the distance between the window wall and the rear wall of the studios
were quite deep, which was 11.25m; it was considered that the reflective surfaces of the
panels were not wide enough to reflect the sunlight into an adequate distance inside.
Thus, light shelves were selected for daylight simulations, because of their wider
reflective surfaces.
The light shelves were modeled in Autodesk Ecotect Analysis and their
dimensioning was adjusted as 80cm wide, regarding an application of the Danish
Building Research Institute in Denmark (IEA, 2000). But unlike the “flight wing” shape
that was used in that application in Denmark, the shape of the light shelves was selected
as rectangular.
A) Regarding the studio S01, the distribution of daylight illuminance in the
studio was largely similar with the current condition except the simulations conducted
at12:30 on May 4th
; according to the simulation results of the light shelf equipped model
on May 4th
and June 21st.
The simulations conducted at 09:00 showed an improvement in uniformity at the
rows A and B, and the illuminance was also closer to 750 lux. The remaining area of the
studio showed almost the same illuminance distribution with lower illuminance levels.
Also, the previous sun patches that were observed on 09:00 in the current condition
were prevented totally by the application of light shelves for both days.
The simulation results conducted at 12:30 and 16:10 on June 21st were almost
identical to the current condition in terms of illuminance and uniformity. The reason
why light shelves had almost no effect on the daylighting condition of the studio might
be because of the application of the light shelves only on one façade of the studio,
which was the east wall with the largest glazing area.
The simulations conducted on May 4th
at 12:30 were, on the other hand, severely
irregular in terms of distribution and did not showed remarkable similarities with the
current condition which might be due to the variations in the sky condition on May 4th
.
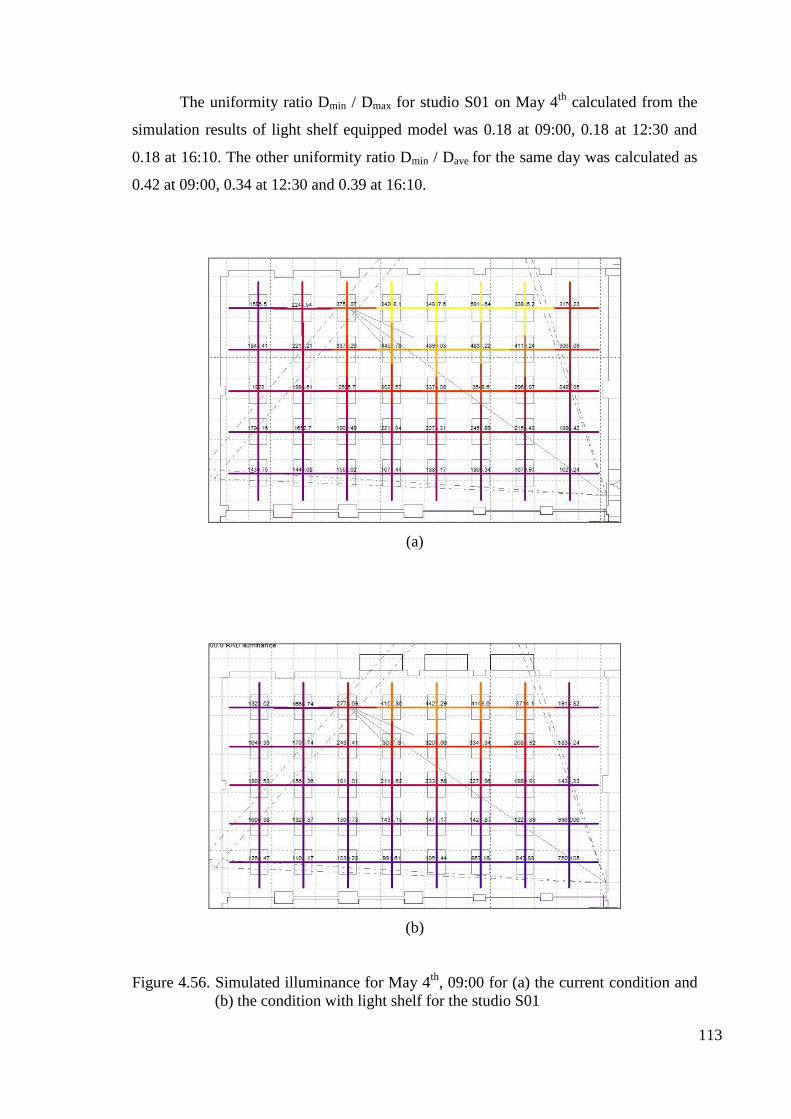
113
The uniformity ratio Dmin / Dmax for studio S01 on May 4th
calculated from the
simulation results of light shelf equipped model was 0.18 at 09:00, 0.18 at 12:30 and
0.18 at 16:10. The other uniformity ratio Dmin / Dave for the same day was calculated as
0.42 at 09:00, 0.34 at 12:30 and 0.39 at 16:10.
(a)
(b)
Figure 4.56. Simulated illuminance for May 4th
, 09:00 for (a) the current condition and
(b) the condition with light shelf for the studio S01
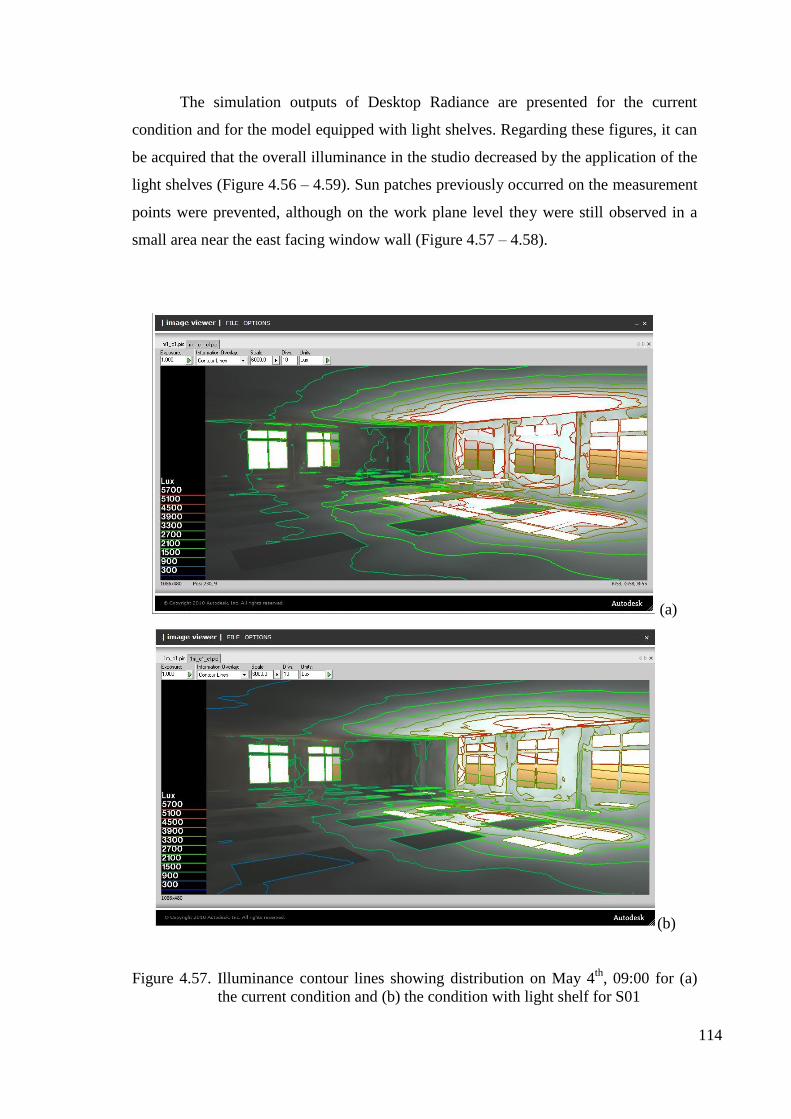
114
The simulation outputs of Desktop Radiance are presented for the current
condition and for the model equipped with light shelves. Regarding these figures, it can
be acquired that the overall illuminance in the studio decreased by the application of the
light shelves (Figure 4.56 – 4.59). Sun patches previously occurred on the measurement
points were prevented, although on the work plane level they were still observed in a
small area near the east facing window wall (Figure 4.57 – 4.58).
(a)
(b)
Figure 4.57. Illuminance contour lines showing distribution on May 4th
, 09:00 for (a)
the current condition and (b) the condition with light shelf for S01
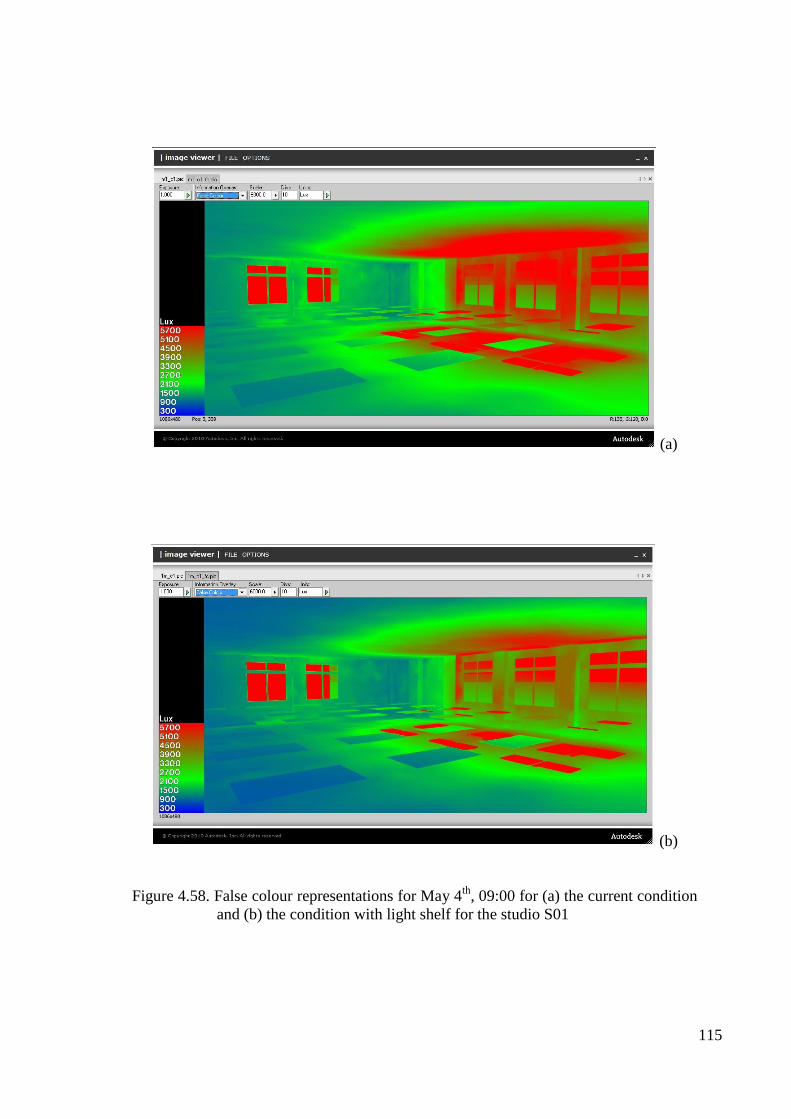
115
(a)
(b)
Figure 4.58. False colour representations for May 4th
, 09:00 for (a) the current condition
and (b) the condition with light shelf for the studio S01
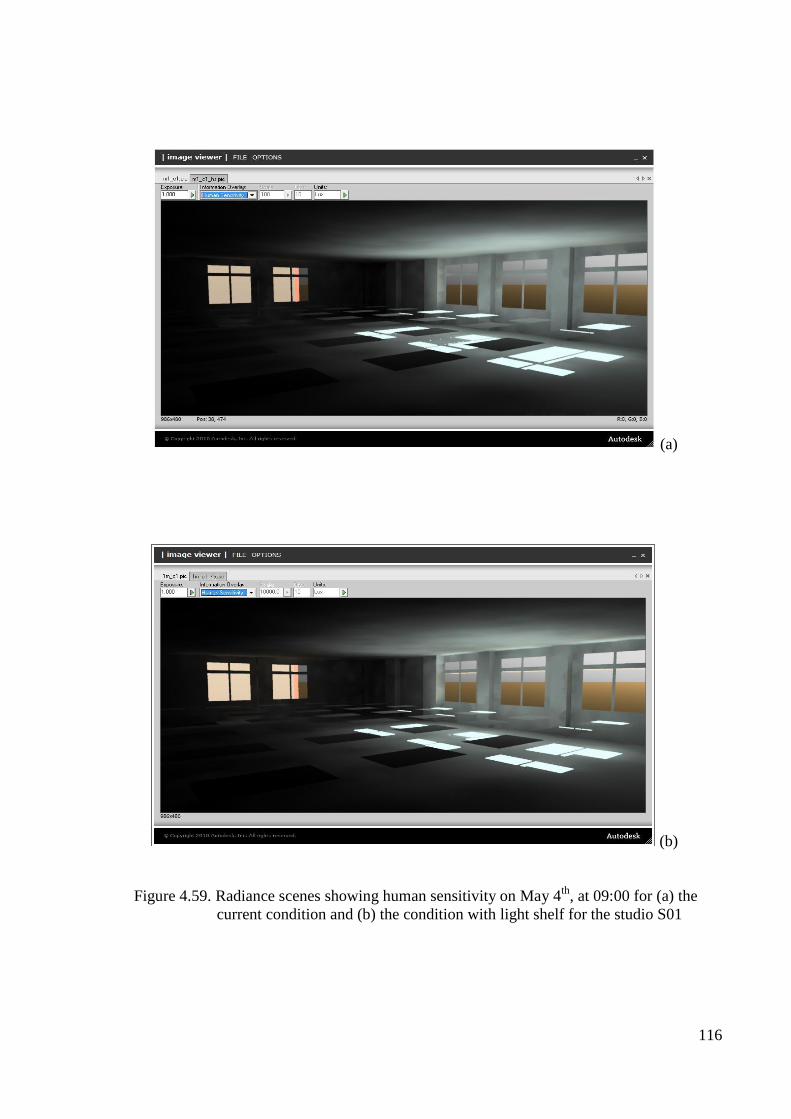
116
(a)
(b)
Figure 4.59. Radiance scenes showing human sensitivity on May 4th
, at 09:00 for (a) the
current condition and (b) the condition with light shelf for the studio S01
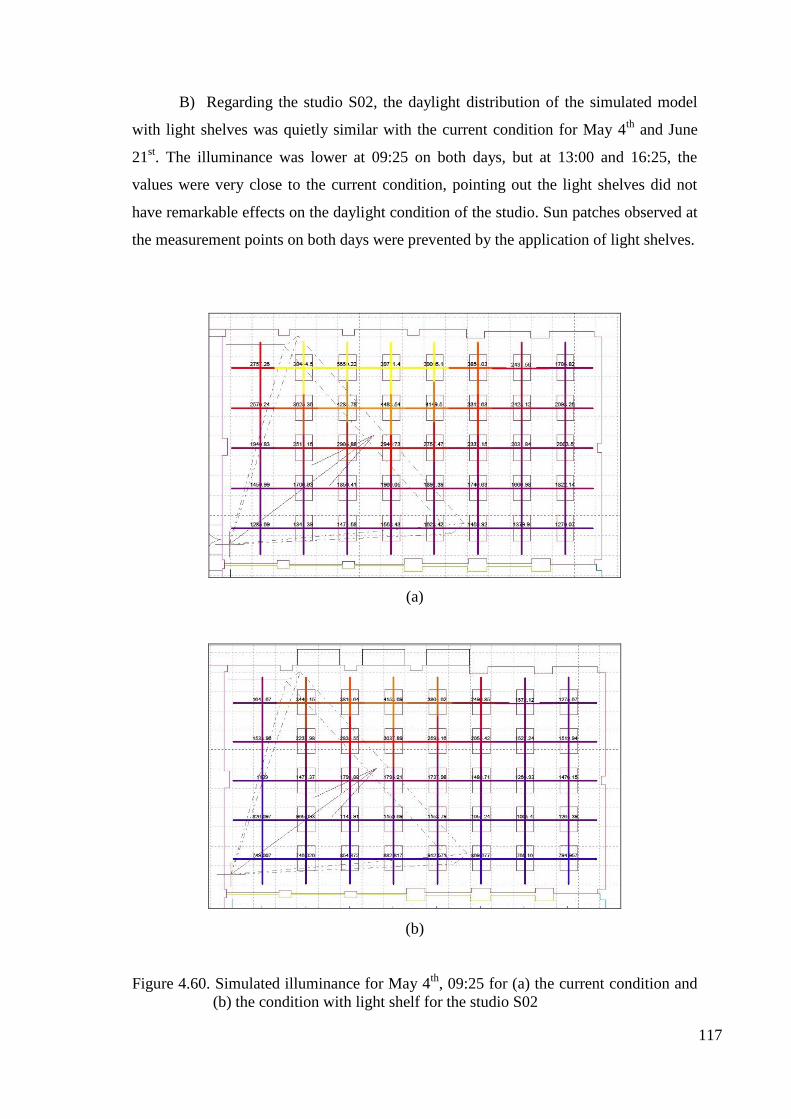
117
B) Regarding the studio S02, the daylight distribution of the simulated model
with light shelves was quietly similar with the current condition for May 4th
and June
21st. The illuminance was lower at 09:25 on both days, but at 13:00 and 16:25, the
values were very close to the current condition, pointing out the light shelves did not
have remarkable effects on the daylight condition of the studio. Sun patches observed at
the measurement points on both days were prevented by the application of light shelves.
(a)
(b)
Figure 4.60. Simulated illuminance for May 4th
, 09:25 for (a) the current condition and
(b) the condition with light shelf for the studio S02
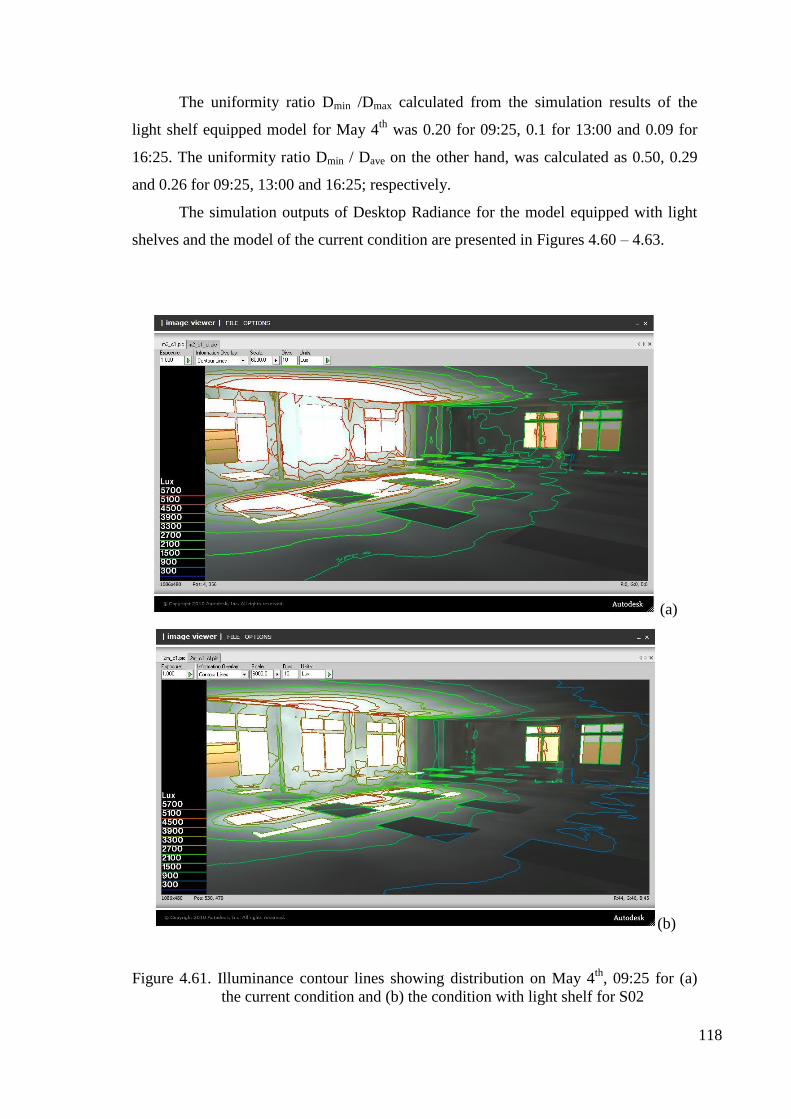
118
The uniformity ratio Dmin /Dmax calculated from the simulation results of the
light shelf equipped model for May 4th
was 0.20 for 09:25, 0.1 for 13:00 and 0.09 for
16:25. The uniformity ratio Dmin / Dave on the other hand, was calculated as 0.50, 0.29
and 0.26 for 09:25, 13:00 and 16:25; respectively.
The simulation outputs of Desktop Radiance for the model equipped with light
shelves and the model of the current condition are presented in Figures 4.60 – 4.63.
(a)
(b)
Figure 4.61. Illuminance contour lines showing distribution on May 4th
, 09:25 for (a)
the current condition and (b) the condition with light shelf for S02
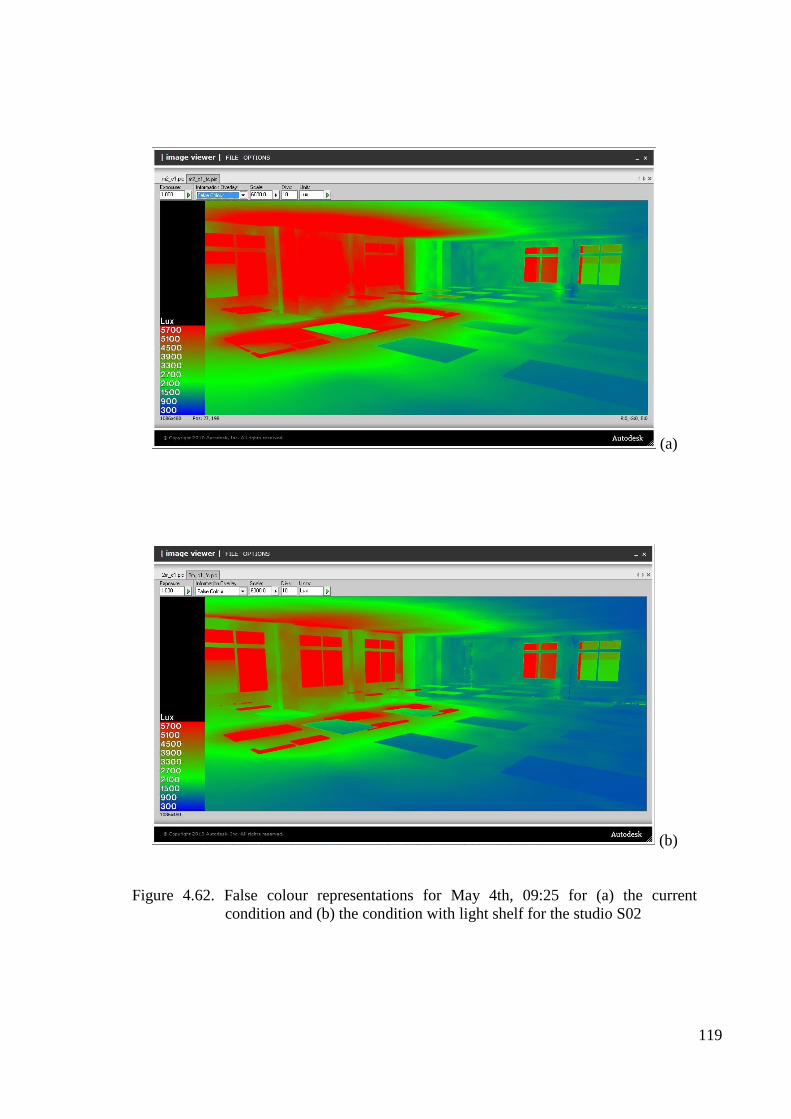
119
(a)
(b)
Figure 4.62. False colour representations for May 4th, 09:25 for (a) the current
condition and (b) the condition with light shelf for the studio S02
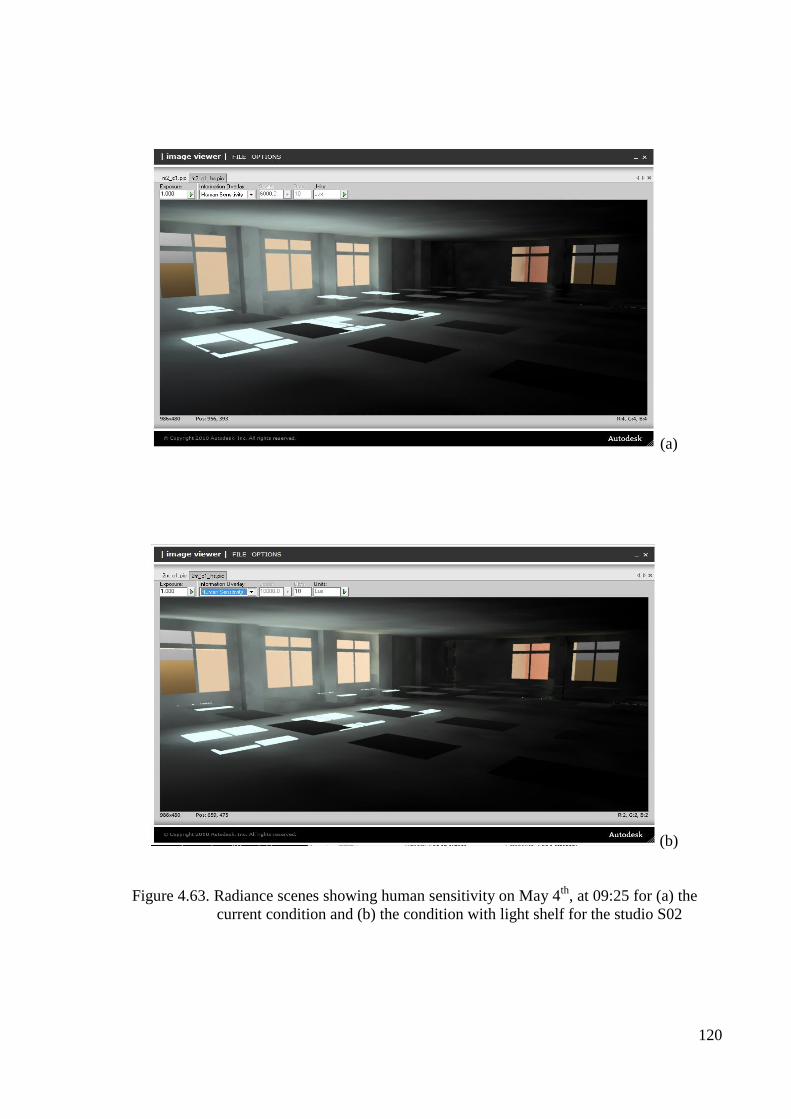
120
(a)
(b)
Figure 4.63. Radiance scenes showing human sensitivity on May 4th
, at 09:25 for (a) the
current condition and (b) the condition with light shelf for the studio S02
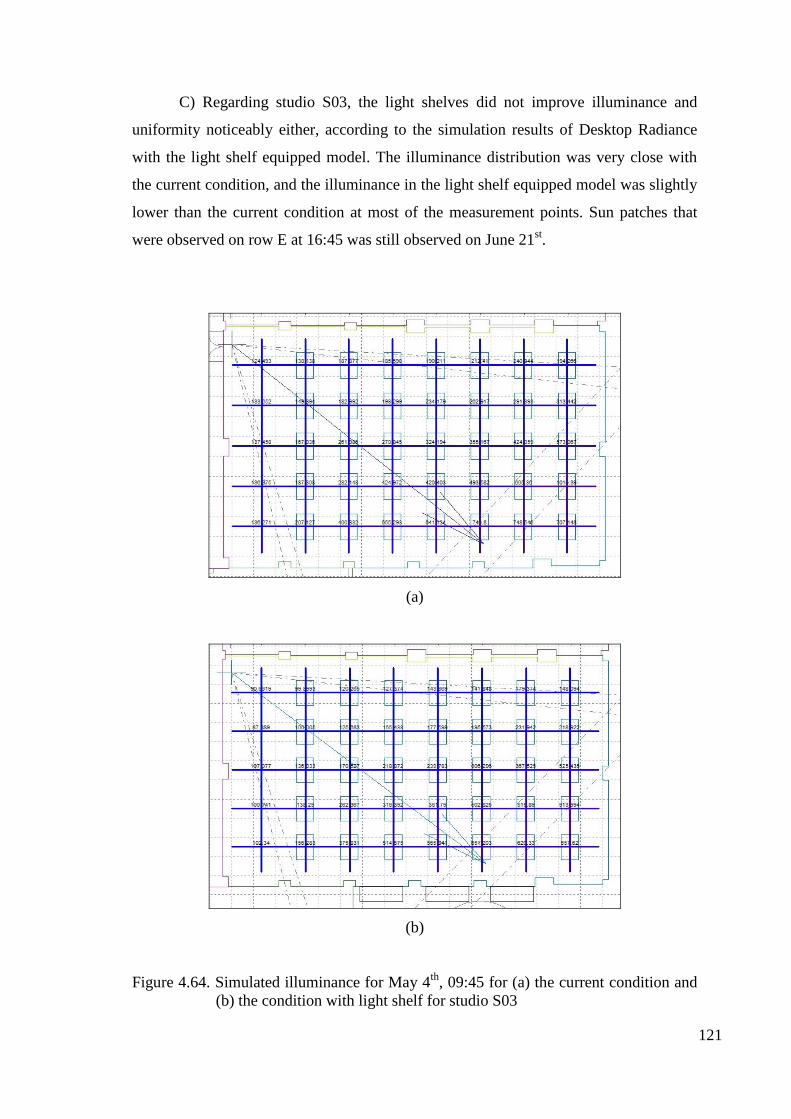
121
C) Regarding studio S03, the light shelves did not improve illuminance and
uniformity noticeably either, according to the simulation results of Desktop Radiance
with the light shelf equipped model. The illuminance distribution was very close with
the current condition, and the illuminance in the light shelf equipped model was slightly
lower than the current condition at most of the measurement points. Sun patches that
were observed on row E at 16:45 was still observed on June 21st.
(a)
(b)
Figure 4.64. Simulated illuminance for May 4th
, 09:45 for (a) the current condition and
(b) the condition with light shelf for studio S03
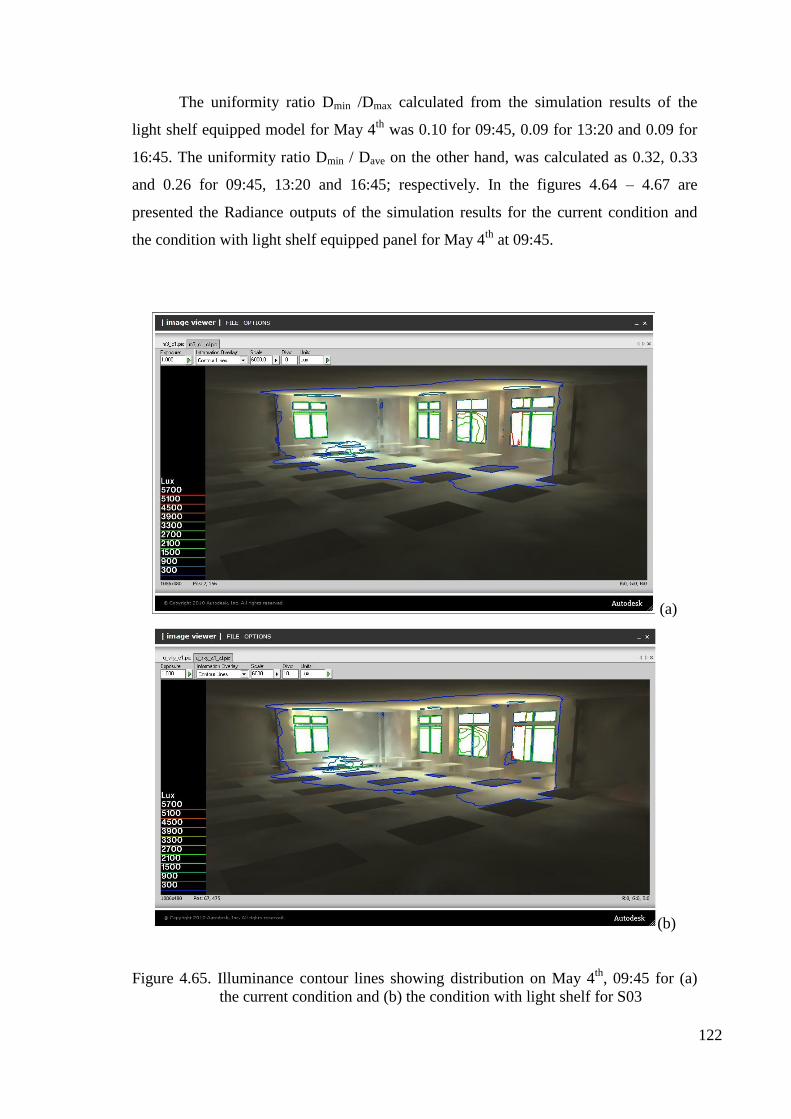
122
The uniformity ratio Dmin /Dmax calculated from the simulation results of the
light shelf equipped model for May 4th
was 0.10 for 09:45, 0.09 for 13:20 and 0.09 for
16:45. The uniformity ratio Dmin / Dave on the other hand, was calculated as 0.32, 0.33
and 0.26 for 09:45, 13:20 and 16:45; respectively. In the figures 4.64 – 4.67 are
presented the Radiance outputs of the simulation results for the current condition and
the condition with light shelf equipped panel for May 4th
at 09:45.
(a)
(b)
Figure 4.65. Illuminance contour lines showing distribution on May 4th
, 09:45 for (a)
the current condition and (b) the condition with light shelf for S03
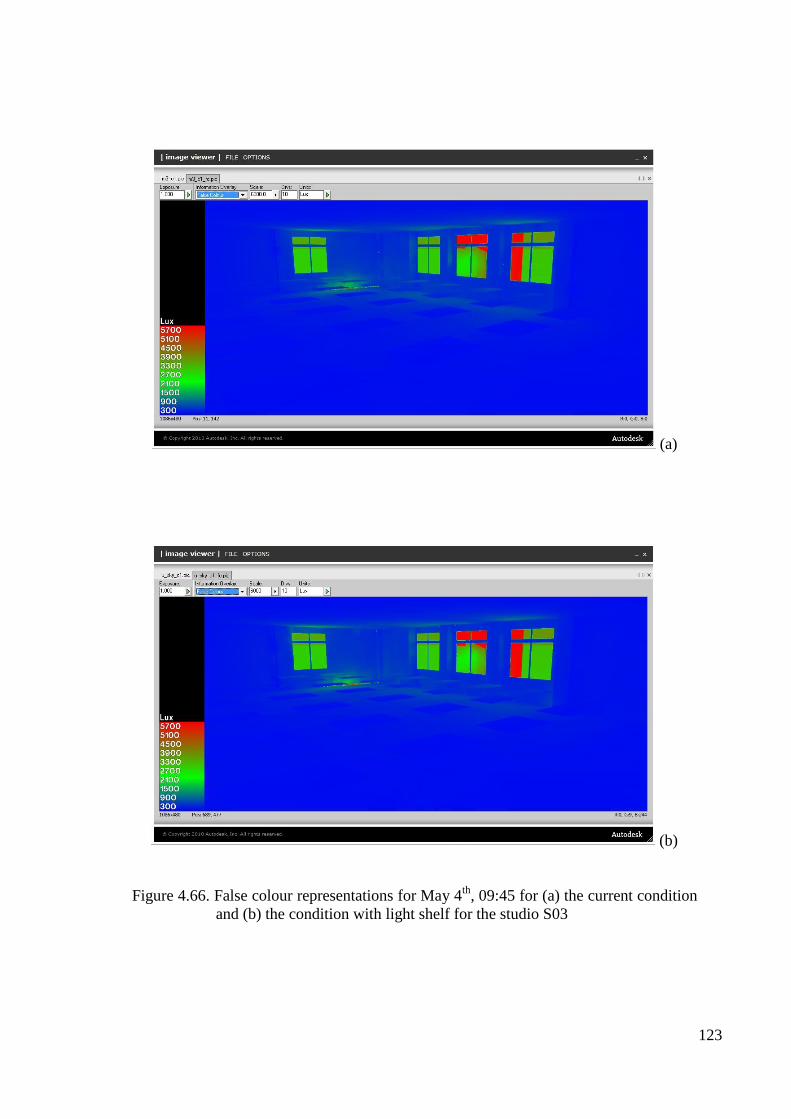
123
(a)
(b)
Figure 4.66. False colour representations for May 4th
, 09:45 for (a) the current condition
and (b) the condition with light shelf for the studio S03
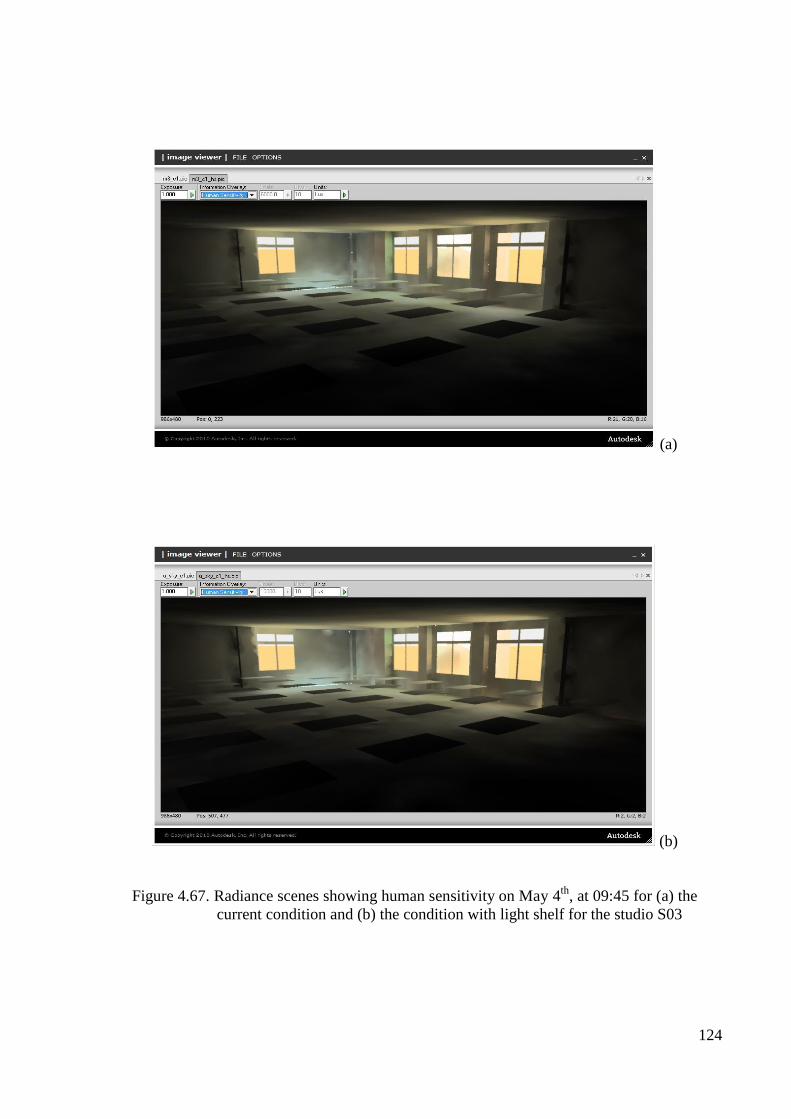
124
(a)
(b)
Figure 4.67. Radiance scenes showing human sensitivity on May 4th
, at 09:45 for (a) the
current condition and (b) the condition with light shelf for the studio S03
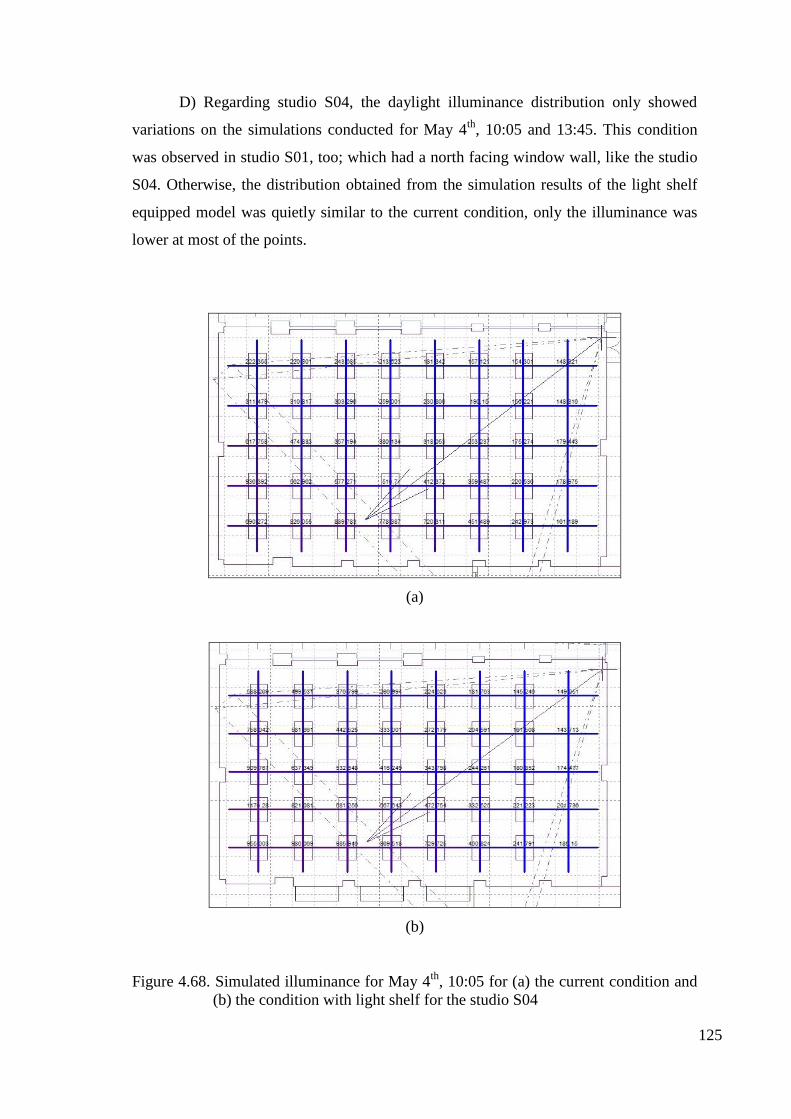
125
D) Regarding studio S04, the daylight illuminance distribution only showed
variations on the simulations conducted for May 4th
, 10:05 and 13:45. This condition
was observed in studio S01, too; which had a north facing window wall, like the studio
S04. Otherwise, the distribution obtained from the simulation results of the light shelf
equipped model was quietly similar to the current condition, only the illuminance was
lower at most of the points.
(a)
(b)
Figure 4.68. Simulated illuminance for May 4th
, 10:05 for (a) the current condition and
(b) the condition with light shelf for the studio S04
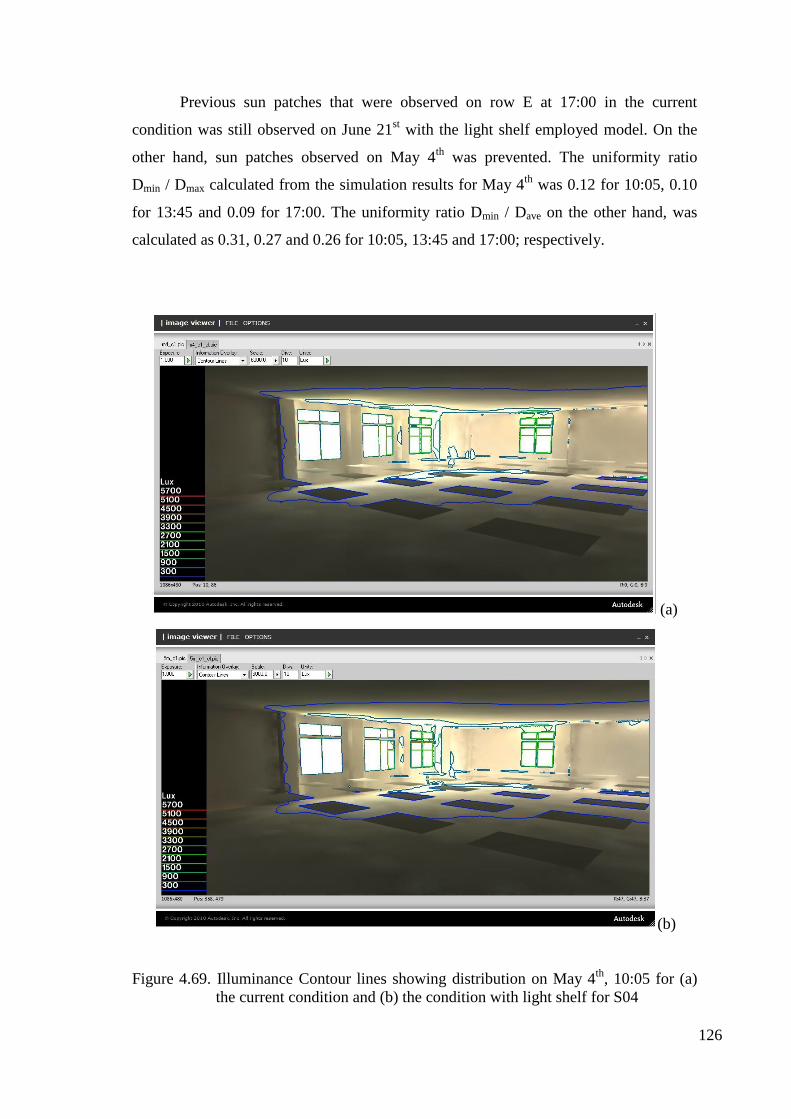
126
Previous sun patches that were observed on row E at 17:00 in the current
condition was still observed on June 21st with the light shelf employed model. On the
other hand, sun patches observed on May 4th
was prevented. The uniformity ratio
Dmin / Dmax calculated from the simulation results for May 4th
was 0.12 for 10:05, 0.10
for 13:45 and 0.09 for 17:00. The uniformity ratio Dmin / Dave on the other hand, was
calculated as 0.31, 0.27 and 0.26 for 10:05, 13:45 and 17:00; respectively.
(a)
(b)
Figure 4.69. Illuminance Contour lines showing distribution on May 4th
, 10:05 for (a)
the current condition and (b) the condition with light shelf for S04
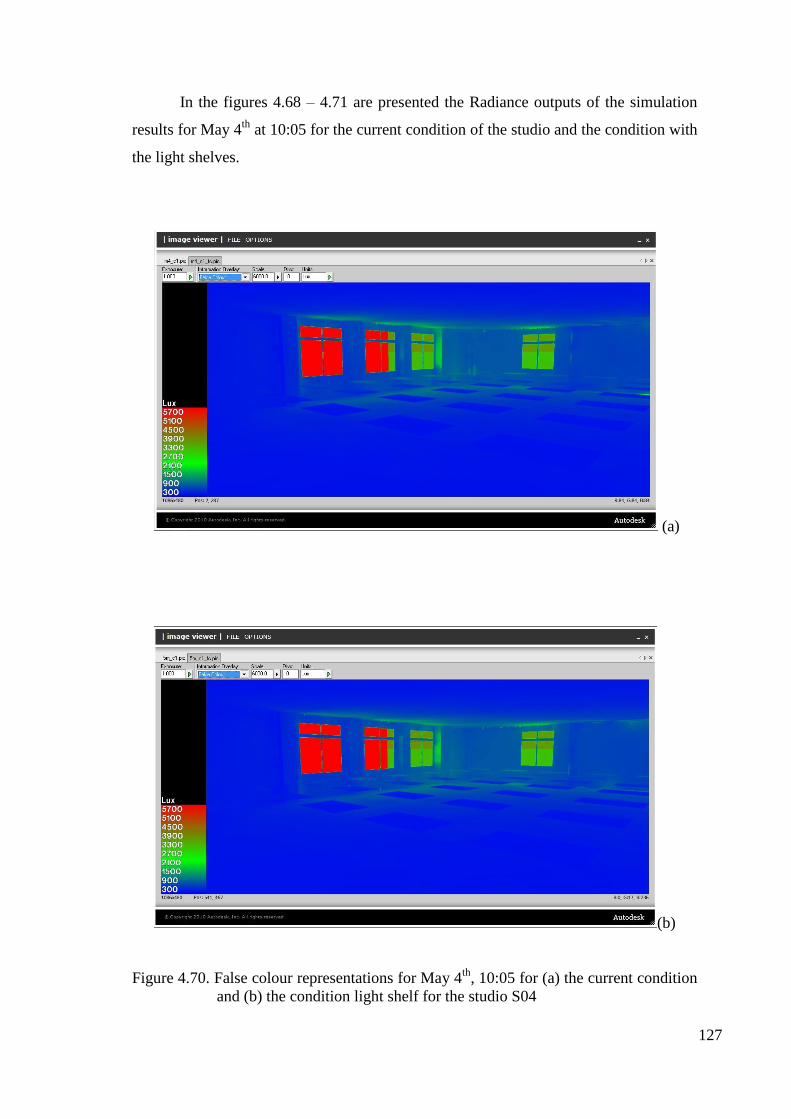
127
In the figures 4.68 – 4.71 are presented the Radiance outputs of the simulation
results for May 4th
at 10:05 for the current condition of the studio and the condition with
the light shelves.
(a)
(b)
Figure 4.70. False colour representations for May 4th
, 10:05 for (a) the current condition
and (b) the condition light shelf for the studio S04
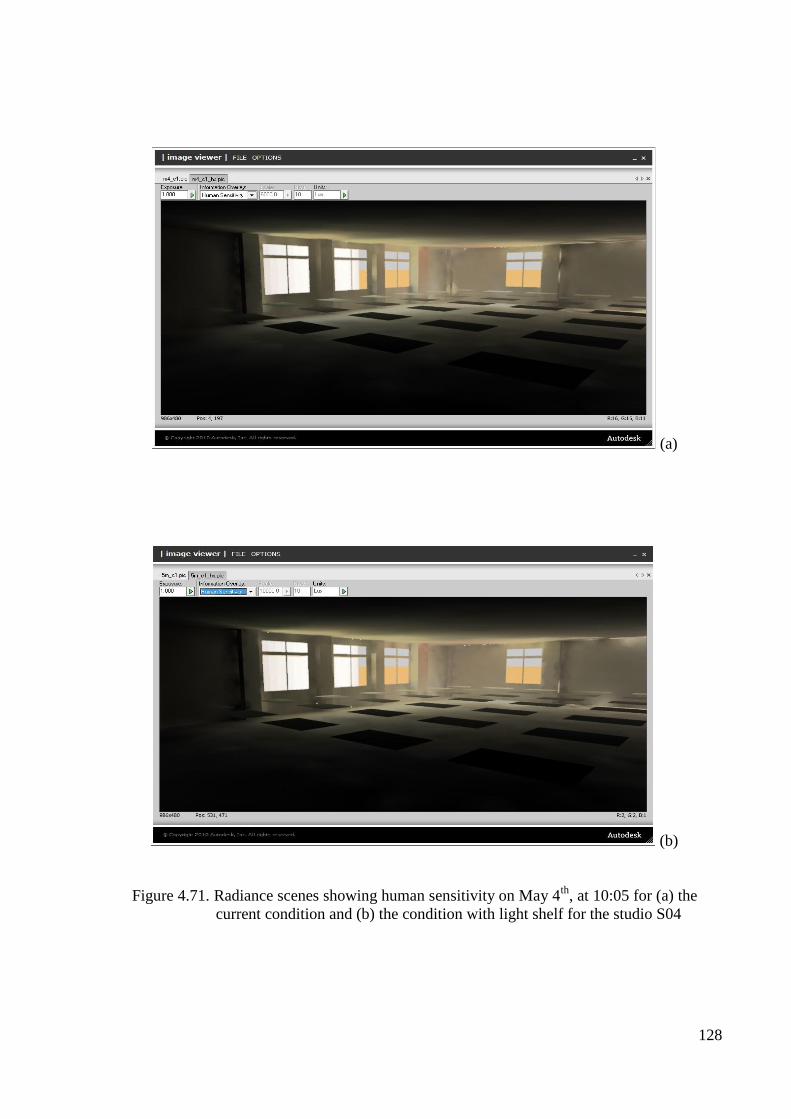
128
(a)
(b)
Figure 4.71. Radiance scenes showing human sensitivity on May 4th
, at 10:05 for (a) the
current condition and (b) the condition with light shelf for the studio S04
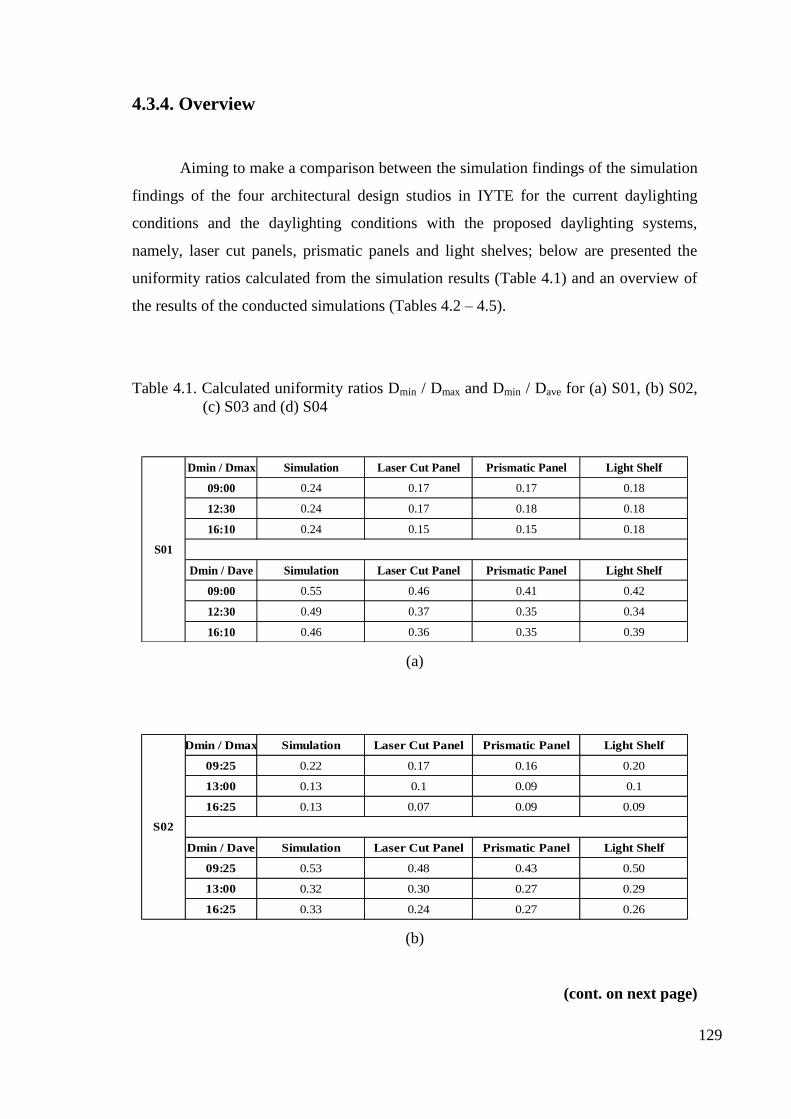
129
4.3.4. Overview
Aiming to make a comparison between the simulation findings of the simulation
findings of the four architectural design studios in IYTE for the current daylighting
conditions and the daylighting conditions with the proposed daylighting systems,
namely, laser cut panels, prismatic panels and light shelves; below are presented the
uniformity ratios calculated from the simulation results (Table 4.1) and an overview of
the results of the conducted simulations (Tables 4.2 – 4.5).
Table 4.1. Calculated uniformity ratios Dmin / Dmax and Dmin / Dave for (a) S01, (b) S02,
(c) S03 and (d) S04
Dmin / Dmax Simulation Laser Cut Panel Prismatic Panel Light Shelf
09:00 0.24 0.17 0.17 0.18
12:30 0.24 0.17 0.18 0.18
16:10 0.24 0.15 0.15 0.18
Dmin / Dave Simulation Laser Cut Panel Prismatic Panel Light Shelf
09:00 0.55 0.46 0.41 0.42
12:30 0.49 0.37 0.35 0.34
16:10 0.46 0.36 0.35 0.39
S01
(a)
Dmin / Dmax Simulation Laser Cut Panel Prismatic Panel Light Shelf
09:25 0.22 0.17 0.16 0.20
13:00 0.13 0.1 0.09 0.1
16:25 0.13 0.07 0.09 0.09
Dmin / Dave Simulation Laser Cut Panel Prismatic Panel Light Shelf
09:25 0.53 0.48 0.43 0.50
13:00 0.32 0.30 0.27 0.29
16:25 0.33 0.24 0.27 0.26
S02
(b)
(cont. on next page)
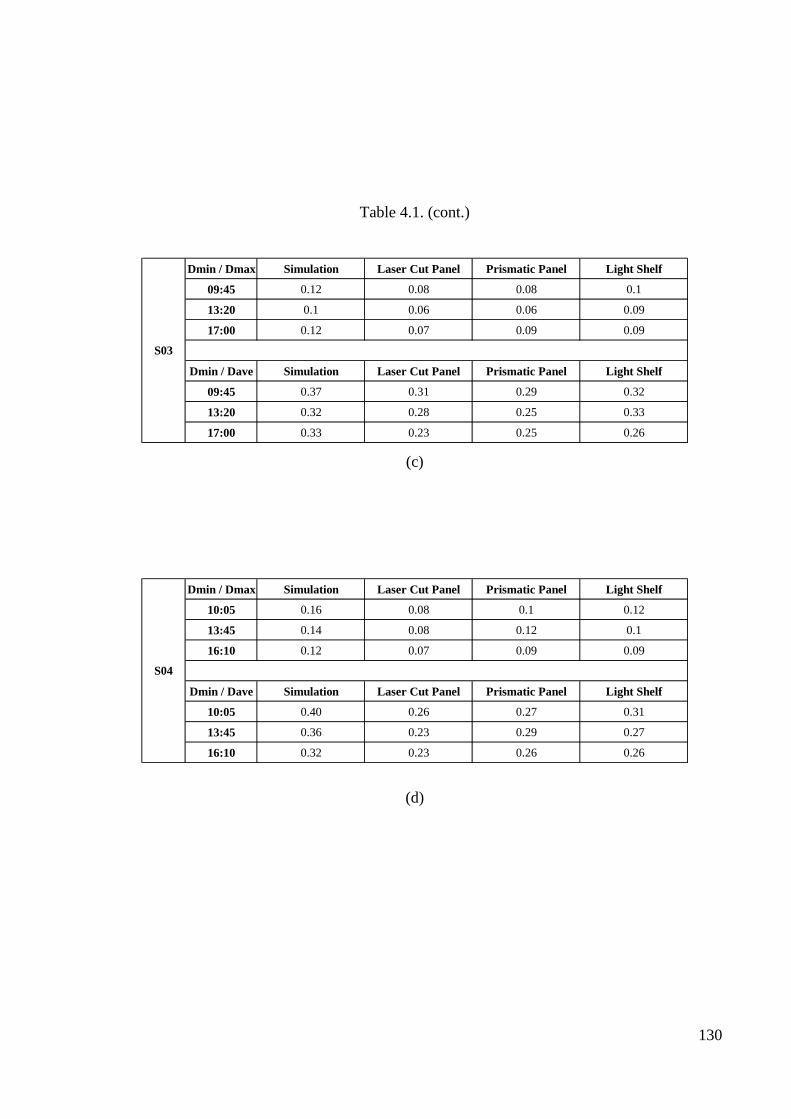
130
Table 4.1. (cont.)
Dmin / Dmax Simulation Laser Cut Panel Prismatic Panel Light Shelf
09:45 0.12 0.08 0.08 0.1
13:20 0.1 0.06 0.06 0.09
17:00 0.12 0.07 0.09 0.09
Dmin / Dave Simulation Laser Cut Panel Prismatic Panel Light Shelf
09:45 0.37 0.31 0.29 0.32
13:20 0.32 0.28 0.25 0.33
17:00 0.33 0.23 0.25 0.26
S03
(c)
Dmin / Dmax Simulation Laser Cut Panel Prismatic Panel Light Shelf
10:05 0.16 0.08 0.1 0.12
13:45 0.14 0.08 0.12 0.1
16:10 0.12 0.07 0.09 0.09
Dmin / Dave Simulation Laser Cut Panel Prismatic Panel Light Shelf
10:05 0.40 0.26 0.27 0.31
13:45 0.36 0.23 0.29 0.27
16:10 0.32 0.23 0.26 0.26
S04
(d)
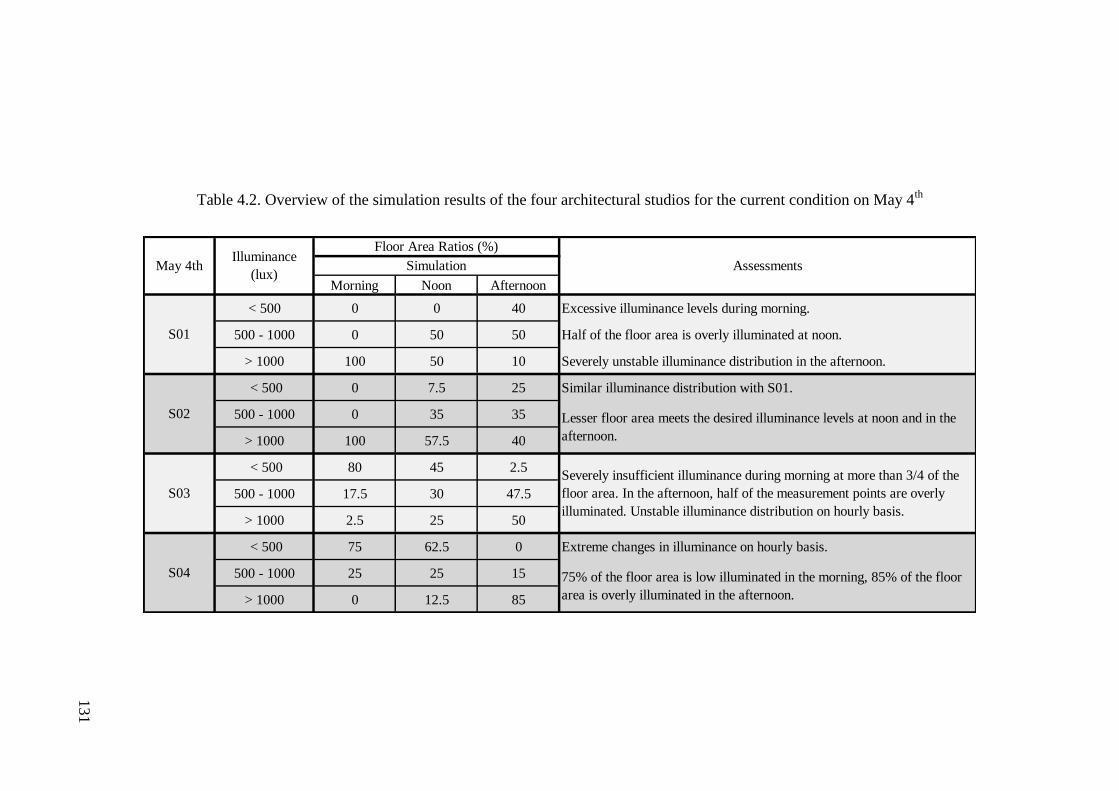
131
Table 4.2. Overview of the simulation results of the four architectural studios for the current condition on May 4th
Morning Noon Afternoon
< 500 0 0 40 Excessive illuminance levels during morning.
500 - 1000 0 50 50 Half of the floor area is overly illuminated at noon.
> 1000 100 50 10 Severely unstable illuminance distribution in the afternoon.
< 500 0 7.5 25 Similar illuminance distribution with S01.
500 - 1000 0 35 35
> 1000 100 57.5 40
< 500 80 45 2.5
500 - 1000 17.5 30 47.5
> 1000 2.5 25 50
< 500 75 62.5 0 Extreme changes in illuminance on hourly basis.
500 - 1000 25 25 15
> 1000 0 12.5 85
Assessments
Lesser floor area meets the desired illuminance levels at noon and in the
afternoon.
Severely insufficient illuminance during morning at more than 3/4 of the
floor area. In the afternoon, half of the measurement points are overly
illuminated. Unstable illuminance distribution on hourly basis.
75% of the floor area is low illuminated in the morning, 85% of the floor
area is overly illuminated in the afternoon.
S04
Floor Area Ratios (%)Illuminance
(lux)Simulation
S01
S02
S03
May 4th
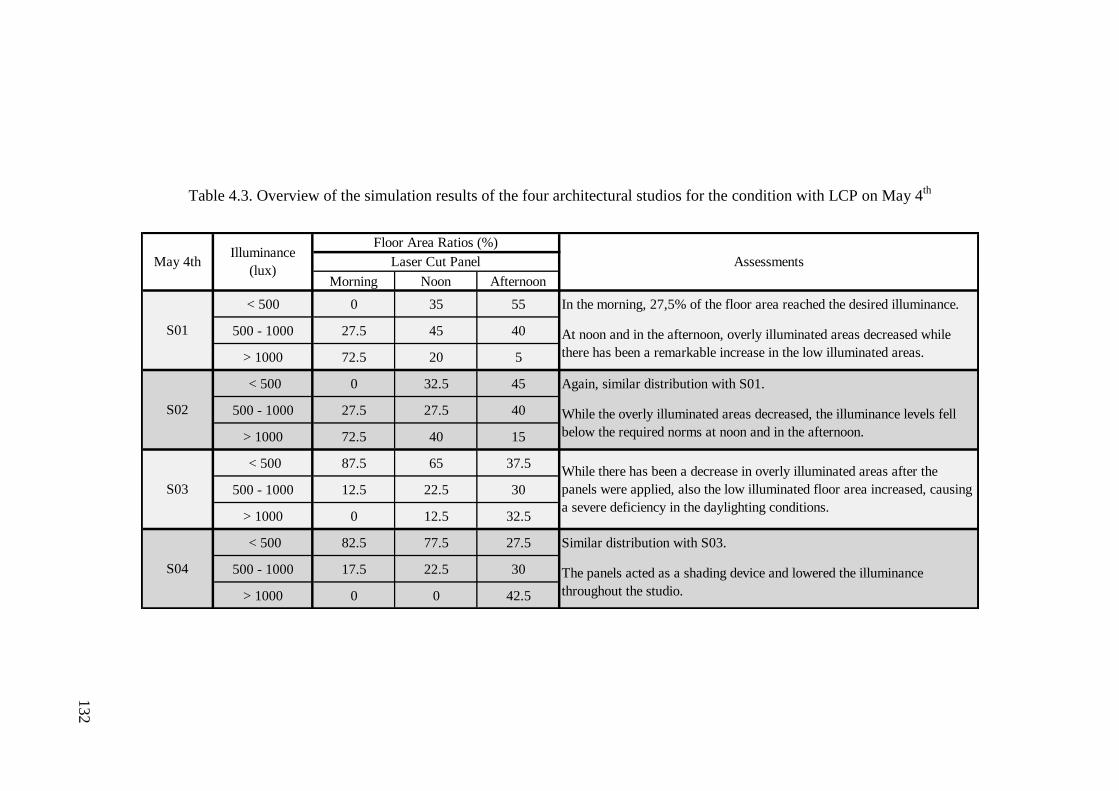
132
Table 4.3. Overview of the simulation results of the four architectural studios for the condition with LCP on May 4th
Morning Noon Afternoon
< 500 0 35 55 In the morning, 27,5% of the floor area reached the desired illuminance.
500 - 1000 27.5 45 40
> 1000 72.5 20 5
< 500 0 32.5 45 Again, similar distribution with S01.
500 - 1000 27.5 27.5 40
> 1000 72.5 40 15
< 500 87.5 65 37.5
500 - 1000 12.5 22.5 30
> 1000 0 12.5 32.5
< 500 82.5 77.5 27.5 Similar distribution with S03.
500 - 1000 17.5 22.5 30
> 1000 0 0 42.5
Assessments
At noon and in the afternoon, overly illuminated areas decreased while
there has been a remarkable increase in the low illuminated areas.
While the overly illuminated areas decreased, the illuminance levels fell
below the required norms at noon and in the afternoon.
While there has been a decrease in overly illuminated areas after the
panels were applied, also the low illuminated floor area increased, causing
a severe deficiency in the daylighting conditions.
The panels acted as a shading device and lowered the illuminance
throughout the studio.
S01
S02
S03
S04
May 4thIlluminance
(lux)
Floor Area Ratios (%)
Laser Cut Panel
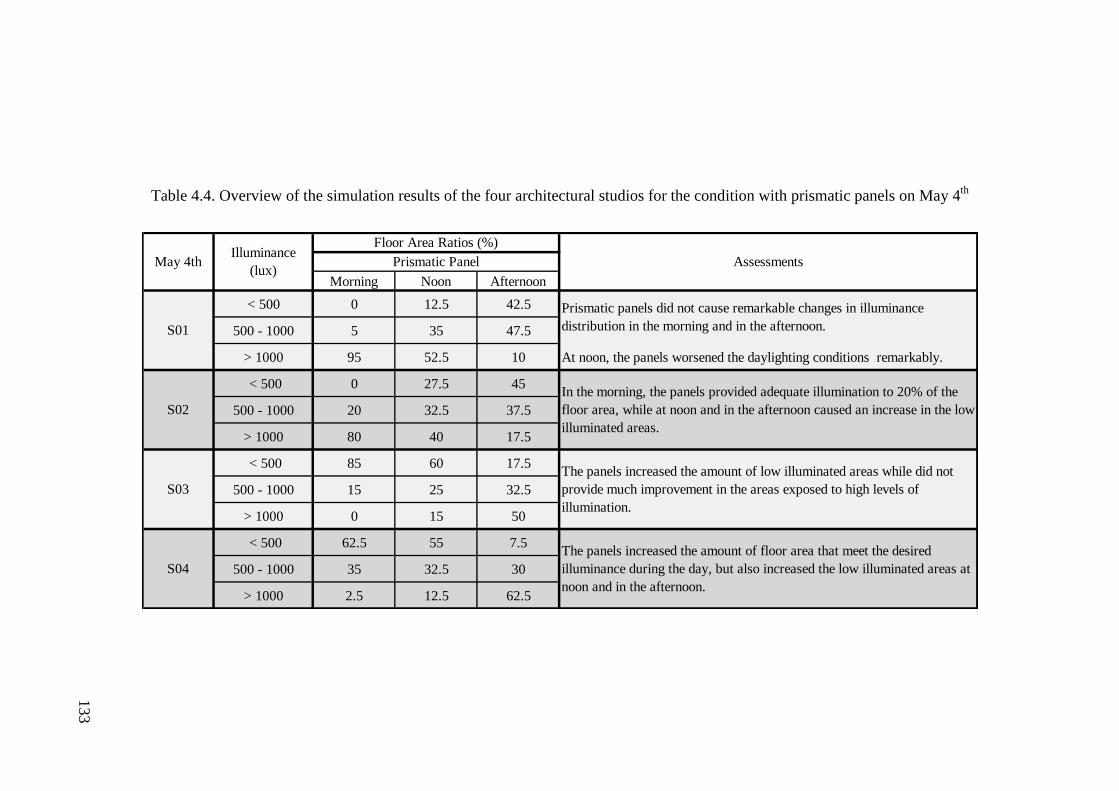
133
Table 4.4. Overview of the simulation results of the four architectural studios for the condition with prismatic panels on May 4th
Morning Noon Afternoon
< 500 0 12.5 42.5
500 - 1000 5 35 47.5
> 1000 95 52.5 10 At noon, the panels worsened the daylighting conditions remarkably.
< 500 0 27.5 45
500 - 1000 20 32.5 37.5
> 1000 80 40 17.5
< 500 85 60 17.5
500 - 1000 15 25 32.5
> 1000 0 15 50
< 500 62.5 55 7.5
500 - 1000 35 32.5 30
> 1000 2.5 12.5 62.5
Prismatic panels did not cause remarkable changes in illuminance
distribution in the morning and in the afternoon.
In the morning, the panels provided adequate illumination to 20% of the
floor area, while at noon and in the afternoon caused an increase in the low
illuminated areas.
The panels increased the amount of low illuminated areas while did not
provide much improvement in the areas exposed to high levels of
illumination.
The panels increased the amount of floor area that meet the desired
illuminance during the day, but also increased the low illuminated areas at
noon and in the afternoon.
Assessments
S03
S04
Illuminance
(lux)
Floor Area Ratios (%)
Prismatic Panel
S01
S02
May 4th
134
Table 4.5. Overview of the simulation results of the four architectural studios for the condition with light shelves on May 4th
Morning Noon Afternoon
< 500 0 12.5 35
500 - 1000 12.5 37.5 45
> 1000 87.5 50 20
< 500 0 17.5 37.5
500 - 1000 25 32.5 32.5
> 1000 75 50 30 Distribution was similar with S01.
< 500 77.5 55 25 In the morning, light shelves provided the best performance.
500 - 1000 22.5 22.5 37.5
> 1000 0 22.5 37.5
< 500 62.5 50 15
500 - 1000 35 30 35
> 1000 2.5 20 50
In the morning, provided adequate illumination to 1/4 of the floor area, but
laser cut panels had a better performance.
At noon and in the afternoon, they decreased the uniformity and lowered
the illuminance throughout the studio.
The light shelves increased the amount of floor area exposed to adequate
levels of illumination throughout the day, but also increased the overly
illuminated areas in the morning and at noon, while increased the low
illuminated areas in the afternoon.
Assessments
S01
Illuminance
(lux)
Floor Area Ratios (%)
Light Shelf
In the morning, provided adequate illumination to 12.5% of the floor area,
but the laser cut panels had a better performance. At noon and in the
afternoon, worsened the distribution.
S02
S03
S04
May 4th
135
4.4. Discussion
The aim of this thesis was to improve the illuminance and uniformity of the four
architectural design studios in İzmir Institute of Technology by applying advanced
daylighting systems. Besides, the simulation model was employed in order to estimate
and evaluate the daylight illuminance and uniformity. There are several studies which
included the advanced daylighting systems selected for this thesis, namely, the light
shelves, laser cut panels and prismatic panels. For instance, Bleney and Edmonds
(2013) recommended using laser cut panels as light redirection systems only if they
were designed with the combination of fixed shading devices, at the end of an analysis
of the laser cut panels they conducted in a school in Brisbane, Australia. In another
example, Sweitzer (1991) identified the critical impacts of prismatic panels on the
reflections and shadows on interior surfaces in perimeter offices. They concluded
similarly that these redirecting systems effectively altered the daylighting distribution
only if the window aperture was set accordingly.
In view of these studies, since the floor plan depth of the architectural studios
selected for this thesis were too deep, 11.25 meters to 17.65 meters, and the illuminance
was inadequate in the areas near the rear wall; it was assumed that by using those
daylight redirecting elements which were mentioned above, the daylight could reach
efficiently through these low illuminated areas. In addition, it would be possible to
balance the average illuminance within the studios regardless of time when moving
from the rear wall towards the main wall including the largest glazing area. Even, sun
patches observed near the window would be prevented. Therefore the illuminance in
these areas should have been decreased in order to provide a healthy environment to
conduct the tasks of an architectural design studio. In the light of these arguments, it
was also thought that the daylighting systems that would be applied on the exterior of
the windows should also have sun shading characteristics.
Regarding these considerations, the Desktop Radiance employed the daylighting
simulations with the inclusion of three selected advanced daylighting systems which
met the needs of sun shading and redirection of daylight; namely, laser cut panels,
prismatic panels and light shelves.
Discussions about several noteworthy findings of this study may guide further
researchers and lighting designers in two ways, as iterated below.
136
a. First, Ecotect and Radiance are two simulation tools which may be suggested
to be used in daylighting performance studies together.
One noteworthy discussion may base on the physical correctness, usability and
applicability of the daylighting simulation tools. They have been the frequently-used
and the mostly-reliable tools among the scale models and mathematical calculations in
the prediction of illuminance and daylight factor in the field of daylighting design. Their
priority depends on being less-time consuming, providing various visual scenes for
various physical and sky conditions. It is possible to detect any deficiency in the design
phase and provide solutions before its construction. So it is cost-efficient. Here, in this
study, the Autodesk Ecotect Analysis and Desktop Radiance tools were used to model
the studios and analyze their lighting condition. Majority of the studies reviewed from
literature concluded that Radiance is the most accurate tool among other tools and
preferred to design and examine some technological components, i.e., laser-cut or
prismatic panels in glazing. However, it was also understood that even the most precise
tool might display misleading findings by the consideration of the various real sky
conditions and a plenty of surface reflectance values. There are also evidences to
support this statement in this study; i.e. there were several unbalanced illuminance
variation between the measurements and the simulation model during the day,
especially observed at the measurement points near the windows.
It is obvious that the advances in simulation technologies would continue with a
growing acceleration. However the noteworthy point here is that which tool is the most
accurate one at the moment and that its accuracy/or inaccuracy depends on which
factors (such as sky model, material, etc.) The answers would allow the improvement in
the simulation technology. Designers and researchers also would use such tools with an
absolute awareness.
b. Second, the simulation results indicated that none of the applied daylighting
systems satisfactorily improved the illuminance and daylight uniformity in the
architectural design studios.
Another discussion may be stated here about the impact of daylighting systems
on the parameters of daylighting performance, namely, the illuminance and uniformity.
The prevented excessive light intensity by laser cut panels reduced the horizontal
illuminance. For example, laser cut panels reduced the horizontal illuminance on the
working surface near the window from about 39klux to about 3klux. Although they
were successful in avoiding sun patches, they were unable to enhance the uniformity
137
ratios up to the recommended values. Thus, the systems only reduced the horizontal
illuminance in general. On the other hand, the prismatic panels did not provide adequate
sun shading for the areas which were overly illuminated.
The studies about the daylighting performance of laser cut and prismatic panels
were mostly included office buildings whose plan depths were 5 – 6 m. However, the
horizontal depth of the architectural studios which were subjected in this thesis was
11.25 m. Each studio was approximately 200m2. There were windows only on the two
façades, and the total glazing ratio was almost 10%. The glazing ratio, as well as the
number of glazed facades was inadequate in such a space of this amount of floor area.
All of these considerations might be the cause of the inadequacy of the selected
daylighting systems. Also, all of these conditions were the results of unsolved design
problems at the preliminary stages of the architectural design of the studios.
138
CHAPTER 5
CONCLUSION
This study aimed to obtain the best daylighting illuminance and uniformity in an
architectural design studio. The measurements were taken to evaluate the real case
lighting conditions and to validate the simulation model which was employed by
Autodesk Ecotect Analysis. Then, simulated lighting analyses were carried out to
construct trial models in Desktop Radiance by applying advanced daylighting
systems(laser cut panels, prismatic panels and light shelves with different size and
material combinations in May and June. It was predicted that the applied daylighting
systems would illuminate the areas near the rear wall with their light guiding
characteristics, balance the average illuminance regardless of time within the studios
when moving from the rear wall to the window wall with the largest glazing area, and
prevent the previous sun patches with their sun shading characteristics.
But the simulation results indicated that, all three of the systems failed to
increase the illuminance near the rear wall, the systems did not improved the uniformity
of the studios and all three of the systems showed sun shading characteristics rather than
acting as light guiding elements.
Findings showed that the 20% of the floor area did not receive enough daylight
in the morning period; and almost 60% of the floor area was gloomy at noon (daytime)
for the studios facing east. The existing daylighting conditions did not satisfy the
uniformity rates. By applying laser-cut panels, prismatic panels and light shelves, trial
simulation models displayed that uniformity values wouldn’t be improved, although
illuminance near the windows decreased sharply. One reason might be the depth of the
studio was far away from the range of daylighting system’s effectiveness. In literature
(Greenup, Edmonds, &Compagnon, 2000; Thanachareonkit, & Scartezzini, 2006) such
systems were applied in smaller spaces, such as offices or classrooms. Similarly, the
systems were very effective on the floor area close to the windows and decreased the
horizontal illuminance in that overall space while they improved the uniformity.
Another reason might be the rate of window area to the floor area was not enough to
admit sufficient amount of daylight inside. It is almost one third of the values proposed
139
in standards. It is considered that retrofitting efforts after the construction would be
inadequate due to daylighting, unless complying with the standards during the design
process. In other words, designers and professionals should pay attention to apply
requirements mentioned in the standards/or norms about daylighting in the design stage.
Another finding was that Ecotect/Radiance modeling was a suitable tool to
evaluate and retrofit an existing building’s daylighting performance. It was believed that
further retrofitting/repairing applications such as opening additional windows and
considering their design together with laser-cut panels and light shelves would help to
find better daylighting conditions.
In the light of these, the findings of this study can be summarized as;
- Autodesk Ecotect Analysis and Desktop Radiance are two powerful simulation
tools which may be suggested to be used in daylighting performance studies
together,
- None of the applied daylighting systems satisfactorily improved the illuminance
and uniformity in the selected design studios due to the previously mentioned
reasons; and
- Daylighting decisions should be integrated with the building design in the
preliminary design stages, since the main design decisions like glazing ratio, the
number and positioning of the daylight apertures have remarkable effects on the
daylighting performance of the buildings.
140
REFERENCES
Acosta, I., Navarro J., & Sendra J. J. (2011). Towards an analysis of daylighting
simulation software. Energies, 4, 1010 - 1024.
Aghemo, C., Pellegrino, A., & Lo Verso, V. R. M. (2008). The approach to daylighting
by scale models and sun and sky simulators: A case study for different shading
systems. Building and Environment, 43, 917 - 927.
Aizlewood, M. E., & Littlefair, P. J. (1994). Daylight prediction methods: A survey of
their use. Garston Watford, UK: British Research Establishment.
Al - Sallal K.A. (1998). Sizing windows to achieve passive cooling, passive heating,
and daylighting in hot arid regions. Renewable Energy, 14, 365 - 371.
Alvarez, S., Blanco, A., Sanz, J.A., & Sanchez, F.J. (2005). The Euroclass method-
description of the software. In Santamouris, M. (Ed.), Energy performance of
residential buildings (pp. 71 - 77). London, UK: James & James/ Earthscan.
Attia S., Beltrán L., Herde A., & D. Hensen J. (2009). Proceedings from Eleventh
International IBPSA Conference: Architect Friendly: A Comparison Of Ten
Different Building Performance Simulation Tools. Glasgow, Scotland
Bhavani, R.G., & Kahn, M.A. (2011). Advanced lighting simulation tools for
daylighting purpose: powerful features and related issues. Trends in Applied
Sciences Research, 6 (4), 345 - 363.
Bleney, G., & Edmonds, I. (2013). A sub tropical building façade combining light
redirection, shading and ventilation; St. Paul’s School, Brisbane, Australia.
Retrieved February 22, 2013 from www.solatran.com.au/bald_hills_school.htm
Bostancı, C.S. (2006). Akıllı Kinetik Güneş Kontrol Sistemi Önerisi. (Unpublished
Master of Science dissertation). Yıldız Teknik Üniversitesi Fen Bilimleri
Enstitüsü, İstanbul.
Boubekri, M. (2004). A Overview of the current state of daylight legislation. Journal of
the Human – Environmental System, 7 (2), 57 - 63.
141
Chartered Institution of Building Services Engineers (CIBSE). (2008). Working Plane
Illuminance in Electrically Lit Spaces. Retrieved January 5, 2013, from
http//www.cibse.org/pdfs/factfile3.pdf.
Christakou, E., & Silva, N. A. (2008). Comparison of software for architectural
simulation of natural light. T. Sobh (Ed.), Advances in computer and information
sciences and engineering (pp. 136 - 141). New York, NY: Springer
CIBSE. (1994). Interior Lighting Code, London, UK: CIBSE.
Claros,S – T, & Soler, A. (2002). Indoor daylight climate–infuence of light shelf and
model refectance on light shelf performance in Madrid for hours with unit
sunshine fraction. Building and Environment, 37, 587 - 598.
Cutler, B., Sheng, Y., Martin, S., Glaser, D., & Andersen, M. (2008) Interactive
selection of optimal fenestration materials for schematic architectural
daylighting design. Automation in Construction, 17 , 809 - 823.
DesignBuilder. (2012). Simulation Tool, Manual. [Data file]. Retrieved from
http://www.designbuilder.co.uk/
ECOTECT. (2012). Autodesk Ecotect Analysis Sustainable Building Design Software.
Retrieved from: http://usa.autodesk.com/ecotect-analysis/
Edmonds, I. R., & Greenup, P. J. (2002). Daylighting in the Tropics. Solar Energy, 73
(2), 111 - 121.
Egan, MD. (2002). Concepts in architectural lighting. Newyork, NY: Mc Graw-Hill.
Erlalelitepe, İ., Aral, D., & Kazanasmaz, T. (2011). Eğitim Yapılarının Doğal
Aydınlatma Performansı Açısından İncelenmesi. Megaron, 6 (1), 39 - 51.
Fontoynont, M. (Ed.). (1999). Daylight performance of buildings. Oxford, UK:
Routledge.
Greenup, P.J., Edmonds, I.R., & Compagnon, R. (2000). RADIANCE algorithm to
simulate laser-cut panel light-redirecting elements. Lighting Research and
Technology, 32, 49 - 54.
142
Güvenkaya, R., K., & Küçükdoğu, M., Ş. (2009). İlköğretim dersliklerinde aydınlatma
enerjisi yönetiminde yönlere göre uygun cephe seçeneklerinin belirlenmesi. İtü
Dergisi/ a Mimarlık, Planlama, Tasarım, 8 (2), 77 - 88.
Hansen, G.H. (2006). Innovative daylighting systems for deep-plan commercial
buildings. (Doctoral Dissertation). Quennsland University of Technology School
of Design, Brisbane.
Hocheng, H., Huang, T.Y., Chou, T. H., & Yang, W. H. (2010). Journal of
Achievements in Materials and Manufacturing Engineering, 43 (1), 409 - 417.
International Energy Agency (IEA). (2000). Daylight in buildings, a source book on
daylighting systems and components. (A report of IEA SHC Task 21/ ECBCS
Annex 29, July 2000). Berkeley, CA: The Lawrence Berkeley National
Laboratory.
International Energy Agency (IEA). (2010). Daylight in Buildings, Project Summary
Report. Ed. Johnsen, K., & Watkins, R. United Kingdom: AECOM.
Kazanasmaz, T., & Fırat, P. (2012). Proceedings from International Congress of
Architecture – I “Architecture and Technology”: Comparison of simulation tools
mostly used in daylighting performance studies. Konya, Turkey.
Kesten, D., & Yener, A., K. (2006). Proceedings from 6. Ulusal Aydınlatma Kongresi:
İlköğretim Binalarında Enerji Etkin Aydınlatma Sistemi Tasarımına İlişkin Bir
Çalışma. İstanbul, Turkey.
Kim, C., & Chung, S. (2011). Daylighting simulation as an architectural design process
in museums installed with toplights. Building and Environment, 46, 210 - 222.
Kischkoweit – Lopin, M. (2002). An overview of daylighting systems. Solar Energy, 73
(2), 77 - 82.
Köster, H. (2004). Dynamic Daylighting Architecture, Basics, Systems, Projects, New
York, NY: Birkhauser.
Labayrade, R., Jensen, H.W., & Jensen C.W. (2010). An iterative workflow to assess
the physical accuracy of lighting simulation programmes. Light & Engineering,
18 (2), 60 - 70.
143
Laouadi, A., Saber, H., Galasiu, A.D., & Arsenault, C. (2013). Optical model for
prismatic glazing (1415 – RP). HVAC&R Research, 19, 63 - 75.
Leslie, RP. (2003). Capturing the daylight dividend in buildings: why and how? Build
Environment, 38 (2), 381 - 385.
Licht, U.B. (2006). Lighting Design Detail Practice, Basel, Switzerland: Birkhauser.
Lim, Y., Ahmad, M.H., & Ossen, D.R. (2010). Empirical validation of daylight
simulation tool with physical model measurement. American Journal of Applied
Sciences, 7 (10), 1426 - 1431.
Lim, H.S., & Kim, G. (2010). Predicted performance of shading devices for healtier
visual environment. Indoor and Built Environment, 19 (4), 486 - 496.
Lim, Y – W., Kandar, M., Z., Ahmad, M., H., Ossen, D., R., & and Abdullah, A., M.
(2012). Building façade design for daylighting quality in typical government
office building. Building and Environment, 57, 194 - 204.
Littlefair, P. (2002). Daylight prediction in atrium buildings. Solar Energy, 73, 105 -
109.
Littlefair, P. J., & Motin, A. (2001). Lighting controls in areas with innovative
daylighting systems: a study of sensor type. Lighting Research and Technology,
33 (1), 59 - 73.
Mistrick, R.G. (2000). Desktop Radiance Overview. Retrieved from:
http://radsite.lbl.gov/deskrad/drad-overview.pdf
Miyazaki, T., Akisawa, A., &Kashiwagi, T. (2005). Energy savings of office buildings
by the use of semi-transparent solar cells for windows. Renewable Energy, 30,
281 - 304.
Ng, E. (2001). Proceedings from Seventh International IBPSA Conference: A study on
the accuracy of daylighting simulation of heavily obstructed buildings in Hong
Kong. Rio de janerio, Brazil.
144
Rao, S., & Tzempelikos, A. (2012). The impact of a combined dynamic shading system
on the thermal performance of building perimeter zones. ASHRAE Transactions,
118 (1), 265 - 272.
Reinhart, C.F., & Andersen, M. (2006). Development and validation of a Radiance
model for a translucent panel, Energy and Buildings, 38, 890 - 904.
Reinhart, C.F., & Fitz, A. (2006). Findings from a survey on the current use of daylight
simulations in building design, Energy and Buildings, 38, 824 - 835.
Reinhart, C.F., & Ibarra D.I. (2009). Proceedings from International IBPSA
Conference: Daylight factor simulations – how close do simulation beginners
‘really’ get? Glasgow, Scotland.
Reinhart, C.F., & Wienold, J. (2011). The daylighting dashboard - a simulation-based
design analysis for daylit spaces. Building and Environment, 46, 386 - 396.
Reppel, J., & Edmonds, I.R. (1998). Angle – selective glazing for radiant heat control in
buildings: Theory. Solar Energy, 62 (3), 245 - 253.
Soler, A., & Oteiza, P. (1996). Dependence on solar elevation of the performance of a
light shelf as a potential daylighting device. Renewable Energy, 8 (1 – 4), 198 -
201.
Sweitzer, G. (1991). Proceedings from “Right Light Bright Light” 1st European
Conference on Energy Efficient Lighting: Prismatic panel sidelighting systems:
Daylighting distribution and electric lighting use patterns in perimeter office
workplaces. Stockholm, Sweden.
Thanachareonkit, A., Scartezzini J.L., & Robinson D. (2006). Proceedings from The
23rd Conference on Passive and Low Energy Architecture (PLEA 2006):
Comparing the accuracy of daylighting physical and virtual models for complex
fenestration systems. Geneva, Switzerland.
Tsangrassoulis, A. (2008). A review of innovative daylighting systems. Advances in
Building Energy Research, 2, 33 - 56.
VELUX. (2012). Daylight Visualiser. [Data file]. Retrieved from
http://viz.velux.com/daylight_visualizer/about
145
Winterbottom, & M., Wilkins, A. (2009). Lighting and discomfort in the classroom.
Journal of Environmental Psychology, 29, 63 - 75.
Yener, A.K., Güvenkaya, R., & Şener, F. (2009). İlkokul sınıflarında görsel konfor ve
enerji verimi – Bir durum çalışması üzerine araştırma- , Türk Tesisat
Mühendisleri Derneği Dergisi, Temmuz Ağustos 2009, 30 - 33.
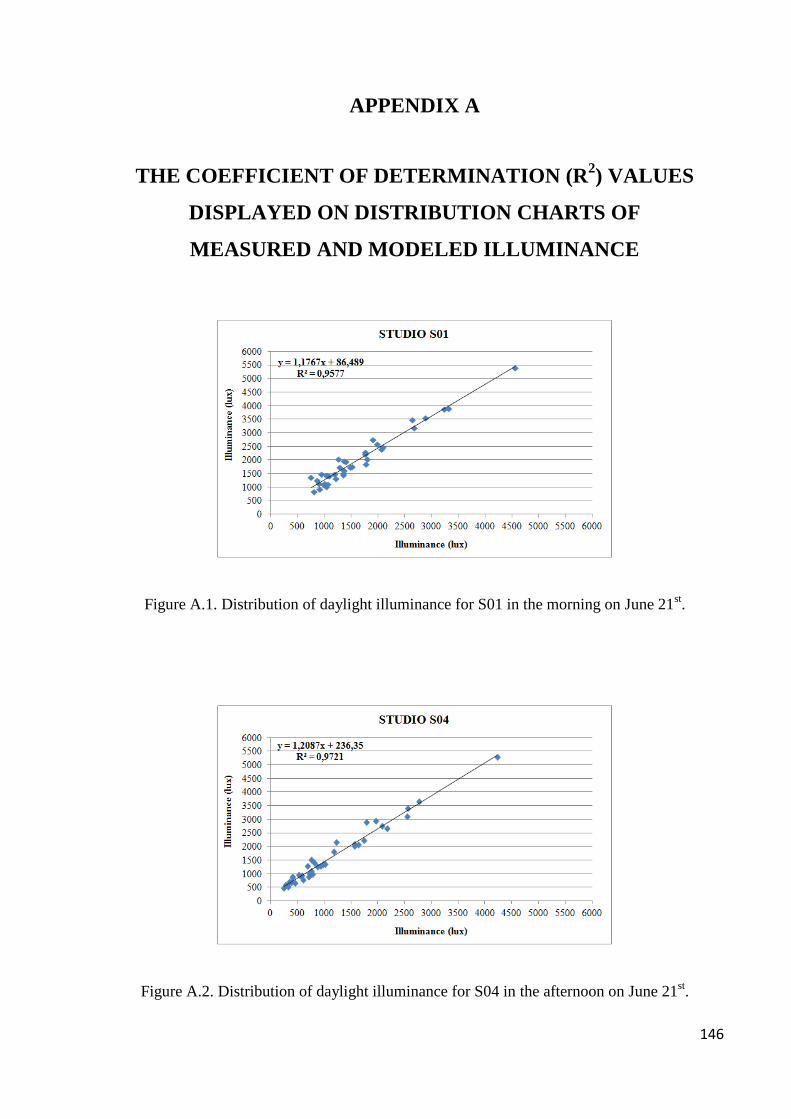
146
APPENDIX A
THE COEFFICIENT OF DETERMINATION (R2) VALUES
DISPLAYED ON DISTRIBUTION CHARTS OF
MEASURED AND MODELED ILLUMINANCE
Figure A.1. Distribution of daylight illuminance for S01 in the morning on June 21st.
Figure A.2. Distribution of daylight illuminance for S04 in the afternoon on June 21st.
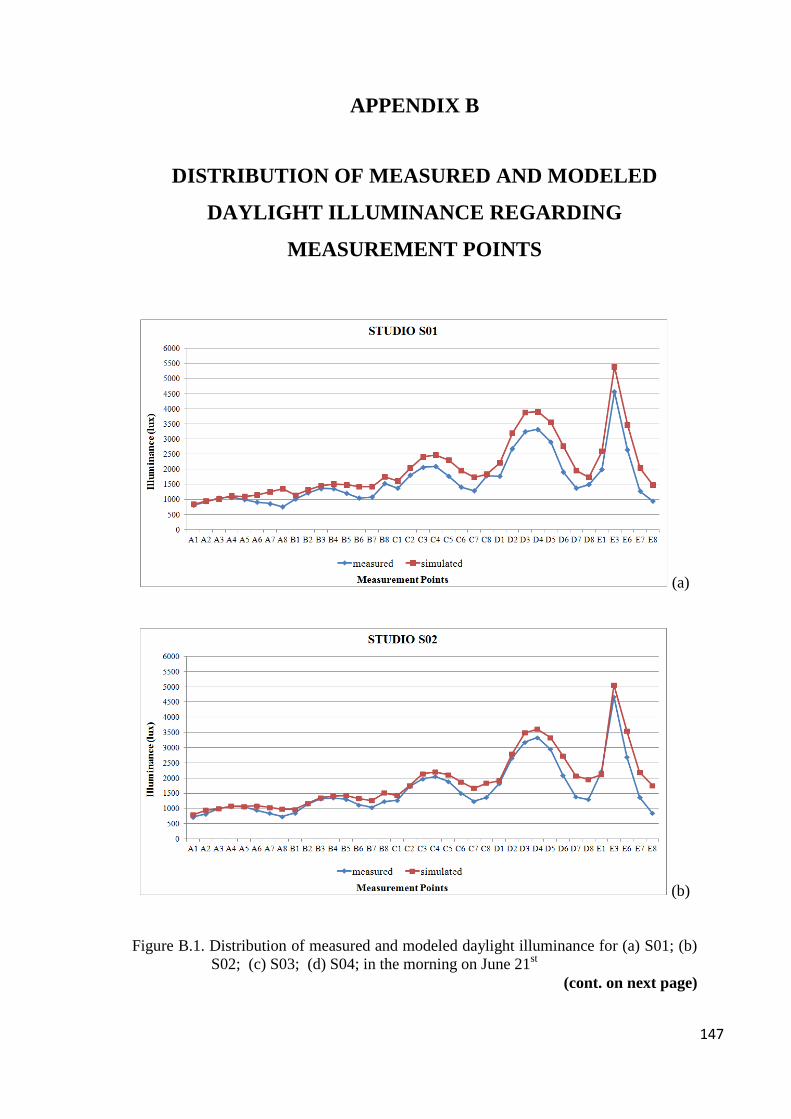
147
APPENDIX B
DISTRIBUTION OF MEASURED AND MODELED
DAYLIGHT ILLUMINANCE REGARDING
MEASUREMENT POINTS
(a)
(b)
Figure B.1. Distribution of measured and modeled daylight illuminance for (a) S01; (b)
S02; (c) S03; (d) S04; in the morning on June 21st
(cont. on next page)
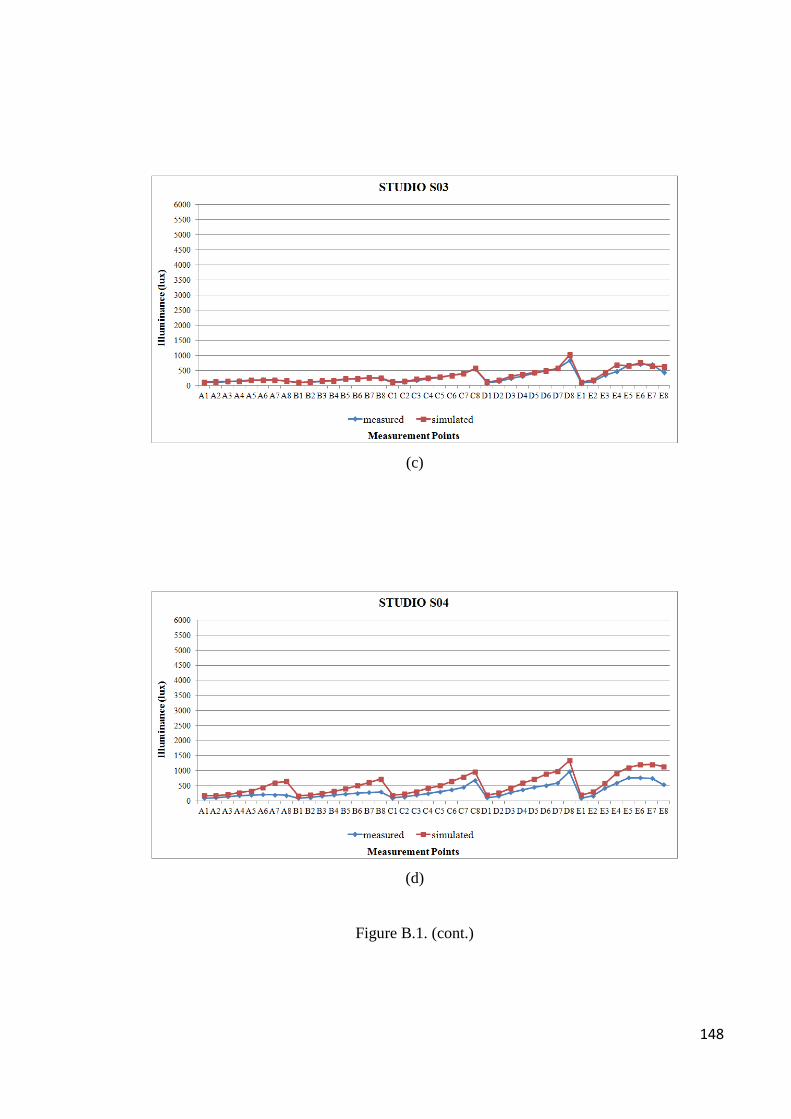
148
(c)
(d)
Figure B.1. (cont.)
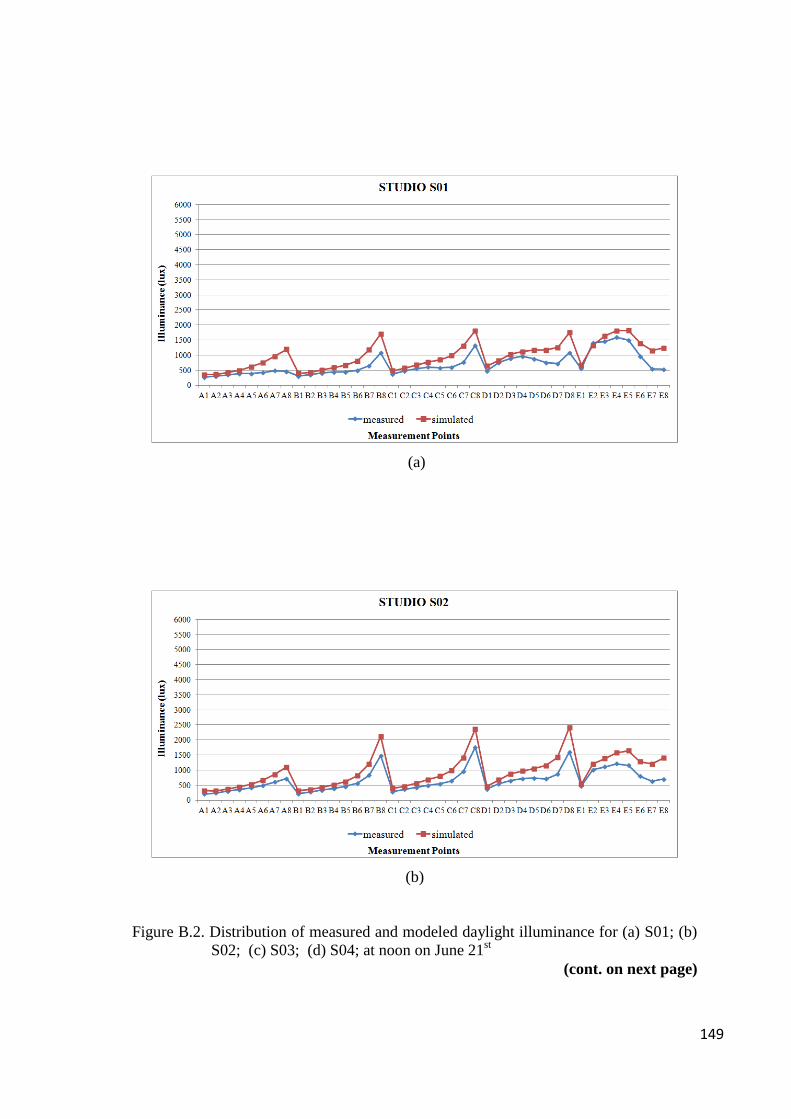
149
(a)
(b)
Figure B.2. Distribution of measured and modeled daylight illuminance for (a) S01; (b)
S02; (c) S03; (d) S04; at noon on June 21st
(cont. on next page)
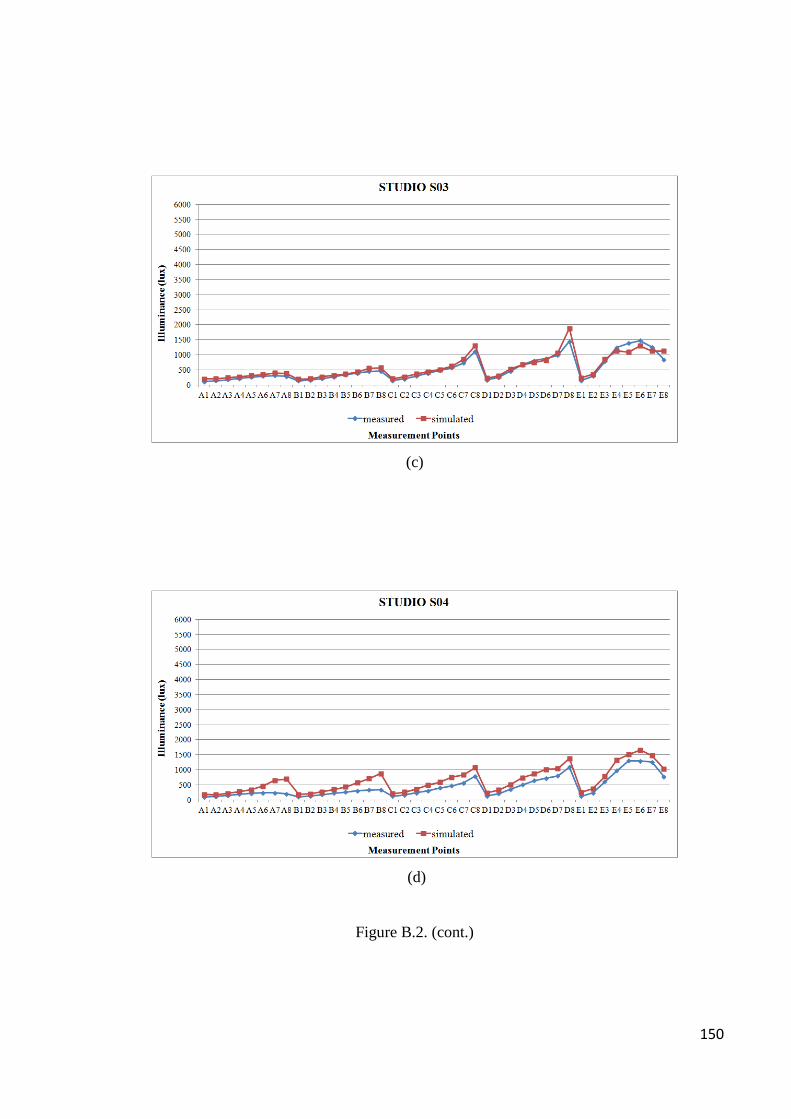
150
(c)
(d)
Figure B.2. (cont.)
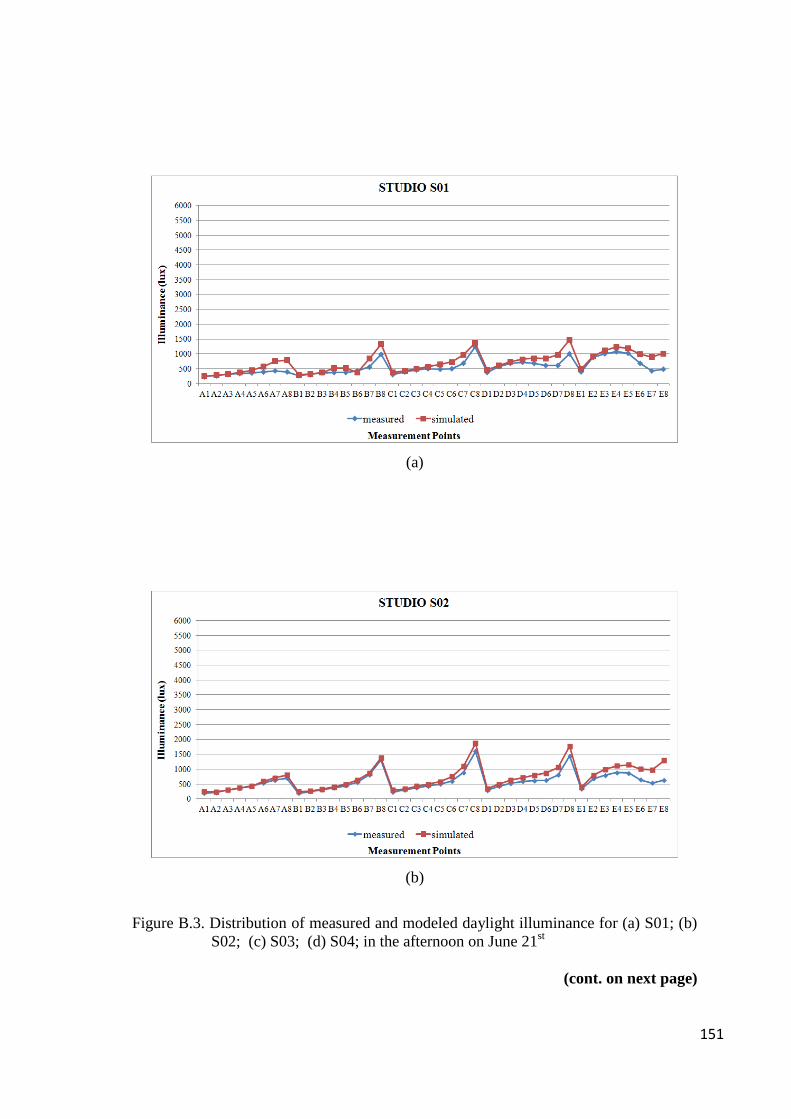
151
(a)
(b)
Figure B.3. Distribution of measured and modeled daylight illuminance for (a) S01; (b)
S02; (c) S03; (d) S04; in the afternoon on June 21st
(cont. on next page)
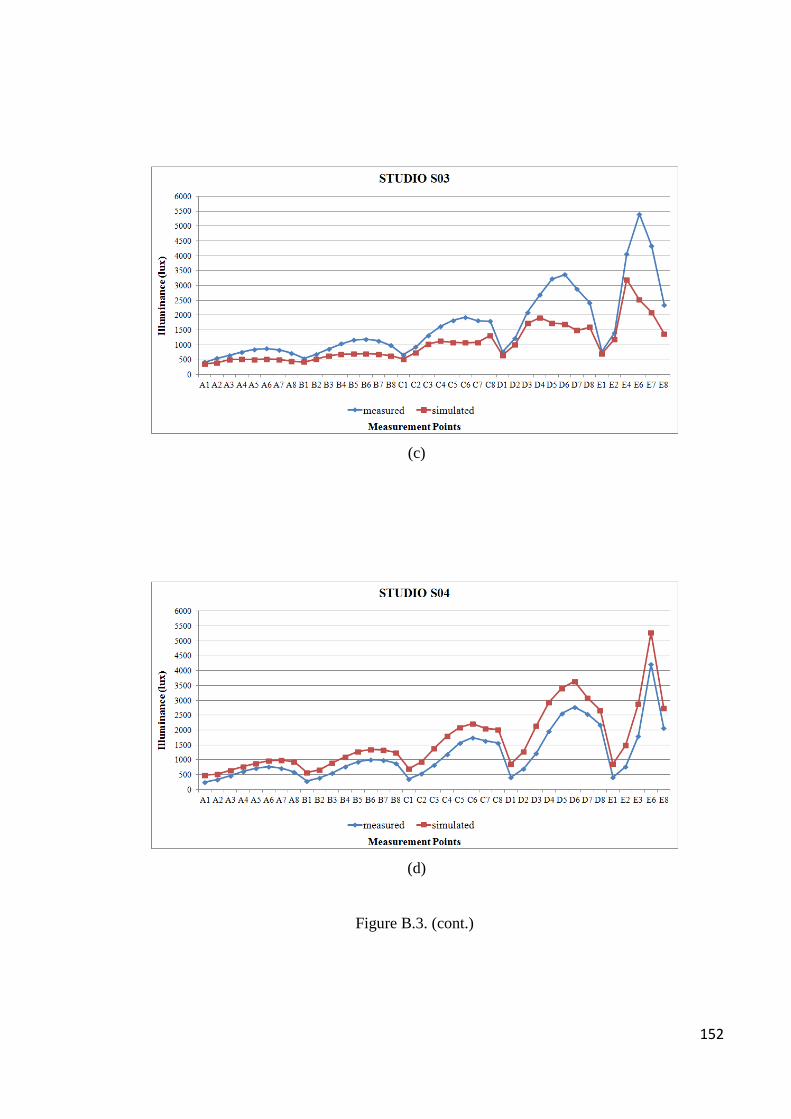
152
(c)
(d)
Figure B.3. (cont.)
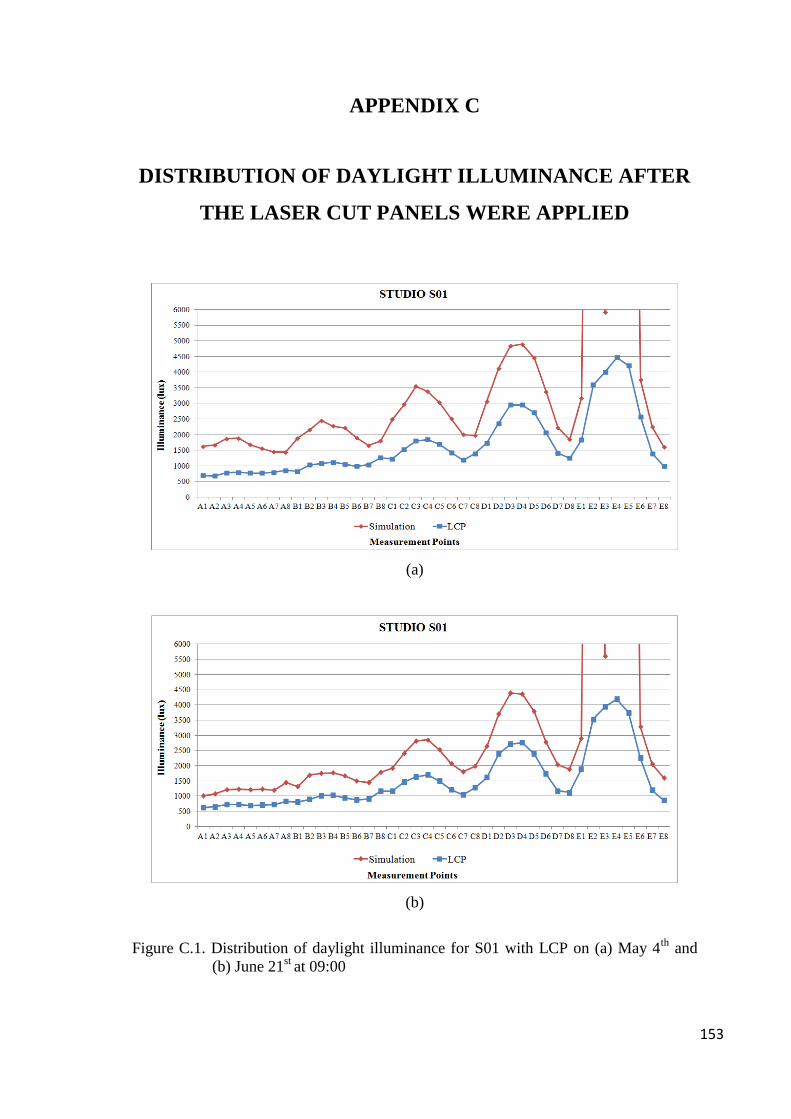
153
APPENDIX C
DISTRIBUTION OF DAYLIGHT ILLUMINANCE AFTER
THE LASER CUT PANELS WERE APPLIED
(a)
(b)
Figure C.1. Distribution of daylight illuminance for S01 with LCP on (a) May 4th
and
(b) June 21st
at 09:00
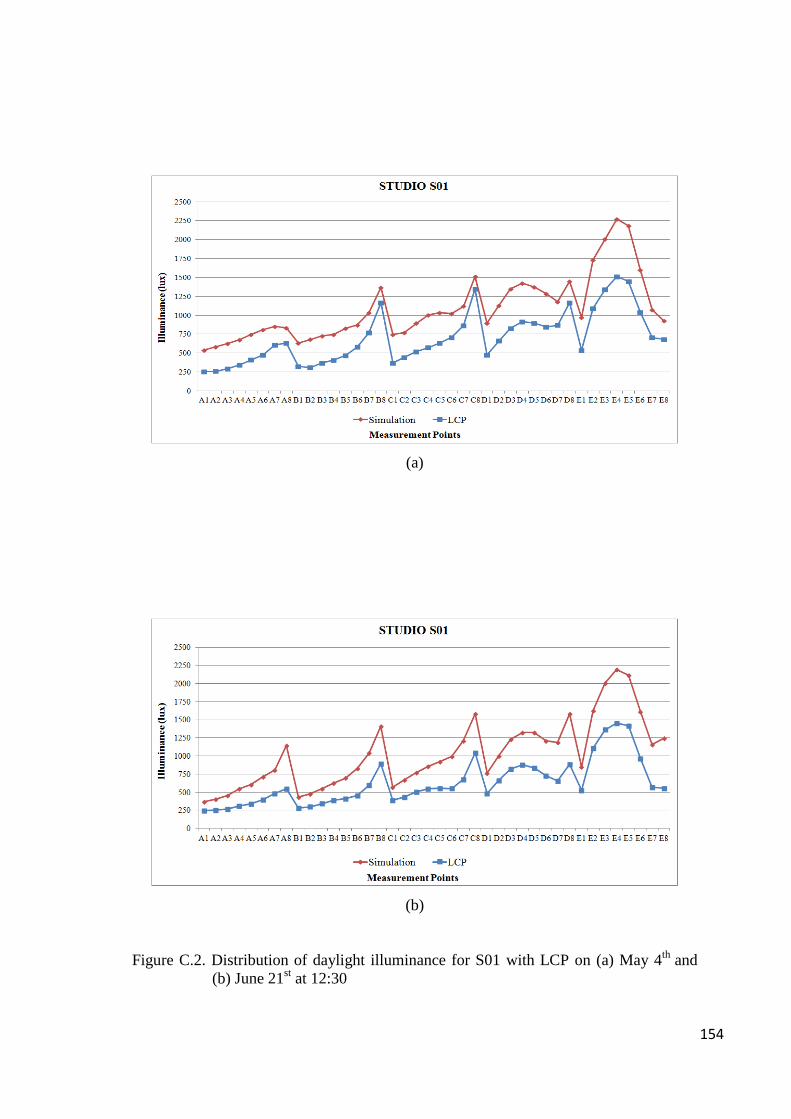
154
(a)
(b)
Figure C.2. Distribution of daylight illuminance for S01 with LCP on (a) May 4th
and
(b) June 21st at 12:30
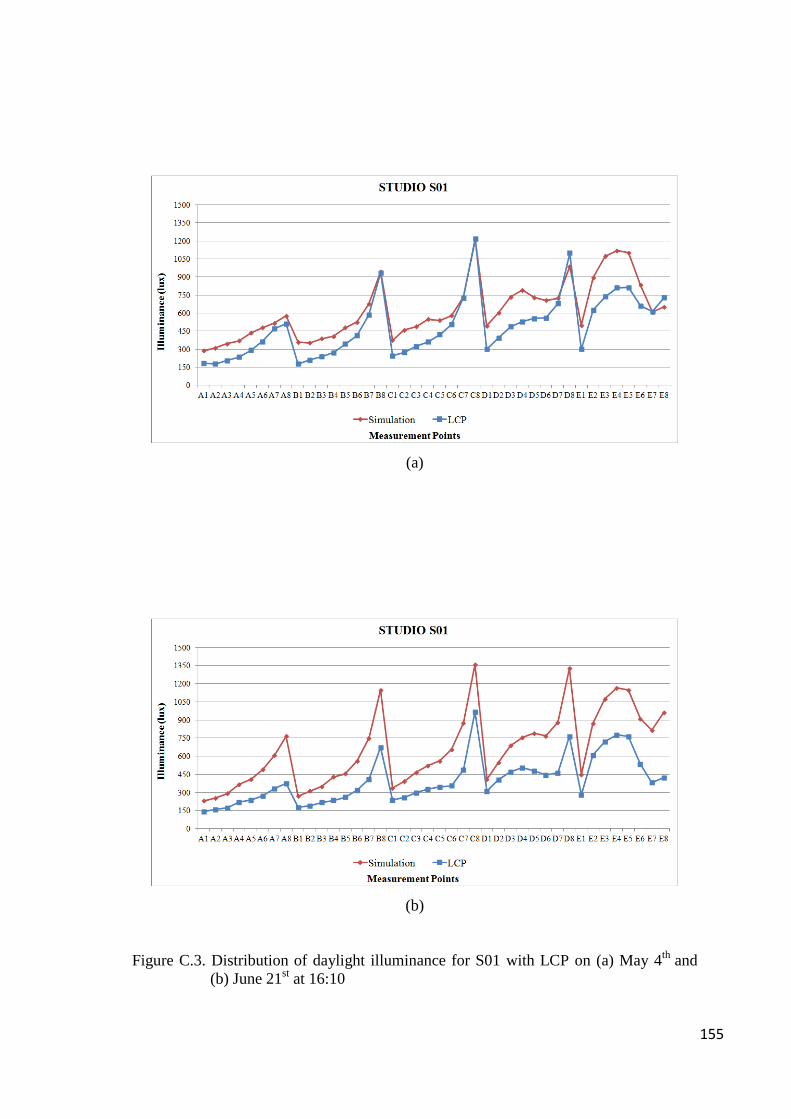
155
(a)
(b)
Figure C.3. Distribution of daylight illuminance for S01 with LCP on (a) May 4th
and
(b) June 21st at 16:10
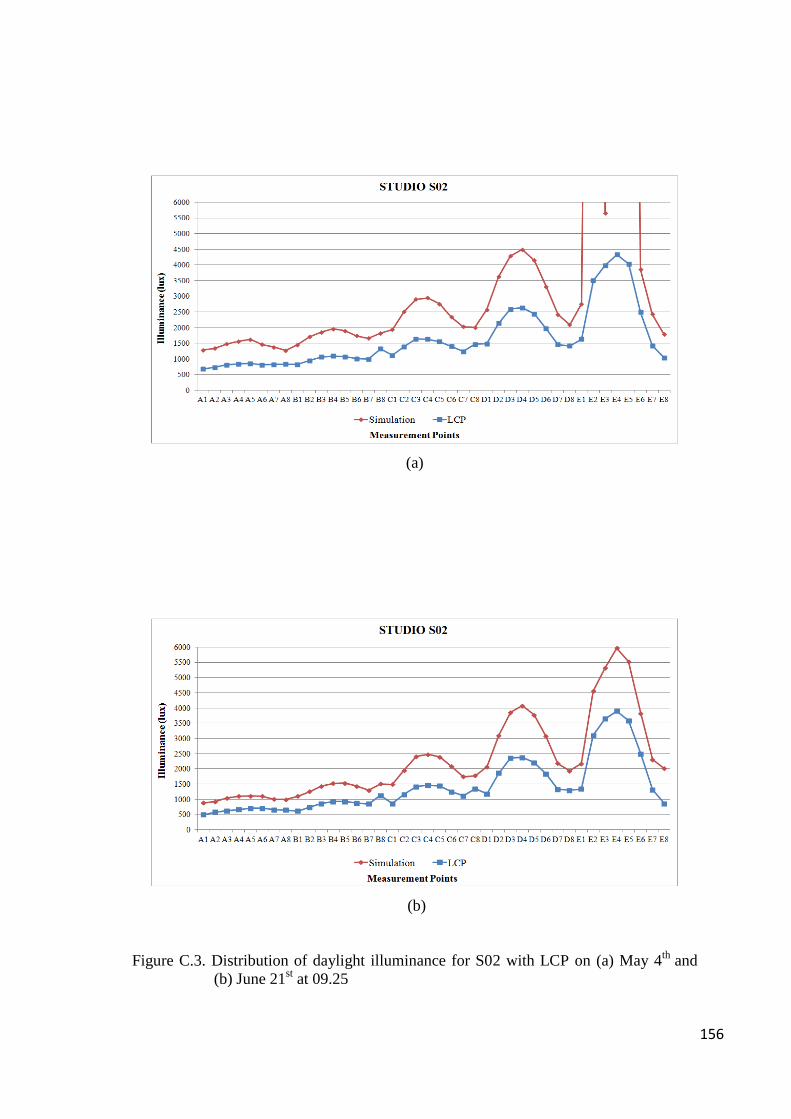
156
(a)
(b)
Figure C.3. Distribution of daylight illuminance for S02 with LCP on (a) May 4th
and
(b) June 21st at 09.25
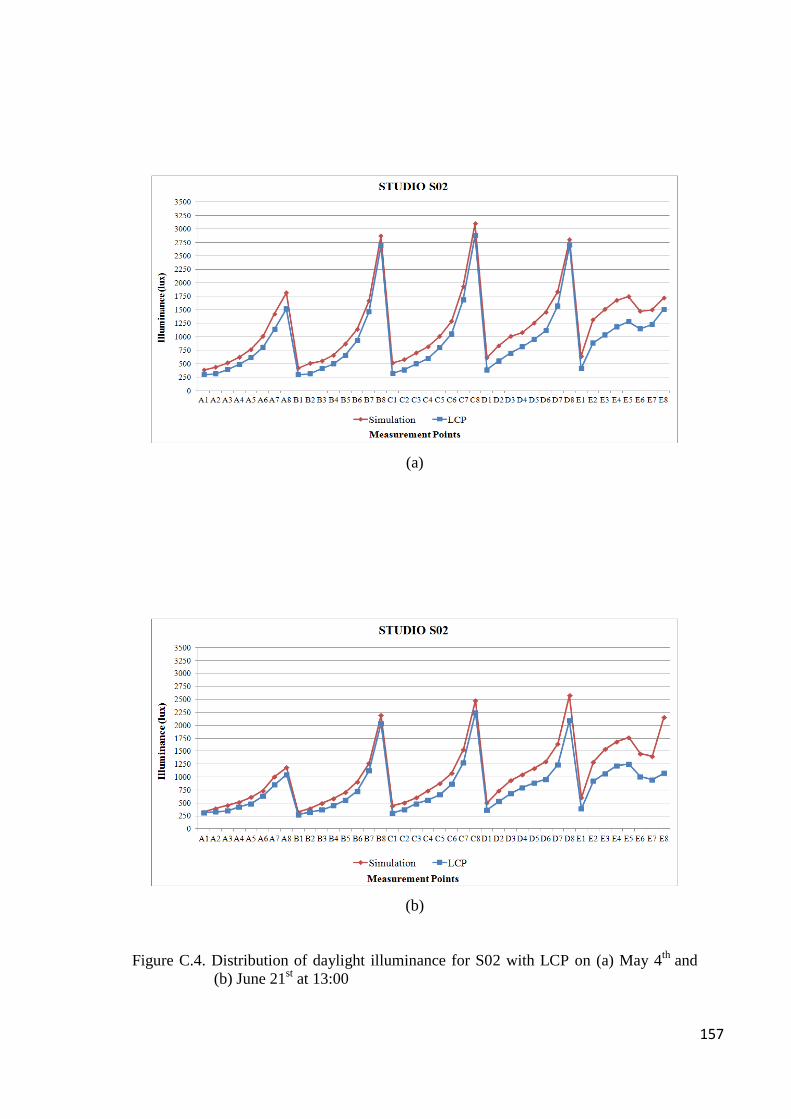
157
(a)
(b)
Figure C.4. Distribution of daylight illuminance for S02 with LCP on (a) May 4th
and
(b) June 21st at 13:00
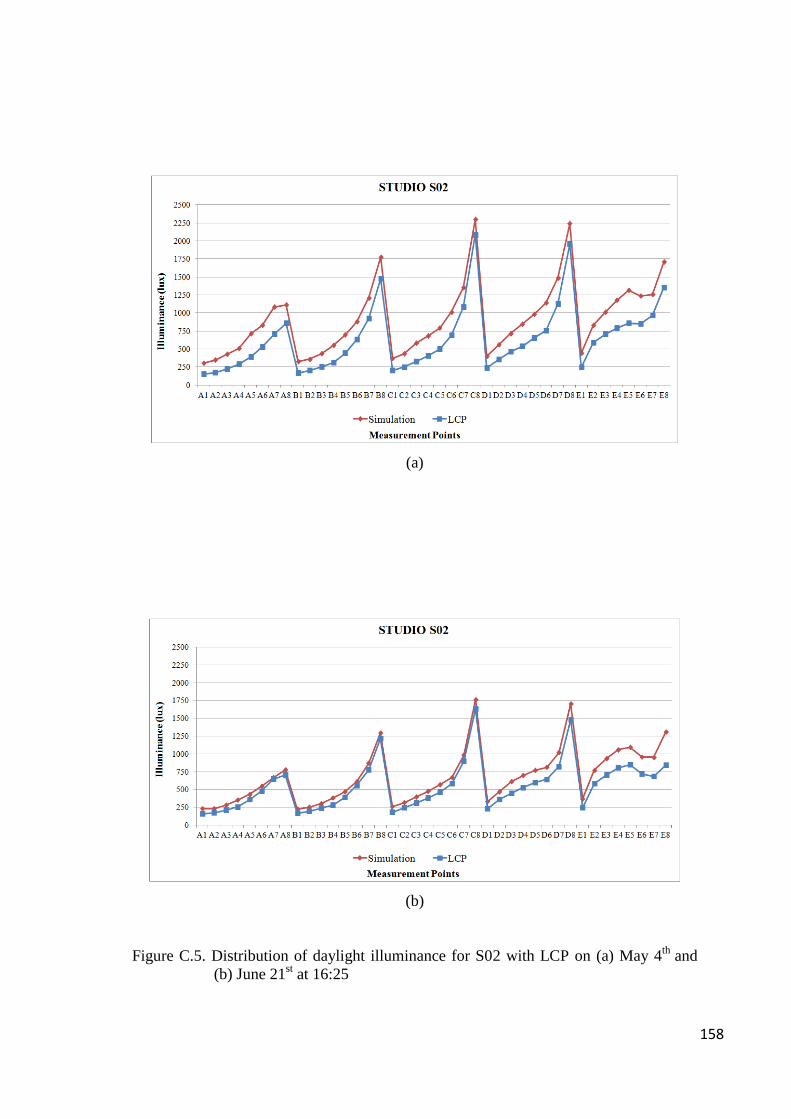
158
(a)
(b)
Figure C.5. Distribution of daylight illuminance for S02 with LCP on (a) May 4th
and
(b) June 21st at 16:25
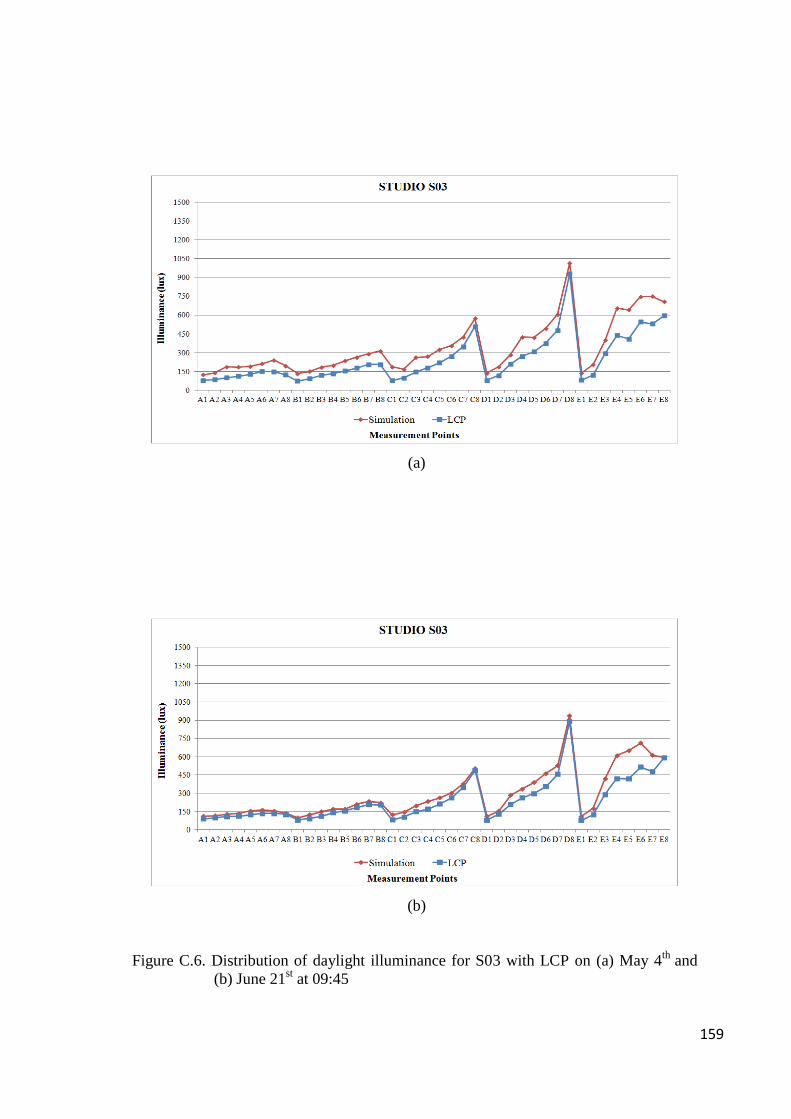
159
(a)
(b)
Figure C.6. Distribution of daylight illuminance for S03 with LCP on (a) May 4th
and
(b) June 21st at 09:45
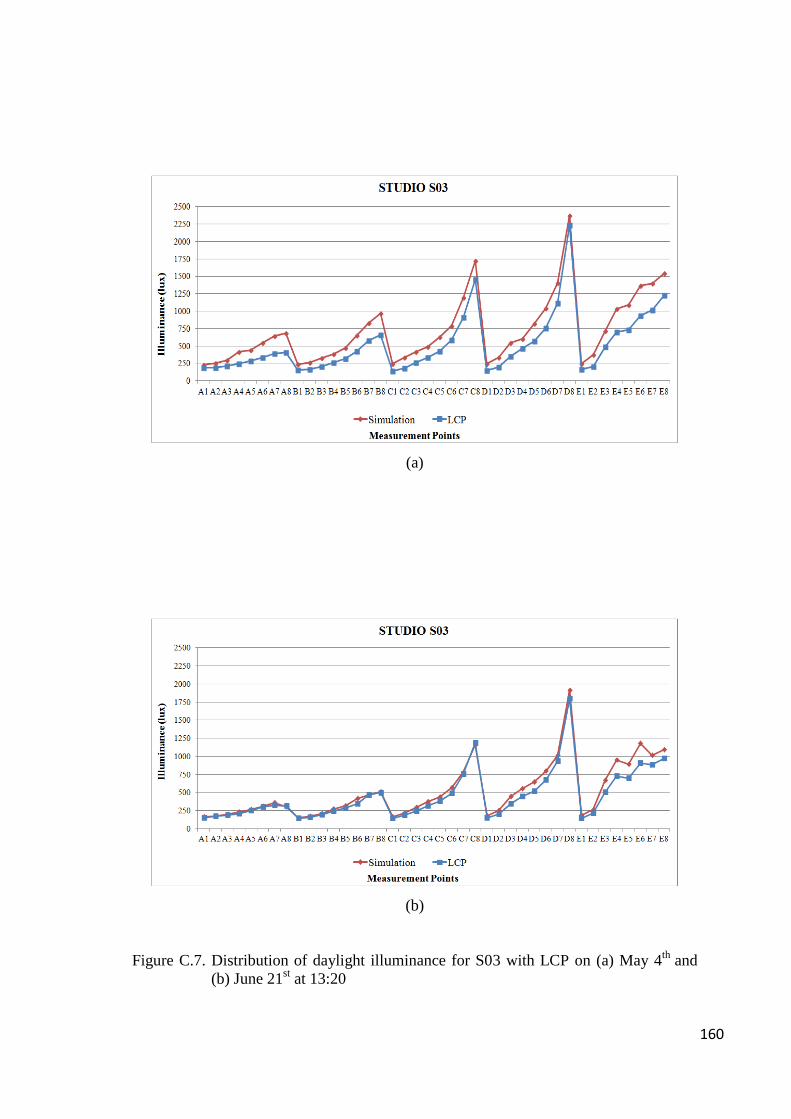
160
(a)
(b)
Figure C.7. Distribution of daylight illuminance for S03 with LCP on (a) May 4th
and
(b) June 21st at 13:20
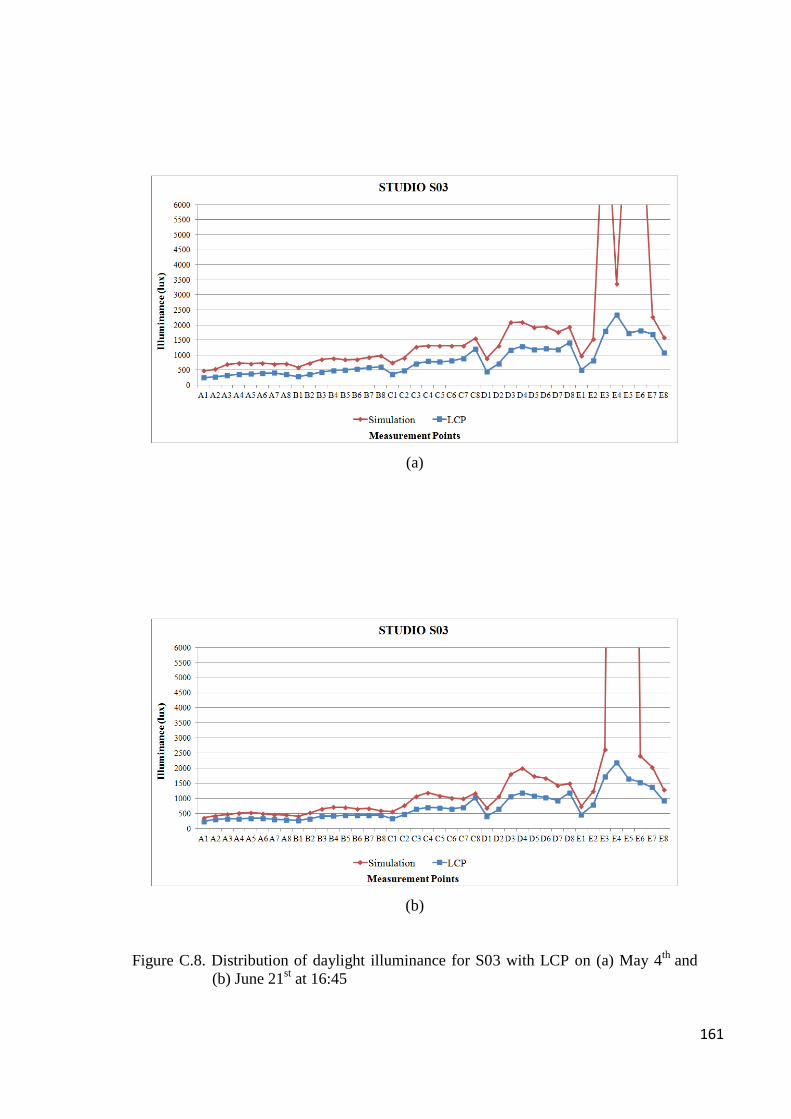
161
(a)
(b)
Figure C.8. Distribution of daylight illuminance for S03 with LCP on (a) May 4th
and
(b) June 21st at 16:45
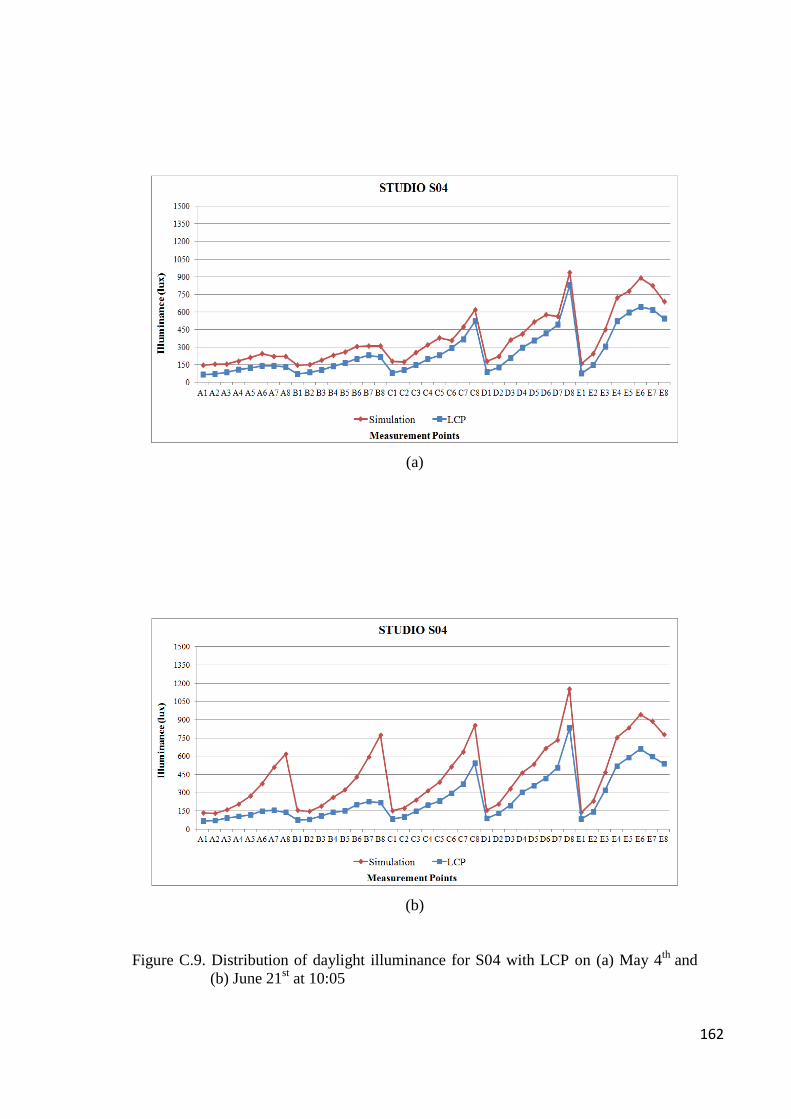
162
(a)
(b)
Figure C.9. Distribution of daylight illuminance for S04 with LCP on (a) May 4th
and
(b) June 21st at 10:05
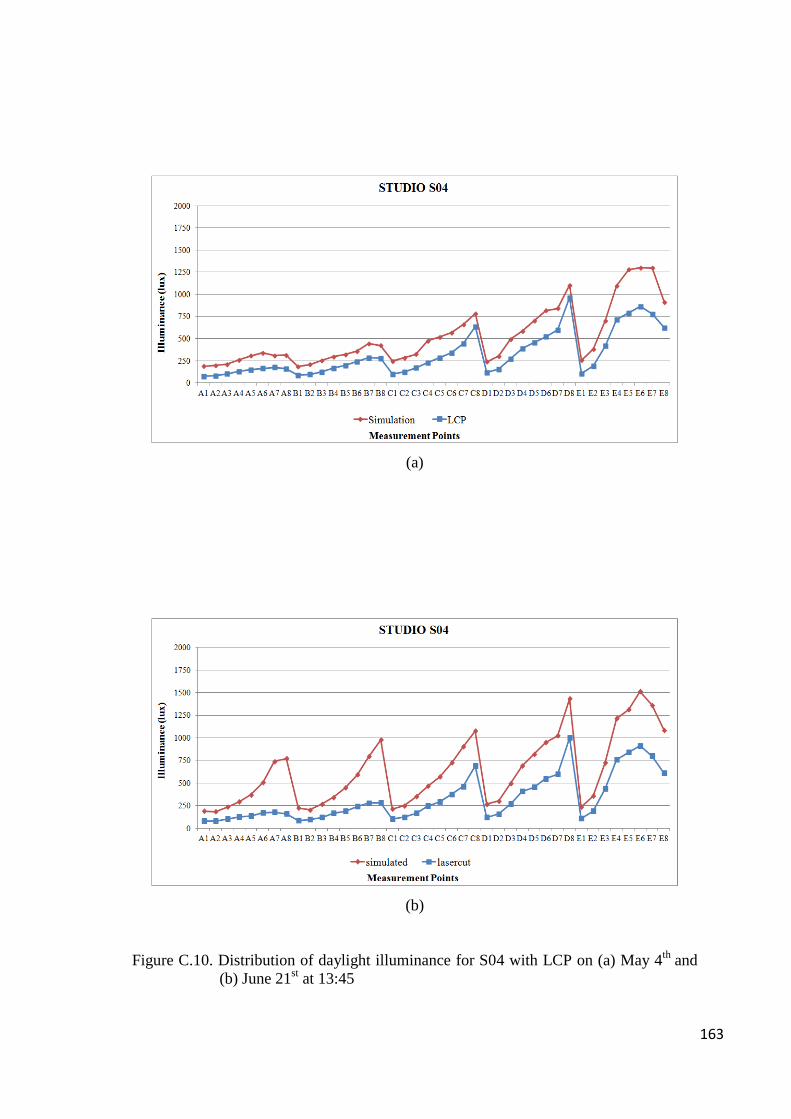
163
(a)
(b)
Figure C.10. Distribution of daylight illuminance for S04 with LCP on (a) May 4th
and
(b) June 21st at 13:45
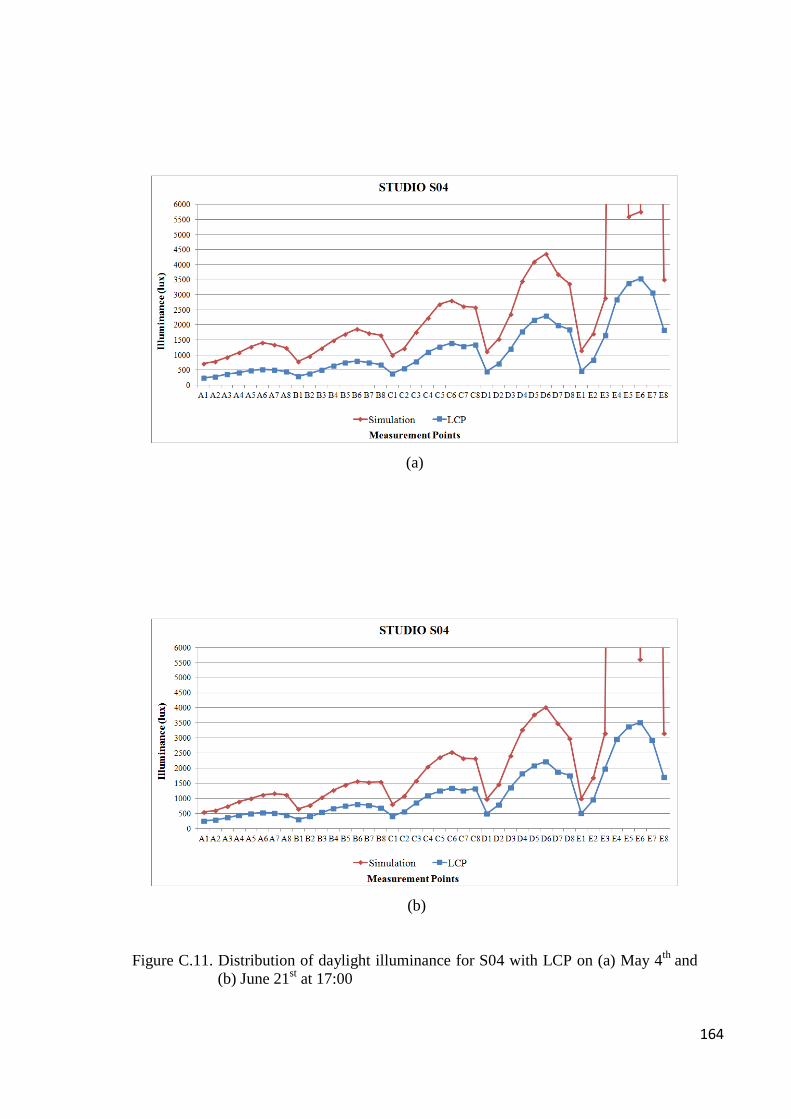
164
(a)
(b)
Figure C.11. Distribution of daylight illuminance for S04 with LCP on (a) May 4th
and
(b) June 21st at 17:00
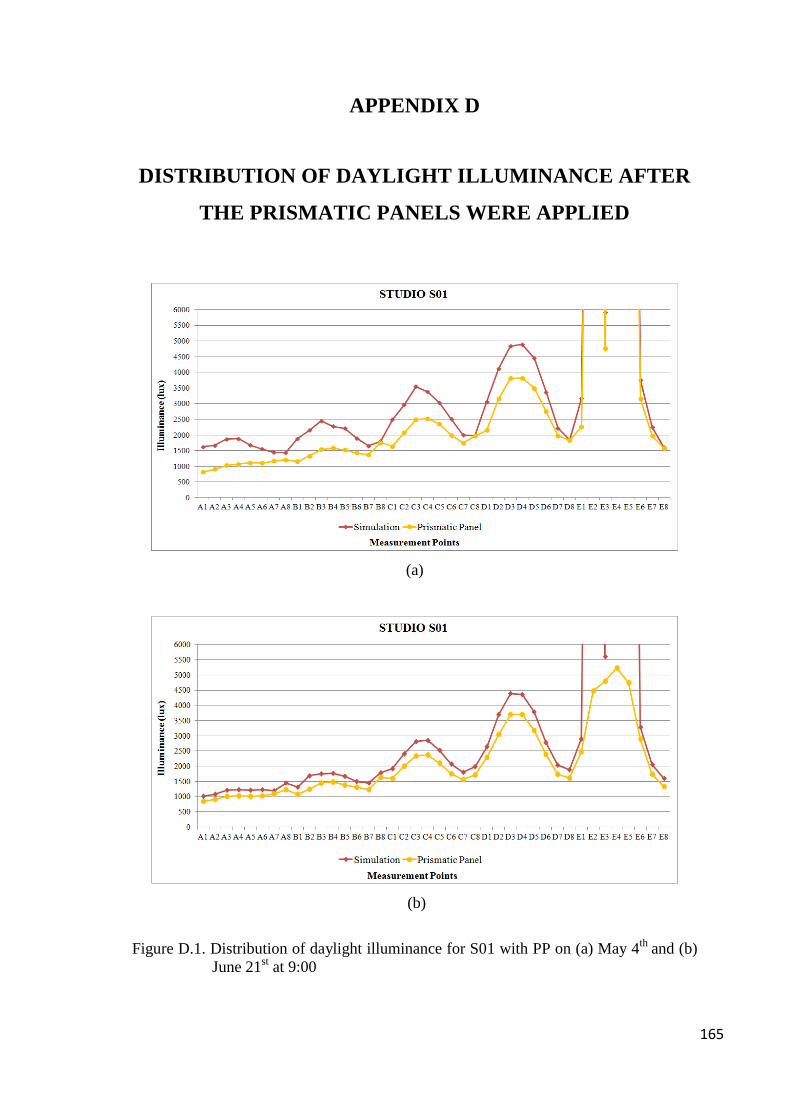
165
APPENDIX D
DISTRIBUTION OF DAYLIGHT ILLUMINANCE AFTER
THE PRISMATIC PANELS WERE APPLIED
(a)
(b)
Figure D.1. Distribution of daylight illuminance for S01 with PP on (a) May 4th
and (b)
June 21st at 9:00
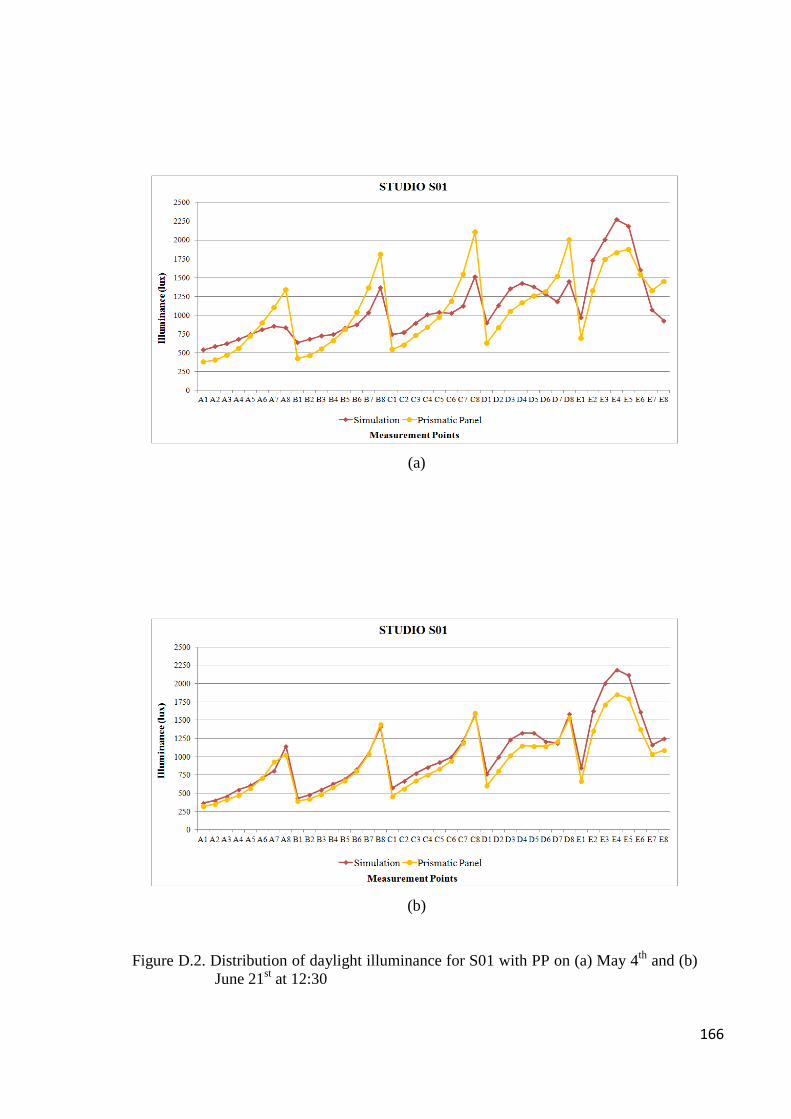
166
(a)
(b)
Figure D.2. Distribution of daylight illuminance for S01 with PP on (a) May 4th
and (b)
June 21st at 12:30
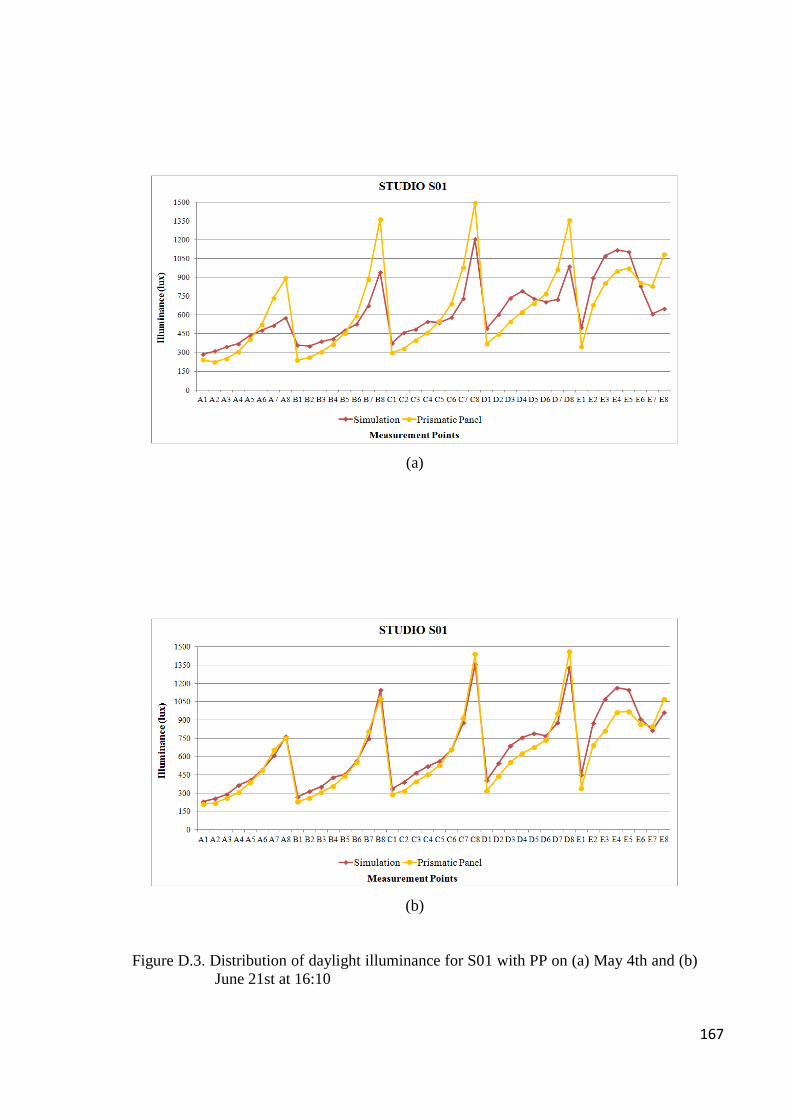
167
(a)
(b)
Figure D.3. Distribution of daylight illuminance for S01 with PP on (a) May 4th and (b)
June 21st at 16:10
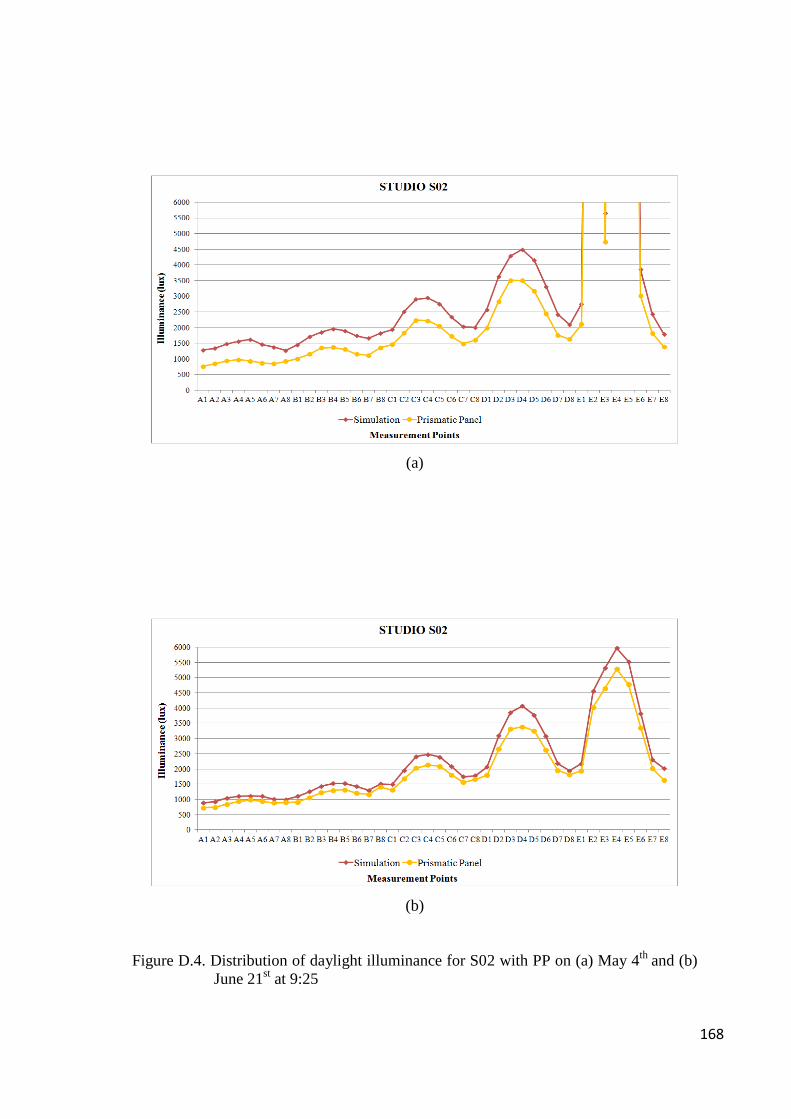
168
(a)
(b)
Figure D.4. Distribution of daylight illuminance for S02 with PP on (a) May 4th
and (b)
June 21st at 9:25
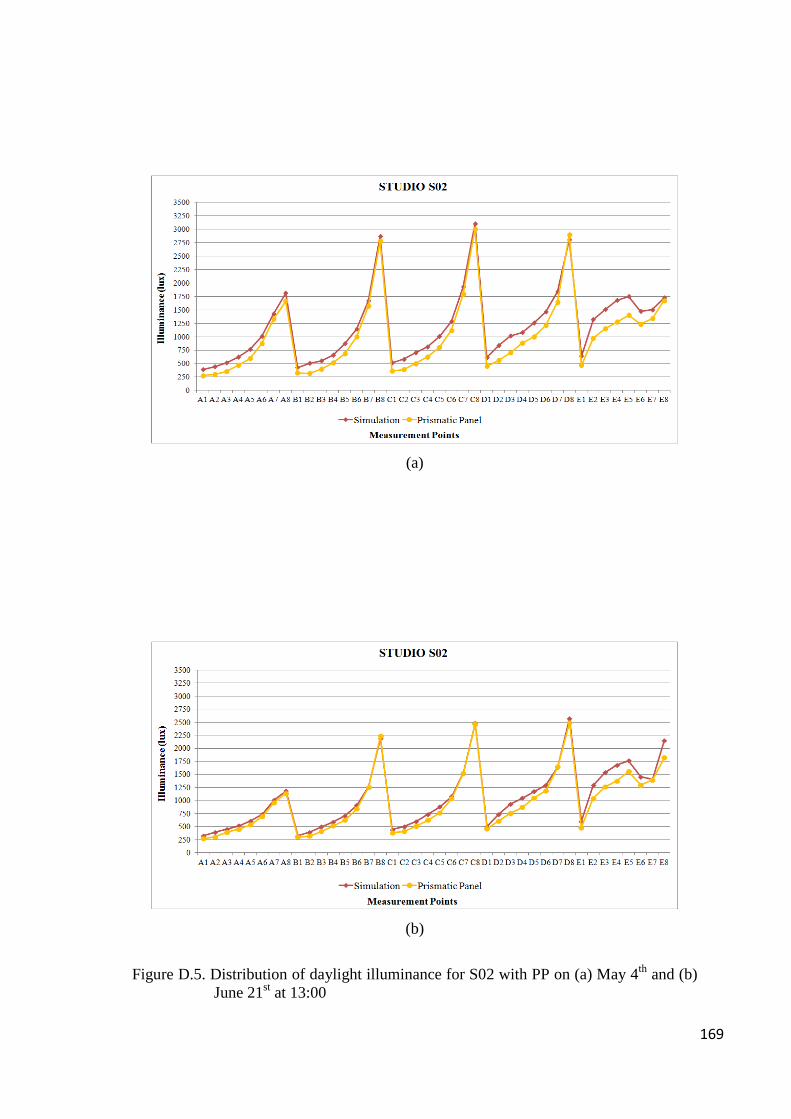
169
(a)
(b)
Figure D.5. Distribution of daylight illuminance for S02 with PP on (a) May 4th
and (b)
June 21st at 13:00
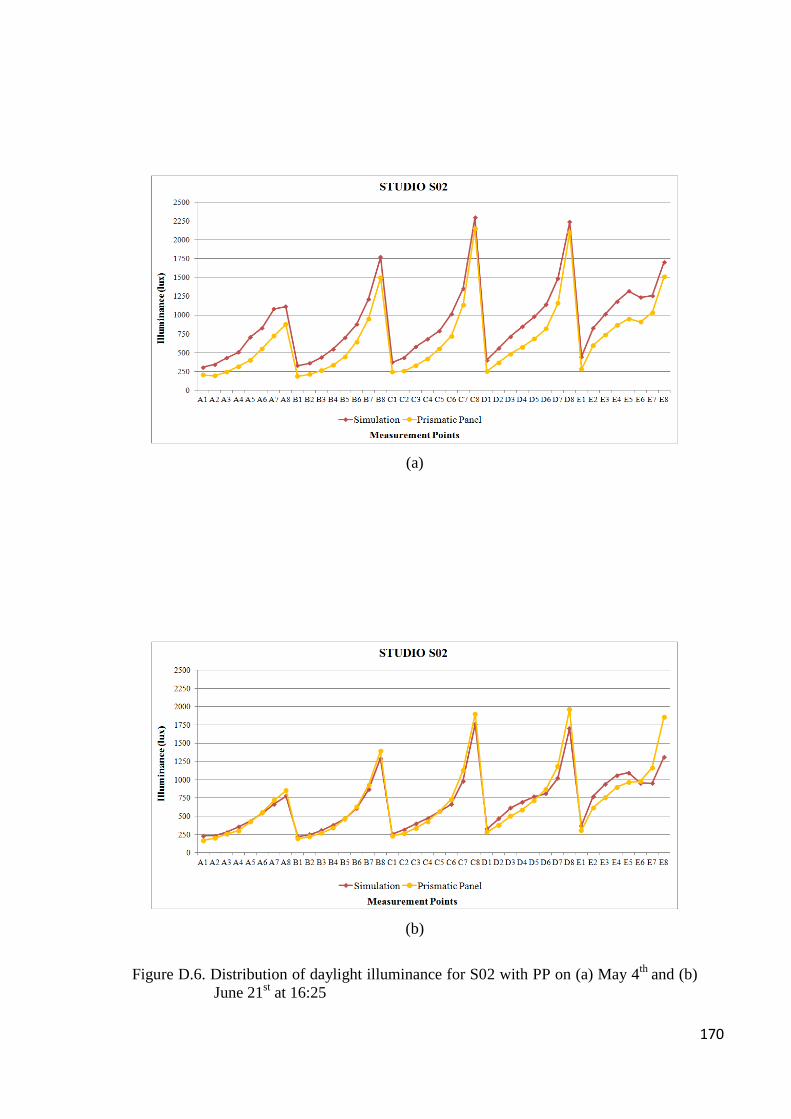
170
(a)
(b)
Figure D.6. Distribution of daylight illuminance for S02 with PP on (a) May 4th
and (b)
June 21st at 16:25
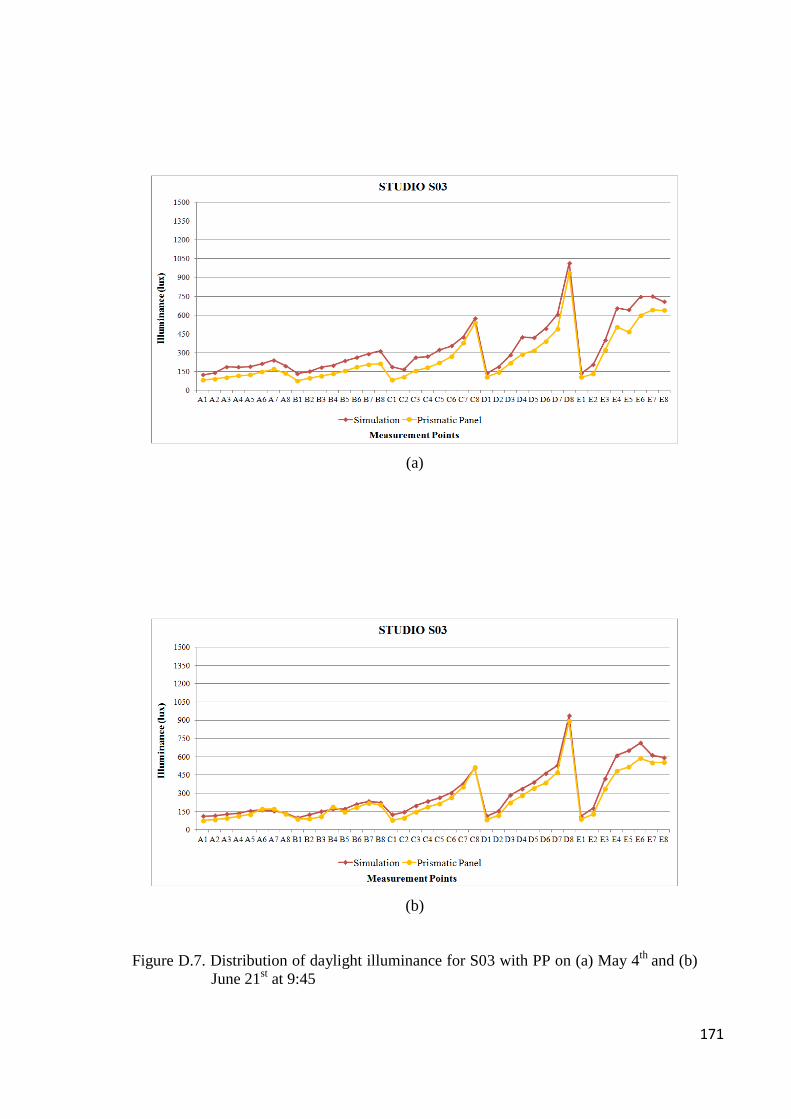
171
(a)
(b)
Figure D.7. Distribution of daylight illuminance for S03 with PP on (a) May 4th
and (b)
June 21st at 9:45
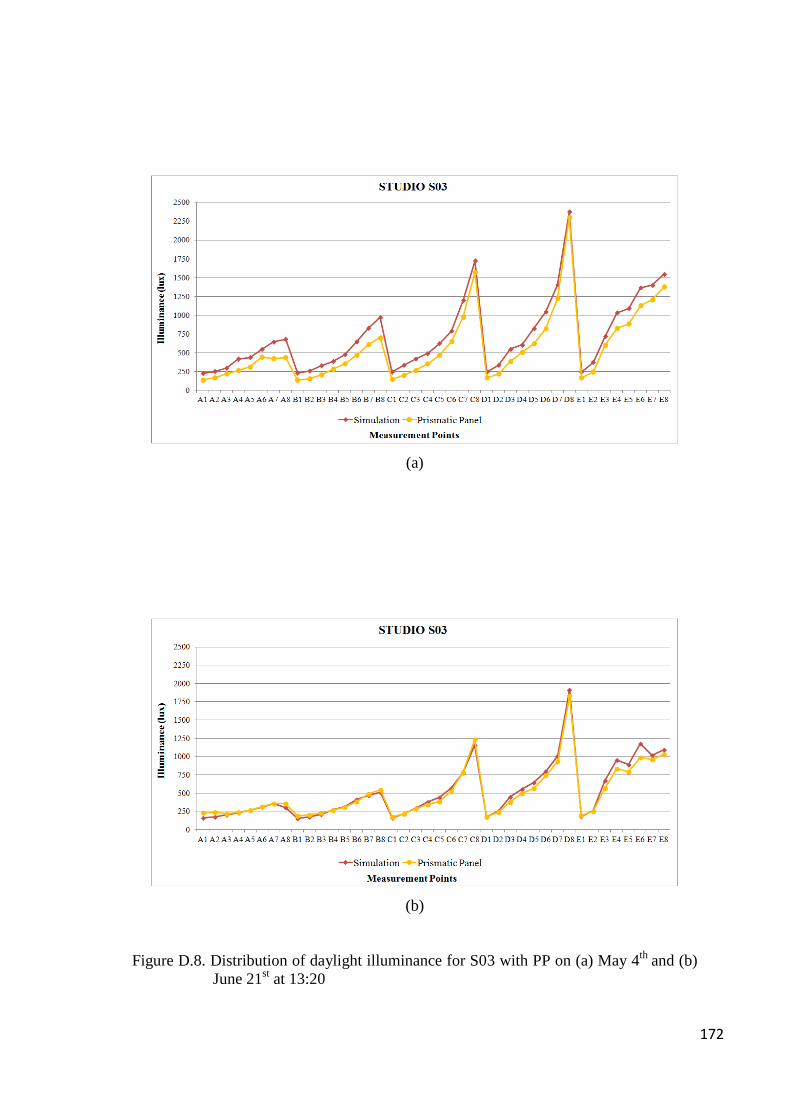
172
(a)
(b)
Figure D.8. Distribution of daylight illuminance for S03 with PP on (a) May 4th
and (b)
June 21st at 13:20
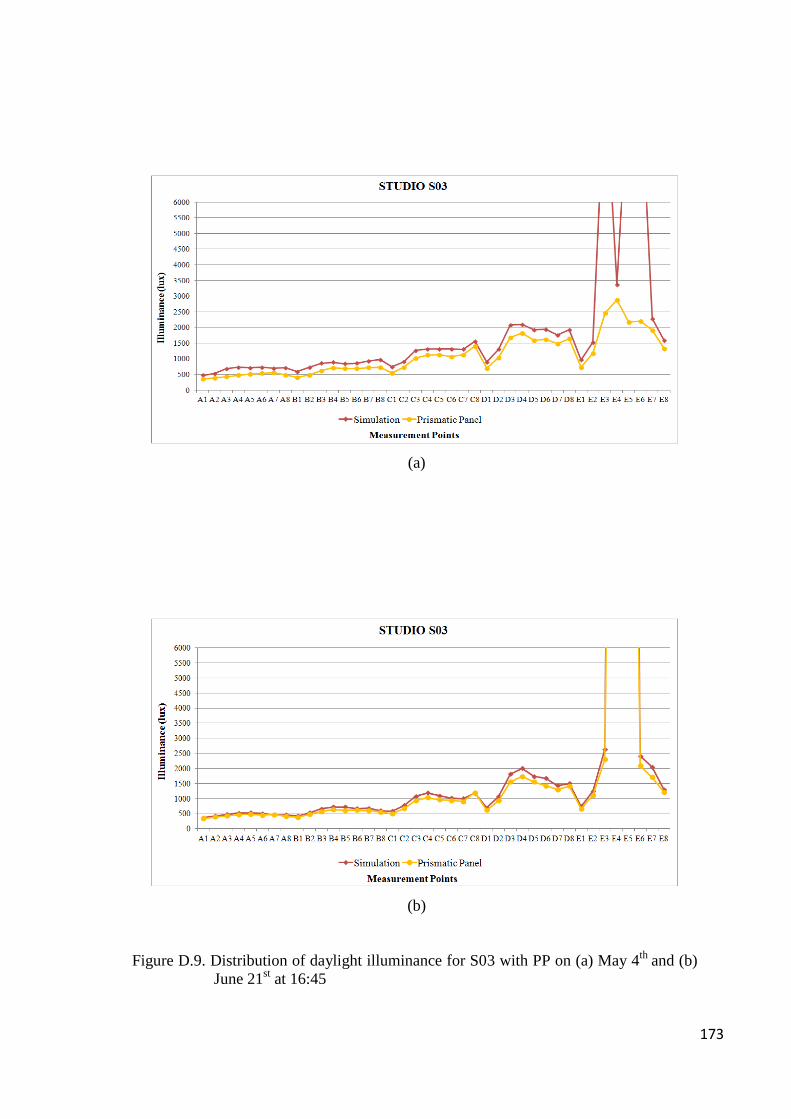
173
(a)
(b)
Figure D.9. Distribution of daylight illuminance for S03 with PP on (a) May 4th
and (b)
June 21st at 16:45
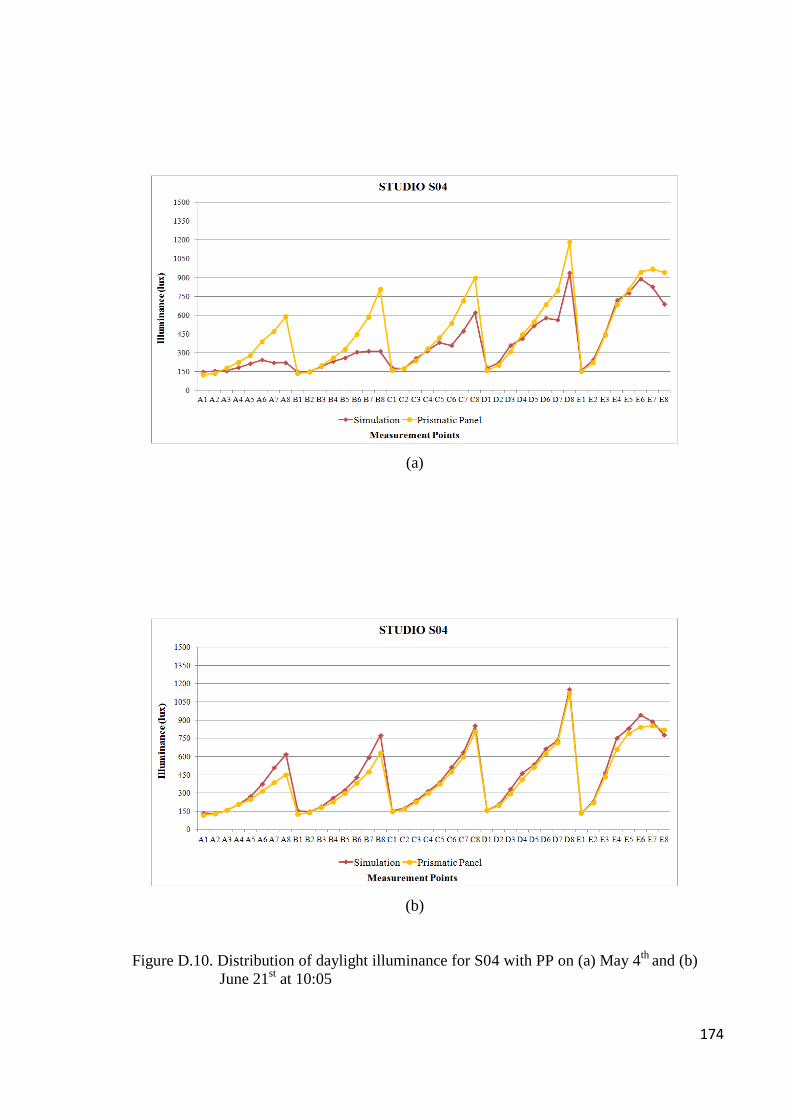
174
(a)
(b)
Figure D.10. Distribution of daylight illuminance for S04 with PP on (a) May 4th
and (b)
June 21st at 10:05
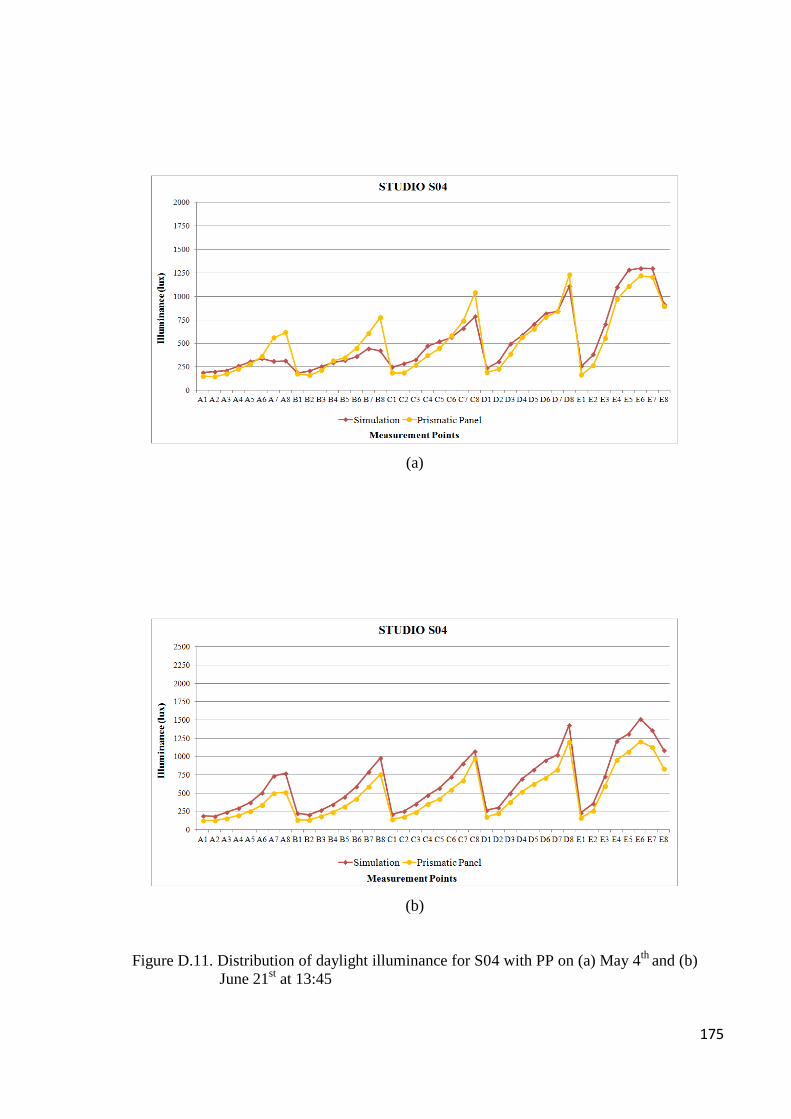
175
(a)
(b)
Figure D.11. Distribution of daylight illuminance for S04 with PP on (a) May 4th
and (b)
June 21st at 13:45
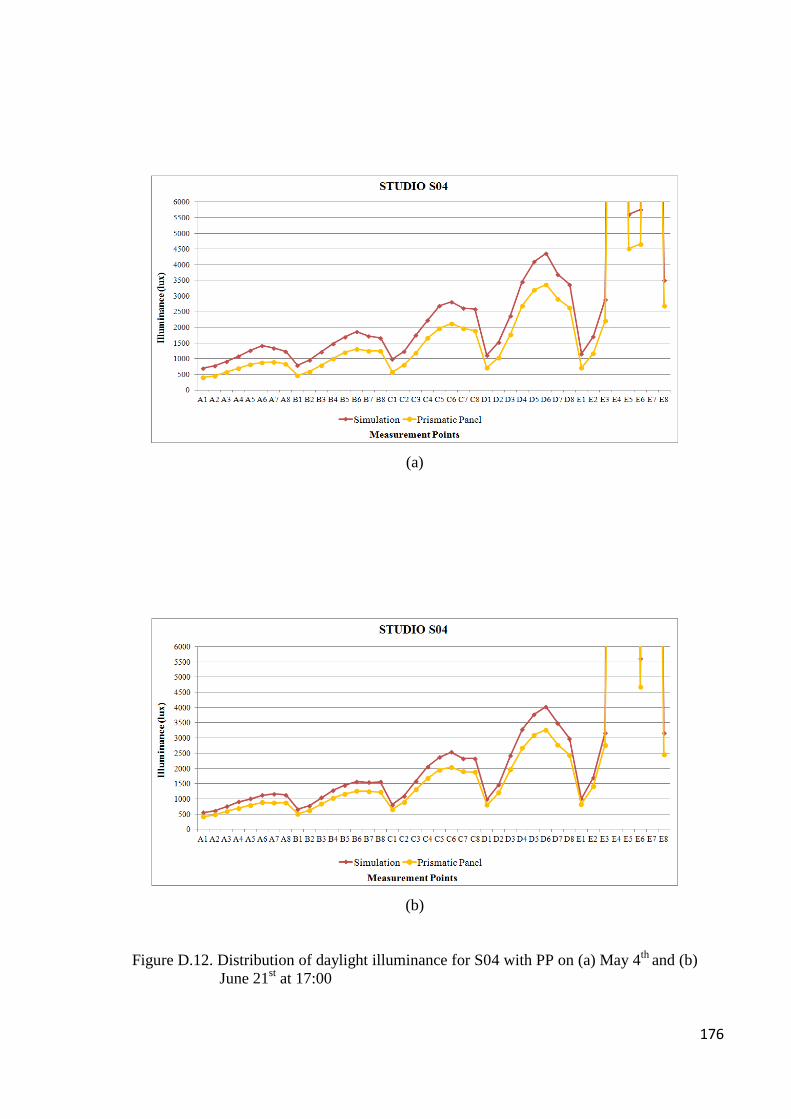
176
(a)
(b)
Figure D.12. Distribution of daylight illuminance for S04 with PP on (a) May 4th
and (b)
June 21st at 17:00
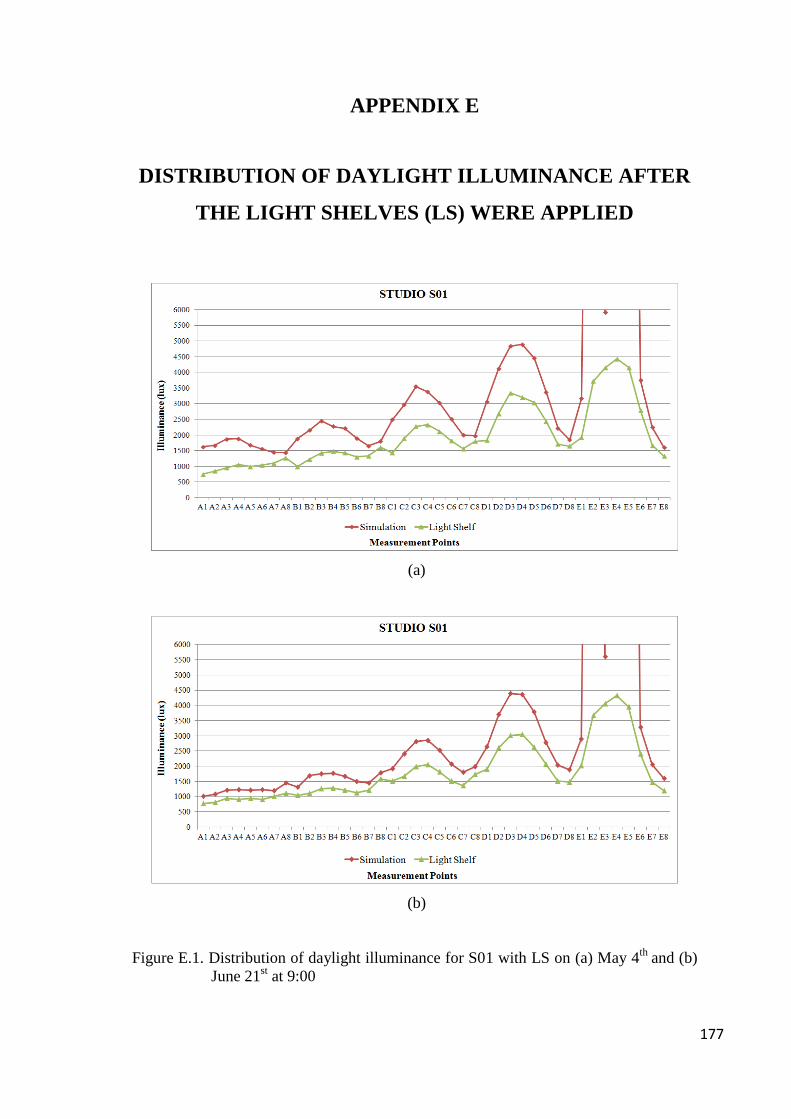
177
APPENDIX E
DISTRIBUTION OF DAYLIGHT ILLUMINANCE AFTER
THE LIGHT SHELVES (LS) WERE APPLIED
(a)
(b)
Figure E.1. Distribution of daylight illuminance for S01 with LS on (a) May 4th
and (b)
June 21st at 9:00
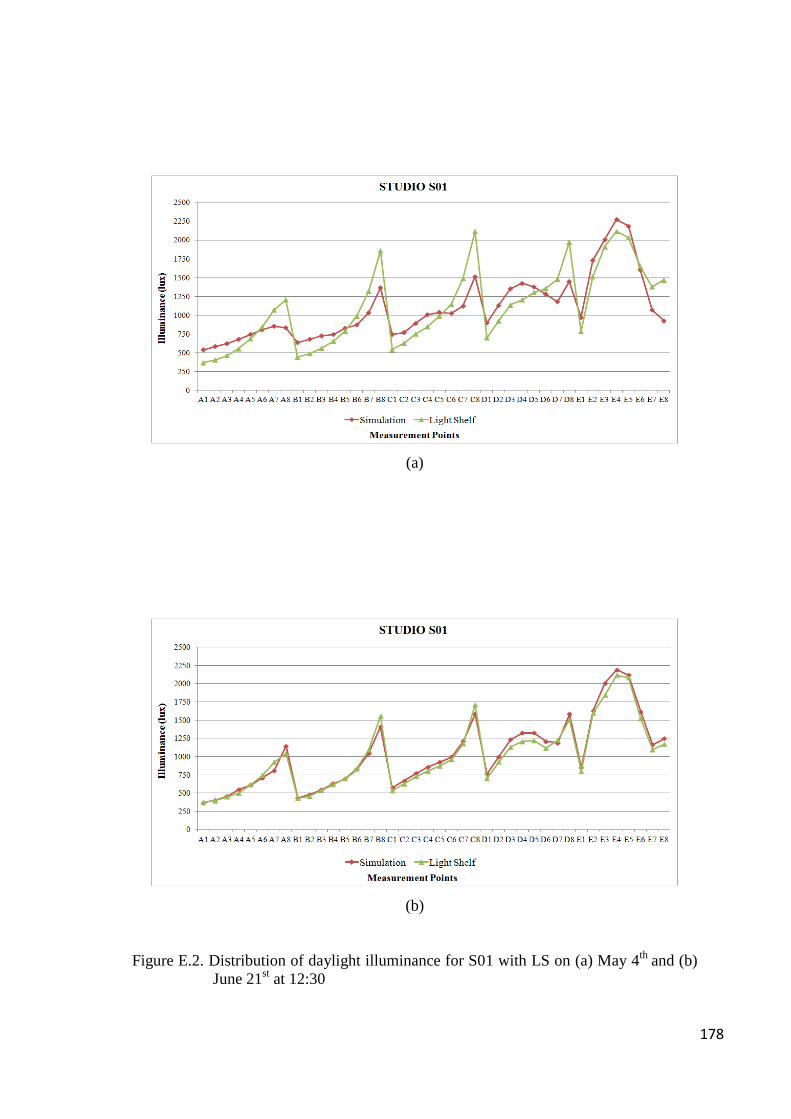
178
(a)
(b)
Figure E.2. Distribution of daylight illuminance for S01 with LS on (a) May 4th
and (b)
June 21st at 12:30
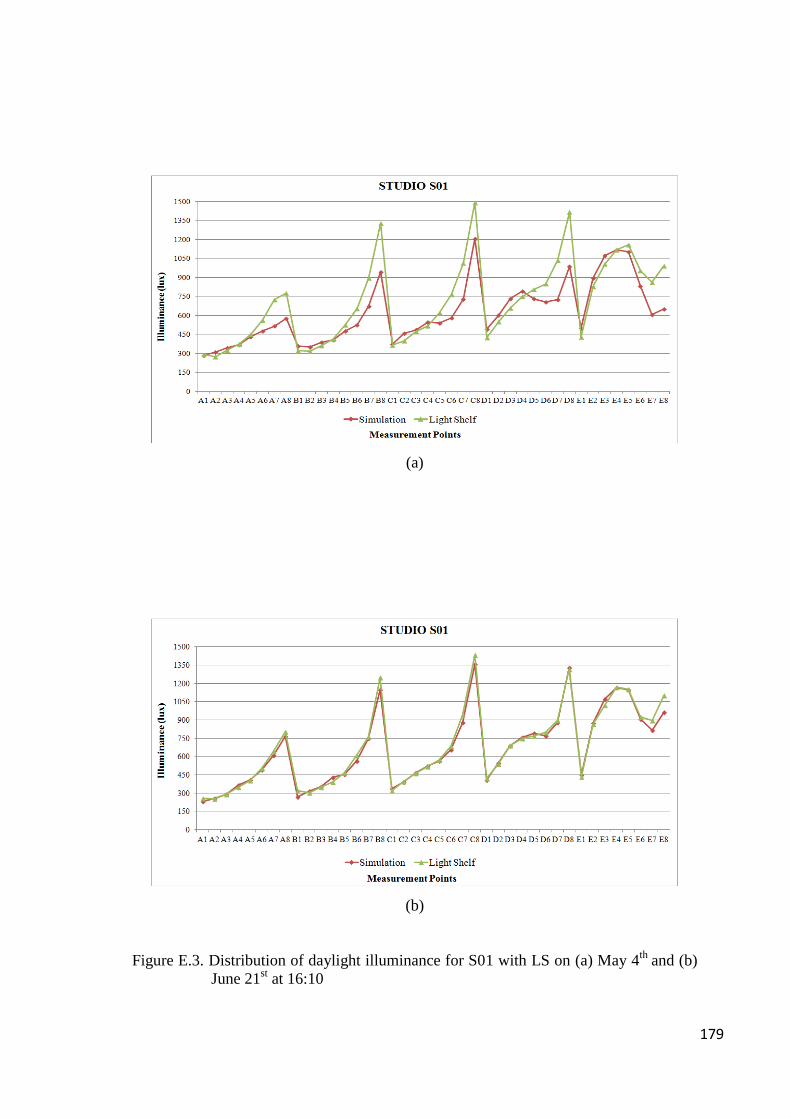
179
(a)
(b)
Figure E.3. Distribution of daylight illuminance for S01 with LS on (a) May 4th
and (b)
June 21st at 16:10
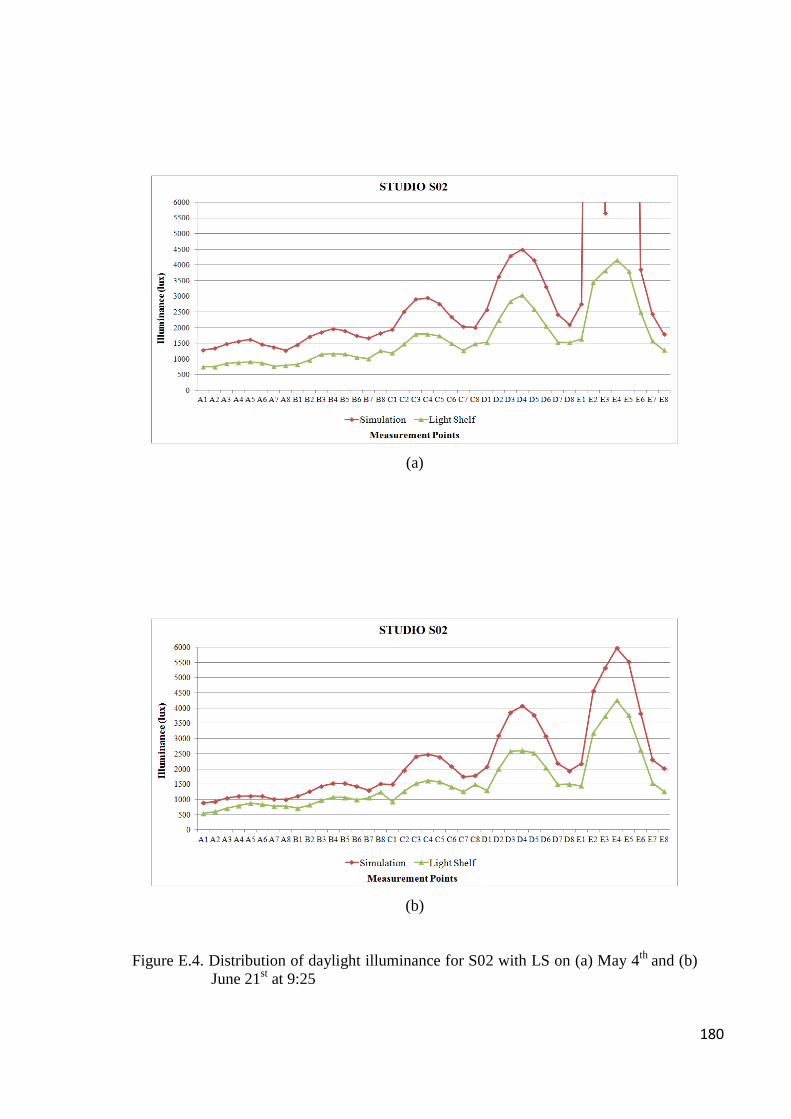
180
(a)
(b)
Figure E.4. Distribution of daylight illuminance for S02 with LS on (a) May 4th
and (b)
June 21st at 9:25
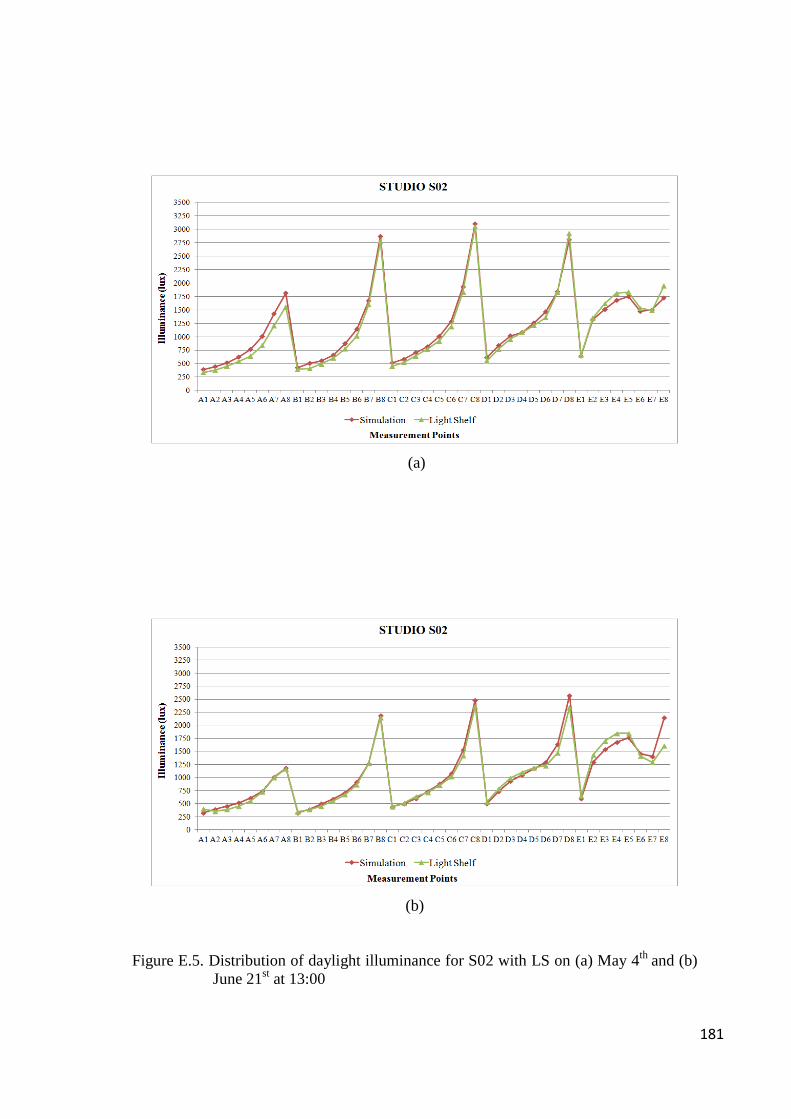
181
(a)
(b)
Figure E.5. Distribution of daylight illuminance for S02 with LS on (a) May 4th
and (b)
June 21st at 13:00
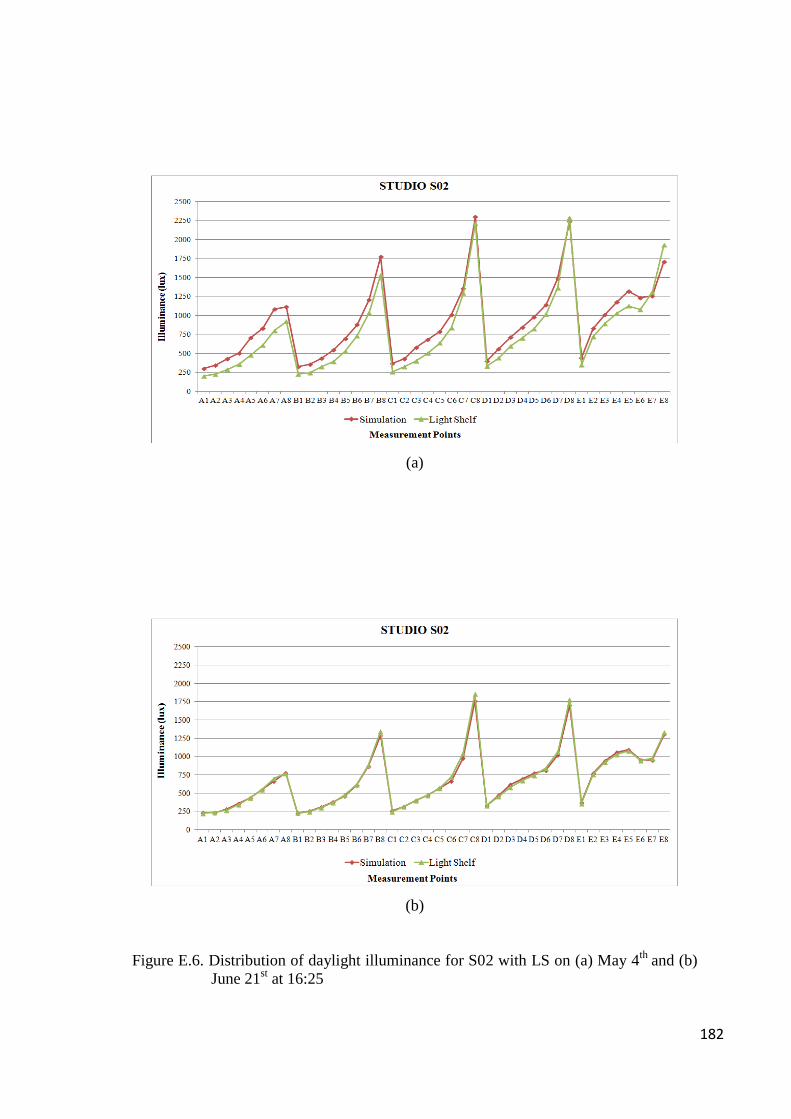
182
(a)
(b)
Figure E.6. Distribution of daylight illuminance for S02 with LS on (a) May 4th
and (b)
June 21st at 16:25
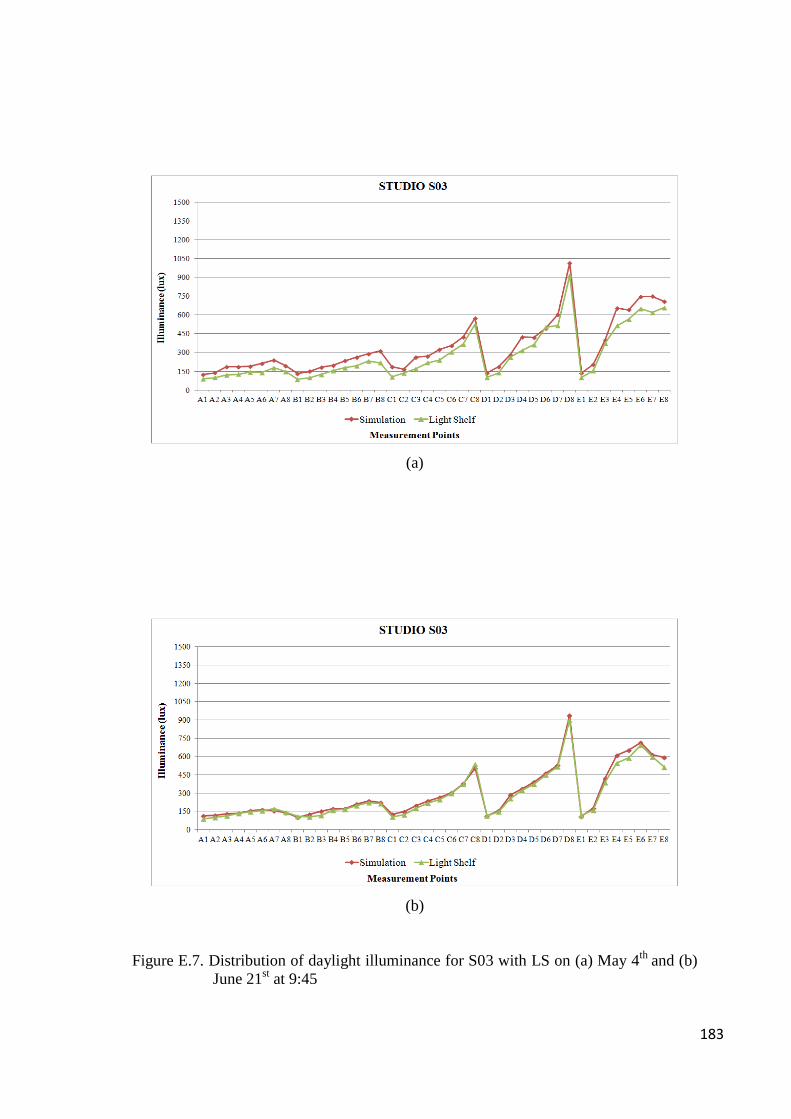
183
(a)
(b)
Figure E.7. Distribution of daylight illuminance for S03 with LS on (a) May 4th
and (b)
June 21st at 9:45
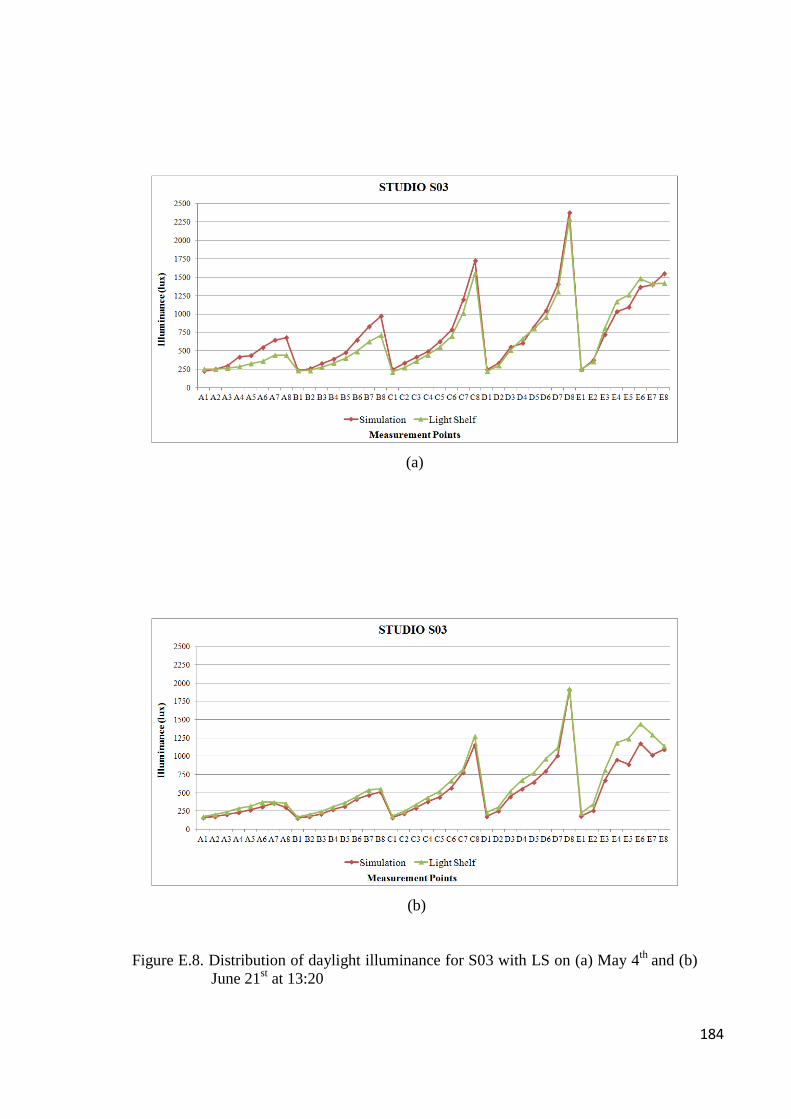
184
(a)
(b)
Figure E.8. Distribution of daylight illuminance for S03 with LS on (a) May 4th
and (b)
June 21st at 13:20
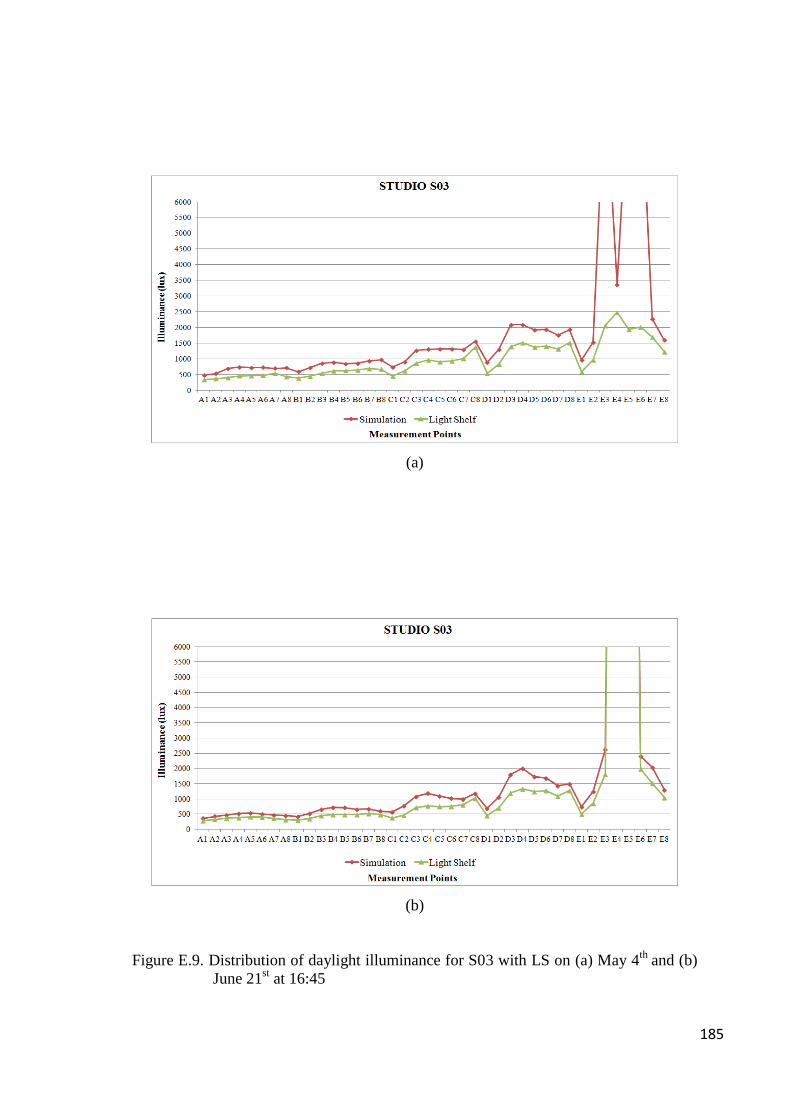
185
(a)
(b)
Figure E.9. Distribution of daylight illuminance for S03 with LS on (a) May 4th
and (b)
June 21st at 16:45
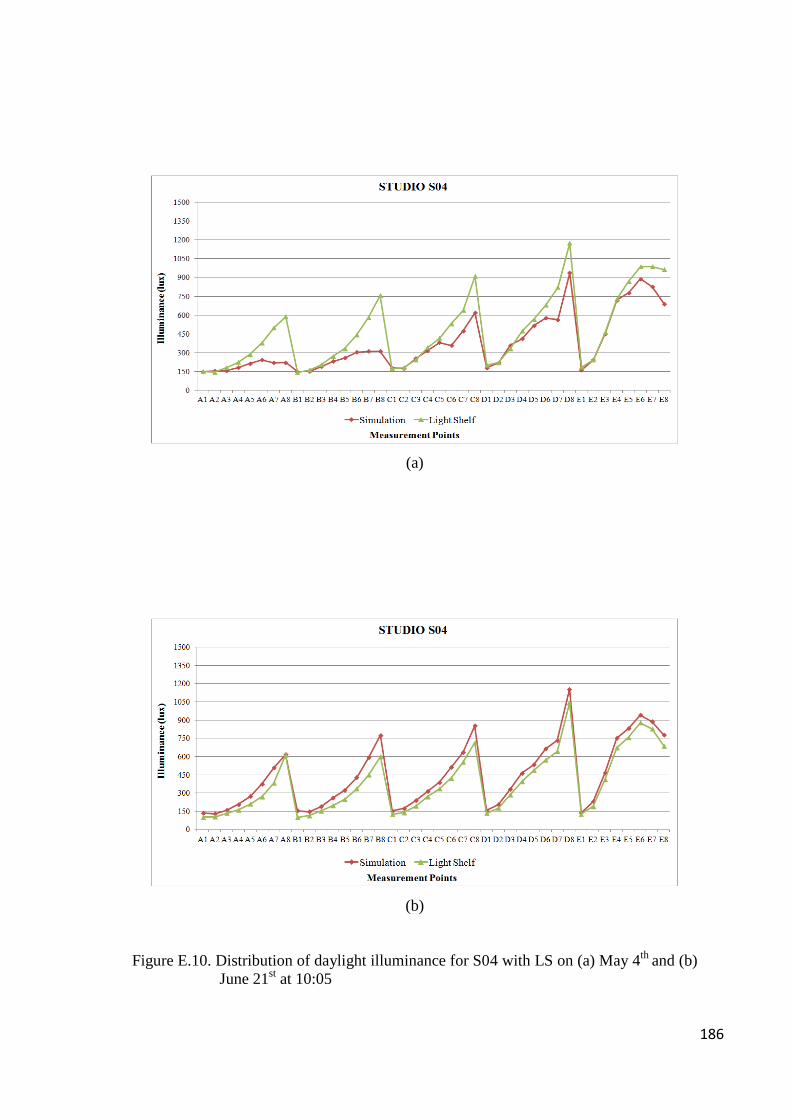
186
(a)
(b)
Figure E.10. Distribution of daylight illuminance for S04 with LS on (a) May 4th
and (b)
June 21st at 10:05
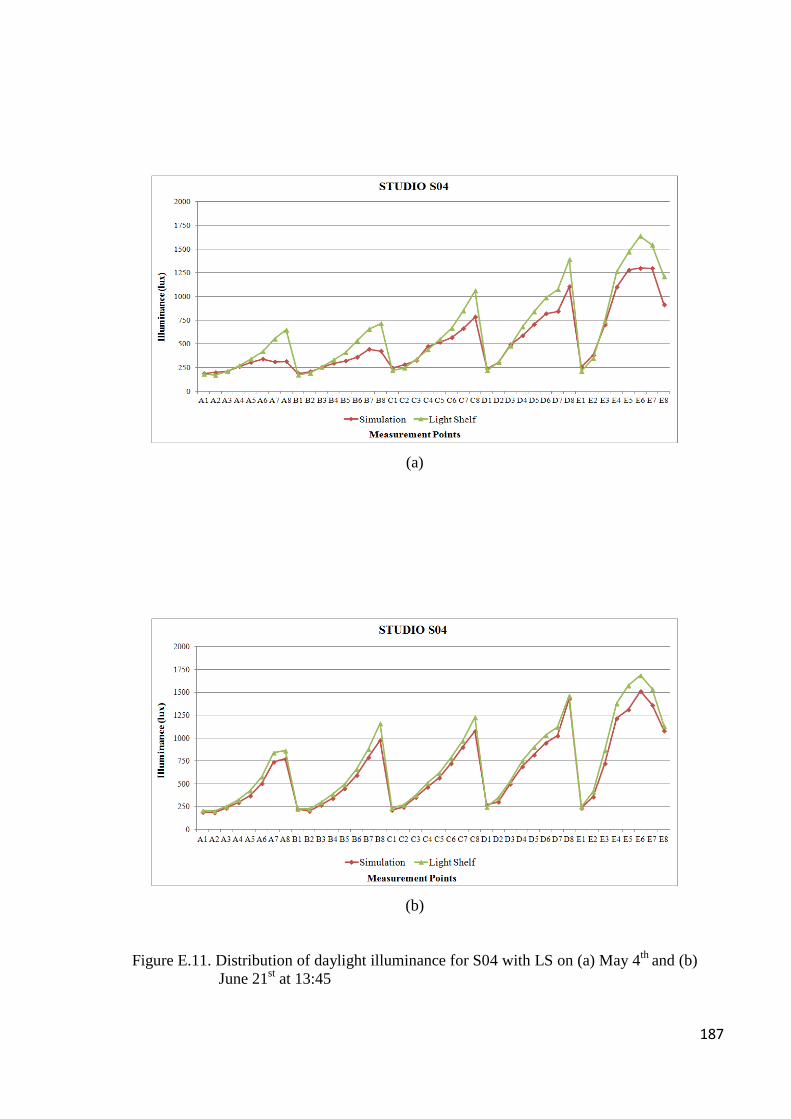
187
(a)
(b)
Figure E.11. Distribution of daylight illuminance for S04 with LS on (a) May 4th
and (b)
June 21st at 13:45
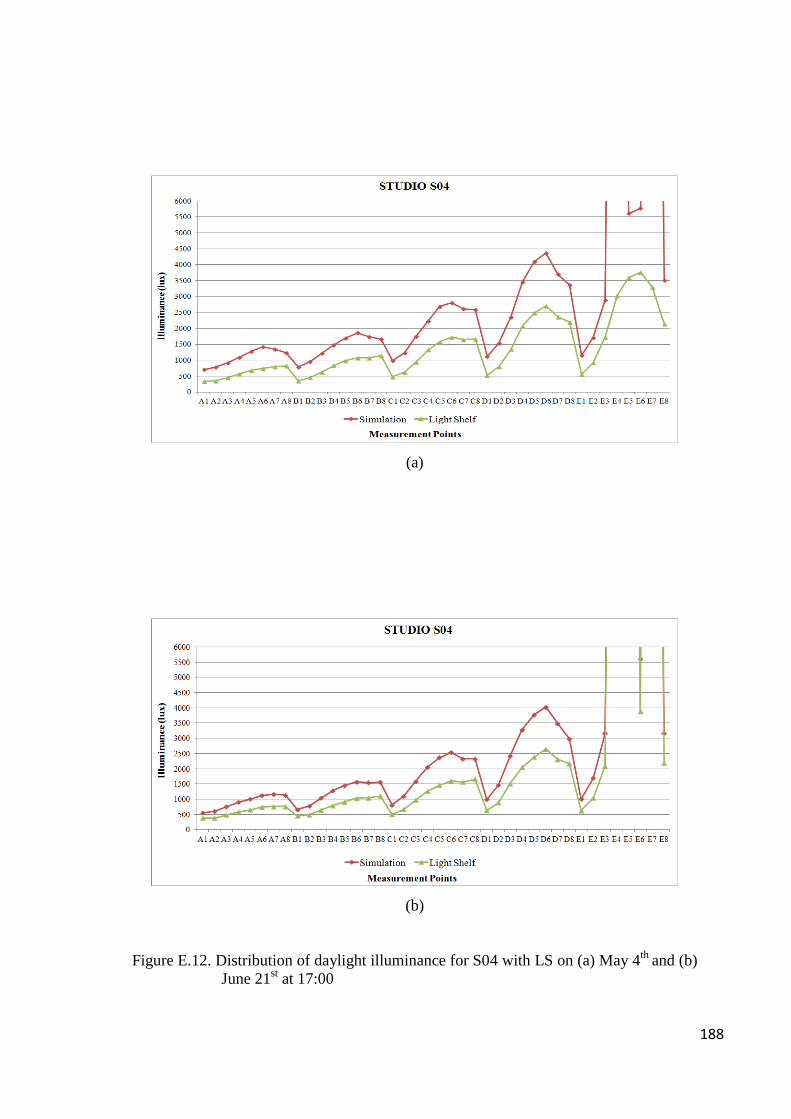
188
(a)
(b)
Figure E.12. Distribution of daylight illuminance for S04 with LS on (a) May 4th
and (b)
June 21st at 17:00
Related Documents


